Embed Size (px)
Citation preview
Public Transport Affordability and Subsidy Policies: A case
study of Santiago, Chile
Andrés Gómez-LoboTransport ForumMarch 28, 2007
Overview
• Public transport in Santiago
• Affordability measures and their impact
• General comments regarding transport affordability measures
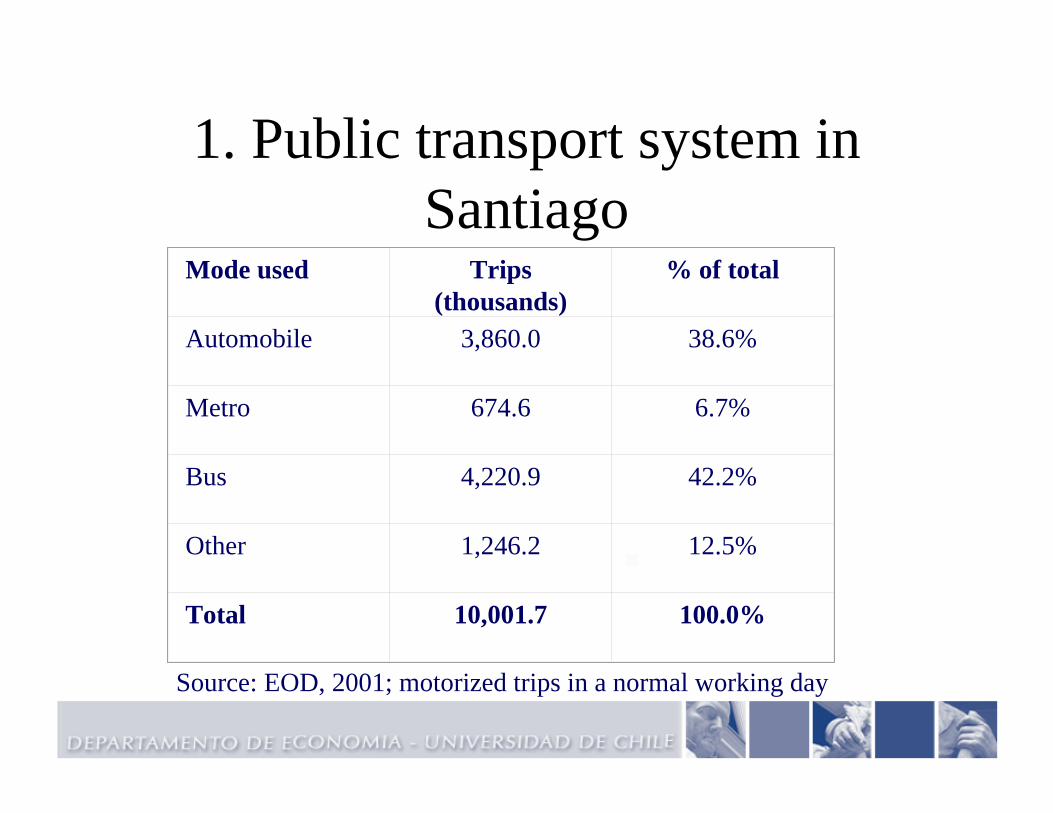
1. Public transport system in Santiago
Mode used Trips (thousands)
% of total
Automobile 3,860.0 38.6%
Metro 674.6 6.7%
Bus 4,220.9 42.2%
Other 1,246.2 12.5%
Total 10,001.7 100.0%
Source: EOD, 2001; motorized trips in a normal working day
Transantiago
• Big Bang: February 10, 2007
• Important changes in public transport system that will affect:– Modal split– Expenditure on public transport
Expenditure on Public Transport
• Percentage of minimum income required to purchase 50 bus tickets per month:– 1988: 28% (ECLAC, 1992)– 2007: 14%
• Family expenditure survey (1996-97):– Public transport: 3.55% on average, 6.4% first quintile
• Carruthers, Dick and Saurkar (2005):– 7.2% of income on average– 44.8% first quintile
2. Affordability measures
1) Student preferential fare
2) Metro infrastructure expansion
3) Fuel prices: • Specific fuel taxes• Fuel Price Stabilization Fund (FEPP)
4) Direct compensatory monetary transfers
Student preferential fares
• Benefits students from 5º grade upwards in non private schools and also many university students
• Pay approximately 1/3 of fare in buses and metro
• Funded through cross-subsidy
Metro expansion
• More than US$2.000 million to expand network between 2000 and 2009
• Metro covers operating costs and some capital costs:– Tariff should increase by 200% to cover full
economic cost
Fuel prices
• Specific tax on gasoline and diesel:– More than double for gasoline compared to
diesel
• Fuel price stabilization fund (FEPP)– Price band– In practice it has operated like a subsidy
Direct monetary transfers• Implemented in 2004, 2005 and 2006• Direct payment to households and individuals to
compensate for increasing fuel and transport costs– Better for households than a transfer in kind
• Funded entirely from national budget • Since 2005 it has benefited 40% of households:
• Minimum and subsidized government backed pensioners• “Chile Solidario” program recipients• Family subsidy recipients• Workers who receive family allowance payments and earn less
than $180.000 a month
Evaluation of 5 measures
• Student preferential fare in bus and metro
• Metro infrastructure subsidy
• Reduction in the price of gasoline (FEPP or tax)
• Reduction in bus fares
• Direct compensatory transfers
Distributive incidence of general tax system
• Engel, Galetovic and Raddatz (1999)– Neutral distributive impact
• Consequence: we only have to analyze the funding side of the student preferential fare policy that is funded through a cross subsidy
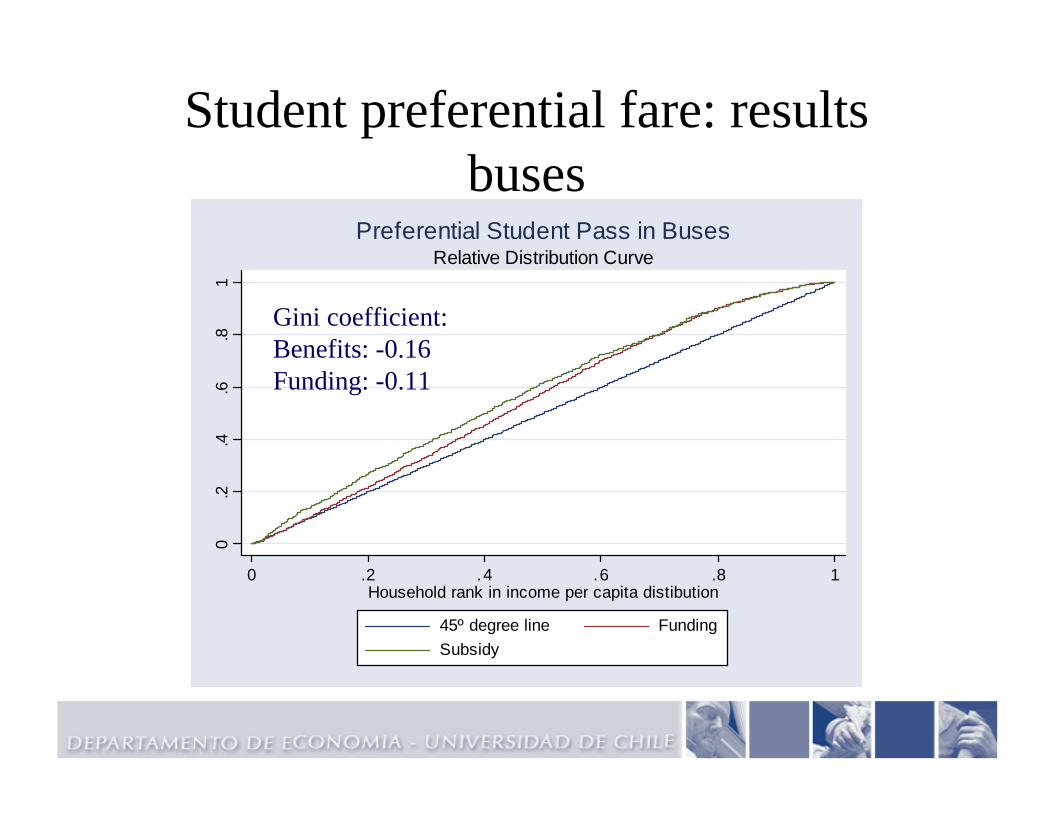
Student preferential fare: results buses
0.2
.4.6
.81
0 .2 .4 .6 .8 1Household rank in income per capita distibution
45º degree line FundingSubsidy
Relative Distribution CurvePreferential Student Pass in Buses
Gini coefficient:Benefits: -0.16Funding: -0.11
0.2
.4.6
.81
0 .2 .4 .6 .8 1Household rank in income per capita distibution
45º degree line FundingSubsidy
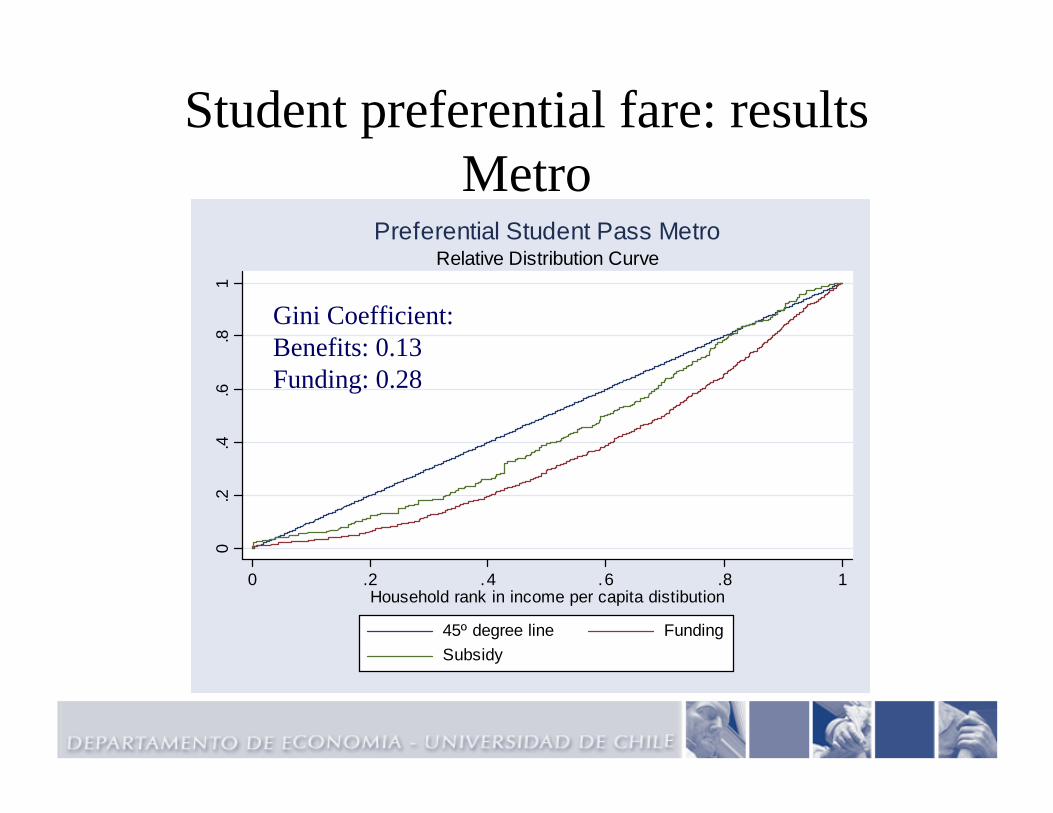
Relative Distribution CurvePreferential Student Pass Metro
Gini Coefficient:Benefits: 0.13Funding: 0.28
Student preferential fare: results Metro
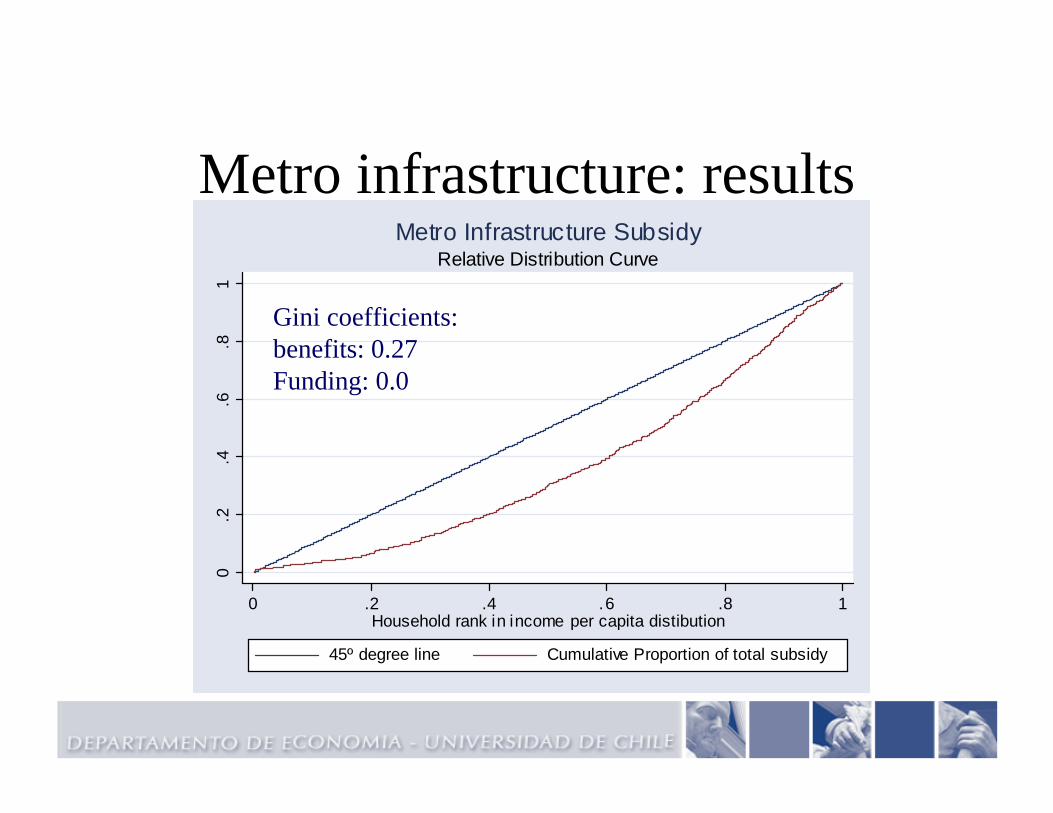
Metro infrastructure: results0
.2.4
.6.8
1
0 .2 .4 .6 .8 1Household rank in income per capita distibution
45º degree line Cumulative Proportion of total subsidy
Relative Distribution CurveMetro Infrastructure Subsidy
Gini coefficients:benefits: 0.27Funding: 0.0
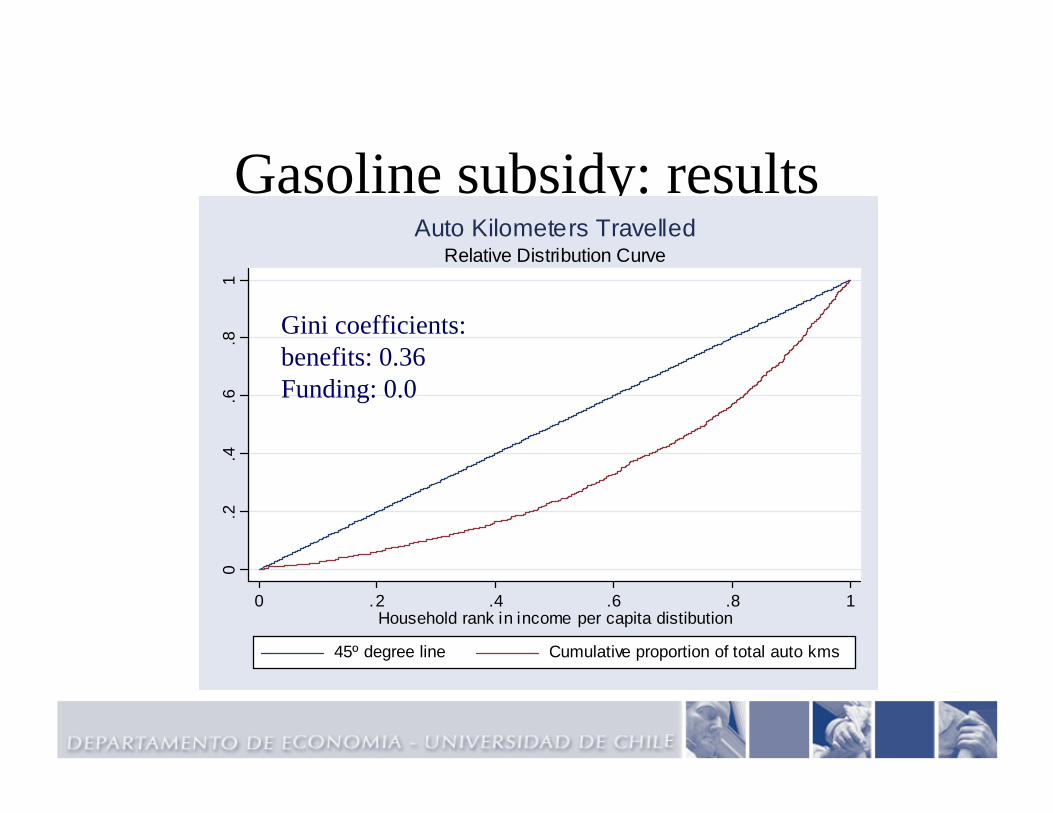
Gasoline subsidy: results0
.2.4
.6.8
1
0 .2 .4 .6 .8 1Household rank in income per capita distibution
45º degree line Cumulative proportion of total auto kms
Relative Distribution CurveAuto Kilometers Travelled
Gini coefficients: benefits: 0.36Funding: 0.0
Bus fare subsidy: results
• Same distributive impact as the funding of the student preferential fare for buses:
• Gini: - 0.11
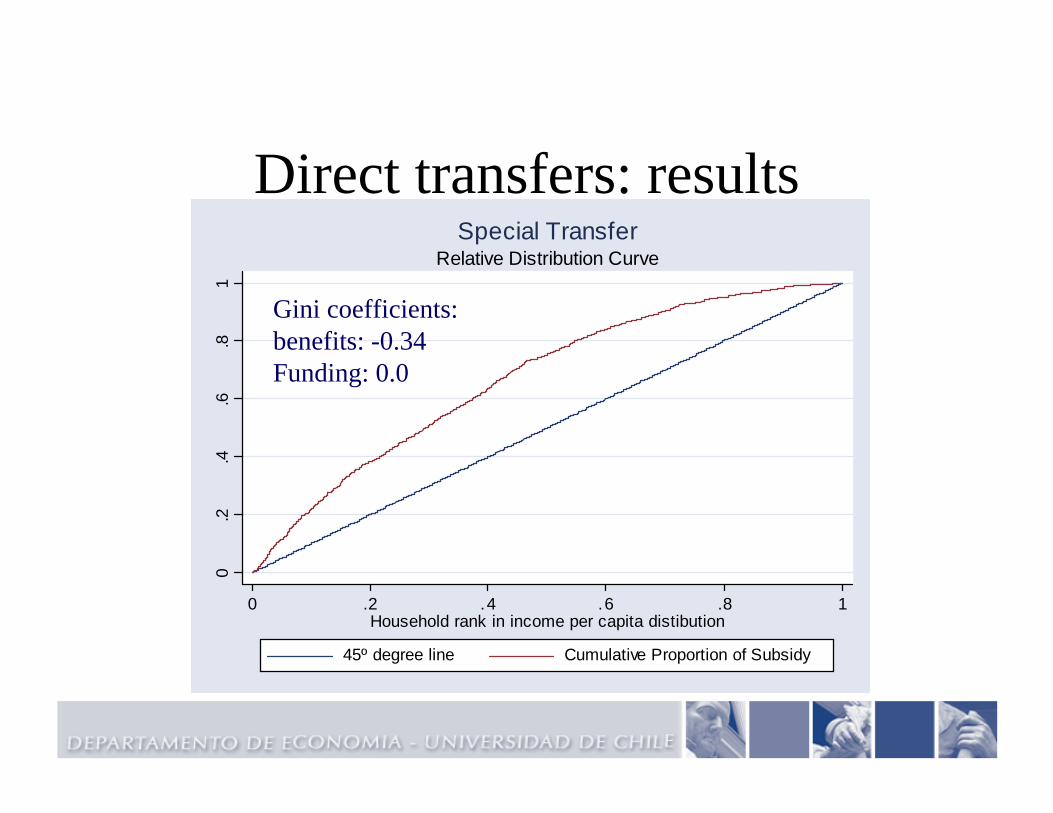
Direct transfers: results0
.2.4
.6.8
1
0 .2 .4 .6 .8 1Household rank in income per capita distibution
45º degree line Cumulative Proportion of Subsidy
Relative Distribution CurveSpecial Transfer
Gini coefficients:benefits: -0.34Funding: 0.0
Santiago case study: conclusions• Except for the transfers, other subsidies are either neutral
or regressive
– Use of general welfare system much better than sectoral subsidy
• Some minor adjustments would improve de distributive impact of existing affordability policies:
– Fund student preferential pass from national budget instead of cross subsidy
3. General comments and conclusions
• Transport affordability is an important issue: but current policies are not pro-poor.
• Sectoral subsidies are hard to target well:– Public utilities:
• Wodon, et. al (2005): water and electricity• Gómez-Lobo and Contreras (2003): water
– Transport:• Santiago, all other case studies• Vale Transporte Brazil, Buenos Aires (Foster, 2005)
Can they be improved?
• Perhaps, but:
– Access problem: many of the poor walk
– Expenditure on transport does not fall fast enough with income
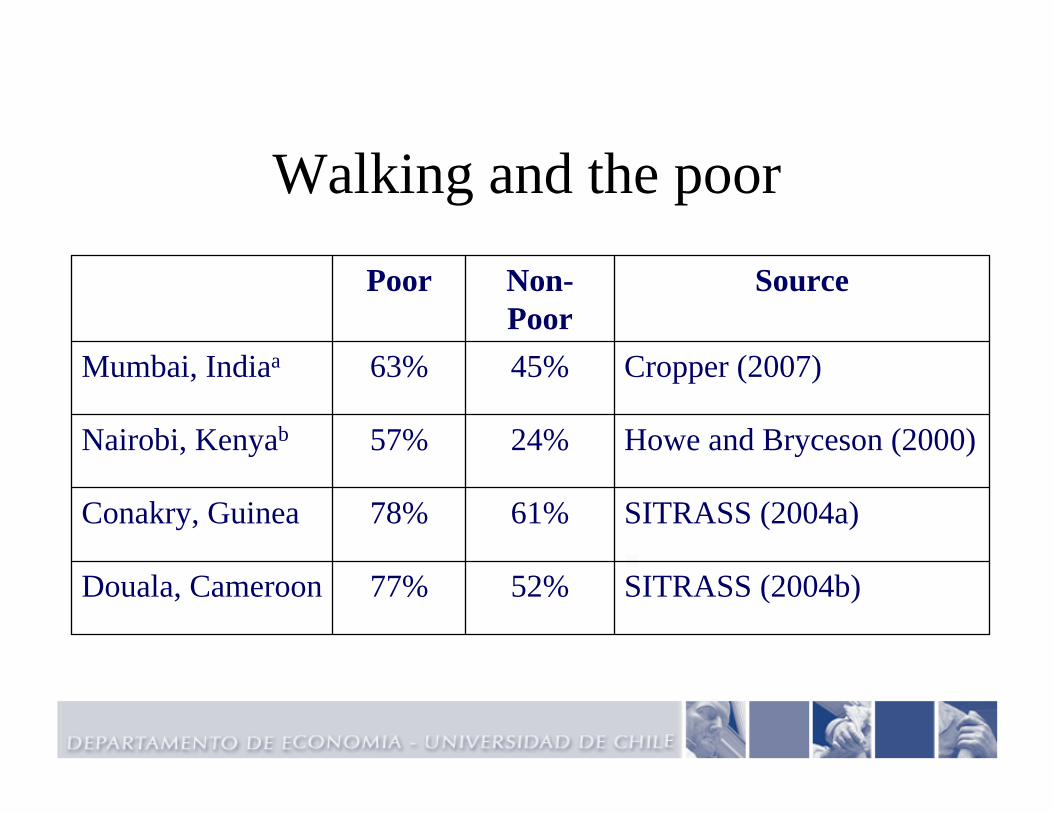
Walking and the poor
SITRASS (2004b)52%77%Douala, Cameroon
SITRASS (2004a)61%78%Conakry, Guinea
Howe and Bryceson (2000)24%57%Nairobi, Kenyab
Cropper (2007)45%63%Mumbai, Indiaa
SourceNon-Poor
Poor
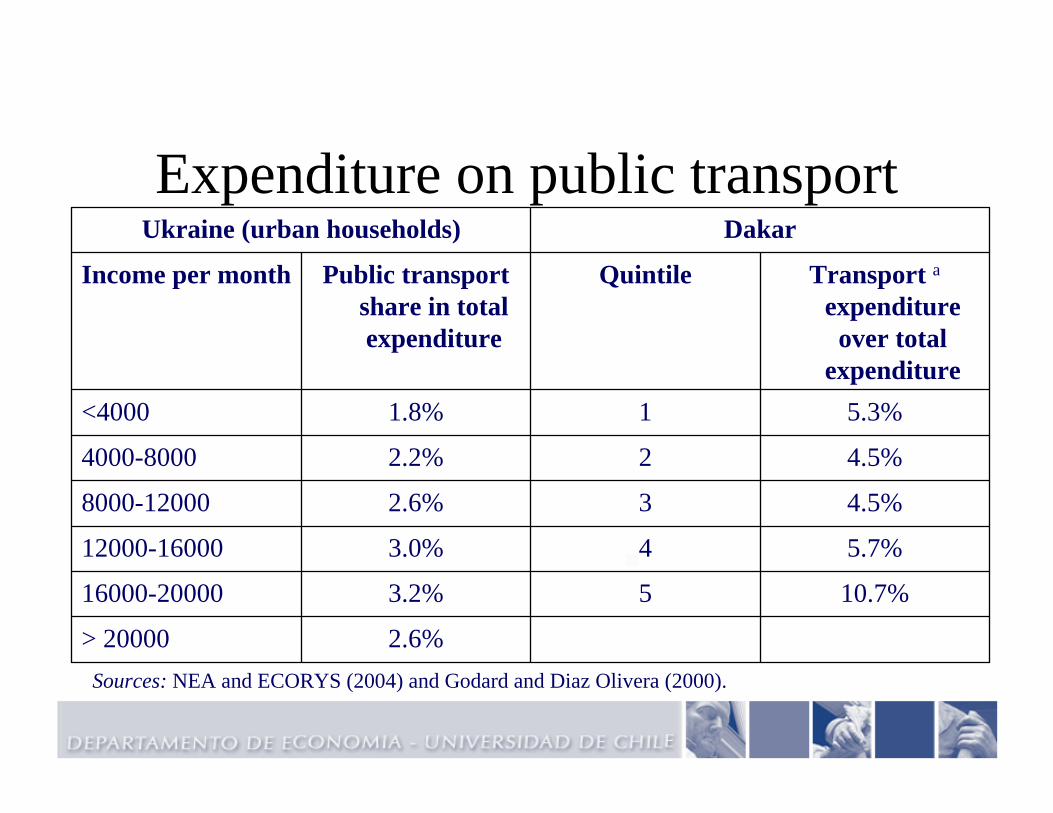
Expenditure on public transport
2.6%> 20000
10.7%53.2%16000-20000
5.7%43.0%12000-16000
4.5%32.6%8000-12000
4.5%22.2%4000-8000
5.3%11.8%<4000
Transport aexpenditure
over total expenditure
QuintilePublic transport share in total expenditure
Income per month
DakarUkraine (urban households)
Sources: NEA and ECORYS (2004) and Godard and Diaz Olivera (2000).
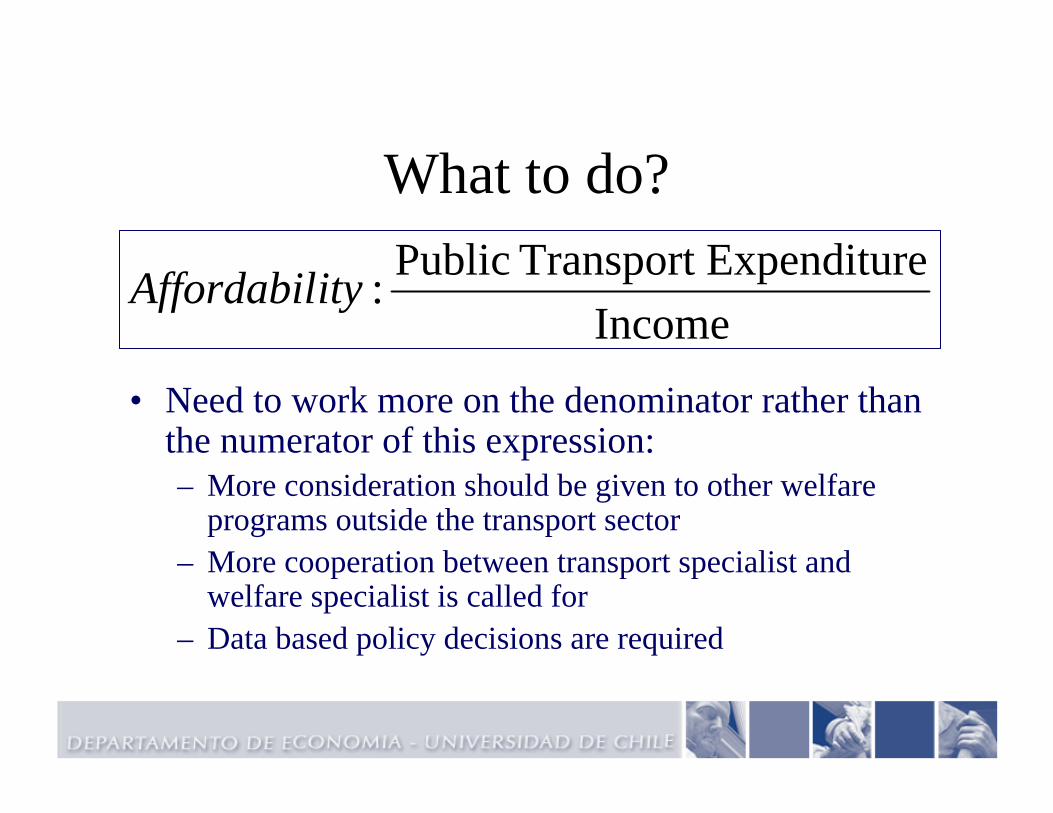
What to do?
• Need to work more on the denominator rather than the numerator of this expression:– More consideration should be given to other welfare
programs outside the transport sector– More cooperation between transport specialist and
welfare specialist is called for– Data based policy decisions are required
IncomeeExpenditurTransport Public:ityAffordabil