Embed Size (px)
Citation preview
Pulsar
Realtime Analytics At ScaleTony Ng, Sharad Murthy
June 11, 2015
2
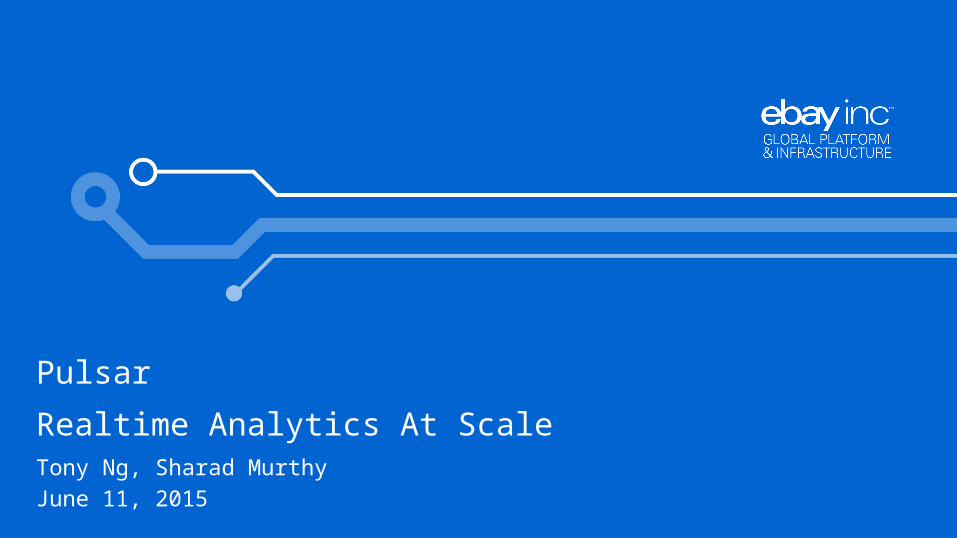
Big Data Trends
•Bigger data volumes•More data sources
–DBs, logs, behavioral & business event streams, sensors …•Faster analysis
–Next day to hours to minutes to seconds•Newer processing models
–MR, in-memory, stream processing, Lambda …
3
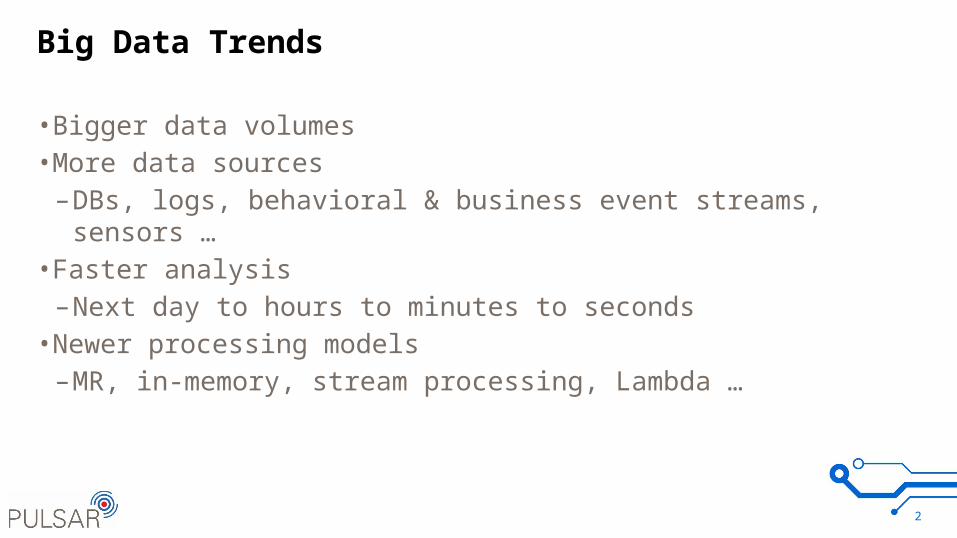
What is Pulsar
Open-source real-time analytics platform and stream processing framework
4
Business Needs for Real-time Analytics
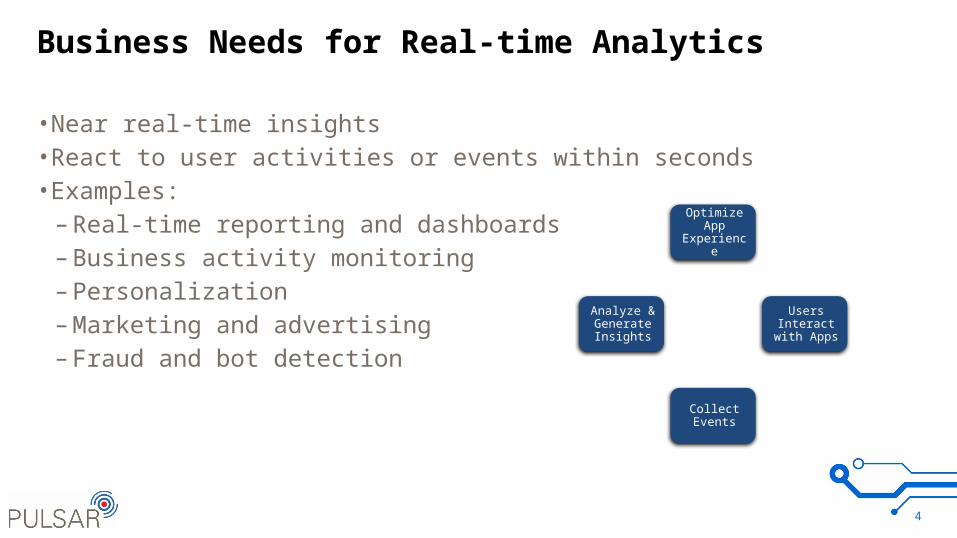
• Near real-time insights• React to user activities or events within seconds• Examples:
– Real-time reporting and dashboards– Business activity monitoring– Personalization– Marketing and advertising– Fraud and bot detection
Optimize App Experience
Users Interact with
Apps
Collect Events
Analyze & Generate Insights
5
Systemic Quality Requirements
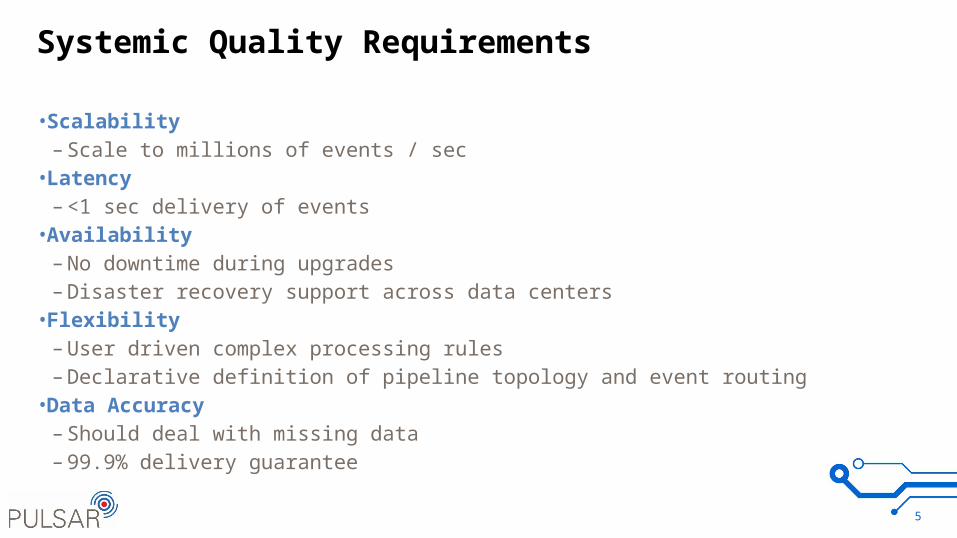
• Scalability– Scale to millions of events / sec
• Latency– <1 sec delivery of events
• Availability– No downtime during upgrades– Disaster recovery support across data centers
• Flexibility– User driven complex processing rules – Declarative definition of pipeline topology and event routing
• Data Accuracy– Should deal with missing data– 99.9% delivery guarantee
6
Pulsar Real-time Analytics
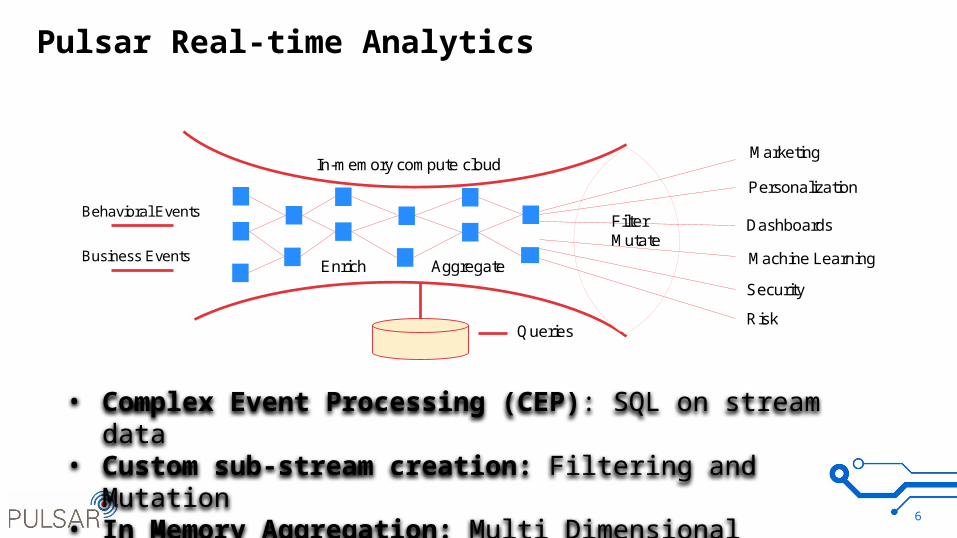
Behavioral Events
Business Events
Marketing
Personalization
Dashboards
Machine Learning
Security
Risk
In-memory compute cloud
Queries
FilterMutate
Enrich Aggregate
• Complex Event Processing (CEP): SQL on stream data• Custom sub-stream creation: Filtering and Mutation• In Memory Aggregation: Multi Dimensional counting
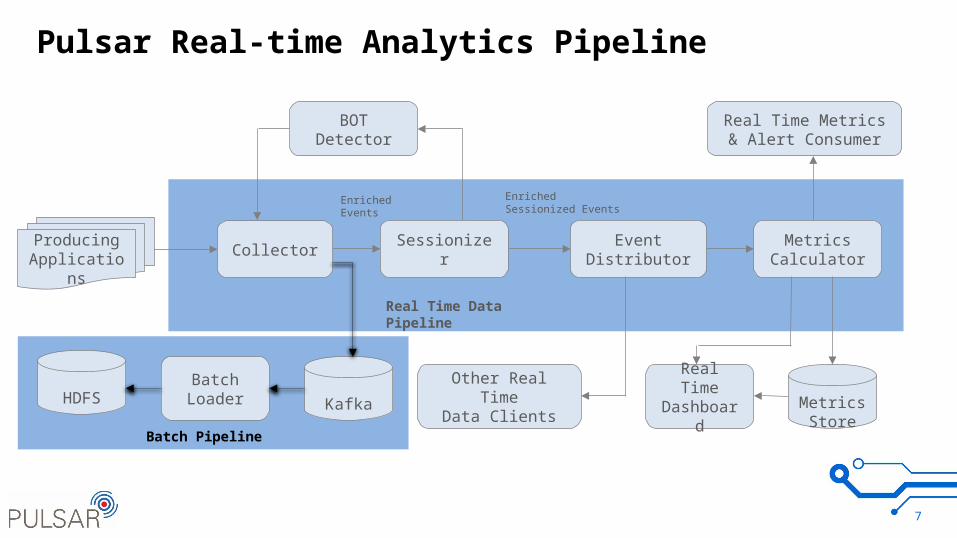
Pulsar Real-time Analytics Pipeline
7
SessionizerMetrics
CalculatorEvent
Distributor
Other Real TimeData Clients Metrics
Store
Collector
Real Time Metrics & Alert Consumer
Real Time Data Pipeline
BOTDetector
EnrichedEvents
EnrichedSessionized Events
ProducingApplications
Real TimeDashboardKafkaHDFS
Batch Loader
Batch Pipeline

Pipeline Data
8
SessionizerMetrics
CalculatorEvent
Distributor
Other Real TimeData Clients
Metrics Store
Collector
Real Time Data Pipeline
ProducingApplications
Real TimeDashboardKafkaHDFS
Batch Loader
Batch Pipeline
100,000+
UnstructuredAvg Payload - 1500 – 3000 bytesPeak 300,000 to 400000 events/sec
100+
1+ Billion sessions
MutatedStreams
Avg latency < 100 millisecond
EventEnrichment
8 – 10 Billion events/day
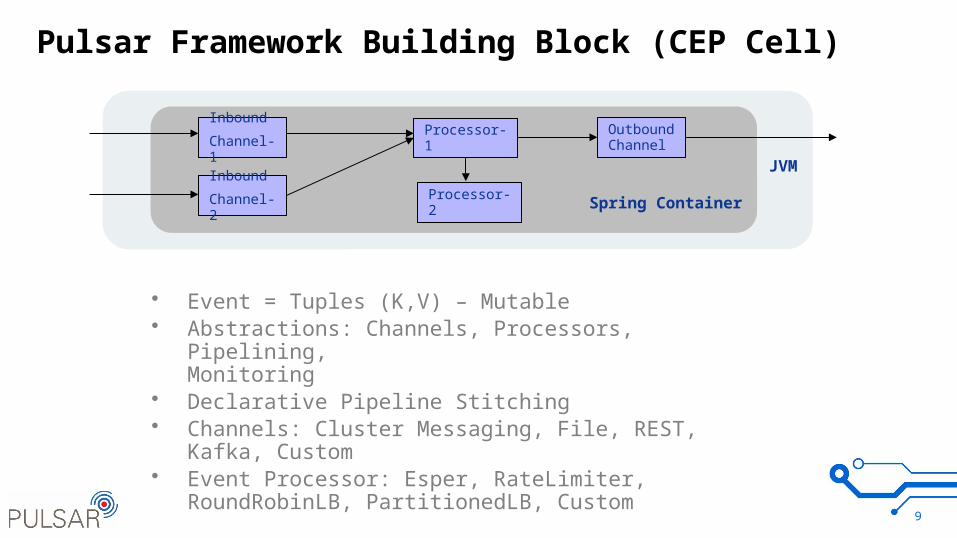
Pulsar Framework Building Block (CEP Cell)
9
• Event = Tuples (K,V) – Mutable• Abstractions: Channels, Processors, Pipelining,
Monitoring• Declarative Pipeline Stitching• Channels: Cluster Messaging, File, REST, Kafka, Custom• Event Processor: Esper, RateLimiter, RoundRobinLB,
PartitionedLB, Custom
Inbound
Channel-1
Inbound
Channel-2
OutboundChannelProcessor-1
Processor-2 Spring Container
JVM
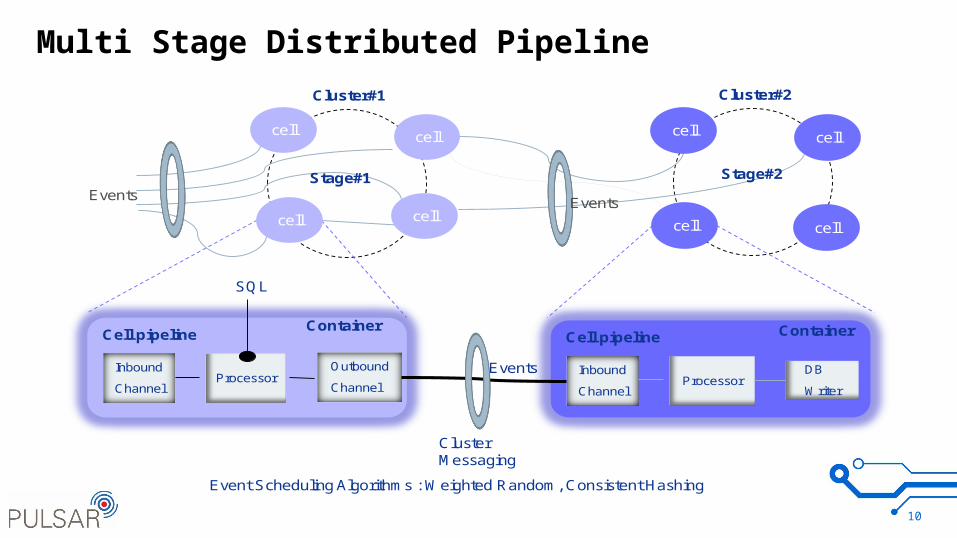
Multi Stage Distributed Pipeline
10
Events
Cell pipeline
Inbound
Channel
Outbound
ChannelProcessor
Cluster#1 Cluster#2
Stage#1 Stage#2
Container
Events
cell cell
cellcell cell
cell cell
cell
Cell pipeline
Inbound
ChannelProcessor
Container
DB
Writer
Events
ClusterMessaging
Event Scheduling Algorithms : Weighted Random, Consistent Hashing
SQL
11
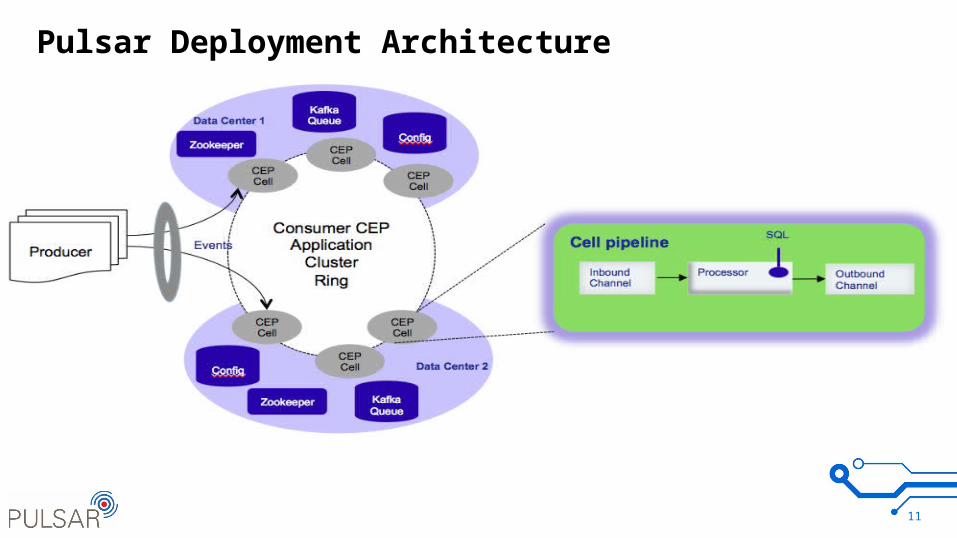
Pulsar Deployment Architecture
12
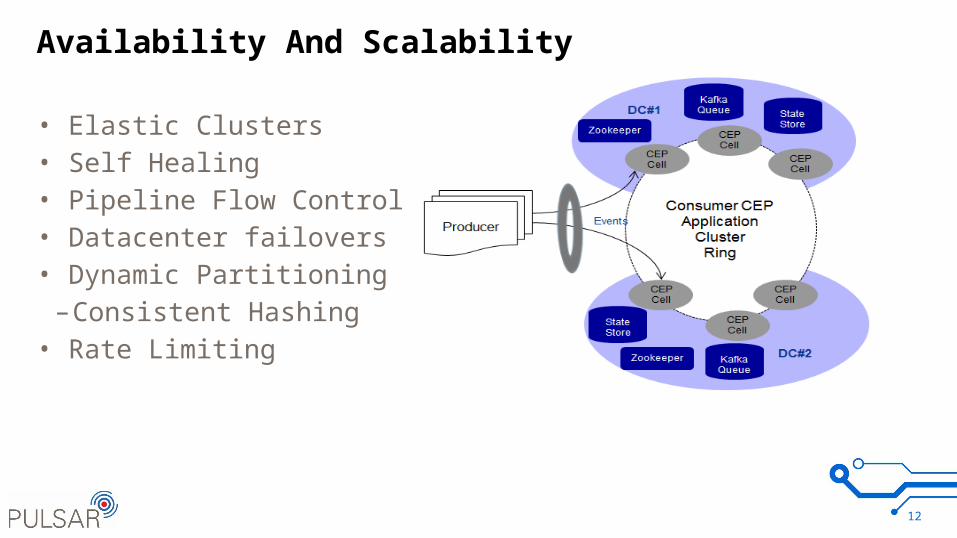
Availability And Scalability
• Elastic Clusters• Self Healing• Pipeline Flow Control• Datacenter failovers• Dynamic Partitioning
–Consistent Hashing• Rate Limiting
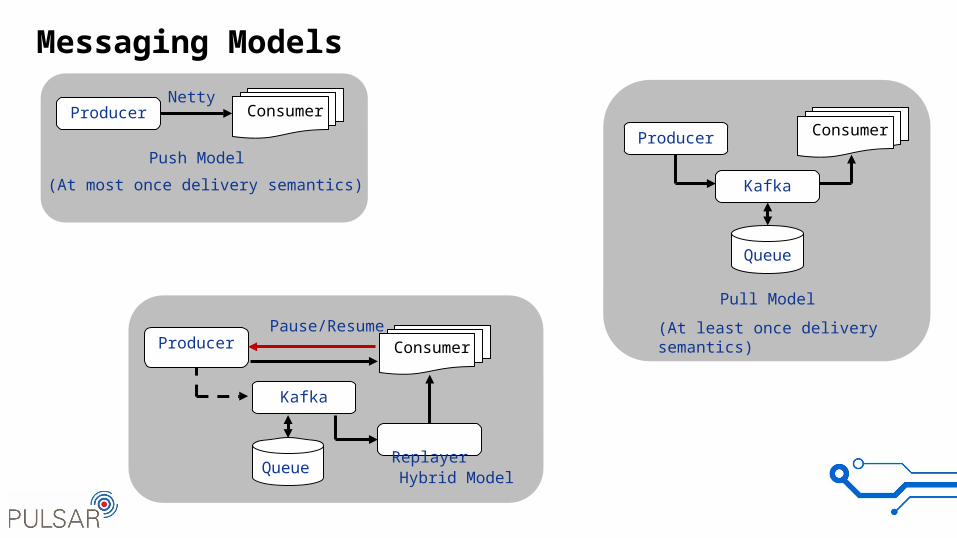
Messaging Models
Producer
Producer
Queue
Kafka
Producer
Queue
Kafka
Replayer
Push Model
Pull Model
Pause/Resume
Hybrid Model
(At most once delivery semantics)
(At least once delivery semantics)
ConsumerConsumer
Consumer
Netty
14
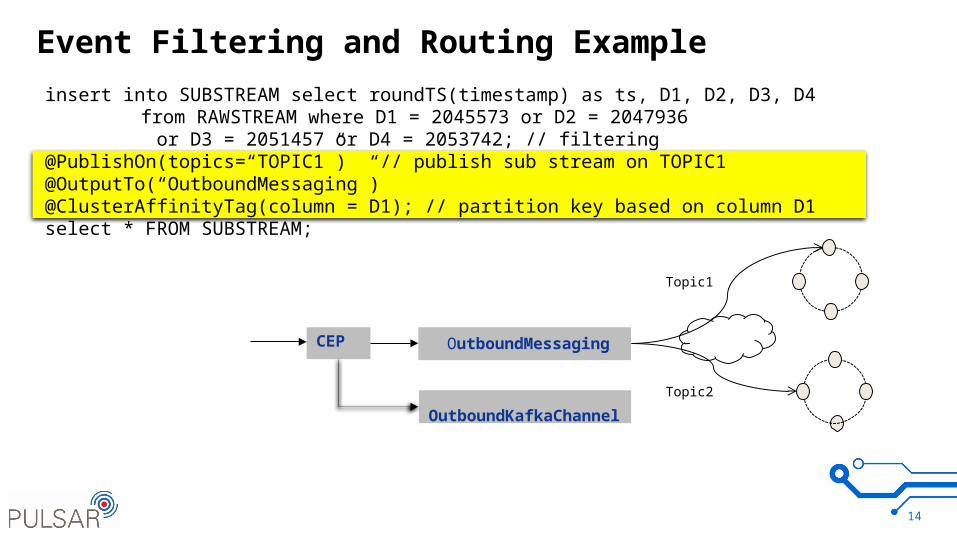
Event Filtering and Routing Example
CEP OutboundMessaging
Topic1
Topic2
insert into SUBSTREAM select roundTS(timestamp) as ts, D1, D2, D3, D4 from RAWSTREAM where D1 = 2045573 or D2 = 2047936
or D3 = 2051457 or D4 = 2053742; // filtering @PublishOn(topics=“TOPIC1”) // publish sub stream on TOPIC1 @OutputTo(“OutboundMessaging”) @ClusterAffinityTag(column = D1); // partition key based on column D1 select * FROM SUBSTREAM;
OutboundKafkaChannel
15
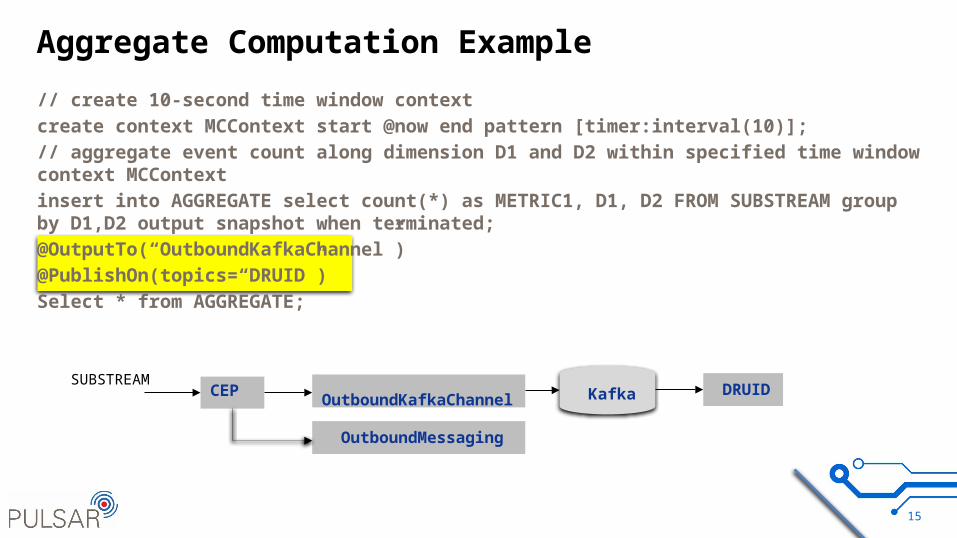
Aggregate Computation Example
// create 10-second time window context create context MCContext start @now end pattern [timer:interval(10)]; // aggregate event count along dimension D1 and D2 within specified time window context MCContext insert into AGGREGATE select count(*) as METRIC1, D1, D2 FROM SUBSTREAM group by D1,D2 output snapshot when terminated; @OutputTo(“OutboundKafkaChannel”)@PublishOn(topics=“DRUID”)Select * from AGGREGATE;
CEP OutboundKafkaChannel Kafka DRUIDSUBSTREAM
OutboundMessaging
16
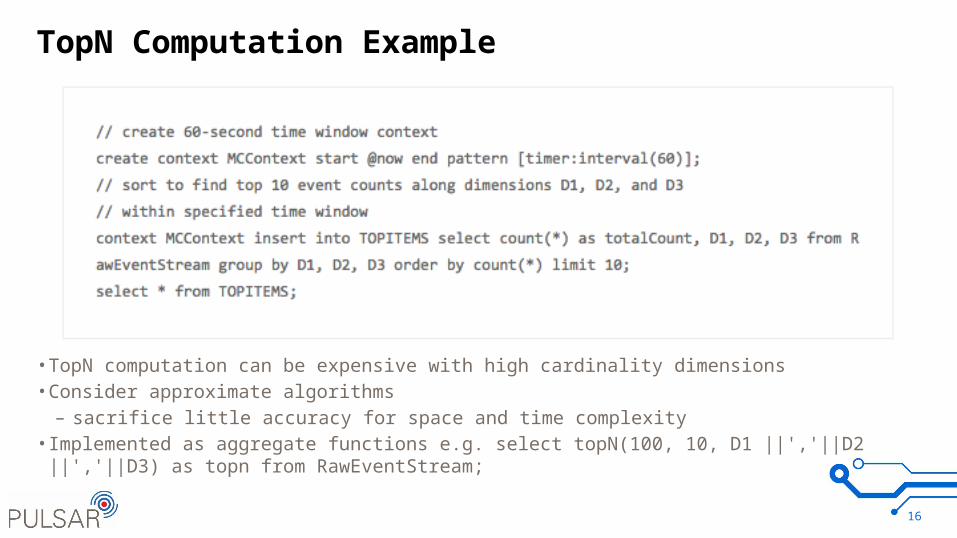
TopN Computation Example
• TopN computation can be expensive with high cardinality dimensions• Consider approximate algorithms
– sacrifice little accuracy for space and time complexity• Implemented as aggregate functions e.g. select topN(100, 10, D1 ||','||D2 ||','||D3) as topn from
RawEventStream;
17
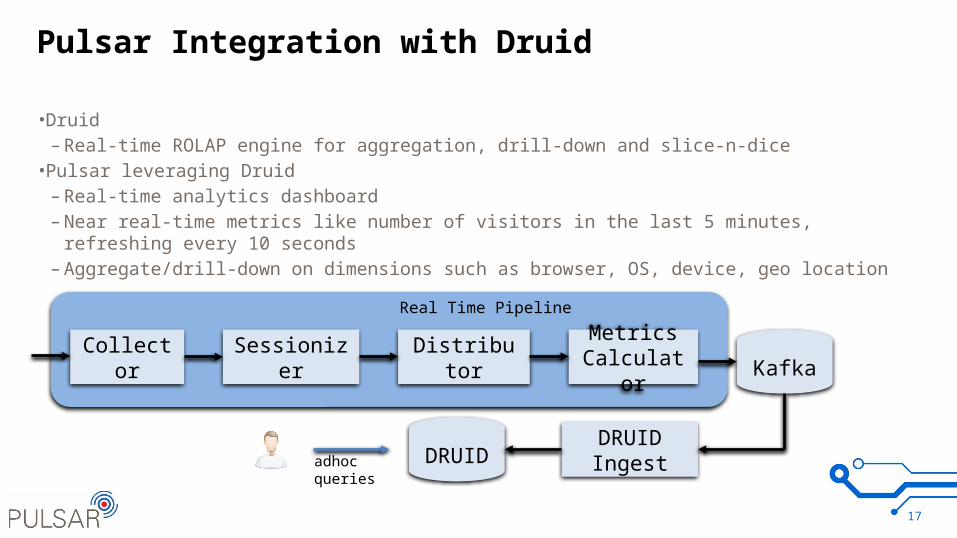
Pulsar Integration with Druid
• Druid– Real-time ROLAP engine for aggregation, drill-down and slice-n-dice
• Pulsar leveraging Druid– Real-time analytics dashboard– Near real-time metrics like number of visitors in the last 5 minutes, refreshing every 10 seconds– Aggregate/drill-down on dimensions such as browser, OS, device, geo location
Collector Sessionizer DistributorMetrics
Calculator Kafka
DRUIDIngestDRUID
Real Time Pipeline
adhocqueries
Key Differentiators
•Declarative Topology Management•Streaming SQL with hot deployment of SQL•Elastic clustering with flow control in the cloud•Dynamic partitioning of clusters•Hybrid messaging model
–Combo of push and pull
•< 100 millisecond pipeline latency•99.99% Availability•< 0.01% steady state data loss
18
Future Development and Open Source
•Real-time reporting API and dashboard•Integration with Druid and other metrics stores•Session store scaling to 1 million insert/update per sec•Rolling window aggregation over long time windows (hours or days)
•GROK filters for log processing•Anomaly detection
19
20
More Information
•GitHub: http://github.com/pulsarIO–repos: pipeline, framework, docker files
•Website: http://gopulsar.io–Technical whitepaper–Getting started–Documentation
•Google group: http://groups.google.com/d/forum/pulsar