Embed Size (px)
Citation preview
Prof. dr. Bart Baesens
Department of Decision Sciences and Information Management, KU Leuven (Belgium)
School of Management, University of Southampton (United Kingdom) [email protected]
Twitter/Facebook/YouTube: DataMiningApps www.dataminingapps.com
Putting Big Data & Analytics to Work!
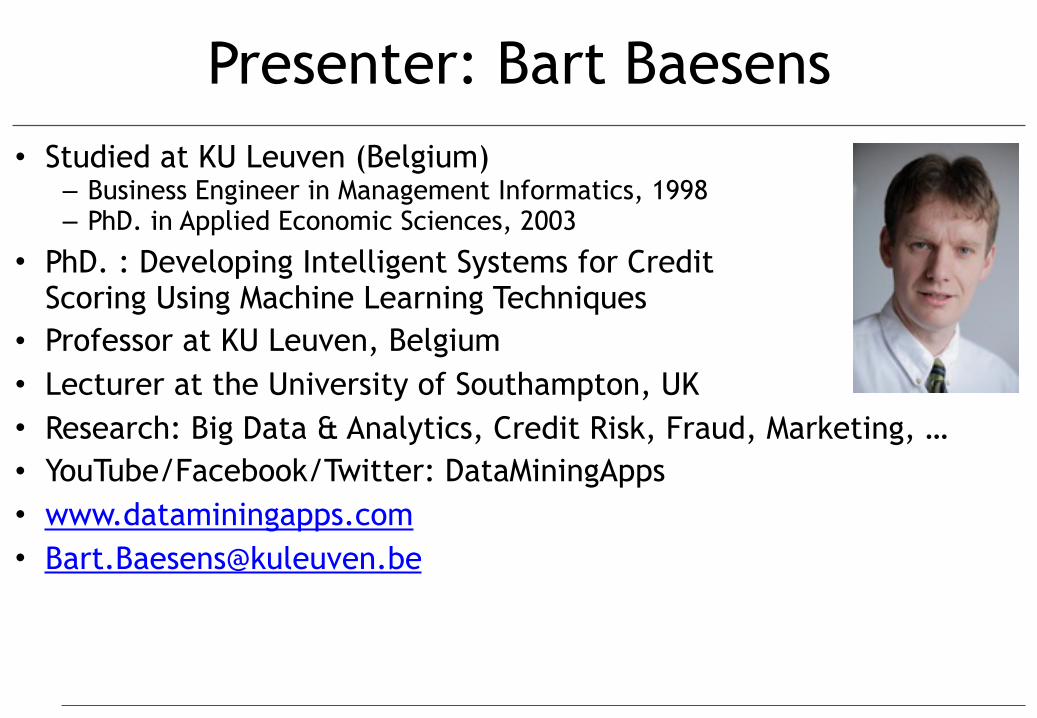
Presenter: Bart Baesens• Studied at KU Leuven (Belgium)
– Business Engineer in Management Informatics, 1998 – PhD. in Applied Economic Sciences, 2003
• PhD. : Developing Intelligent Systems for Credit Scoring Using Machine Learning Techniques
• Professor at KU Leuven, Belgium • Lecturer at the University of Southampton, UK • Research: Big Data & Analytics, Credit Risk, Fraud, Marketing, … • YouTube/Facebook/Twitter: DataMiningApps • www.dataminingapps.com • [email protected]
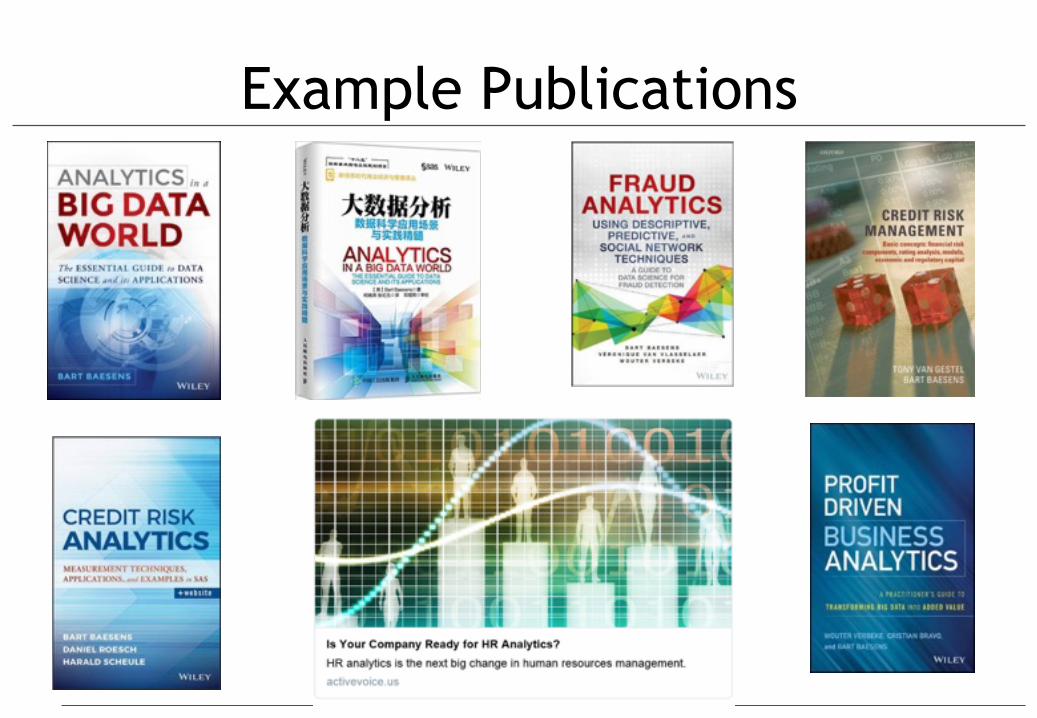
Example Publications
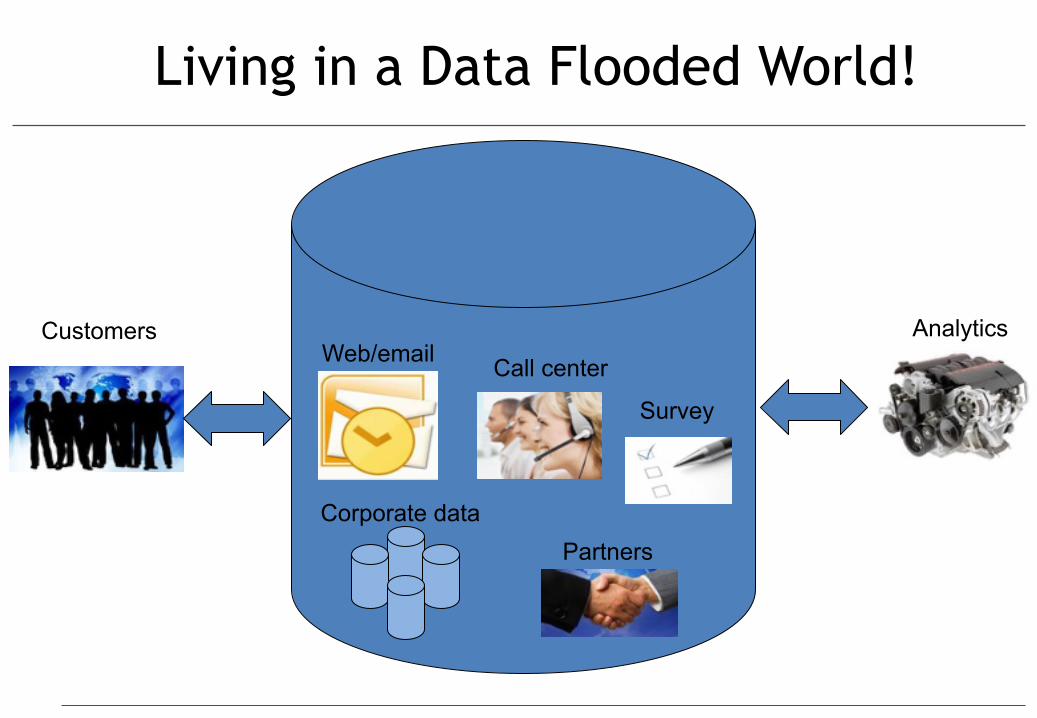
Living in a Data Flooded World!
Web/email
PartnersCorporate data
Call center
Analytics
Survey
Customers
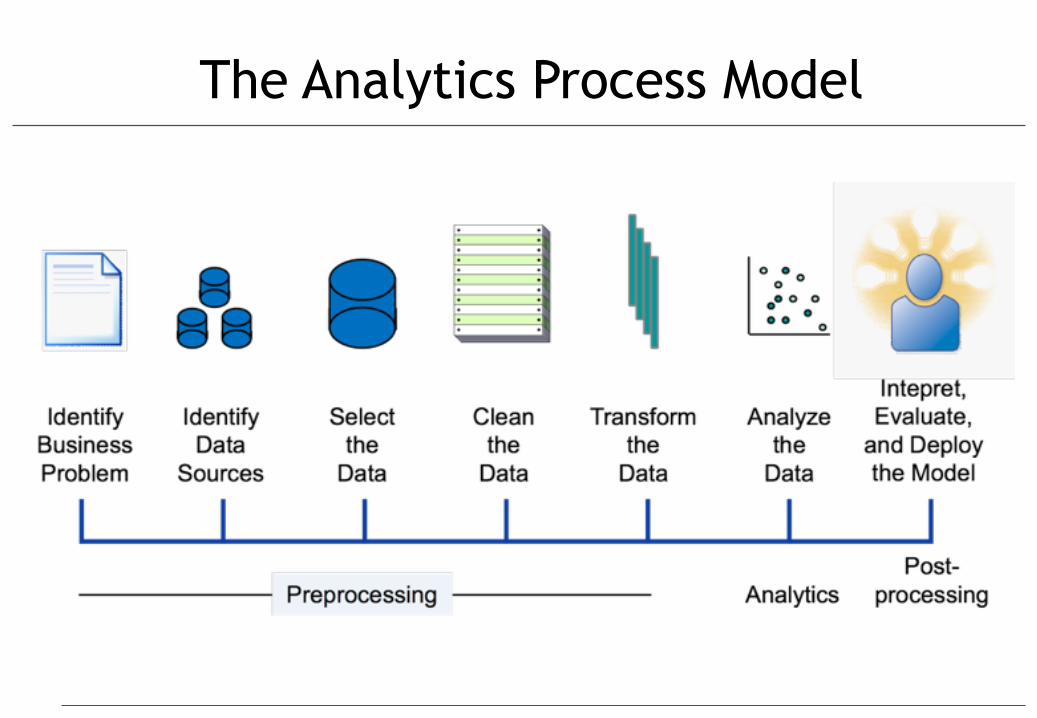
The Analytics Process Model
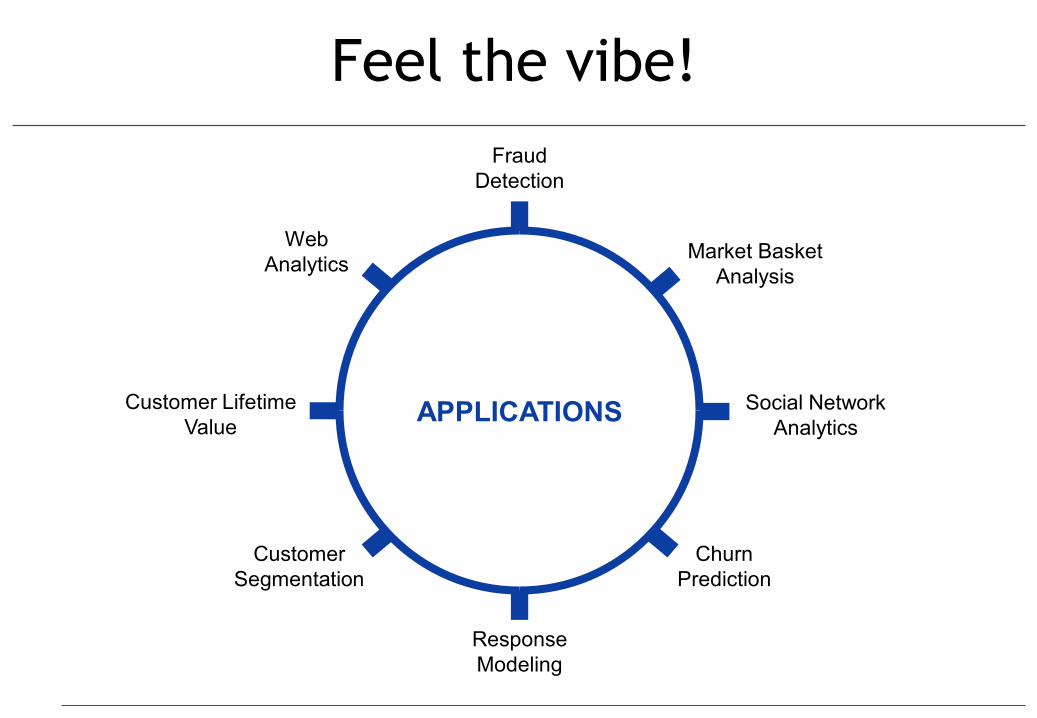
Feel the vibe!
APPLICATIONS
FraudDetection
Social NetworkAnalytics
ResponseModeling
Customer LifetimeValue
Market BasketAnalysis
ChurnPrediction
CustomerSegmentation
WebAnalytics
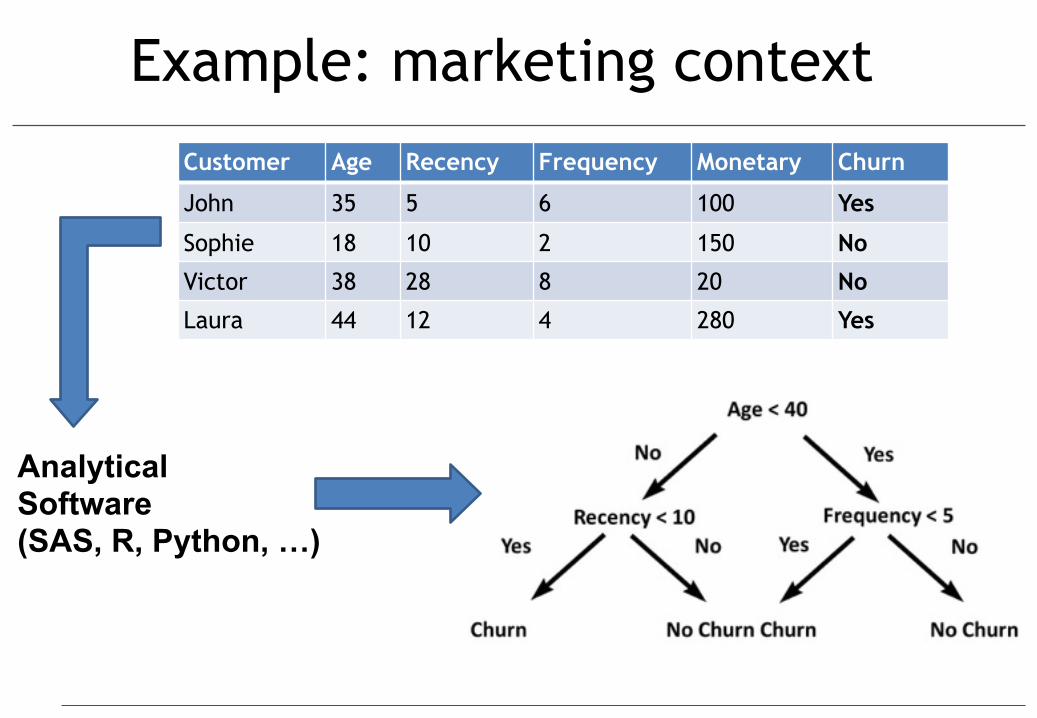
Example: marketing context
Customer Age Recency Frequency Monetary Churn
John 35 5 6 100 Yes
Sophie 18 10 2 150 No
Victor 38 28 8 20 No
Laura 44 12 4 280 Yes
Analytical Software (SAS, R, Python, …)
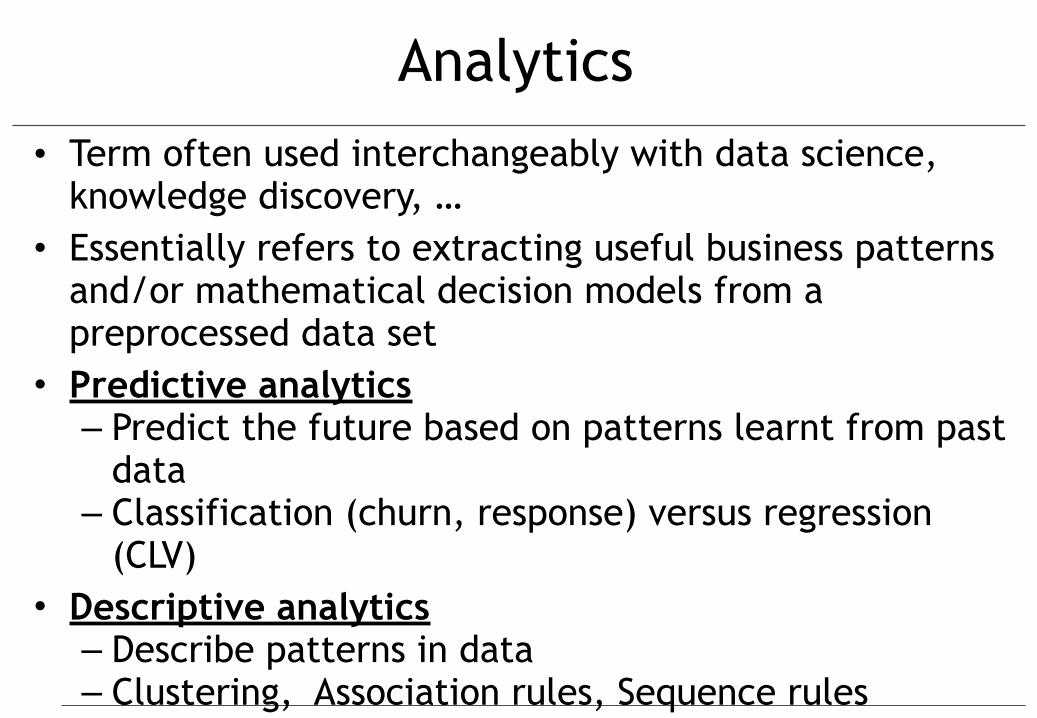
Analytics• Term often used interchangeably with data science,
knowledge discovery, … • Essentially refers to extracting useful business patterns
and/or mathematical decision models from a preprocessed data set
• Predictive analytics – Predict the future based on patterns learnt from past
data – Classification (churn, response) versus regression
(CLV) • Descriptive analytics
– Describe patterns in data – Clustering, Association rules, Sequence rules
Analytic Model requirements
• Business relevance – Solve a particular business problem
• Statistical performance – Statistical significance of model – Statistical prediction performance
• Interpretability + Justifiability – Very subjective (depends on decision maker), but CRUCIAL! – Often need to be balanced against statistical performance
• Operational efficiency – How can the analytical models be integrated with campaign
management? • Economical cost
– What is the cost to gather the model inputs and evaluate the model? – Is it worthwhile buying external data and/or models?
• Regulatory compliance – In accordance with regulation and legislation
Post processing• Interpretation and validation of analytical models by
business experts • Trivial versus unexpected (interesting?) patterns
• Sensitivity analysis • How sensitive is the model wrt sample characteristics, assumptions and/or
technique parameters?
• Deploy analytical model into business setting • Represent model output in a user-friendly way • Integrate with campaign management tools and marketing decision engines
• Model monitoring and backtesting • Continuously monitor model output • Contrast model output with observed numbers
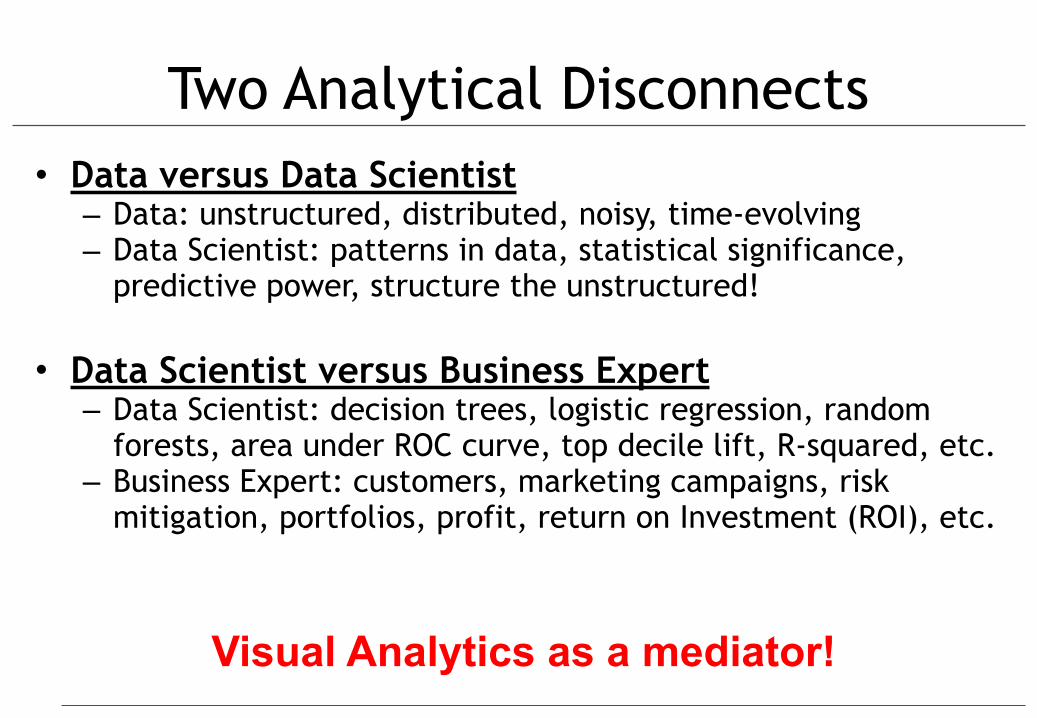
Two Analytical Disconnects• Data versus Data Scientist
– Data: unstructured, distributed, noisy, time-evolving – Data Scientist: patterns in data, statistical significance,
predictive power, structure the unstructured!
• Data Scientist versus Business Expert – Data Scientist: decision trees, logistic regression, random
forests, area under ROC curve, top decile lift, R-squared, etc. – Business Expert: customers, marketing campaigns, risk
mitigation, portfolios, profit, return on Investment (ROI), etc.
Visual Analytics as a mediator!
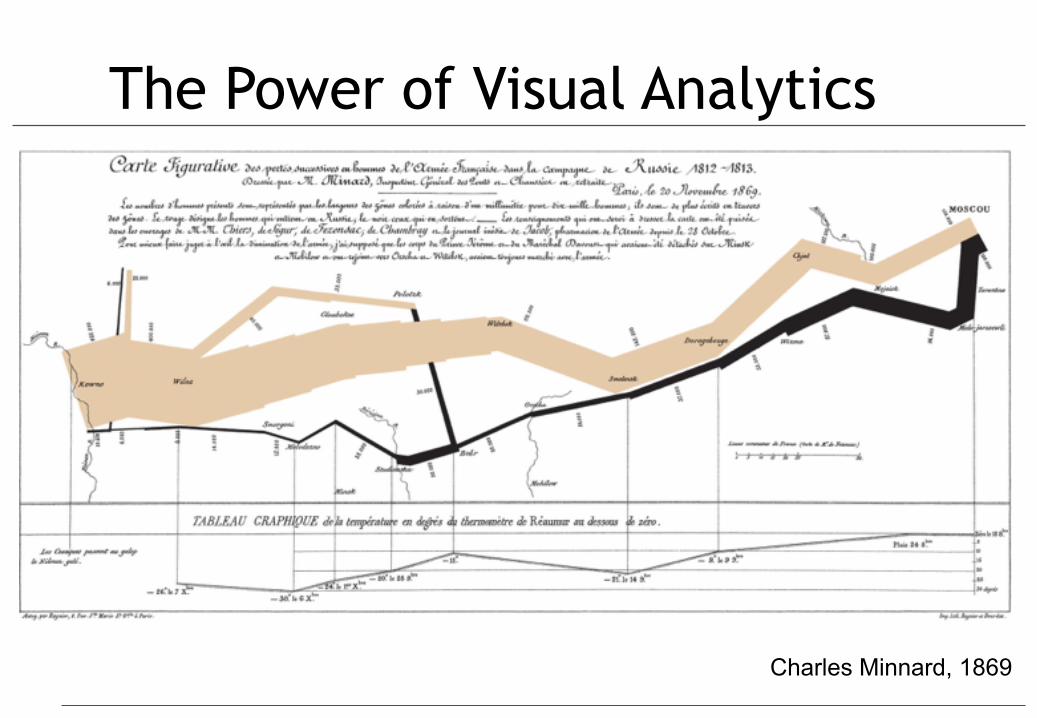
The Power of Visual Analytics
Charles Minnard, 1869
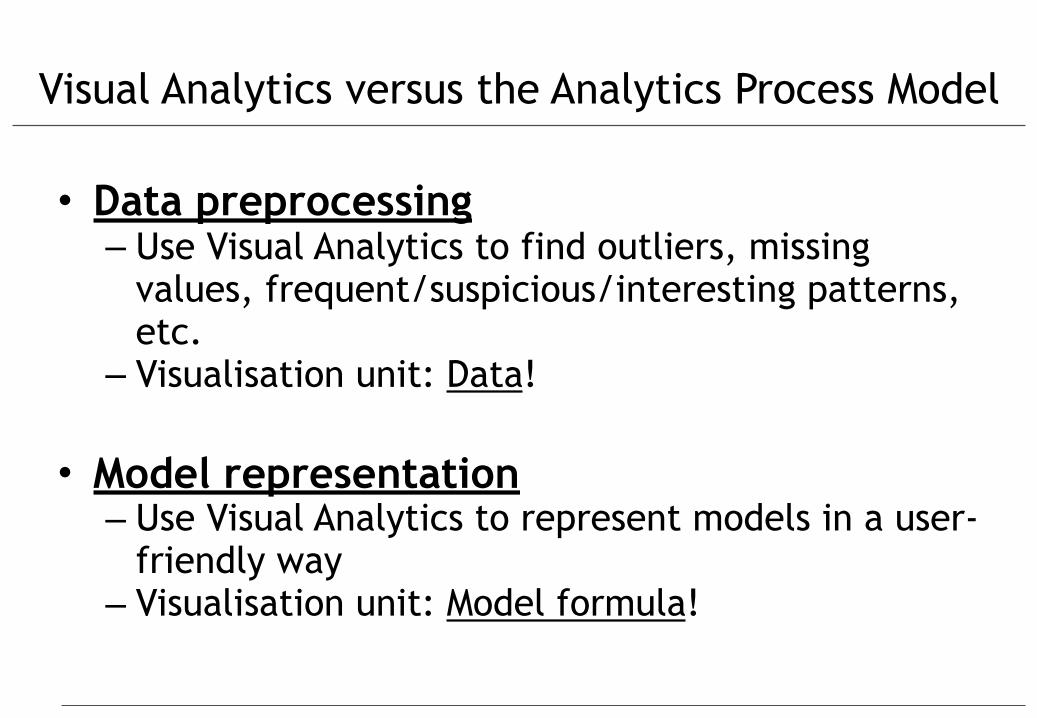
Visual Analytics versus the Analytics Process Model
• Data preprocessing – Use Visual Analytics to find outliers, missing
values, frequent/suspicious/interesting patterns, etc.
– Visualisation unit: Data!
• Model representation – Use Visual Analytics to represent models in a user-
friendly way – Visualisation unit: Model formula!
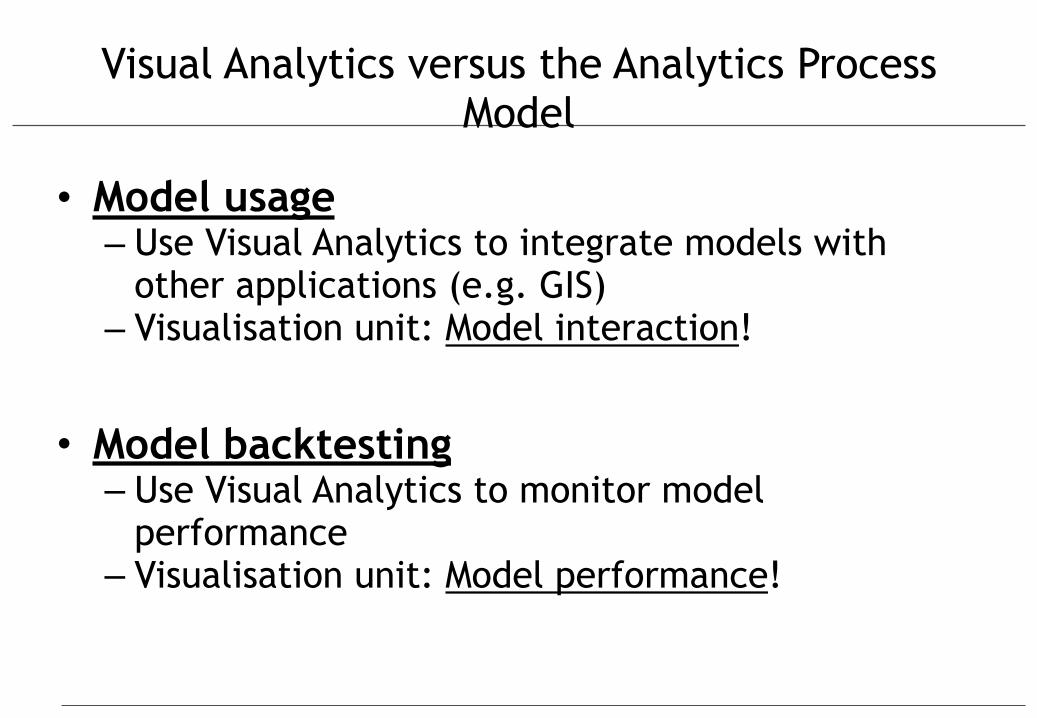
Visual Analytics versus the Analytics Process Model
• Model usage – Use Visual Analytics to integrate models with
other applications (e.g. GIS) – Visualisation unit: Model interaction!
• Model backtesting – Use Visual Analytics to monitor model
performance – Visualisation unit: Model performance!
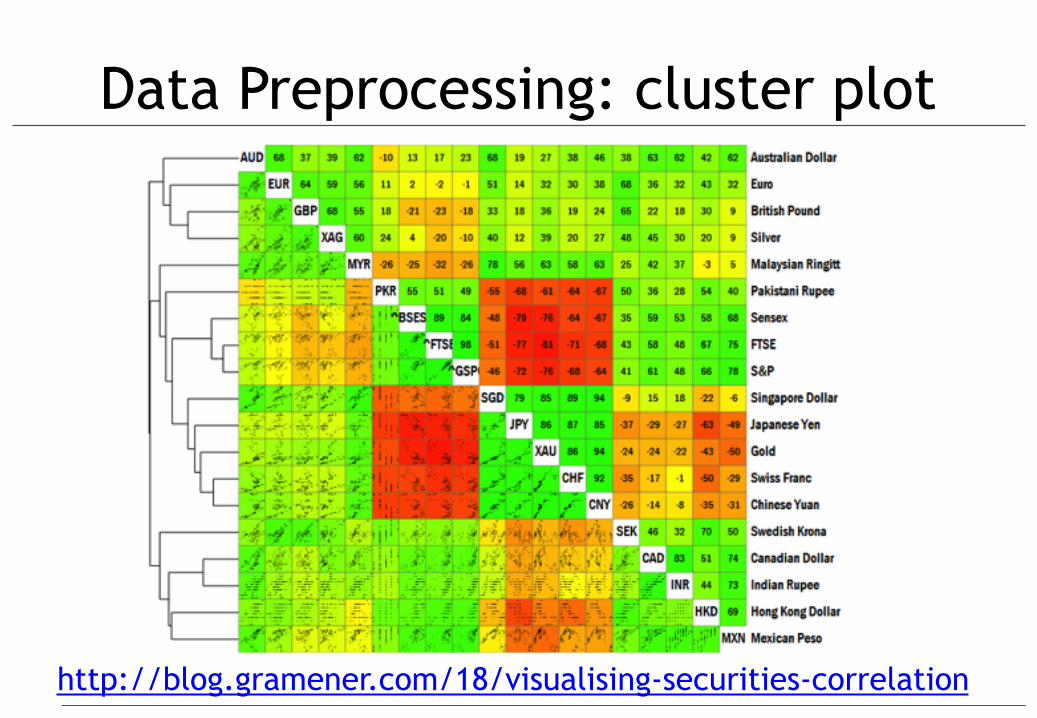
Data Preprocessing: cluster plot
http://blog.gramener.com/18/visualising-securities-correlation
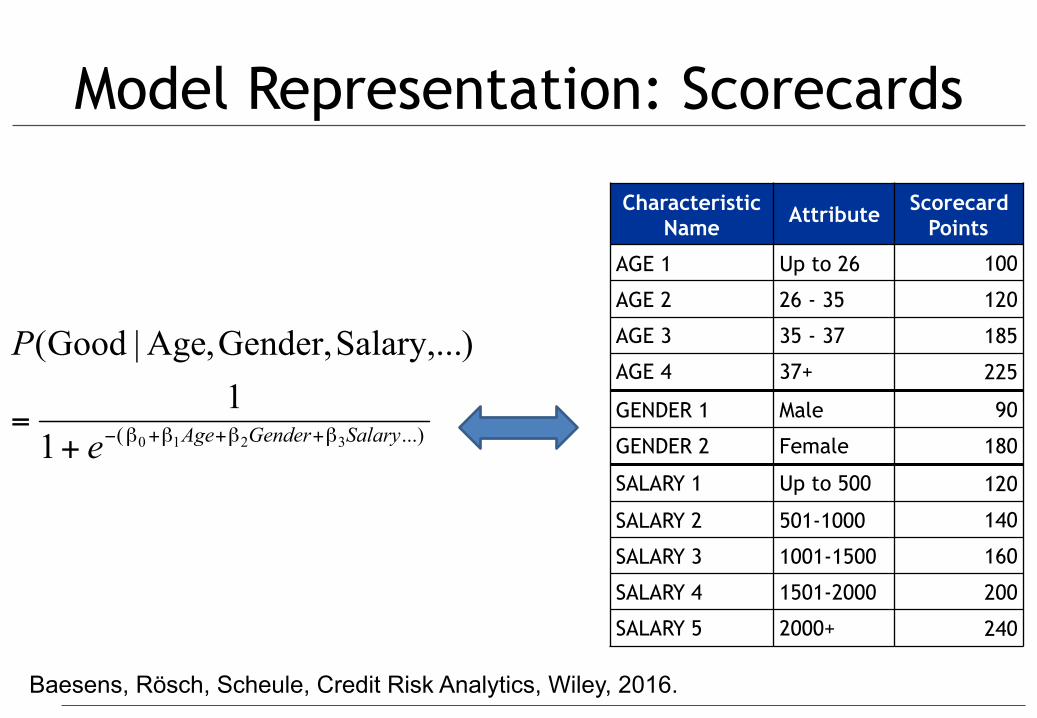
Model Representation: Scorecards
Characteristic Name Attribute Scorecard
Points
AGE 1 Up to 26 100
AGE 2 26 - 35 120
AGE 3 35 - 37 185
AGE 4 37+ 225
GENDER 1 Male 90
GENDER 2 Female 180
SALARY 1 Up to 500 120
SALARY 2 501-1000 140
SALARY 3 1001-1500 160
SALARY 4 1501-2000 200
SALARY 5 2000+ 240
...)( 321011
)Salary,...Gender,,Age|Good(
SalaryGenderAgee
P
ββββ +++−+=
Baesens, Rösch, Scheule, Credit Risk Analytics, Wiley, 2016.
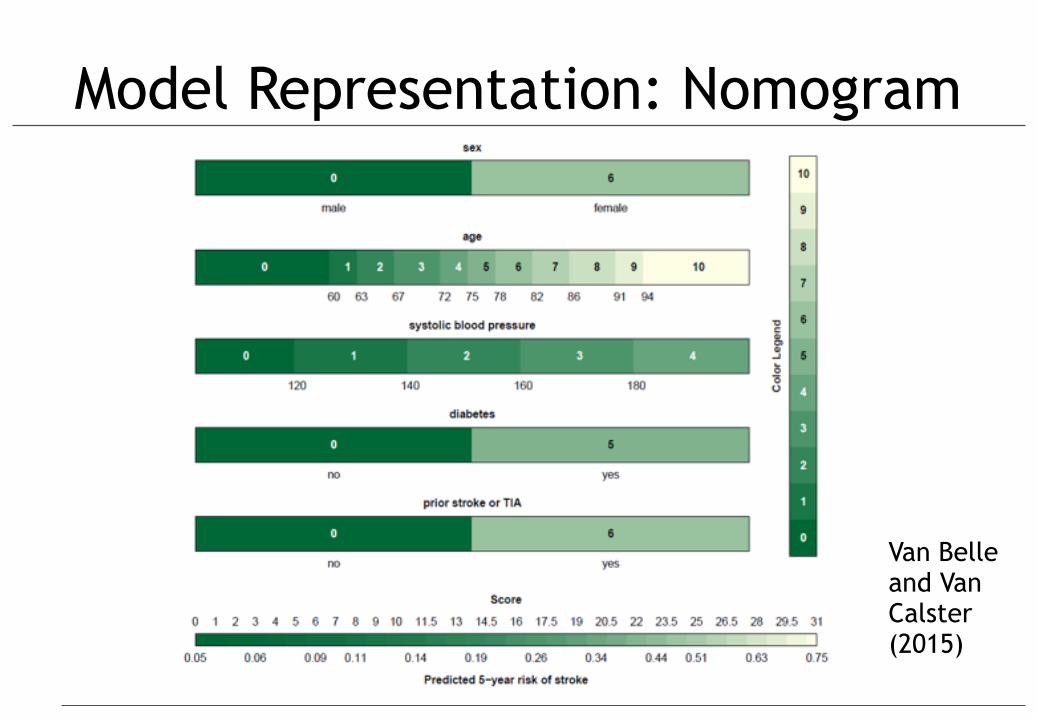
Model Representation: Nomogram
Van Belle and Van Calster (2015)
Model Representation
• Bridge the gap between the analytical model and the business user
• Minimize information loss between analytical model and visual representation
• Business user engagement to foster trust • Note: model interpretability depends upon
business application – Credit risk versus medical diagnosis – Fraud detection versus fraud prevention
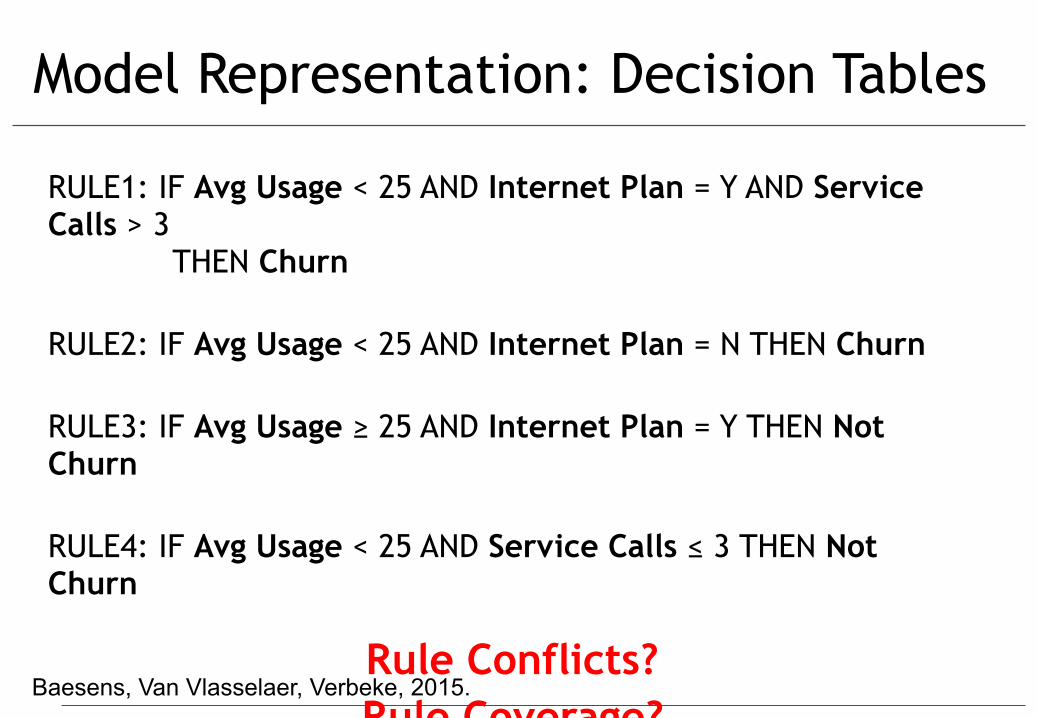
Model Representation: Decision Tables
RULE1: IF Avg Usage < 25 AND Internet Plan = Y AND Service Calls > 3 THEN Churn
RULE2: IF Avg Usage < 25 AND Internet Plan = N THEN Churn
RULE3: IF Avg Usage ≥ 25 AND Internet Plan = Y THEN Not Churn
RULE4: IF Avg Usage < 25 AND Service Calls ≤ 3 THEN Not Churn
Rule Conflicts? Rule Coverage?
Baesens, Van Vlasselaer, Verbeke, 2015.
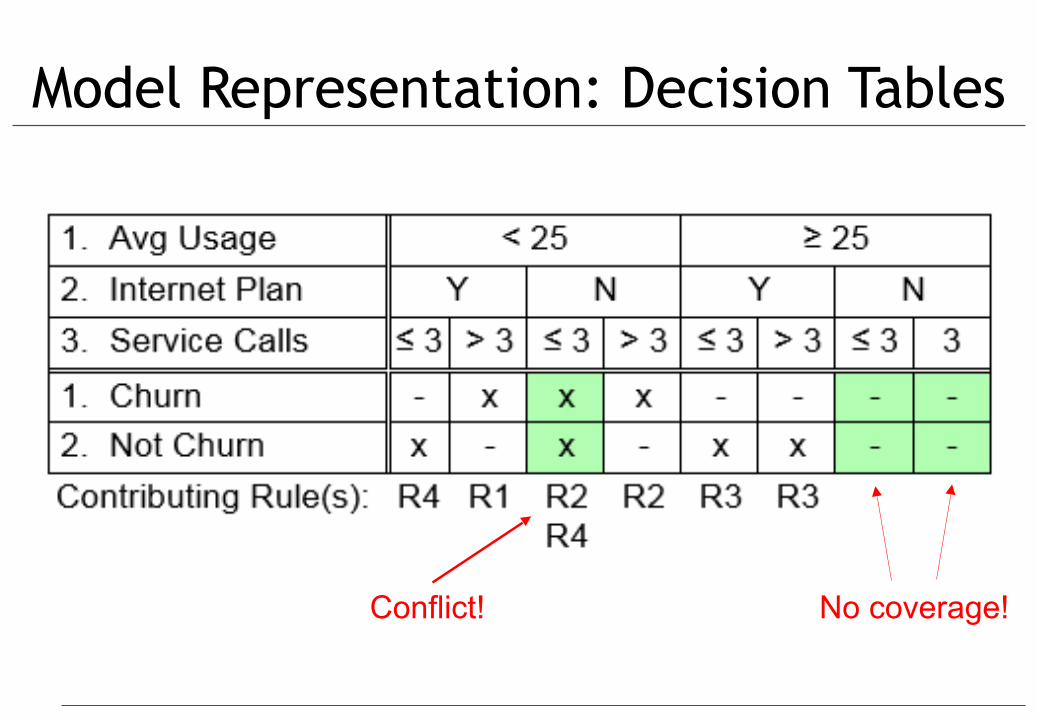
Model Representation: Decision Tables
Conflict! No coverage!
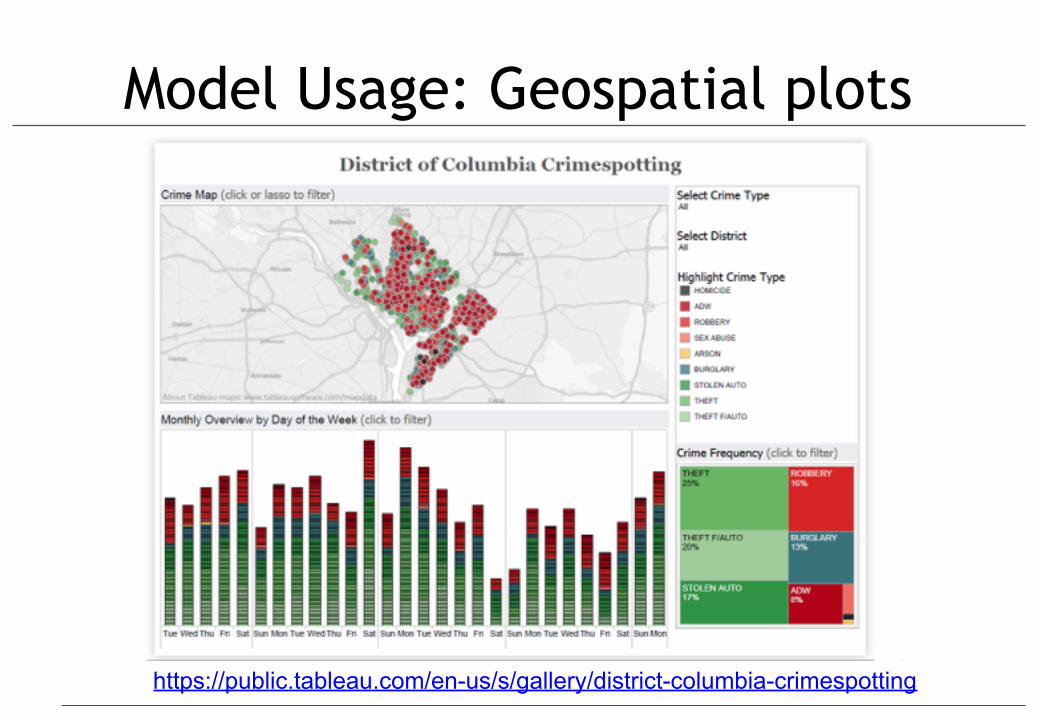
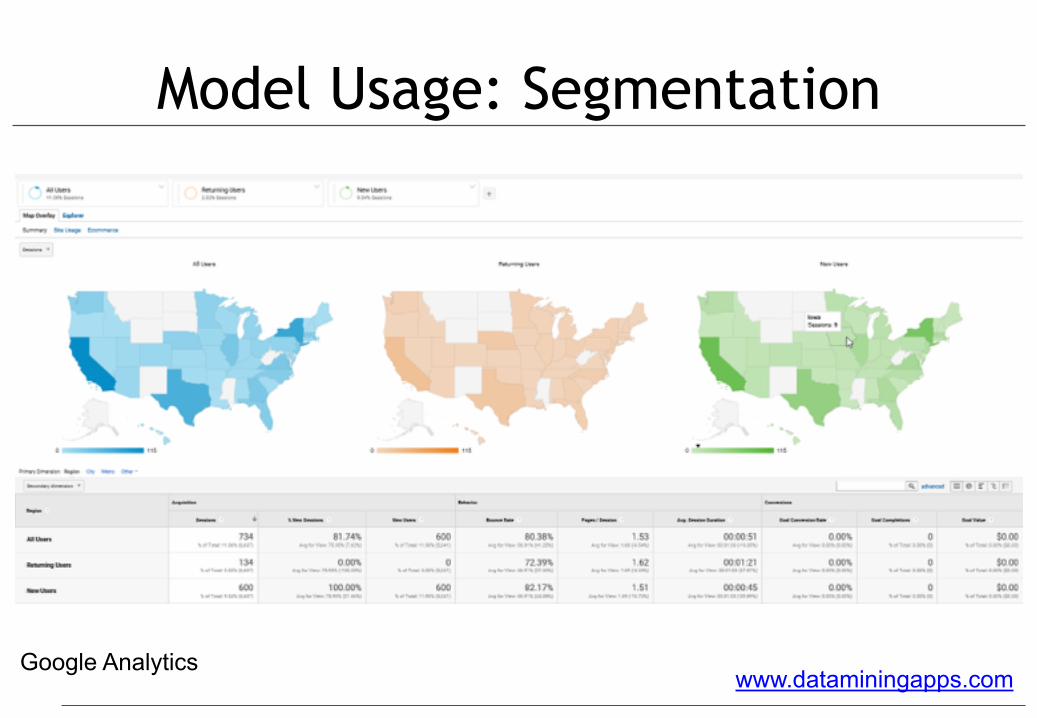
Model Usage: Geospatial plots
https://public.tableau.com/en-us/s/gallery/district-columbia-crimespotting
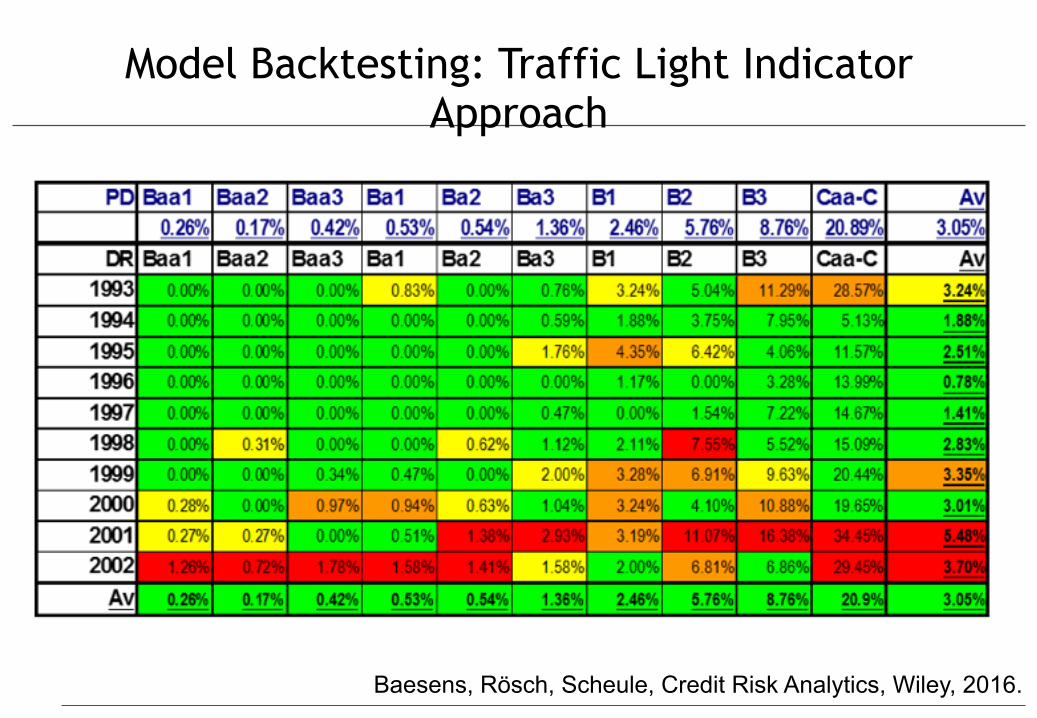
Model Backtesting: Traffic Light Indicator Approach
Baesens, Rösch, Scheule, Credit Risk Analytics, Wiley, 2016.
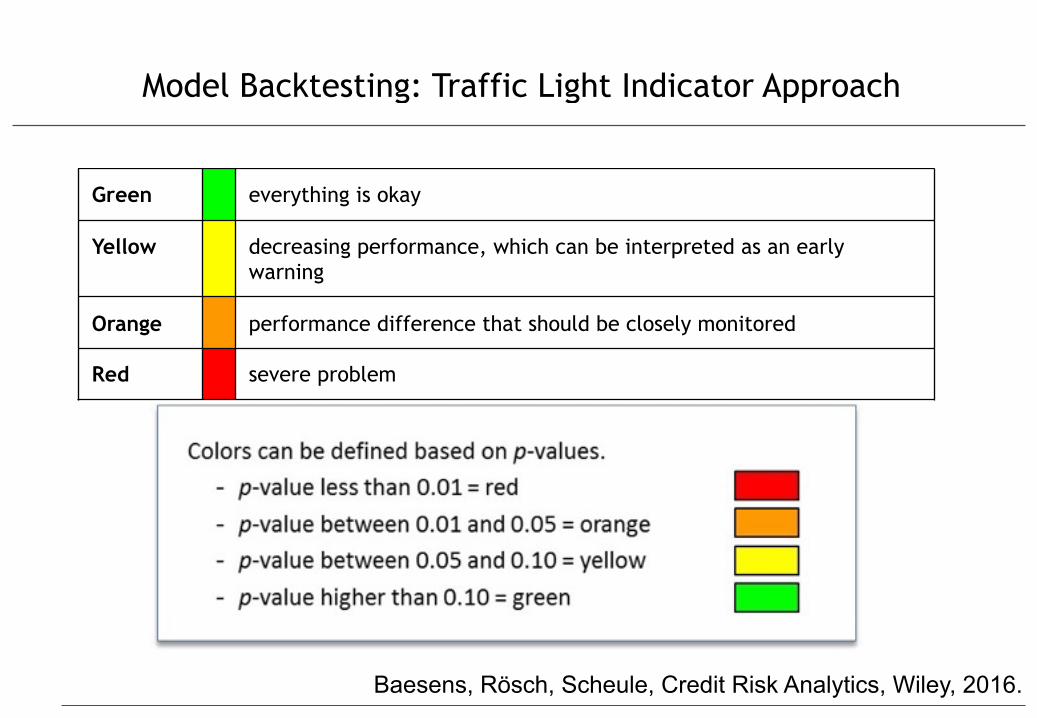
Model Backtesting: Traffic Light Indicator Approach
Green everything is okay
Yellow decreasing performance, which can be interpreted as an early warning
Orange performance difference that should be closely monitored
Red severe problem
Baesens, Rösch, Scheule, Credit Risk Analytics, Wiley, 2016.
Visualing Temporal Patterns
• E.g. Churn Prediction in Telco
Homophily!
Conclusions
• Be aware but critical about emerging technologies (e.g. deep learning)
• Validation of patterns is key! • Profit driven analytics (TCO and ROI) • Visual analytics
• Analytics: Putting it all to Work (1 day) https://support.sas.com/edu/schedules.html?ctry=us&id=1339
• Advanced Analytics in a Big Data World (3 days) https://support.sas.com/edu/schedules.html?ctry=us&id=2169
• Credit Risk Modeling (3 days) https://support.sas.com/edu/schedules.html?ctry=us&id=2455
• Fraud Analytics using Descriptive, Predictive and Social Network Analytics (2 days) https://support.sas.com/edu/schedules.html?ctry=us&id=1912
Courses
More InformationE-learning course: Advanced Analytics in a Big Data World https://support.sas.com/edu/schedules.html?id=2169&ctry=US
The E-learning course starts by refreshing the basic concepts of the analytics process model: data preprocessing, analytics and post processing. We then discuss decision trees and ensemble methods (random forests), neural networks, SVMs, Bayesian networks, survival analysis, social networks, monitoring and backtesting analytical models. Throughout the course, we extensively refer to our industry and research experience. Various business examples (e.g. credit scoring, churn prediction, fraud detection, customer segmentation, etc.) and small case studies are also included for further clarification. The E-learning course consists of more than 20 hours of movies, each 5 minutes on average. Quizzes are included to facilitate the understanding of the material. Upon registration, you will get an access code which gives you unlimited access to all course material (movies, quizzes, scripts, ...) during 1 year. The E-learning course focusses on the concepts and modeling methodologies and not on the SAS software. To access the course material, you only need a laptop, iPad, iPhone with a web browser. No SAS software is needed.
More Information
E-learning course: Fraud Analytics
https://support.sas.com/edu/schedules.html?ctry=us&id=1912
This new E-learning course will show how learning fraud patterns from historical data can be used to fight fraud. To be discussed is the use of descriptive analytics (using an unlabeled data set), predictive analytics (using a labeled data set) and social network learning (using a networked data set). The techniques can be applied across a wide variety of fraud applications, such as insurance fraud, credit card fraud, anti-money laundering, healthcare fraud, telecommunications fraud, click fraud, tax evasion, counterfeit, etc. The course will provide a mix of both theoretical and technical insights, as well as practical implementation details. The instructor will also extensively report on his recent research insights about the topic. Various real-life case studies and examples will be used for further clarification.
More informationE-learning course: Credit Risk Modeling
https://support.sas.com/edu/schedules.html?ctry=us&id=2455
The E-learning course covers both the basic as well some more advanced ways of modeling, validating and stress testing Probability of Default (PD), Loss Given Default (LGD ) and Exposure At Default (EAD) models. Throughout the course, we extensively refer to our industry and research experience. Various business examples and small case studies in both retail and corporate credit are also included for further clarification. The E-learning course consists of more than 20 hours of movies, each 5 minutes on average. Quizzes are included to facilitate the understanding of the material. Upon registration, you will get an access code which gives you unlimited access to all course material (movies, quizzes, scripts, ...) during 1 year. The course focusses on the concepts and modeling methodologies and not on the SAS software. To access the course material, you only need a laptop, iPad, iPhone with a web browser. No SAS software is needed. See https://support.sas.com/edu/schedules.html?ctry=us&id=2455 for more details.