Embed Size (px)
Citation preview
nature biotechnology volume 28 number 10 october 2010 1053
Aleksandar Milosavljevic is at The NIH Epigenomics Roadmap Data Analysis and Coordination Center, Molecular and Human Genetics Department, Baylor College of Medicine, Houston, Texas, USA. e-mail: [email protected]
Putting epigenome comparison into practiceAleksandar Milosavljevic
Comparative analysis of epigenomes offers new opportunities to understand cellular differentiation, mutation effects and disease processes. But the scale and heterogeneity of epigenetic data present numerous computational challenges.
Many layers of epigenomic information are being mapped using methods based
on high-throughput sequencing and micro- arrays, but thus far, integrative analysis of epi- genomic data has been limited by the relatively few types of cells that have been assayed1–4. The most recent achievement in this area is computational inference of chromatin states5 defined by combinations of histone marks. New initiatives6, enabled by high-throughput sequencing–based assays, aim to systematically sample many diverse cell types. In addition, falling costs for DNA sequencing are making it feasible to conduct smaller-scale projects focused on specific diseases. This denser sam-pling of the space of epigenomic variation by large and small projects alike should provide unprecedented opportunities for discovery by comparative analysis of epigenomes.
Unlike DNA sequence, however, epigenomic data are not digital. Furthermore, epigenomes may be measured at several levels of resolu-tion, from the 1-base-pair (bp) resolution of DNA methylation detected by whole-genome bisulfite sequencing to >100-bp-resolution maps of histone marks or of methylation measured via methylated DNA immunopre-cipitation and high-throughput sequencing (MeDIP-seq)7. In addition, epigenomic sig-nals may be spread throughout the genome and may not necessarily be associated with any specific genomic element. Epigenomic information may vary between cell types, between individuals and even between cells
of the same type in a population. It may also be influenced by many molecular processes, including transcriptional regulation, splic-ing, and DNA recombination, replication and repair8. Epigenomic diversity spans several timescales, ranging from short-term physio-logical processes, such as memory formation9 and cell differentiation10, to long-term pro-cesses, such as aging11 and evolutionary varia-tion12. Epigenomic variation is also influenced by genetic, environmental, disease-associated and experimental perturbations.
The wide spectrum of biological processes involving epigenomic variation points to an opportunity for discovery by comparative epigenome analysis. Comparative analysis has been successfully applied to genomic DNA sequences and to perturbations of gene expres-sion patterns13. As the sampling of epigenomic diversity improves, comparative analyses of epigenomes will provide increasing oppor-tunities for discovery by identifying, at ever finer levels of detail, epigenomic changes that correlate with each other and with biologically significant variables. Here I describe two appli-cations of comparative analysis of epigenomes and then consider the relevant computational and cyberinfrastructure challenges.
Comparing epigenomes to map cellular differentiationWaddington’s epigenetic landscape concept14,15 suggests a bifurcating branching pattern of cel-lular differentiation. The now iconic picture of the landscape is a visual representation of cellular differentiation along specific trajecto-ries in the abstract multi-dimensional space of molecular states within a cell. This totality of molecular states includes what we now refer to as the epigenome. Epigenomes from sev-eral related cell types might provide sufficient
information to infer the bifurcating branching patterns of the epigenetic landscape.
Studies of differentiation mediated by the Polycomb-Trithorax system suggest that this will be possible. In embryonic stem cells, Polycomb-Trithorax regulates genes contain-ing CpG islands in their promoters. Such genes reside in a ‘bivalent’ or ‘poised’ state, defined by the presence of both trimethylated lysine 4 on histone H3, an epigenetic mark associated with active genes, and trimethylated lysine 27 on histone H3 (H3K27me3), a mark associated with inactive genes4,16. Genes marked with this chromatin state may be activated or inac-tivated upon differentiation. A recent study17 has identified extensive patterns of H3K27me3 shared by two pancreatic cell types, beta cells and acinar cells, which is consistent with their common developmental history. Specifically this study found that the epigenomes of beta cells contain H3K27me3 marks characteristic of the endodermal lineage of the pancreatic cells, whereas the gene expression signature of beta cells largely resembles those of ectoderm-derived neural tissues. Additional results sug-gest that the neural expression program of beta cells is activated during late pancreatic cell differentiation by a small number of tran-scriptional regulators. This case shows that epigenomes provide information about cell lineages that may not be available at the level of gene expression.
One method to reconstruct the presumably bifurcating patterns of differentiation is the cla-distic method18, which has been used to recover evolutionary branching patterns of speciation. Unlike purely numerical methods that use the totality of measurements of a single type, the cladistic method focuses on select evidence (‘characters’) from a diversity of sources rele-vant for the reconstruction of a tree pattern19.
c o M M e n ta ry©
201
0 N
atu
re A
mer
ica,
Inc.
All
rig
hts
res
erve
d.
1054 volume 28 number 10 october 2010 nature biotechnology
evidence that the effects of copy-number vari-ants on the epigenome may be widespread. The study reports that the effects of copy-number variation on gene expression are not limited to the genes within copy-altered loci, as had commonly been assumed. In fact, most of the affected genes reside far from the structural change, leading the authors to hypothesize that the effects of structural variants may be medi-ated by local changes in chromatin structure. Epigenome comparisons are likely to be useful in testing this hypothesis.
Computational and engineering challenges aheadComparing epigenomes to each other and to other types of data is challenging because the resolution of epigenomic signals is assay depen-dent and may not match the resolution of the other data sets. For example, assays of DNA methylation based on bisulfite sequencing yield data at nucleotide resolution, whereas MeDIP assays offer hundred-base-pair resolution7.
There are a number of different solutions to this problem. One is to average signals over fixed-size ‘windows’ across the genome or over features such as exons, introns or enhancer ele-ments. An alternative is to parse epigenomic signals into discrete peaks. This is suitable for punctate peaks, such as trimethylation of lysine 4 on histone H3, but not for the broad peaks associated with many other signals, such as trimethylation of lysine 36 on histone H3. There will probably be numerous ways in which the genome-wide signals are transformed into numerical data for epigenome comparison, with each transformation being appropriate for specific purposes.
Epigenomes may be compared by search-ing for similarity or by detecting differences. Searches for similarity among epigenomes may borrow from methods developed for whole-genome comparison. In particular, comparing epigenomes may require a combination of global and local ‘alignment’ methods. Unlike genomic sequence, however, which provides a convenient concept of ‘locality’ in the one-dimensional base-pair coordinate system, comparing epi- genomes may require sets of noncontiguous loci to be analyzed together to accommodate our knowledge of the three-dimensional orga-nization of chromosomes in the nucleus or our knowledge of thousands of loci spread through-out the genome that are co-regulated by master regulators of development. Such sets may be cre-ated by grouping genomic regions containing binding sites of specific master regulators, genes related to a particular differentiation pathway or gene elements such as promoters.
Interpreting specific differences between two epigenomes will depend on our understanding
mutation acts in trans, in that mutation at a single locus alters genome-wide patterns of epigenome maintenance. Alternatively, genetic variants may act in cis to alter local patterns of epigenomic marks, as shown, for example, by a recent high-resolution genome-wide compari-son of DNA methylation and single-nucleotide polymorphisms (SNPs) in humans21. This study found that allele-specific skewing of methyla-tion levels occurs at >35,000 sites across the genome, suggesting that sequence variants have pervasive effects on the epigenome. Moreover, genetic mutations are known to affect local epigenetic marks in diseases such as fragile X and facioscapulohumeral muscular dystrophy. The frequency with which sequence variants cause phenotypically significant changes in the epigenome is an open question. A plan has been proposed22 to use patterns of allele-specific epigenomic marks to identify SNPs of functional significance within critical regions detected by genome-wide association studies.
Epigenome comparisons may also help iden-tify functional consequences of structural vari-ants. Cahan et al.23 recently provided indirect
By focusing on the bifurcating tree as the underlying structure, the cladistic method succeeded in integrating evidence from pale-ontological and molecular data18. By analogy, in case of cell differentiation, the method holds promise for integrating data obtained by direct measurements on partially differentiated cell types and from reconstructions based on fully differentiated ones.
Comparing epigenomes to understand genetic variationA comparison of two epigenomes may reveal differences that are due to the variation in the underlying genomic sequence. This may be accomplished by identifying differences between the epigenomes that coincide with changes in genomic sequences in the same locus.
The effects of genetic variation on the epigenome are just beginning to be compre-hended20, with the exception of a few relatively well-understood genomic loci where variants cause human diseases. In some cases, such as in Rett syndrome, where the methyl-CpG–binding protein MeCP2 is mutated, genetic
Project 1 Project 2 Project 3
Comparison
Data processingcluster
Comparisoncluster
Databasecluster
Humanepigenome
atlas
0Data level 1 2 3
Kat
ie V
icar
i
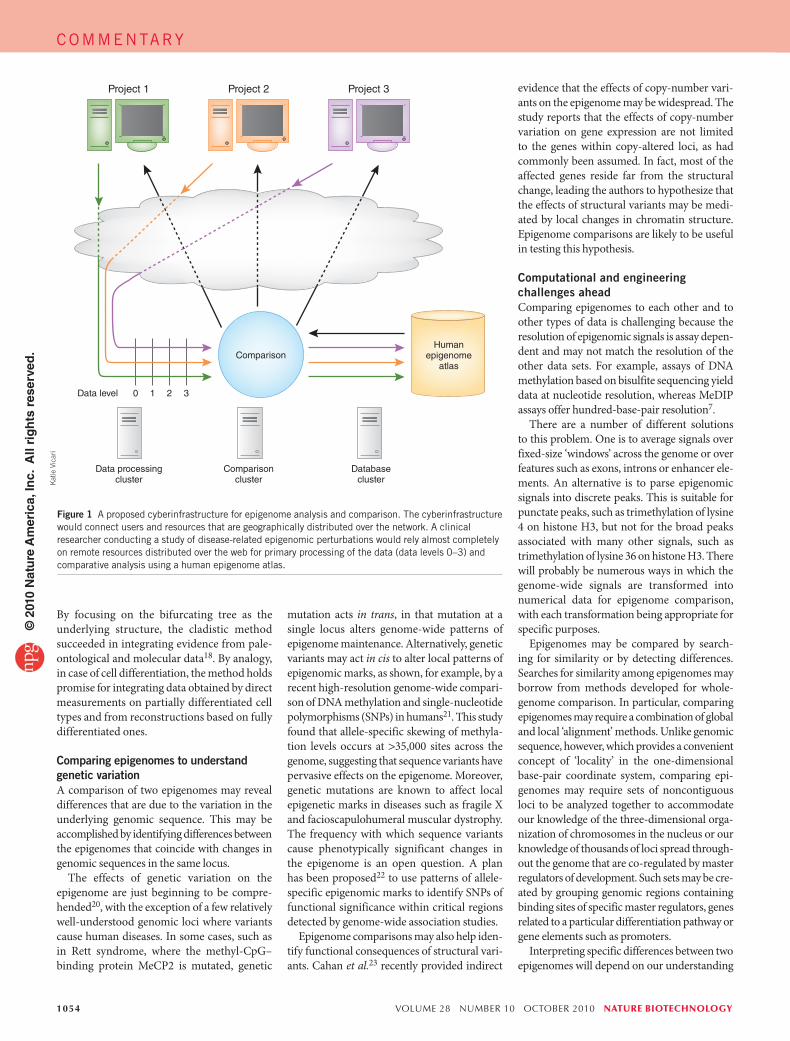
Figure 1 A proposed cyberinfrastructure for epigenome analysis and comparison. The cyberinfrastructure would connect users and resources that are geographically distributed over the network. A clinical researcher conducting a study of disease-related epigenomic perturbations would rely almost completely on remote resources distributed over the web for primary processing of the data (data levels 0–3) and comparative analysis using a human epigenome atlas.
COMMENTARY©
201
0 N
atu
re A
mer
ica,
Inc.
All
rig
hts
res
erve
d.
nature biotechnology volume 28 number 10 october 2010 1055
differences will be open to context-dependent reinterpretation as more data accumulate.
The comparative interpretation of epigenomic signals will also pose several technical and engi-neering challenges that are often grouped under the term ‘cyberinfrastructure’. These challenges include the standards, resources and tools for computer-aided discovery, data sharing and
Gradual accumulation of data will solve this problem but probably not in a definitive way, because variation is not only locus-dependent but may be also highly context dependent. For example, variation during development in one cell lineage may have different meaning than variation in a different lineage or variation due to aging. Consequently, observed epigenomic
of the background variation in the signal. In analogy to DNA sequence comparisons, we need to understand which epigenomic marks are con-served at a specific locus and which are under looser constraint in the same locus. Of course, the immediate problem is that we currently do not have much knowledge about the conserva-tion of epigenomic marks across genomic loci.
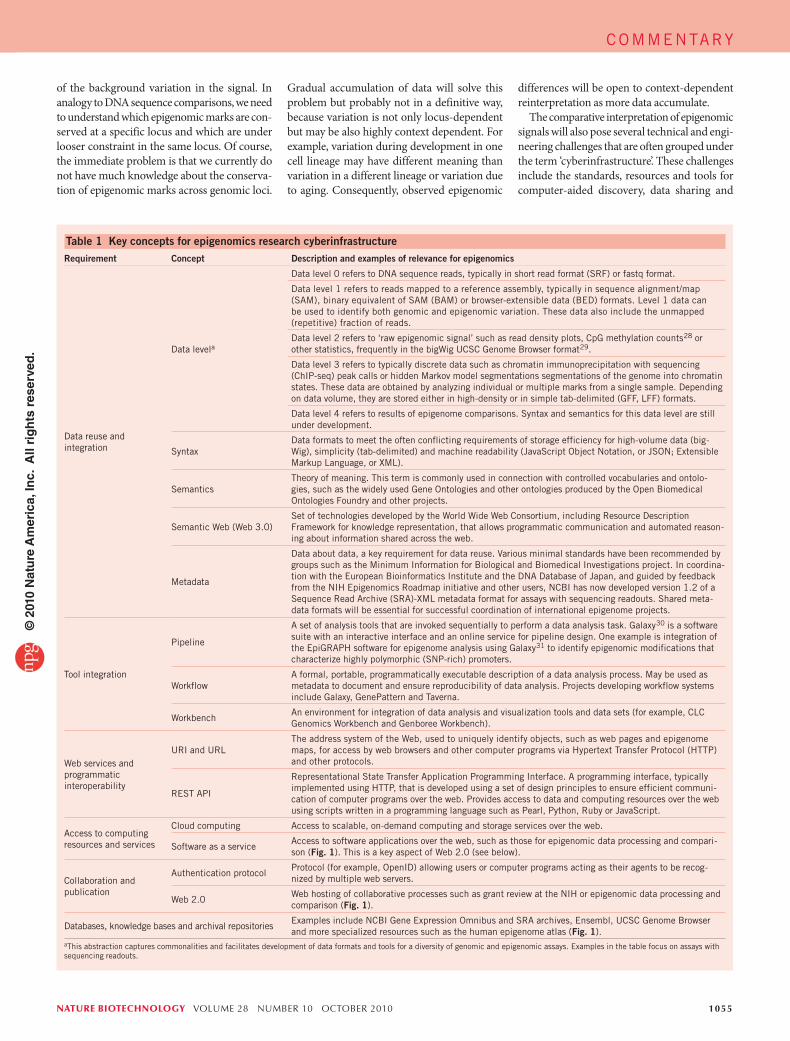
Table 1 Key concepts for epigenomics research cyberinfrastructureRequirement Concept Description and examples of relevance for epigenomics
Data reuse and integration
Data levela
Data level 0 refers to DNA sequence reads, typically in short read format (SRF) or fastq format.
Data level 1 refers to reads mapped to a reference assembly, typically in sequence alignment/map (SAM), binary equivalent of SAM (BAM) or browser-extensible data (BED) formats. Level 1 data can be used to identify both genomic and epigenomic variation. These data also include the unmapped (repetitive) fraction of reads.
Data level 2 refers to ‘raw epigenomic signal’ such as read density plots, CpG methylation counts28 or other statistics, frequently in the bigWig UCSC Genome Browser format29.
Data level 3 refers to typically discrete data such as chromatin immunoprecipitation with sequencing (ChIP-seq) peak calls or hidden Markov model segmentations segmentations of the genome into chromatin states. These data are obtained by analyzing individual or multiple marks from a single sample. Depending on data volume, they are stored either in high-density or in simple tab-delimited (GFF, LFF) formats.
Data level 4 refers to results of epigenome comparisons. Syntax and semantics for this data level are still under development.
SyntaxData formats to meet the often conflicting requirements of storage efficiency for high-volume data (big-Wig), simplicity (tab-delimited) and machine readability (JavaScript Object Notation, or JSON; Extensible Markup Language, or XML).
SemanticsTheory of meaning. This term is commonly used in connection with controlled vocabularies and ontolo-gies, such as the widely used Gene Ontologies and other ontologies produced by the Open Biomedical Ontologies Foundry and other projects.
Semantic Web (Web 3.0)Set of technologies developed by the World Wide Web Consortium, including Resource Description Framework for knowledge representation, that allows programmatic communication and automated reason-ing about information shared across the web.
Metadata
Data about data, a key requirement for data reuse. Various minimal standards have been recommended by groups such as the Minimum Information for Biological and Biomedical Investigations project. In coordina-tion with the European Bioinformatics Institute and the DNA Database of Japan, and guided by feedback from the NIH Epigenomics Roadmap initiative and other users, NCBI has now developed version 1.2 of a Sequence Read Archive (SRA)-XML metadata format for assays with sequencing readouts. Shared meta-data formats will be essential for successful coordination of international epigenome projects.
Tool integration
Pipeline
A set of analysis tools that are invoked sequentially to perform a data analysis task. Galaxy30 is a software suite with an interactive interface and an online service for pipeline design. One example is integration of the EpiGRAPH software for epigenome analysis using Galaxy31 to identify epigenomic modifications that characterize highly polymorphic (SNP-rich) promoters.
WorkflowA formal, portable, programmatically executable description of a data analysis process. May be used as metadata to document and ensure reproducibility of data analysis. Projects developing workflow systems include Galaxy, GenePattern and Taverna.
WorkbenchAn environment for integration of data analysis and visualization tools and data sets (for example, CLC Genomics Workbench and Genboree Workbench).
Web services and programmatic interoperability
URI and URLThe address system of the Web, used to uniquely identify objects, such as web pages and epigenome maps, for access by web browsers and other computer programs via Hypertext Transfer Protocol (HTTP) and other protocols.
REST API
Representational State Transfer Application Programming Interface. A programming interface, typically implemented using HTTP, that is developed using a set of design principles to ensure efficient communi-cation of computer programs over the web. Provides access to data and computing resources over the web using scripts written in a programming language such as Pearl, Python, Ruby or JavaScript.
Access to computing resources and services
Cloud computing Access to scalable, on-demand computing and storage services over the web.
Software as a serviceAccess to software applications over the web, such as those for epigenomic data processing and compari-son (Fig. 1). This is a key aspect of Web 2.0 (see below).
Collaboration and publication
Authentication protocolProtocol (for example, OpenID) allowing users or computer programs acting as their agents to be recog-nized by multiple web servers.
Web 2.0Web hosting of collaborative processes such as grant review at the NIH or epigenomic data processing and comparison (Fig. 1).
Databases, knowledge bases and archival repositoriesExamples include NCBI Gene Expression Omnibus and SRA archives, Ensembl, UCSC Genome Browser and more specialized resources such as the human epigenome atlas (Fig. 1).
aThis abstraction captures commonalities and facilitates development of data formats and tools for a diversity of genomic and epigenomic assays. Examples in the table focus on assays with sequencing readouts.
COMMENTARY©
201
0 N
atu
re A
mer
ica,
Inc.
All
rig
hts
res
erve
d.
1056 volume 28 number 10 october 2010 nature biotechnology
mapping of epigenomic perturbations should reveal consequences of genomic mutations and environmental influences on human develop-ment and disease. To achieve these goals, we must develop conceptual and computational approaches that address the heterogeneity and context dependence of epigenetic data. In addition, discovery would be aided by the building of a cyberinfrastructure that includes shared repositories and knowledge bases able to accommodate the unprecedented volume of data and diversity of applications.
COMPETING FINANCIAL INTERESTSThe author declares competing financial interests: details accompany the full-text HTML version of the paper at http://www.nature.com/naturebiotechnology/
1. Birney, E. et al. Nature 447, 799–816 (2007).2. Barski, A. et al. Cell 129, 823–837 (2007).3. Heintzman, N.D. et al. Nat. Genet. 39, 311–318
(2007).4. Mikkelsen, T.S. et al. Nature 448, 553–560 (2007).5. Ernst, J. & Kellis, M. Nat. Biotechnol. 28, 817–825
(2010).6. Bernstein B.E. et al. Nat. Biotechnol. 28, 1045–1048
(2010).7. Harris, R.A. et al. Nat. Biotechnol. 28, 1097–1105
(2010)8. Kouzarides, T. Cell 128, 693–705 (2007).9. Levenson, J.M. et al. J. Biol. Chem. 281, 15763–
15773 (2006).10. Reik, W. Nature 447, 425–432 (2007).11. Rakyan, V.K. et al. Genome Res. 20, 434–439
(2010).12. Bernstein, B.E. et al. Cell 120, 169–181 (2005).13. Lamb, J. et al. Science 313, 1929–1935 (2006).14. Slack, J.M. Nat. Rev. Genet 3, 889–895 (2002).15. Waddington, C.H. The Strategy of the Genes: A
Discussion of Some Aspects of Theoretical Biology (Allen & Unwin, London, 1957).
16. Bernstein, B.E. et al. Cell 128, 669–681 (2007).17. van Arensbergen, J. et al. Genome Res. 20, 722–732
(2010).18. Ridley, M. Evolution and Classification: the Reformation
of Cladism (Longman, London UK, 1989).19. Hennig, W. Phylogenetic Systematics (University of
Illinois Press, Urbana, Illinois, 1966).20. Meaburn, E.L. et al. Epigenetics 5, 578–582
(2010).21. Schalkwyk, L.C. et al. Am. J. Hum. Genet. 86, 196–
212 (2010).22. Tycko, B. Am. J. Hum. Genet. 86, 109–112 (2010).23. Cahan, P. et al. Nat. Genet. 41, 430–437 (2009).24. Tony Hey, S.T. & Tolle, K. (eds). The Fourth Paradigm:
Data-Intensive Scientific Discovery (Microsoft Research, Seattle, 2009).
25. Wang, X. et al. Nat. Biotechnol. 23, 1099–1103 (2005).
26. Mesirov, J.P. Science 327, 415–416 (2010).27. McKenna, A. et al. Genome Res. 20, 1297–1303
(2010).28. Xi, Y. & Li, W. BMC Bioinformatics 10, 232 (2009).29. Rosenbloom, K.R. et al. Nucleic Acids Res. 38,
D620–D625 (2010).30. Goecks, J. et al. Genome Biol. 11, R86 (2010).31. Bock, C. et al. Methods Mol. Biol. 628, 275–296
(2010).
and computing resources that are geographi-cally distributed over the web, and of ‘cloud computing’ (using shared remote computer hardware) and programming frameworks such as the Genome Analysis Toolkit27, may be helpful.
A human epigenome atlas. How will cyber-infrastructure be used to facilitate epigenome comparison? Figure 1 illustrates a hypotheti-cal scheme that includes several projects and could involve clinical researchers using web-based services to process epigenomic data and perform comparative analyses. This model, known as ‘software as a service’, is appealing because fewer local resources would be required. Such an arrangement would be particularly important for adop-tion of epigenomics in the context of trans-lational and disease-focused studies, where local bioinformatics resources and expertise may be limited. Many projects could use cloud computing and well-tested pipelines with built-in quality-characterization steps that take in sequencing data (data level 0) as it is delivered from sequencers and generate epigenomic signals at the level of individual samples (data levels 1–3). These signals would be compared against a human epigenome atlas, which would serve as a reference data set much like the reference human genome. Other types of visualization and analysis are possible. Upon publication, raw data and the results of analyses would be archived and incorporated into the human epigenome atlas and other specialized repositories.
One open issue is how best to involve the research community in the continued develop-ment and maintenance of repositories such as a human epigenome atlas. To stimulate the con-tribution of smaller projects to these data and knowledge commons, the NIH Epigenomics Roadmap Consortium is collaborating with the NCBI to develop standards for epigenomic metadata and define reference pipelines for uniform processing and characterization of the quality of a variety of epigenomic assays.
ConclusionsIn summary, comparative analysis of epige-nomes is likely to provide many novel insights. Mapping the bifurcating tree of cellular dif-ferentiation should be useful for understand-ing development. Precise and comprehensive
collaboration over the web. The problems of high-volume data capture, visualization, inter-pretation and reuse are currently recognized as key limiting factors across scientific disci-plines24. Table 1 lists infrastructure require-ments and concepts relevant (but not necessarily specific) to epigenome research. A few of these are described in detail below.
Data reuse. One practical cyberinfrastruc-ture challenge for epigenomics research is to enable effective data exchange and reuse. The first step in this direction is to develop a unifying framework for the multiple lay-ers of heterogeneous information generated by sequencing- and array-based assays. Data standards are emerging from the coordina-tion between the Cancer Genome Atlas, the 1000 Genomes Project, the Encyclopedia of DNA Elements and the US National Institutes of Health (NIH) Epigenomics Roadmap (see ‘data levels’ in Table 1). The abstract data levels codify commonalities across the diversity of assays and technologies used to obtain data. As the diversity of derived data and knowledge increases, advanced methods for knowledge representation and exchange, such as the Resource Description Framework derived in the context of the Semantic Web, will need to be applied25.
Metadata standards. Metadata is a key require-ment for reuse of epigenomic data in the pub-lic domain for comparative analyses because it provides the biological and experimental context in which the data were generated. One example is the Sequence Read Archive XML schema developed by the US National Center for Biotechnology Information (NCBI) and adapted by the NIH Epigenomics Roadmap initiative for epigenomic data.
Reproducibility. Another practical challenge is to ensure reproducibility of reported analy-sis results26. This problem may be tackled by encapsulating all aspects of computational analyses in the form of workflow descrip-tions and distributing them as metadata with analysis results.
Data storage and computing power. Epigenome comparisons and higher-level interpretations will require substantial com-putational resources. The use of multiple data
COMMENTARY©
201
0 N
atu
re A
mer
ica,
Inc.
All
rig
hts
res
erve
d.


![Handout for WashU EpiGenome Browser Tutorialepigenomegateway.wustl.edu/support/HandoutforWashUEpi...the and green highlighted text. This tutorial has 12 demos: [1-3] Loading the EpiGenome](https://img.pdfslide.net/doc/110x75/5fbc9bf1edabf95e9b1ec9e0/handout-for-washu-epigenome-browser-tuto-the-and-green-highlighted-text-this.jpg)