Embed Size (px)
Citation preview

July 2017
PwC Trustee Survey
Contents
Introduction 1
Trustee Pay 2
Composition of the board 4
Fiduciary Management 5
83%
Introduction
If you would like to participate in the 2018 and obtain the full Trustee Survey 2018 report, please contact a member of our team. Likewise, if you are interested in benchmarking other commercial aspects of your scheme then we would be happy to hear from you.
Please see the back of this report for contact details.
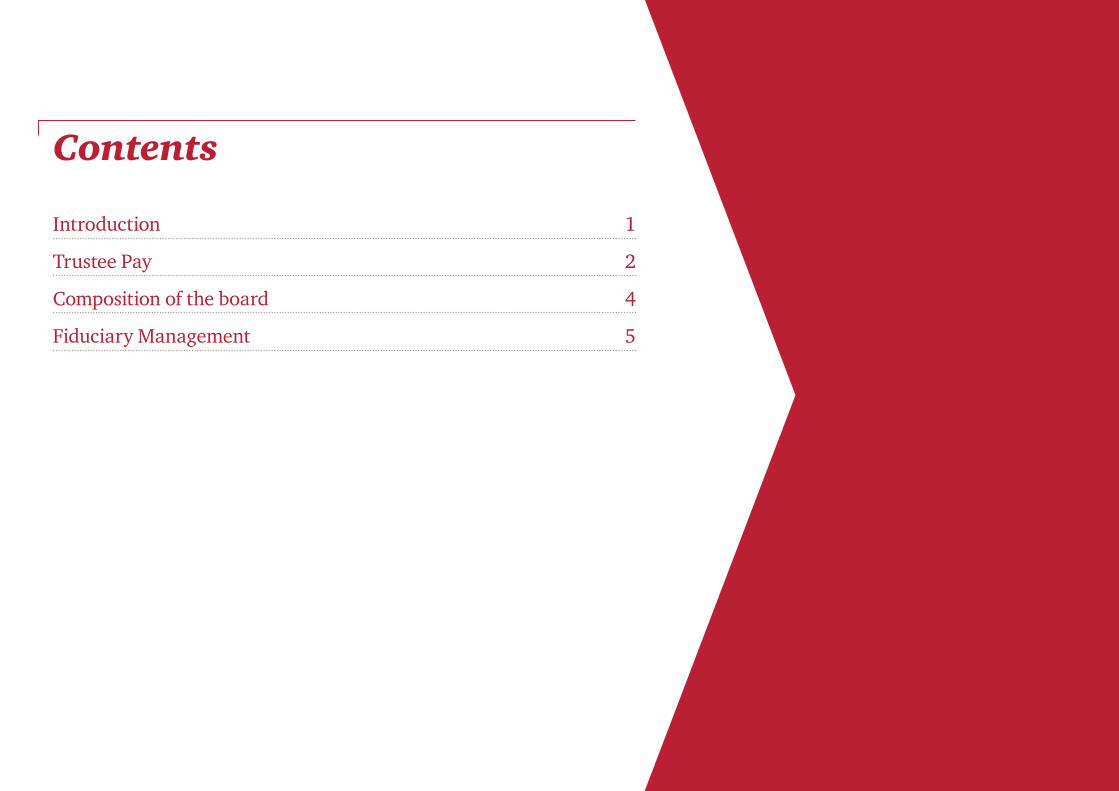
The Survey saw the highest response rate since its inception and the profile of survey participants continues to change as more and more schemes take part.
of the responses are from schemes with assets of £500 million or more.
0% 5% 10% 15% 20% 25% 30% 35% 40%
Over £5bn35%
20%
£1.5bn – £5bn
£0.5bn – £1.5bn
£0 – £0.5bn17%
7%
26%
22%
37%
37%
2016 2014
2012 2010 2007 Size of respondents’ schemes
We are pleased to present a sample of our findings from the fifth biennial PwC Survey of trustee pay.
Our results continue to represent schemes with an asset size of £500 million or more, however we have experienced a 10% rise in the number of comparatively smaller schemes taking part. The largest proportion of participants continue to represent DB schemes closed to new hires and future accrual (38%).
Although we recognise the influence the change in profile of schemes respondents represent may have had on the results, this year we have seen some interesting trends showing that while the time commitment of trustee boards has increased, trustee pay overall has not.
1PwC Trustee Survey
Introduction
2 PwC Trustee Survey
Trustee Pay
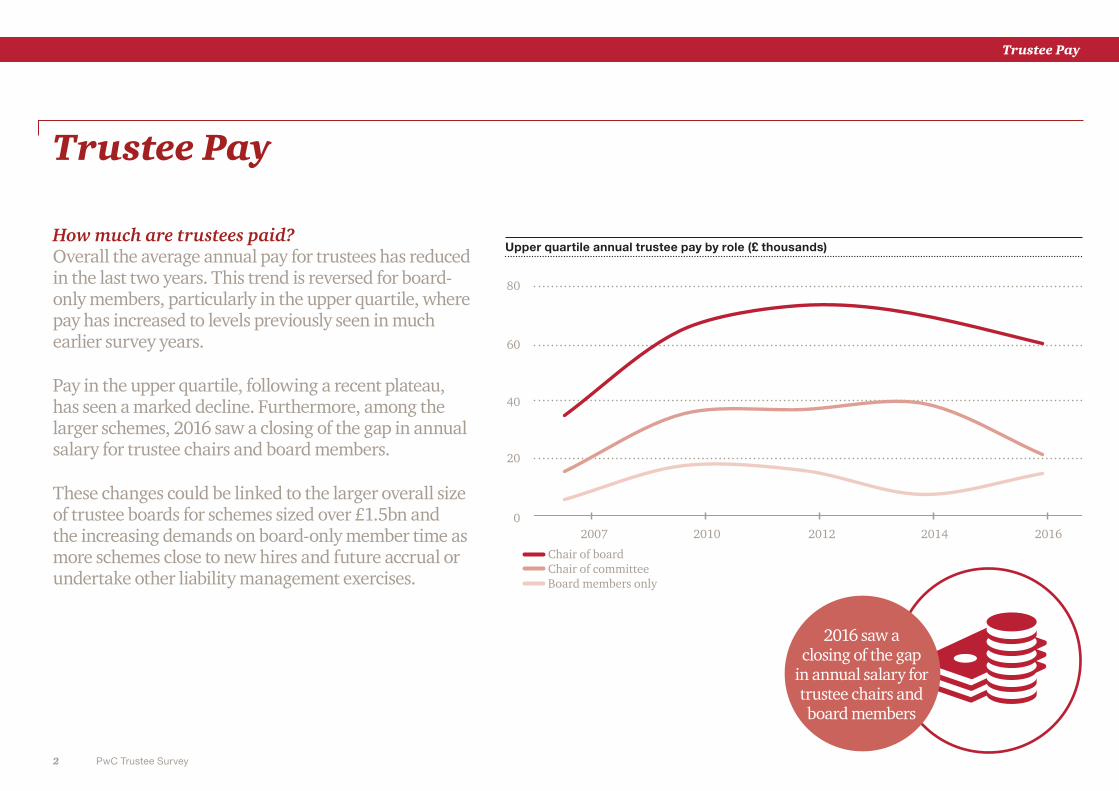
How much are trustees paid?Overall the average annual pay for trustees has reduced in the last two years. This trend is reversed for board-only members, particularly in the upper quartile, where pay has increased to levels previously seen in much earlier survey years.
Pay in the upper quartile, following a recent plateau, has seen a marked decline. Furthermore, among the larger schemes, 2016 saw a closing of the gap in annual salary for trustee chairs and board members.
These changes could be linked to the larger overall size of trustee boards for schemes sized over £1.5bn and the increasing demands on board-only member time as more schemes close to new hires and future accrual or undertake other liability management exercises.
2016 saw a closing of the gap
in annual salary for trustee chairs and board members
Upper quartile annual trustee pay by role (£ thousands)
40
60
20
0
80
2007 2010 2012 2014 2016
Chair of boardChair of committeeBoard members only
Trustee Pay
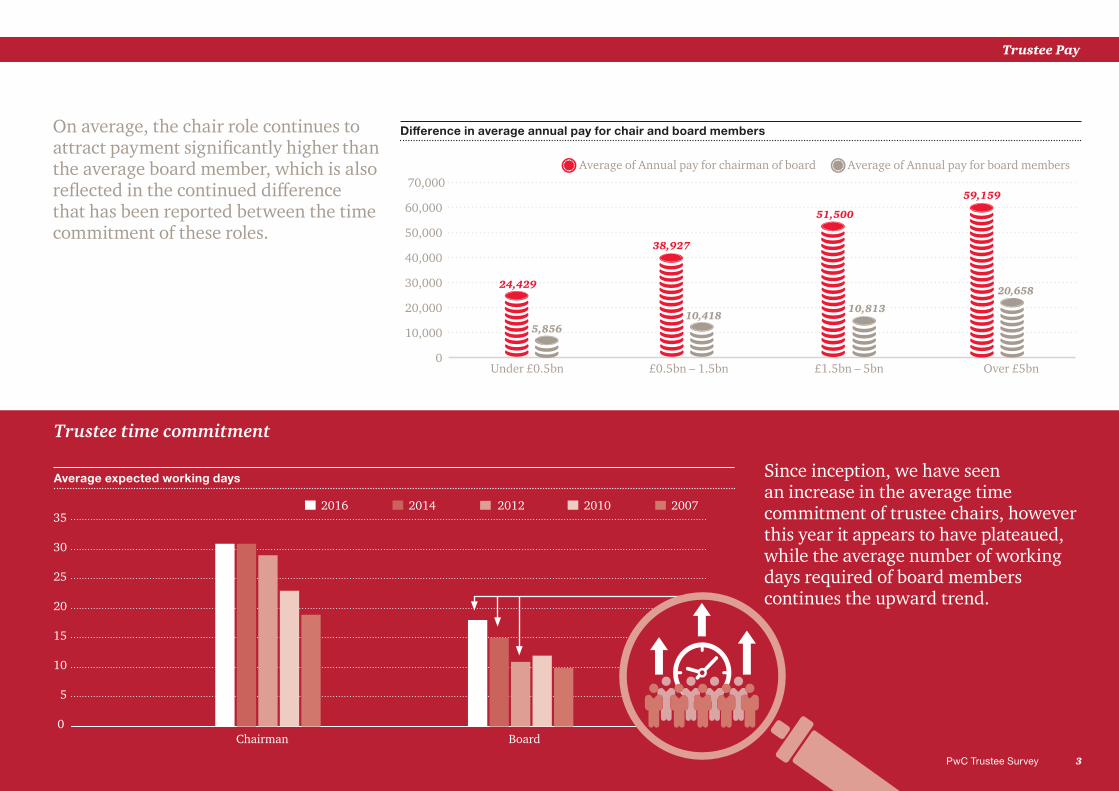
On average, the chair role continues to attract payment significantly higher than the average board member, which is also reflected in the continued difference that has been reported between the time commitment of these roles.
Difference in average annual pay for chair and board members
0
10,000
20,000
30,000
40,000
50,000
60,000
70,000
Under £0.5bn £0.5bn – 1.5bn £1.5bn – 5bn Over £5bn
Average of Annual pay for chairman of board Average of Annual pay for board members
24,429
5,856
38,927
10,418
51,500
10,813
59,159
20,658
Since inception, we have seen an increase in the average time commitment of trustee chairs, however this year it appears to have plateaued, while the average number of working days required of board members continues the upward trend.
5
0
10
15
20
25
30
352016 2014 2012 2010 2007
BoardChairman
Average expected working days
Trustee time commitment
3PwC Trustee Survey
Trustee Pay
Composition of the board
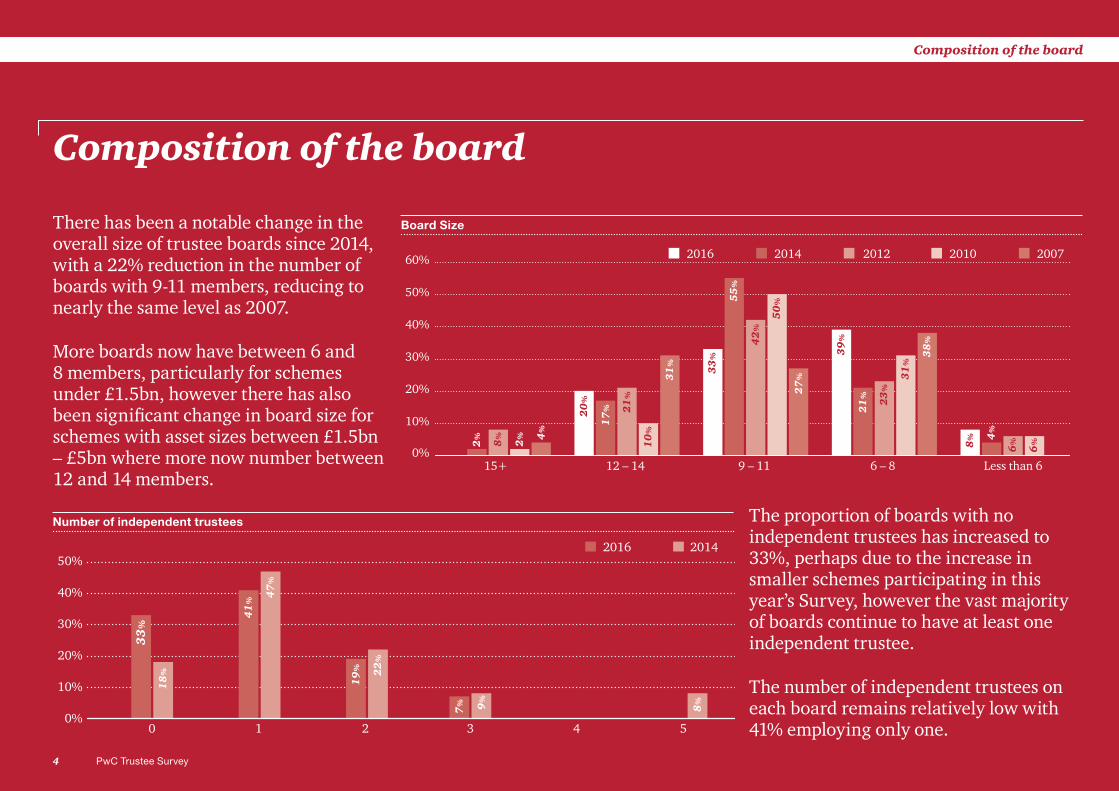
There has been a notable change in the overall size of trustee boards since 2014, with a 22% reduction in the number of boards with 9-11 members, reducing to nearly the same level as 2007.
More boards now have between 6 and 8 members, particularly for schemes under £1.5bn, however there has also been significant change in board size for schemes with asset sizes between £1.5bn – £5bn where more now number between 12 and 14 members.
Board Size
10%
0%
20%
30%
40%
50%
60% 2016 2014 2012 2010 2007
6 – 8 Less than 69 – 1112 – 142
% 2%
15+
8% 4
%
17
% 21
%
10
%
31
%
55
%
42
%
50
%
27
%
39
%
21
% 23
%
31
%
38
%
8% 4
%
6%
6%
33
%
20
%
The proportion of boards with no independent trustees has increased to 33%, perhaps due to the increase in smaller schemes participating in this year’s Survey, however the vast majority of boards continue to have at least one independent trustee.
The number of independent trustees on each board remains relatively low with 41% employing only one.
Number of independent trustees
0%
10%
20%
30%
40%
50% 2016 2014
3 4 521
33
%
18
%
41
%
47
%
19
% 22
%
7% 9
%
8%
0
Under £0.5bn
£1.5-5bn
£0.5-1.5bn
Over £5bn
No Yes for a proportion of the scheme’s assets Yes for all the scheme’s assets
4 PwC Trustee Survey
Composition of the board Fiduciary Management
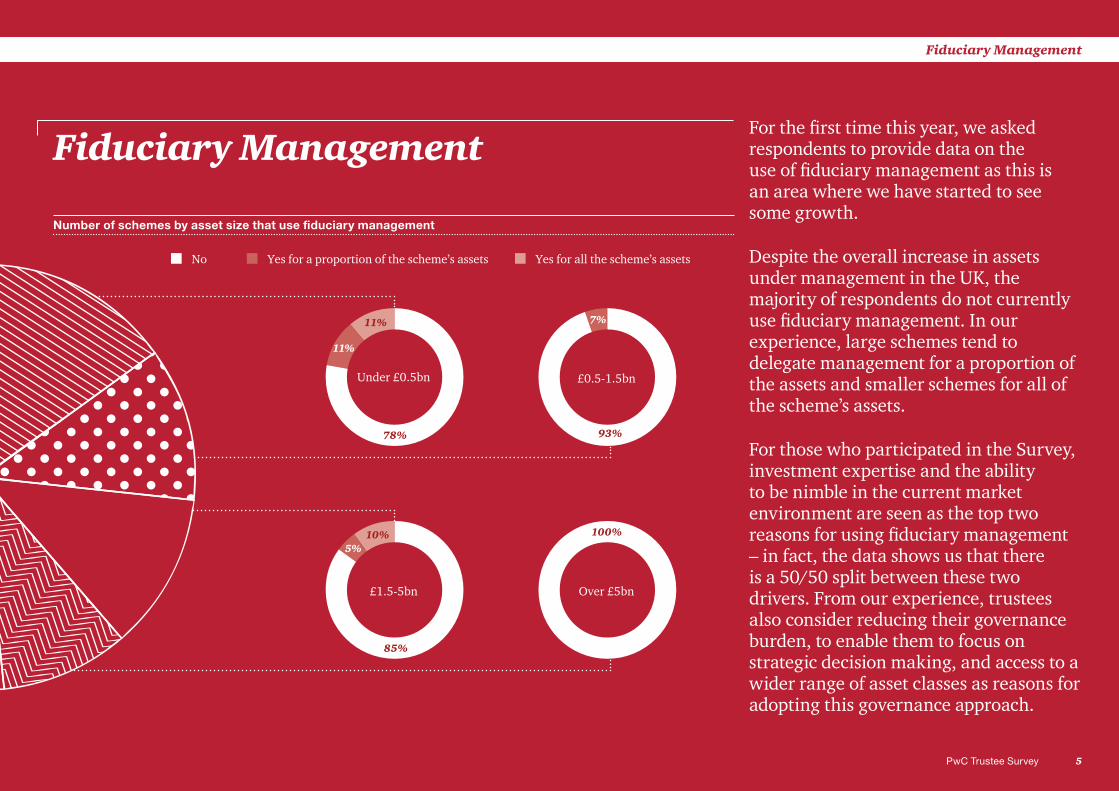
Fiduciary ManagementFor the first time this year, we asked respondents to provide data on the use of fiduciary management as this is an area where we have started to see some growth.
Despite the overall increase in assets under management in the UK, the majority of respondents do not currently use fiduciary management. In our experience, large schemes tend to delegate management for a proportion of the assets and smaller schemes for all of the scheme’s assets.
For those who participated in the Survey, investment expertise and the ability to be nimble in the current market environment are seen as the top two reasons for using fiduciary management – in fact, the data shows us that there is a 50/50 split between these two drivers. From our experience, trustees also consider reducing their governance burden, to enable them to focus on strategic decision making, and access to a wider range of asset classes as reasons for adopting this governance approach.
Number of schemes by asset size that use fiduciary management
Under £0.5bn
£1.5-5bn
£0.5-1.5bn
Over £5bn
No Yes for a proportion of the scheme’s assets Yes for all the scheme’s assets
78%
11%
11%
93%
7%
85%
5%10% 100%
5PwC Trustee Survey
Fiduciary Management
6 PwC Trustee Survey
This report was produced by PwC’s Pensions Management Consulting team (PMC), led by Peter Sparshott. Our PMC team are dedicated to working with trustees to demonstrably improve their ability to deliver an effective and compliant pension service.
Below are PMC’s core service offerings.
Pensions Management ConsultingPensions Management Consulting
Tender Management & SupportWe provide varying levels of support throughout the process of procurement of third party service providers, from initial engagement with the market through to contract negotiations and implementation.
BenchmarkingWe maintain an extensive database of data against which we can compare leading suppliers services and costs.
Quality AssuranceWe provide independent assessments of the changes our clients or their service providers implement and provide recommendations of remedial actions where required.
Programme ManagementWe provide hands on support and project management of the implementation of any change project.
Operational DesignDesign and support in the transition to service delivery models based on best practice that optimise effectiveness and efficiency.
GovernanceWe work with trustees to support the effective management of scheme operations, advisers and trustee governance structures.
Pensions Management Consulting
Simon BourkeT: 0207 212 3657E: [email protected]
Phil AnthonyT: 0207 213 4228E: [email protected]
Peter SparshottT: 0207 212 4165E: [email protected]
Anna SmithT: 0207 804 4969E: [email protected]
For further information on this Survey please contact:
7PwC Trustee Survey
Pensions Management Consulting

8 Trustee Survey 2016 – Lite
This publication has been prepared for general guidance on matters of interest only, and does not constitute professional advice. You should not act upon the information contained in this publication without obtaining specific professional advice. No representation or warranty (express or implied) is given as to the accuracy or completeness of the information contained in this publication, and, to the extent permitted by law, PricewaterhouseCoopers LLP, its members, employees and agents do not accept or assume any liability, responsibility or duty of care for any consequences of you or anyone else acting, or refraining to act, in reliance on the information contained in this publication or for any decision based on it.
© 2017 PricewaterhouseCoopers LLP. All rights reserved. In this document, “PwC” refers to the UK member firm, and may sometimes refer to the PwC network. Each member firm is a separate legal entity. Please see www.pwc.com/structure for further details.
170713-133800-GC-OS
www.pwc.co.uk


![TRADING TRUST ANS D STRAW TRUSTEES (Principles & … · 2015-03-18 · TRADING TRUSTS AN D STRAW TRUSTEES 19 only by the trust asset e.gs . 'a s trustee onty2] o 'ars trustee but](https://img.pdfslide.net/doc/110x75/5f459a1959bac45b924f1983/trading-trust-ans-d-straw-trustees-principles-2015-03-18-trading-trusts.jpg)