Embed Size (px)
Citation preview
PwC’s analytics solutions for the FMCG sector
www.pwc.in
Strictly private and confidential
2 PwC
OverviewIndian consumers are changing at a faster pace than expected. Today, FMCG manufacturers rely on consumers ‘pulling’ products through the supply chain; thus, they require a better understanding of consumer behaviour and choices. Consumers are well-informed about product information—in particular, promotions and price comparisons via the Internet—which makes predicting behaviour very complex. This is where business analytics plays a very important role, as it allows organisations to derive predictive insights to enable competitive fact-based decisions. Armed with deeper insights into consumer behaviour, FMCG manufacturers will be able to direct R&D investment, improve the effectiveness of marketing and maximise supply chain efficiencies.
Let’s look at a few scenarios where analytics plays a crucial role in solving the challenges encountered by FMCG companies.
PwC’s analytics solutions for the FMCG sector 3
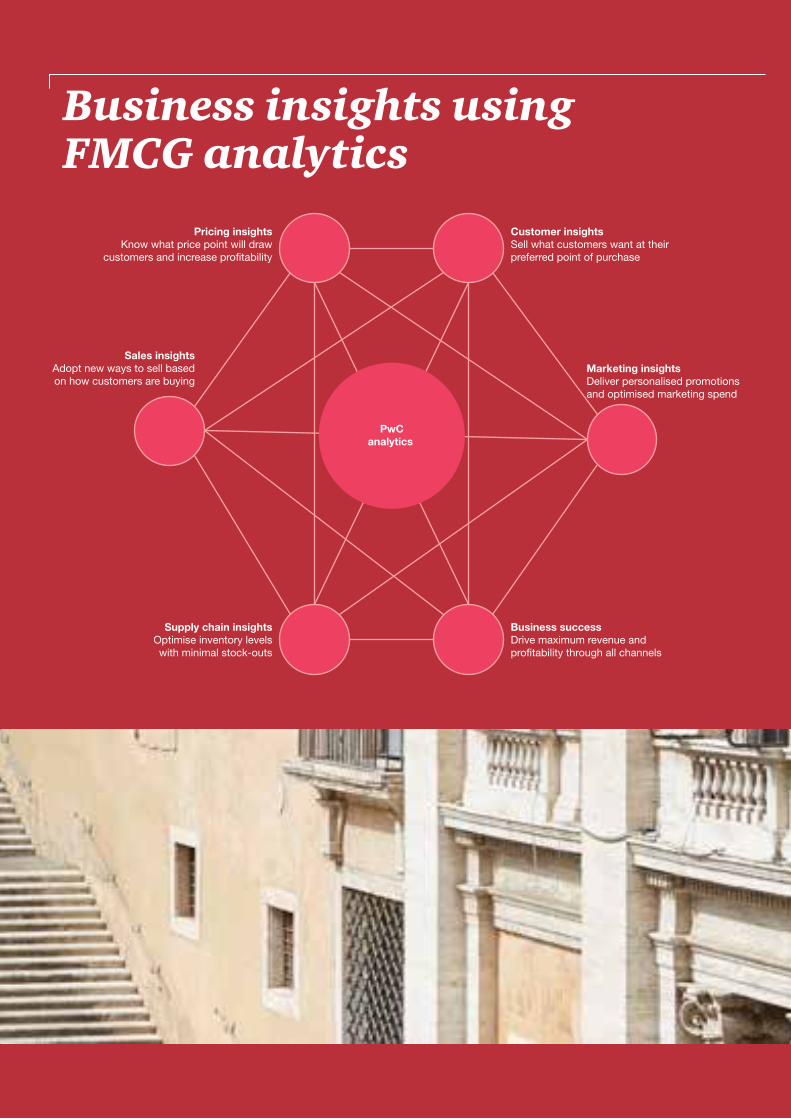
Business insights using FMCG analytics
PwCanalytics
Pricing insights Know what price point will draw
customers and increase profitability
Customer insights Sell what customers want at theirpreferred point of purchase
Sales insights Adopt new ways to sell based on how customers are buying
Supply chain insightsOptimise inventory levelswith minimal stock-outs
Business success Drive maximum revenue andprofitability through all channels
Marketing insights Deliver personalised promotionsand optimised marketing spend
4 PwC
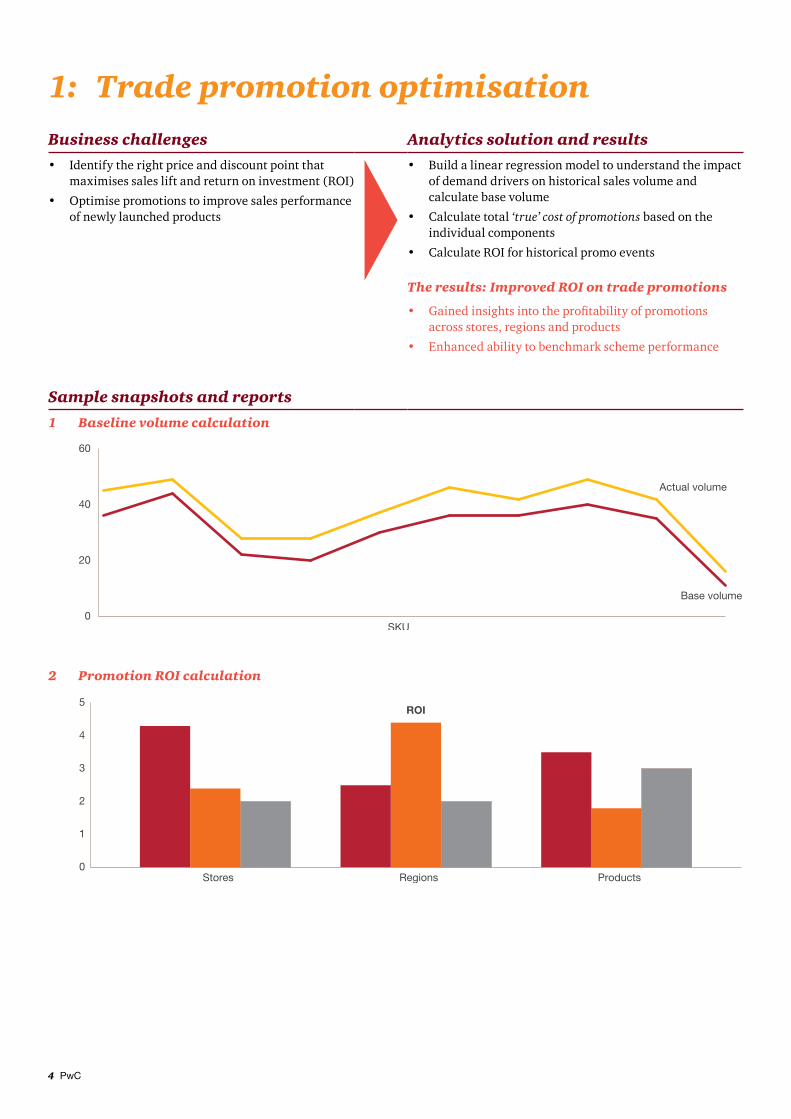
1: Trade promotion optimisationBusiness challenges Analytics solution and results
• Identify the right price and discount point that maximises sales lift and return on investment (ROI)
• Optimise promotions to improve sales performance of newly launched products
• Build a linear regression model to understand the impact of demand drivers on historical sales volume and calculate base volume
• Calculate total ‘true’ cost of promotions based on the individual components
• Calculate ROI for historical promo events
The results: Improved ROI on trade promotions
• Gained insights into the profitability of promotions across stores, regions and products
• Enhanced ability to benchmark scheme performance
Sample snapshots and reports
1 Baseline volume calculation
0
20
40
60
Base volume
Actual volume
SKU
2 Promotion ROI calculation
0
1
2
3
4
5
ProductsRegions
ROI
Stores
PwC’s analytics solutions for the FMCG sector 5
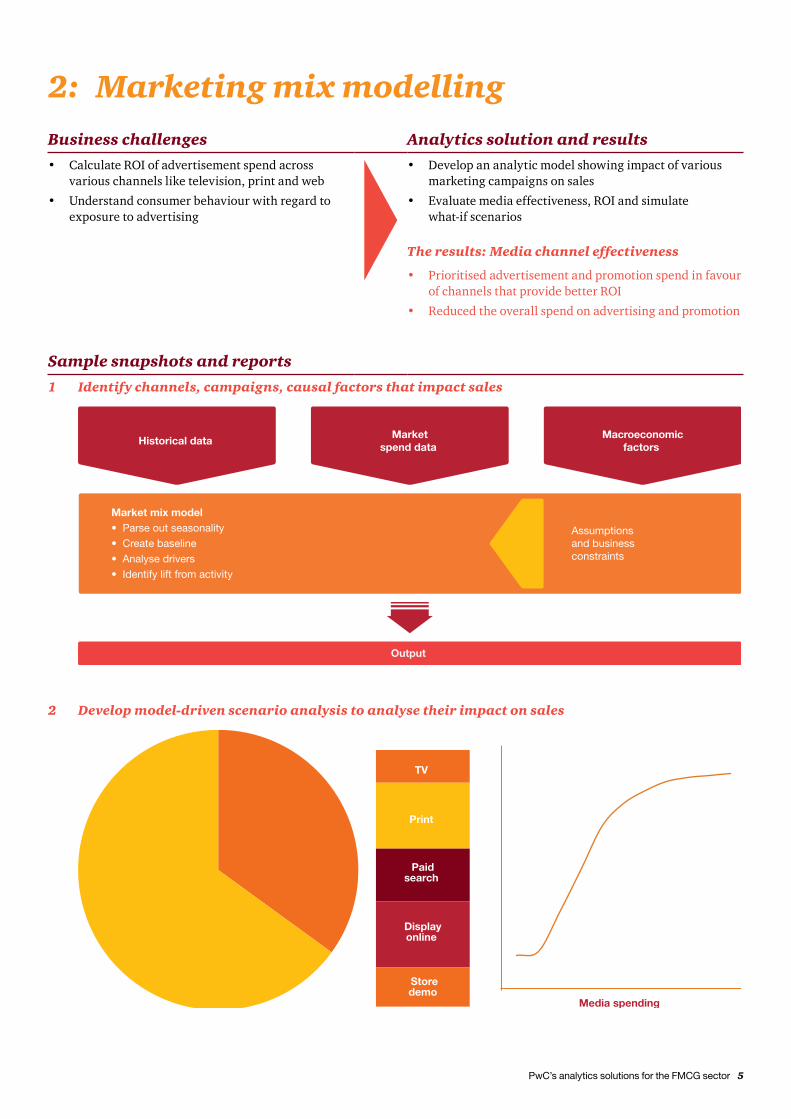
2: Marketing mix modellingBusiness challenges Analytics solution and results
• Calculate ROI of advertisement spend across various channels like television, print and web
• Understand consumer behaviour with regard to exposure to advertising
• Develop an analytic model showing impact of various marketing campaigns on sales
• Evaluate media effectiveness, ROI and simulate what‑if scenarios
The results: Media channel effectiveness
• Prioritised advertisement and promotion spend in favour of channels that provide better ROI
• Reduced the overall spend on advertising and promotion
Sample snapshots and reports
1 Identify channels, campaigns, causal factors that impact sales
Marketspend data
Macroeconomicfactors
Historical data
Market mix model• Parse out seasonality • Create baseline• Analyse drivers • Identify lift from activity
Assumptionsand businessconstraints
Output
2 Develop model-driven scenario analysis to analyse their impact on sales
Media spending
TV
Paidsearch
Displayonline
Storedemo
6 PwC
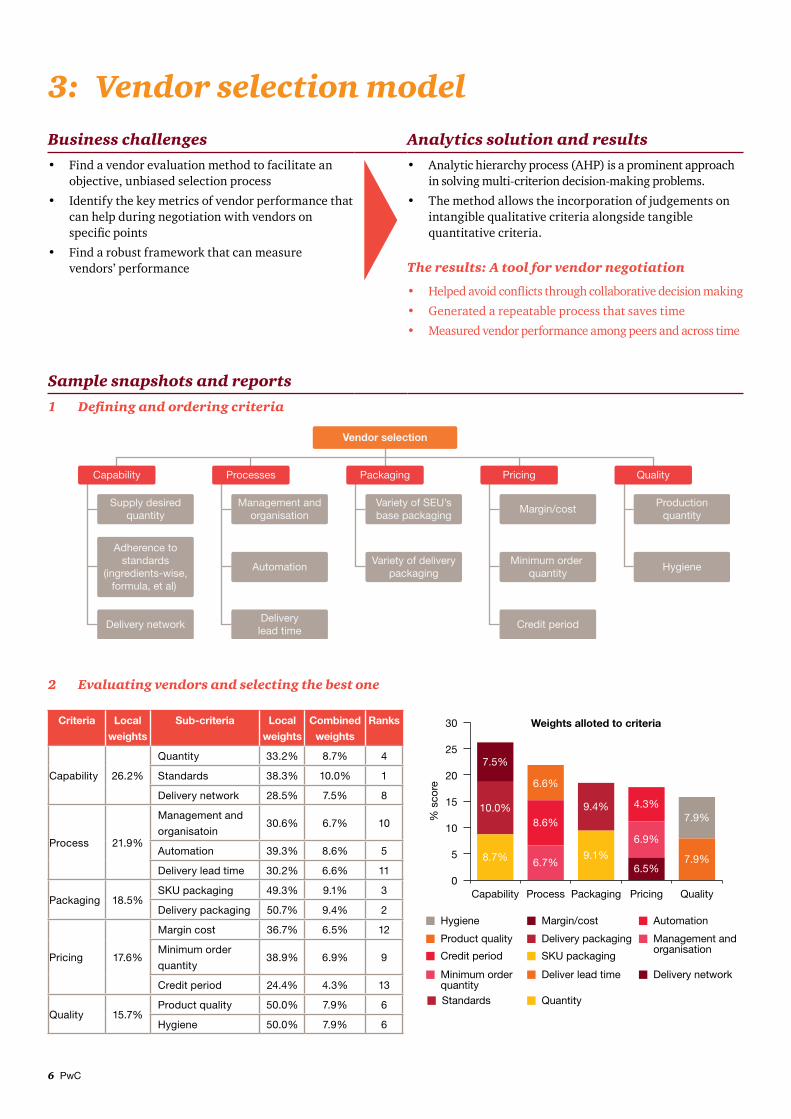
3: Vendor selection modelBusiness challenges Analytics solution and results
• Find a vendor evaluation method to facilitate an objective, unbiased selection process
• Identify the key metrics of vendor performance that can help during negotiation with vendors on specific points
• Find a robust framework that can measure vendors’ performance
• Analytic hierarchy process (AHP) is a prominent approach in solving multi-criterion decision-making problems.
• The method allows the incorporation of judgements on intangible qualitative criteria alongside tangible quantitative criteria.
The results: A tool for vendor negotiation
• Helped avoid conflicts through collaborative decision making
• Generated a repeatable process that saves time
• Measured vendor performance among peers and across time
Sample snapshots and reports
1 Definingandorderingcriteria
Supply desiredquantity
Delivery network
Adherence tostandards
(ingredients-wise,formula, et al)
Management andorganisation
AutomationVariety of delivery
packagingMinimum order
quantityHygiene
Deliverylead time
Credit period
Variety of SEU’sbase packaging
Margin/costProduction
quantity
Capability Processes Packaging Pricing Quality
Vendor selection
2 Evaluating vendors and selecting the best one
Criteria Local
weights
Sub-criteria Local
weights
Combined
weights
Ranks
Capability 26.2%
Quantity 33.2% 8.7% 4
Standards 38.3% 10.0% 1
Delivery network 28.5% 7.5% 8
Process 21.9%
Management and
organisatoin30.6% 6.7% 10
Automation 39.3% 8.6% 5
Delivery lead time 30.2% 6.6% 11
Packaging 18.5%SKU packaging 49.3% 9.1% 3
Delivery packaging 50.7% 9.4% 2
Pricing 17.6%
Margin cost 36.7% 6.5% 12
Minimum order
quantity38.9% 6.9% 9
Credit period 24.4% 4.3% 13
Quality 15.7%Product quality 50.0% 7.9% 6
Hygiene 50.0% 7.9% 6
0
5
10
15
20
25
30
Capability Process Packaging Pricing
Weights alloted to criteria
% s
core
Quality
Hygiene
Product quality
Credit period
Minimum order quantity
Margin/cost
Delivery packaging
SKU packaging
Deliver lead time
Quantity
Automation
Management andorganisation
Delivery network
Standards
7.5%
10.0%
8.7% 6.7%
8.6%
6.6%
9.4% 4.3%
6.9%
6.5%
7.9%
7.9%9.1%
PwC’s analytics solutions for the FMCG sector 7
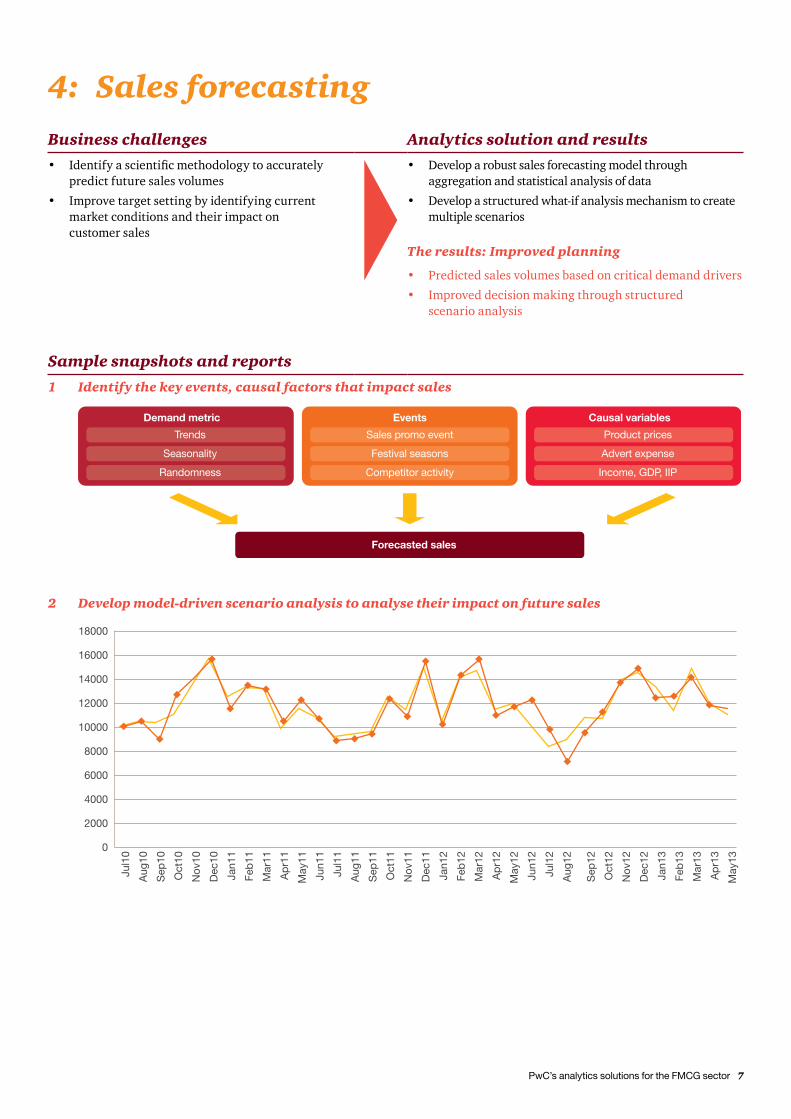
4: Sales forecastingBusiness challenges Analytics solution and results
• Identify a scientific methodology to accurately predict future sales volumes
• Improve target setting by identifying current market conditions and their impact on customer sales
• Develop a robust sales forecasting model through aggregation and statistical analysis of data
• Develop a structured what-if analysis mechanism to create multiple scenarios
The results: Improved planning
• Predicted sales volumes based on critical demand drivers
• Improved decision making through structured scenario analysis
Sample snapshots and reports
1 Identify the key events, causal factors that impact sales
Demand metric
Trends
Seasonality
Randomness
Events
Sales promo event
Festival seasons
Competitor activity
Causal variables
Product prices
Advert expense
Income, GDP, IIP
Forecasted sales
2 Develop model-driven scenario analysis to analyse their impact on future sales
18000
16000
14000
12000
10000
8000
6000
4000
2000
0
Jul1
0
Aug
10
Sep
10
Oct
10
Nov
10
Dec
10
Jan1
1
Feb
11
Mar
11
Ap
r11
May
11
Jun1
1
Jul1
1
Aug
11
Sep
11
Oct
11
Nov
11
Dec
11
Jan1
2
Feb
12
Mar
12
Ap
r12
May
12
Jan1
3
Feb
13
Mar
13
Ap
r13
May
13
Jun1
2
Jul1
2
Aug
12
Sep
12
Oct
12
Nov
12
Dec
12
8 PwC
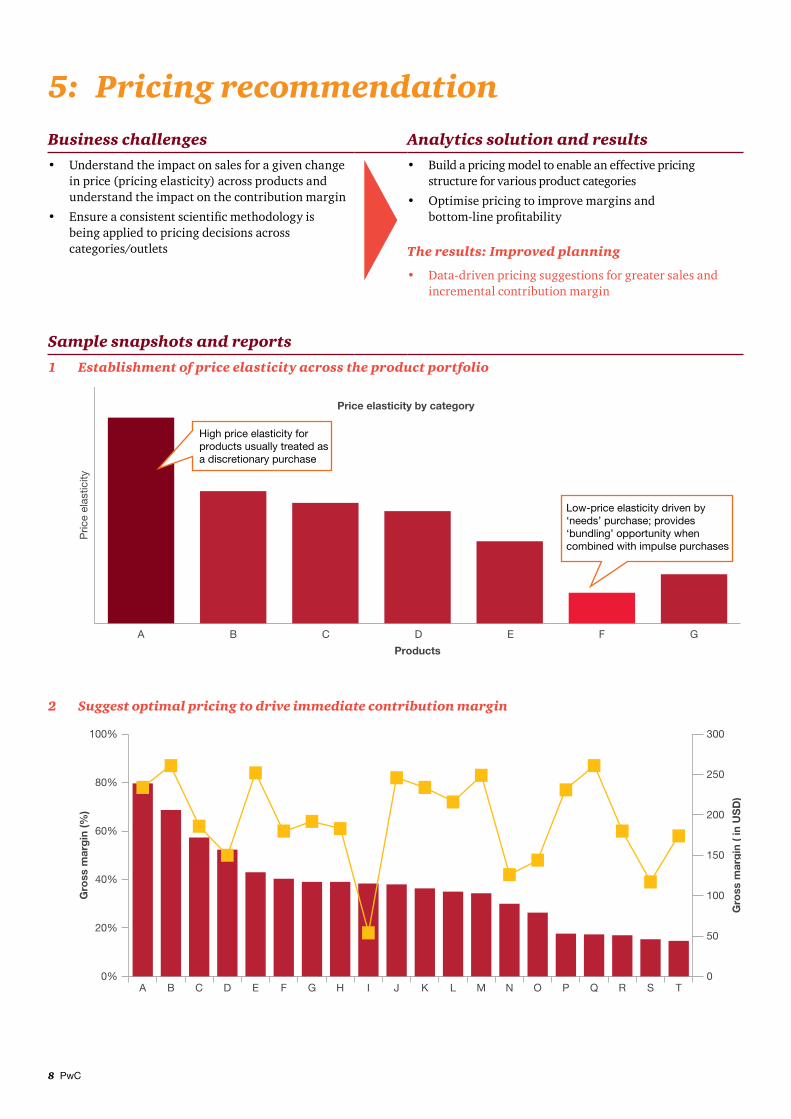
5: Pricing recommendationBusiness challenges Analytics solution and results
• Understand the impact on sales for a given change in price (pricing elasticity) across products and understand the impact on the contribution margin
• Ensure a consistent scientific methodology is being applied to pricing decisions across categories/outlets
• Build a pricing model to enable an effective pricing structure for various product categories
• Optimise pricing to improve margins and bottom‑line profitability
The results: Improved planning
• Data-driven pricing suggestions for greater sales and incremental contribution margin
Sample snapshots and reports
1 Establishment of price elasticity across the product portfolio
Pric
e el
astic
ity
Products
Price elasticity by category
GFEDCBA
High price elasticity for products usually treated as a discretionary purchase
Low-price elasticity driven by ‘needs’ purchase; provides ‘bundling’ opportunity when combined with impulse purchases
2 Suggest optimal pricing to drive immediate contribution margin
Gro
ss m
arg
in (%
)
Gro
ss m
arg
in (
in U
SD
)
SQNLIFC RPMKHEB TOJGDA
100%
80%
0%
20%
40%
60%
300
250
200
0
50
100
150
PwC’s analytics solutions for the FMCG sector 9
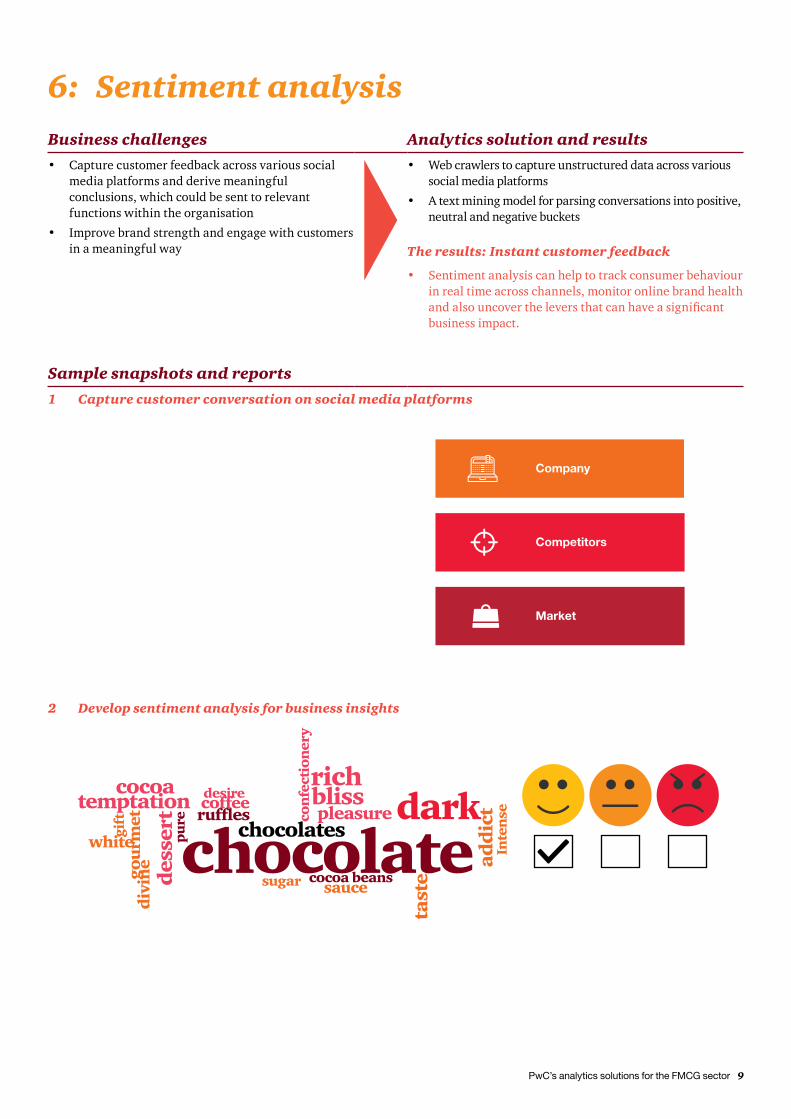
6: Sentiment analysisBusiness challenges Analytics solution and results
• Capture customer feedback across various social media platforms and derive meaningful conclusions, which could be sent to relevant functions within the organisation
• Improve brand strength and engage with customers in a meaningful way
• Web crawlers to capture unstructured data across various social media platforms
• A text mining model for parsing conversations into positive, neutral and negative buckets
The results: Instant customer feedback
• Sentiment analysis can help to track consumer behaviour in real time across channels, monitor online brand health and also uncover the levers that can have a significant business impact.
Sample snapshots and reports
1 Capturecustomerconversationonsocialmedia platforms
Company
Competitors
Market
2 Developsentimentanalysisforbusiness insights
10 PwC
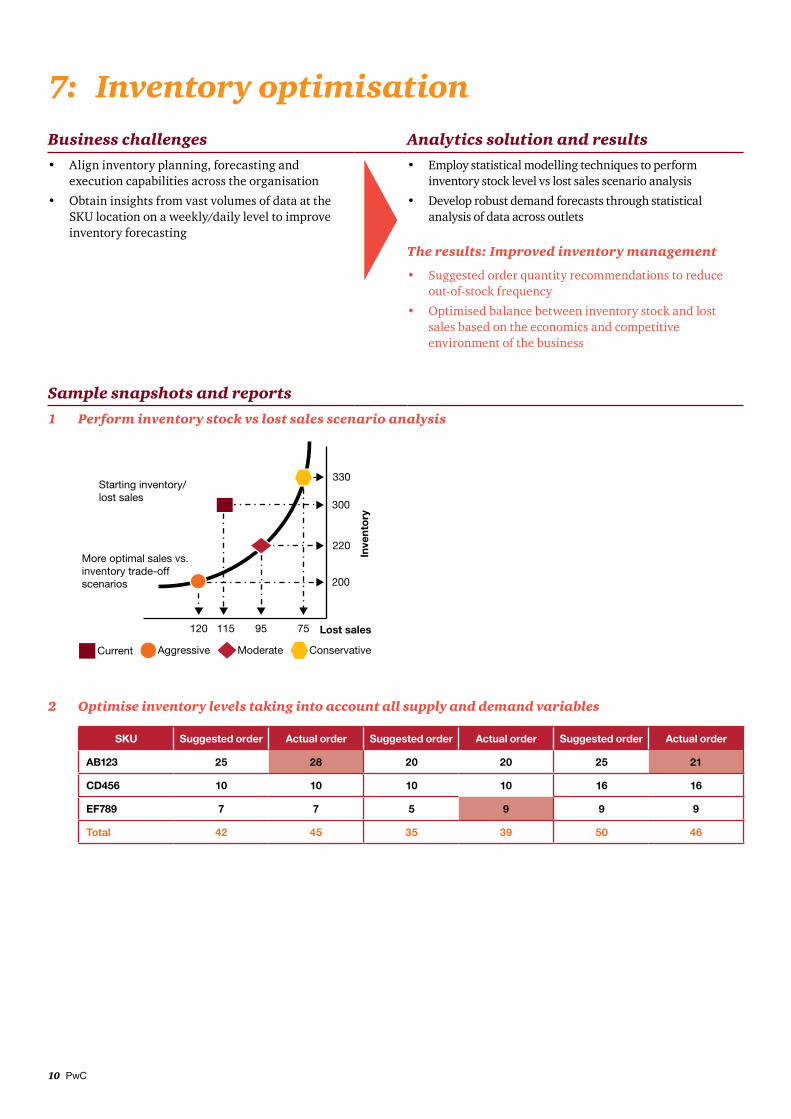
7: Inventory optimisationBusiness challenges Analytics solution and results
• Align inventory planning, forecasting and execution capabilities across the organisation
• Obtain insights from vast volumes of data at the SKU location on a weekly/daily level to improve inventory forecasting
• Employ statistical modelling techniques to perform inventory stock level vs lost sales scenario analysis
• Develop robust demand forecasts through statistical analysis of data across outlets
The results: Improved inventory management
• Suggested order quantity recommendations to reduce out-of-stock frequency
• Optimised balance between inventory stock and lost sales based on the economics and competitive environment of the business
Sample snapshots and reports
1 Performinventorystockvslostsalesscenario analysis
200
330
95 115
Inve
nto
ry
Starting inventory/lost sales
75 120
300
220
Current Moderate Conservative
More optimal sales vs.inventory trade-offscenarios
Lost sales
Aggressive
2 Optimise inventory levels taking into account all supply and demand variables
SKU Suggested order Actual order Suggested order Actual order Suggested order Actual order
AB123 25 28 20 20 25 21
CD456 10 10 10 10 16 16
EF789 7 7 5 9 9 9
Total 42 45 35 39 50 46
PwC’s analytics solutions for the FMCG sector 11
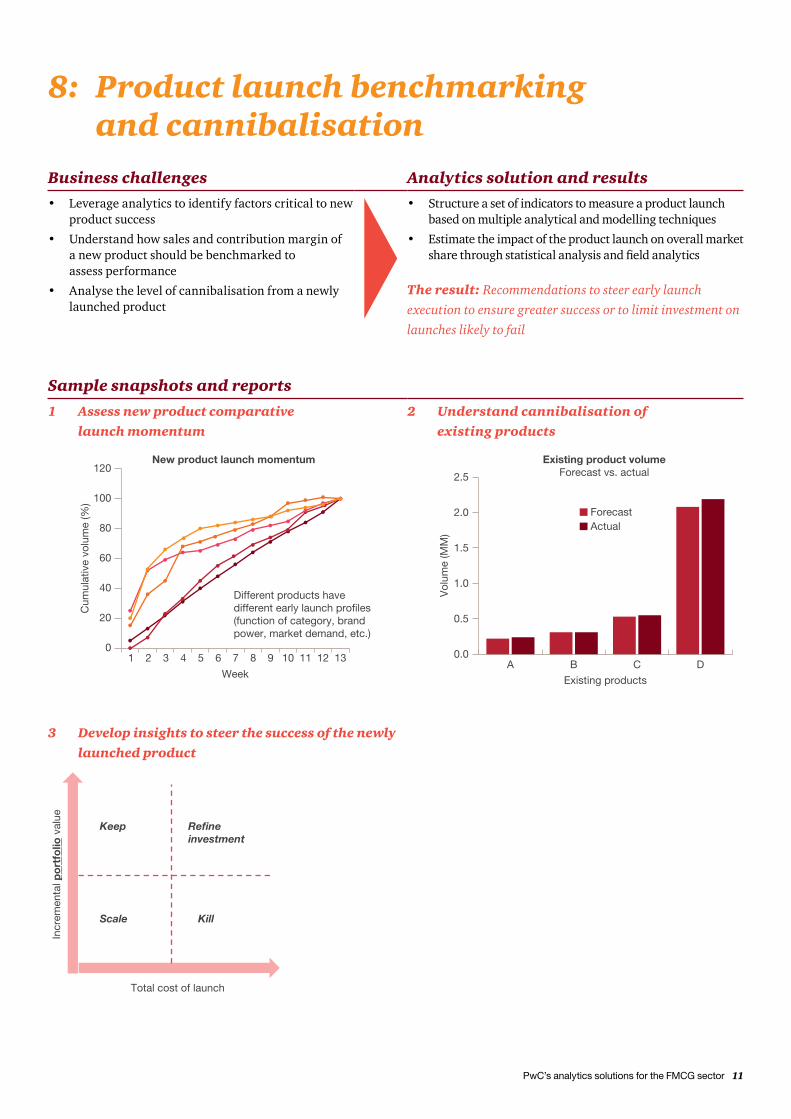
8: Product launch benchmarking and cannibalisation
Business challenges Analytics solution and results
• Leverage analytics to identify factors critical to new product success
• Understand how sales and contribution margin of a new product should be benchmarked to assess performance
• Analyse the level of cannibalisation from a newly launched product
• Structure a set of indicators to measure a product launch based on multiple analytical and modelling techniques
• Estimate the impact of the product launch on overall market share through statistical analysis and field analytics
The result: Recommendations to steer early launch
execution to ensure greater success or to limit investment on
launches likely to fail
Sample snapshots and reports
1 Assess new product comparative launch momentum
2 Understand cannibalisation of existing products
1 2 3 4 5 6 7 8 9 10 11 12 13
New product launch momentum
Week
Cum
ulat
ive
volu
me
(%)
Different products havedifferent early launch profiles(function of category, brandpower, market demand, etc.)
0
20
40
60
80
100
120
0.0
0.5
1.0
1.5
2.0
2.5
A B C D
Existing product volumeForecast vs. actual
Existing products
Vol
ume
(MM
)
ForecastActual
3 Develop insights to steer the success of the newly launched product
Keep
Scale
Refine investment
Kill
Total cost of launch
Incr
emen
tal p
ort
folio
val
ue
12 PwC
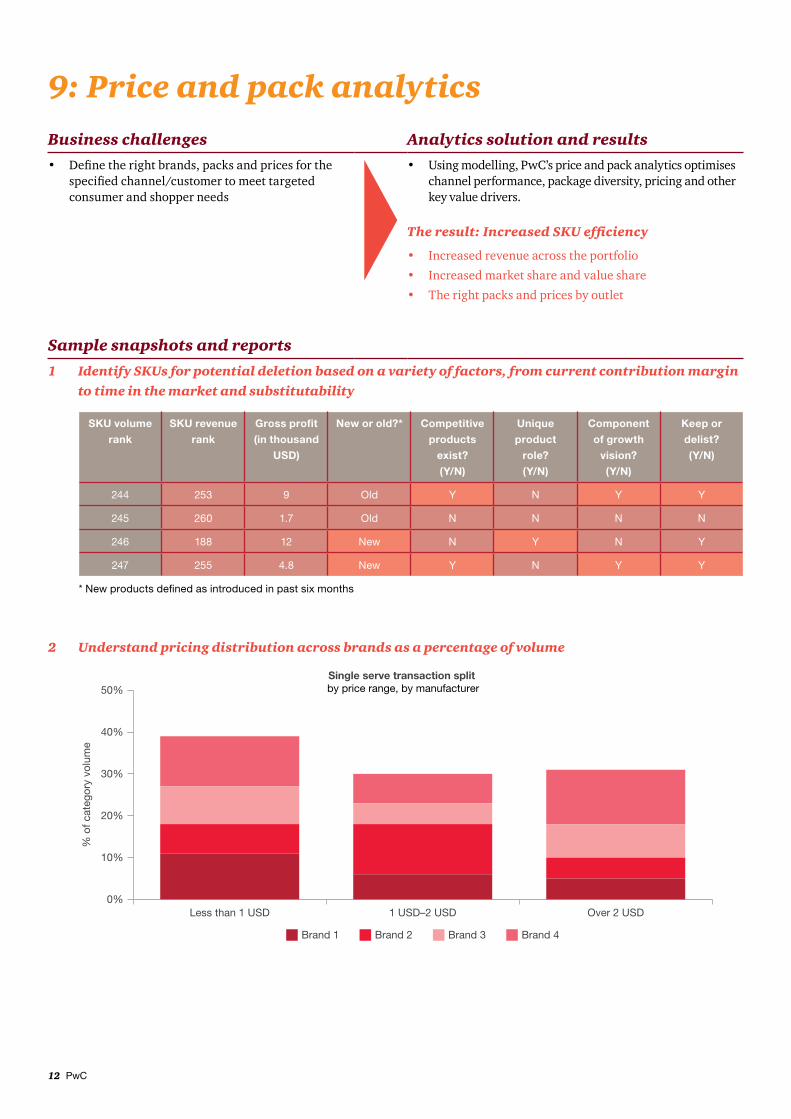
9: Price and pack analyticsBusiness challenges Analytics solution and results
• Define the right brands, packs and prices for the specified channel/customer to meet targeted consumer and shopper needs
• Using modelling, PwC’s price and pack analytics optimises channel performance, package diversity, pricing and other key value drivers.
Theresult:IncreasedSKUefficiency
• Increased revenue across the portfolio
• Increased market share and value share
• The right packs and prices by outlet
Sample snapshots and reports
1 Identify SKUs for potential deletion based on a variety of factors, from current contribution margin to time in the market and substitutability
SKU volume
rank
SKU revenue
rank
Gross profit
(in thousand
USD)
New or old?* Competitive
products
exist?
(Y/N)
Unique
product
role?
(Y/N)
Component
of growth
vision?
(Y/N)
Keep or
delist?
(Y/N)
244 253 9 Old Y N Y Y
245 260 1.7 Old N N N N
246 188 12 New N Y N Y
247 255 4.8 New Y N Y Y
* New products defined as introduced in past six months
2 Understand pricing distribution across brands as a percentage of volume
% o
f cat
egor
y vo
lum
e
Single serve transaction split by price range, by manufacturer
0%
10%
20%
30%
40%
50%
Less than 1 USD 1 USD–2 USD Over 2 USD
Brand 1 Brand 2 Brand 3 Brand 4
PwC’s analytics solutions for the FMCG sector 13
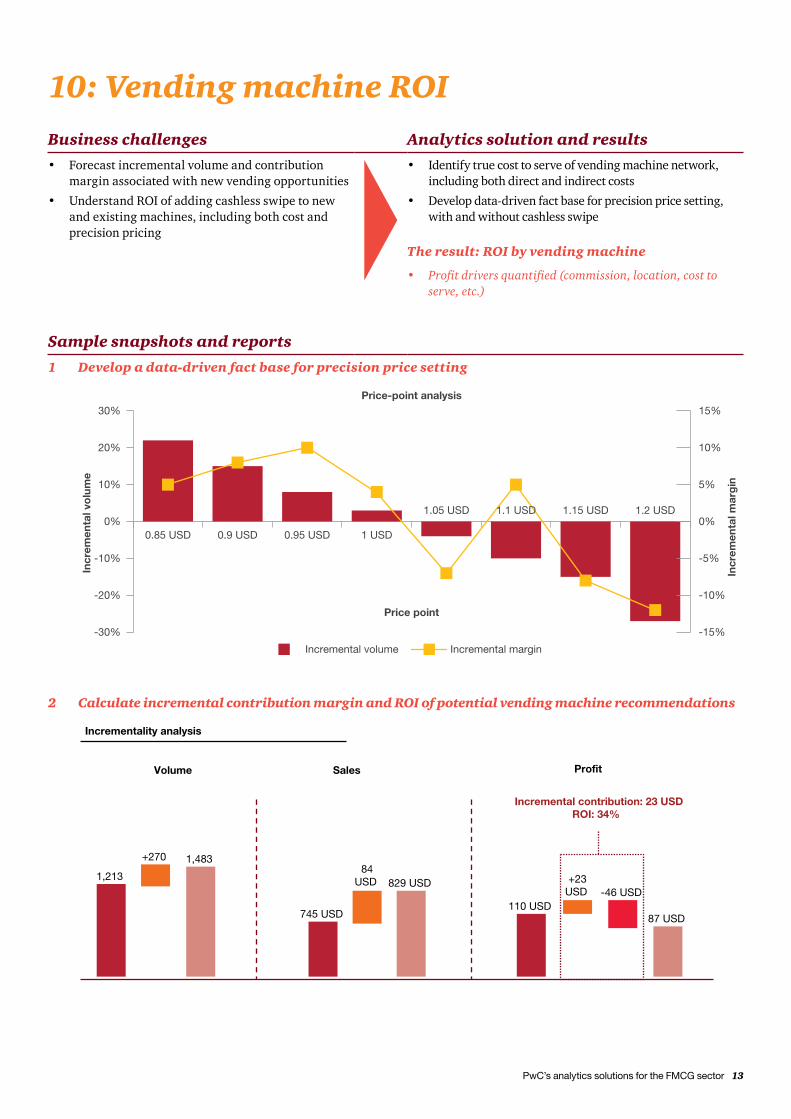
10: Vending machine ROIBusiness challenges Analytics solution and results
• Forecast incremental volume and contribution margin associated with new vending opportunities
• Understand ROI of adding cashless swipe to new and existing machines, including both cost and precision pricing
• Identify true cost to serve of vending machine network, including both direct and indirect costs
• Develop data-driven fact base for precision price setting, with and without cashless swipe
The result: ROI by vending machine
• Profit drivers quantified (commission, location, cost to serve, etc.)
Sample snapshots and reports
1 Develop a data-driven fact base for precision price setting
Incr
emen
tal v
olu
me
Price-point analysis
Price point
Incr
emen
tal m
arg
in
-30%
-20%
-10%
0%
10%
0.85 USD 0.9 USD 0.95 USD 1 USD
1.05 USD
20%
30%
-15%
-10%
-5%
0%
5%
10%
15%
1.1 USD 1.15 USD 1.2 USD
Incremental volume Incremental margin
2 Calculate incremental contribution margin and ROI of potential vending machine recommendations
Volume Sales Profit
Incremental contribution: 23 USDROI: 34%
Incrementality analysis
1,213
+270 1,483
745 USD
84USD 829 USD
110 USD
+23USD -46 USD
87 USD
14 PwC
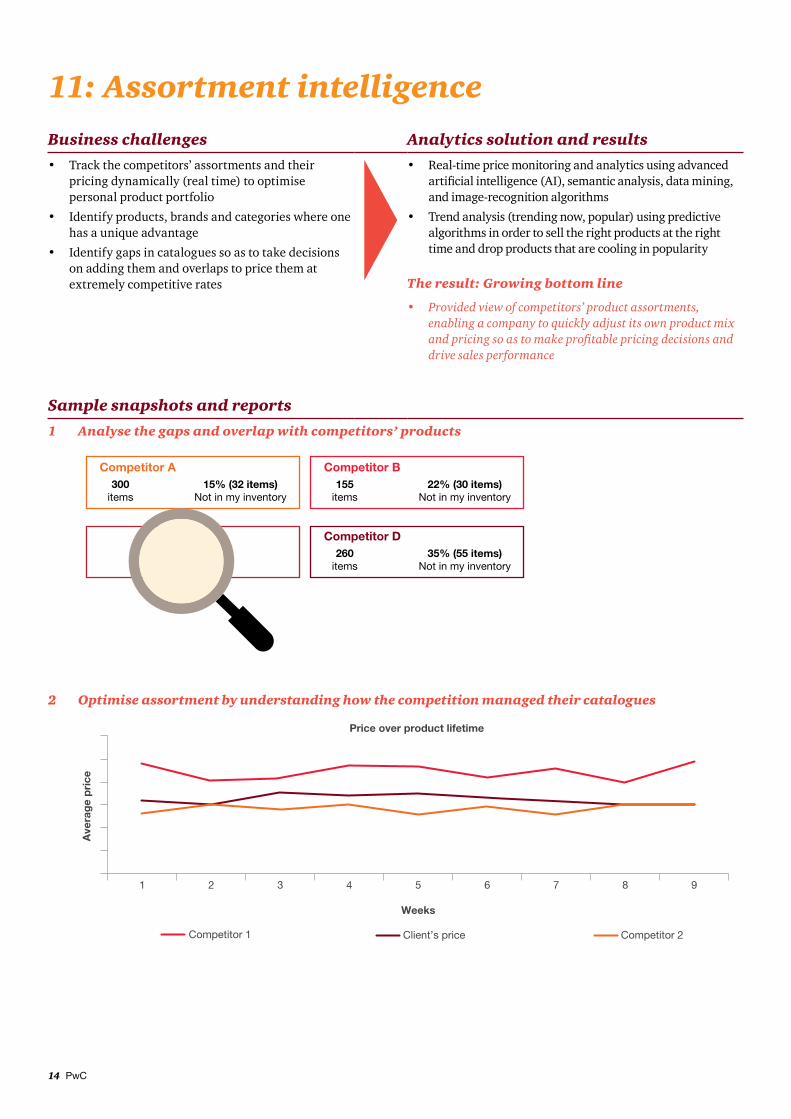
11: Assortment intelligenceBusiness challenges Analytics solution and results
• Track the competitors’ assortments and their pricing dynamically (real time) to optimise personal product portfolio
• Identify products, brands and categories where one has a unique advantage
• Identify gaps in catalogues so as to take decisions on adding them and overlaps to price them at extremely competitive rates
• Real-time price monitoring and analytics using advanced artificial intelligence (AI), semantic analysis, data mining, and image-recognition algorithms
• Trend analysis (trending now, popular) using predictive algorithms in order to sell the right products at the right time and drop products that are cooling in popularity
The result: Growing bottom line
• Provided view of competitors’ product assortments, enabling a company to quickly adjust its own product mix and pricing so as to make profitable pricing decisions and drive sales performance
Sample snapshots and reports
1 Analysethegapsandoverlapwithcompetitors’ products
Competitor A300
items15% (32 items)
Not in my inventory
Competitor B155
items22% (30 items)
Not in my inventory
Competitor D260
items35% (55 items)
Not in my inventory
2 Optimise assortment by understanding how the competition managed their catalogues
Price over product lifetime
Ave
rag
e p
rice
Weeks
Competitor 1
1 2 3 4 5 6 7 98
Client’s price Competitor 2
PwC’s analytics solutions for the FMCG sector 15
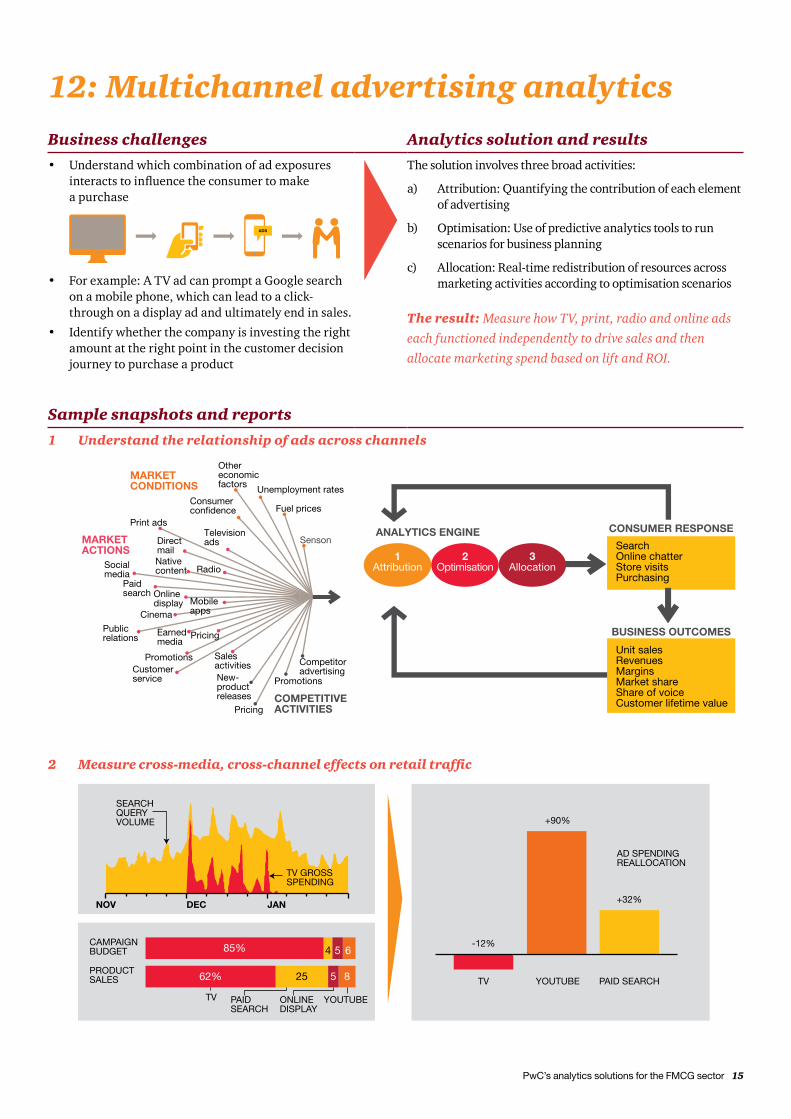
12: Multichannel advertising analyticsBusiness challenges Analytics solution and results
• Understand which combination of ad exposures interacts to influence the consumer to make a purchase
ADS
• For example: A TV ad can prompt a Google search on a mobile phone, which can lead to a click-through on a display ad and ultimately end in sales.
• Identify whether the company is investing the right amount at the right point in the customer decision journey to purchase a product
The solution involves three broad activities:
a) Attribution: Quantifying the contribution of each element of advertising
b) Optimisation: Use of predictive analytics tools to run scenarios for business planning
c) Allocation: Real‑time redistribution of resources across marketing activities according to optimisation scenarios
The result: Measure how TV, print, radio and online ads
each functioned independently to drive sales and then
allocate marketing spend based on lift and ROI.
Sample snapshots and reports
1 Understandtherelationshipofadsacross channels
Unemployment rates
Fuel prices
Senson
Othereconomicfactors
Print adsTelevisionadsDirect
mailNativecontent RadioSocial
mediaPaidsearch Online
displayCinema
Consumerconfidence
MARKETCONDITIONS
MARKETACTIONS
COMPETITIVEACTIVITIES
ANALYTICS ENGINE CONSUMER RESPONSE
BUSINESS OUTCOMES
Mobileapps
Pricing
Pricing
Promotions
Competitoradvertising
Earnedmedia
Publicrelations
PromotionsCustomerservice
SalesactivitiesNew-productreleases
Unit salesRevenuesMarginsMarket shareShare of voiceCustomer lifetime value
SearchOnline chatterStore visitsPurchasing
1Attribution
2Optimisation
3Allocation
2 Measurecross-media,cross-channeleffectsonretailtraffic
CAMPAIGNBUDGET
NOV DEC JAN
TV GROSSSPENDING
TV
-12%
YOUTUBE
+90%
PAID SEARCH
AD SPENDINGREALLOCATION
+32%
SEARCHQUERYVOLUME
PAIDSEARCH
PRODUCTSALES
85%
62% 25
4 5
5
6
8
ONLINEDISPLAY
YOUTUBETV
16 PwC
PwC can help you deal with all of these and other challenges through the use of analytics, allowing you to have access to information quickly and accurately and in formats that will enable you to make meaningful business decisions in realtime.
PwC’s analytics solutions for the FMCG sector 17
Why PwC?
Strong FMCG sector expertise
Our consultants have a proven track record of working with leading FMCG players in India and have strong domain knowledge in the consumer space.
Scalable,flexibleandcost-effective offerings
Our analytics solutions can be customised as per an FMCG player’s specific needs across different areas.
Cutting-edge technology
We have expertise in implementing FMCG analytics through leading market tools by aligning them to the client’s technology landscape.
18 PwC
Dat
a of
ferin
gs
Industry
Gov
ernm
ent
and
pub
lic s
ecto
r
Man
ufac
turin
g
Ret
ail a
nd c
onsu
mer
TIC
E
FS (B
CM
, ins
uran
ce, P
E, i
nves
tmen
t m
anag
emen
t)
Ana
lytic
s of
ferin
gs
Hea
lthca
re a
nd p
harm
a
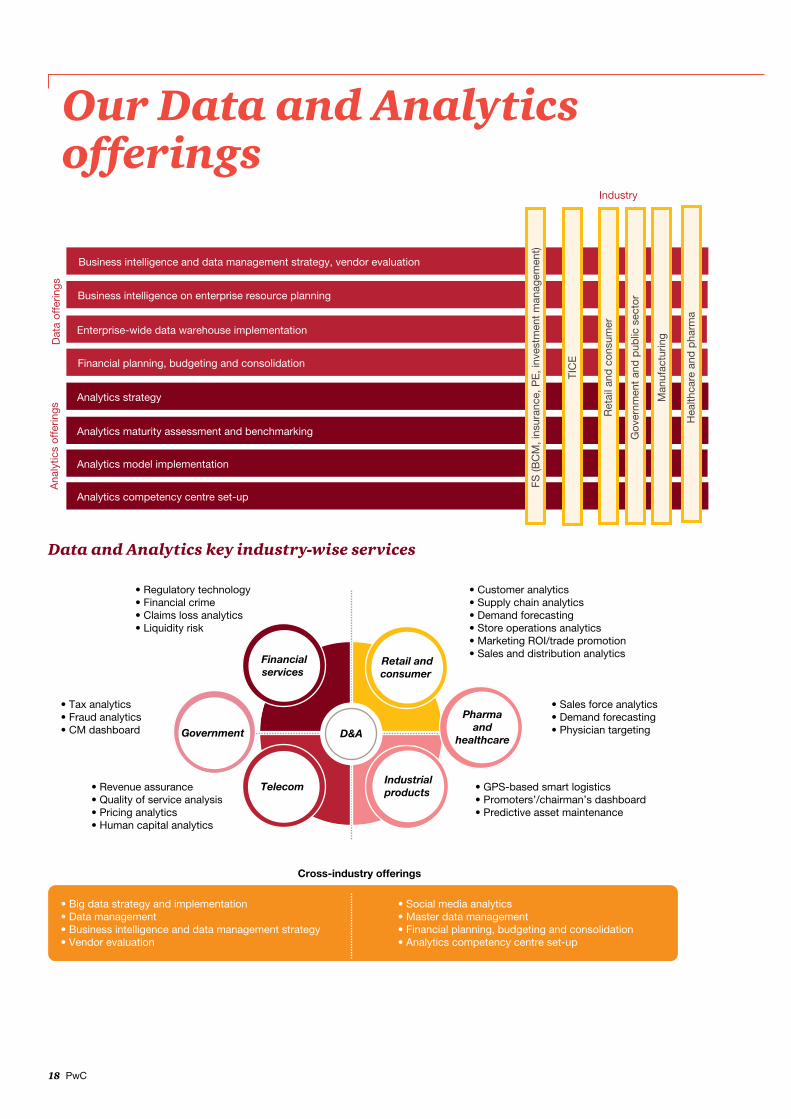
Business intelligence on enterprise resource planning
Business intelligence and data management strategy, vendor evaluation
Enterprise-wide data warehouse implementation
Financial planning, budgeting and consolidation
Analytics model implementation
Analytics strategy
Analytics maturity assessment and benchmarking
Analytics competency centre set-up
Data and Analytics key industry-wise services
Cross-industry offerings
• Regulatory technology• Financial crime• Claims loss analytics• Liquidity risk
• Customer analytics• Supply chain analytics• Demand forecasting• Store operations analytics• Marketing ROI/trade promotion • Sales and distribution analytics
• Tax analytics• Fraud analytics• CM dashboard
• GPS-based smart logistics• Promoters’/chairman’s dashboard• Predictive asset maintenance
• Sales force analytics• Demand forecasting• Physician targeting
• Revenue assurance• Quality of service analysis• Pricing analytics• Human capital analytics
Financialservices
Retail andconsumer
D&A
Industrialproducts Telecom
Pharmaand
healthcareGovernment
• Big data strategy and implementation• Data management• Business intelligence and data management strategy• Vendor evaluation
• Social media analytics• Master data management• Financial planning, budgeting and consolidation• Analytics competency centre set-up
Our Data and Analytics offerings

At PwC, our purpose is to build trust in society and solve important problems. We’re a network of firms in 157 countries with more than 2,23,000 people who are committed to delivering quality in assurance, advisory and tax services. Find out more and tell us what matters to you by visiting us at www.pwc.com.
In India, PwC has offices in these cities: Ahmedabad, Bengaluru, Chennai, Delhi NCR, Hyderabad, Kolkata, Mumbai and Pune. For more information about PwC India’s service offerings, visit www.pwc.com/in
PwC refers to the PwC International network and/or one or more of its member firms, each of which is a separate, independent and distinct legal entity. Please see www.pwc.com/structure for further details.
©2016 PwC. All rights reserved
About PwC

pwc.inData Classification: DC0
This document does not constitute professional advice. The information in this document has been obtained or derived from sources believed by PricewaterhouseCoopers Private Limited (PwCPL) to be reliable but PwCPL does not represent that this information is accurate or complete. Any opinions or estimates contained in this document represent the judgment of PwCPL at this time and are subject to change without notice. Readers of this publication are advised to seek their own professional advice before taking any course of action or decision, for which they are entirely responsible, based on the contents of this publication. PwCPL neither accepts or assumes any responsibility or liability to any reader of this publication in respect of the information contained within it or for any decisions readers may take or decide not to or fail to take.
© 2016 PricewaterhouseCoopers Private Limited. All rights reserved. In this document, “PwC” refers to PricewaterhouseCoopers Private Limited (a limited liability company in India having Corporate Identity Number or CIN : U74140WB1983PTC036093), which is a member firm of PricewaterhouseCoopers International Limited (PwCIL), each member firm of which is a separate legal entity.
SUS-IMS/Dec2016-8259


![Hay Groups FMCG Insights October 2011[1]](https://img.pdfslide.net/doc/110x75/544abd1caf7959a0438b4b98/hay-groups-fmcg-insights-october-20111.jpg)