Embed Size (px)
Citation preview
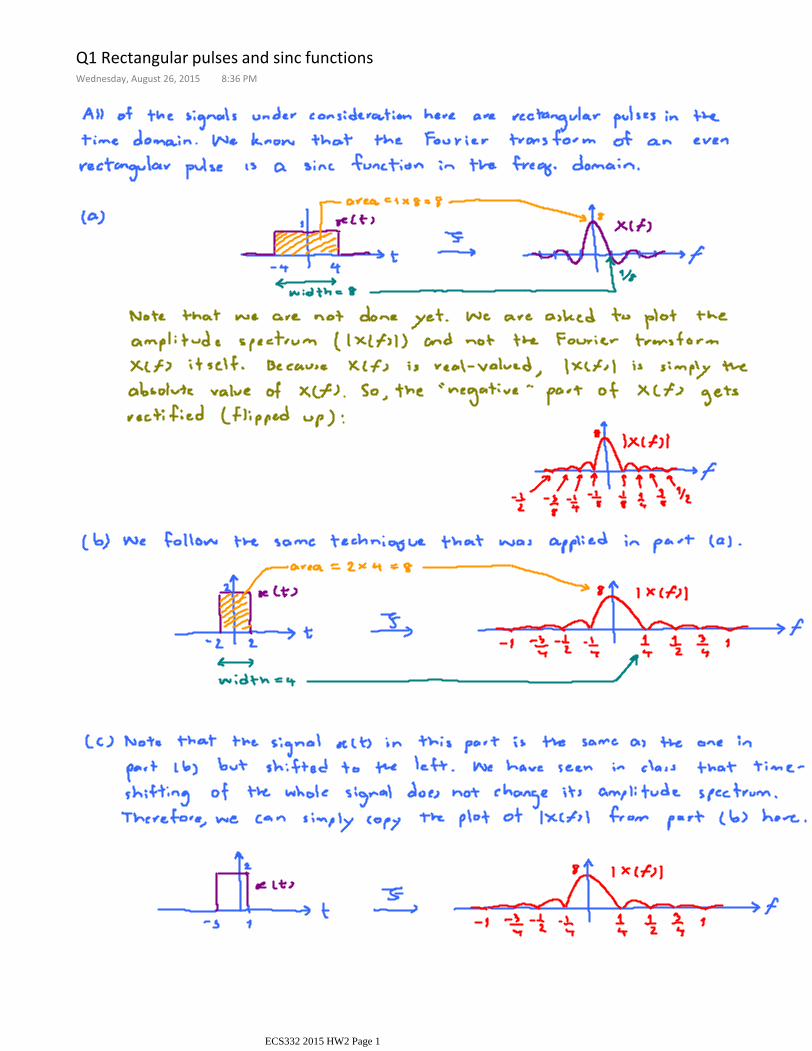
Q1 Rectangular pulses and sinc functionsWednesday, August 26, 2015 8:36 PM
ECS332 2015 HW2 Page 1
Q2 Magnitude Spectrum via MATLAB
a)
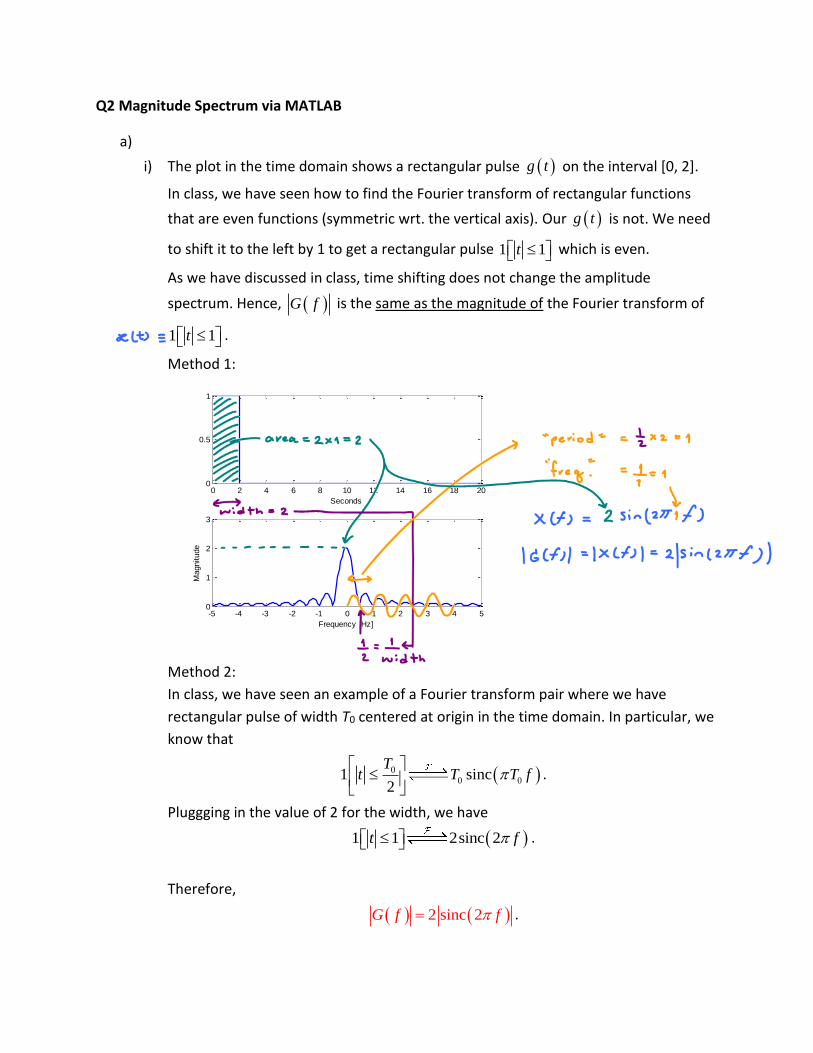
i) The plot in the time domain shows a rectangular pulse g t on the interval [0, 2].
In class, we have seen how to find the Fourier transform of rectangular functions
that are even functions (symmetric wrt. the vertical axis). Our g t is not. We need
to shift it to the left by 1 to get a rectangular pulse 1 1t which is even.
As we have discussed in class, time shifting does not change the amplitude
spectrum. Hence, G f is the same as the magnitude of the Fourier transform of
1 1t .
Method 1:
Method 2:
In class, we have seen an example of a Fourier transform pair where we have
rectangular pulse of width T0 centered at origin in the time domain. In particular, we
know that
0
0 01 sinc2
Tt T T f
.
Pluggging in the value of 2 for the width, we have
1 1 2sinc 2t f .
Therefore,
2 sinc 2G f f .
0 2 4 6 8 10 12 14 16 18 200
0.5
1
Seconds
-5 -4 -3 -2 -1 0 1 2 3 4 50
1
2
3
Frequency [Hz]
Magnitude
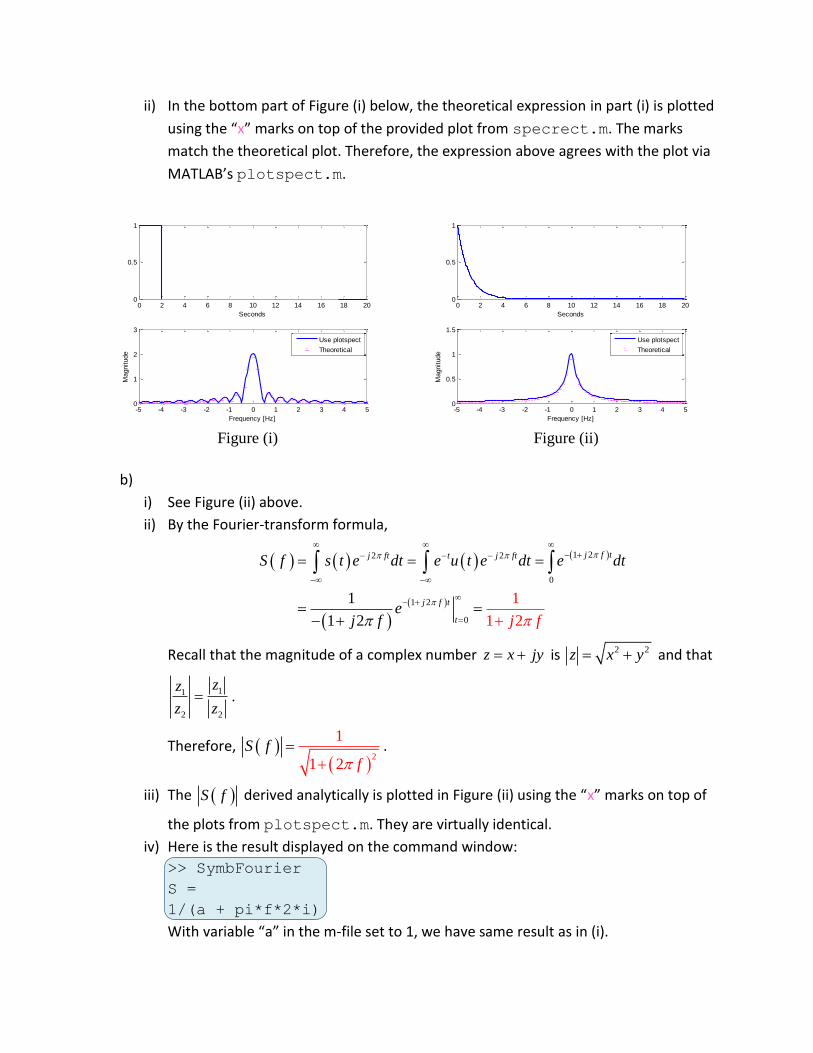
ii) In the bottom part of Figure (i) below, the theoretical expression in part (i) is plotted
using the “x” marks on top of the provided plot from specrect.m. The marks
match the theoretical plot. Therefore, the expression above agrees with the plot via
MATLAB’s plotspect.m.
Figure (i) Figure (ii)
b)
i) See Figure (ii) above.
ii) By the Fourier-transform formula,
1 22 2
0
1 2
0
1
1
1
1 22
j f tj ft t j ft
j f t
t
S
j f
f s t e dt e u t e dt e dt
ej f
Recall that the magnitude of a complex number z x jy is 2 2z x y and that
11
2 2
zz
z z .
Therefore,
2
1
1 2 f
S f
.
iii) The S f derived analytically is plotted in Figure (ii) using the “x” marks on top of
the plots from plotspect.m. They are virtually identical.
iv) Here is the result displayed on the command window:
>> SymbFourier
S =
1/(a + pi*f*2*i)
With variable “a” in the m-file set to 1, we have same result as in (i).
0 2 4 6 8 10 12 14 16 18 200
0.5
1
Seconds
-5 -4 -3 -2 -1 0 1 2 3 4 50
1
2
3
Frequency [Hz]
Magnitude
Use plotspect
Theoretical
0 2 4 6 8 10 12 14 16 18 200
0.5
1
Seconds
-5 -4 -3 -2 -1 0 1 2 3 4 50
0.5
1
1.5
Frequency [Hz]
Magnitude
Use plotspect
Theoretical
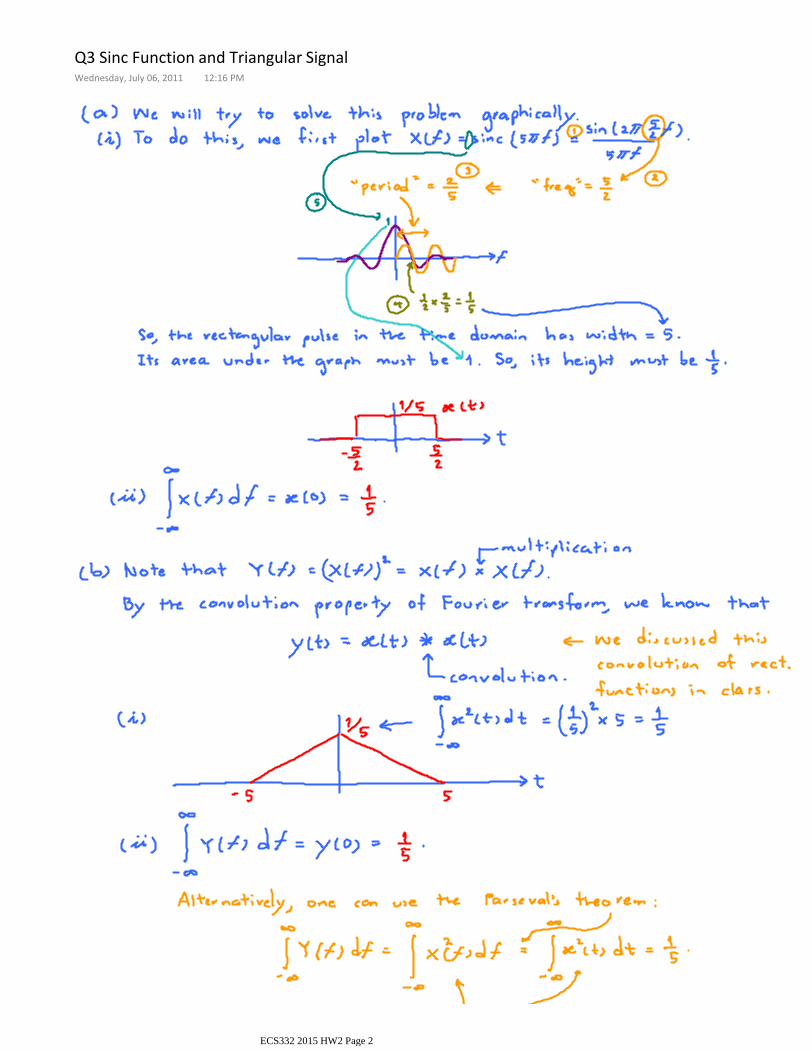
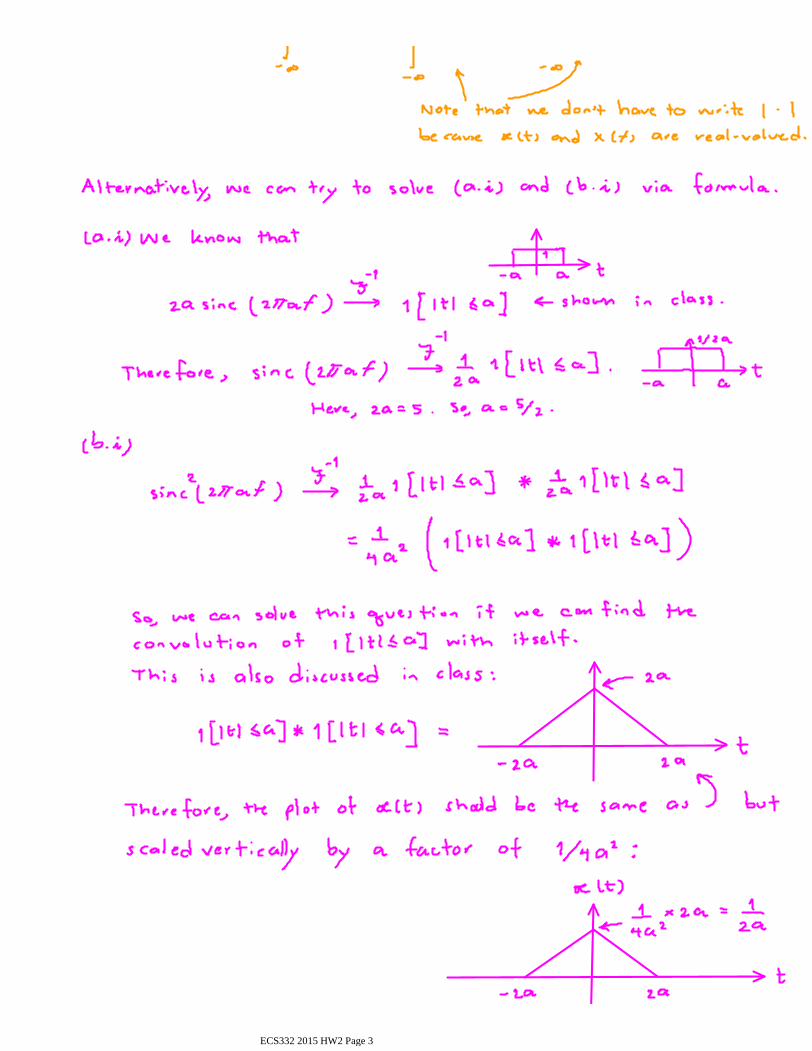
Q3 Sinc Function and Triangular SignalWednesday, July 06, 2011 12:16 PM
ECS332 2015 HW2 Page 2
ECS332 2015 HW2 Page 3

ECS332 2015 HW2 Page 4
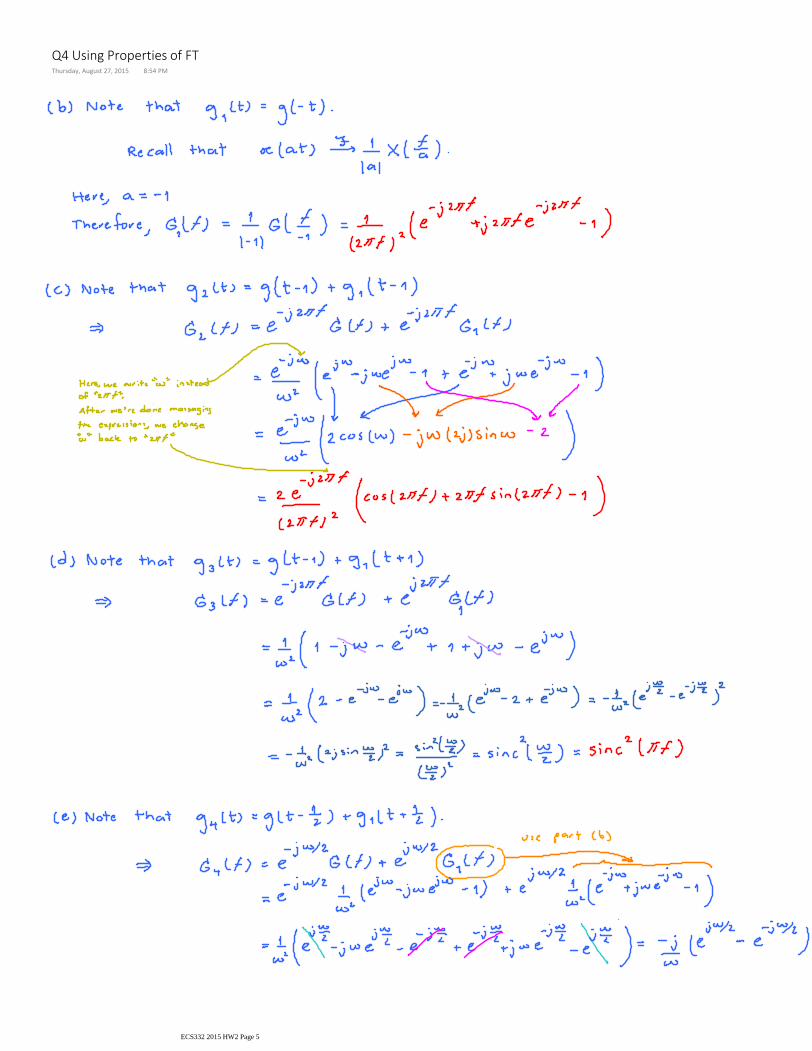
Q4 Using Properties of FTThursday, August 27, 2015 8:54 PM
ECS332 2015 HW2 Page 5
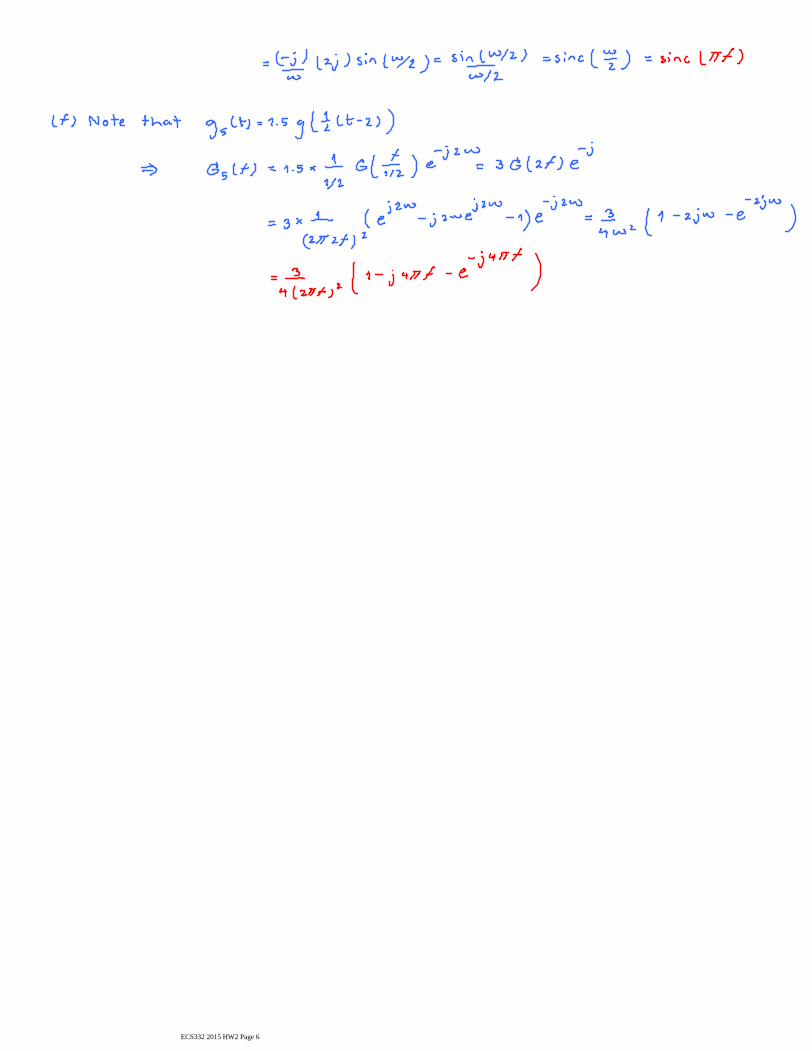
ECS332 2015 HW2 Page 6