Embed Size (px)
Citation preview
Q2 2013Results Review(U.S. GAAP – Preliminary)
July 30, 2013
1July 30, 2013
(Preliminary results prepared in accordance with U.S. GAAP - Refer to Appendix for definitions of non-U.S. GAAP financial measures)
Forward-Looking Statement
This document contains forward-looking
statements that ref lect management 's current
v iews wi th respect to future events. The words
“ant ic ipate,” “assume,” “bel ieve,” “est imate,”
“expect , ” “ intend,” “may,” “plan,” “project , ”
“should” and similar expressions ident ify
forward-looking statements. Such statements
are subject to r isks and uncertaint ies,
including, but not l imi ted to: the ef fective
implementation of the Chrysler Group LLC
2010 – 2014 Business Plan out l ined on
Nov ember 4, 2009 and subsequent updates,
including successful vehicle launches;
industry SAAR levels; cont inued economic
weakness, especial ly in North America,
including continued high unemployment levels
and l im ited availabi l i ty of af fordably pr iced
f inancing for our dealers and consumers;
int roduct ion of compet ing products and
competi t ive pressures which may lim it our
abi l i ty to reduce sales incent iv es; supply
disrupt ions resul t ing f rom natural disasters
and other events impact ing our supply chain;
and our abi l i ty to real ize benef i ts f rom our
industr ial al l iance wi th Fiat, part icular ly in
l ight of the economic cr isis current ly af fecting
sev eral European countr ies. In addi tion, any
project ions or targets on future performance
are based on the assumpt ion that the
Company maintains i ts status as a partnership
for U.S. federal and state income tax
purposes and do not consider the impact of a
potent ial conversion into a corporat ion. If any
of these or other risks and uncertaint ies
occur, or if the assumpt ions underlying any of
these statements prov e incorrect , then actual
resul t s may be material ly dif ferent f rom those
expressed or impl ied by such statements. We
do not intend or assume any obl igation to
update any forward-looking statement, which
speaks only as of the date on which i t is
made. Further detai ls of potent ial r isks that
may affect Chrysler Group are described in
Chrysler Group’s 2012 Annual Report on Form
10-K, and i ts subsequent periodic reports f i led
wi th the U.S. Securi t ies and Exchange
Commission.
2July 30, 2013
(Preliminary results prepared in accordance with U.S. GAAP - Refer to Appendix for definitions of non-U.S. GAAP financial measures)
Executive SummaryQ2 2013 Highlights
• Q2 2013 Worldwide shipments totaled 660k vehicles, up 5% versus Q2 2012 and 15% versus Q1 2013;Net revenues totaled $18.0B, up 7% versus Q2 2012
• Modified Operating Profit increased 7% year-over-year to $808M
Higher shipment volumes and pricing offset increased industrial costs
Q2 2013 includes a $151 million charge related to the voluntary safety recall for the 1993-1998 Jeep Grand Cherokee and the2002-2007 Jeep Liberty, and the customer satisfaction action for the 1999-2004 Jeep Grand Cherokee
• Net income increased 16% year-over-year to $507M – 8th consecutive quarter of positive net income
Adjusted Net Income was $530 million, excluding a $23 million loss on extinguishment of debt recognized in connection withthe June 2013 re-pricing and amendment of the Tranche B Term Loan and undrawn revolving credit facility
• Strong Q2 2013 worldwide vehicle sales of 643k, up 10% from Q2 2012; U.S. retail vehicle sales increased 17% withdealer inventories at 68 days supply
U.S. market share up 20 bps in Q2 2013 to 11.4%
Canada market share up 60 bps to 15.1%
• Free Cash Flow was $91M in Q2 2013 and Net Industrial Debt increased slightly to $656M at June 30, 2013 (from$619M at March 31, 2013)
• Chrysler Group amended its U.S. and Canadian salaried defined benefit pension plans
• New Jeep Cherokee production launched at end of Q2 2013
H2 product market launches include the Ram Pro-Master, Dodge Durango major refresh and Fiat 500L
• FY 2013 guidance revised
Worldwide vehicle shipments to ~2.6 million (from 2.6-2.7 million)
Modified Operating Profit to $3.3-3.8B (from ~$3.8B)
Net income to $1.7-2.2B (from ~$2.2B)
3July 30, 2013
(Preliminary results prepared in accordance with U.S. GAAP - Refer to Appendix for definitions of non-U.S. GAAP financial measures)
Q2 2013 Financial Highlights
Net Income ($M)
Net Industrial Debt ($B)
0.6 0.7
Cash ($B)
Net Revenue ($B)
Modified Operating Profit ($M)
Modified EBITDA ($M)
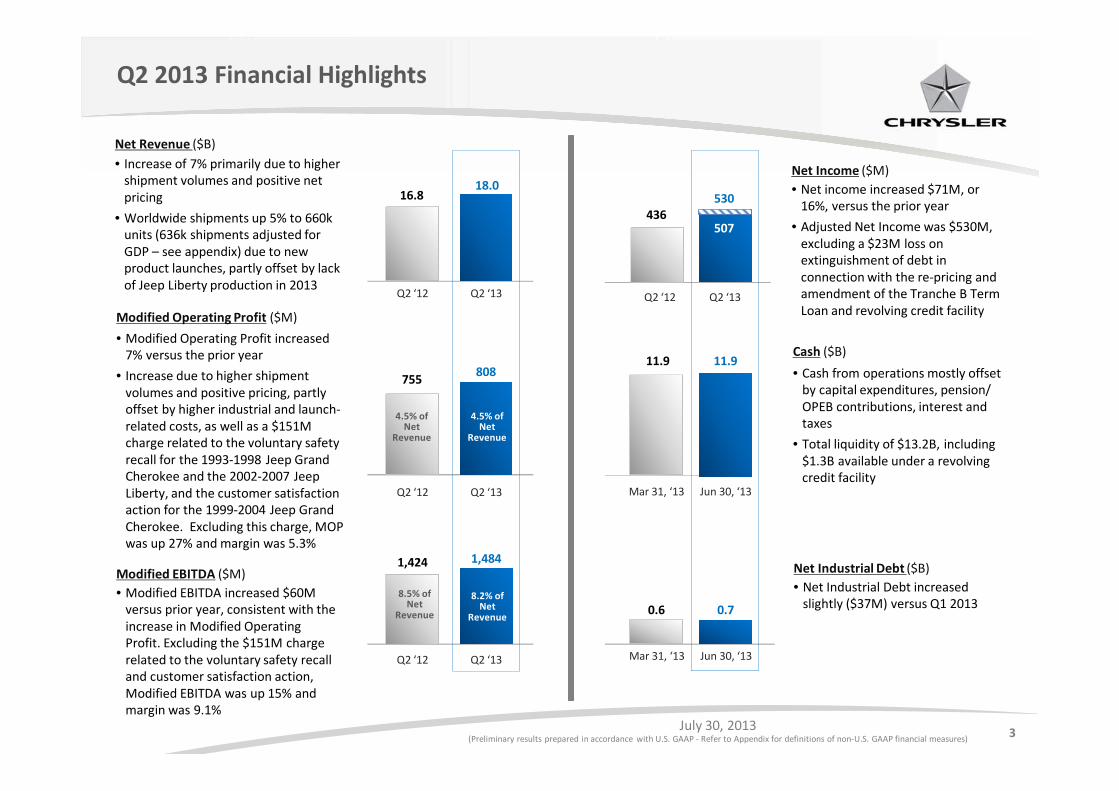
• Increase of 7% primarily due to highershipment volumes and positive netpricing
• Worldwide shipments up 5% to 660kunits (636k shipments adjusted forGDP – see appendix) due to newproduct launches, partly offset by lackof Jeep Liberty production in 2013
• Modified Operating Profit increased7% versus the prior year
• Increase due to higher shipmentvolumes and positive pricing, partlyoffset by higher industrial and launch-related costs, as well as a $151Mcharge related to the voluntary safetyrecall for the 1993-1998 Jeep GrandCherokee and the 2002-2007 JeepLiberty, and the customer satisfactionaction for the 1999-2004 Jeep GrandCherokee. Excluding this charge, MOPwas up 27% and margin was 5.3%
16.818.0
755808
1,424 1,484
Q2 ‘12 Q2 ‘13 Q2 ‘12 Q2 ‘13
Q2 ‘12 Q2 ‘13
Q2 ‘12 Q2 ‘13
Mar 31, ‘13 Jun 30, ‘13
• Modified EBITDA increased $60Mversus prior year, consistent with theincrease in Modified OperatingProfit. Excluding the $151M chargerelated to the voluntary safety recalland customer satisfaction action,Modified EBITDA was up 15% andmargin was 9.1%
4.5% ofNet
Revenue
• Net Industrial Debt increasedslightly ($37M) versus Q1 2013
4.5% ofNet
Revenue
8.2% ofNet
Revenue
8.5% ofNet
Revenue
11.9• Cash from operations mostly offset
by capital expenditures, pension/OPEB contributions, interest andtaxes
• Total liquidity of $13.2B, including$1.3B available under a revolvingcredit facility
11.9
Mar 31, ‘13 Jun 30, ‘13
507
530436
• Net income increased $71M, or16%, versus the prior year
• Adjusted Net Income was $530M,excluding a $23M loss onextinguishment of debt inconnection with the re-pricing andamendment of the Tranche B TermLoan and revolving credit facility
4July 30, 2013
(Preliminary results prepared in accordance with U.S. GAAP - Refer to Appendix for definitions of non-U.S. GAAP financial measures)
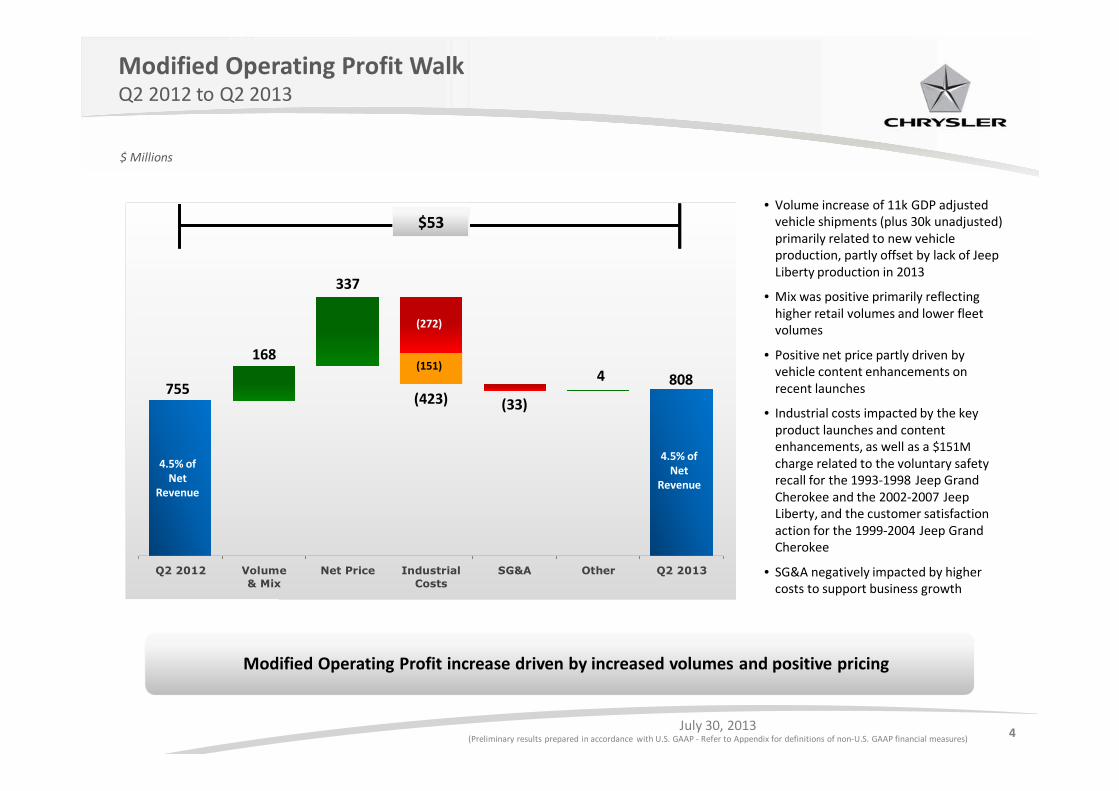
Q2 2012 Volume& Mix
Net Price IndustrialCosts
SG&A Other Q2 2013
755(33)
4 808(423)
$ Millions
168
$53
Modified Operating Profit increase driven by increased volumes and positive pricing
4.5% ofNet
Revenue
4.5% ofNet
Revenue
Modified Operating Profit WalkQ2 2012 to Q2 2013
337
• Volume increase of 11k GDP adjustedvehicle shipments (plus 30k unadjusted)primarily related to new vehicleproduction, partly offset by lack of JeepLiberty production in 2013
• Mix was positive primarily reflectinghigher retail volumes and lower fleetvolumes
• Positive net price partly driven byvehicle content enhancements onrecent launches
• Industrial costs impacted by the keyproduct launches and contentenhancements, as well as a $151M
charge related to the voluntary safetyrecall for the 1993-1998 Jeep GrandCherokee and the 2002-2007 JeepLiberty, and the customer satisfactionaction for the 1999-2004 Jeep GrandCherokee
• SG&A negatively impacted by highercosts to support business growth
(151)
(272)
5July 30, 2013
(Preliminary results prepared in accordance with U.S. GAAP - Refer to Appendix for definitions of non-U.S. GAAP financial measures)
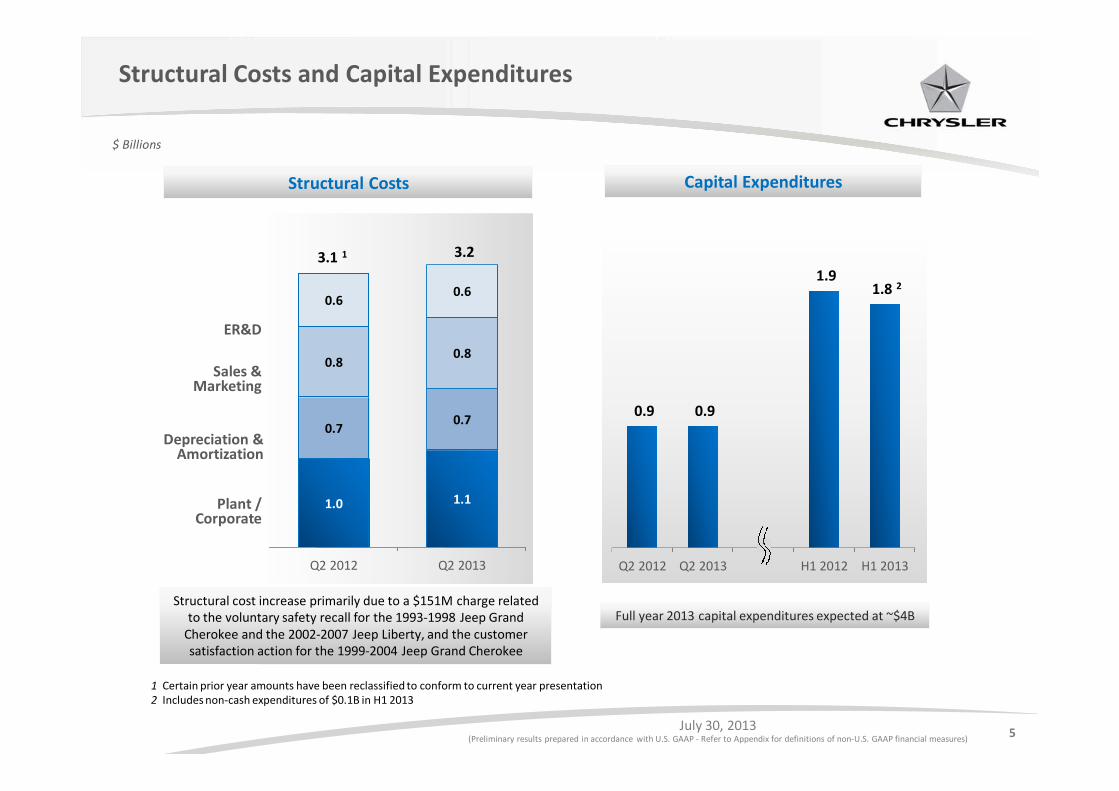
Structural Costs and Capital Expenditures
$ Billions
1.0 1.1
0.70.7
0.80.8
0.60.6
Q2 2012 Q2 2013
Plant /Corporate
Depreciation &Amortization
Sales &Marketing
ER&D
3.1 1
Structural Costs
0.9 0.9
1.91.8 2
Q2 2012 Q2 2013 H1 2012 H1 2013
Capital Expenditures
3.2
Full year 2013 capital expenditures expected at ~$4B
1 Certain prior year amounts have been reclassified to conform to current year presentation2 Includes non-cash expenditures of $0.1B in H1 2013
Structural cost increase primarily due to a $151M charge relatedto the voluntary safety recall for the 1993-1998 Jeep Grand
Cherokee and the 2002-2007 Jeep Liberty, and the customersatisfaction action for the 1999-2004 Jeep Grand Cherokee
6July 30, 2013
(Preliminary results prepared in accordance with U.S. GAAP - Refer to Appendix for definitions of non-U.S. GAAP financial measures)
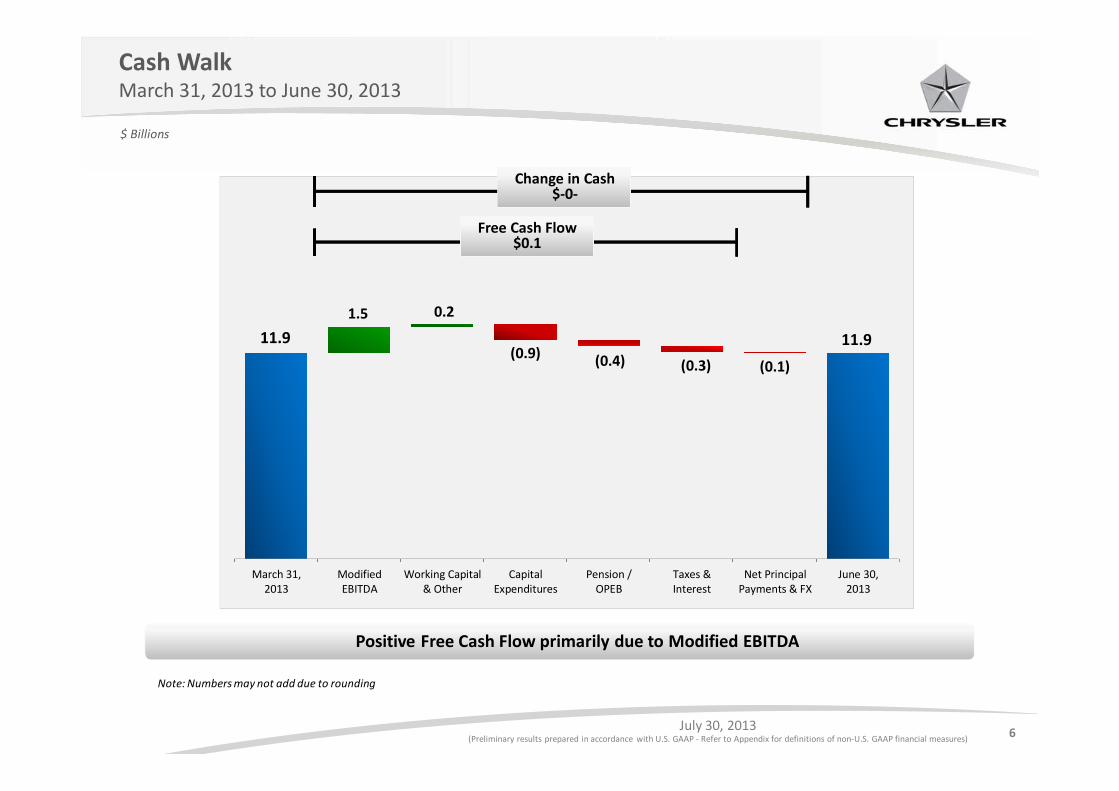
Cash WalkMarch 31, 2013 to June 30, 2013
$ Billions
March 31,2013
ModifiedEBITDA
Working Capital& Other
CapitalExpenditures
Pension /OPEB
Taxes &Interest
Net PrincipalPayments & FX
June 30,2013
Change in Cash$-0-
(0.4)
0.2
11.9
(0.3)
11.9
1.5
(0.9)
Free Cash Flow$0.1
Positive Free Cash Flow primarily due to Modified EBITDA
Note: Numbers may not add due to rounding
(0.1)
7July 30, 2013
(Preliminary results prepared in accordance with U.S. GAAP - Refer to Appendix for definitions of non-U.S. GAAP financial measures)
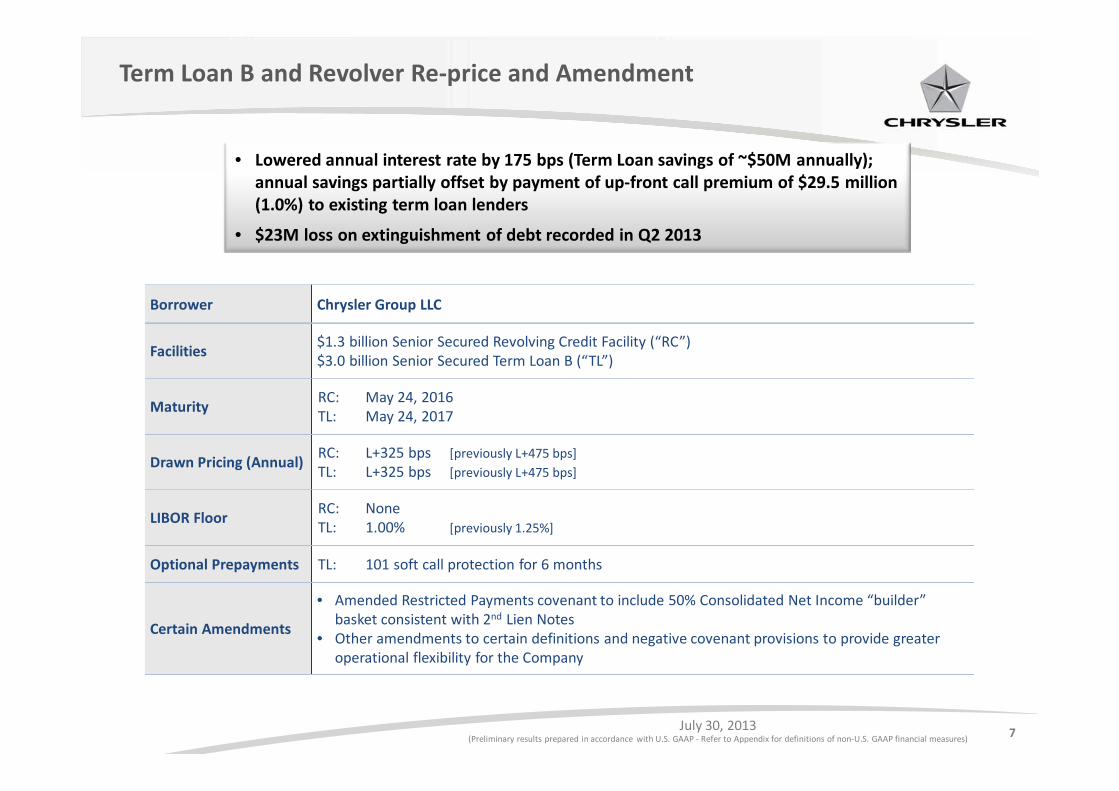
Term Loan B and Revolver Re-price and Amendment
Borrower Chrysler Group LLC
Facilities$1.3 billion Senior Secured Revolving Credit Facility (“RC”)$3.0 billion Senior Secured Term Loan B (“TL”)
MaturityRC: May 24, 2016TL: May 24, 2017
Drawn Pricing (Annual)RC: L+325 bps [previously L+475 bps]
TL: L+325 bps [previously L+475 bps]
LIBOR FloorRC: NoneTL: 1.00% [previously 1.25%]
Optional Prepayments TL: 101 soft call protection for 6 months
Certain Amendments
• Amended Restricted Payments covenant to include 50% Consolidated Net Income “builder”basket consistent with 2nd Lien Notes
• Other amendments to certain definitions and negative covenant provisions to provide greateroperational flexibility for the Company
• Lowered annual interest rate by 175 bps (Term Loan savings of ~$50M annually);annual savings partially offset by payment of up-front call premium of $29.5 million(1.0%) to existing term loan lenders
• $23M loss on extinguishment of debt recorded in Q2 2013
8July 30, 2013
(Preliminary results prepared in accordance with U.S. GAAP - Refer to Appendix for definitions of non-U.S. GAAP financial measures)
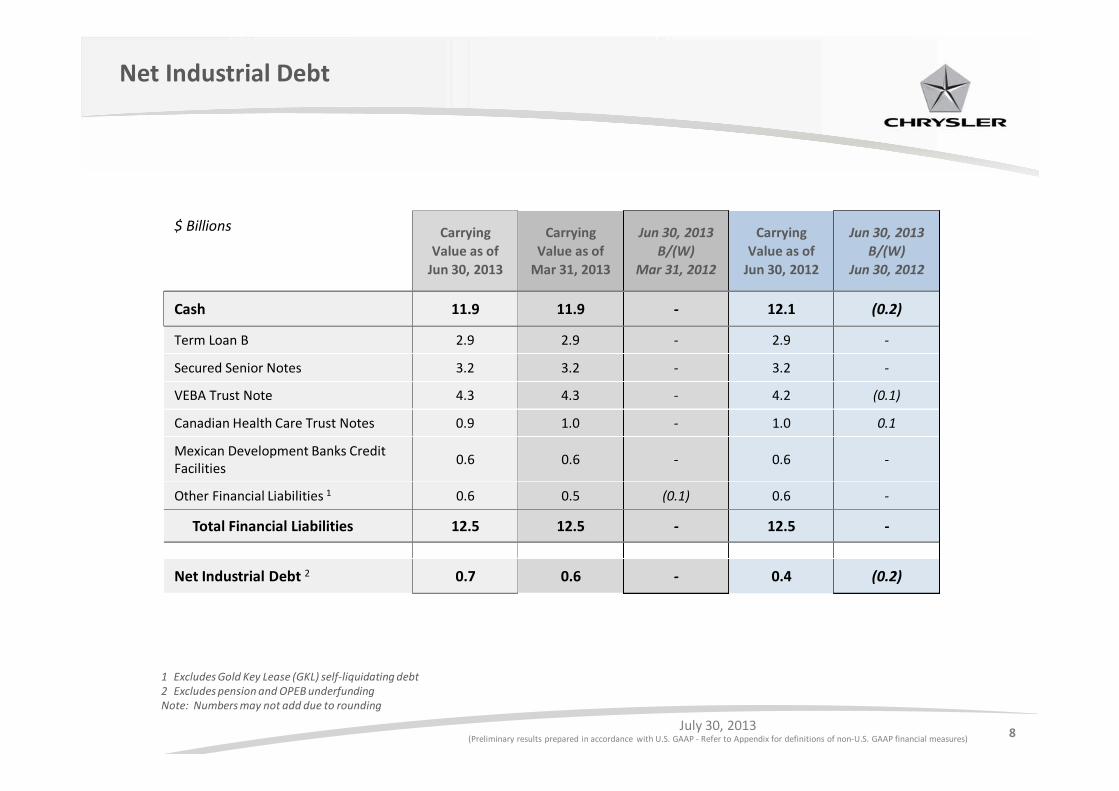
Net Industrial Debt
$ Billions Carrying
Value as of
Jun 30, 2013
Carrying
Value as of
Mar 31, 2013
Jun 30, 2013
B/(W)
Mar 31, 2012
Carrying
Value as of
Jun 30, 2012
Jun 30, 2013
B/(W)
Jun 30, 2012
Cash 11.9 11.9 - 12.1 (0.2)
Term Loan B 2.9 2.9 - 2.9 -
Secured Senior Notes 3.2 3.2 - 3.2 -
VEBA Trust Note 4.3 4.3 - 4.2 (0.1)
Canadian Health Care Trust Notes 0.9 1.0 - 1.0 0.1
Mexican Development Banks CreditFacilities
0.6 0.6 - 0.6 -
Other Financial Liabilities 1 0.6 0.5 (0.1) 0.6 -
Total Financial Liabilities 12.5 12.5 - 12.5 -
Net Industrial Debt 2 0.7 0.6 - 0.4 (0.2)
1 Excludes Gold Key Lease (GKL) self-liquidating debt2 Excludes pension and OPEB underfundingNote: Numbers may not add due to rounding
9July 30, 2013
(Preliminary results prepared in accordance with U.S. GAAP - Refer to Appendix for definitions of non-U.S. GAAP financial measures)
Pension Plan Amendment Summary
• During the second quarter of 2013, Chrysler Group amended its U.S. and Canadian salaried definedbenefit pension plans
o The U.S. plans were amended in order to comply with IRS regulations; consequently the accrualof future benefits will cease effective December 31, 2013, and the Company decided toenhance the retirement factors
o The Canada amendment also ceases the accrual of future benefits effective December 31,2014, and enhances the retirement factors
• The changes to the plans resulted in a curtailment gain and plan amendments for which theCompany recognized a $218 million net reduction to the pension obligation with a correspondingincrease in accumulated other comprehensive income during the second quarter of 2013.
• Company actions to mitigate impact on employees
o Enhanced the pension formula by adjusting the pension plans‘ retirement factors to allow U.S.retirement eligible employees who retire on or after January 1, 2014 and Canadian retirementeligible employees who retire on or after January 1, 2015, to receive 100% of their accruedbenefit beginning at age 58 and 60, respectively, versus age 62
o The Company will contribute to its existing defined contribution plans
o Retained a financial counseling firm to provide confidential, individual transition counseling onsavings and retirement readiness at no cost to the employee
10July 30, 2013
(Preliminary results prepared in accordance with U.S. GAAP - Refer to Appendix for definitions of non-U.S. GAAP financial measures)
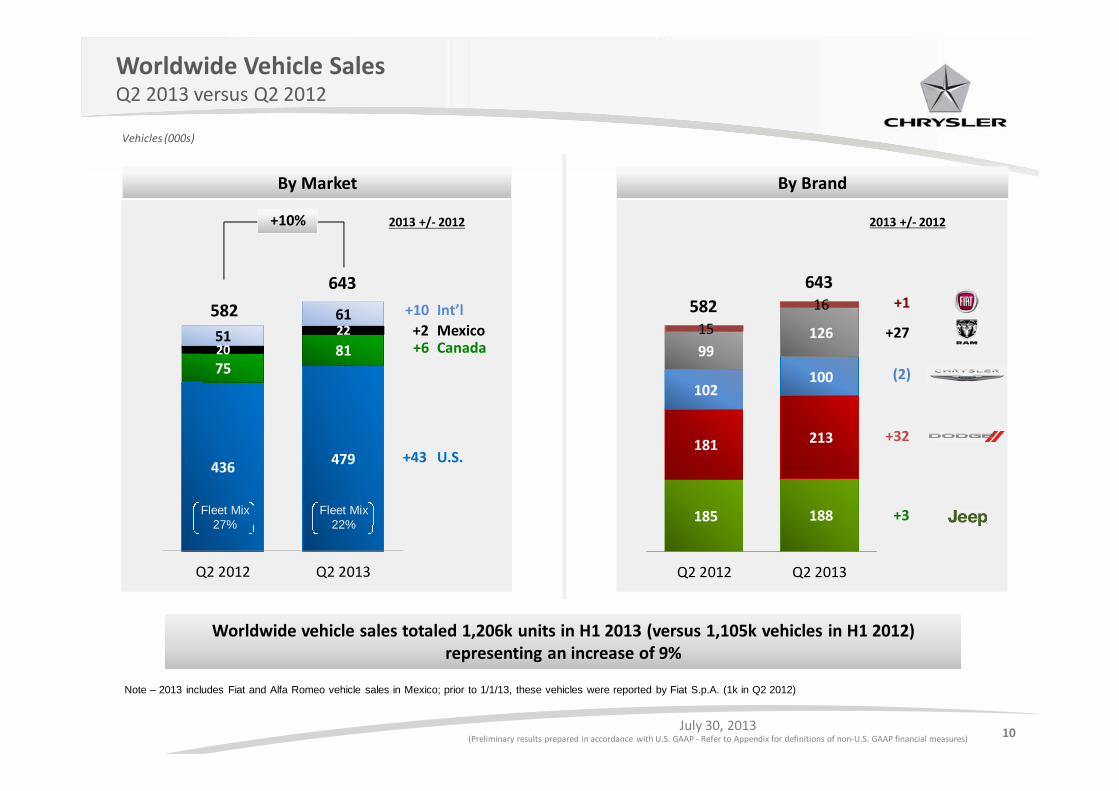
Worldwide Vehicle SalesQ2 2013 versus Q2 2012
185 188
181 213
102100
9912615
16
Q2 2012 Q2 2013
436479
758120
2251
61
Q2 2012 Q2 2013
U.S.
CanadaMexico
Int’l
By Market By Brand
Vehicles (000s)
582
643
+43
+6+2
+10
2013 +/- 2012
+3
(2)
+27
+1
2013 +/- 2012
+32
+10%
Fleet Mix27%
Fleet Mix22%
582
643
Note – 2013 includes Fiat and Alfa Romeo vehicle sales in Mexico; prior to 1/1/13, these vehicles were reported by Fiat S.p.A. (1k in Q2 2012)
Worldwide vehicle sales totaled 1,206k units in H1 2013 (versus 1,105k vehicles in H1 2012)representing an increase of 9%
Worldwide vehicle sales totaled 1,206k units in H1 2013 (versus 1,105k vehicles in H1 2012)representing an increase of 9%
11July 30, 2013
(Preliminary results prepared in accordance with U.S. GAAP - Refer to Appendix for definitions of non-U.S. GAAP financial measures)
IndustryVehicles (000’s)
Chrysler Group performance (Q2 2013 vs. Q2 2012)
Sales Market share Key Messages (period-over-period)
+10%11.4%
(up 20 bps)
+9%15.1%
(up 60 bps)
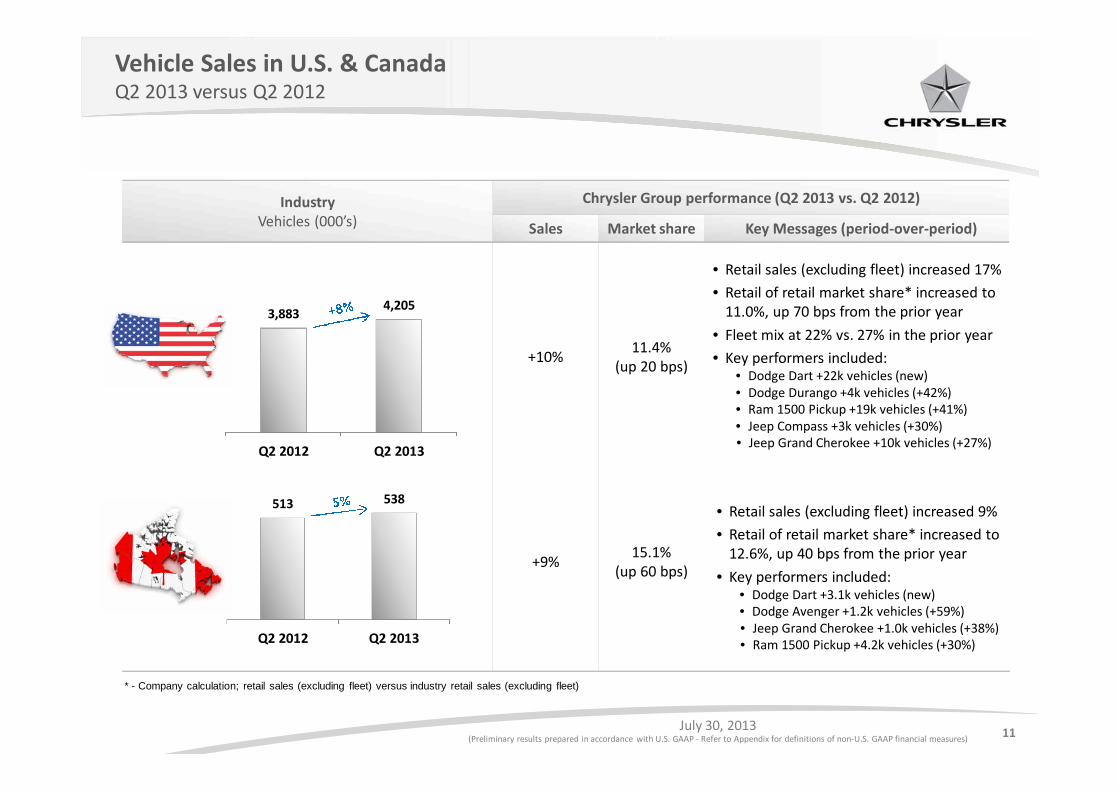
Vehicle Sales in U.S. & CanadaQ2 2013 versus Q2 2012
3,8834,205
Q2 2012 Q2 2013
513 538
Q2 2012 Q2 2013
• Retail sales (excluding fleet) increased 17%
• Retail of retail market share* increased to11.0%, up 70 bps from the prior year
• Fleet mix at 22% vs. 27% in the prior year
• Key performers included:• Dodge Dart +22k vehicles (new)• Dodge Durango +4k vehicles (+42%)• Ram 1500 Pickup +19k vehicles (+41%)• Jeep Compass +3k vehicles (+30%)• Jeep Grand Cherokee +10k vehicles (+27%)
• Retail sales (excluding fleet) increased 9%
• Retail of retail market share* increased to12.6%, up 40 bps from the prior year
• Key performers included:• Dodge Dart +3.1k vehicles (new)• Dodge Avenger +1.2k vehicles (+59%)• Jeep Grand Cherokee +1.0k vehicles (+38%)• Ram 1500 Pickup +4.2k vehicles (+30%)
* - Company calculation; retail sales (excluding fleet) versus industry retail sales (excluding fleet)
12July 30, 2013
(Preliminary results prepared in accordance with U.S. GAAP - Refer to Appendix for definitions of non-U.S. GAAP financial measures)
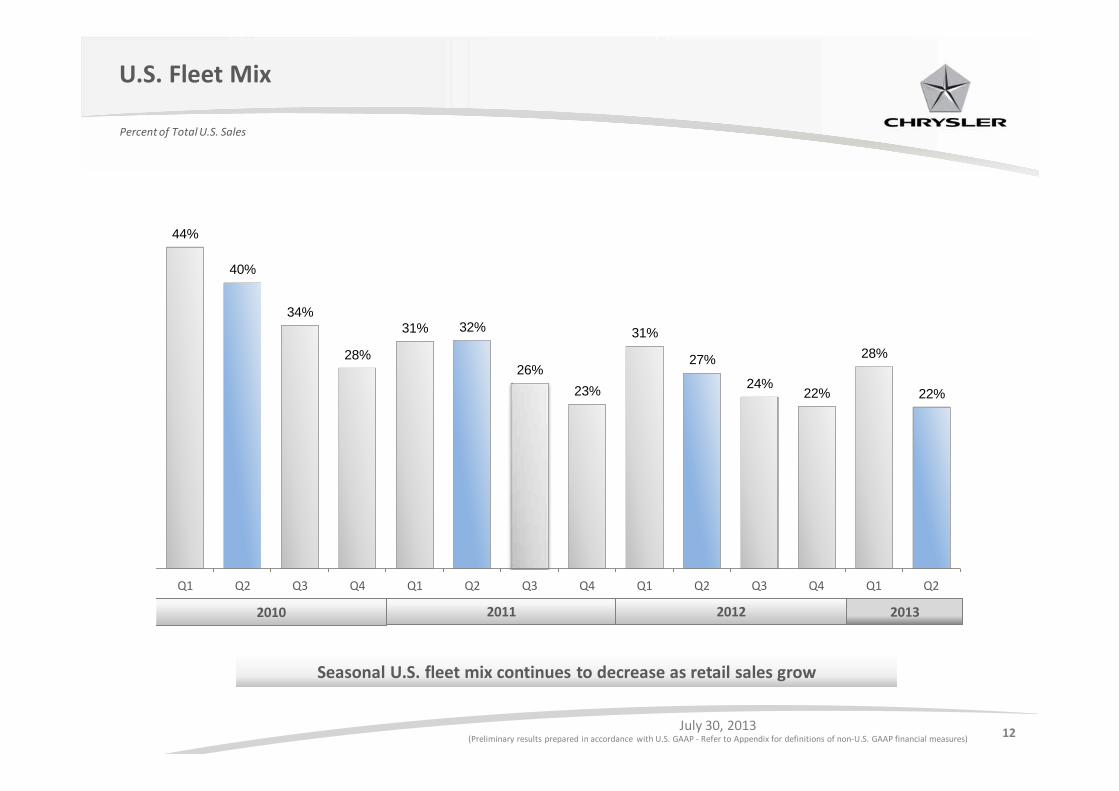
44%
40%
34%
28%
31% 32%
26%
23%
31%
27%
24%22%
28%
22%
Q1 Q2 Q3 Q4 Q1 Q2 Q3 Q4 Q1 Q2 Q3 Q4 Q1 Q2
U.S. Fleet Mix
2010 2012
Percent of Total U.S. Sales
2011
Seasonal U.S. fleet mix continues to decrease as retail sales grow
2013
13July 30, 2013
(Preliminary results prepared in accordance with U.S. GAAP - Refer to Appendix for definitions of non-U.S. GAAP financial measures)
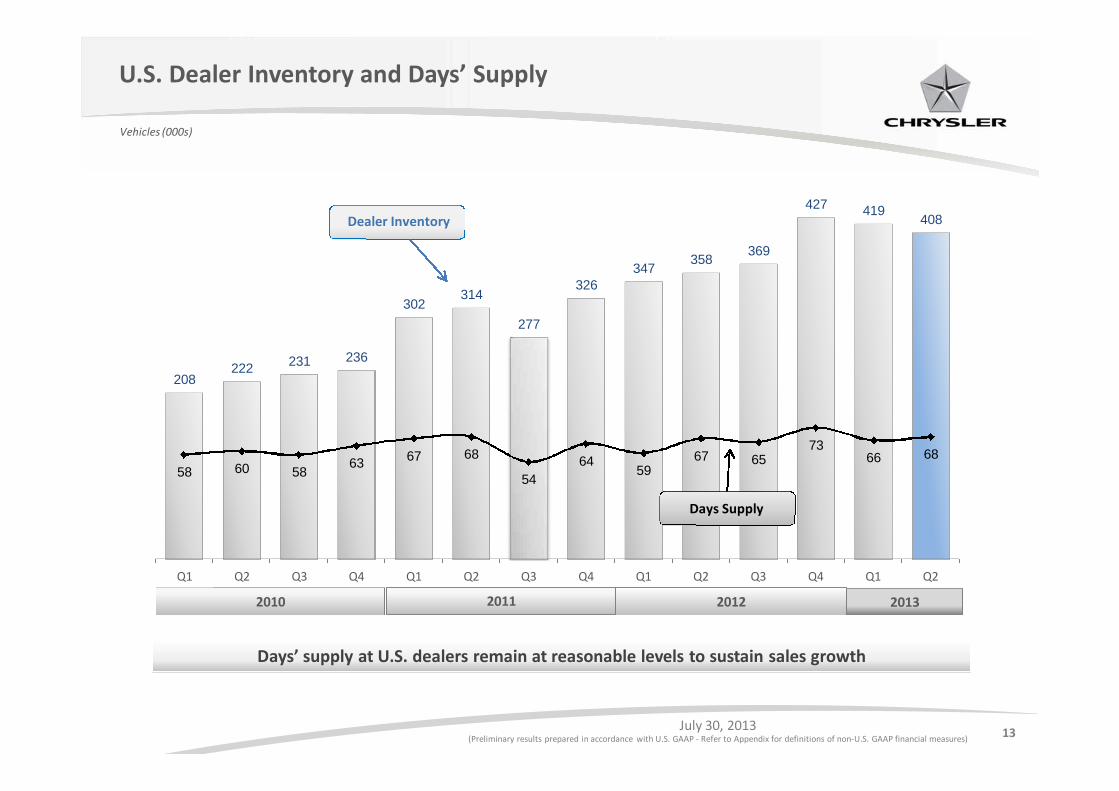
208222
231 236
302314
277
326347
358369
427 419408
58 60 5863
67 68
54
6459
67 6573
66 68
Q1 Q2 Q3 Q4 Q1 Q2 Q3 Q4 Q1 Q2 Q3 Q4 Q1 Q2
U.S. Dealer Inventory and Days’ Supply
Vehicles (000s)
Dealer Inventory
Days Supply
Days’ supply at U.S. dealers remain at reasonable levels to sustain sales growth
2010 20122011 2013
14July 30, 2013
(Preliminary results prepared in accordance with U.S. GAAP - Refer to Appendix for definitions of non-U.S. GAAP financial measures)
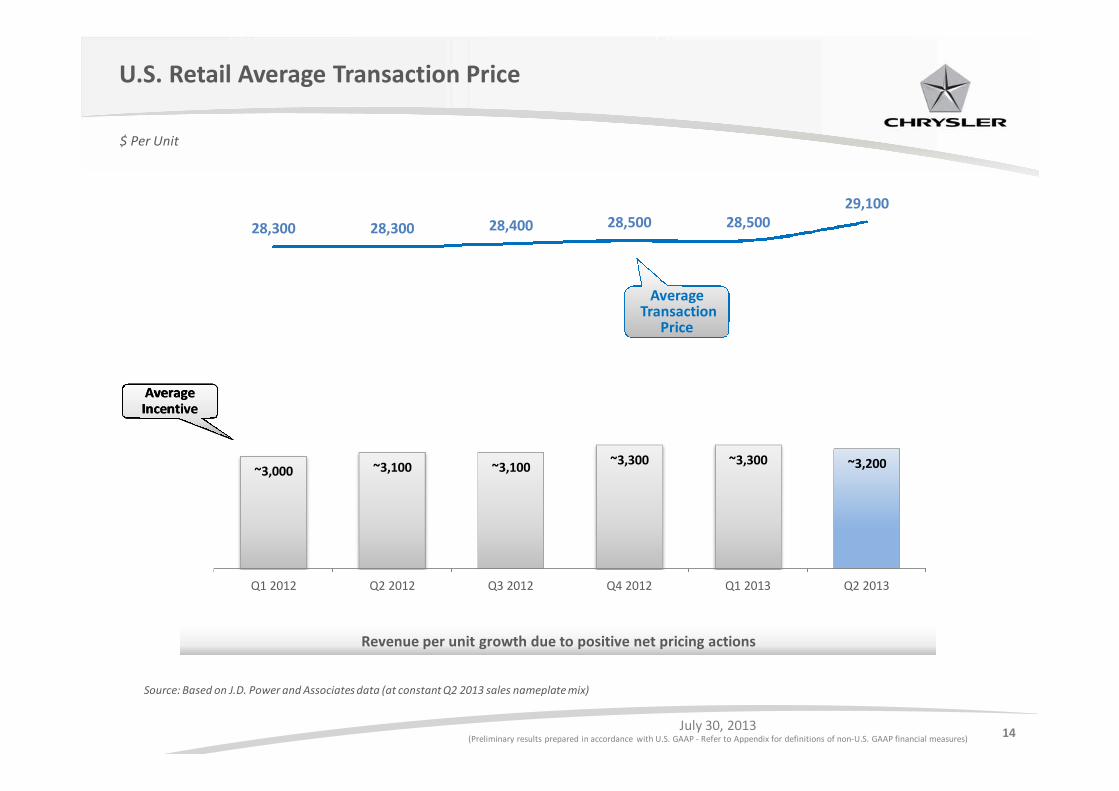
Source: Based on J.D. Power and Associates data (at constant Q2 2013 sales nameplate mix)
U.S. Retail Average Transaction Price
$ Per Unit
~3,000 ~3,100 ~3,100~3,300 ~3,300 ~3,200
28,300 28,300 28,400 28,500 28,50029,100
Q1 2012 Q2 2012 Q3 2012 Q4 2012 Q1 2013 Q2 2013
AverageAverageTransaction
Price
AverageIncentiveAverageIncentive
Revenue per unit growth due to positive net pricing actions
15July 30, 2013
(Preliminary results prepared in accordance with U.S. GAAP - Refer to Appendix for definitions of non-U.S. GAAP financial measures)
Jeep Grand Cherokee / Ram Heavy Duty Pickup Performance
Oct'12
Nov'12
Dec'12
Jan'13
Feb'13
Mar'13
Apr'13
May'13
Jun'13
Worldwide ShipmentsTrend
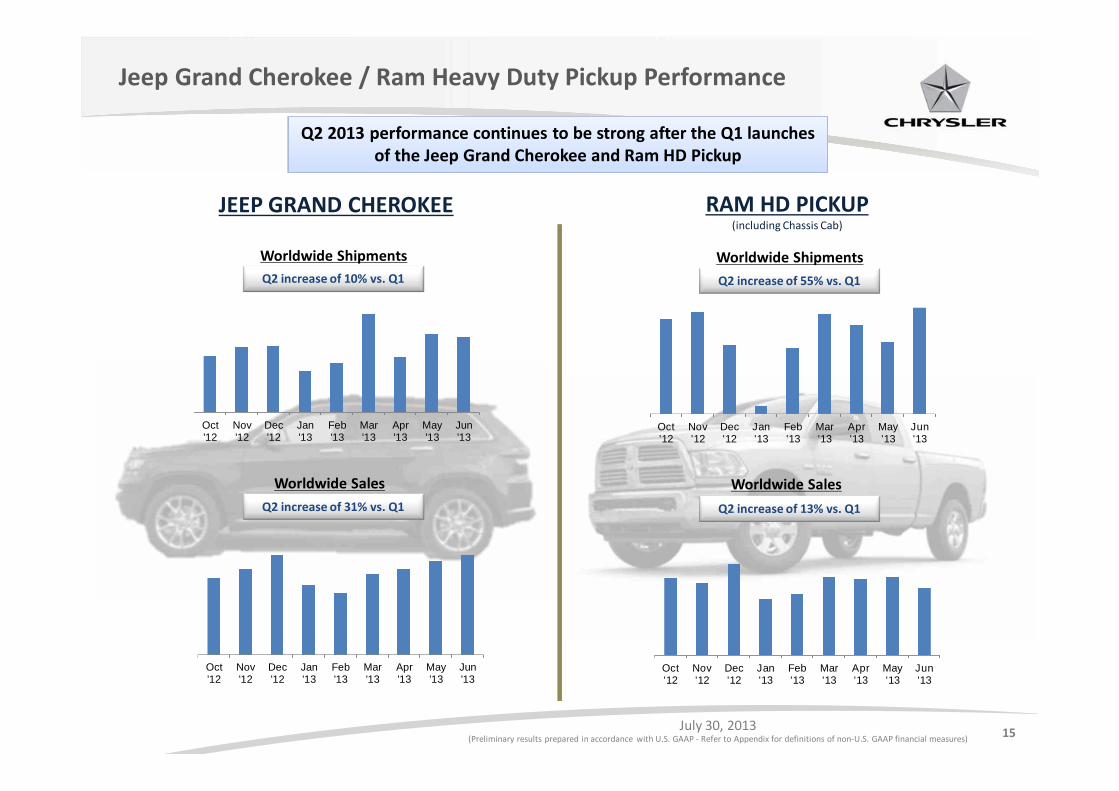
Q2 2013 performance continues to be strong after the Q1 launchesof the Jeep Grand Cherokee and Ram HD Pickup
Oct'12
Nov'12
Dec'12
Jan'13
Feb'13
Mar'13
Apr'13
May'13
Jun'13
Worldwide ShipmentsTrend
Oct'12
Nov'12
Dec'12
Jan'13
Feb'13
Mar'13
Apr'13
May'13
Jun'13
Worldwide Sales
Oct'12
Nov'12
Dec'12
Jan'13
Feb'13
Mar'13
Apr'13
May'13
Jun'13
Worldwide Sales
Q2 increase of 10% vs. Q1
Q2 increase of 31% vs. Q1
Q2 increase of 55% vs. Q1
Q2 increase of 13% vs. Q1
JEEP GRAND CHEROKEE RAM HD PICKUP(including Chassis Cab)
16July 30, 2013
(Preliminary results prepared in accordance with U.S. GAAP - Refer to Appendix for definitions of non-U.S. GAAP financial measures)
2014 Jeep Cherokee / Toledo North Assembly Plant
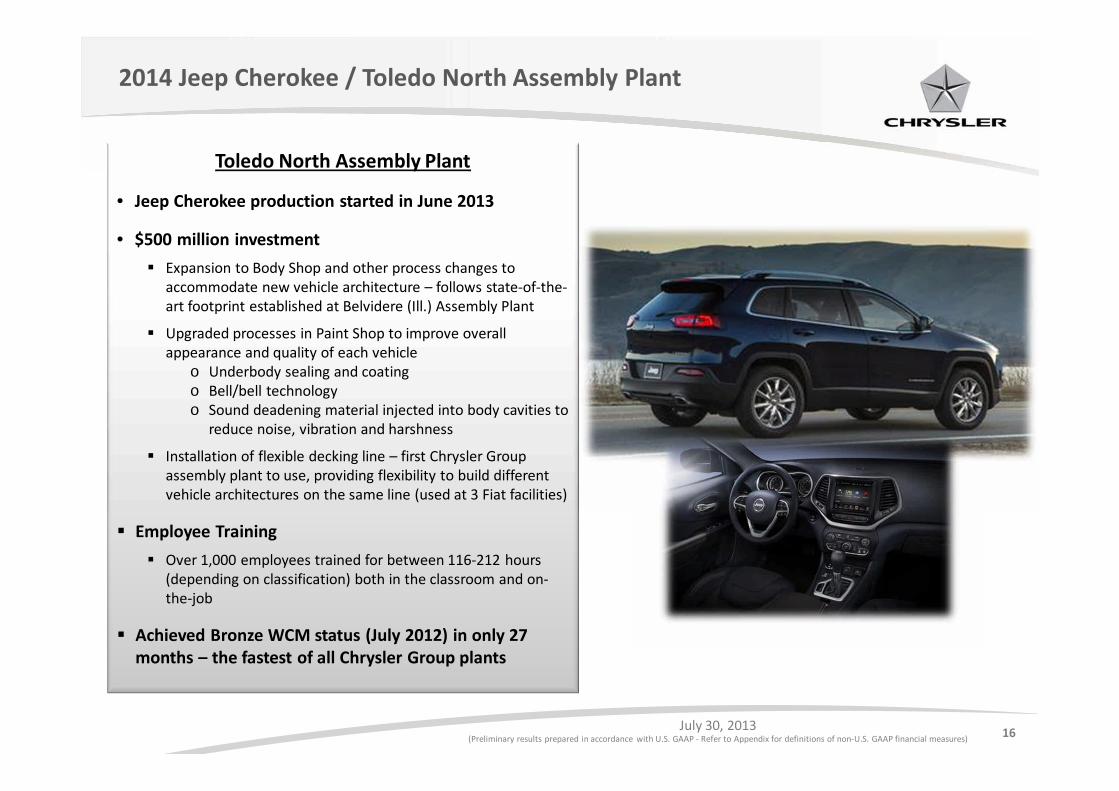
Toledo North Assembly Plant
• Jeep Cherokee production started in June 2013
• $500 million investment
Expansion to Body Shop and other process changes toaccommodate new vehicle architecture – follows state-of-the-art footprint established at Belvidere (Ill.) Assembly Plant
Upgraded processes in Paint Shop to improve overallappearance and quality of each vehicle
o Underbody sealing and coatingo Bell/bell technologyo Sound deadening material injected into body cavities to
reduce noise, vibration and harshness
Installation of flexible decking line – first Chrysler Groupassembly plant to use, providing flexibility to build differentvehicle architectures on the same line (used at 3 Fiat facilities)
Employee Training
Over 1,000 employees trained for between 116-212 hours(depending on classification) both in the classroom and on-the-job
Achieved Bronze WCM status (July 2012) in only 27months – the fastest of all Chrysler Group plants
17July 30, 2013
(Preliminary results prepared in accordance with U.S. GAAP - Refer to Appendix for definitions of non-U.S. GAAP financial measures)
2014 Dodge Durango
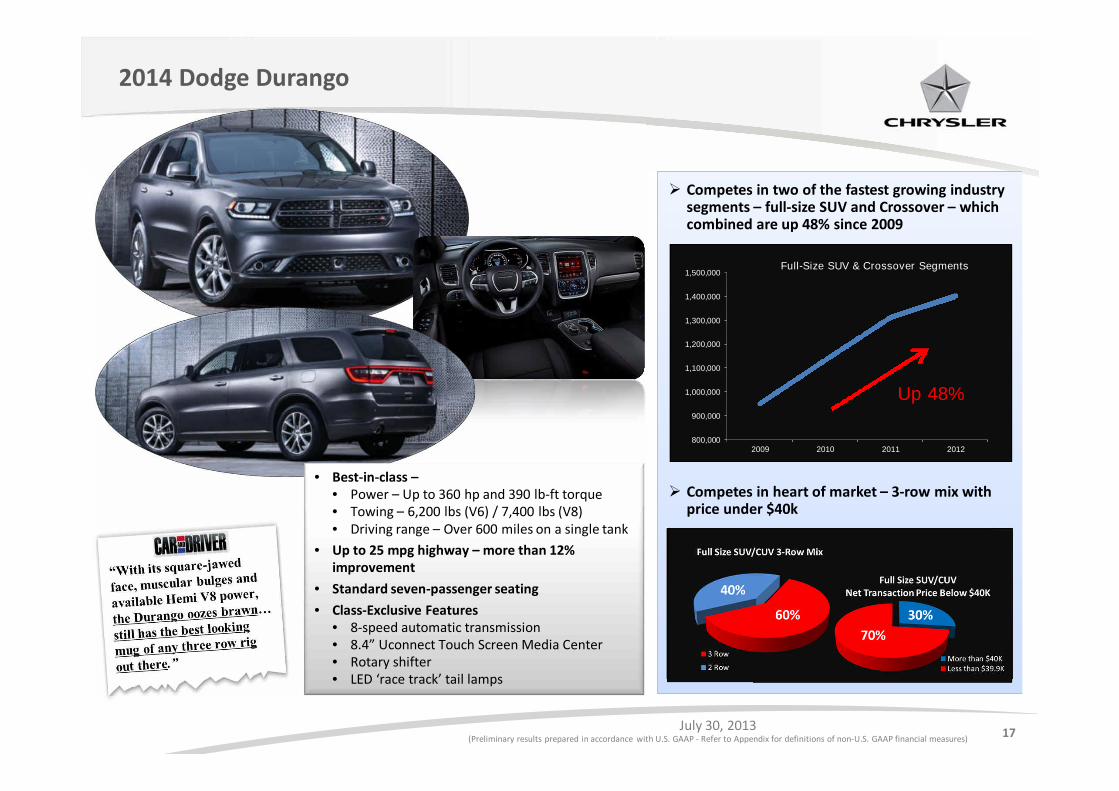
• Best-in-class –• Power – Up to 360 hp and 390 lb-ft torque• Towing – 6,200 lbs (V6) / 7,400 lbs (V8)• Driving range – Over 600 miles on a single tank
• Up to 25 mpg highway – more than 12%improvement
• Standard seven-passenger seating
• Class-Exclusive Features• 8-speed automatic transmission• 8.4” Uconnect Touch Screen Media Center• Rotary shifter• LED ‘race track’ tail lamps
Competes in two of the fastest growing industrysegments – full-size SUV and Crossover – whichcombined are up 48% since 2009
Competes in heart of market – 3-row mix withprice under $40k
800,000
900,000
1,000,000
1,100,000
1,200,000
1,300,000
1,400,000
1,500,000
2009 2010 2011 2012
Full-Size SUV & Crossover Segments
Up 48%
18July 30, 2013
(Preliminary results prepared in accordance with U.S. GAAP - Refer to Appendix for definitions of non-U.S. GAAP financial measures)
Fiat 500 and 500L in North America
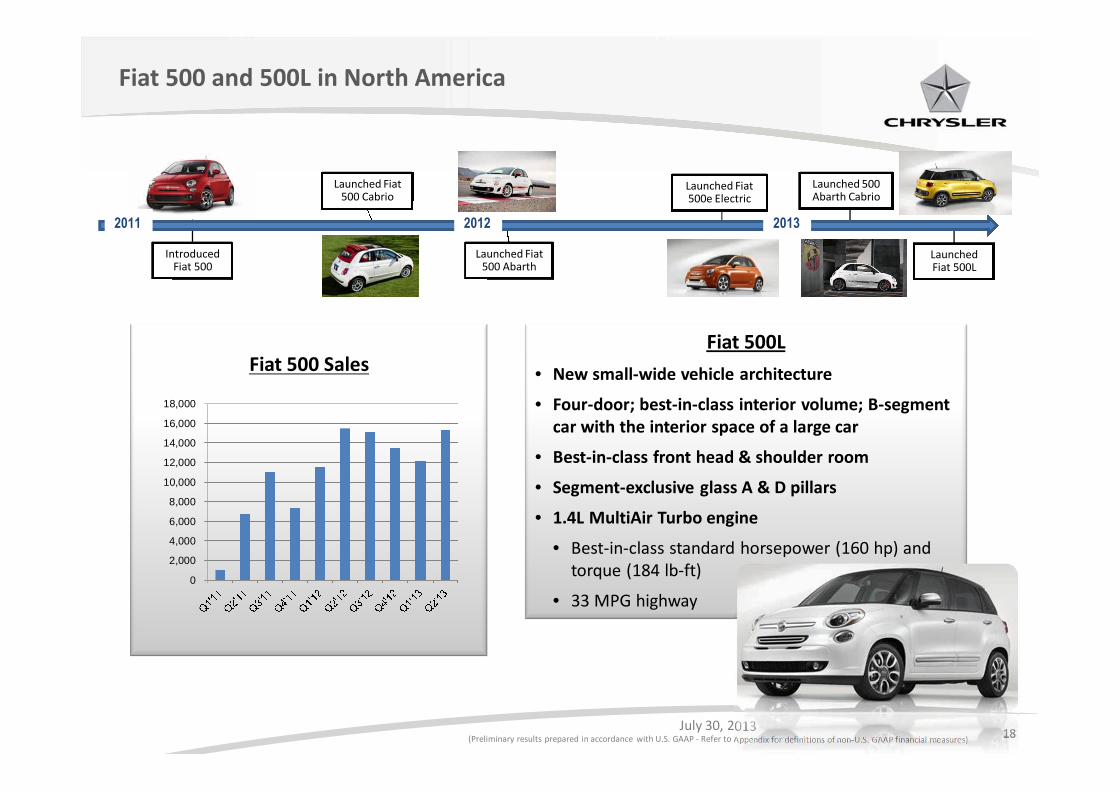
IntroducedFiat 500
2011 2012 2013
Launched Fiat500 Abarth
Launched Fiat500 Cabrio
Launched Fiat500e Electric
LaunchedFiat 500L
Fiat 500 Sales
0
2,000
4,000
6,000
8,000
10,000
12,000
14,000
16,000
18,000
Fiat 500L
• New small-wide vehicle architecture
• Four-door; best-in-class interior volume; B-segmentcar with the interior space of a large car
• Best-in-class front head & shoulder room
• Segment-exclusive glass A & D pillars
• 1.4L MultiAir Turbo engine
• Best-in-class standard horsepower (160 hp) andtorque (184 lb-ft)
• 33 MPG highway
Launched 500Abarth Cabrio
19July 30, 2013
(Preliminary results prepared in accordance with U.S. GAAP - Refer to Appendix for definitions of non-U.S. GAAP financial measures)
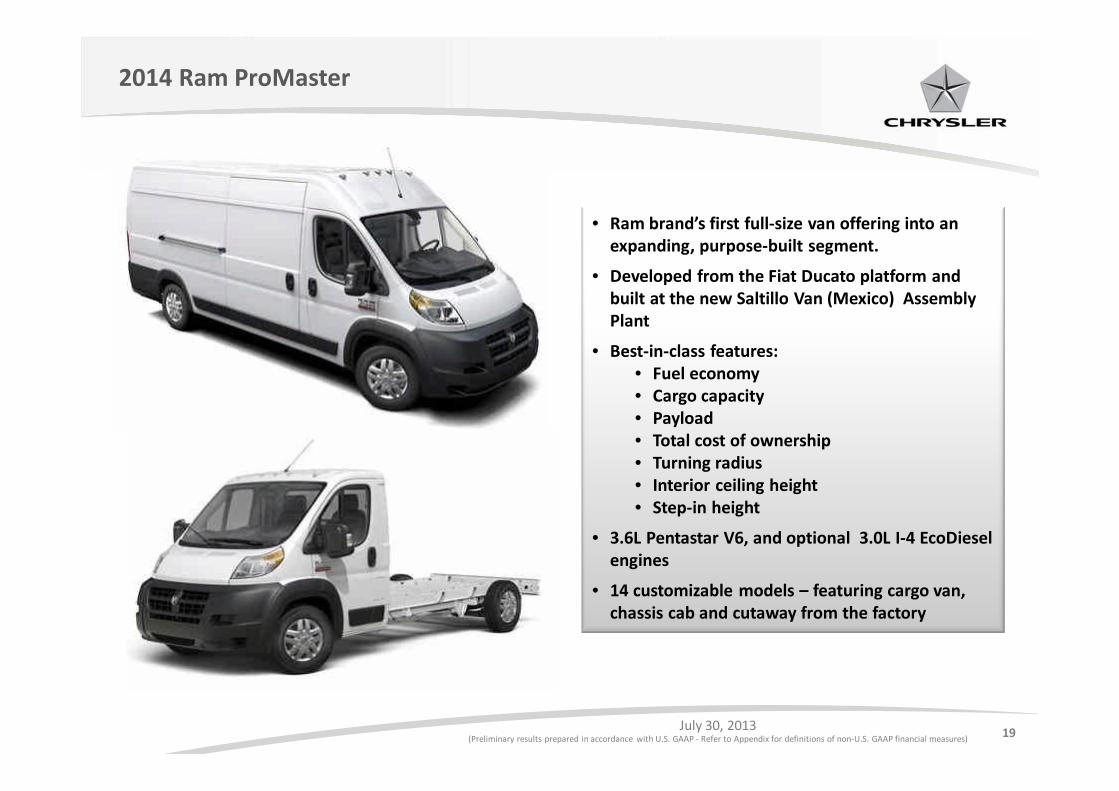
2014 Ram ProMaster
• Ram brand’s first full-size van offering into anexpanding, purpose-built segment.
• Developed from the Fiat Ducato platform andbuilt at the new Saltillo Van (Mexico) AssemblyPlant
• Best-in-class features:• Fuel economy• Cargo capacity• Payload• Total cost of ownership• Turning radius• Interior ceiling height• Step-in height
• 3.6L Pentastar V6, and optional 3.0L I-4 EcoDieselengines
• 14 customizable models – featuring cargo van,chassis cab and cutaway from the factory
20July 30, 2013
(Preliminary results prepared in accordance with U.S. GAAP - Refer to Appendix for definitions of non-U.S. GAAP financial measures)
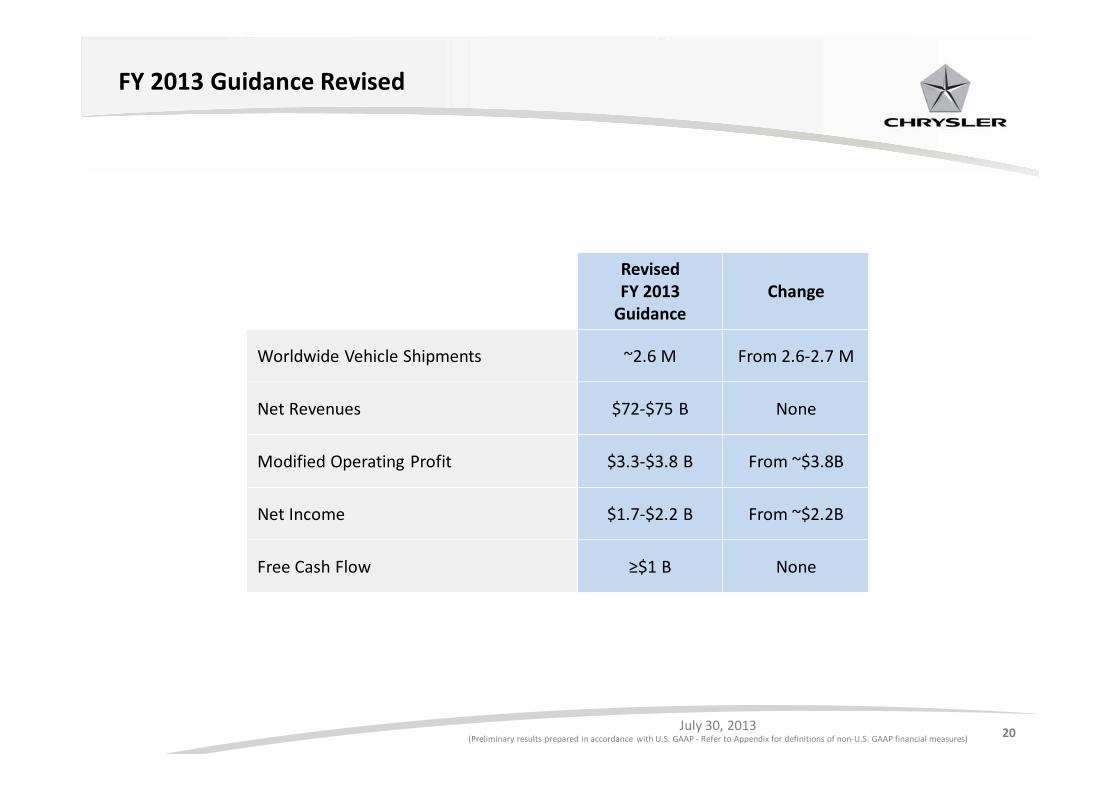
FY 2013 Guidance Revised
RevisedFY 2013
GuidanceChange
Worldwide Vehicle Shipments ~2.6 M From 2.6-2.7 M
Net Revenues $72-$75 B None
Modified Operating Profit $3.3-$3.8 B From ~$3.8B
Net Income $1.7-$2.2 B From ~$2.2B
Free Cash Flow ≥$1 B None

22July 30, 2013
(Preliminary results prepared in accordance with U.S. GAAP - Refer to Appendix for definitions of non-U.S. GAAP financial measures)
Appendix
23July 30, 2013
(Preliminary results prepared in accordance with U.S. GAAP - Refer to Appendix for definitions of non-U.S. GAAP financial measures)
NHTSA Recall Request Update
• August 2010 – NHTSA opened a Preliminary Evaluation, upgraded to an Engineering Analysis in June 2012,covering certain Jeep Cherokee, Jeep Grand Cherokee and Jeep Liberty vehicles with fuel tanks locatedbehind the rear axle
o Chrysler Group cooperated with NHTSA throughout the investigation, sharing data on incidents, engineeringspecifications and additional information, concluding at each stage that the subject vehicles are not defective
• June 4, 2013 – Chrysler Group responded to NHTSA recall request letter covering only the 1993-2004 JeepGrand Cherokee and 2002-2007 Jeep Liberty vehicles , noting its disagreement with NHTSA’s preliminaryfinding of defect and its intent to file a more detailed response supporting its position
• June 18, 2013 – Chrysler Group and NHTSA resolve their differences; Chrysler Group filed its response tothe recall request, maintaining that none of the subject vehicles were defective
o NHTSA agreed there will be no final finding of a defect in the subject vehicles and Chrysler Group agrees to undertake avoluntary safety recall to inspect and, if necessary, install a trailer hitch on 1993-1998 Jeep Grand Cherokee and 2002-2007 Jeep Liberty vehicles to provide incremental improvement for low-speed rear impacts
o Chrysler Group agreed to conduct a Customer Satisfaction Notification campaign to inspect aftermarket trailer hitchesinstalled on 1999-2004 Jeep Grand Cherokee vehicles and take corrective action, as necessary
• June 20, 2013 – Transportation Secretary Ray LaHood in a press interview notes the matter has beenresolved satisfactorily
24July 30, 2013
(Preliminary results prepared in accordance with U.S. GAAP - Refer to Appendix for definitions of non-U.S. GAAP financial measures)
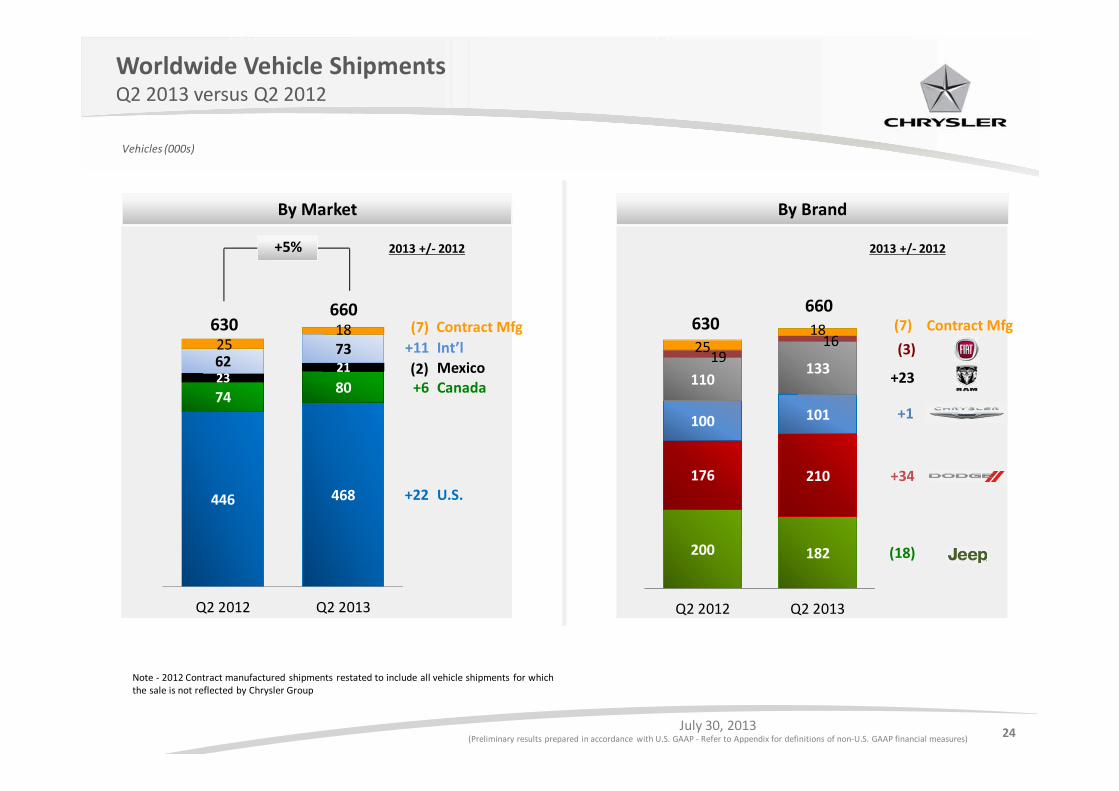
Worldwide Vehicle ShipmentsQ2 2013 versus Q2 2012
Vehicles (000s)
200 182
176 210
100 101
110133
191625
18
Q2 2012 Q2 2013
446 468
7480
232162732518
Q2 2012 Q2 2013
U.S.
CanadaMexico
Int’l
By Market By Brand
630660
+22
+6(2)
+11
2013 +/- 2012
(18)
+1
+23
(3)
2013 +/- 2012
+34
+5%
Contract Mfg(7) Contract Mfg(7)630660
Note - 2012 Contract manufactured shipments restated to include all vehicle shipments for whichthe sale is not reflected by Chrysler Group
25July 30, 2013
(Preliminary results prepared in accordance with U.S. GAAP - Refer to Appendix for definitions of non-U.S. GAAP financial measures)
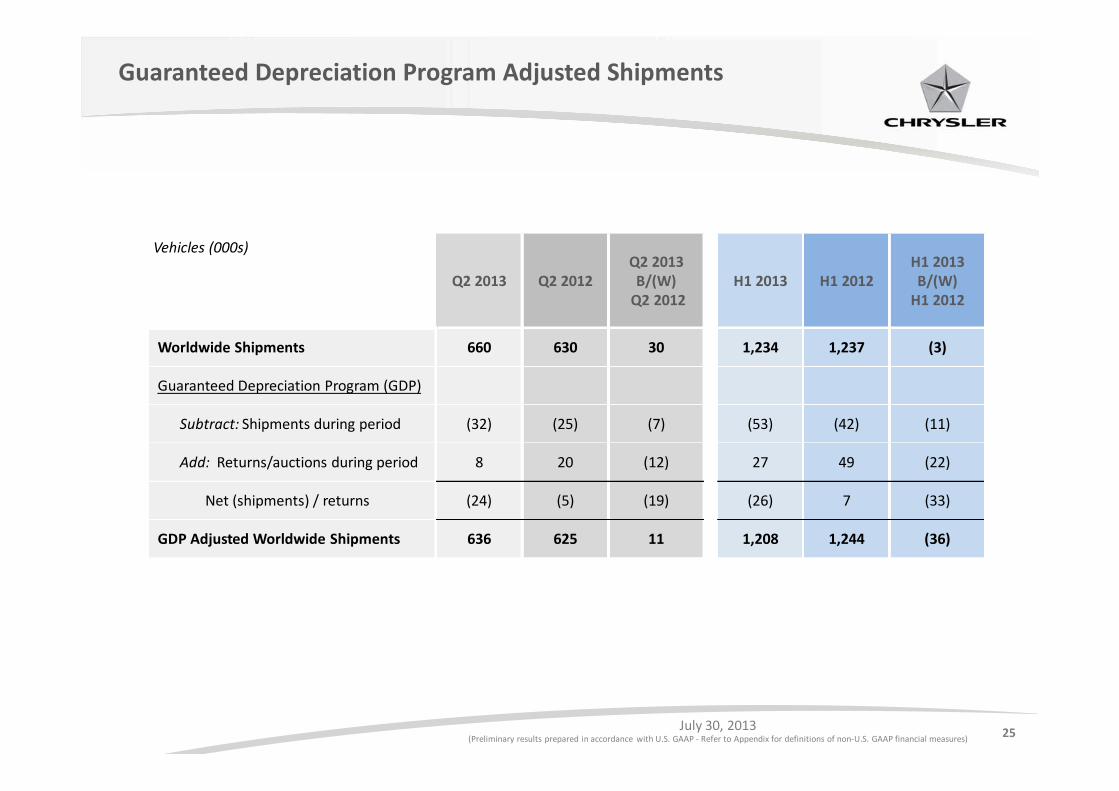
Guaranteed Depreciation Program Adjusted Shipments
Vehicles (000s)
Q2 2013 Q2 2012Q2 2013B/(W)
Q2 2012H1 2013 H1 2012
H1 2013B/(W)
H1 2012
Worldwide Shipments 660 630 30 1,234 1,237 (3)
Guaranteed Depreciation Program (GDP)
Subtract: Shipments during period (32) (25) (7) (53) (42) (11)
Add: Returns/auctions during period 8 20 (12) 27 49 (22)
Net (shipments) / returns (24) (5) (19) (26) 7 (33)
GDP Adjusted Worldwide Shipments 636 625 11 1,208 1,244 (36)
26July 30, 2013
(Preliminary results prepared in accordance with U.S. GAAP - Refer to Appendix for definitions of non-U.S. GAAP financial measures)
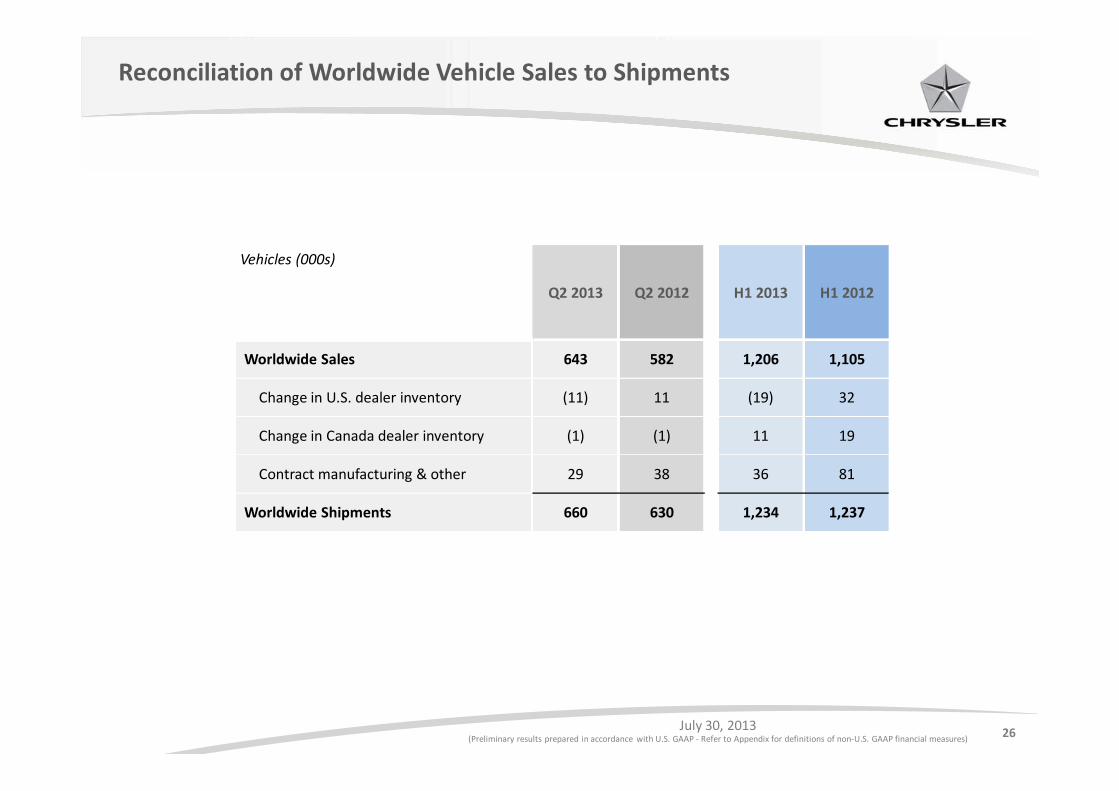
Reconciliation of Worldwide Vehicle Sales to Shipments
Vehicles (000s)
Q2 2013 Q2 2012 H1 2013 H1 2012
Worldwide Sales 643 582 1,206 1,105
Change in U.S. dealer inventory (11) 11 (19) 32
Change in Canada dealer inventory (1) (1) 11 19
Contract manufacturing & other 29 38 36 81
Worldwide Shipments 660 630 1,234 1,237
27July 30, 2013
(Preliminary results prepared in accordance with U.S. GAAP - Refer to Appendix for definitions of non-U.S. GAAP financial measures)
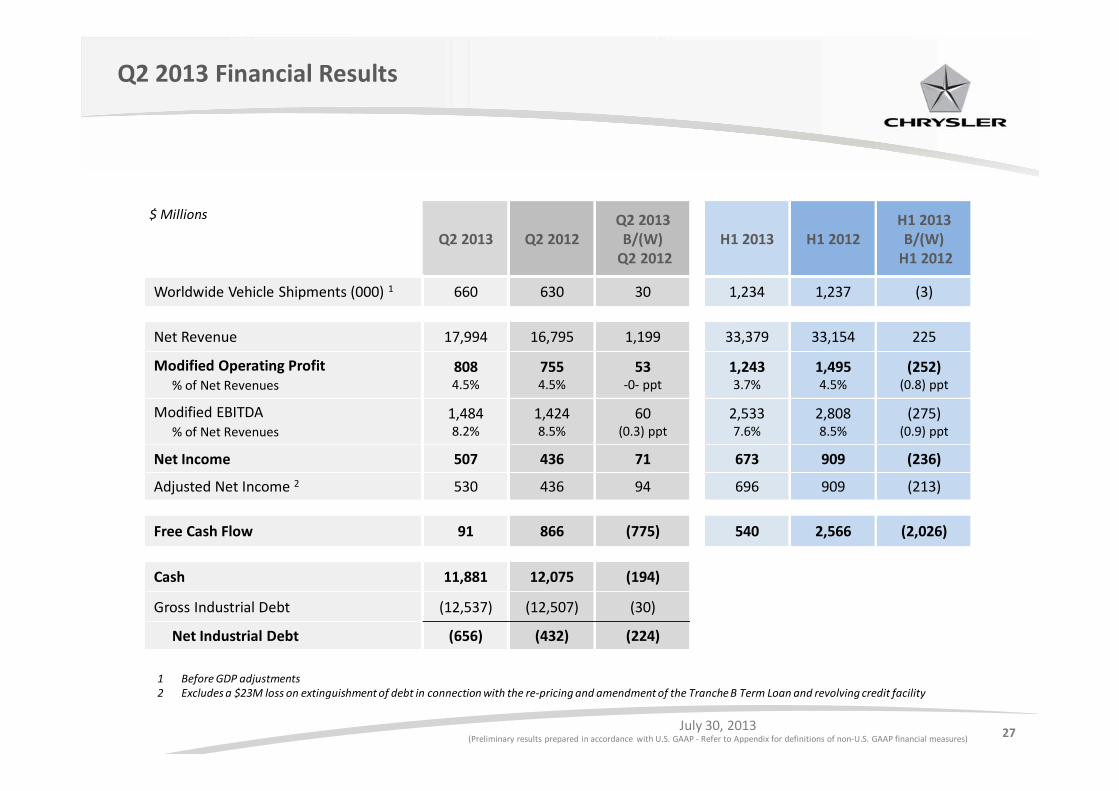
Q2 2013 Financial Results
$ Millions
Q2 2013 Q2 2012Q2 2013B/(W)
Q2 2012H1 2013 H1 2012
H1 2013B/(W)
H1 2012
Worldwide Vehicle Shipments (000) 1 660 630 30 1,234 1,237 (3)
Net Revenue 17,994 16,795 1,199 33,379 33,154 225
Modified Operating Profit% of Net Revenues
8084.5%
7554.5%
53-0- ppt
1,2433.7%
1,4954.5%
(252)(0.8) ppt
Modified EBITDA% of Net Revenues
1,4848.2%
1,4248.5%
60(0.3) ppt
2,5337.6%
2,8088.5%
(275)(0.9) ppt
Net Income 507 436 71 673 909 (236)
Adjusted Net Income 2 530 436 94 696 909 (213)
Free Cash Flow 91 866 (775) 540 2,566 (2,026)
Cash 11,881 12,075 (194)
Gross Industrial Debt (12,537) (12,507) (30)
Net Industrial Debt (656) (432) (224)
1 Before GDP adjustments2 Excludes a $23M loss on extinguishment of debt in connection with the re-pricing and amendment of the Tranche B Term Loan and revolving credit facility
28July 30, 2013
(Preliminary results prepared in accordance with U.S. GAAP - Refer to Appendix for definitions of non-U.S. GAAP financial measures)
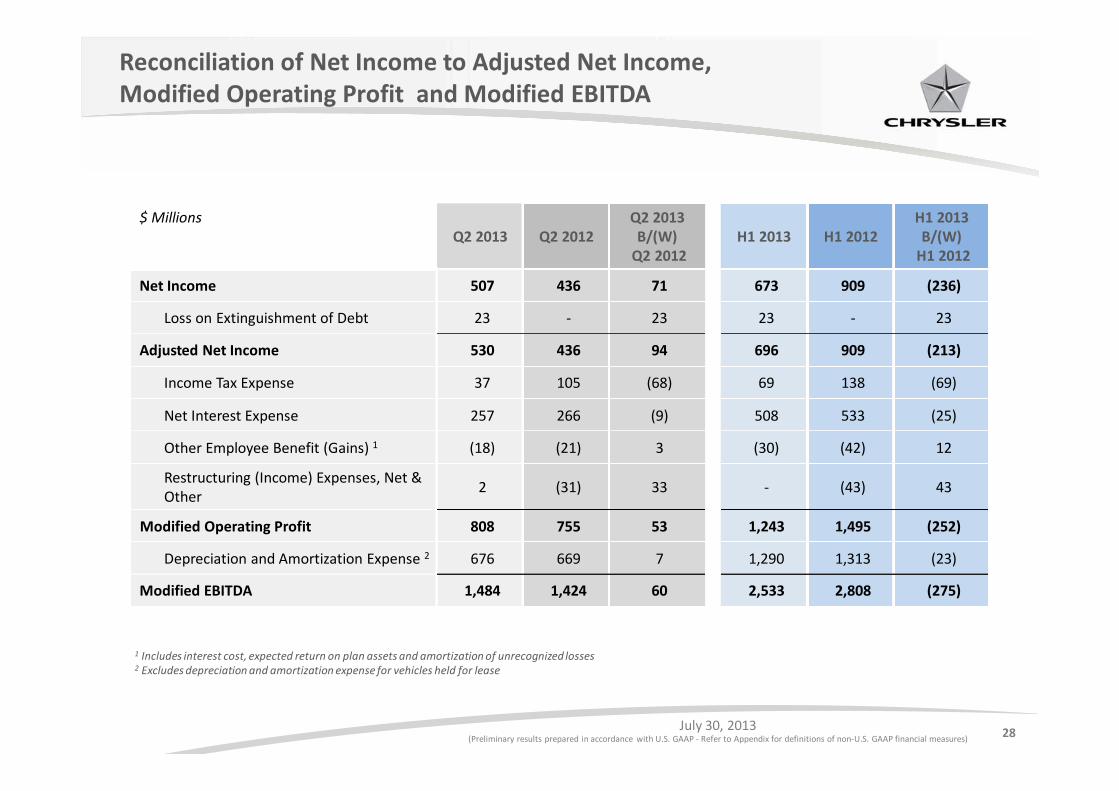
Reconciliation of Net Income to Adjusted Net Income,Modified Operating Profit and Modified EBITDA
$ MillionsQ2 2013 Q2 2012
Q2 2013B/(W)
Q2 2012H1 2013 H1 2012
H1 2013B/(W)
H1 2012
Net Income 507 436 71 673 909 (236)
Loss on Extinguishment of Debt 23 - 23 23 - 23
Adjusted Net Income 530 436 94 696 909 (213)
Income Tax Expense 37 105 (68) 69 138 (69)
Net Interest Expense 257 266 (9) 508 533 (25)
Other Employee Benefit (Gains) 1 (18) (21) 3 (30) (42) 12
Restructuring (Income) Expenses, Net &Other
2 (31) 33 - (43) 43
Modified Operating Profit 808 755 53 1,243 1,495 (252)
Depreciation and Amortization Expense 2 676 669 7 1,290 1,313 (23)
Modified EBITDA 1,484 1,424 60 2,533 2,808 (275)
1 Includes interest cost, expected return on plan assets and amortization of unrecognized losses2 Excludes depreciation and amortization expense for vehicles held for lease
29July 30, 2013
(Preliminary results prepared in accordance with U.S. GAAP - Refer to Appendix for definitions of non-U.S. GAAP financial measures)
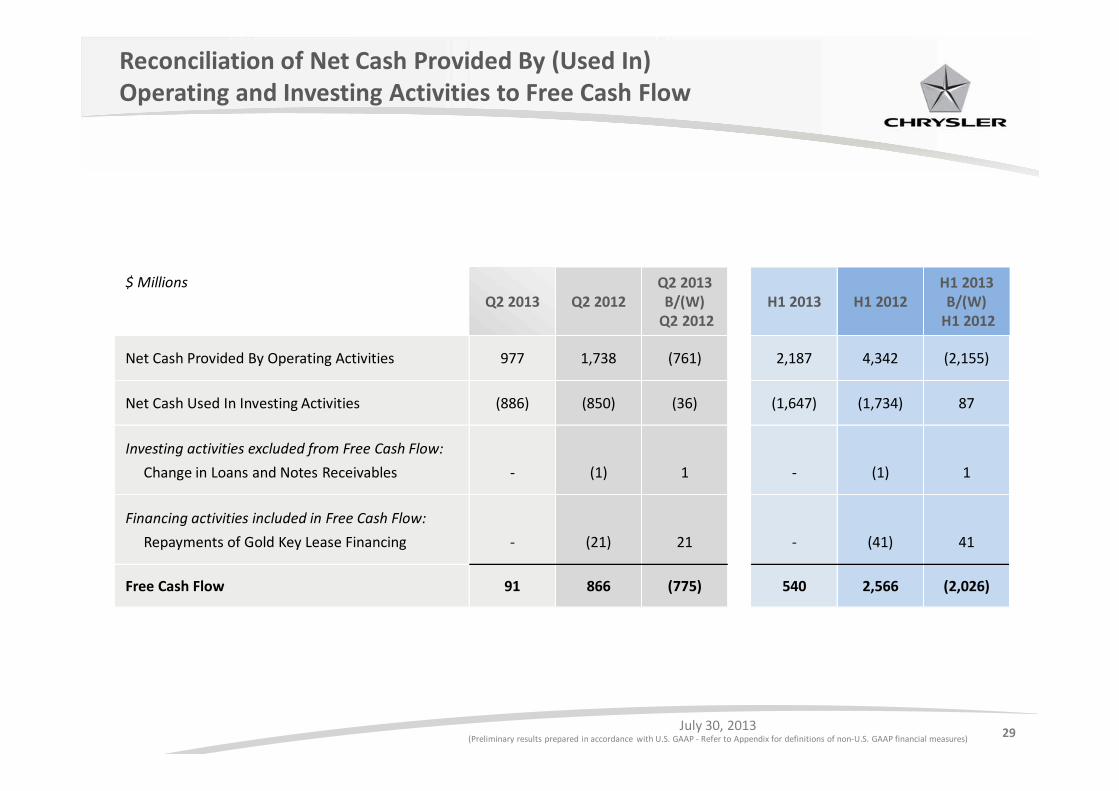
Reconciliation of Net Cash Provided By (Used In)Operating and Investing Activities to Free Cash Flow
$ MillionsQ2 2013 Q2 2012
Q2 2013B/(W)
Q2 2012H1 2013 H1 2012
H1 2013B/(W)
H1 2012
Net Cash Provided By Operating Activities 977 1,738 (761) 2,187 4,342 (2,155)
Net Cash Used In Investing Activities (886) (850) (36) (1,647) (1,734) 87
Investing activities excluded from Free Cash Flow:
Change in Loans and Notes Receivables - (1) 1 - (1) 1
Financing activities included in Free Cash Flow:
Repayments of Gold Key Lease Financing - (21) 21 - (41) 41
Free Cash Flow 91 866 (775) 540 2,566 (2,026)
30July 30, 2013
(Preliminary results prepared in accordance with U.S. GAAP - Refer to Appendix for definitions of non-U.S. GAAP financial measures)
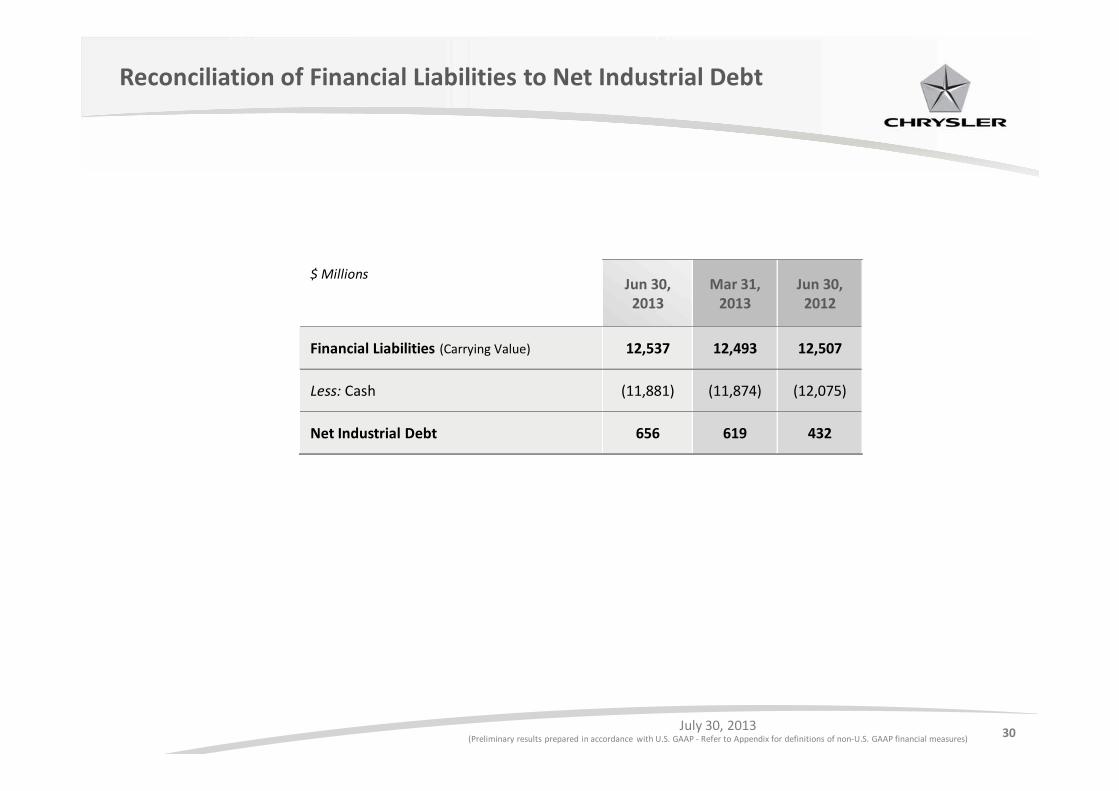
Reconciliation of Financial Liabilities to Net Industrial Debt
$ MillionsJun 30,
2013Mar 31,
2013Jun 30,
2012
Financial Liabilities (Carrying Value) 12,537 12,493 12,507
Less: Cash (11,881) (11,874) (12,075)
Net Industrial Debt 656 619 432
31July 30, 2013
(Preliminary results prepared in accordance with U.S. GAAP - Refer to Appendix for definitions of non-U.S. GAAP financial measures)
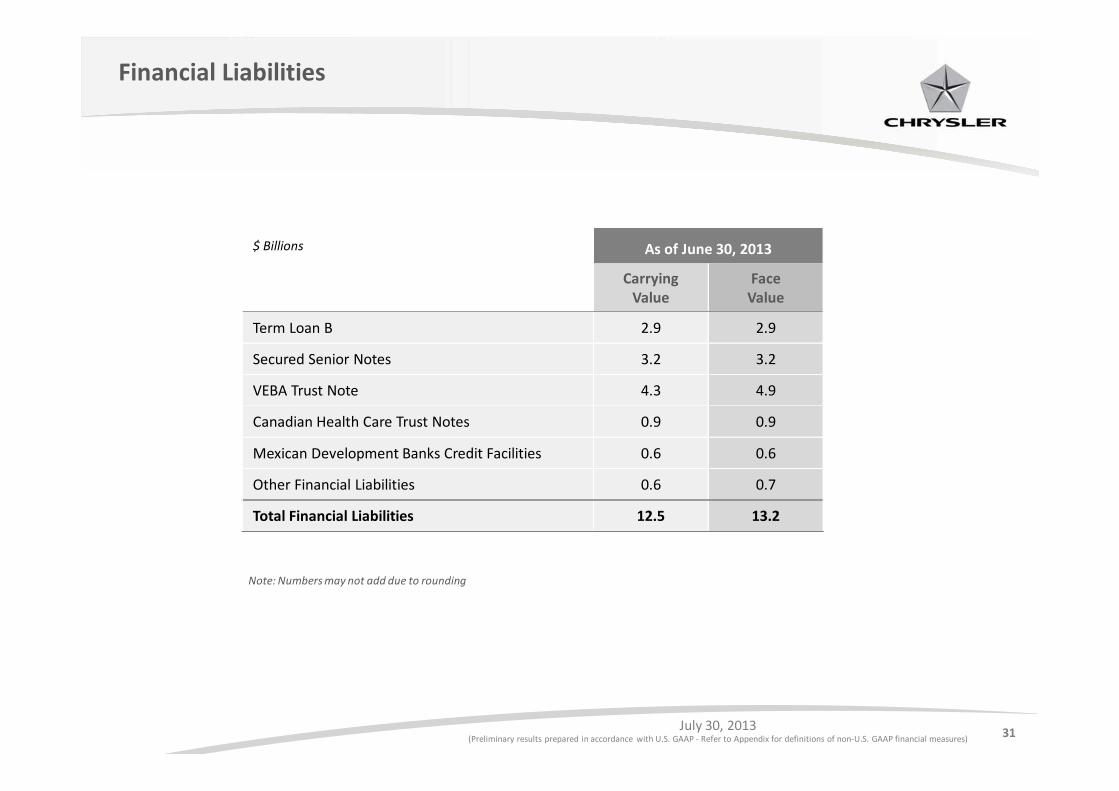
Financial Liabilities
$ Billions As of June 30, 2013
CarryingValue
FaceValue
Term Loan B 2.9 2.9
Secured Senior Notes 3.2 3.2
VEBA Trust Note 4.3 4.9
Canadian Health Care Trust Notes 0.9 0.9
Mexican Development Banks Credit Facilities 0.6 0.6
Other Financial Liabilities 0.6 0.7
Total Financial Liabilities 12.5 13.2
Note: Numbers may not add due to rounding
32July 30, 2013
(Preliminary results prepared in accordance with U.S. GAAP - Refer to Appendix for definitions of non-U.S. GAAP financial measures)
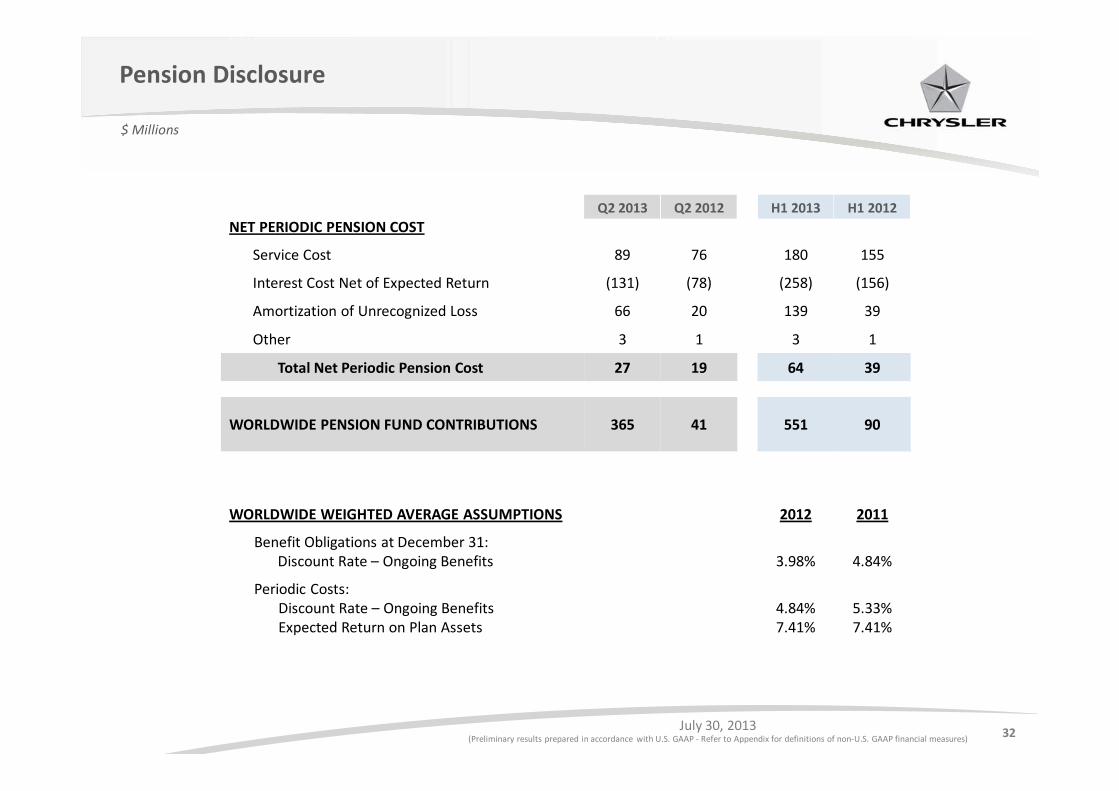
Pension Disclosure
$ Millions
NET PERIODIC PENSION COSTQ2 2013 Q2 2012 H1 2013 H1 2012
Service Cost 89 76 180 155
Interest Cost Net of Expected Return (131) (78) (258) (156)
Amortization of Unrecognized Loss 66 20 139 39
Other 3 1 3 1
Total Net Periodic Pension Cost 27 19 64 39
WORLDWIDE PENSION FUND CONTRIBUTIONS 365 41 551 90
WORLDWIDE WEIGHTED AVERAGE ASSUMPTIONS 2012 2011
Benefit Obligations at December 31:Discount Rate – Ongoing Benefits 3.98% 4.84%
Periodic Costs:Discount Rate – Ongoing BenefitsExpected Return on Plan Assets
4.84%7.41%
5.33%7.41%
33July 30, 2013
(Preliminary results prepared in accordance with U.S. GAAP - Refer to Appendix for definitions of non-U.S. GAAP financial measures)
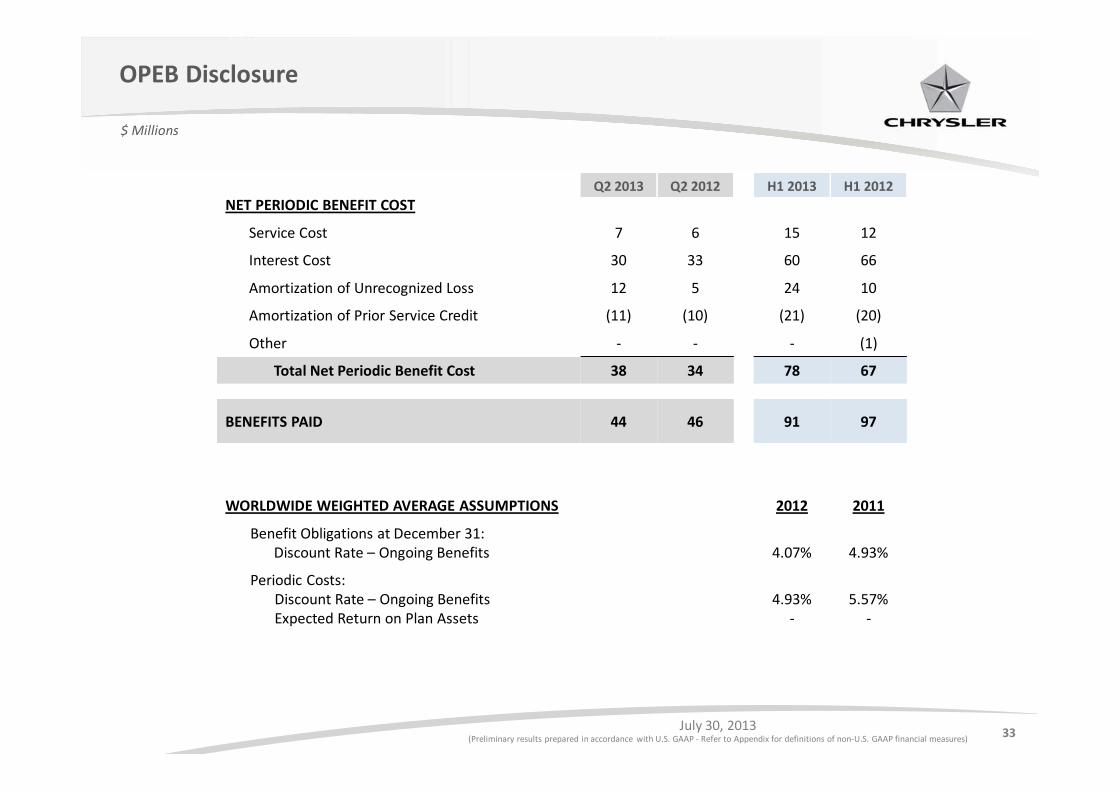
OPEB Disclosure
$ Millions
NET PERIODIC BENEFIT COSTQ2 2013 Q2 2012 H1 2013 H1 2012
Service Cost 7 6 15 12
Interest Cost 30 33 60 66
Amortization of Unrecognized Loss 12 5 24 10
Amortization of Prior Service Credit (11) (10) (21) (20)
Other - - - (1)
Total Net Periodic Benefit Cost 38 34 78 67
BENEFITS PAID 44 46 91 97
WORLDWIDE WEIGHTED AVERAGE ASSUMPTIONS 2012 2011
Benefit Obligations at December 31:Discount Rate – Ongoing Benefits 4.07% 4.93%
Periodic Costs:Discount Rate – Ongoing BenefitsExpected Return on Plan Assets
4.93%-
5.57%-
34July 30, 2013
(Preliminary results prepared in accordance with U.S. GAAP - Refer to Appendix for definitions of non-U.S. GAAP financial measures)
Non-U.S. GAAP Financial Information and Other Items
The following non-U.S. GAAP financial definitions apply when the presentation is referring to Adjusted Net Income,Modified Operating Profit, Modified EBITDA, Cash, Free Cash Flow and Gross and Net Industrial Debt
(a) Adjusted Net Income (Loss) is defined as net income (loss) excluding the impact of infrequent charges, which includes losses onextinguishment of debt. The reconciliation of net income to Adjusted Net Income, Modified Operating Profit and Modified EBITDA(defined below) for the three and six months ended June 30, 2013 and 2012 is detailed on page 28
(b) Modified Operating Profit (Loss) is computed starting with net income (loss) and then adjusting the amount to (i) add back income taxexpense and exclude income tax benefits, (ii) add back net interest expense (excluding interest expense related to financing activitiesassociated with the vehicle lease portfolio the Company refers to as Gold Key Lease), (iii) add back (exclude) all pension, otherpostretirement benefit (OPEB) and other employee benefit costs (gains) other than service costs, (iv) add back restructuring expenseand exclude restructuring income, (v) add back other financial expense, (vi) add back losses and exclude gains due to cumulativechange in accounting principles, and (vii) add back certain other costs, charges and expenses, which include the charges factored intothe calculation of Adjusted Net Income (Loss). The reconciliation of net income to Adjusted Net Income, Modified Operating Profit andModified EBITDA (defined below) for the three and six months ended June 30, 2013 and 2012 is detailed on page 28
(c) Modified EBITDA is computed starting with net income (loss) adjusted to Modified Operating Profit (Loss) as described above, andthen adding back depreciation and amortization expense (excluding depreciation and amortization expense for vehicles held forlease). The reconciliation of net income to Adjusted Net Income, Modified Operating Profit and Modified EBITDA for the three and sixmonths ended June 30, 2013 and 2012 is detailed on page 28
(d) Cash is defined as cash and cash equivalents
(e) Free Cash Flow is defined as cash flows from operating and investing activities, excluding any debt related investing activities,adjusted for financing activities related to Gold Key Lease. A reconciliation of net cash provided by (used in) operating and investingactivities to Free Cash Flow for the three and six months ended June 30, 2013 and 2012 is detailed on page 29
(f) Net Industrial Debt is defined as financial liabilities less Cash. A reconciliation of financial liabilities Net Industrial Debt at June 30,2013, March 31, 2013, and December 31, 2012, is detailed on page 30
35July 30, 2013
(Preliminary results prepared in accordance with U.S. GAAP - Refer to Appendix for definitions of non-U.S. GAAP financial measures)
Contacts
Chrysler Investor Relations
Timothy Krause phone: 248-512-2923
email: [email protected]
Chrysler Communications
Gualberto Ranieri phone: 248-512-2226
email: [email protected]
Website
www.chryslergroupllc.com


![Conference Call Results Q2 2015 - GEA engineering … Group Conference Call...Q2 12 Q3 12 Q4 12 Q1 13 Q2 13 Q3 13 Q4 13 Q1 14 Q2 14 Q3 14 Q4 14 Q1 15 Q2 15 [EURm] 1.06 1.05 1.07 1.05](https://img.pdfslide.net/doc/110x75/5f308a5968effd5a733a4c31/conference-call-results-q2-2015-gea-engineering-group-conference-call-q2-12.jpg)