Embed Size (px)
Citation preview

Presentation to analysts and investors | 28 October 2021
Q3 INTERIM MANAGEMENT
STATEMENT
1
Charlie Nunn
Group Chief Executive
Introduction
2
William Chalmers
Chief Financial Officer
Strategic and financial update
3
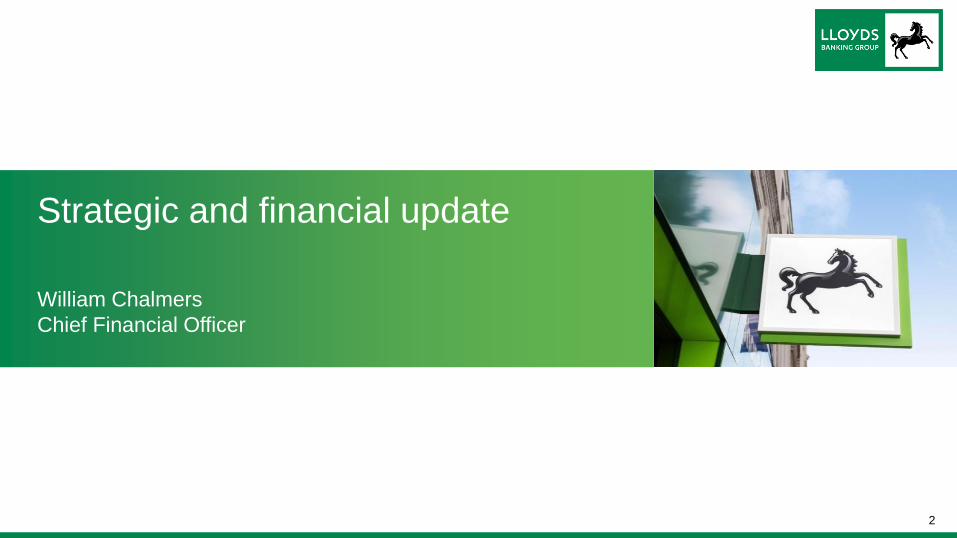
Enhanced capabilitiesCustomer ambitionsHelping Britain Recover
Exceeding £10bn first-time buyer
target (YTD: c.£13bn)
Increasing funding to Housing
Growth Partnership to support
£300m commitment for new homes
Introduced flagship fossil fuel-free
fund allowing pension investment
with positive environmental impact
Supporting businesses in start up
(>70k) and boosting digital
capabilities (>130k)
Preferred financial partner for
personal customers:
• >£15bn open book mortgage growth
• £5bn net new open book AuA in
Insurance & Wealth1 and enhancing
Wealth offering through acquisition of
Embark Group
• All channel NPS and mobile app
NPS above 2021 targets
Best bank for business:
• >50% growth in SME products
originated via a digital source
• Improved GBP rates ranking to 6th
(from FY20 10th)2
>25% increase in SME client
engagement following roll out of data-
driven targeted marketing in June
Improved merchant services
proposition delivering 12% new client
growth
Hybrid ways of working being
introduced and c.5% reduction in office
space, on track for 2021 target of 8%
Illustrative examples of YTD progress
Strong progress on Strategic Review 2021
1 – Excludes market movements. 2 – Combined Tradeweb and Bloomberg GBP IRS (Rates) ranking.
4
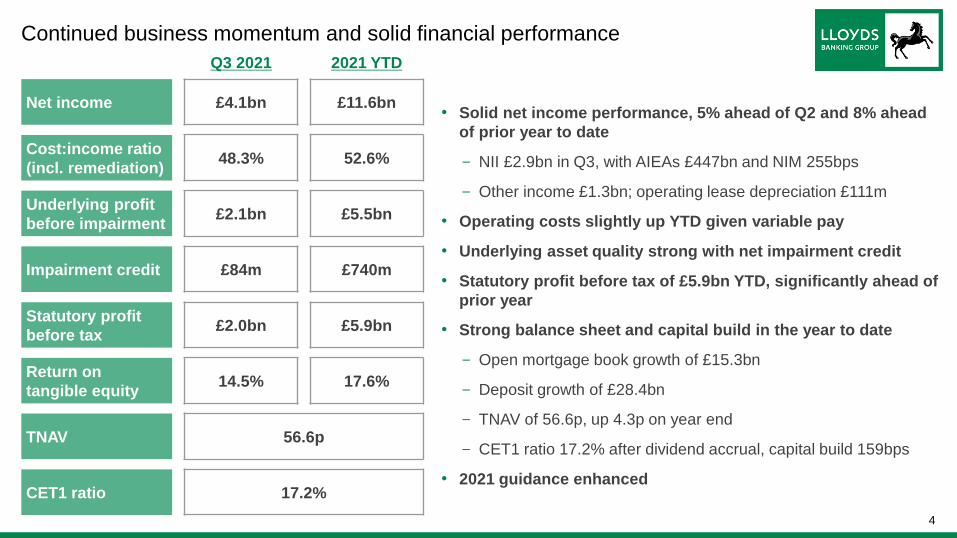
• Solid net income performance, 5% ahead of Q2 and 8% ahead
of prior year to date
- NII £2.9bn in Q3, with AIEAs £447bn and NIM 255bps
- Other income £1.3bn; operating lease depreciation £111m
• Operating costs slightly up YTD given variable pay
• Underlying asset quality strong with net impairment credit
• Statutory profit before tax of £5.9bn YTD, significantly ahead of
prior year
• Strong balance sheet and capital build in the year to date
- Open mortgage book growth of £15.3bn
- Deposit growth of £28.4bn
- TNAV of 56.6p, up 4.3p on year end
- CET1 ratio 17.2% after dividend accrual, capital build 159bps
• 2021 guidance enhanced
Continued business momentum and solid financial performance
Q3 2021 2021 YTD
Net income £4.1bn £11.6bn
Cost:income ratio
(incl. remediation)48.3% 52.6%
Underlying profit
before impairment£2.1bn £5.5bn
Impairment credit £84m £740m
Statutory profit
before tax£2.0bn £5.9bn
Return on
tangible equity14.5% 17.6%
TNAV 56.6p
CET1 ratio 17.2%
5
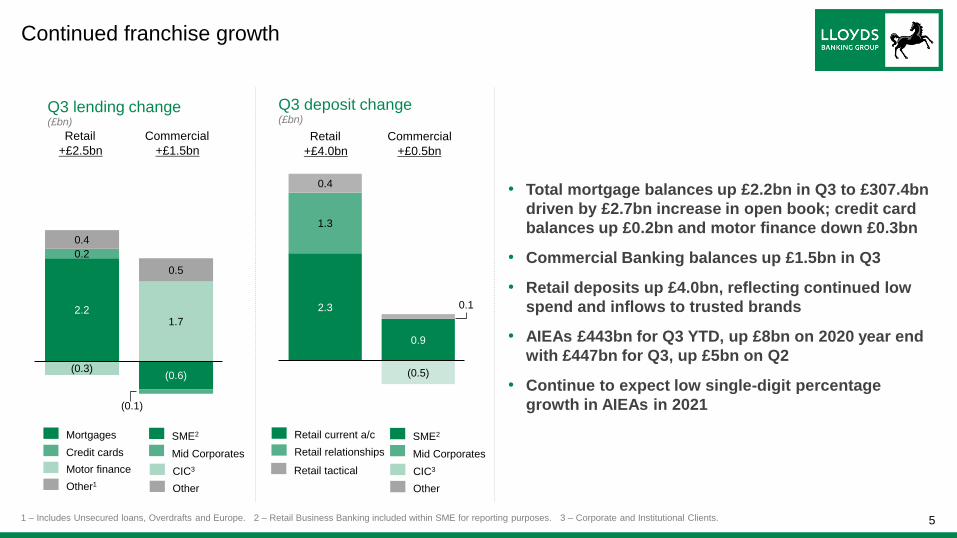
Continued franchise growth
2.2
(0.6)
0.2
(0.1)
(0.3)
1.7
0.4
0.5
• Total mortgage balances up £2.2bn in Q3 to £307.4bn
driven by £2.7bn increase in open book; credit card
balances up £0.2bn and motor finance down £0.3bn
• Commercial Banking balances up £1.5bn in Q3
• Retail deposits up £4.0bn, reflecting continued low
spend and inflows to trusted brands
• AIEAs £443bn for Q3 YTD, up £8bn on 2020 year end
with £447bn for Q3, up £5bn on Q2
• Continue to expect low single-digit percentage
growth in AIEAs in 2021
Q3 lending change(£bn)
Motor finance
Credit cards
Mortgages
Other1
Retail Commercial
2.3
0.9
1.3
(0.5)
0.4
0.1
Q3 deposit change(£bn)
Retail relationships
Retail current a/c
Retail Commercial
+£2.5bn +£1.5bn +£4.0bn +£0.5bn
Retail tactical
Mid Corporates
SME2
CIC3
Other
1 – Includes Unsecured loans, Overdrafts and Europe. 2 – Retail Business Banking included within SME for reporting purposes. 3 – Corporate and Institutional Clients.
Mid Corporates
SME2
CIC3
Other
6
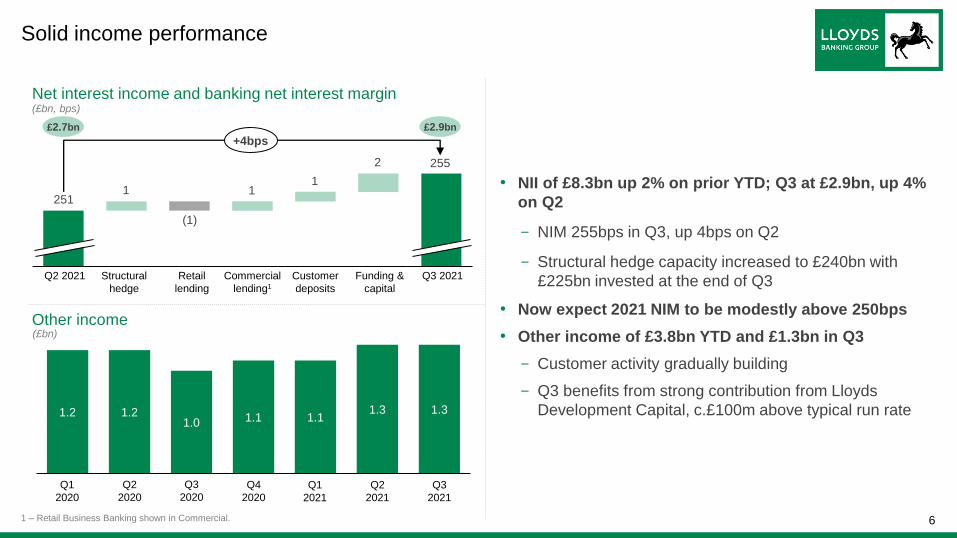
Net interest income and banking net interest margin(£bn, bps)
• NII of £8.3bn up 2% on prior YTD; Q3 at £2.9bn, up 4%
on Q2
- NIM 255bps in Q3, up 4bps on Q2
- Structural hedge capacity increased to £240bn with
£225bn invested at the end of Q3
• Now expect 2021 NIM to be modestly above 250bps
• Other income of £3.8bn YTD and £1.3bn in Q3
- Customer activity gradually building
- Q3 benefits from strong contribution from Lloyds
Development Capital, c.£100m above typical run rate
Solid income performance
1 – Retail Business Banking shown in Commercial.
Structural
hedge
Q2 2021
251
Q3 2021
255
(1)
Retail
lending
Commercial
lending1
11
Funding &
capital
2
Customer
deposits
1
£2.7bn £2.9bn
+4bps
(£bn)
1.31.31.11.11.0
1.21.2
Q1
2020
Q4
2020
Q2
2020
Q3
2020Q1
2021
Q2
2021
Other income
Q3
2021
7
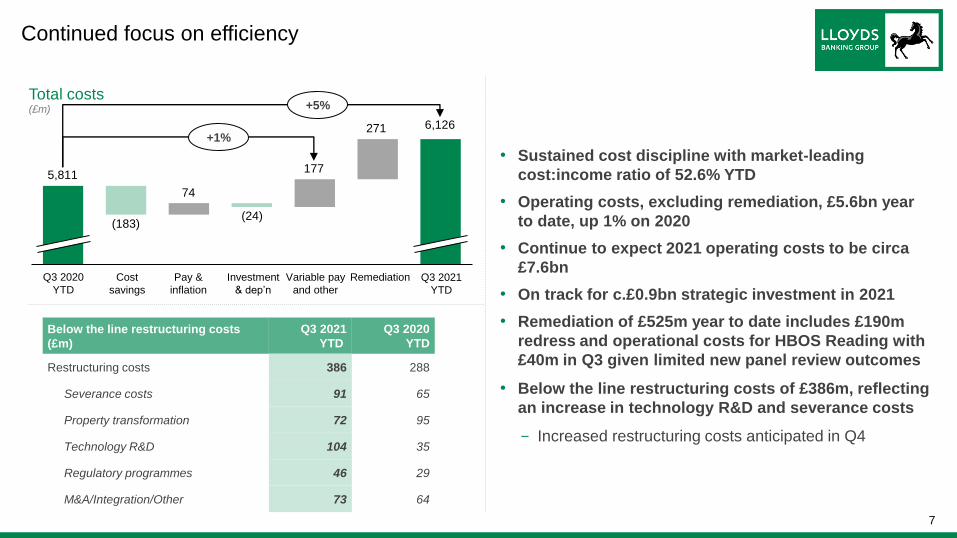
Total costs(£m)
Continued focus on efficiency
Pay &
inflation
Cost
savings
Q3 2020
YTD
Investment
& dep’n
Q3 2021
YTD
5,811
74
6,126
(183)(24)
+5%
Remediation
271
Variable pay
and other
177
+1%
• Sustained cost discipline with market-leading
cost:income ratio of 52.6% YTD
• Operating costs, excluding remediation, £5.6bn year
to date, up 1% on 2020
• Continue to expect 2021 operating costs to be circa
£7.6bn
• On track for c.£0.9bn strategic investment in 2021
• Remediation of £525m year to date includes £190m
redress and operational costs for HBOS Reading with
£40m in Q3 given limited new panel review outcomes
• Below the line restructuring costs of £386m, reflecting
an increase in technology R&D and severance costs
- Increased restructuring costs anticipated in Q4
Below the line restructuring costs
(£m)
Q3 2021
YTD
Q3 2020
YTD
Restructuring costs 386 288
Severance costs 91 65
Property transformation 72 95
Technology R&D 104 35
Regulatory programmes 46 29
M&A/Integration/Other 73 64
8
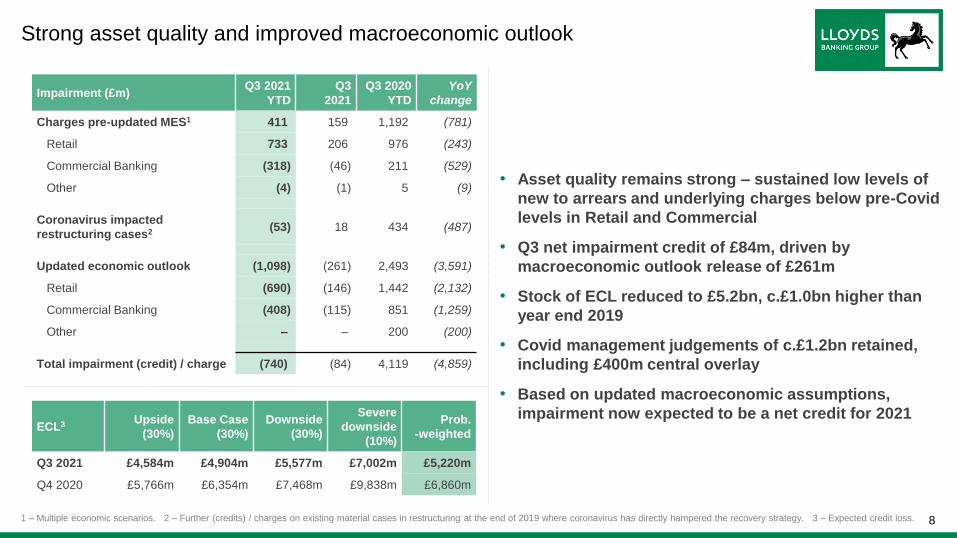
• Asset quality remains strong – sustained low levels of
new to arrears and underlying charges below pre-Covid
levels in Retail and Commercial
• Q3 net impairment credit of £84m, driven by
macroeconomic outlook release of £261m
• Stock of ECL reduced to £5.2bn, c.£1.0bn higher than
year end 2019
• Covid management judgements of c.£1.2bn retained,
including £400m central overlay
• Based on updated macroeconomic assumptions,
impairment now expected to be a net credit for 2021
Impairment (£m)Q3 2021
YTD
Q3
2021
Q3 2020
YTD
YoY
change
Charges pre-updated MES1 411 159 1,192 (781)
Retail 733 206 976 (243)
Commercial Banking (318) (46) 211 (529)
Other (4) (1) 5 (9)
Coronavirus impacted
restructuring cases2 (53) 18 434 (487)
Updated economic outlook (1,098) (261) 2,493 (3,591)
Retail (690) (146) 1,442 (2,132)
Commercial Banking (408) (115) 851 (1,259)
Other – – 200 (200)
Total impairment (credit) / charge (740) (84) 4,119 (4,859)
ECL3 Upside
(30%)
Base Case
(30%)
Downside
(30%)
Severe
downside
(10%)
Prob.
-weighted
Q3 2021 £4,584m £4,904m £5,577m £7,002m £5,220m
Q4 2020 £5,766m £6,354m £7,468m £9,838m £6,860m
Strong asset quality and improved macroeconomic outlook
1 – Multiple economic scenarios. 2 – Further (credits) / charges on existing material cases in restructuring at the end of 2019 where coronavirus has directly hampered the recovery strategy. 3 – Expected credit loss.
9
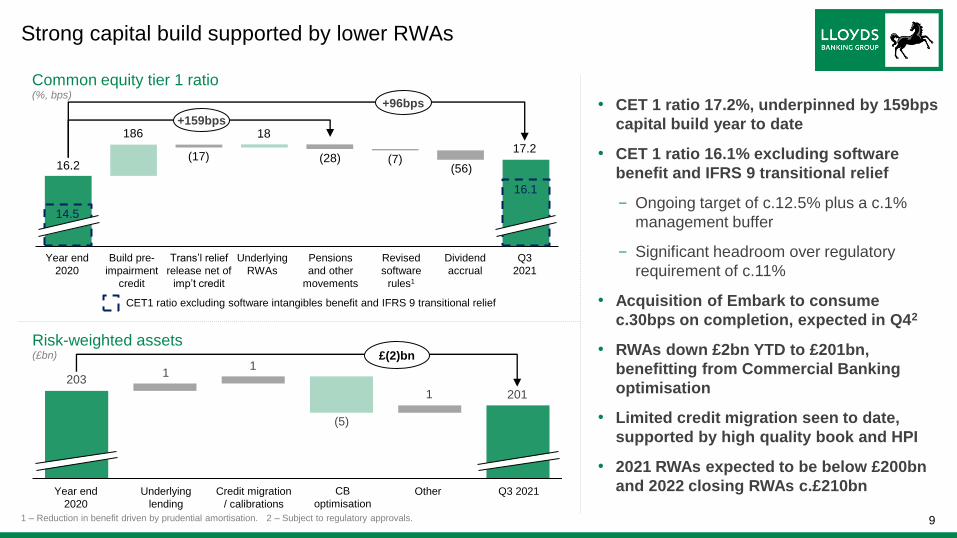
Strong capital build supported by lower RWAs
Common equity tier 1 ratio(%, bps)
Build pre-
impairment
credit
Year end
2020
(17)
18
Trans’l relief
release net of
imp’t credit
Revised
software
rules1
+96bps
16.2
17.2
Underlying
RWAs
186
(56)
Pensions
and other
movements
16.1
Q3
2021
(28)
14.5
CET1 ratio excluding software intangibles benefit and IFRS 9 transitional relief
Dividend
accrual
(7)
+159bps
• CET 1 ratio 17.2%, underpinned by 159bps
capital build year to date
• CET 1 ratio 16.1% excluding software
benefit and IFRS 9 transitional relief
- Ongoing target of c.12.5% plus a c.1%
management buffer
- Significant headroom over regulatory
requirement of c.11%
• Acquisition of Embark to consume
c.30bps on completion, expected in Q42
• RWAs down £2bn YTD to £201bn,
benefitting from Commercial Banking
optimisation
• Limited credit migration seen to date,
supported by high quality book and HPI
• 2021 RWAs expected to be below £200bn
and 2022 closing RWAs c.£210bn
Risk-weighted assets (£bn)
Year end
2020
Q3 2021
1
Other
£(2)bn
203
201
Credit migration
/ calibrations
Underlying
lending
11
(5)
CB
optimisation
1 – Reduction in benefit driven by prudential amortisation. 2 – Subject to regulatory approvals.
10
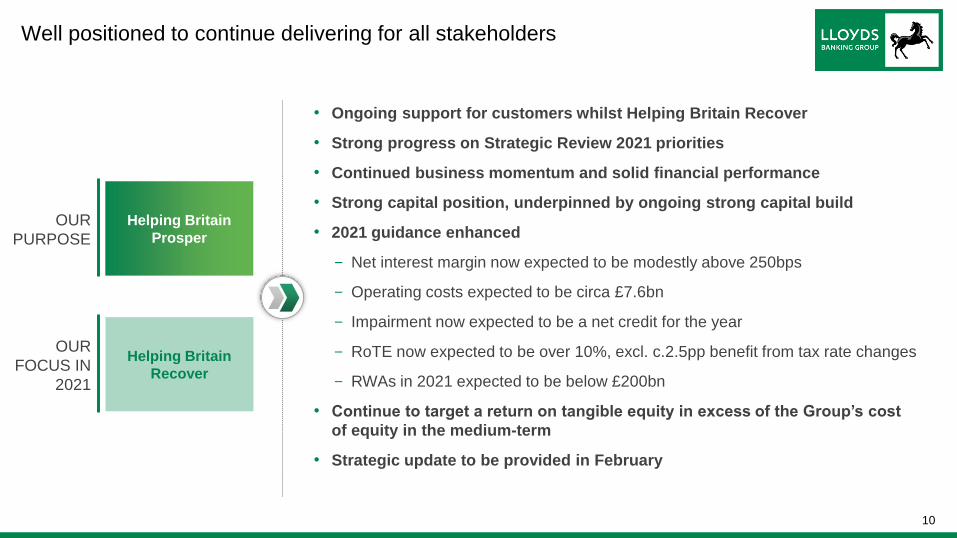
OUR
PURPOSE
Helping Britain
Prosper
Well positioned to continue delivering for all stakeholders
OUR
FOCUS IN
2021
Helping Britain
Recover
• Ongoing support for customers whilst Helping Britain Recover
• Strong progress on Strategic Review 2021 priorities
• Continued business momentum and solid financial performance
• Strong capital position, underpinned by ongoing strong capital build
• 2021 guidance enhanced
- Net interest margin now expected to be modestly above 250bps
- Operating costs expected to be circa £7.6bn
- Impairment now expected to be a net credit for the year
- RoTE now expected to be over 10%, excl. c.2.5pp benefit from tax rate changes
- RWAs in 2021 expected to be below £200bn
• Continue to target a return on tangible equity in excess of the Group’s cost
of equity in the medium-term
• Strategic update to be provided in February

11
Questions and Answers

12
Appendix 1: IFRS 17
13
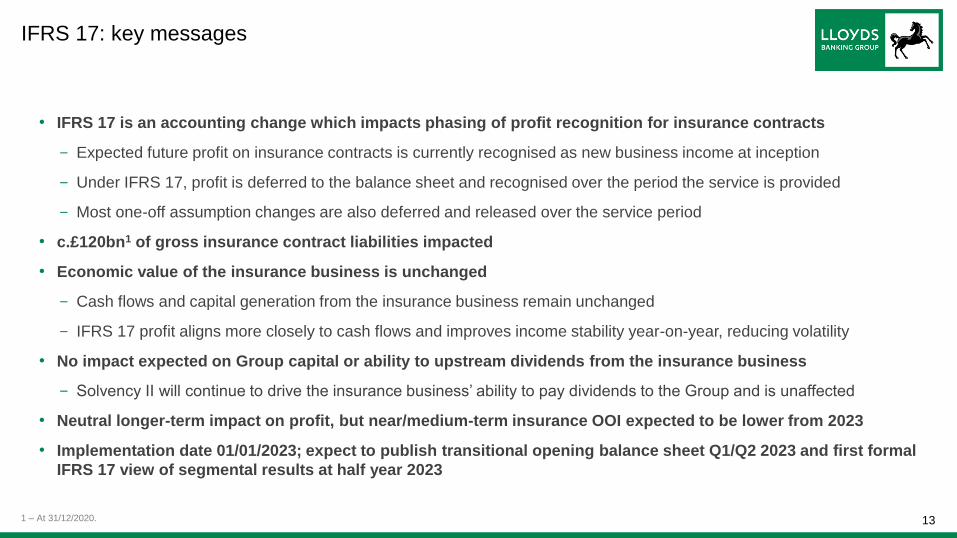
IFRS 17: key messages
• IFRS 17 is an accounting change which impacts phasing of profit recognition for insurance contracts
- Expected future profit on insurance contracts is currently recognised as new business income at inception
- Under IFRS 17, profit is deferred to the balance sheet and recognised over the period the service is provided
- Most one-off assumption changes are also deferred and released over the service period
• c.£120bn1 of gross insurance contract liabilities impacted
• Economic value of the insurance business is unchanged
- Cash flows and capital generation from the insurance business remain unchanged
- IFRS 17 profit aligns more closely to cash flows and improves income stability year-on-year, reducing volatility
• No impact expected on Group capital or ability to upstream dividends from the insurance business
- Solvency II will continue to drive the insurance business’ ability to pay dividends to the Group and is unaffected
• Neutral longer-term impact on profit, but near/medium-term insurance OOI expected to be lower from 2023
• Implementation date 01/01/2023; expect to publish transitional opening balance sheet Q1/Q2 2023 and first formal
IFRS 17 view of segmental results at half year 2023
1 – At 31/12/2020.
14
0.40.91.0
0.61.1
1.8
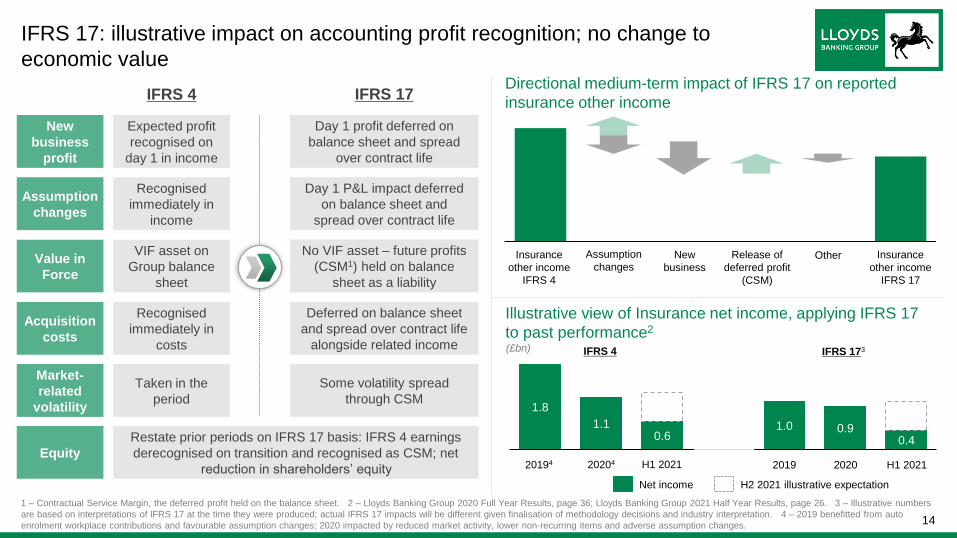
IFRS 17: illustrative impact on accounting profit recognition; no change to
economic value
1 – Contractual Service Margin, the deferred profit held on the balance sheet. 2 – Lloyds Banking Group 2020 Full Year Results, page 36; Lloyds Banking Group 2021 Half Year Results, page 26. 3 – Illustrative numbers
are based on interpretations of IFRS 17 at the time they were produced; actual IFRS 17 impacts will be different given finalisation of methodology decisions and industry interpretation. 4 – 2019 benefitted from auto
enrolment workplace contributions and favourable assumption changes; 2020 impacted by reduced market activity, lower non-recurring items and adverse assumption changes.
Illustrative view of Insurance net income, applying IFRS 17
to past performance2
Directional medium-term impact of IFRS 17 on reported
insurance other income
Insurance
other income
IFRS 4
Insurance
other income
IFRS 17
Release of
deferred profit
(CSM)
New
businessOtherAssumption
changes
20194 20204 H1 2021 2019 2020 H1 2021
IFRS 4 IFRS 173(£bn)
H2 2021 illustrative expectationNet income
IFRS 4 IFRS 17
Expected profit
recognised on
day 1 in income
Equity
Acquisition
costs
Value in
Force
Assumption
changes
New
business
profit
Recognised
immediately in
income
VIF asset on
Group balance
sheet
Recognised
immediately in
costs
Day 1 profit deferred on
balance sheet and spread
over contract life
Day 1 P&L impact deferred
on balance sheet and
spread over contract life
No VIF asset – future profits
(CSM1) held on balance
sheet as a liability
Deferred on balance sheet
and spread over contract life
alongside related income
Restate prior periods on IFRS 17 basis: IFRS 4 earnings
derecognised on transition and recognised as CSM; net
reduction in shareholders’ equity
Market-
related
volatility
Taken in the
period
Some volatility spread
through CSM
15
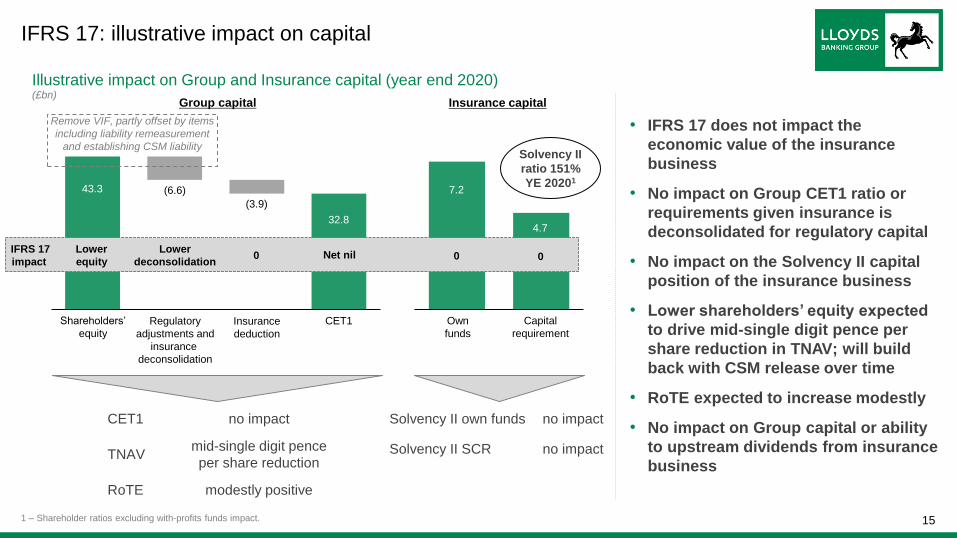
IFRS 17: illustrative impact on capital
Shareholders’
equityRegulatory
adjustments and
insurance
deconsolidation
CET1
43.3 (6.6)
32.8
Own
funds
Capital
requirement
7.2
4.7
Lower
equity
Lower
deconsolidation0
IFRS 17
impact 0 0
Solvency II
ratio 151%
YE 20201
Illustrative impact on Group and Insurance capital (year end 2020)(£bn)
Insurance
deduction
(3.9)
Net nil
1 – Shareholder ratios excluding with-profits funds impact.
CET1 no impact
TNAVmid-single digit pence
per share reduction
RoTE modestly positive
Solvency II own funds no impact
Solvency II SCR no impact
Remove VIF, partly offset by items
including liability remeasurement
and establishing CSM liability
• IFRS 17 does not impact the
economic value of the insurance
business
• No impact on Group CET1 ratio or
requirements given insurance is
deconsolidated for regulatory capital
• No impact on the Solvency II capital
position of the insurance business
• Lower shareholders’ equity expected
to drive mid-single digit pence per
share reduction in TNAV; will build
back with CSM release over time
• RoTE expected to increase modestly
• No impact on Group capital or ability
to upstream dividends from insurance
business
Group capital Insurance capital
16
Appendix 2
17
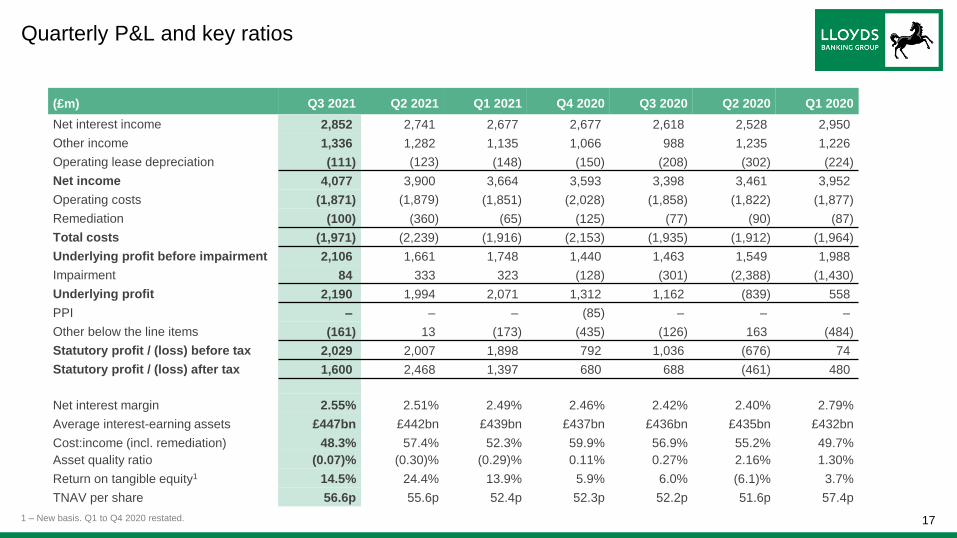
(£m) Q3 2021 Q2 2021 Q1 2021 Q4 2020 Q3 2020 Q2 2020 Q1 2020
Net interest income 2,852 2,741 2,677 2,677 2,618 2,528 2,950
Other income 1,336 1,282 1,135 1,066 988 1,235 1,226
Operating lease depreciation (111) (123) (148) (150) (208) (302) (224)
Net income 4,077 3,900 3,664 3,593 3,398 3,461 3,952
Operating costs (1,871) (1,879) (1,851) (2,028) (1,858) (1,822) (1,877)
Remediation (100) (360) (65) (125) (77) (90) (87)
Total costs (1,971) (2,239) (1,916) (2,153) (1,935) (1,912) (1,964)
Underlying profit before impairment 2,106 1,661 1,748 1,440 1,463 1,549 1,988
Impairment 84 333 323 (128) (301) (2,388) (1,430)
Underlying profit 2,190 1,994 2,071 1,312 1,162 (839) 558
PPI – – – (85) – – –
Other below the line items (161) 13 (173) (435) (126) 163 (484)
Statutory profit / (loss) before tax 2,029 2,007 1,898 792 1,036 (676) 74
Statutory profit / (loss) after tax 1,600 2,468 1,397 680 688 (461) 480
Net interest margin 2.55% 2.51% 2.49% 2.46% 2.42% 2.40% 2.79%
Average interest-earning assets £447bn £442bn £439bn £437bn £436bn £435bn £432bn
Cost:income (incl. remediation) 48.3% 57.4% 52.3% 59.9% 56.9% 55.2% 49.7%
Asset quality ratio (0.07)% (0.30)% (0.29)% 0.11% 0.27% 2.16% 1.30%
Return on tangible equity1 14.5% 24.4% 13.9% 5.9% 6.0% (6.1)% 3.7%
TNAV per share 56.6p 55.6p 52.4p 52.3p 52.2p 51.6p 57.4p
Quarterly P&L and key ratios
1 – New basis. Q1 to Q4 2020 restated.
18
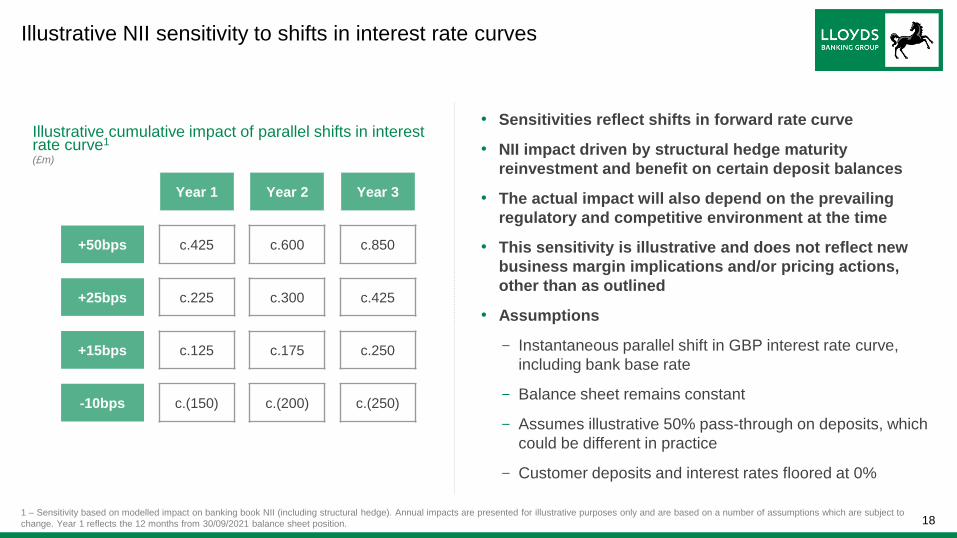
Illustrative NII sensitivity to shifts in interest rate curves
• Sensitivities reflect shifts in forward rate curve
• NII impact driven by structural hedge maturity
reinvestment and benefit on certain deposit balances
• The actual impact will also depend on the prevailing
regulatory and competitive environment at the time
• This sensitivity is illustrative and does not reflect new
business margin implications and/or pricing actions,
other than as outlined
• Assumptions
- Instantaneous parallel shift in GBP interest rate curve,
including bank base rate
- Balance sheet remains constant
- Assumes illustrative 50% pass-through on deposits, which
could be different in practice
- Customer deposits and interest rates floored at 0%
1 – Sensitivity based on modelled impact on banking book NII (including structural hedge). Annual impacts are presented for illustrative purposes only and are based on a number of assumptions which are subject to
change. Year 1 reflects the 12 months from 30/09/2021 balance sheet position.
Year 1 Year 2 Year 3
+50bps c.425 c.600 c.850
+25bps c.225 c.300 c.425
+15bps c.125 c.175 c.250
-10bps c.(150) c.(200) c.(250)
Illustrative cumulative impact of parallel shifts in interest rate curve1
(£m)
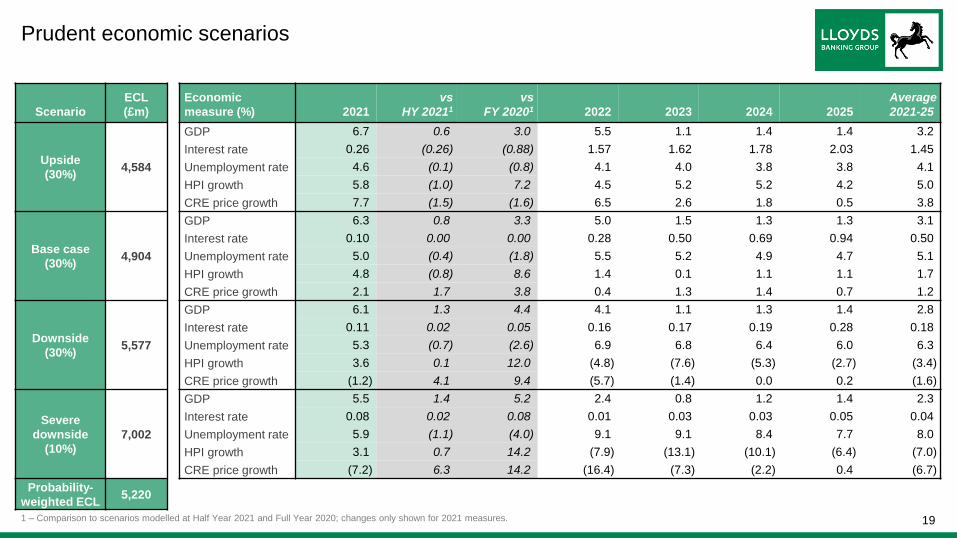
191 – Comparison to scenarios modelled at Half Year 2021 and Full Year 2020; changes only shown for 2021 measures.
Prudent economic scenarios
Scenario
ECL
(£m)
Economic
measure (%) 2021
vs
HY 20211
vs
FY 20201 2022 2023 2024 2025
Average
2021-25
Upside
(30%)4,584
GDP 6.7 0.6 3.0 5.5 1.1 1.4 1.4 3.2
Interest rate 0.26 (0.26) (0.88) 1.57 1.62 1.78 2.03 1.45
Unemployment rate 4.6 (0.1) (0.8) 4.1 4.0 3.8 3.8 4.1
HPI growth 5.8 (1.0) 7.2 4.5 5.2 5.2 4.2 5.0
CRE price growth 7.7 (1.5) (1.6) 6.5 2.6 1.8 0.5 3.8
Base case
(30%)4,904
GDP 6.3 0.8 3.3 5.0 1.5 1.3 1.3 3.1
Interest rate 0.10 0.00 0.00 0.28 0.50 0.69 0.94 0.50
Unemployment rate 5.0 (0.4) (1.8) 5.5 5.2 4.9 4.7 5.1
HPI growth 4.8 (0.8) 8.6 1.4 0.1 1.1 1.1 1.7
CRE price growth 2.1 1.7 3.8 0.4 1.3 1.4 0.7 1.2
Downside
(30%)5,577
GDP 6.1 1.3 4.4 4.1 1.1 1.3 1.4 2.8
Interest rate 0.11 0.02 0.05 0.16 0.17 0.19 0.28 0.18
Unemployment rate 5.3 (0.7) (2.6) 6.9 6.8 6.4 6.0 6.3
HPI growth 3.6 0.1 12.0 (4.8) (7.6) (5.3) (2.7) (3.4)
CRE price growth (1.2) 4.1 9.4 (5.7) (1.4) 0.0 0.2 (1.6)
Severe
downside
(10%)
7,002
GDP 5.5 1.4 5.2 2.4 0.8 1.2 1.4 2.3
Interest rate 0.08 0.02 0.08 0.01 0.03 0.03 0.05 0.04
Unemployment rate 5.9 (1.1) (4.0) 9.1 9.1 8.4 7.7 8.0
HPI growth 3.1 0.7 14.2 (7.9) (13.1) (10.1) (6.4) (7.0)
CRE price growth (7.2) 6.3 14.2 (16.4) (7.3) (2.2) 0.4 (6.7)
Probability-
weighted ECL5,220
20
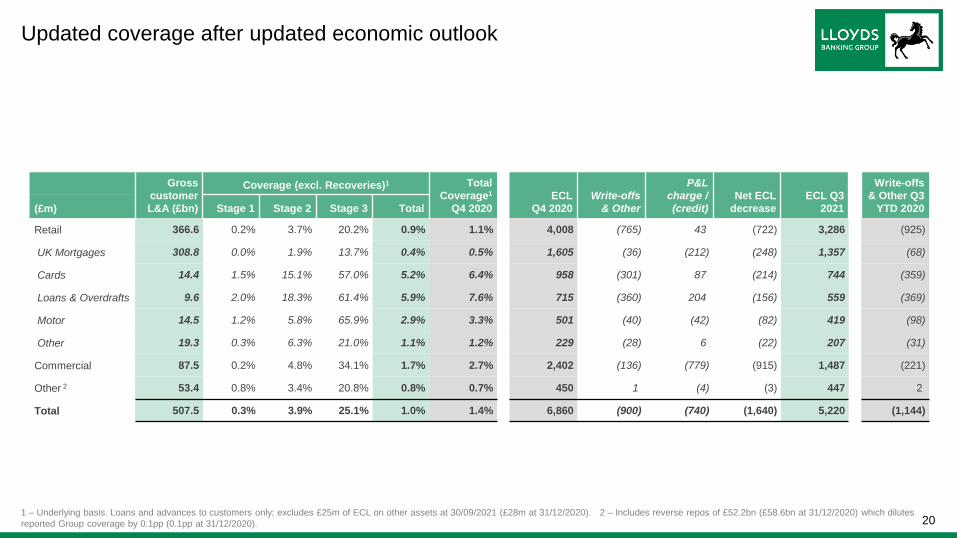
Updated coverage after updated economic outlook
Gross
customer
L&A (£bn)
Coverage (excl. Recoveries)1 Total
Coverage1
Q4 2020
ECL
Q4 2020
Write-offs
& Other
P&L
charge /
(credit)
Net ECL
decrease
ECL Q3
2021
Write-offs
& Other Q3
YTD 2020(£m) Stage 1 Stage 2 Stage 3 Total
Retail 366.6 0.2% 3.7% 20.2% 0.9% 1.1% 4,008 (765) 43 (722) 3,286 (925)
UK Mortgages 308.8 0.0% 1.9% 13.7% 0.4% 0.5% 1,605 (36) (212) (248) 1,357 (68)
Cards 14.4 1.5% 15.1% 57.0% 5.2% 6.4% 958 (301) 87 (214) 744 (359)
Loans & Overdrafts 9.6 2.0% 18.3% 61.4% 5.9% 7.6% 715 (360) 204 (156) 559 (369)
Motor 14.5 1.2% 5.8% 65.9% 2.9% 3.3% 501 (40) (42) (82) 419 (98)
Other 19.3 0.3% 6.3% 21.0% 1.1% 1.2% 229 (28) 6 (22) 207 (31)
Commercial 87.5 0.2% 4.8% 34.1% 1.7% 2.7% 2,402 (136) (779) (915) 1,487 (221)
Other 2 53.4 0.8% 3.4% 20.8% 0.8% 0.7% 450 1 (4) (3) 447 2
Total 507.5 0.3% 3.9% 25.1% 1.0% 1.4% 6,860 (900) (740) (1,640) 5,220 (1,144)
1 – Underlying basis. Loans and advances to customers only; excludes £25m of ECL on other assets at 30/09/2021 (£28m at 31/12/2020). 2 – Includes reverse repos of £52.2bn (£58.6bn at 31/12/2020) which dilutes
reported Group coverage by 0.1pp (0.1pp at 31/12/2020).
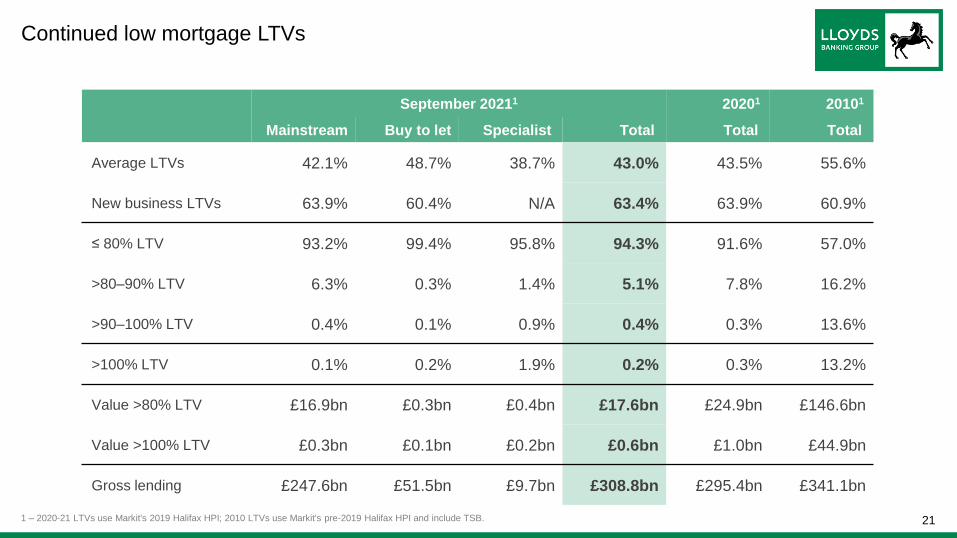
211 – 2020-21 LTVs use Markit's 2019 Halifax HPI; 2010 LTVs use Markit's pre-2019 Halifax HPI and include TSB.
September 20211 20201 20101
Mainstream Buy to let Specialist Total Total Total
Average LTVs 42.1% 48.7% 38.7% 43.0% 43.5% 55.6%
New business LTVs 63.9% 60.4% N/A 63.4% 63.9% 60.9%
≤ 80% LTV 93.2% 99.4% 95.8% 94.3% 91.6% 57.0%
>80–90% LTV 6.3% 0.3% 1.4% 5.1% 7.8% 16.2%
>90–100% LTV 0.4% 0.1% 0.9% 0.4% 0.3% 13.6%
>100% LTV 0.1% 0.2% 1.9% 0.2% 0.3% 13.2%
Value >80% LTV £16.9bn £0.3bn £0.4bn £17.6bn £24.9bn £146.6bn
Value >100% LTV £0.3bn £0.1bn £0.2bn £0.6bn £1.0bn £44.9bn
Gross lending £247.6bn £51.5bn £9.7bn £308.8bn £295.4bn £341.1bn
Continued low mortgage LTVs
22
This document contains certain forward-looking statements within the meaning of Section 21E of the US Securities Exchange Act of 1934, as amended, and section 27A of the US Securities Act of 1933, as
amended, with respect to Lloyds Banking Group plc together with its subsidiaries (the Group) and its current goals and expectations. Statements that are not historical or current facts, including statements
about the Group's or its directors' and/or management's beliefs and expectations, are forward looking statements. Words such as, without limitation, ‘believes’, ‘achieves’, ‘anticipates’, ‘estimates’, ‘expects’,
‘targets’, ‘should’, ‘intends’, ‘aims’, ‘projects’, ‘plans’, ‘potential’, ‘will’, ‘would’, ‘could’, ‘considered’, ‘likely’, ‘may’, ‘seek’, ‘estimate’, ‘probability’, ‘goal’, ‘objective’, ‘deliver’, ‘endeavour’, ‘prospects’, ‘optimistic’
and similar expressions or variations on these expressions are intended to identify forward looking statements. These statements concern or may affect future matters, including but not limited to: projections
or expectations of the Group’s future financial position, including profit attributable to shareholders, provisions, economic profit, dividends, capital structure, portfolios, net interest margin, capital ratios,
liquidity, risk-weighted assets (RWAs), expenditures or any other financial items or ratios; litigation, regulatory and governmental investigations; the Group’s future financial performance; the level and extent
of future impairments and write-downs; the Group’s ESG targets and/or commitments; statements of plans, objectives or goals of the Group or its management and other statements that are not historical
fact; expectations about the impact of COVID-19; and statements of assumptions underlying such statements. By their nature, forward looking statements involve risk and uncertainty because they relate to
events and depend upon circumstances that will or may occur in the future. Factors that could cause actual business, strategy, plans and/or results (including but not limited to the payment of dividends) to
differ materially from forward looking statements include, but are not limited to: general economic and business conditions in the UK and internationally; market related risks, trends and developments;
fluctuations in interest rates, inflation, exchange rates, stock markets and currencies; volatility in credit markets; any impact of the transition from IBORs to alternative reference rates; the ability to access
sufficient sources of capital, liquidity and funding when required; changes to the Group’s credit ratings; the ability to derive cost savings and other benefits including, but without limitation, as a result of any
acquisitions, disposals and other strategic transactions; potential changes in dividend policy; the ability to achieve strategic objectives; management and monitoring of conduct risk; exposure to counterparty
risk; credit rating risk; instability in the global financial markets, including within the Eurozone, and as a result of uncertainty surrounding the exit by the UK from the European Union (EU) and the effects of
the EU-UK Trade and Cooperation Agreement; political instability including as a result of any UK general election and any further possible referendum on Scottish independence; technological changes and
risks to the security of IT and operational infrastructure, systems, data and information resulting from increased threat of cyber and other attacks; natural pandemic (including but not limited to the COVID-19
pandemic) and other disasters; inadequate or failed internal or external processes or systems; acts of hostility or terrorism and responses to those acts, or other such events; geopolitical unpredictability;
risks relating to sustainability and climate change (and achieving climate change ambitions), including the Group’s ability along with the government and other stakeholders to measure, manage and mitigate
the impacts of climate change effectively; changes in laws, regulations, practices and accounting standards or taxation; changes to regulatory capital or liquidity requirements and similar contingencies; the
policies and actions of governmental or regulatory authorities or courts together with any resulting impact on the future structure of the Group; projected employee numbers and key person risk; the impact of
competitive conditions; and exposure to legal, regulatory or competition proceedings, investigations or complaints. A number of these influences and factors are beyond the Group’s control. Please refer to
the latest Annual Report on Form 20-F filed by Lloyds Banking Group plc with the US Securities and Exchange Commission (the SEC), which is available on the SEC’s website at www.sec.gov, for a
discussion of certain factors and risks. Lloyds Banking Group plc may also make or disclose written and/or oral forward-looking statements in other written materials and in oral statements made by the
directors, officers or employees of Lloyds Banking Group plc to third parties, including financial analysts. Except as required by any applicable law or regulation, the forward-looking statements contained in
this document are made as of today's date, and the Group expressly disclaims any obligation or undertaking to release publicly any updates or revisions to any forward looking statements contained in this
document whether as a result of new information, future events or otherwise. The information, statements and opinions contained in this document do not constitute a public offer under any applicable law or
an offer to sell any securities or financial instruments or any advice or recommendation with respect to such securities or financial instruments.
Forward looking statements