Embed Size (px)
Citation preview
© Copyright 2015, Cardinal Health. All rights reserved. CARDINAL HEALTH, the Cardinal Health LOGO and ESSENTIAL TO CARE are trademarks or registered trademarks of Cardinal Health.
Q4 FY2015 earnings investor/analyst call
July 30, 2015
© Copyright 2015, Cardinal Health. All rights reserved. CARDINAL HEALTH, the Cardinal Health LOGO and ESSENTIAL TO CARE are trademarks or registered trademarks of Cardinal Health.
2
Forward-looking statements and GAAP reconciliation
Cautions Concerning Forward-Looking Statements
This presentation contains forward-looking statements addressing expectations, prospects, estimates and other matters that are dependent upon future events or developments. These statements may be identified by words such as "expect," "anticipate," "intend," "plan," "believe," "will," "should," "could," "would," "project," "continue," "likely," and similar expressions, and include statements reflecting future results or guidance, statements of outlook and expense accruals. These matters are subject to risks and uncertainties that could cause actual results to differ materially from those projected, anticipated or implied. These risks and uncertainties include competitive pressures in Cardinal Health's various lines of business; the ability to achieve the expected benefits from the generic sourcing venture with CVS Health and from our acquisition of The Harvard Drug Group; the frequency or rate of pharmaceutical price appreciation or deflation and the timing of generic and branded pharmaceutical introductions; the ability to successfully complete the acquisition of Cordis on a timely basis and if completed to achieve the anticipated results from the Cordisacquisition; the non-renewal or a default under one or more key customer or supplier arrangements or changes to the terms of or level of purchases under those arrangements; uncertainties due to government health care reform including federal health care reform legislation; changes in the distribution patterns or reimbursement rates for health care products and services; the effects of any investigation or action by any regulatory authority; and changes in the cost of commodities such as oil-based resins, cotton, latex and diesel fuel. Cardinal Health is subject to additional risks and uncertainties described in Cardinal Health's Form 10-K, Form 10-Q and Form 8-K reports and exhibits to those reports. This presentation reflects management's views as of July 30, 2015. Except to the extent required by applicable law, Cardinal Health undertakes no obligation to update or revise any forward-looking statement. In addition, these presentations contain Non-GAAP financial measures. Cardinal Health provides GAAP numbers, definitions and reconciling information in the Financial Appendix at the end of these presentations and on its Investors page at ir.cardinalhealth.com. An audio replay of the conference call will be available on the Investors page at ir.cardinalhealth.com.
© Copyright 2015, Cardinal Health. All rights reserved. CARDINAL HEALTH, the Cardinal Health LOGO and ESSENTIAL TO CARE are trademarks or registered trademarks of Cardinal Health.
3
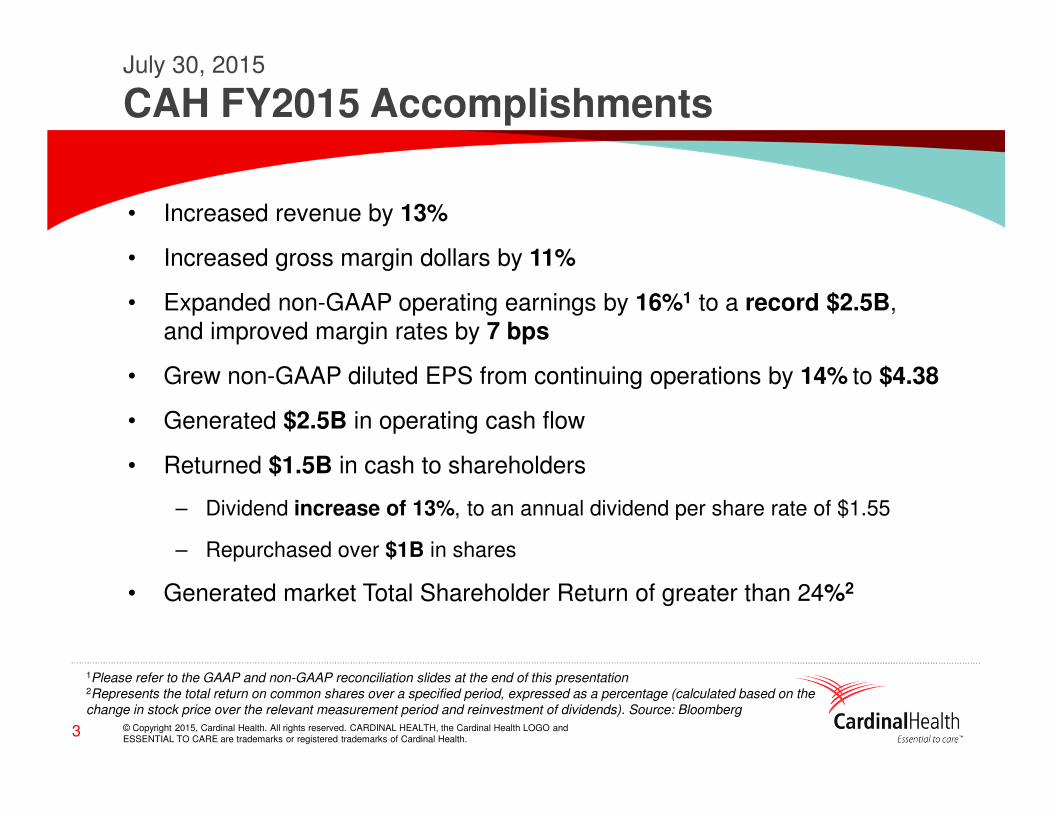
• Increased revenue by 13%
• Increased gross margin dollars by 11%
• Expanded non-GAAP operating earnings by 16%1 to a record $2.5B, and improved margin rates by 7 bps
• Grew non-GAAP diluted EPS from continuing operations by 14% to $4.38
• Generated $2.5B in operating cash flow
• Returned $1.5B in cash to shareholders
– Dividend increase of 13%, to an annual dividend per share rate of $1.55
– Repurchased over $1B in shares
• Generated market Total Shareholder Return of greater than 24%2
July 30, 2015
CAH FY2015 Accomplishments
1Please refer to the GAAP and non-GAAP reconciliation slides at the end of this presentation2Represents the total return on common shares over a specified period, expressed as a percentage (calculated based on the change in stock price over the relevant measurement period and reinvestment of dividends). Source: Bloomberg
© Copyright 2015 Cardinal Health. All rights reserved. CARDINAL HEALTH, the Cardinal Health LOGO andESSENTIAL TO CARE are trademarks or registered trademarks of Cardinal Health.
Q4 and FY2015 results
4
© Copyright 2015, Cardinal Health. All rights reserved. CARDINAL HEALTH, the Cardinal Health LOGO and ESSENTIAL TO CARE are trademarks or registered trademarks of Cardinal Health.
5
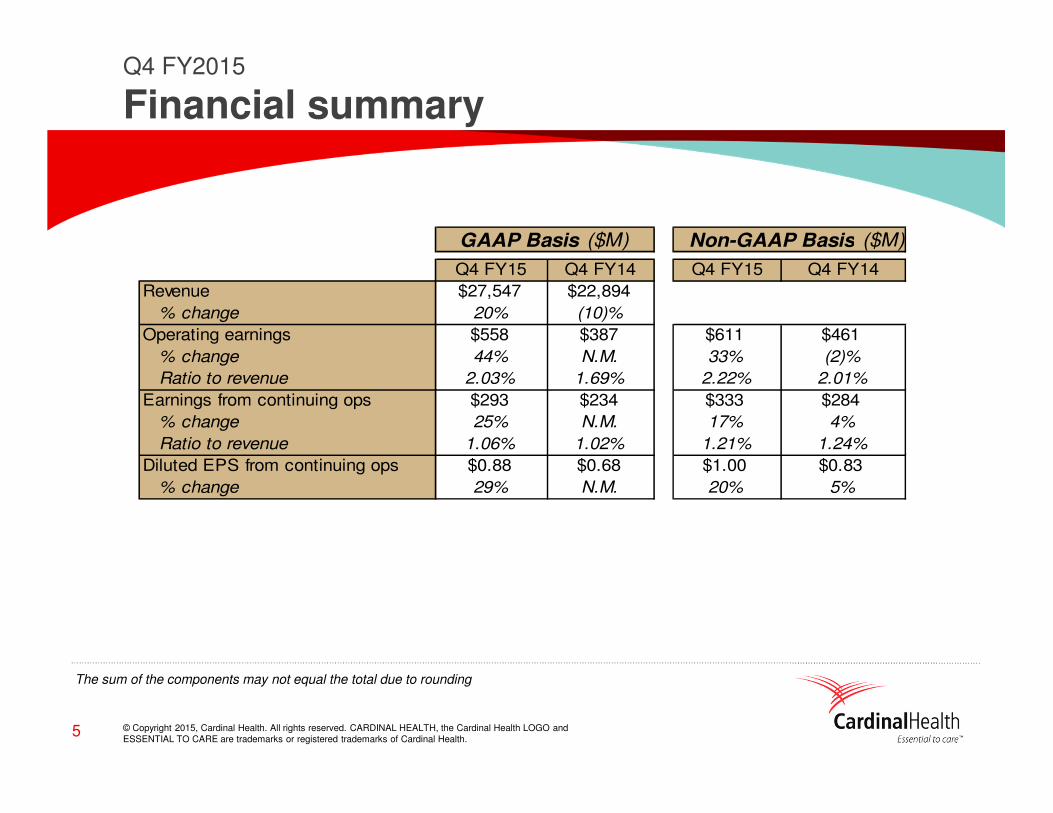
Q4 FY2015
Financial summary
The sum of the components may not equal the total due to rounding
Q4 FY15 Q4 FY14 Q4 FY15 Q4 FY14
Revenue $27,547 $22,894
% change 20% (10)%
Operating earnings $558 $387 $611 $461
% change 44% N.M. 33% (2)%
Ratio to revenue 2.03% 1.69% 2.22% 2.01%
Earnings from continuing ops $293 $234 $333 $284
% change 25% N.M. 17% 4%
Ratio to revenue 1.06% 1.02% 1.21% 1.24%
Diluted EPS from continuing ops $0.88 $0.68 $1.00 $0.83
% change 29% N.M. 20% 5%
Non-GAAP Basis ($M)GAAP Basis ($M)
© Copyright 2015, Cardinal Health. All rights reserved. CARDINAL HEALTH, the Cardinal Health LOGO and ESSENTIAL TO CARE are trademarks or registered trademarks of Cardinal Health.
6
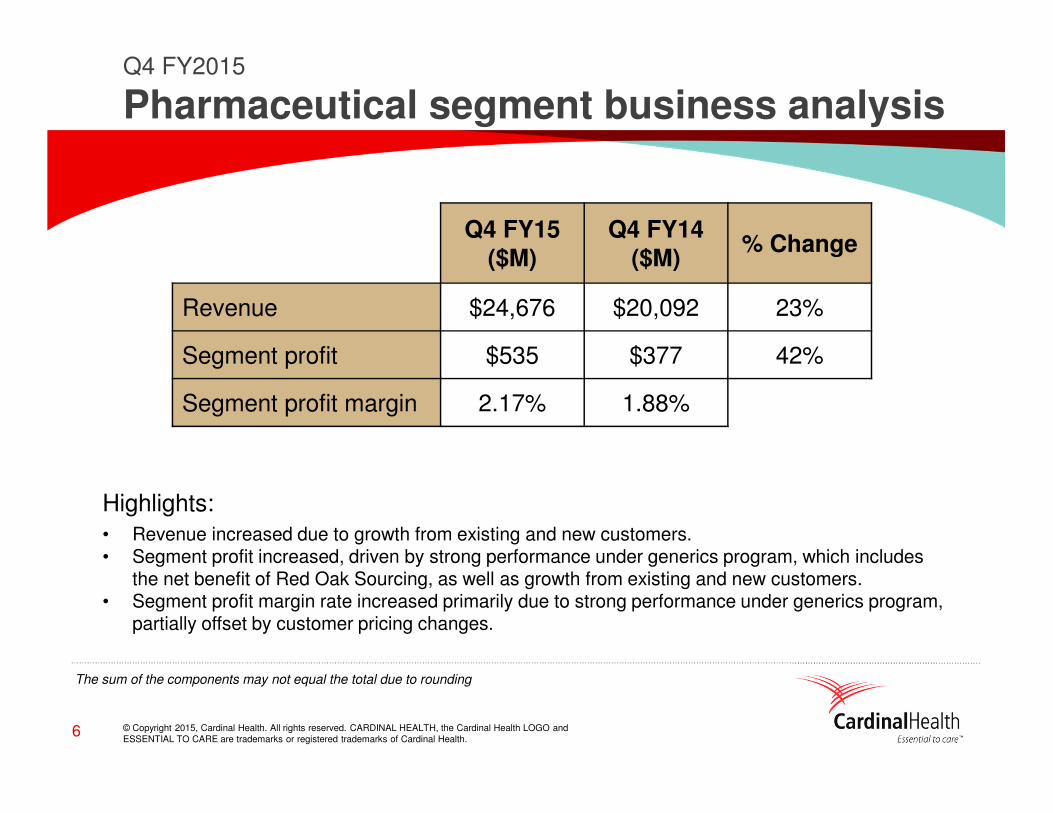
Q4 FY15($M)
Q4 FY14($M)
% Change
Revenue $24,676 $20,092 23%
Segment profit $535 $377 42%
Segment profit margin 2.17% 1.88%
The sum of the components may not equal the total due to rounding
Q4 FY2015
Pharmaceutical segment business analysis
Highlights: • Revenue increased due to growth from existing and new customers.• Segment profit increased, driven by strong performance under generics program, which includes
the net benefit of Red Oak Sourcing, as well as growth from existing and new customers.• Segment profit margin rate increased primarily due to strong performance under generics program,
partially offset by customer pricing changes.
© Copyright 2015, Cardinal Health. All rights reserved. CARDINAL HEALTH, the Cardinal Health LOGO and ESSENTIAL TO CARE are trademarks or registered trademarks of Cardinal Health.
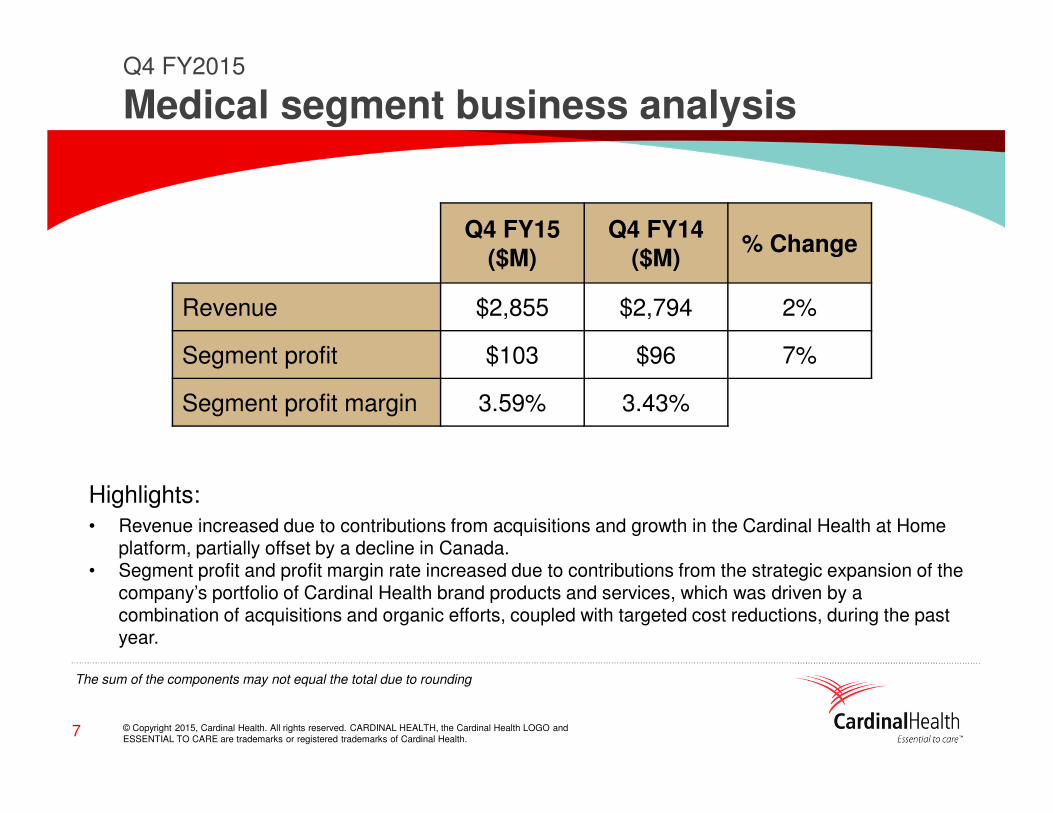
Q4 FY15($M)
Q4 FY14($M)
% Change
Revenue $2,855 $2,794 2%
Segment profit $103 $96 7%
Segment profit margin 3.59% 3.43%
Highlights: • Revenue increased due to contributions from acquisitions and growth in the Cardinal Health at Home
platform, partially offset by a decline in Canada.• Segment profit and profit margin rate increased due to contributions from the strategic expansion of the
company’s portfolio of Cardinal Health brand products and services, which was driven by a combination of acquisitions and organic efforts, coupled with targeted cost reductions, during the past year.
The sum of the components may not equal the total due to rounding
Q4 FY2015
Medical segment business analysis
7
© Copyright 2015, Cardinal Health. All rights reserved. CARDINAL HEALTH, the Cardinal Health LOGO and ESSENTIAL TO CARE are trademarks or registered trademarks of Cardinal Health.
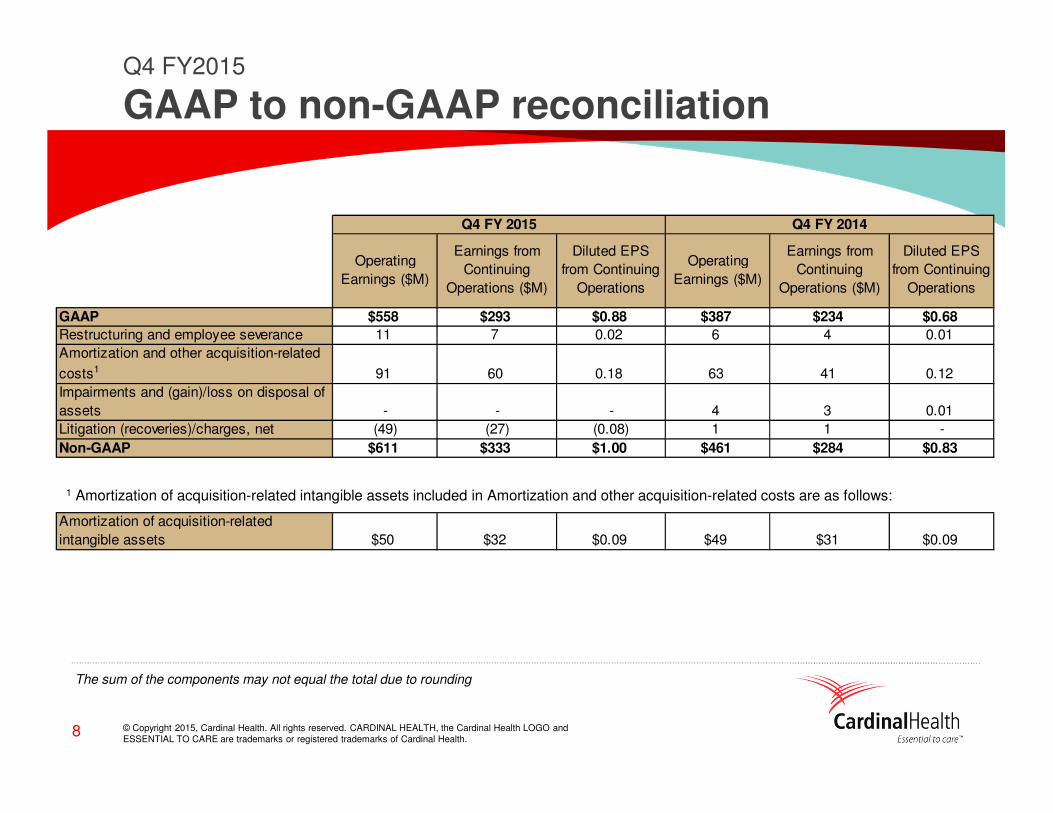
The sum of the components may not equal the total due to rounding
1 Amortization of acquisition-related intangible assets included in Amortization and other acquisition-related costs are as follows:
Q4 FY2015
GAAP to non-GAAP reconciliation
8
Operating
Earnings ($M)
Earnings from
Continuing
Operations ($M)
Diluted EPS
from Continuing
Operations
Operating
Earnings ($M)
Earnings from
Continuing
Operations ($M)
Diluted EPS
from Continuing
Operations
GAAP $558 $293 $0.88 $387 $234 $0.68
Restructuring and employee severance 11 7 0.02 6 4 0.01
Amortization and other acquisition-related
costs1 91 60 0.18 63 41 0.12
Impairments and (gain)/loss on disposal of
assets - - - 4 3 0.01
Litigation (recoveries)/charges, net (49) (27) (0.08) 1 1 -
Non-GAAP $611 $333 $1.00 $461 $284 $0.83
Amortization of acquisition-related
intangible assets $50 $32 $0.09 $49 $31 $0.09
Q4 FY 2014Q4 FY 2015
© Copyright 2015, Cardinal Health. All rights reserved. CARDINAL HEALTH, the Cardinal Health LOGO and ESSENTIAL TO CARE are trademarks or registered trademarks of Cardinal Health.
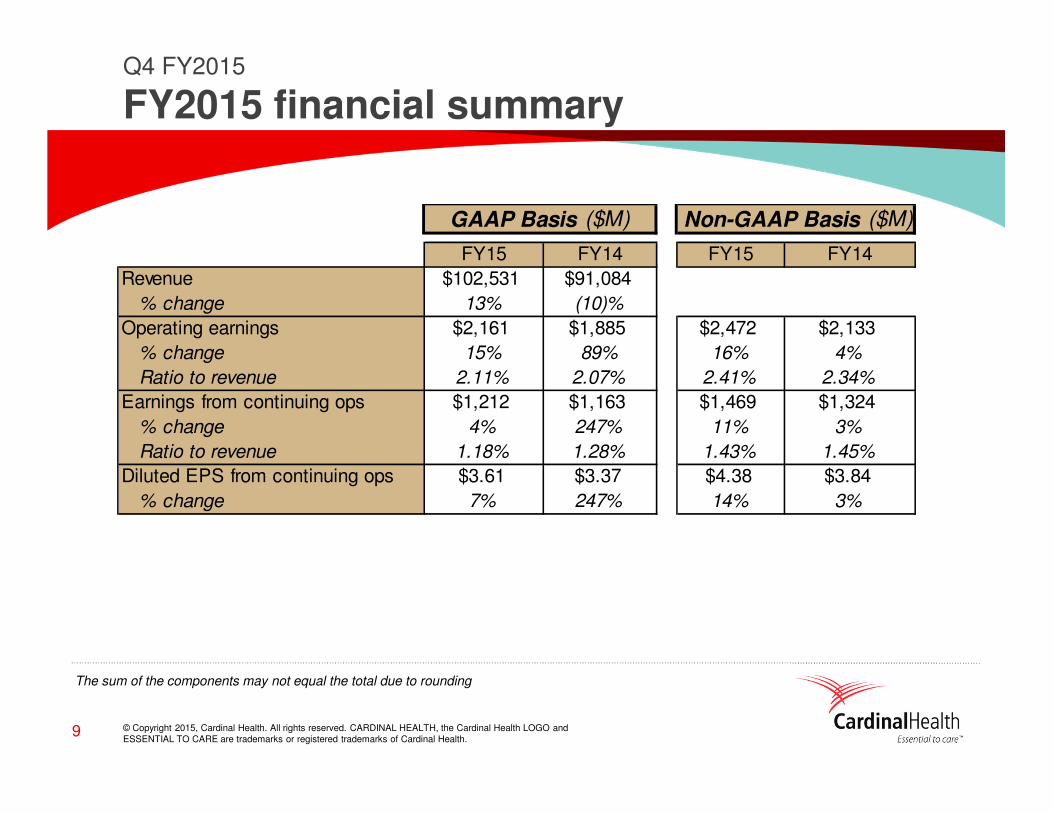
Q4 FY2015
FY2015 financial summary
9
The sum of the components may not equal the total due to rounding
FY15 FY14 FY15 FY14
Revenue $102,531 $91,084
% change 13% (10)%
Operating earnings $2,161 $1,885 $2,472 $2,133
% change 15% 89% 16% 4%
Ratio to revenue 2.11% 2.07% 2.41% 2.34%
Earnings from continuing ops $1,212 $1,163 $1,469 $1,324
% change 4% 247% 11% 3%
Ratio to revenue 1.18% 1.28% 1.43% 1.45%
Diluted EPS from continuing ops $3.61 $3.37 $4.38 $3.84
% change 7% 247% 14% 3%
Non-GAAP Basis ($M)GAAP Basis ($M)
© Copyright 2015, Cardinal Health. All rights reserved. CARDINAL HEALTH, the Cardinal Health LOGO and ESSENTIAL TO CARE are trademarks or registered trademarks of Cardinal Health.
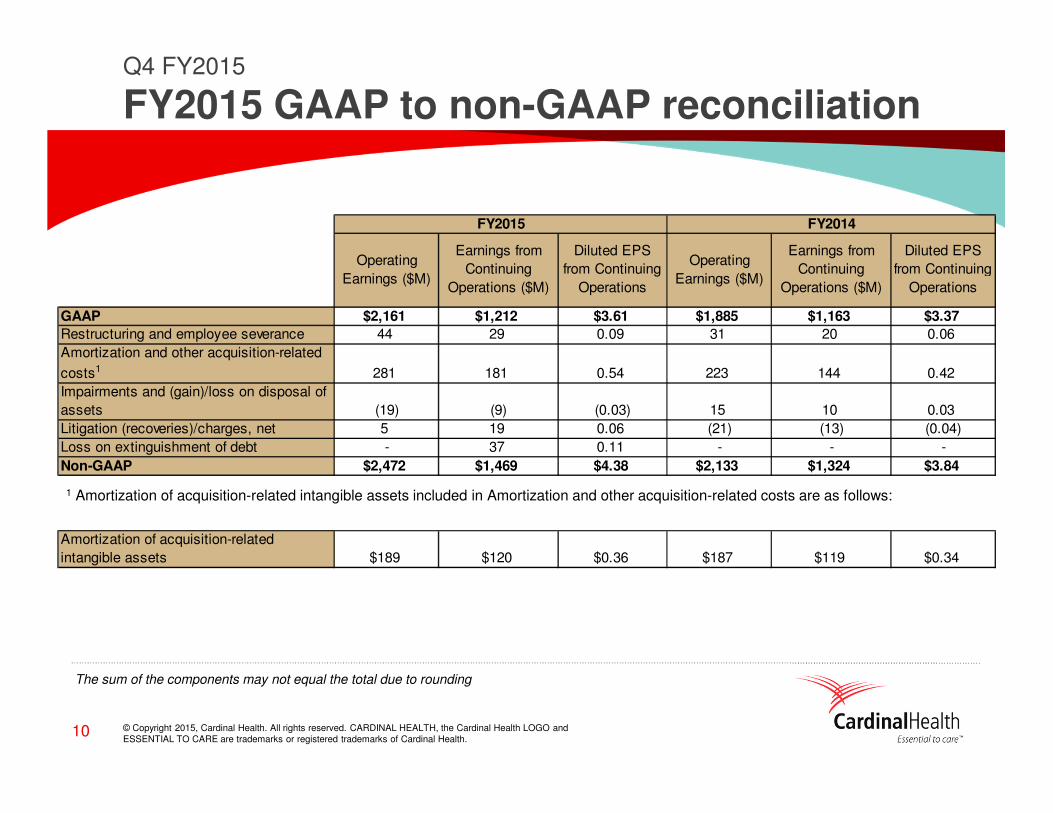
The sum of the components may not equal the total due to rounding
1 Amortization of acquisition-related intangible assets included in Amortization and other acquisition-related costs are as follows:
Q4 FY2015
FY2015 GAAP to non-GAAP reconciliation
10
Operating
Earnings ($M)
Earnings from
Continuing
Operations ($M)
Diluted EPS
from Continuing
Operations
Operating
Earnings ($M)
Earnings from
Continuing
Operations ($M)
Diluted EPS
from Continuing
Operations
GAAP $2,161 $1,212 $3.61 $1,885 $1,163 $3.37
Restructuring and employee severance 44 29 0.09 31 20 0.06
Amortization and other acquisition-related
costs1 281 181 0.54 223 144 0.42
Impairments and (gain)/loss on disposal of
assets (19) (9) (0.03) 15 10 0.03
Litigation (recoveries)/charges, net 5 19 0.06 (21) (13) (0.04)
Loss on extinguishment of debt - 37 0.11 - - -
Non-GAAP $2,472 $1,469 $4.38 $2,133 $1,324 $3.84
Amortization of acquisition-related
intangible assets $189 $120 $0.36 $187 $119 $0.34
FY2014FY2015

© Copyright 2015 Cardinal Health. All rights reserved. CARDINAL HEALTH, the Cardinal Health LOGO andESSENTIAL TO CARE are trademarks or registered trademarks of Cardinal Health.
FY2016 outlook
11
© Copyright 2015, Cardinal Health. All rights reserved. CARDINAL HEALTH, the Cardinal Health LOGO and ESSENTIAL TO CARE are trademarks or registered trademarks of Cardinal Health.
12
July 30, 2015
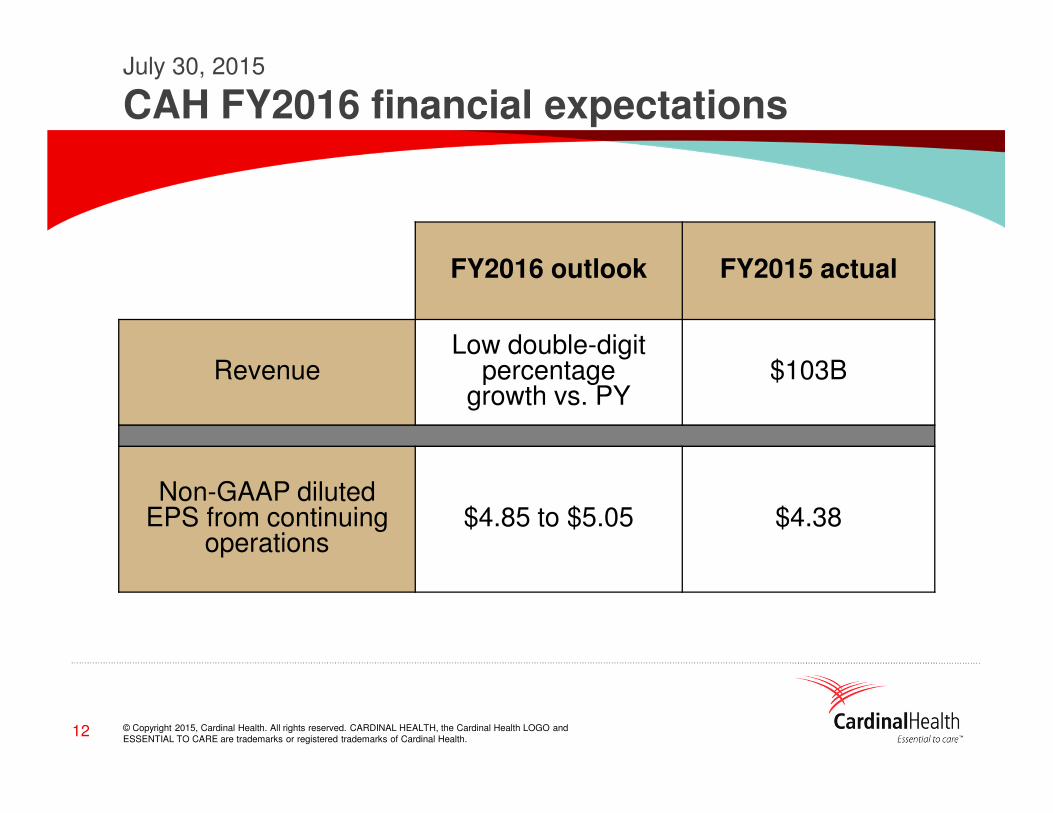
CAH FY2016 financial expectations
FY2016 outlook FY2015 actual
RevenueLow double-digit
percentage growth vs. PY
$103B
Non-GAAP diluted EPS from continuing
operations$4.85 to $5.05 $4.38
© Copyright 2015, Cardinal Health. All rights reserved. CARDINAL HEALTH, the Cardinal Health LOGO and ESSENTIAL TO CARE are trademarks or registered trademarks of Cardinal Health.
July 30, 2015
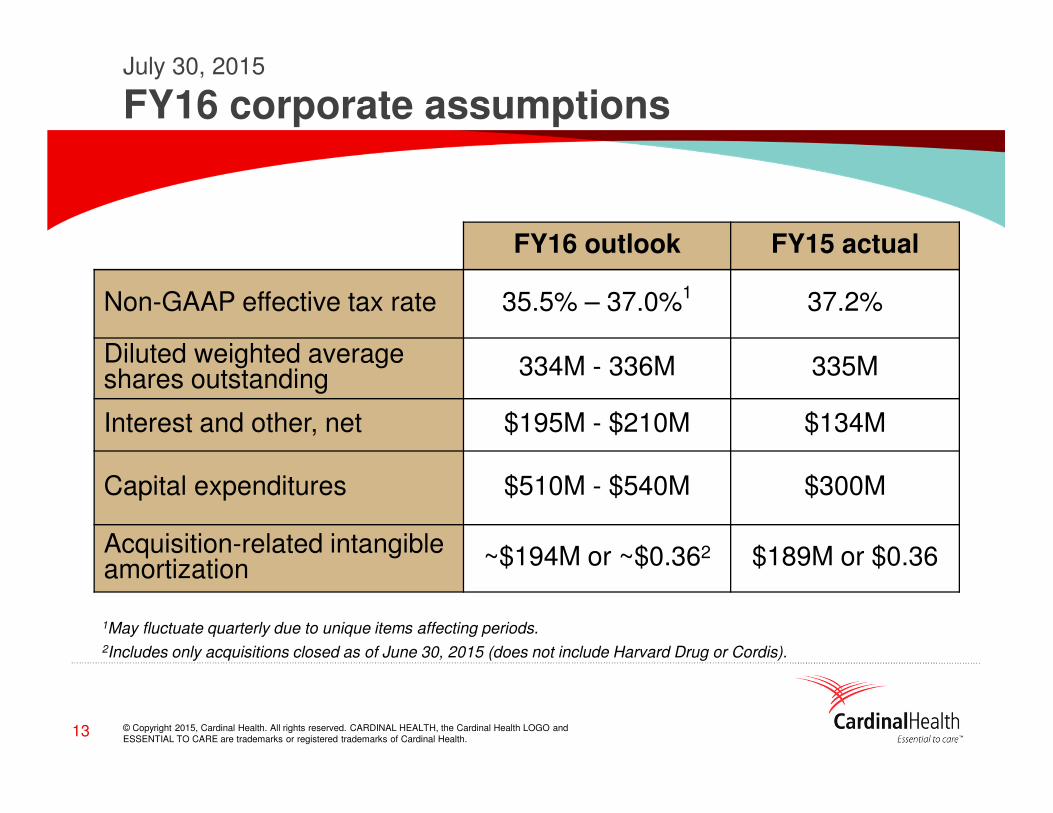
FY16 corporate assumptions
13
1May fluctuate quarterly due to unique items affecting periods.2Includes only acquisitions closed as of June 30, 2015 (does not include Harvard Drug or Cordis).
FY16 outlook FY15 actual
Non-GAAP effective tax rate 35.5% – 37.0%1 37.2%
Diluted weighted average shares outstanding 334M - 336M 335M
Interest and other, net $195M - $210M $134M
Capital expenditures $510M - $540M $300M
Acquisition-related intangible amortization ~$194M or ~$0.362 $189M or $0.36
© Copyright 2015, Cardinal Health. All rights reserved. CARDINAL HEALTH, the Cardinal Health LOGO and ESSENTIAL TO CARE are trademarks or registered trademarks of Cardinal Health.
July 30, 2015
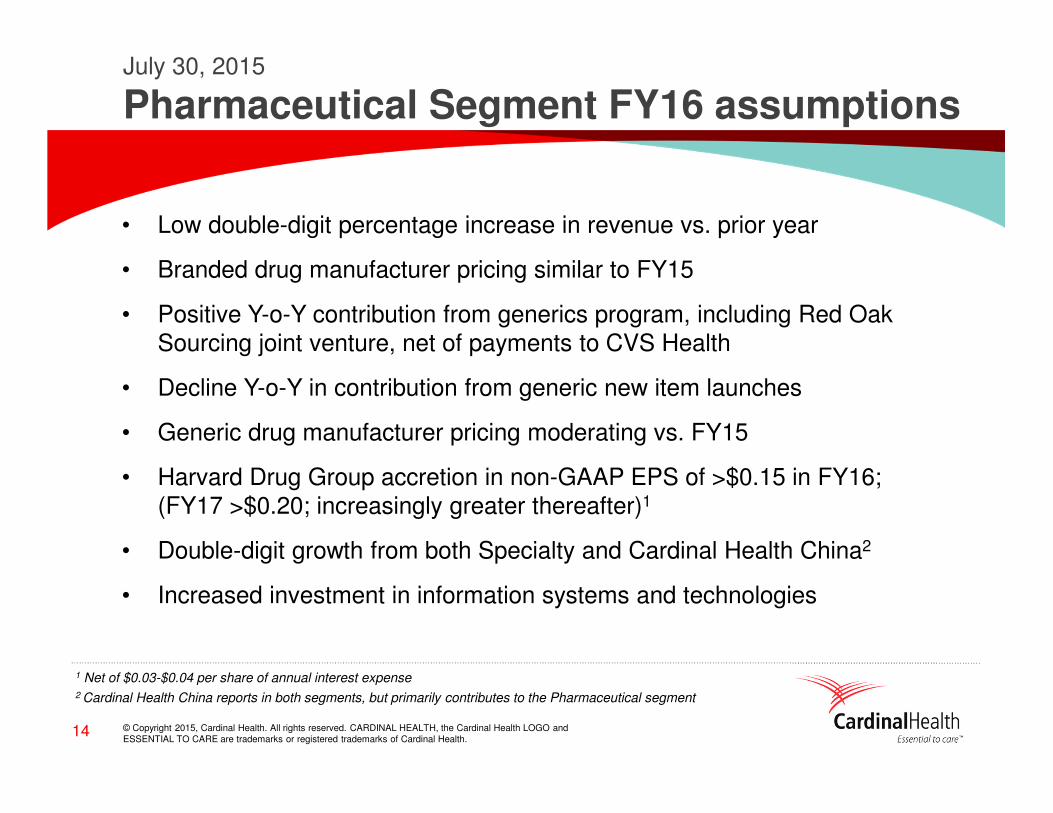
Pharmaceutical Segment FY16 assumptions
14
• Low double-digit percentage increase in revenue vs. prior year
• Branded drug manufacturer pricing similar to FY15
• Positive Y-o-Y contribution from generics program, including Red Oak Sourcing joint venture, net of payments to CVS Health
• Decline Y-o-Y in contribution from generic new item launches
• Generic drug manufacturer pricing moderating vs. FY15
• Harvard Drug Group accretion in non-GAAP EPS of >$0.15 in FY16;(FY17 >$0.20; increasingly greater thereafter)1
• Double-digit growth from both Specialty and Cardinal Health China2
• Increased investment in information systems and technologies
1 Net of $0.03-$0.04 per share of annual interest expense2 Cardinal Health China reports in both segments, but primarily contributes to the Pharmaceutical segment
© Copyright 2015, Cardinal Health. All rights reserved. CARDINAL HEALTH, the Cardinal Health LOGO and ESSENTIAL TO CARE are trademarks or registered trademarks of Cardinal Health.
15
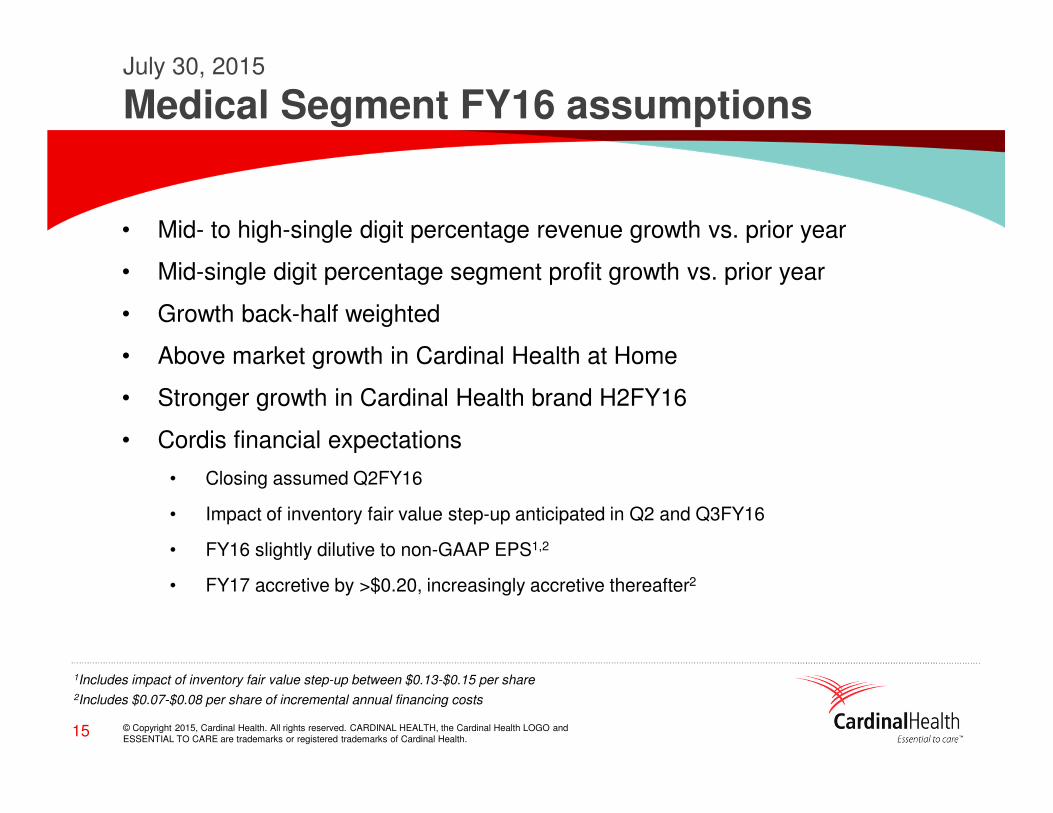
• Mid- to high-single digit percentage revenue growth vs. prior year
• Mid-single digit percentage segment profit growth vs. prior year
• Growth back-half weighted
• Above market growth in Cardinal Health at Home
• Stronger growth in Cardinal Health brand H2FY16
• Cordis financial expectations
• Closing assumed Q2FY16
• Impact of inventory fair value step-up anticipated in Q2 and Q3FY16
• FY16 slightly dilutive to non-GAAP EPS1,2
• FY17 accretive by >$0.20, increasingly accretive thereafter2
July 30, 2015
Medical Segment FY16 assumptions
1Includes impact of inventory fair value step-up between $0.13-$0.15 per share2Includes $0.07-$0.08 per share of incremental annual financing costs
© Copyright 2015 Cardinal Health. All rights reserved. CARDINAL HEALTH, the Cardinal Health LOGO andESSENTIAL TO CARE are trademarks or registered trademarks of Cardinal Health.
© Copyright 2015 Cardinal Health. All rights reserved. CARDINAL HEALTH, the Cardinal Health LOGO andESSENTIAL TO CARE are trademarks or registered trademarks of Cardinal Health.
Q4 FY2015 trailing five quartersand GAAP to Non-GAAP reconciliation statements
17
© Copyright 2015, Cardinal Health. All rights reserved. CARDINAL HEALTH, the Cardinal Health LOGO and ESSENTIAL TO CARE are trademarks or registered trademarks of Cardinal Health.
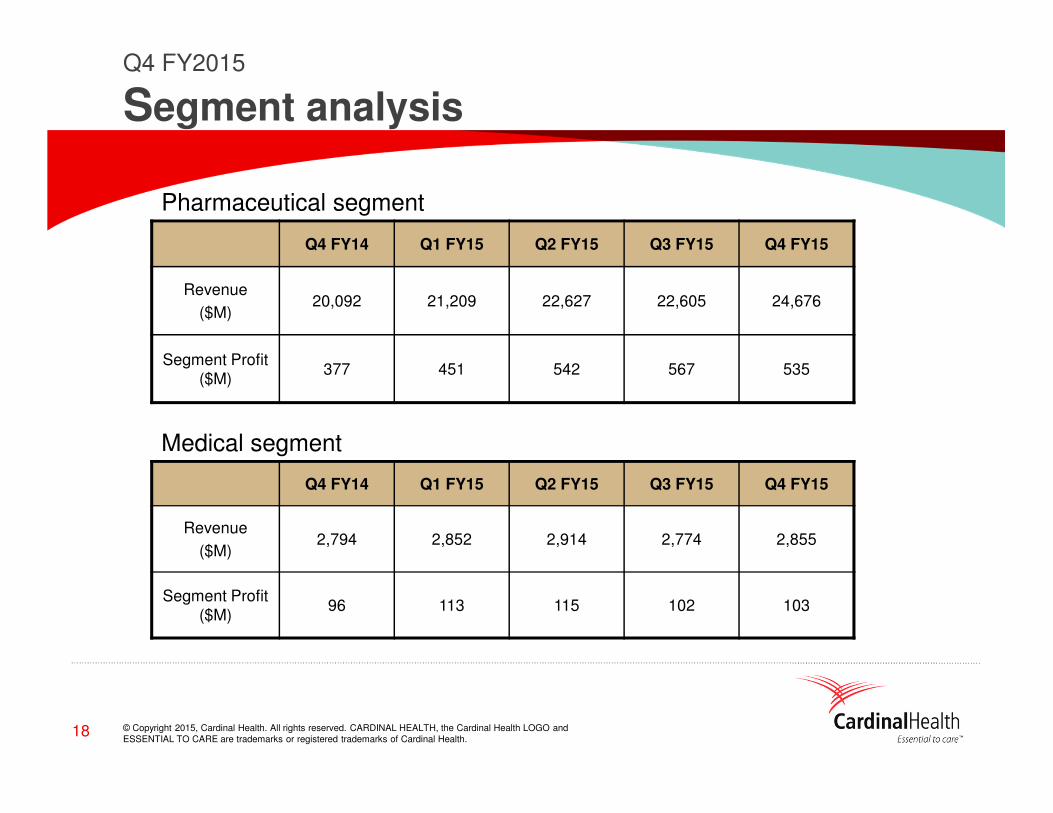
Q4 FY14 Q1 FY15 Q2 FY15 Q3 FY15 Q4 FY15
Revenue
($M)20,092 21,209 22,627 22,605 24,676
Segment Profit ($M)
377 451 542 567 535
Q4 FY14 Q1 FY15 Q2 FY15 Q3 FY15 Q4 FY15
Revenue
($M)2,794 2,852 2,914 2,774 2,855
Segment Profit ($M)
96 113 115 102 103
Pharmaceutical segment
Medical segment
Q4 FY2015
Segment analysis
18
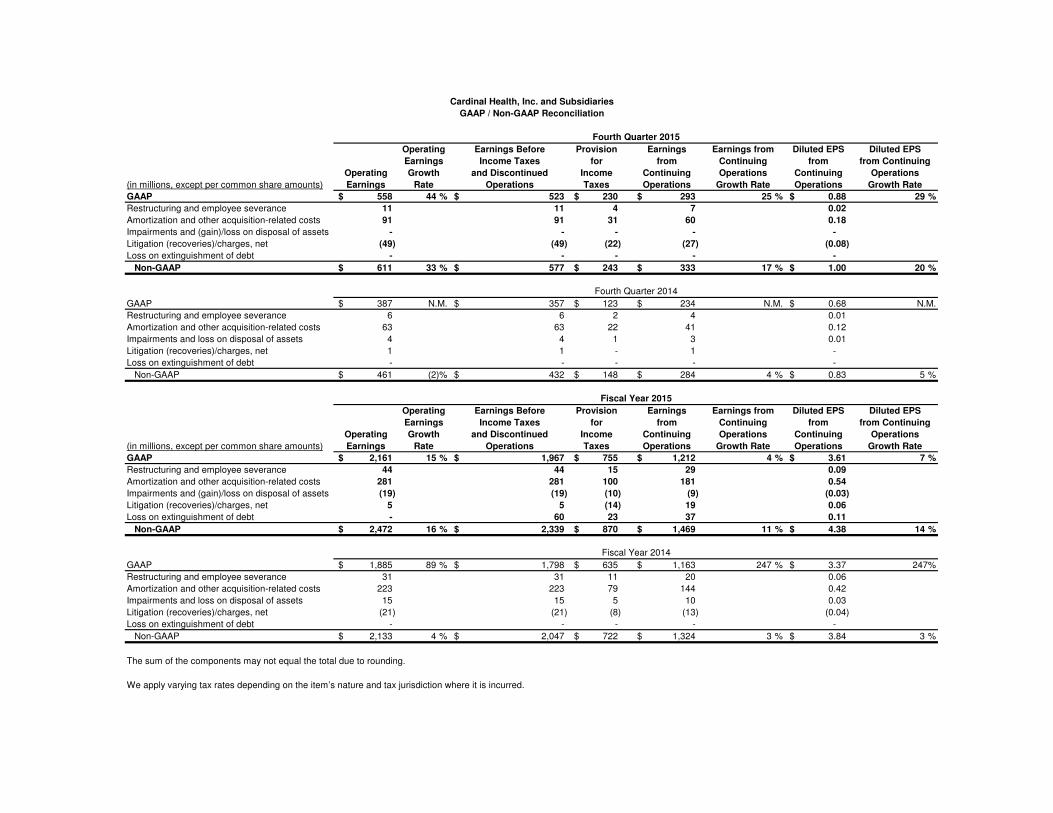
Operating Earnings Before Provision Earnings Earnings from Diluted EPS Diluted EPS
Earnings Income Taxes for from Continuing from from Continuing
Operating Growth and Discontinued Income Continuing Operations Continuing Operations
(in millions, except per common share amounts) Earnings Rate Operations Taxes Operations Growth Rate Operations Growth Rate
GAAP 558$ 44 % 523$ 230$ 293$ 25 % 0.88$ 29 %
Restructuring and employee severance 11 11 4 7 0.02
Amortization and other acquisition-related costs 91 91 31 60 0.18
Impairments and (gain)/loss on disposal of assets - - - - -
Litigation (recoveries)/charges, net (49) (49) (22) (27) (0.08)
Loss on extinguishment of debt - - - - -
Non-GAAP 611$ 33 % 577$ 243$ 333$ 17 % 1.00$ 20 %
GAAP 387$ N.M. 357$ 123$ 234$ N.M. 0.68$ N.M.
Restructuring and employee severance 6 6 2 4 0.01
Amortization and other acquisition-related costs 63 63 22 41 0.12
Impairments and loss on disposal of assets 4 4 1 3 0.01
Litigation (recoveries)/charges, net 1 1 - 1 -
Loss on extinguishment of debt - - - - -
Non-GAAP 461$ (2)% 432$ 148$ 284$ 4 % 0.83$ 5 %
Operating Earnings Before Provision Earnings Earnings from Diluted EPS Diluted EPS
Earnings Income Taxes for from Continuing from from Continuing
Operating Growth and Discontinued Income Continuing Operations Continuing Operations
(in millions, except per common share amounts) Earnings Rate Operations Taxes Operations Growth Rate Operations Growth Rate
GAAP 2,161$ 15 % 1,967$ 755$ 1,212$ 4 % 3.61$ 7 %
Restructuring and employee severance 44 44 15 29 0.09
Amortization and other acquisition-related costs 281 281 100 181 0.54
Impairments and (gain)/loss on disposal of assets (19) (19) (10) (9) (0.03)
Litigation (recoveries)/charges, net 5 5 (14) 19 0.06
Loss on extinguishment of debt - 60 23 37 0.11
Non-GAAP 2,472$ 16 % 2,339$ 870$ 1,469$ 11 % 4.38$ 14 %
GAAP 1,885$ 89 % 1,798$ 635$ 1,163$ 247 % 3.37$ 247%
Restructuring and employee severance 31 31 11 20 0.06
Amortization and other acquisition-related costs 223 223 79 144 0.42
Impairments and loss on disposal of assets 15 15 5 10 0.03
Litigation (recoveries)/charges, net (21) (21) (8) (13) (0.04)
Loss on extinguishment of debt - - - - -
Non-GAAP 2,133$ 4 % 2,047$ 722$ 1,324$ 3 % 3.84$ 3 %
Fiscal Year 2014
We apply varying tax rates depending on the item’s nature and tax jurisdiction where it is incurred.
The sum of the components may not equal the total due to rounding.
Cardinal Health, Inc. and Subsidiaries
GAAP / Non-GAAP Reconciliation
Fourth Quarter 2015
Fourth Quarter 2014
Fiscal Year 2015
(in millions) 2015 2014 2015 2014
Revenue
Amount 27,547$ 22,894$
Growth rate 20 % (10)%
Operating earnings
Amount 558$ 387$ 611$ 461$
Growth rate 44 % N.M. 33 % (2)%
Earnings from continuing operations
Amount 293$ 234$ 333$ 284$
Growth rate 25 % N.M. 17 % 4 %
Return on equity 18.7 % 14.5 % 21.3 % 17.6 %
Effective tax rate from continuing operations 44.1 % 34.4 % 42.2 % 34.2 %
Debt to total capital 47 % 38 %
Net debt to capital 12 % 15 %
(in millions) 2015 2014 2015 2014
Revenue
Amount 102,531$ 91,084$
Growth rate1 13 % (10)%
Operating earnings
Amount 2,161$ 1,885$ 2,472$ 2,133$
Growth rate 15 % 89 % 16 % 4 %
Earnings from continuing operations
Amount 1,212$ 1,163$ 1,469$ 1,324$
Growth rate 4 % 247 % 11 % 3 %
Return on equity 19.4 % 18.3 % 23.4 % 20.9 %
Effective tax rate from continuing operations 38.4 % 35.3 % 37.2 % 35.3 %
1
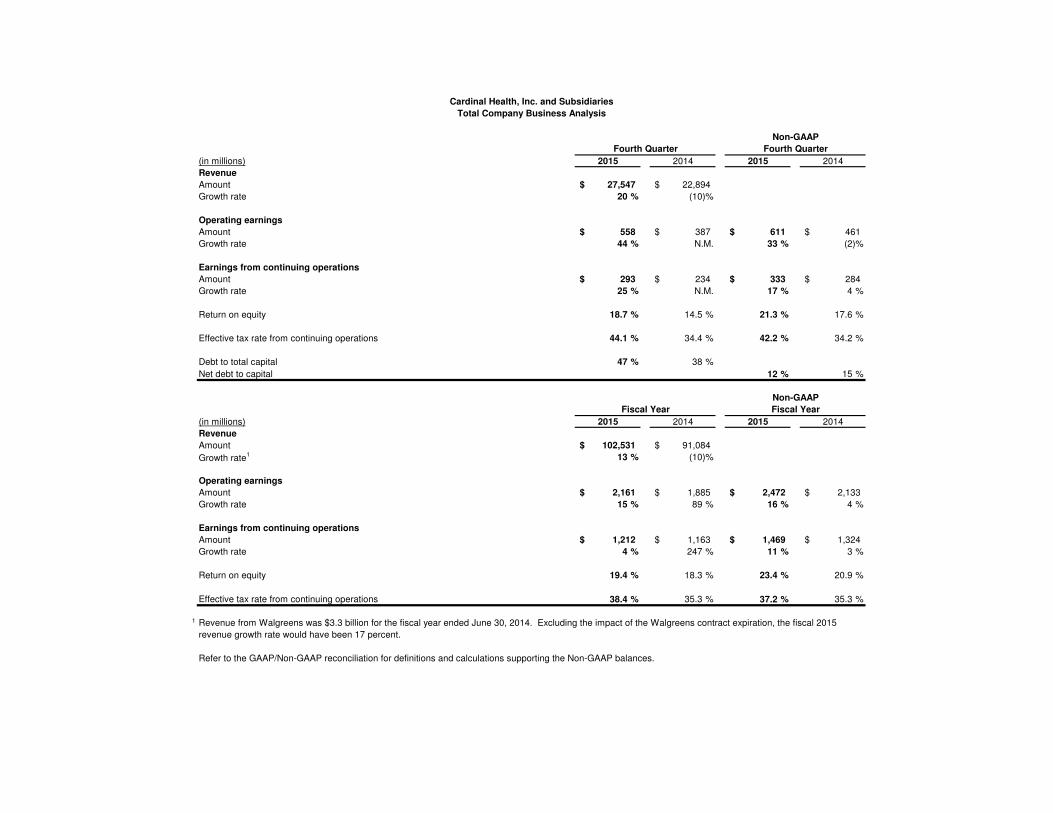
Cardinal Health, Inc. and Subsidiaries
Total Company Business Analysis
Fiscal Year Fiscal Year
Non-GAAP
Non-GAAP
Fourth Quarter Fourth Quarter
Refer to the GAAP/Non-GAAP reconciliation for definitions and calculations supporting the Non-GAAP balances.
Revenue from Walgreens was $3.3 billion for the fiscal year ended June 30, 2014. Excluding the impact of the Walgreens contract expiration, the fiscal 2015
revenue growth rate would have been 17 percent.
(in millions) 2015 2014 (in millions) 2015 2014
Pharmaceutical Medical
Revenue Revenue
Amount 24,676$ 20,092$ Amount 2,855$ 2,794$
Growth rate 23 % (12)% Growth rate 2 % 4 %
Segment profit Segment profit
Amount 535$ 377$ Amount 103$ 96$
Growth rate 42 % (5)% Growth rate 7 % (8)%
Segment profit margin 2.17 % 1.88 % Segment profit margin 3.59 % 3.43 %
Total consolidated operating earnings for the three months ended June 30, 2015 were $558 million, which included total
segment profit of $638 million and Corporate costs of $(80) million. Total consolidated operating earnings for the three
months ended June 30, 2014 were $387 million, which included total segment profit of $473 million and Corporate costs of
$(86) million. Corporate includes, among other things, restructuring and employee severance, amortization and other
acquisition-related costs, impairments and (gain)/loss on disposal of assets, litigation (recoveries)/charges, net and certain
investment spending that are not allocated to the segments.
Cardinal Health, Inc. and Subsidiaries
Segment Business Analysis
Refer to definitions for an explanation of calculations.
Fourth Quarter Fourth Quarter
Total consolidated revenue for the three months ended June 30, 2015 was $27,547 million, which included total segment
revenue of $27,531 million and Corporate revenue of $16 million. Total consolidated revenue for the three months ended
June 30, 2014 was $22,894 million, which included total segment revenue of $22,886 million and Corporate revenue of $8
million. Corporate revenue consists primarily of elimination of inter-segment revenue and other revenue not allocated to the
segments.
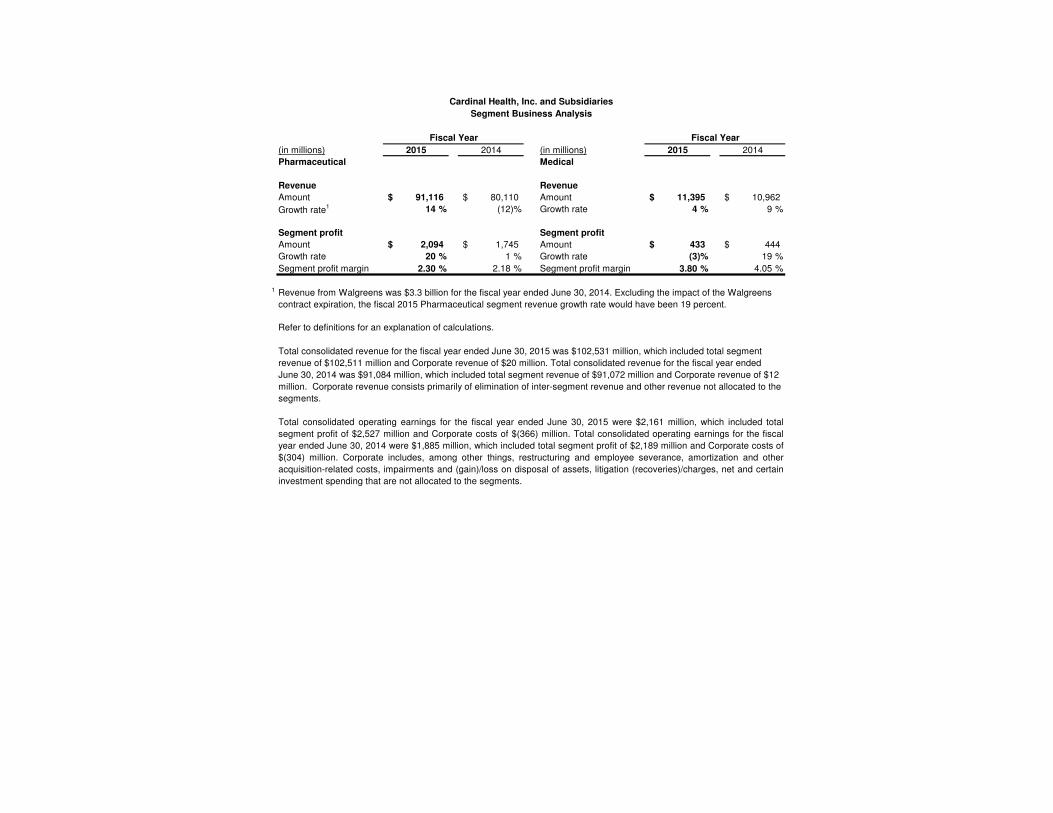
(in millions) 2015 2014 (in millions) 2015 2014
Pharmaceutical Medical
Revenue Revenue
Amount 91,116$ 80,110$ Amount 11,395$ 10,962$
Growth rate1 14 % (12)% Growth rate 4 % 9 %
Segment profit Segment profit
Amount 2,094$ 1,745$ Amount 433$ 444$
Growth rate 20 % 1 % Growth rate (3)% 19 %
Segment profit margin 2.30 % 2.18 % Segment profit margin 3.80 % 4.05 %
1
Cardinal Health, Inc. and Subsidiaries
Segment Business Analysis
Fiscal Year Fiscal Year
Refer to definitions for an explanation of calculations.
Total consolidated operating earnings for the fiscal year ended June 30, 2015 were $2,161 million, which included total
segment profit of $2,527 million and Corporate costs of $(366) million. Total consolidated operating earnings for the fiscal
year ended June 30, 2014 were $1,885 million, which included total segment profit of $2,189 million and Corporate costs of
$(304) million. Corporate includes, among other things, restructuring and employee severance, amortization and other
acquisition-related costs, impairments and (gain)/loss on disposal of assets, litigation (recoveries)/charges, net and certain
investment spending that are not allocated to the segments.
Revenue from Walgreens was $3.3 billion for the fiscal year ended June 30, 2014. Excluding the impact of the Walgreens
contract expiration, the fiscal 2015 Pharmaceutical segment revenue growth rate would have been 19 percent.
Total consolidated revenue for the fiscal year ended June 30, 2015 was $102,531 million, which included total segment
revenue of $102,511 million and Corporate revenue of $20 million. Total consolidated revenue for the fiscal year ended
June 30, 2014 was $91,084 million, which included total segment revenue of $91,072 million and Corporate revenue of $12
million. Corporate revenue consists primarily of elimination of inter-segment revenue and other revenue not allocated to the
segments.
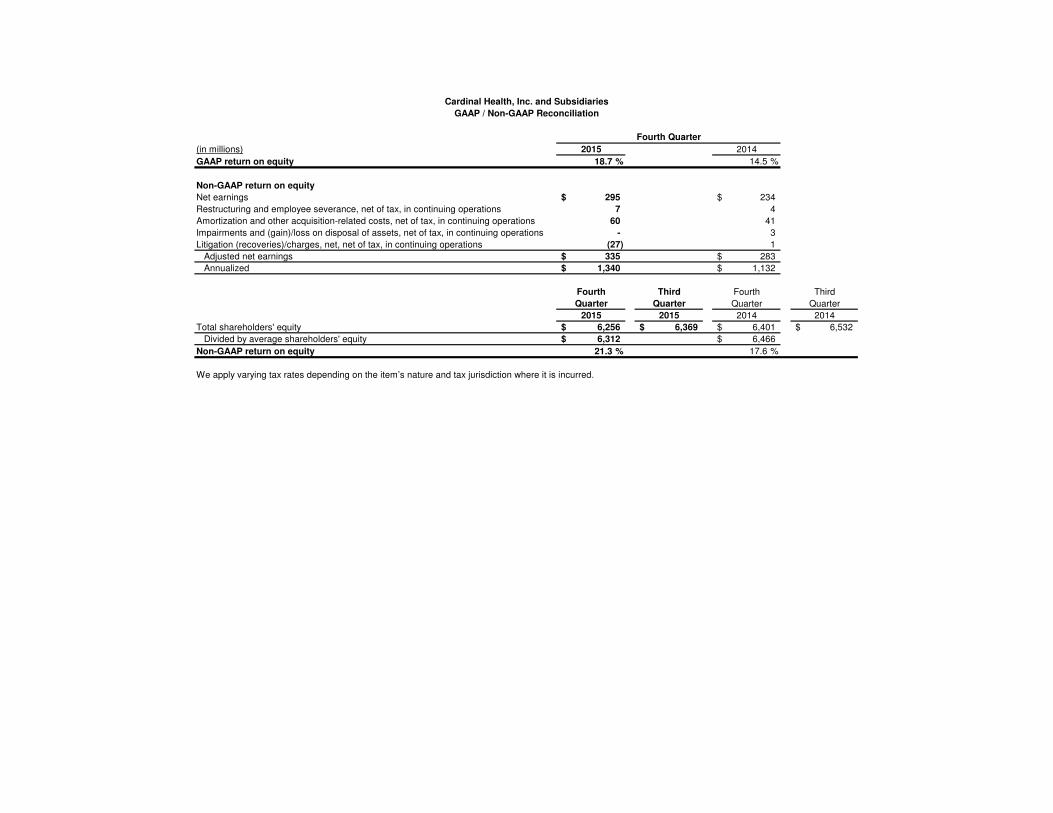
(in millions) 2015 2014
GAAP return on equity 18.7 % 14.5 %
Non-GAAP return on equity
Net earnings 295$ 234$
Restructuring and employee severance, net of tax, in continuing operations 7 4
Amortization and other acquisition-related costs, net of tax, in continuing operations 60 41
Impairments and (gain)/loss on disposal of assets, net of tax, in continuing operations - 3
Litigation (recoveries)/charges, net, net of tax, in continuing operations (27) 1
Adjusted net earnings 335$ 283$
Annualized 1,340$ 1,132$
Fourth Third Fourth Third
Quarter Quarter Quarter Quarter
2015 2015 2014 2014
Total shareholders' equity 6,256$ 6,369$ 6,401$ 6,532$
Divided by average shareholders' equity 6,312$ 6,466$
Non-GAAP return on equity 21.3 % 17.6 %
Cardinal Health, Inc. and Subsidiaries
GAAP / Non-GAAP Reconciliation
Fourth Quarter
We apply varying tax rates depending on the item’s nature and tax jurisdiction where it is incurred.
(in millions) 2015 2014
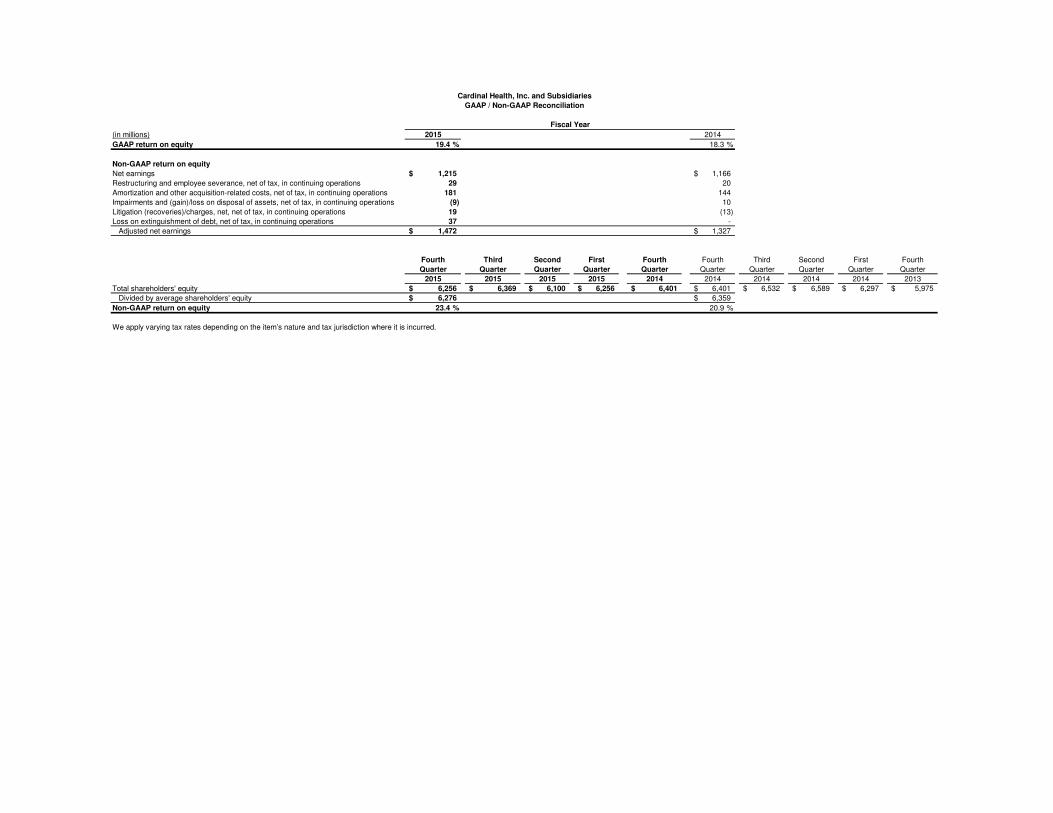
GAAP return on equity 19.4 % 18.3 %
Non-GAAP return on equity
Net earnings 1,215$ 1,166$
Restructuring and employee severance, net of tax, in continuing operations 29 20
Amortization and other acquisition-related costs, net of tax, in continuing operations 181 144
Impairments and (gain)/loss on disposal of assets, net of tax, in continuing operations (9) 10
Litigation (recoveries)/charges, net, net of tax, in continuing operations 19 (13)
Loss on extinguishment of debt, net of tax, in continuing operations 37 -
Adjusted net earnings 1,472$ 1,327$
Fourth Third Second First Fourth Fourth Third Second First Fourth
Quarter Quarter Quarter Quarter Quarter Quarter Quarter Quarter Quarter Quarter
2015 2015 2015 2015 2014 2014 2014 2014 2014 2013
Total shareholders' equity 6,256$ 6,369$ 6,100$ 6,256$ 6,401$ 6,401$ 6,532$ 6,589$ 6,297$ 5,975$
Divided by average shareholders' equity 6,276$ 6,359$
Non-GAAP return on equity 23.4 % 20.9 %
Cardinal Health, Inc. and Subsidiaries
GAAP / Non-GAAP Reconciliation
Fiscal Year
We apply varying tax rates depending on the item’s nature and tax jurisdiction where it is incurred.
Schedule 8
(in millions) 2015 2014 2015 2014
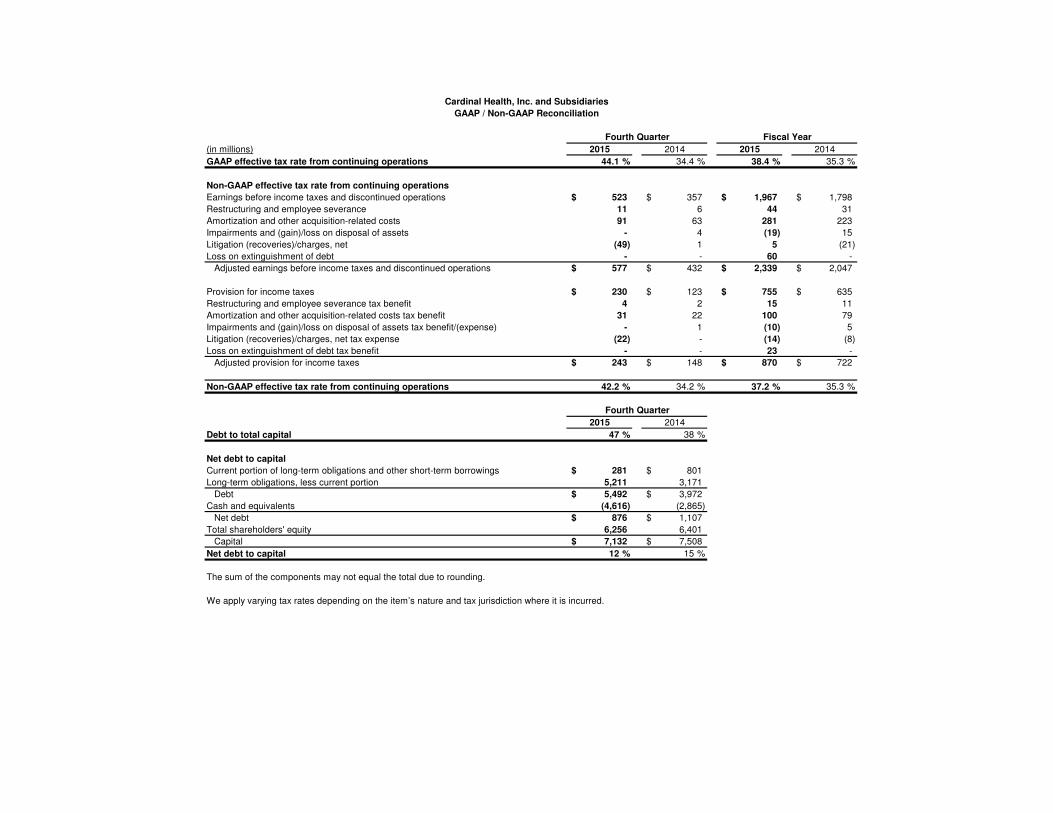
GAAP effective tax rate from continuing operations 44.1 % 34.4 % 38.4 % 35.3 %
Non-GAAP effective tax rate from continuing operations
Earnings before income taxes and discontinued operations 523$ 357$ 1,967$ 1,798$
Restructuring and employee severance 11 6 44 31
Amortization and other acquisition-related costs 91 63 281 223
Impairments and (gain)/loss on disposal of assets - 4 (19) 15
Litigation (recoveries)/charges, net (49) 1 5 (21)
Loss on extinguishment of debt - - 60 -
Adjusted earnings before income taxes and discontinued operations 577$ 432$ 2,339$ 2,047$
Provision for income taxes 230$ 123$ 755$ 635$
Restructuring and employee severance tax benefit 4 2 15 11
Amortization and other acquisition-related costs tax benefit 31 22 100 79
Impairments and (gain)/loss on disposal of assets tax benefit/(expense) - 1 (10) 5
Litigation (recoveries)/charges, net tax expense (22) - (14) (8)
Loss on extinguishment of debt tax benefit - - 23 -
Adjusted provision for income taxes 243$ 148$ 870$ 722$
Non-GAAP effective tax rate from continuing operations 42.2 % 34.2 % 37.2 % 35.3 %
2015 2014
Debt to total capital 47 % 38 %
Net debt to capital
Current portion of long-term obligations and other short-term borrowings 281$ 801$
Long-term obligations, less current portion 5,211 3,171
Debt 5,492$ 3,972$
Cash and equivalents (4,616) (2,865)
Net debt 876$ 1,107$
Total shareholders' equity 6,256 6,401
Capital 7,132$ 7,508$
Net debt to capital 12 % 15 %
We apply varying tax rates depending on the item’s nature and tax jurisdiction where it is incurred.
The sum of the components may not equal the total due to rounding.
Cardinal Health, Inc. and Subsidiaries
GAAP / Non-GAAP Reconciliation
Fiscal YearFourth Quarter
Fourth Quarter
1
2
3
4
5
6
Non-GAAP Diluted EPS from Continuing Operations: non-GAAP earnings from continuing operations divided by diluted weighted-average shares outstanding.
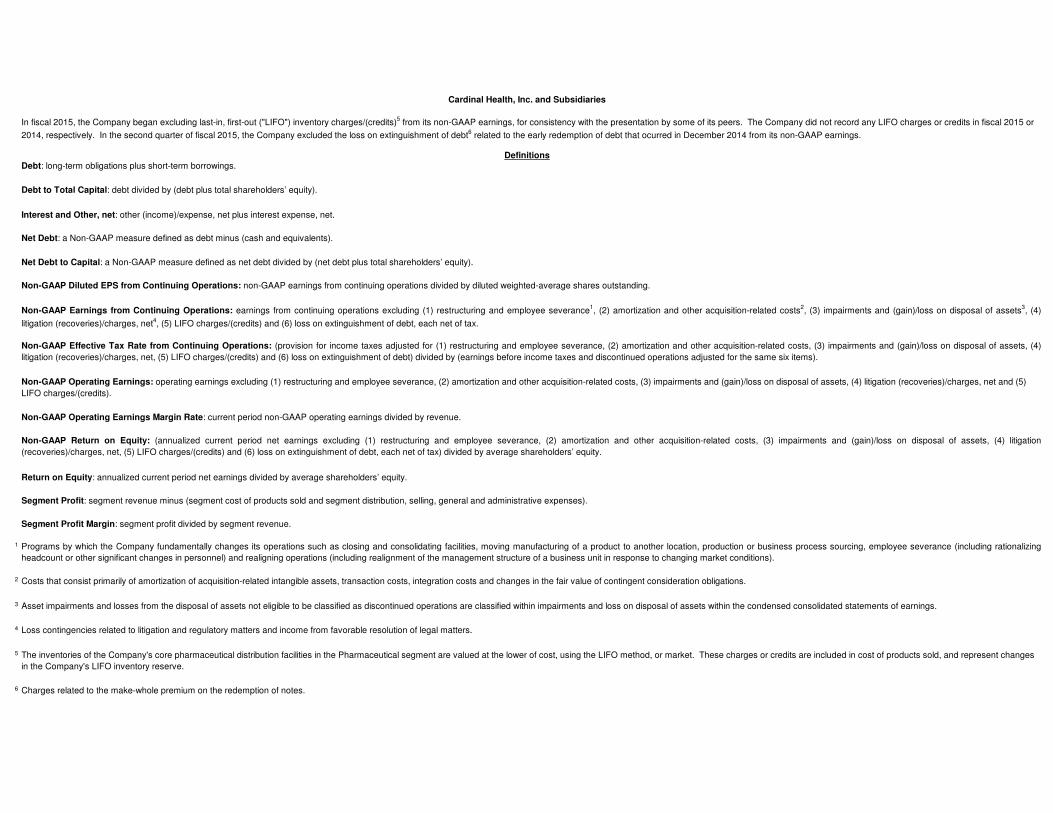
Cardinal Health, Inc. and Subsidiaries
DefinitionsDebt: long-term obligations plus short-term borrowings.
Debt to Total Capital: debt divided by (debt plus total shareholders’ equity).
Net Debt: a Non-GAAP measure defined as debt minus (cash and equivalents).
Net Debt to Capital: a Non-GAAP measure defined as net debt divided by (net debt plus total shareholders’ equity).
Interest and Other, net: other (income)/expense, net plus interest expense, net.
In fiscal 2015, the Company began excluding last-in, first-out ("LIFO") inventory charges/(credits)5 from its non-GAAP earnings, for consistency with the presentation by some of its peers. The Company did not record any LIFO charges or credits in fiscal 2015 or
2014, respectively. In the second quarter of fiscal 2015, the Company excluded the loss on extinguishment of debt6 related to the early redemption of debt that ocurred in December 2014 from its non-GAAP earnings.
Charges related to the make-whole premium on the redemption of notes.
Return on Equity: annualized current period net earnings divided by average shareholders’ equity.
Non-GAAP Operating Earnings Margin Rate: current period non-GAAP operating earnings divided by revenue.
Non-GAAP Earnings from Continuing Operations: earnings from continuing operations excluding (1) restructuring and employee severance1, (2) amortization and other acquisition-related costs2, (3) impairments and (gain)/loss on disposal of assets3, (4)
litigation (recoveries)/charges, net4, (5) LIFO charges/(credits) and (6) loss on extinguishment of debt, each net of tax.
Non-GAAP Effective Tax Rate from Continuing Operations: (provision for income taxes adjusted for (1) restructuring and employee severance, (2) amortization and other acquisition-related costs, (3) impairments and (gain)/loss on disposal of assets, (4)
litigation (recoveries)/charges, net, (5) LIFO charges/(credits) and (6) loss on extinguishment of debt) divided by (earnings before income taxes and discontinued operations adjusted for the same six items).
Non-GAAP Operating Earnings: operating earnings excluding (1) restructuring and employee severance, (2) amortization and other acquisition-related costs, (3) impairments and (gain)/loss on disposal of assets, (4) litigation (recoveries)/charges, net and (5)
LIFO charges/(credits).
Non-GAAP Return on Equity: (annualized current period net earnings excluding (1) restructuring and employee severance, (2) amortization and other acquisition-related costs, (3) impairments and (gain)/loss on disposal of assets, (4) litigation
(recoveries)/charges, net, (5) LIFO charges/(credits) and (6) loss on extinguishment of debt, each net of tax) divided by average shareholders’ equity.
Loss contingencies related to litigation and regulatory matters and income from favorable resolution of legal matters.
The inventories of the Company's core pharmaceutical distribution facilities in the Pharmaceutical segment are valued at the lower of cost, using the LIFO method, or market. These charges or credits are included in cost of products sold, and represent changes
in the Company's LIFO inventory reserve.
Segment Profit: segment revenue minus (segment cost of products sold and segment distribution, selling, general and administrative expenses).
Segment Profit Margin: segment profit divided by segment revenue.
Programs by which the Company fundamentally changes its operations such as closing and consolidating facilities, moving manufacturing of a product to another location, production or business process sourcing, employee severance (including rationalizing
headcount or other significant changes in personnel) and realigning operations (including realignment of the management structure of a business unit in response to changing market conditions).
Costs that consist primarily of amortization of acquisition-related intangible assets, transaction costs, integration costs and changes in the fair value of contingent consideration obligations.
Asset impairments and losses from the disposal of assets not eligible to be classified as discontinued operations are classified within impairments and loss on disposal of assets within the condensed consolidated statements of earnings.


![Announces Q4 & FY15 results [Result]](https://img.pdfslide.net/doc/110x75/577cb3551a28aba7118c3d58/announces-q4-fy15-results-result.jpg)