Embed Size (px)
Citation preview
QBE Insurance Group Annual report 2012
QBE is a major insurer of the mining sector, from leading global players to specialist service providers and smaller operations.
Madepossible by QBE
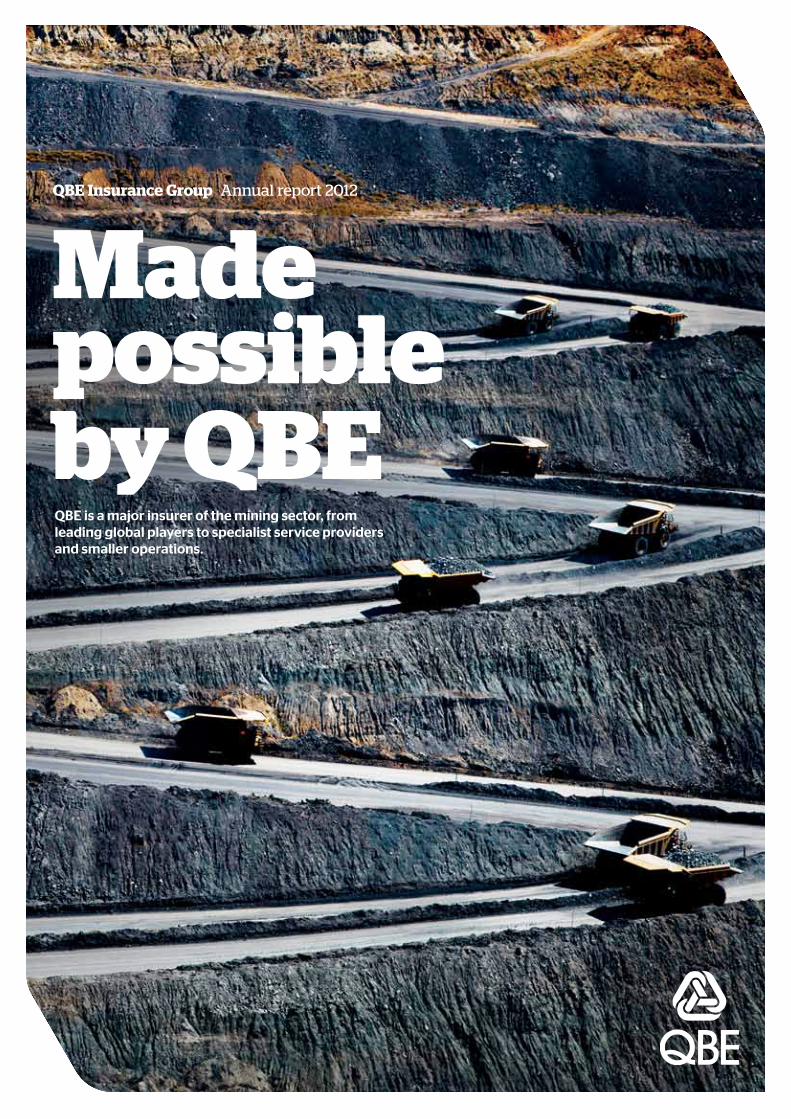
Contents
Chairman’s messageDelivering value to our stakeholders
Our operations around the worldAn overview of our six divisions and their operations
Group Chief Risk Officer's reportRisk: Our business
Spotlight on crop insuranceQBE’s crop insurance business covers nearly 100 crops spanning 52 million acres in the US
Group Chief Financial Officer’s reportFinancial strength and flexibility
In the communityThe QBE Foundation is our major corporate responsibility initiative
QBE Insurance Group Annual report 2012
QBE Insurance Group LimitedABN 28 008 485 014
Section 1Highlights & overview
2 Chairman’s message 6 Consolidated highlights 8 Group Chief Executive Officer’s report 14 Highlights by division
Section 2Business review
16 Group Chief Financial Officer’s report 26 Spotlight on crop insurance 30 North American Operations
business review 36 Latin American Operations
business review 42 European Operations business review 48 Australian & New Zealand Operations
business review 54 Asia Pacific Operations business review 60 Equator Re business review 64 In the community
Section 3Governance
66 Group Chief Risk Officer’s report 70 Board of directors 72 Group Executive Committee 74 Corporate governance statement
Section 4Directors' report
80 Directors’ report
Section 5Financial report
107 Financial report contents 108 Financial statements 112 Notes to the financial statements 173 Directors’ declaration
Section 6Other information
174 Independent auditor’s report 175 Shareholder information 179 Financial calendar 180 Material announcements to the ASX 181 10 year history 182 Glossary of insurance terms
Group Chief Executive Officer’s reportTurning possibilities into reality
2012 snapshotOverview of QBE’s full year financial performance
Gross written premium and net earned premium (US$M)
18,43415,798
18,29115,359
13,62911,362
11,2399,446
11,0159,293
2012
2011
2010
2009
2008
Gross written premium 1%
Net earned premium 3%
p. 2—5
p. 8—13
p. 6—7
p. 66—69
p. 26—29
p. 16—25
p. 64—65
p. 30—63
Oth
er in
form
ation
6
Fin
ancial
repo
rt
5
Bu
siness
review
2
Go
vern
ance
3
Directo
rs' rep
ort
4
QB
E In
suran
ce Gro
up
A
nn
ual rep
ort 20
12H
ighligh
ts &
ov
erview
1QBE has been one of the most successful insurers of the past two decades and, to continue that success, we must evolve.
We have reset our vision – to be the most successful global insurer and reinsurer in the eyes of our customers, our people, our shareholders and the community. Our vision lies at the heart of everything we do, driving both our internal and our external behaviours.
Our culture is described by our values and behaviours.
Open Minded
Networked
Empowered
Quality Approach
Business Acumen
Excellent Outcomes
Whatever way we choose to structure ourselves, whatever products and services we offer, we are ONE QBE.
Our strategy describes the way we will achieve our vision and how we will create value.
•Leadership in our core businesses
•Operational excellence – global reach and scale
•Financial strength and flexibility
•Profitable growth and diversification
Our strategy is underpinned by a commitment to developing world-class talent and leadership.
We are in the business of managing risk. We understand risk and, in an increasingly volatile world, we believe our ability to manage risk makes it possible for things to happen.
• For our customers to turn their business ambitions into reality
• For our people to realise their abilities and potential
• For our shareholders to grow their long-term wealth
• For the communities in which we operate to develop and prosper
Our aim is to make your vision a reality.
All amounts in this report are US dollars unless otherwise stated.
1
Chairman’s message
Delivering value to our stakeholdersQBE’s strength lies in the international scale and diversity of its operations and the local expertise of its people. QBE has large, well-established and valuable franchises in the major markets in which we operate. Market conditions in recent years have challenged our long record of profitable growth. In order to manage the challenges of increasingly competitive insurance markets, the Board has adopted a refreshed strategy and vision designed to enhance value for all our stakeholders.
QBE’s strategic mission is to become a truly global insurer and reinsurer that thinks and acts as one company, which is critical to unlocking our full potential. We believe a shared vision and purpose across the Group will underpin our future success.
2012Against the backdrop of greatly reduced investment yields and adverse catastrophe experience, the last few years have proved challenging for insurers and reinsurers. This trend continued in 2012. The natural disasters of 2010 and 2011 were followed in 2012 by a severe drought in the US impacting crop yields and then in October by Superstorm Sandy. In addition, a review of our underperforming and run-off portfolios in the US led to a strengthening of the claims provision for our North American Operations and a subsequent downgrade of our profit forecast for the year. Reflecting the challenging year for QBE and the global insurance industry, QBE’s share price underperformed the broader market.
While North American Operations underperformed, European, Australian & New Zealand, Asia Pacific and Latin American Operations produced strong results. In addition, our investments team produced an above target net yield of 4.1% on our $31.5 billion portfolio of cash and investments.
The Board is confident that the remediation work undertaken has significantly strengthened our business. Underlying results are trending favourably and the equity and debt capital raised during the year position us well heading into 2013. There are signs of a modest recovery in the commercial insurance market after a number of years of weakness, with premium rate increases starting to reflect the historically low interest rate environment.
Although the Board is disappointed with the final outcome for 2012, we believe we have addressed a number of key market concerns and have put in place a strong foundation on which to build towards our vision.
Leadership in a year of transition 2012 was also a landmark year for QBE with the appointment of John Neal as Group Chief Executive Officer following the retirement of Frank O’Halloran in August. Frank was the architect of QBE’s successful international expansion and growth into the ranks of the top 20 insurance and reinsurance companies. After a number of years of strong acquisition-driven growth, QBE is entering a new stage of development.
The growth and maturity of the business in recent years has brought with it a need for an increased focus on collaboration across QBE, with the divisional CEOs having a greater degree of accountability and involvement in the Group’s direction, together with a higher level of cross divisional interaction. While we are still in the early days of John Neal’s leadership, QBE has commenced the cultural change that the Board believes is required. We have reset our vision and values and implemented a strategy to transform QBE into a truly global insurer and reinsurer. As part of the rollout of the refreshed vision and strategy, changes were made to the organisational structure including the combination of Australian & New Zealand Operations into a new reporting segment, the establishment of >
2
Oth
er in
form
ation
6
Fin
ancial
repo
rt
5
High
lights
& o
verv
iew
1
Bu
siness
review
2
Go
vern
ance
3
Directo
rs' rep
ort
4
QB
E In
suran
ce Gro
up
A
nn
ual rep
ort 20
12
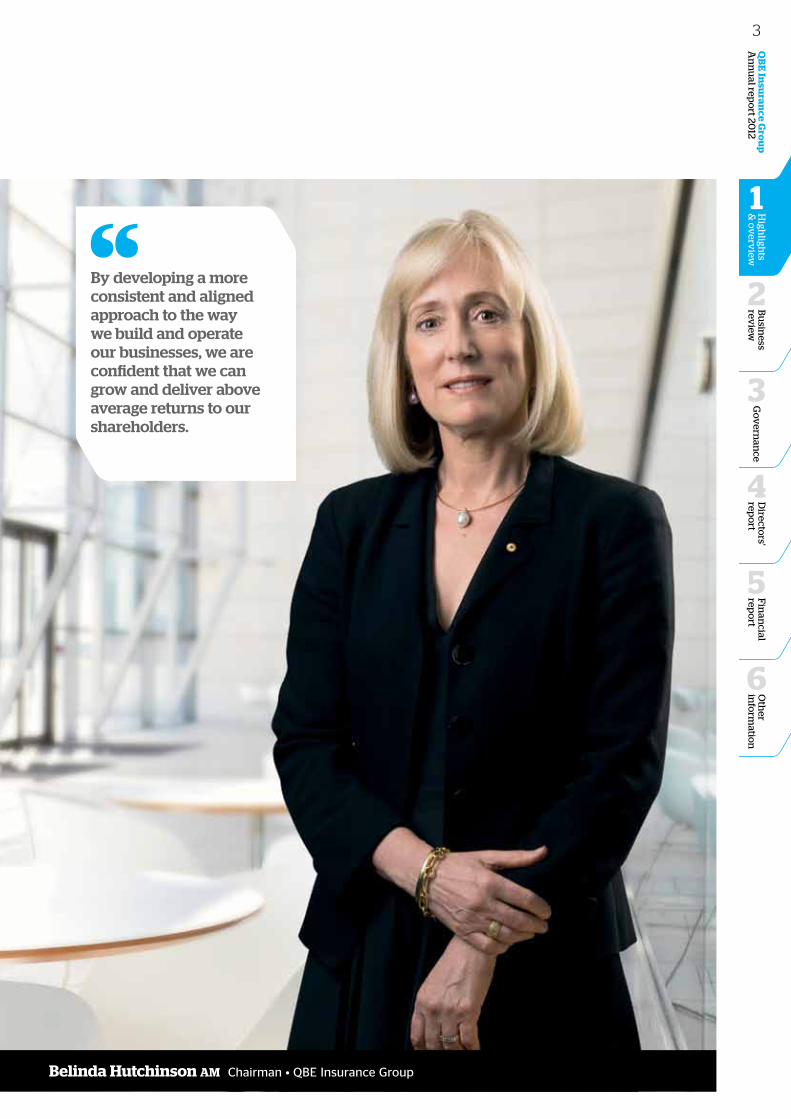
Belinda Hutchinson AM Chairman • QBE Insurance Group
By developing a more consistent and aligned approach to the way we build and operate our businesses, we are confident that we can grow and deliver above average returns to our shareholders.
3
Asia Pacific Operations as a stand alone reporting segment with a new CEO commencing in 2013 and the creation of a new position to head our global operational transformation program.
As part of our ongoing commitment to improving the company's governance and performance, we commissioned an independent audit to understand investor perceptions across a range of areas which we had identified in our own review over the past year. One key finding was the need for further diversification of the Board's geographic experience and market expertise as we grow and expand globally. In August, we appointed the US-based insurance and financial services industry expert, John Graf, as a non-executive director, enhancing the insurance industry experience of the Board. We are planning further appointments as the business develops. Our long serving non-executive director, Len Bleasel, retired from the Board in September and we thank him for his commitment and service to QBE over many years.
We believe we now have a strong foundation on which to build towards our refreshed vision – to be the most successful global insurer and reinsurer in the eyes of our customers, our people, our shareholders and the community.
Delivering value to shareholders We recognise that QBE’s share price performance over recent years has been disappointing. Our focus in 2013 is on supporting management to implement its strategy of growing the profitability of our core businesses by leveraging our global capabilities. We support management’s plans to realise at least $250 million in annual run-rate benefits by the end of 2015 as a result of the strategic shift from our regionally based operating model into that of a fully integrated global insurance company. These plans should allow the company to produce a market-leading combined operating ratio and insurance margin.
Our 2013 outlook anticipates a significantly improved return on shareholders’ equity as discussed further in the Group Chief Executive Officer’s report.
Throughout the year, I met with many shareholders to hear their views. Your Board has taken note of the concerns raised by shareholders. In particular, shareholders confirmed that they shared the Board's view about the importance of robust and conservative capital management, including the sustainability of QBE’s dividend over the longer term. As part of this exercise, your Board has reconsidered the Group's dividend policy and, for 2013 and onwards, has agreed a payout ratio of up to 50% of cash profit i.e. reported net profit after tax but before amortisation and impairment of intangibles and tax thereon. Given that goodwill and intangibles are excluded from our capital base for regulatory and ratings agency purposes, the Board regards cash profit to be a more relevant measure of profitability for the purposes of determining the Group’s dividend. This reduced payout ratio will assist QBE to retain capital to fund its ongoing expansion and meet the more stringent capital adequacy requirements being imposed by regulators and rating agencies.
We recognise that some shareholders will be disappointed with the lower proposed dividend; however, we must balance our obligations to maintain financial strength and flexibility with an appropriate dividend policy.
The Board meets key regulators on a routine basis. Whilst we are satisfied that QBE is comfortably within the capital adequacy requirements set by the various regulatory authorities, there remains uncertainty around foreshadowed amendments to the rating criteria used by Standard & Poor’s (S&P). We will continue to work with S&P and other agencies regarding the current ratings outlook. QBE’s capital adequacy multiple at 31 December 2012 was 1.7 times the minimum requirement set by the Australian Prudential Regulation Authority’s risk-based capital approach for Australian insurance groups.
We also took further steps during the year to improve our communication to the market and to provide more transparency on our various businesses. We recognise the need for consistency in our communications, delivering results which meet our published targets with no surprises.
Chairman’s message4

Oth
er in
form
ation
6
Fin
ancial
repo
rt
5
High
lights
& o
verv
iew
1
Bu
siness
review
2
Go
vern
ance
3
Directo
rs' rep
ort
4
QB
E In
suran
ce Gro
up
A
nn
ual rep
ort 20
12
Delivering value to our customers As a global insurer, our customers include brokers and agents, small to large businesses and individuals. QBE has a broader footprint than most insurers in terms of products and services, distribution channels and geographic reach. By joining deep technical expertise with broad market and industry relationships, we have a combination that few, if any, of our competitors can replicate. Working as individuals we are good, but what makes us successful is the way we collaborate to provide solutions which are not available elsewhere.
We have made a definitive statement – to be the most successful. You might ask why this is important. Being a leader affords us many advantages – our global scale and breadth positions us so that brokers and potential clients actively seek out QBE to take advantage of QBE’s specialist knowledge in our chosen market segments.
Meeting the needs of QBE’s people and communities QBE recognises that as society changes, so do the skills and expectations of our workforce. To attract, motivate and retain the best people, we understand it is important to have a workplace that is responsive to the professional and personal needs of our employees. QBE aims to create a workplace that is fair and inclusive. We offer a range of programs to support the continued success of our employees. We have invested in a range of leadership programs aimed at supporting our leaders through the key stages in their careers at QBE, including greater access to inter-divisional mobility and development opportunities. Our global flexible working policy and parental leave transition programs help employees balance their professional and personal lives.
QBE seeks to make a positive impact in the communities in which it operates. The Group’s values, which drive the day to day behaviour of our people, recognise QBE’s responsibilities to the community. We strive to contribute to economic and social development and help make it possible for the communities in which we operate to thrive and prosper. We set ourselves high standards
of corporate governance and seek to operate in a socially responsible and ethical way. QBE also places great importance on constructive interaction with the communities in which we operate. In 2011, the QBE Foundation was launched to create a coordinated platform for QBE and its employees to engage with the community. The Foundation not only seeks to support vocational opportunities globally through philanthropy but also encourages QBE's employees to be more involved in community-based initiatives.
The road ahead QBE’s business has grown and developed a great deal in recent years. We will continue our evolution towards becoming a more cohesive, global organisation. In doing so, we will retain the characteristics which have made us great – the entrepreneurial spirit, the deep expertise in underwriting and distribution and the breadth of our local relationships. Most importantly, we will continue to work together to offer solutions to our customers.
Our major stakeholders will have different demands and view success through various lenses. Our aim is to provide value to all, and to hear them say “our success was made possible by QBE”. I am confident that after the challenges of the last few years, we have built a solid platform for future profitable growth.
On behalf of the Board, I wish to acknowledge the hard work and contribution of QBE staff around the world. We thank you for your commitment to the task in a year of challenges and change.
Finally, I wish to thank my fellow directors for their diligence and valuable advice to and support of the management team during a year of transition.
BJ Hutchinson AM Chairman
5
Consolidated highlights
2012 snapshot
Performance
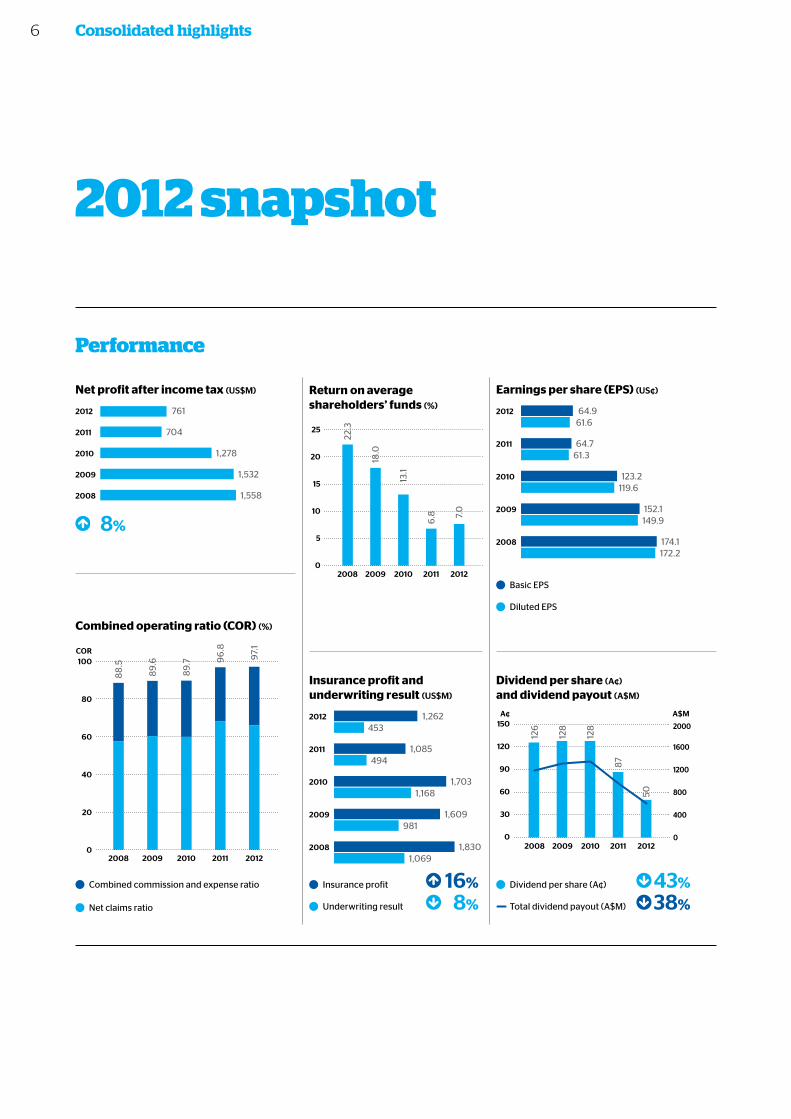
Net profit after income tax (US$M)
761
704
1,278
1,532
1,558
2012
2011
2010
2009
2008
8%
Combined operating ratio (COR) (%)
0
20
40
60
80
100COR
88
.5
89
.6
89
.7 96
.8
97.
1
2008 2009 2010 2011 2012
Combined commission and expense ratio
Net claims ratio
Earnings per share (EPS) (US¢)
64.961.6
64.761.3
123.2119.6
152.1149.9
174.1172.2
2012
2011
2010
2009
2008
Basic EPS
Diluted EPS
Dividend per share (A¢) and dividend payout (A$M)
0
400
800
1200
1600
2000
A$M
126
128
128
87
50
2008 2009 2010 2011 2012
A¢
Dividend per share (A¢) 43%
Total dividend payout (A$M) 38%
0
30
60
90
120
150
Insurance profit and underwriting result (US$M)
1,262453
1,085494
1,7031,168
1,609981
1,8301,069
2012
2011
2010
2009
2008
Insurance profit 16%
Underwriting result 8%
Return on average shareholders’ funds (%)
0
5
10
15
20
25
22.3
18.0
13.1
6.8 7.
0
2008 2009 2010 2011 2012
6
Oth
er in
form
ation
6
Fin
ancial
repo
rt
5
High
lights
& o
verv
iew
1
Bu
siness
review
2
Go
vern
ance
3
Directo
rs' rep
ort
4
QB
E In
suran
ce Gro
up
A
nn
ual rep
ort 20
12
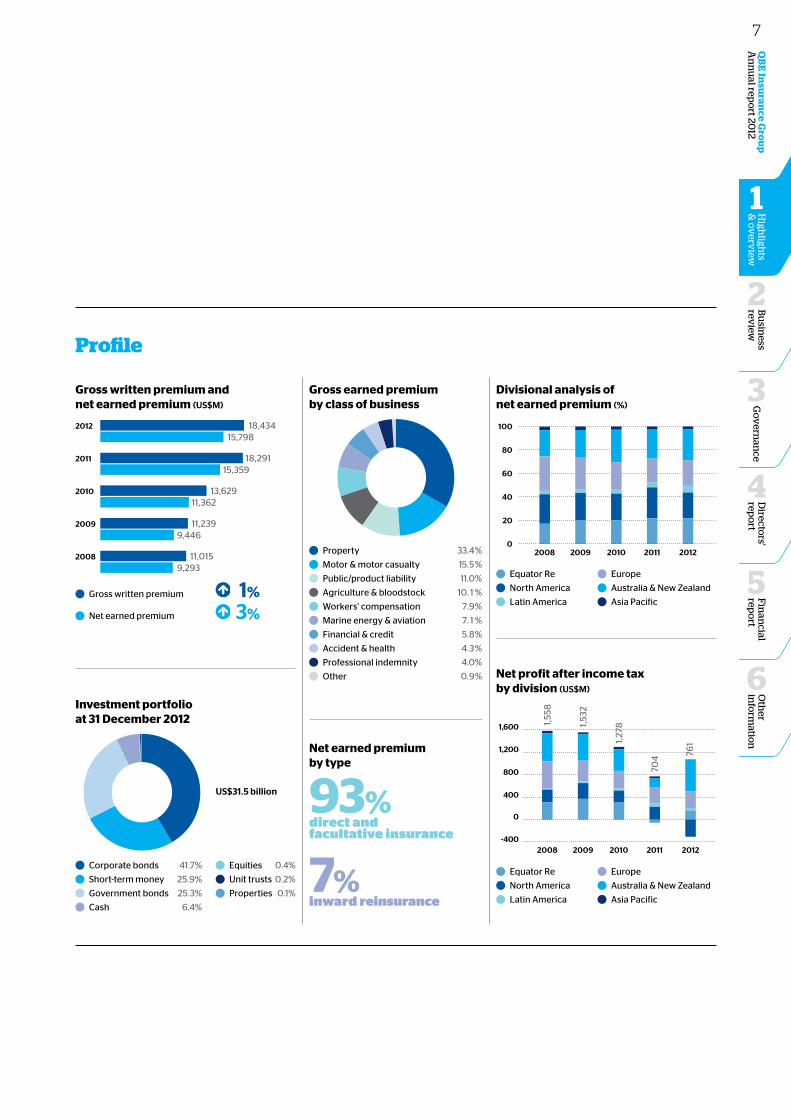
Profile
Gross written premium and net earned premium (US$M)
18,43415,798
18,29115,359
13,62911,362
11,2399,446
11,0159,293
2012
2011
2010
2009
2008
Gross written premium 1%
Net earned premium 3%
Divisional analysis of net earned premium (%)
0
20
40
60
80
100
2008 2009 2010 2011 2012
Equator Re
North America
Latin America
Europe
Australia & New Zealand
Asia Pacific
Gross earned premium by class of business Other
Prof Indem
Accident
Fin
Marine
WC
Agri
Liability
Motor
Property
Property
Motor & motor casualty
Public/product liability
Agriculture & bloodstock
Workers’ compensation
Marine energy & aviation
Financial & credit
Accident & health
Professional indemnity
Other
4
5
0
1
9
1
8
3
0%
9
33.
15.
11.
10.
7.
7.
5.
4.
4.
0.
%
%
%
%
%
%
%
%
% Net profit after income tax by division (US$M)
400
0
-400
800
1,200
1,600
2008 2009 2010 2011 2012
1,55
8
1,53
2
1,27
8
704 76
1
Equator Re
North America
Latin America
Europe
Australia & New Zealand
Asia Pacific
Investment portfolio at 31 December 2012 Prop
Unit trusts
Equities
Cash
Gov bonds
ST Money
Corp bondsCorporate bonds 41.7%
US$31.5 billion
Short-term money 25.9%
Government bonds 25.3%
Equities 0.4%
Unit trusts 0.2%
Properties 0.1%
Cash 6.4%
93%direct and facultative insurance
7%inward reinsurance
Net earned premium by type
7

Group Chief Executive Officer’s report
John Neal Group Chief Executive Officer • QBE Insurance Group
We have set out a clear vision for the future as we look to meet our obligations to our policyholders, fulfil the expectations of our shareholders, excite our people and be trusted and valued by the communities in which we do business.
8
Oth
er in
form
ation
6
Fin
ancial
repo
rt
5
High
lights
& o
verv
iew
1
Bu
siness
review
2
Go
vern
ance
3
Directo
rs' rep
ort
4
QB
E In
suran
ce Gro
up
A
nn
ual rep
ort 20
12
Turning possibilitiesinto reality2012 has shown once again the importance of insurance in a world still economically challenged and where natural catastrophes have become regular headline news. Going forward, our objective is to prudently manage risk while carefully balancing the security our insurance policies offer with the returns our shareholders expect.
Year in review Before discussing the key performance drivers and influences on our 2012 result, it is worth reflecting upon 2012 which was a year of transition for QBE in a number of respects. After more than 36 years with QBE and 15 years as Group CEO, Frank O’Halloran retired in August 2012. As with any change in leadership, we took the opportunity to review our diverse global insurance and reinsurance interests and to affirm and reposition our strategy for future profitable growth.
A snapshot of the 2012 result is set out on pages 6 to 7. Insurance profit was up 16% to $1,262 million based on a broadly unchanged combined operating ratio of 97.1%. A strong investment performance lifted the insurance profit margin to 8.0% compared with 7.1% last year. The overall underwriting result was disappointing mainly due to adverse prior accident year claims development. We also decided to strengthen the Group's risk margins. More details are provided later in this report.
Net profit after tax (NPAT) before non-cash charges for amortisation and impairment of intangibles (cash profit) was $1,042 million, up 32% from last year. Reported NPAT was $761 million, an increase of 8% compared with $704 million in 2011. The headline NPAT was adversely impacted by an increase in amortisation and impairment charges following changes to the structure and operation of our business, predominantly in North America. Further details are provided in the Group Chief Financial Officer’s Report on page 16.
Assisted by strong operating cash flow, our in-house managed investment portfolio grew to $31.5 billion from $28.0 billion last year. Whilst global interest rates fell to all time lows, the Group’s investment returns were well ahead of expectations, benefiting from narrowing credit spreads and strong equity returns.
In response to the increased catastrophe experience of 2011 and historically low interest rates, the pricing of our insurance products increased on average by slightly in excess of 5%, comfortably outstripping generally benign claims inflation. Despite this modest firming of premium rates, QBE achieved gross written premium growth of only 1%. Additional premium income generated by price increases, organic growth initiatives and bolt-on acquisitions was largely offset by the impact of portfolio remediation initiatives (the deliberate shedding of inadequately priced risks), lower soft commodity prices impacting our US crop portfolio and a gradual recovery in the US economy adversely impacting lender-placed homeowner volumes.
Our renewed focus on diligent use of our underwriting capacity in a manner consistent with our risk management protocols is demonstrated by the portfolio remediation undertaken in our Australian & New Zealand Operations following unacceptably high claims costs in 2011. This division delivered a substantially improved result in 2012, reflecting an increased focus on technical pricing discipline, risk selection and portfolio management. The very material improvement in the attritional claims ratio and the fact that our catastrophe experience was lower than our market share in Australia during 2012 represent tangible evidence that the remedial actions taken over the past 18 months were appropriate and well considered.
In 2012, worldwide insured catastrophe losses were around $65 billion compared with $119 billion in 2011. Although lower than the prior year, 2012 catastrophe losses were still above the 10 year industry average of $50 billion. Moreover, 90% or nearly $59 billion of the 2012 losses occurred in the US (compared with only $32 billion in 2011) underpinned by substantial crop claims stemming from the worst drought conditions for over 50 years and Superstorm Sandy, the second largest hurricane in US history. >
9
Group Chief Executive Officer’s report
Given that QBE derives around 36% of gross written premium from US licensed entities, and we also have US exposure through business written in our European Operations, it is not surprising that these two events severely impacted the profits of our largest division and the Group as a whole.
Notwithstanding improved or stable profitability across most of our other divisions, the Group’s overall 2012 underwriting result was extremely disappointing, tarnished by $464 million of adverse prior accident year claims development which largely related to North America and Equator Re, partly offset by releases in Australian & New Zealand and Asia Pacific Operations. The poor underwriting result also reflects the decision to strengthen the Group’s risk margins by $88 million or 7%, thereby improving the probability of adequacy of outstanding claims.
Together these items impacted our combined operating ratio by 3.5% and our net profit after tax by $475 million.
As the final step in the remediation of our US program business, in mid-2012 we established a standalone unit to manage the run-off of $1.2 billion of gross claims provisions. Multiple claims reviews led to the recognition of $236 million of prior accident year development with a further $80 million relating to a number of other US portfolios, following a rigorous and comprehensive year end review of our outstanding claims provision.
Partially offsetting the benefit of Equator Re’s improved catastrophe experience was $235 million of prior accident year claims development (excluding inward quota shares). These claims reflect the unusual catastrophe experience of 2011 as outlined in our 2012 interim result and development on a number of portfolios, notably in North America and Europe, where we took the decision to strengthen claims provisions on some longer tail liability classes.
Our Australian & New Zealand Operations enjoyed favourable central estimate provision releases. Asia Pacific Operations also benefited from prior year claims releases as did some portfolios in our European Operations.
In addition to a thorough year end review by our in-house divisional and head office actuarial teams, the Group’s $22.8 billion gross claims provision was also subject for the first time to a coordinated global actuarial review by a single firm of independent actuaries. In addition to the actions we have taken, the assessment of the independent external actuaries is that our claims central estimate is appropriate, giving us a valuable external perspective. The prior accident year claims strengthening and risk margin top up, coupled with aggressive portfolio remediation initiatives and the additional year end provisioning focus, give us confidence in the appropriateness of our year end claims provision.
The Group’s overall probability of adequacy of outstanding claims stands at 87.5% compared with 86.3% at the end of 2011.
There has been much discussion in 2012 about our two specialty businesses in the US. Our crop business suffered at the hands of one of the worst US droughts on record but will, I am confident, exceed our hurdle return expectations over time. Our lender-placed insurer provides a bespoke set of loan tracking and insurance products to the US banks and their customers. We were pleased to conclude our pricing negotiations satisfactorily with a number of key state regulators in February 2013 and believe we can profitably grow this business over the medium term.
We are disappointed in our 2012 underwriting result but are confident in the broader remediation plans we have in place to improve the future underwriting results of targeted portfolios. We have also taken action to strengthen the balance sheet as discussed in greater detail in the Chief Financial Officer’s report on page 16.
Made possible by QBE Our strategy and value creation model
Our vision is to be the most successful global insurer and reinsurer in the eyes of our customers, our people, our shareholders and the community. In order to achieve our vision, we are committed to increasing the intrinsic value of our company and to delivering a significant increase in shareholder returns.
Our brand should espouse our vision and explain how we benefit our stakeholders – “Made possible by QBE” encapsulates that vision and is very clearly demonstrated in our US crop case study on page 26.
We have developed a clear strategy and set of priorities designed to significantly enhance the value of QBE. This is captured in the value creation model illustrated on page 11.
Delivery of excellent performance sits at the heart of what we aim to do. Our immediate focus is always to deliver against our stated targets consistently and in full – to “say what we do and do what we say”. Our historical focus on profitability remains but we also recognise that delivering profitable growth in line with targets underpins our ability to fund future growth and increase shareholder wealth.
We will pursue our vision through a strategy that is designed to be iterative and cumulative, each component building and supporting the overall goal of creating value.
Not all parts of our value creation model will be in play at all times. As part of the strategic management process, QBE’s Group Executive prioritises and focuses its activities according to the state of the market and our internal requirements.
10
Oth
er in
form
ation
6
Fin
ancial
repo
rt
5
High
lights
& o
verv
iew
1
Bu
siness
review
2
Go
vern
ance
3
Directo
rs' rep
ort
4
QB
E In
suran
ce Gro
up
A
nn
ual rep
ort 20
12
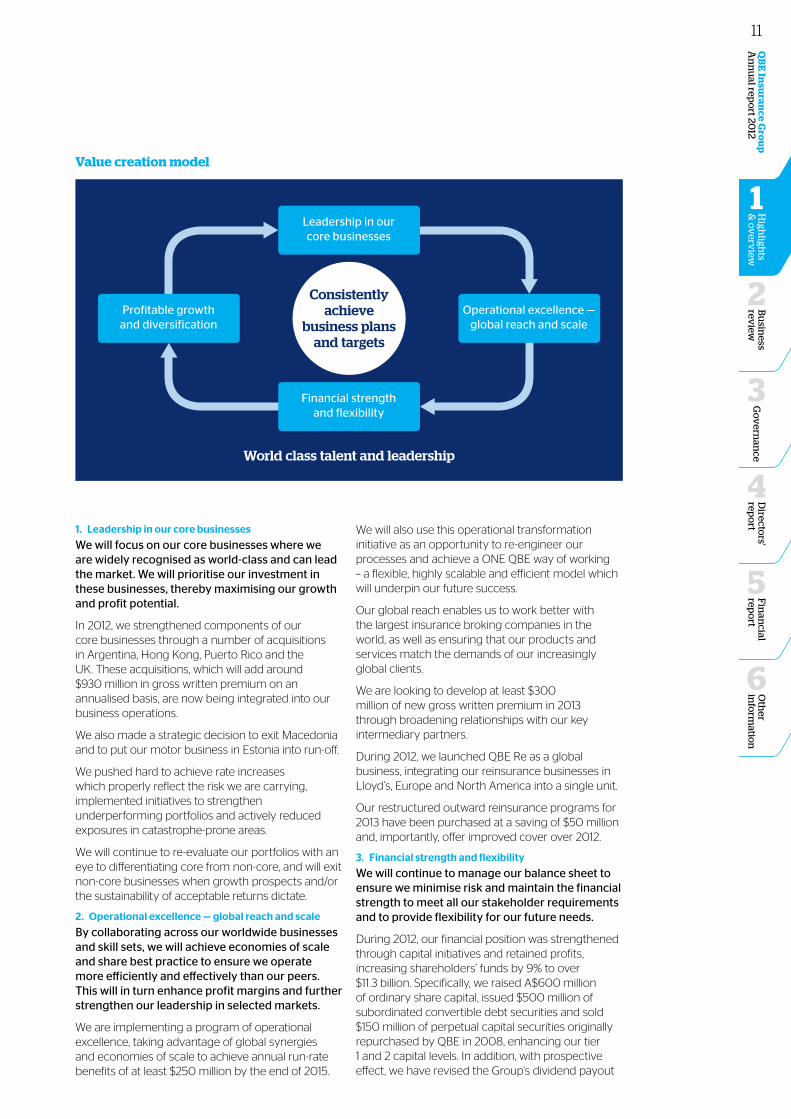
Value creation model
1. Leadership in our core businesses
We will focus on our core businesses where we are widely recognised as world-class and can lead the market. We will prioritise our investment in these businesses, thereby maximising our growth and profit potential.
In 2012, we strengthened components of our core businesses through a number of acquisitions in Argentina, Hong Kong, Puerto Rico and the UK. These acquisitions, which will add around $930 million in gross written premium on an annualised basis, are now being integrated into our business operations.
We also made a strategic decision to exit Macedonia and to put our motor business in Estonia into run-off.
We pushed hard to achieve rate increases which properly reflect the risk we are carrying, implemented initiatives to strengthen underperforming portfolios and actively reduced exposures in catastrophe-prone areas.
We will continue to re-evaluate our portfolios with an eye to differentiating core from non-core, and will exit non-core businesses when growth prospects and/or the sustainability of acceptable returns dictate.
2. Operational excellence — global reach and scale
By collaborating across our worldwide businesses and skill sets, we will achieve economies of scale and share best practice to ensure we operate more efficiently and effectively than our peers. This will in turn enhance profit margins and further strengthen our leadership in selected markets.
We are implementing a program of operational excellence, taking advantage of global synergies and economies of scale to achieve annual run-rate benefits of at least $250 million by the end of 2015.
We will also use this operational transformation initiative as an opportunity to re-engineer our processes and achieve a ONE QBE way of working – a flexible, highly scalable and efficient model which will underpin our future success.
Our global reach enables us to work better with the largest insurance broking companies in the world, as well as ensuring that our products and services match the demands of our increasingly global clients.
We are looking to develop at least $300 million of new gross written premium in 2013 through broadening relationships with our key intermediary partners.
During 2012, we launched QBE Re as a global business, integrating our reinsurance businesses in Lloyd’s, Europe and North America into a single unit.
Our restructured outward reinsurance programs for 2013 have been purchased at a saving of $50 million and, importantly, offer improved cover over 2012.
3. Financial strength and flexibility
We will continue to manage our balance sheet to ensure we minimise risk and maintain the financial strength to meet all our stakeholder requirements and to provide flexibility for our future needs.
During 2012, our financial position was strengthened through capital initiatives and retained profits, increasing shareholders’ funds by 9% to over $11.3 billion. Specifically, we raised A$600 million of ordinary share capital, issued $500 million of subordinated convertible debt securities and sold $150 million of perpetual capital securities originally repurchased by QBE in 2008, enhancing our tier 1 and 2 capital levels. In addition, with prospective effect, we have revised the Group's dividend payout
Leadership in our core businesses
Financial strength and flexibility
World class talent and leadership
Consistently achieve
business plans and targets
Profitable growth and diversification
Operational excellence — global reach and scale
11
Group Chief Executive Officer’s report
ratio to a more conservative approach based on cash profit. More details are provided in the Chief Financial Officer's report on page 16.
We continue to carefully manage our investment portfolio by seeking low-risk strategies that will enhance returns in the ongoing low interest rate environment while, at the same time, reducing overall portfolio volatility. In this regard, plans are underway for a cautious entry into property and infrastructure-related debt instruments in 2013.
Our provision for outstanding claims was strengthened and risk margins increased, improving our overall probability of adequacy.
4. Profitable growth and diversification
We will pursue our ambition for further growth and profitability by expanding into new products, markets and territories where we believe we can build leadership positions.
In 2012, we undertook a fundamental review of our Asian strategy and business model. Our intention is to build upon the Group’s many years of experience and broad footprint in the region by better exploiting our core product set, building on established intermediary relationships and exploiting advantages in technology.
Since our entry into Latin America 12 years ago, the division has grown substantially through acquisition into one of the leading franchises in the region. In 2012, we acquired businesses in both Argentina and Puerto Rico, further adding to the scale and diversity of our Latin American Operations and underpinning our expectations for $1.5 billion of gross written premium in 2013.
We will complete the integration of our 2012 acquisitions in Latin America and Asia and will implement our growth strategy in Asia.
We are forecasting net earned premium growth in Asia and Latin America in excess of 20% whilst still achieving the Group’s performance hurdles.
We currently have no plans to expand into new geographies in 2013.
We envisage limited acquisition activity during 2013, and only where a strong business case exists to support an established profitable business.
Our value creation model is underpinned by our people ONE QBE – our culture
Our value creation model is underpinned by one absolute belief – our ultimate key differentiator has to be our people. Consistent with this belief, we are implementing a global model designed to develop world-class talent and leadership.
In 2012, we took the opportunity to refresh our vision and values and the way in which we communicate our brand internally and externally. Our people are our most precious asset and a strong culture builds the best platform for success for QBE and therefore for all of our stakeholders.
In parallel with day to day challenges and the achievement of targets and business plans, in 2012 we began the transformation of our business towards our refreshed vision. We are progressing on two fronts – internally and externally.
Our people and the way they interact are fundamental to our success. Our unique culture has provided the cornerstone for our success. Recognising the changing social environment and business demands, we have refreshed and modernised the way we describe this. The values and behaviours that describe our culture are represented by the acronym ONE QBE as outlined on page 1 of the annual report. These values and behaviours form the common thread that makes us think and act as one company, whenever and wherever we do business in the world.
ONE QBE is embedded in the language we use internally, in our learning and development and in our performance management systems. You won’t see it explicitly in our marketing materials or documentation, but you will see it in our people – in the way they work with you, in their decision making and in their collaboration with the market and with each other.
In late 2012, we began the ONE QBE roll out across our entire organisation. Through a series of interactive workshops, all 17,000 of our people will get a chance to think about what it means for them and how they can contribute towards our vision.
12
Oth
er in
form
ation
6
Fin
ancial
repo
rt
5
High
lights
& o
verv
iew
1
Bu
siness
review
2
Go
vern
ance
3
Directo
rs' rep
ort
4
QB
E In
suran
ce Gro
up
A
nn
ual rep
ort 20
12
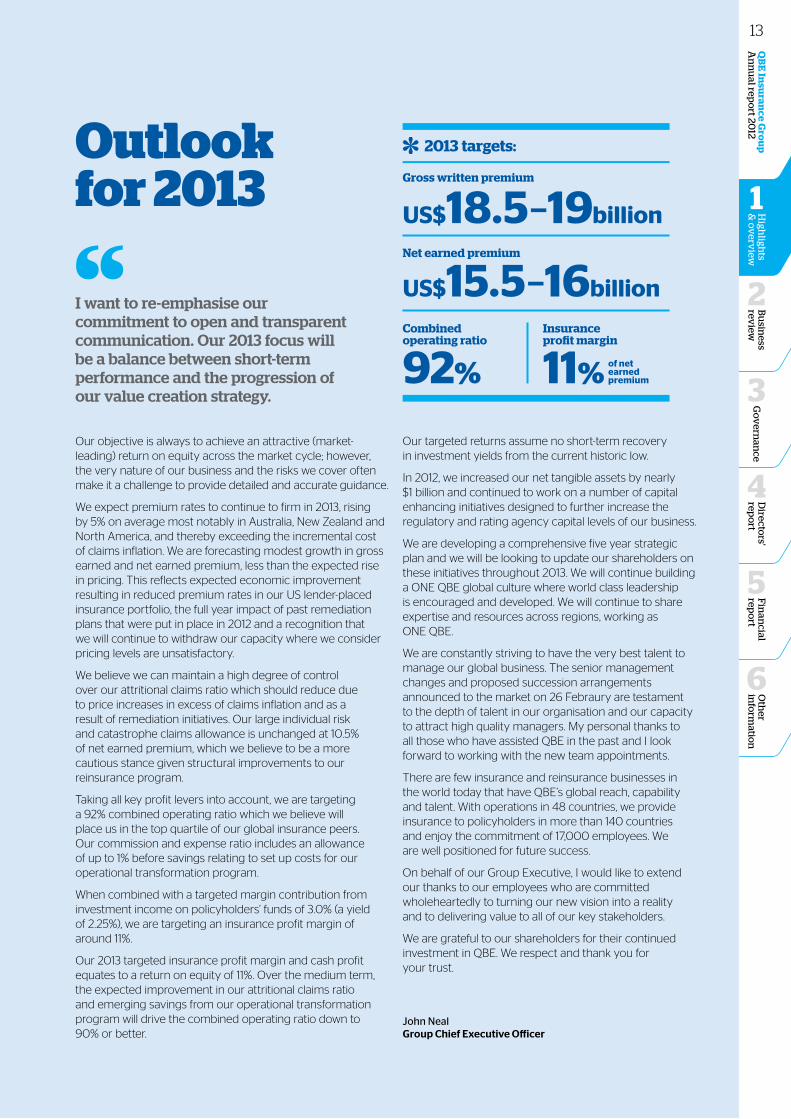
Our objective is always to achieve an attractive (market-leading) return on equity across the market cycle; however, the very nature of our business and the risks we cover often make it a challenge to provide detailed and accurate guidance.
We expect premium rates to continue to firm in 2013, rising by 5% on average most notably in Australia, New Zealand and North America, and thereby exceeding the incremental cost of claims inflation. We are forecasting modest growth in gross earned and net earned premium, less than the expected rise in pricing. This reflects expected economic improvement resulting in reduced premium rates in our US lender-placed insurance portfolio, the full year impact of past remediation plans that were put in place in 2012 and a recognition that we will continue to withdraw our capacity where we consider pricing levels are unsatisfactory.
We believe we can maintain a high degree of control over our attritional claims ratio which should reduce due to price increases in excess of claims inflation and as a result of remediation initiatives. Our large individual risk and catastrophe claims allowance is unchanged at 10.5% of net earned premium, which we believe to be a more cautious stance given structural improvements to our reinsurance program.
Taking all key profit levers into account, we are targeting a 92% combined operating ratio which we believe will place us in the top quartile of our global insurance peers. Our commission and expense ratio includes an allowance of up to 1% before savings relating to set up costs for our operational transformation program.
When combined with a targeted margin contribution from investment income on policyholders’ funds of 3.0% (a yield of 2.25%), we are targeting an insurance profit margin of around 11%.
Our 2013 targeted insurance profit margin and cash profit equates to a return on equity of 11%. Over the medium term, the expected improvement in our attritional claims ratio and emerging savings from our operational transformation program will drive the combined operating ratio down to 90% or better.
Our targeted returns assume no short-term recovery in investment yields from the current historic low.
In 2012, we increased our net tangible assets by nearly $1 billion and continued to work on a number of capital enhancing initiatives designed to further increase the regulatory and rating agency capital levels of our business.
We are developing a comprehensive five year strategic plan and we will be looking to update our shareholders on these initiatives throughout 2013. We will continue building a ONE QBE global culture where world class leadership is encouraged and developed. We will continue to share expertise and resources across regions, working as ONE QBE.
We are constantly striving to have the very best talent to manage our global business. The senior management changes and proposed succession arrangements announced to the market on 26 Febraury are testament to the depth of talent in our organisation and our capacity to attract high quality managers. My personal thanks to all those who have assisted QBE in the past and I look forward to working with the new team appointments.
There are few insurance and reinsurance businesses in the world today that have QBE’s global reach, capability and talent. With operations in 48 countries, we provide insurance to policyholders in more than 140 countries and enjoy the commitment of 17,000 employees. We are well positioned for future success.
On behalf of our Group Executive, I would like to extend our thanks to our employees who are committed wholeheartedly to turning our new vision into a reality and to delivering value to all of our key stakeholders.
We are grateful to our shareholders for their continued investment in QBE. We respect and thank you for your trust.
John Neal Group Chief Executive Officer
Outlook for 2013 Gross written premium
Combined operating ratio
Insurance profit margin
Net earned premium
2013 targets:
US$18.5–19billion
92% 11% of net earned premium
US$15.5–16billionI want to re-emphasise our commitment to open and transparent communication. Our 2013 focus will be a balance between short-term performance and the progression of our value creation strategy.
13
Highlights by division
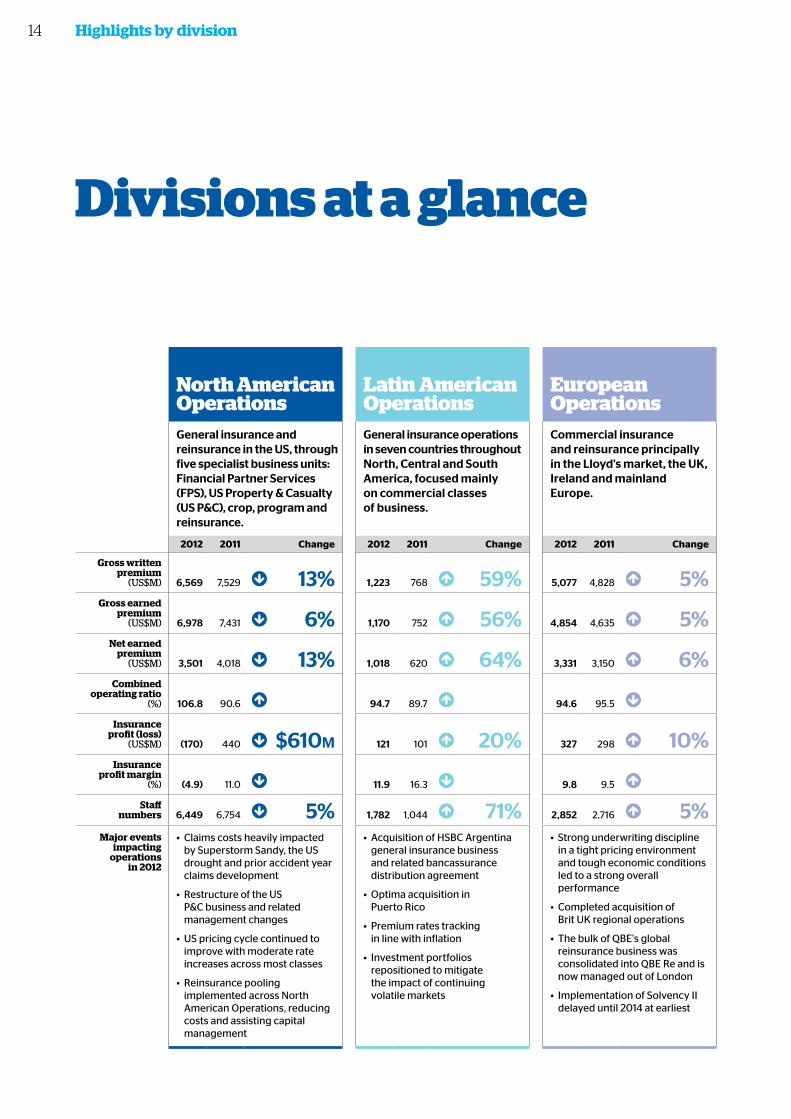
Divisions at a glance
North American Operations
Latin American Operations
European Operations
Australian & New Zealand Operations
Asia Pacific Operations Equator Re
General insurance and reinsurance in the US, through five specialist business units: Financial Partner Services (FPS), US Property & Casualty (US P&C), crop, program and reinsurance.
General insurance operations in seven countries throughout North, Central and South America, focused mainly on commercial classes of business.
Commercial insurance and reinsurance principally in the Lloyd's market, the UK, Ireland and mainland Europe.
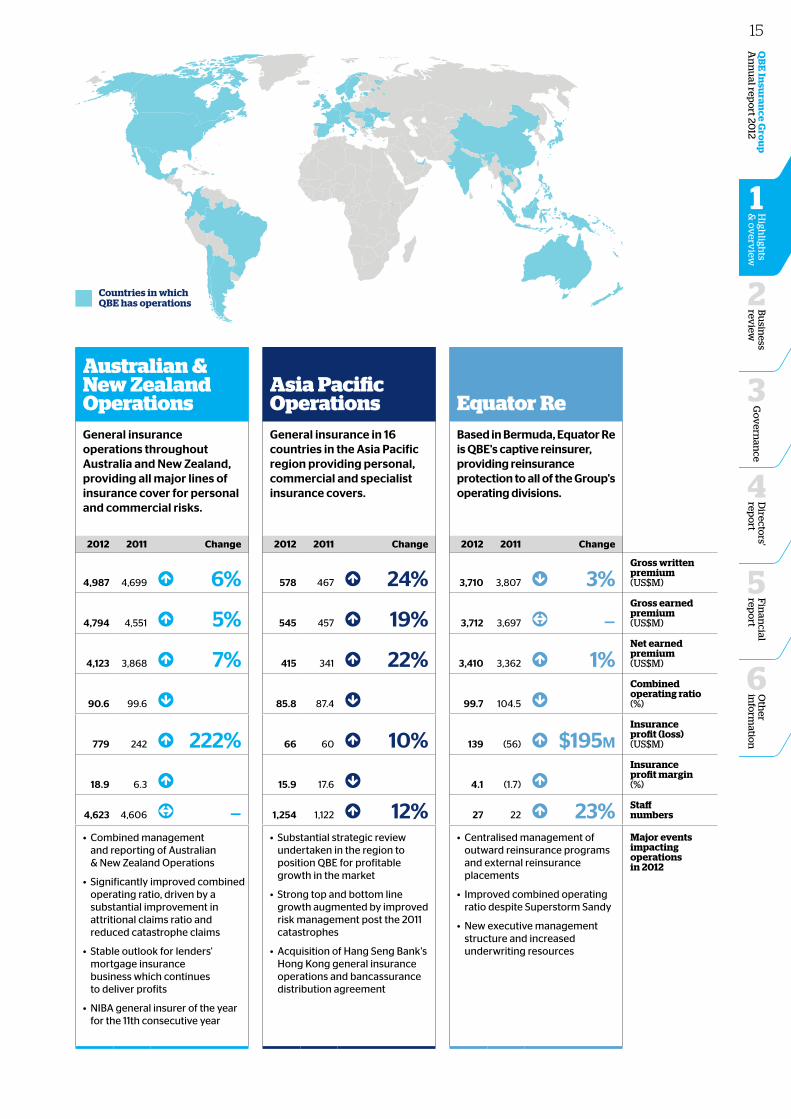
General insurance operations throughout Australia and New Zealand, providing all major lines of insurance cover for personal and commercial risks.
General insurance in 16 countries in the Asia Pacific region providing personal, commercial and specialist insurance covers.
Based in Bermuda, Equator Re is QBE's captive reinsurer, providing reinsurance protection to all of the Group's operating divisions.
2012 2011 Change 2012 2011 Change 2012 2011 Change 2012 2011 Change 2012 2011 Change 2012 2011 Change
Gross written premium
(US$M) 6,569 7,529 13% 1,223 768 59% 5,077 4,828 5% 4,987 4,699 6% 578 467 24% 3,710 3,807 3%Gross written premium (US$M)
Gross earned premium
(US$M) 6,978 7,431 6% 1,170 752 56% 4,854 4,635 5% 4,794 4,551 5% 545 457 19% 3,712 3,697 —Gross earned premium (US$M)
Net earned premium
(US$M) 3,501 4,018 13% 1,018 620 64% 3,331 3,150 6% 4,123 3,868 7% 415 341 22% 3,410 3,362 1%Net earned premium (US$M)
Combined operating ratio
(%) 106.8 90.6 94.7 89.7 94.6 95.5 90.6 99.6 85.8 87.4 99.7 104.5 Combined operating ratio (%)
Insurance profit (loss)
(US$M) (170) 440 $610m 121 101 20% 327 298 10% 779 242 222% 66 60 10% 139 (56) $195mInsurance profit (loss) (US$M)
Insurance profit margin
(%) (4.9) 11.0 11.9 16.3 9.8 9.5 18.9 6.3 15.9 17.6 4.1 (1.7) Insurance profit margin (%)
Staff numbers 6,449 6,754 5% 1,782 1,044 71% 2,852 2,716 5% 4,623 4,606 — 1,254 1,122 12% 27 22 23% Staff
numbers
Major events impacting
operations in 2012
• Claims costs heavily impacted by Superstorm Sandy, the US drought and prior accident year claims development
• Restructure of the US P&C business and related management changes
• US pricing cycle continued to improve with moderate rate increases across most classes
• Reinsurance pooling implemented across North American Operations, reducing costs and assisting capital management
• Acquisition of HSBC Argentina general insurance business and related bancassurance distribution agreement
• Optima acquisition in Puerto Rico
• Premium rates tracking in line with inflation
• Investment portfolios repositioned to mitigate the impact of continuing volatile markets
• Strong underwriting discipline in a tight pricing environment and tough economic conditions led to a strong overall performance
• Completed acquisition of Brit UK regional operations
• The bulk of QBE's global reinsurance business was consolidated into QBE Re and is now managed out of London
• Implementation of Solvency II delayed until 2014 at earliest
• Combined management and reporting of Australian & New Zealand Operations
• Significantly improved combined operating ratio, driven by a substantial improvement in attritional claims ratio and reduced catastrophe claims
• Stable outlook for lenders' mortgage insurance business which continues to deliver profits
• NIBA general insurer of the year for the 11th consecutive year
• Substantial strategic review undertaken in the region to position QBE for profitable growth in the market
• Strong top and bottom line growth augmented by improved risk management post the 2011 catastrophes
• Acquisition of Hang Seng Bank's Hong Kong general insurance operations and bancassurance distribution agreement
• Centralised management of outward reinsurance programs and external reinsurance placements
• Improved combined operating ratio despite Superstorm Sandy
• New executive management structure and increased underwriting resources
Major events impacting operations in 2012
14
Oth
er in
form
ation
6
Fin
ancial
repo
rt
5
High
lights
& o
verv
iew
1
Bu
siness
review
2
Go
vern
ance
3
Directo
rs' rep
ort
4
QB
E In
suran
ce Gro
up
A
nn
ual rep
ort 20
12
North American Operations
Latin American Operations
European Operations
Australian & New Zealand Operations
Asia Pacific Operations Equator Re
General insurance and reinsurance in the US, through five specialist business units: Financial Partner Services (FPS), US Property & Casualty (US P&C), crop, program and reinsurance.
General insurance operations in seven countries throughout North, Central and South America, focused mainly on commercial classes of business.
Commercial insurance and reinsurance principally in the Lloyd's market, the UK, Ireland and mainland Europe.
General insurance operations throughout Australia and New Zealand, providing all major lines of insurance cover for personal and commercial risks.
General insurance in 16 countries in the Asia Pacific region providing personal, commercial and specialist insurance covers.
Based in Bermuda, Equator Re is QBE's captive reinsurer, providing reinsurance protection to all of the Group's operating divisions.
2012 2011 Change 2012 2011 Change 2012 2011 Change 2012 2011 Change 2012 2011 Change 2012 2011 Change
Gross written premium
(US$M) 6,569 7,529 13% 1,223 768 59% 5,077 4,828 5% 4,987 4,699 6% 578 467 24% 3,710 3,807 3%Gross written premium (US$M)
Gross earned premium
(US$M) 6,978 7,431 6% 1,170 752 56% 4,854 4,635 5% 4,794 4,551 5% 545 457 19% 3,712 3,697 —Gross earned premium (US$M)
Net earned premium
(US$M) 3,501 4,018 13% 1,018 620 64% 3,331 3,150 6% 4,123 3,868 7% 415 341 22% 3,410 3,362 1%Net earned premium (US$M)
Combined operating ratio
(%) 106.8 90.6 94.7 89.7 94.6 95.5 90.6 99.6 85.8 87.4 99.7 104.5 Combined operating ratio (%)
Insurance profit (loss)
(US$M) (170) 440 $610m 121 101 20% 327 298 10% 779 242 222% 66 60 10% 139 (56) $195mInsurance profit (loss) (US$M)
Insurance profit margin
(%) (4.9) 11.0 11.9 16.3 9.8 9.5 18.9 6.3 15.9 17.6 4.1 (1.7) Insurance profit margin (%)
Staff numbers 6,449 6,754 5% 1,782 1,044 71% 2,852 2,716 5% 4,623 4,606 — 1,254 1,122 12% 27 22 23% Staff
numbers
Major events impacting
operations in 2012
• Claims costs heavily impacted by Superstorm Sandy, the US drought and prior accident year claims development
• Restructure of the US P&C business and related management changes
• US pricing cycle continued to improve with moderate rate increases across most classes
• Reinsurance pooling implemented across North American Operations, reducing costs and assisting capital management
• Acquisition of HSBC Argentina general insurance business and related bancassurance distribution agreement
• Optima acquisition in Puerto Rico
• Premium rates tracking in line with inflation
• Investment portfolios repositioned to mitigate the impact of continuing volatile markets
• Strong underwriting discipline in a tight pricing environment and tough economic conditions led to a strong overall performance
• Completed acquisition of Brit UK regional operations
• The bulk of QBE's global reinsurance business was consolidated into QBE Re and is now managed out of London
• Implementation of Solvency II delayed until 2014 at earliest
• Combined management and reporting of Australian & New Zealand Operations
• Significantly improved combined operating ratio, driven by a substantial improvement in attritional claims ratio and reduced catastrophe claims
• Stable outlook for lenders' mortgage insurance business which continues to deliver profits
• NIBA general insurer of the year for the 11th consecutive year
• Substantial strategic review undertaken in the region to position QBE for profitable growth in the market
• Strong top and bottom line growth augmented by improved risk management post the 2011 catastrophes
• Acquisition of Hang Seng Bank's Hong Kong general insurance operations and bancassurance distribution agreement
• Centralised management of outward reinsurance programs and external reinsurance placements
• Improved combined operating ratio despite Superstorm Sandy
• New executive management structure and increased underwriting resources
Major events impacting operations in 2012
Countries in which QBE has operations
15
Group Chief Financial Officer’s report
QBE's financial position strengthened considerably during the year with net tangible assets up 22% or $976 million compared with 2011. The stronger balance sheet reflected an improved cash profit of $1,042 million (2011 $791 million).
Operating cash flow was strong at over $2.7 billion, up by over $600 million when compared with last year. Investment returns were well ahead of target with significant realised and unrealised gains on our considerable investment portfolio, now at $31.5 billion. We have taken measures to significantly strengthen our provision for outstanding claims for a number of underperforming and run-off portfolios. Risk margins were strengthened, resulting in an increased probability of adequacy of 87.5% (2011 86.3%).
Continuing weak global economic conditions, financial uncertainty in the eurozone and US budgetary concerns have restricted growth in developed markets. Competition remains strong, although 2012 was encouraging with modest premium rate increases, particularly in North American and Australian & New Zealand Operations. Although catastrophe loss activity was significantly reduced compared with 2011, weather-related events and other man-made disasters fully utilised our allowances for large individual risk and catastrophe claims.
We achieved overall premium rate increases on renewed business of slightly in excess of 5% and, in many cases, were able to increase deductibles, particularly for property classes of business. Despite the lower interest rate environment, pricing in our long tail liability portfolios in Europe remains stubbornly competitive.
The global regulatory environment has become much tighter in recent years and rating agencies have generally applied more onerous criteria when assessing capital charges and minimum capital requirements for insurers. QBE has actively engaged with global agencies as these initiatives have evolved. As a result, the Group has implemented a sound capital management framework to ensure that capital levels meet the requirements of our external stakeholders whilst remaining within management’s benchmark range and targets. In the first half of 2012, we completed a A$600 million capital raising which replaced convertible debt falling due and thereby improved the mix of capital for regulatory purposes. Our position was also assisted by the Board’s decision to reduce the dividend payout in order to maintain capital and allow for future growth. The proposed final dividend is 10 Australian cents per share compared with 25 Australian cents per share last year.
Operating and financial performance Overview of the 2012 resultNet profit after tax was up 8% to $761 million compared with $704 million in 2011. The increased profit benefited from strong net investment income and a lower cost of large individual risk and catastrophe claims, partly offset by adverse prior accident year claims development.
Financial strength and flexibility
16
Oth
er in
form
ation
6
Fin
ancial
repo
rt
5
Go
vern
ance
3
Directo
rs' rep
ort
4
QB
E In
suran
ce Gro
up
A
nn
ual rep
ort 20
12B
usin
ess rev
iew
2
High
lights
& o
verv
iew
1
Amortisation of identifiable intangibles and impairment of goodwill was $407 million, up from $133 million in 2011. The increased charge was mainly due to a write-down of identifiable intangibles in the US following our decision to roll out the ONE QBE brand and rationalise distribution channels. The charge also included a reassessment of the amortisation profile appropriate to the Balboa renewal rights purchased in 2011 and the impairment of goodwill in Asia and Latin America. Further details are included in the intangibles section of this report on page 24.
Insurance profit was up 16% to $1,262 million, resulting in an insurance profit margin of 8.0% compared with 7.1% in 2011. Despite the improvement, the insurance profit margin was well below our target of 13% of net earned premium due to strengthening of claims provisions for underperforming and run-off portfolios, coupled with the impact of the severe drought on our US crop business. Deterioration of 2011 catastrophe claims estimates for the Thai floods and the Christchurch earthquakes, lower risk-free interest rates used to discount outstanding claims and an increase in risk margins further impacted underwriting profitability.
The combined operating ratio was 97.1% compared with 96.8% last year. With the exception of Equator Re which was impacted by development of 2011 catastrophe claims and our North American Operations which bore the
brunt of the prior year claims development for run-off and underperforming portfolios, the other divisions were close to or exceeded their target combined operating ratio. Notably the combined operating ratio for our Australian & New Zealand Operations reduced from 99.6% last year to 90.6%, benefiting from portfolio remediation, strong adherence to pricing disciplines and the more benign claims environment.
The Group’s combined commission and expense ratio increased to 31.1%, from 28.6%, reflecting changes in the mix of business coupled with various remediation and restructuring costs. The impact of these increases was exacerbated by the lower than expected net earned premium base, particularly in our North American Operations. This ratio also reflects our investment in the early stages of our operational transformation program which is expected to produce cost benefits from 2014 onwards.
Investment return for the year was excellent, with net investment income ahead of target and yields exceeding benchmarks. Contracting credit spreads throughout the year and improved equity markets contributed to a high level of realised and unrealised gains for most of our portfolios. Our strong operating cash flow assisted the overall level of investment income generated for the year.
Neil Drabsch Chief Financial Officer • QBE Insurance Group
We continue to focus on financial strength and flexibility, supporting the Group's vision and allowing us to respond to regulatory change.
17
Group Chief Financial Officer’s report
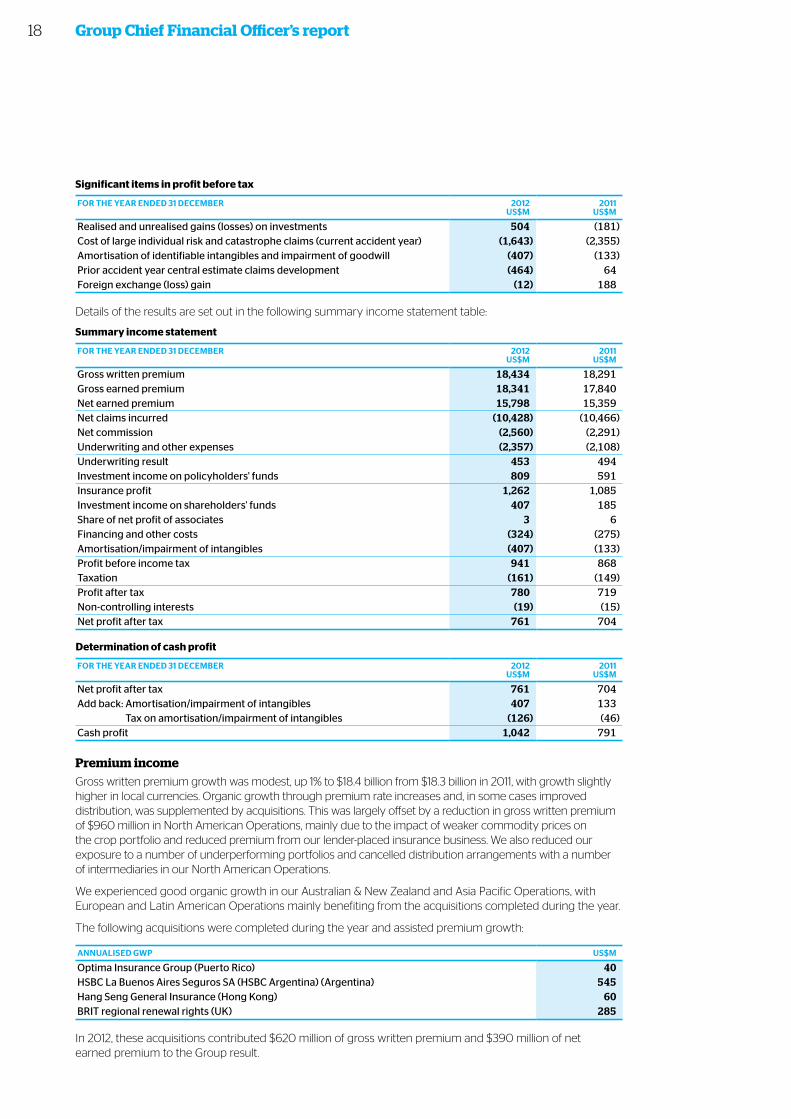
Significant items in profit before tax
FOR thE yEAR ENdEd 31 dECEmBER 2012US$m
2011US$m
Realised and unrealised gains (losses) on investments 504 (181)Cost of large individual risk and catastrophe claims (current accident year) (1,643) (2,355)Amortisation of identifiable intangibles and impairment of goodwill (407) (133)Prior accident year central estimate claims development (464) 64Foreign exchange (loss) gain (12) 188
Details of the results are set out in the following summary income statement table:
Summary income statement
FOR thE yEAR ENdEd 31 dECEmBER 2012US$m
2011US$m
Gross written premium 18,434 18,291Gross earned premium 18,341 17,840Net earned premium 15,798 15,359Net claims incurred (10,428) (10,466)Net commission (2,560) (2,291)Underwriting and other expenses (2,357) (2,108)Underwriting result 453 494Investment income on policyholders' funds 809 591Insurance profit 1,262 1,085Investment income on shareholders' funds 407 185Share of net profit of associates 3 6Financing and other costs (324) (275)Amortisation/impairment of intangibles (407) (133)Profit before income tax 941 868Taxation (161) (149)Profit after tax 780 719Non-controlling interests (19) (15)Net profit after tax 761 704
Determination of cash profit
FOR thE yEAR ENdEd 31 dECEmBER 2012US$m
2011US$m
Net profit after tax 761 704Add back: Amortisation/impairment of intangibles 407 133Add back: Tax on amortisation/impairment of intangibles (126) (46)Cash profit 1,042 791
Premium incomeGross written premium growth was modest, up 1% to $18.4 billion from $18.3 billion in 2011, with growth slightly higher in local currencies. Organic growth through premium rate increases and, in some cases improved distribution, was supplemented by acquisitions. This was largely offset by a reduction in gross written premium of $960 million in North American Operations, mainly due to the impact of weaker commodity prices on the crop portfolio and reduced premium from our lender-placed insurance business. We also reduced our exposure to a number of underperforming portfolios and cancelled distribution arrangements with a number of intermediaries in our North American Operations.
We experienced good organic growth in our Australian & New Zealand and Asia Pacific Operations, with European and Latin American Operations mainly benefiting from the acquisitions completed during the year.
The following acquisitions were completed during the year and assisted premium growth:
ANNUALISEd GWP US$m
Optima Insurance Group (Puerto Rico) 40HSBC La Buenos Aires Seguros SA (HSBC Argentina) (Argentina) 545Hang Seng General Insurance (Hong Kong) 60BRIT regional renewal rights (UK) 285
In 2012, these acquisitions contributed $620 million of gross written premium and $390 million of net earned premium to the Group result.
18
Oth
er in
form
ation
6
Fin
ancial
repo
rt
5
Go
vern
ance
3
Directo
rs' rep
ort
4
QB
E In
suran
ce Gro
up
A
nn
ual rep
ort 20
12B
usin
ess rev
iew
2
High
lights
& o
verv
iew
1Reinsurance expenseReinsurance expense was 13.9% of gross earned premium, unchanged from 2011 but higher than our target of around 12.5%, mainly due to the US crop business. Despite the impact of an overall crop loss in 2012, the increased reinsurance expense reflected costs associated with those States that generated profits and were not affected by the drought conditions. The underlying reinsurance expense was 12.1% excluding US crop reinsurance.
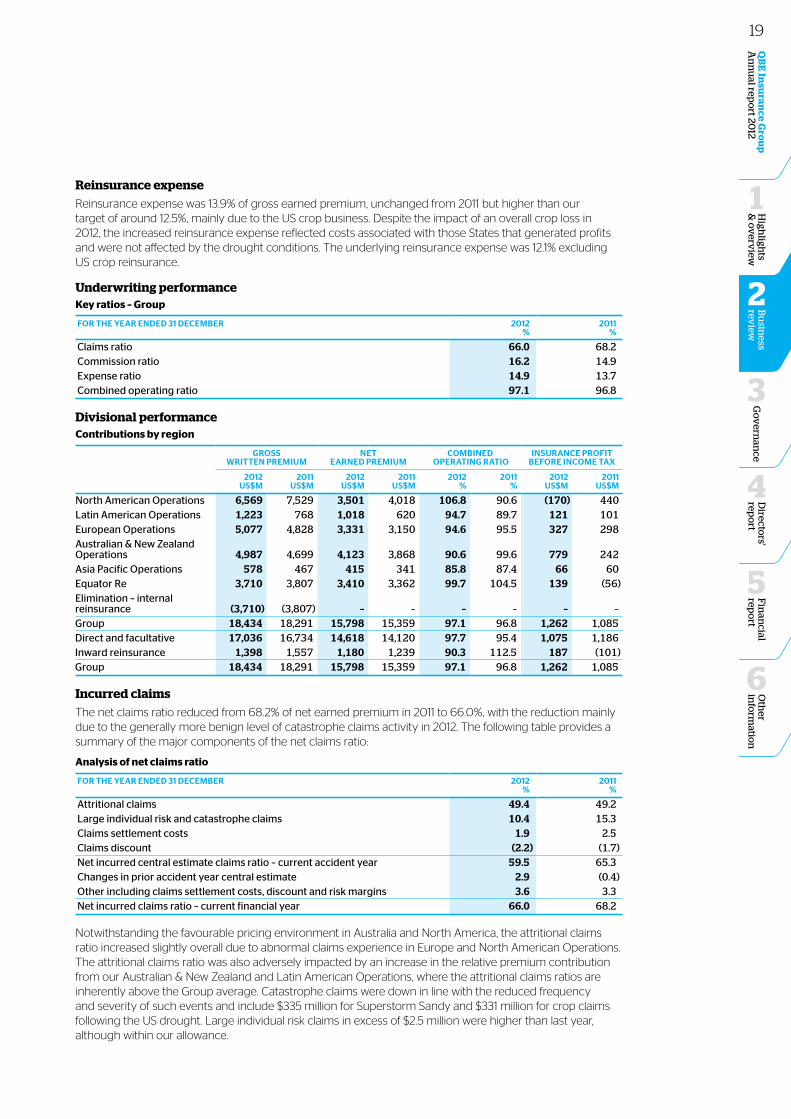
Underwriting performance Key ratios – Group
FOR thE yEAR ENdEd 31 dECEmBER 2012%
2011%
Claims ratio 66.0 68.2Commission ratio 16.2 14.9Expense ratio 14.9 13.7Combined operating ratio 97.1 96.8
Divisional performanceContributions by region
GROSS WRIttEN PREmIUm
NEt EARNEd PREmIUm
COmBINEd OPERAtING RAtIO
INSURANCE PROFIt BEFORE INCOmE tAx
2012US$m
2011US$m
2012US$m
2011US$m
2012%
2011%
2012US$m
2011US$m
North American Operations 6,569 7,529 3,501 4,018 106.8 90.6 (170) 440 Latin American Operations 1,223 768 1,018 620 94.7 89.7 121 101 European Operations 5,077 4,828 3,331 3,150 94.6 95.5 327 298 Australian & New Zealand Operations 4,987 4,699 4,123 3,868 90.6 99.6 779 242 Asia Pacific Operations 578 467 415 341 85.8 87.4 66 60 Equator Re 3,710 3,807 3,410 3,362 99.7 104.5 139 (56)Elimination – internal reinsurance (3,710) (3,807) – – – – – –Group 18,434 18,291 15,798 15,359 97.1 96.8 1,262 1,085 Direct and facultative 17,036 16,734 14,618 14,120 97.7 95.4 1,075 1,186 Inward reinsurance 1,398 1,557 1,180 1,239 90.3 112.5 187 (101)Group 18,434 18,291 15,798 15,359 97.1 96.8 1,262 1,085
Incurred claimsThe net claims ratio reduced from 68.2% of net earned premium in 2011 to 66.0%, with the reduction mainly due to the generally more benign level of catastrophe claims activity in 2012. The following table provides a summary of the major components of the net claims ratio:
Analysis of net claims ratio
FOR thE yEAR ENdEd 31 dECEmBER 2012%
2011%
Attritional claims 49.4 49.2 Large individual risk and catastrophe claims 10.4 15.3 Claims settlement costs 1.9 2.5 Claims discount (2.2) (1.7)Net incurred central estimate claims ratio – current accident year 59.5 65.3 Changes in prior accident year central estimate 2.9 (0.4)Other including claims settlement costs, discount and risk margins 3.6 3.3 Net incurred claims ratio – current financial year 66.0 68.2
Notwithstanding the favourable pricing environment in Australia and North America, the attritional claims ratio increased slightly overall due to abnormal claims experience in Europe and North American Operations. The attritional claims ratio was also adversely impacted by an increase in the relative premium contribution from our Australian & New Zealand and Latin American Operations, where the attritional claims ratios are inherently above the Group average. Catastrophe claims were down in line with the reduced frequency and severity of such events and include $335 million for Superstorm Sandy and $331 million for crop claims following the US drought. Large individual risk claims in excess of $2.5 million were higher than last year, although within our allowance.
19
Group Chief Financial Officer’s report
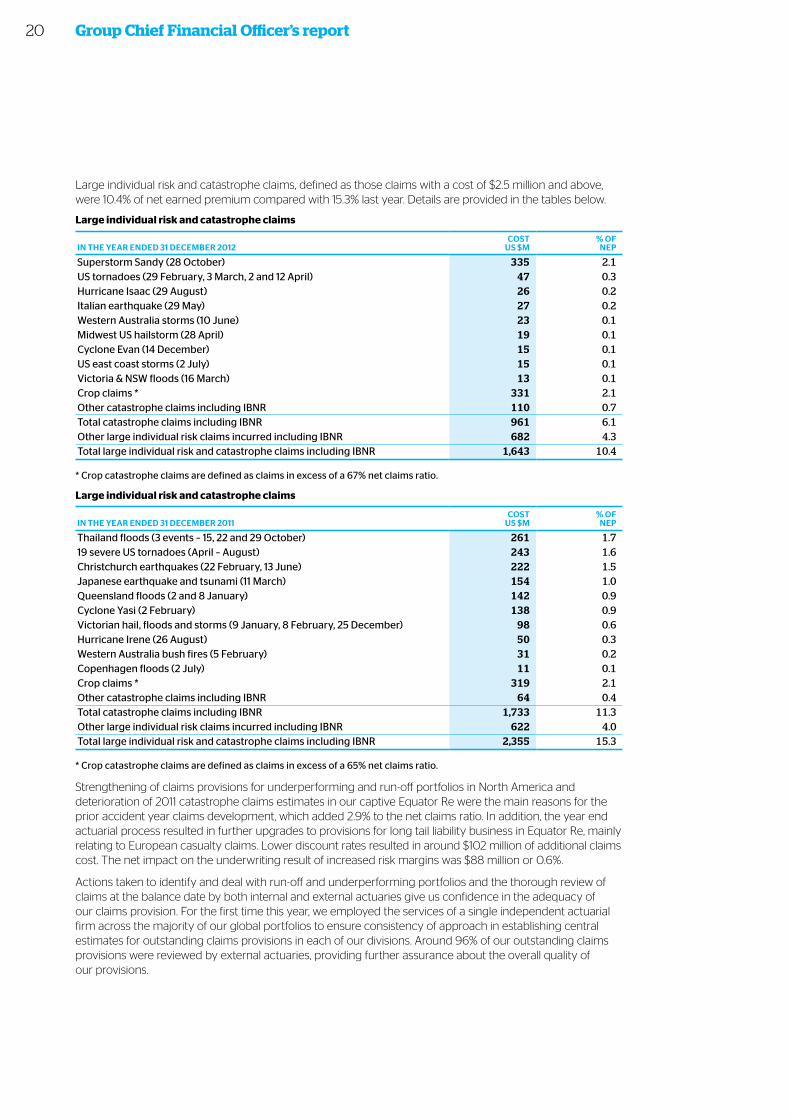
Large individual risk and catastrophe claims, defined as those claims with a cost of $2.5 million and above, were 10.4% of net earned premium compared with 15.3% last year. Details are provided in the tables below.
Large individual risk and catastrophe claims
IN thE yEAR ENdEd 31 dECEmBER 2012COSt
US $m% OF
NEP
Superstorm Sandy (28 October) 335 2.1US tornadoes (29 February, 3 March, 2 and 12 April) 47 0.3Hurricane Isaac (29 August) 26 0.2Italian earthquake (29 May) 27 0.2Western Australia storms (10 June) 23 0.1Midwest US hailstorm (28 April) 19 0.1Cyclone Evan (14 December) 15 0.1US east coast storms (2 July) 15 0.1Victoria & NSW floods (16 March) 13 0.1Crop claims * 331 2.1Other catastrophe claims including IBNR 110 0.7Total catastrophe claims including IBNR 961 6.1Other large individual risk claims incurred including IBNR 682 4.3Total large individual risk and catastrophe claims including IBNR 1,643 10.4
* Crop catastrophe claims are defined as claims in excess of a 67% net claims ratio.
Large individual risk and catastrophe claims
IN thE yEAR ENdEd 31 dECEmBER 2011COSt
US $m% OF
NEP
Thailand floods (3 events – 15, 22 and 29 October) 261 1.719 severe US tornadoes (April – August) 243 1.6Christchurch earthquakes (22 February, 13 June) 222 1.5Japanese earthquake and tsunami (11 March) 154 1.0Queensland floods (2 and 8 January) 142 0.9Cyclone Yasi (2 February) 138 0.9Victorian hail, floods and storms (9 January, 8 February, 25 December) 98 0.6Hurricane Irene (26 August) 50 0.3Western Australia bush fires (5 February) 31 0.2Copenhagen floods (2 July) 11 0.1Crop claims * 319 2.1Other catastrophe claims including IBNR 64 0.4Total catastrophe claims including IBNR 1,733 11.3Other large individual risk claims incurred including IBNR 622 4.0Total large individual risk and catastrophe claims including IBNR 2,355 15.3
* Crop catastrophe claims are defined as claims in excess of a 65% net claims ratio.
Strengthening of claims provisions for underperforming and run-off portfolios in North America and deterioration of 2011 catastrophe claims estimates in our captive Equator Re were the main reasons for the prior accident year claims development, which added 2.9% to the net claims ratio. In addition, the year end actuarial process resulted in further upgrades to provisions for long tail liability business in Equator Re, mainly relating to European casualty claims. Lower discount rates resulted in around $102 million of additional claims cost. The net impact on the underwriting result of increased risk margins was $88 million or 0.6%.
Actions taken to identify and deal with run-off and underperforming portfolios and the thorough review of claims at the balance date by both internal and external actuaries give us confidence in the adequacy of our claims provision. For the first time this year, we employed the services of a single independent actuarial firm across the majority of our global portfolios to ensure consistency of approach in establishing central estimates for outstanding claims provisions in each of our divisions. Around 96% of our outstanding claims provisions were reviewed by external actuaries, providing further assurance about the overall quality of our provisions.
20
Oth
er in
form
ation
6
Fin
ancial
repo
rt
5
Go
vern
ance
3
Directo
rs' rep
ort
4
QB
E In
suran
ce Gro
up
A
nn
ual rep
ort 20
12B
usin
ess rev
iew
2
High
lights
& o
verv
iew
1Commission and expensesThe Group’s combined commission and expense ratio increased to 31.1%, up from 28.6%, reflecting changes in the mix of business due to acquisitions, costs of integrating acquired Latin American and US lender-placed business and increased costs for IT systems and business change initiatives. Costs also increased due to higher government levies in Australia and Europe. Lower net earned premium in our North American Operations also contributed to the higher ratio.
The commission ratio was 16.2%, up from 14.9% last year, due to higher broking costs in Australia and Europe, the change in business mix, and a higher commission ratio on the HSBC Argentina acquisition.
The expense ratio was 14.9%, up from 13.7% last year. The increase in costs was mainly due to costs related to integration and portfolio remediation activities, the commencement of various global operational transformation programs as well as associated systems and depreciation costs and increased government levies. It is likely that the higher expense ratio will continue until the major transformation programs are completed.
Income tax expenseIncome tax expense can vary from year to year due to the mix of profits from our various countries that have different rates of income tax. The income tax expense for 2012 was 17.1% of net profit before tax compared with 17.2% in 2011.
The income tax expense rate was lower than our market guidance of around 22%, mainly reflecting losses in the US taxed at a higher rate, a one-off saving due to the recovery of prior year capital losses, a reduced UK corporate tax rate and other beneficial prior year adjustments. Income tax payments in Australia benefit our dividend franking account. As a significant proportion of our 2012 profit was derived from Australia, the expected higher level of Australian income tax will support an increased franking rate for dividends paid to shareholders in the near term.
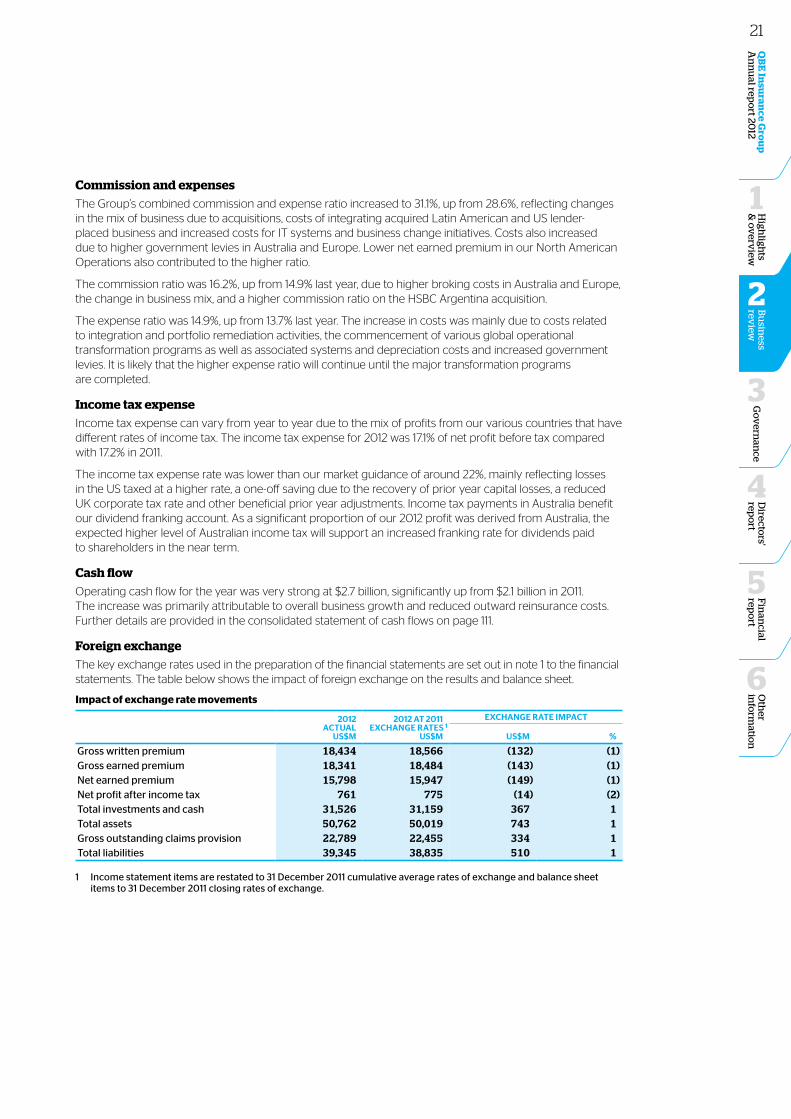
Cash flowOperating cash flow for the year was very strong at $2.7 billion, significantly up from $2.1 billion in 2011. The increase was primarily attributable to overall business growth and reduced outward reinsurance costs. Further details are provided in the consolidated statement of cash flows on page 111.
Foreign exchangeThe key exchange rates used in the preparation of the financial statements are set out in note 1 to the financial statements. The table below shows the impact of foreign exchange on the results and balance sheet.
Impact of exchange rate movements
2012 ACtUAL
US$m
2012 At 2011ExChANGE RAtES 1
US$m
ExChANGE RAtE ImPACt
US$m %
Gross written premium 18,434 18,566 (132) (1)Gross earned premium 18,341 18,484 (143) (1)Net earned premium 15,798 15,947 (149) (1)Net profit after income tax 761 775 (14) (2)Total investments and cash 31,526 31,159 367 1Total assets 50,762 50,019 743 1Gross outstanding claims provision 22,789 22,455 334 1Total liabilities 39,345 38,835 510 1
1 Income statement items are restated to 31 December 2011 cumulative average rates of exchange and balance sheet items to 31 December 2011 closing rates of exchange.
21
Group Chief Financial Officer’s report
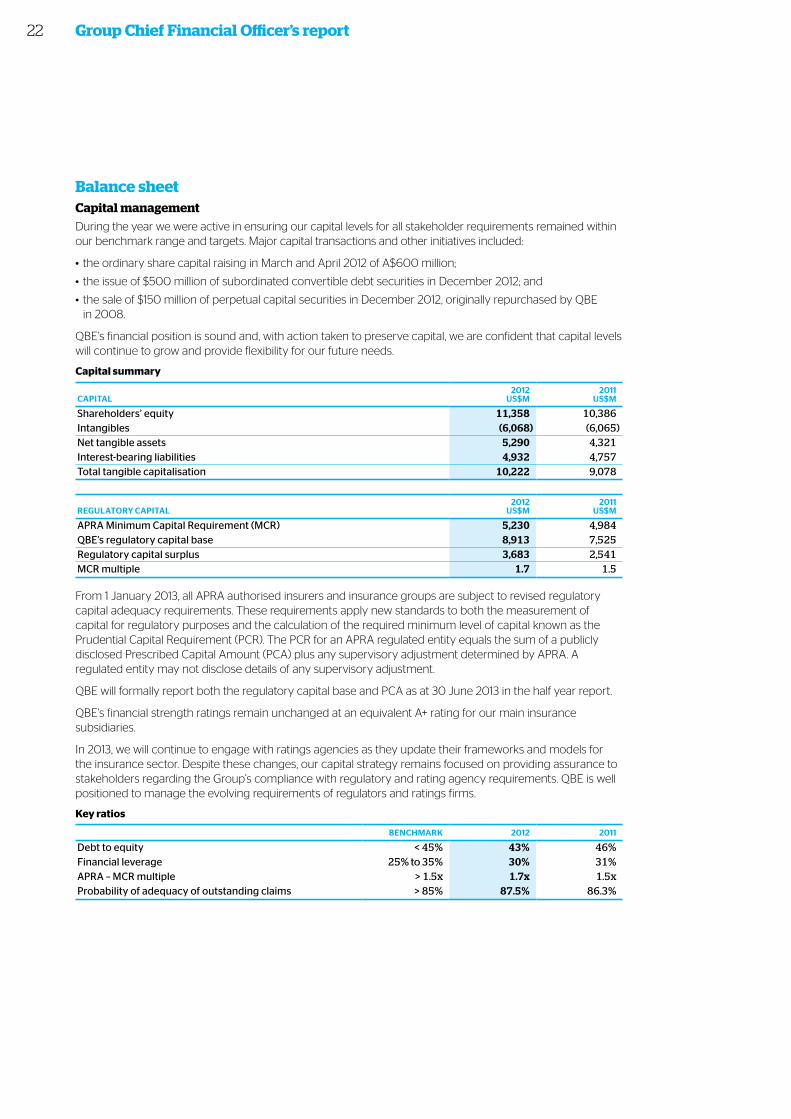
Balance sheet Capital managementDuring the year we were active in ensuring our capital levels for all stakeholder requirements remained within our benchmark range and targets. Major capital transactions and other initiatives included:
• the ordinary share capital raising in March and April 2012 of A$600 million;
• the issue of $500 million of subordinated convertible debt securities in December 2012; and
• the sale of $150 million of perpetual capital securities in December 2012, originally repurchased by QBE in 2008.
QBE’s financial position is sound and, with action taken to preserve capital, we are confident that capital levels will continue to grow and provide flexibility for our future needs.
Capital summary
CAPItAL2012
US$m2011
US$m
Shareholders’ equity 11,358 10,386Intangibles (6,068) (6,065)Net tangible assets 5,290 4,321Interest-bearing liabilities 4,932 4,757Total tangible capitalisation 10,222 9,078
REGULAtORy CAPItAL2012
US$m2011
US$m
APRA Minimum Capital Requirement (MCR) 5,230 4,984QBE’s regulatory capital base 8,913 7,525Regulatory capital surplus 3,683 2,541MCR multiple 1.7 1.5
From 1 January 2013, all APRA authorised insurers and insurance groups are subject to revised regulatory capital adequacy requirements. These requirements apply new standards to both the measurement of capital for regulatory purposes and the calculation of the required minimum level of capital known as the Prudential Capital Requirement (PCR). The PCR for an APRA regulated entity equals the sum of a publicly disclosed Prescribed Capital Amount (PCA) plus any supervisory adjustment determined by APRA. A regulated entity may not disclose details of any supervisory adjustment.
QBE will formally report both the regulatory capital base and PCA as at 30 June 2013 in the half year report.
QBE's financial strength ratings remain unchanged at an equivalent A+ rating for our main insurance subsidiaries.
In 2013, we will continue to engage with ratings agencies as they update their frameworks and models for the insurance sector. Despite these changes, our capital strategy remains focused on providing assurance to stakeholders regarding the Group’s compliance with regulatory and rating agency requirements. QBE is well positioned to manage the evolving requirements of regulators and ratings firms.
Key ratios
BENChmARK 2012 2011
Debt to equity < 45% 43% 46%Financial leverage 25% to 35% 30% 31%APRA – MCR multiple > 1.5x 1.7x 1.5xProbability of adequacy of outstanding claims > 85% 87.5% 86.3%
22
Oth
er in
form
ation
6
Fin
ancial
repo
rt
5
Go
vern
ance
3
Directo
rs' rep
ort
4
QB
E In
suran
ce Gro
up
A
nn
ual rep
ort 20
12B
usin
ess rev
iew
2
High
lights
& o
verv
iew
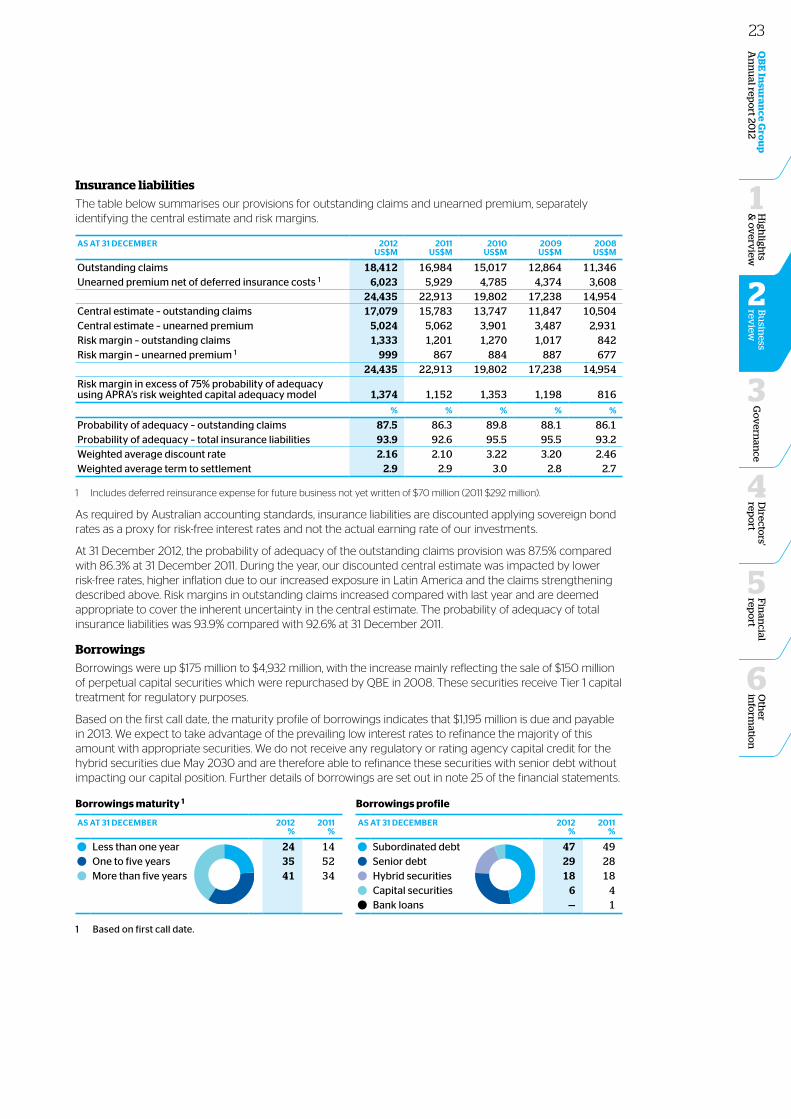
1Insurance liabilitiesThe table below summarises our provisions for outstanding claims and unearned premium, separately identifying the central estimate and risk margins.
AS At 31 dECEmBER 2012US$m
2011US$m
2010US$m
2009US$m
2008US$m
Outstanding claims 18,412 16,984 15,017 12,864 11,346Unearned premium net of deferred insurance costs 1 6,023 5,929 4,785 4,374 3,608
24,435 22,913 19,802 17,238 14,954Central estimate – outstanding claims 17,079 15,783 13,747 11,847 10,504Central estimate – unearned premium 5,024 5,062 3,901 3,487 2,931Risk margin – outstanding claims 1,333 1,201 1,270 1,017 842Risk margin – unearned premium 1 999 867 884 887 677
24,435 22,913 19,802 17,238 14,954Risk margin in excess of 75% probability of adequacy using APRA’s risk weighted capital adequacy model 1,374 1,152 1,353 1,198 816
% % % % %
Probability of adequacy – outstanding claims 87.5 86.3 89.8 88.1 86.1Probability of adequacy – total insurance liabilities 93.9 92.6 95.5 95.5 93.2Weighted average discount rate 2.16 2.10 3.22 3.20 2.46Weighted average term to settlement 2.9 2.9 3.0 2.8 2.7
1 Includes deferred reinsurance expense for future business not yet written of $70 million (2011 $292 million).
As required by Australian accounting standards, insurance liabilities are discounted applying sovereign bond rates as a proxy for risk-free interest rates and not the actual earning rate of our investments.
At 31 December 2012, the probability of adequacy of the outstanding claims provision was 87.5% compared with 86.3% at 31 December 2011. During the year, our discounted central estimate was impacted by lower risk-free rates, higher inflation due to our increased exposure in Latin America and the claims strengthening described above. Risk margins in outstanding claims increased compared with last year and are deemed appropriate to cover the inherent uncertainty in the central estimate. The probability of adequacy of total insurance liabilities was 93.9% compared with 92.6% at 31 December 2011.
BorrowingsBorrowings were up $175 million to $4,932 million, with the increase mainly reflecting the sale of $150 million of perpetual capital securities which were repurchased by QBE in 2008. These securities receive Tier 1 capital treatment for regulatory purposes.
Based on the first call date, the maturity profile of borrowings indicates that $1,195 million is due and payable in 2013. We expect to take advantage of the prevailing low interest rates to refinance the majority of this amount with appropriate securities. We do not receive any regulatory or rating agency capital credit for the hybrid securities due May 2030 and are therefore able to refinance these securities with senior debt without impacting our capital position. Further details of borrowings are set out in note 25 of the financial statements.
Borrowings maturity 1
AS At 31 dECEmBER 2012%
2011%
Less than one year 24 14One to five years 35 52More than five years 41 34
Borrowings profile
AS At 31 dECEmBER 2012%
2011%
Subordinated debt 47 49Senior debt 29 28Hybrid securities 18 18Capital securities 6 4Bank loans — 1
1 Based on first call date.
23
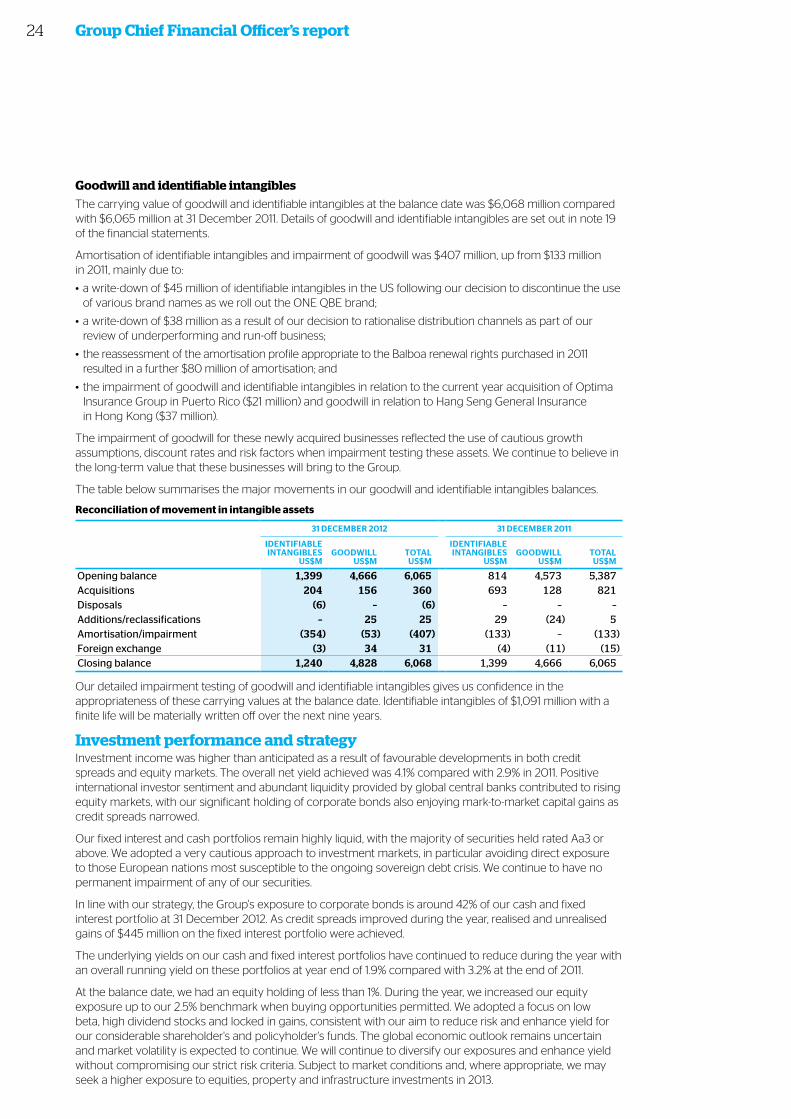
Goodwill and identifiable intangibles The carrying value of goodwill and identifiable intangibles at the balance date was $6,068 million compared with $6,065 million at 31 December 2011. Details of goodwill and identifiable intangibles are set out in note 19 of the financial statements.
Amortisation of identifiable intangibles and impairment of goodwill was $407 million, up from $133 million in 2011, mainly due to:
•a write-down of $45 million of identifiable intangibles in the US following our decision to discontinue the use of various brand names as we roll out the ONE QBE brand;
•a write-down of $38 million as a result of our decision to rationalise distribution channels as part of our review of underperforming and run-off business;
• the reassessment of the amortisation profile appropriate to the Balboa renewal rights purchased in 2011 resulted in a further $80 million of amortisation; and
• the impairment of goodwill and identifiable intangibles in relation to the current year acquisition of Optima Insurance Group in Puerto Rico ($21 million) and goodwill in relation to Hang Seng General Insurance in Hong Kong ($37 million).
The impairment of goodwill for these newly acquired businesses reflected the use of cautious growth assumptions, discount rates and risk factors when impairment testing these assets. We continue to believe in the long-term value that these businesses will bring to the Group.
The table below summarises the major movements in our goodwill and identifiable intangibles balances.
Reconciliation of movement in intangible assets
31 dECEmBER 2012 31 dECEmBER 2011
IdENtIFIABLEINtANGIBLES
US$m GOOdWILL
US$m tOtAL
US$m
IdENtIFIABLEINtANGIBLES
US$m GOOdWILL
US$m tOtAL
US$m
Opening balance 1,399 4,666 6,065 814 4,573 5,387Acquisitions 204 156 360 693 128 821Disposals (6) – (6) – – –Additions/reclassifications – 25 25 29 (24) 5Amortisation/impairment (354) (53) (407) (133) – (133)Foreign exchange (3) 34 31 (4) (11) (15)Closing balance 1,240 4,828 6,068 1,399 4,666 6,065
Our detailed impairment testing of goodwill and identifiable intangibles gives us confidence in the appropriateness of these carrying values at the balance date. Identifiable intangibles of $1,091 million with a finite life will be materially written off over the next nine years.
Investment performance and strategy Investment income was higher than anticipated as a result of favourable developments in both credit spreads and equity markets. The overall net yield achieved was 4.1% compared with 2.9% in 2011. Positive international investor sentiment and abundant liquidity provided by global central banks contributed to rising equity markets, with our significant holding of corporate bonds also enjoying mark-to-market capital gains as credit spreads narrowed.
Our fixed interest and cash portfolios remain highly liquid, with the majority of securities held rated Aa3 or above. We adopted a very cautious approach to investment markets, in particular avoiding direct exposure to those European nations most susceptible to the ongoing sovereign debt crisis. We continue to have no permanent impairment of any of our securities.
In line with our strategy, the Group's exposure to corporate bonds is around 42% of our cash and fixed interest portfolio at 31 December 2012. As credit spreads improved during the year, realised and unrealised gains of $445 million on the fixed interest portfolio were achieved.
The underlying yields on our cash and fixed interest portfolios have continued to reduce during the year with an overall running yield on these portfolios at year end of 1.9% compared with 3.2% at the end of 2011.
At the balance date, we had an equity holding of less than 1%. During the year, we increased our equity exposure up to our 2.5% benchmark when buying opportunities permitted. We adopted a focus on low beta, high dividend stocks and locked in gains, consistent with our aim to reduce risk and enhance yield for our considerable shareholder's and policyholder's funds. The global economic outlook remains uncertain and market volatility is expected to continue. We will continue to diversify our exposures and enhance yield without compromising our strict risk criteria. Subject to market conditions and, where appropriate, we may seek a higher exposure to equities, property and infrastructure investments in 2013.
Group Chief Financial Officer’s report24
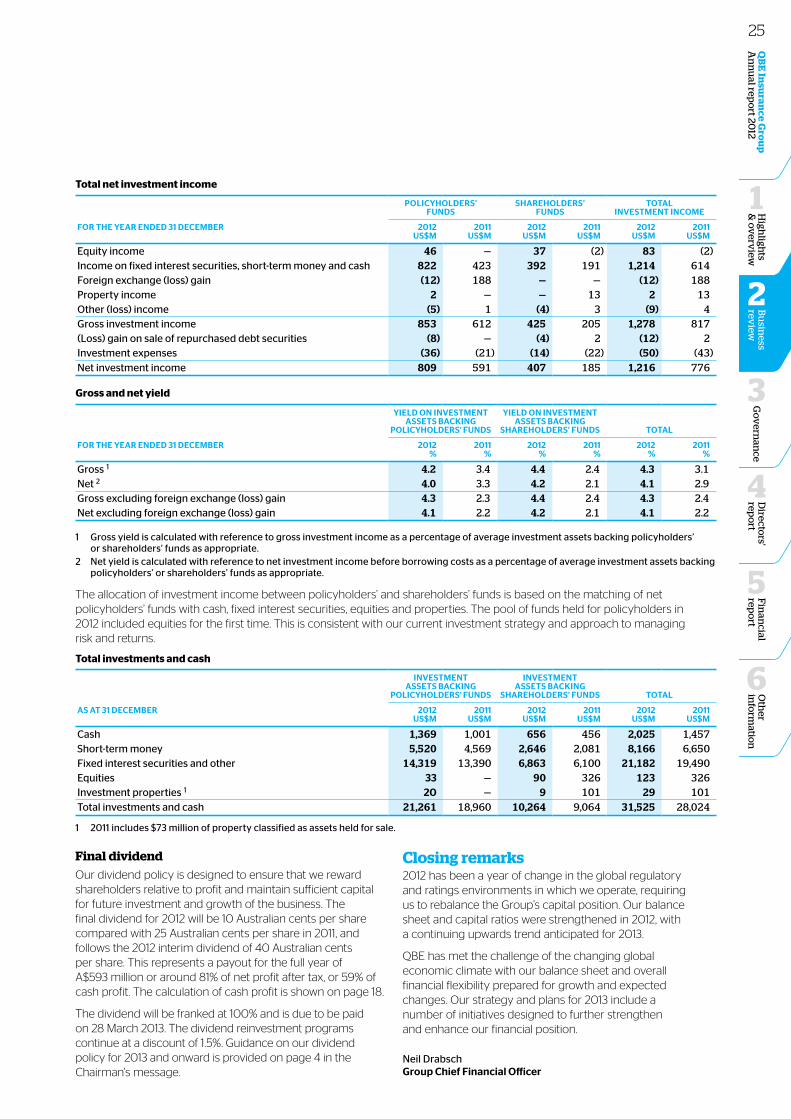
Oth
er in
form
ation
6
Fin
ancial
repo
rt
5
Go
vern
ance
3
Directo
rs' rep
ort
4
QB
E In
suran
ce Gro
up
A
nn
ual rep
ort 20
12B
usin
ess rev
iew
2
High
lights
& o
verv
iew
1
Final dividendOur dividend policy is designed to ensure that we reward shareholders relative to profit and maintain sufficient capital for future investment and growth of the business. The final dividend for 2012 will be 10 Australian cents per share compared with 25 Australian cents per share in 2011, and follows the 2012 interim dividend of 40 Australian cents per share. This represents a payout for the full year of A$593 million or around 81% of net profit after tax, or 59% of cash profit. The calculation of cash profit is shown on page 18.
The dividend will be franked at 100% and is due to be paid on 28 March 2013. The dividend reinvestment programs continue at a discount of 1.5%. Guidance on our dividend policy for 2013 and onward is provided on page 4 in the Chairman's message.
Closing remarks2012 has been a year of change in the global regulatory and ratings environments in which we operate, requiring us to rebalance the Group’s capital position. Our balance sheet and capital ratios were strengthened in 2012, with a continuing upwards trend anticipated for 2013.
QBE has met the challenge of the changing global economic climate with our balance sheet and overall financial flexibility prepared for growth and expected changes. Our strategy and plans for 2013 include a number of initiatives designed to further strengthen and enhance our financial position.
Neil Drabsch Group Chief Financial Officer
Total net investment income
POLICyhOLdERS’ FUNdS
ShAREhOLdERS’ FUNdS
tOtAL INvEStmENt INCOmE
FOR thE yEAR ENdEd 31 dECEmBER 2012 US$m
2011 US$m
2012 US$m
2011 US$m
2012 US$m
2011 US$m
Equity income 46 — 37 (2) 83 (2)Income on fixed interest securities, short-term money and cash 822 423 392 191 1,214 614Foreign exchange (loss) gain (12) 188 — — (12) 188Property income 2 — — 13 2 13Other (loss) income (5) 1 (4) 3 (9) 4Gross investment income 853 612 425 205 1,278 817(Loss) gain on sale of repurchased debt securities (8) — (4) 2 (12) 2Investment expenses (36) (21) (14) (22) (50) (43)Net investment income 809 591 407 185 1,216 776
Gross and net yield
yIELd ON INvEStmENt ASSEtS BACKING
POLICyhOLdERS’ FUNdS
yIELd ON INvEStmENt ASSEtS BACKING
ShAREhOLdERS’ FUNdS tOtAL
FOR thE yEAR ENdEd 31 dECEmBER 2012 %
2011 %
2012 %
2011 %
2012 %
2011 %
Gross 1 4.2 3.4 4.4 2.4 4.3 3.1Net 2 4.0 3.3 4.2 2.1 4.1 2.9Gross excluding foreign exchange (loss) gain 4.3 2.3 4.4 2.4 4.3 2.4Net excluding foreign exchange (loss) gain 4.1 2.2 4.2 2.1 4.1 2.2
1 Gross yield is calculated with reference to gross investment income as a percentage of average investment assets backing policyholders’ or shareholders’ funds as appropriate.
2 Net yield is calculated with reference to net investment income before borrowing costs as a percentage of average investment assets backing policyholders’ or shareholders’ funds as appropriate.
The allocation of investment income between policyholders’ and shareholders’ funds is based on the matching of net policyholders’ funds with cash, fixed interest securities, equities and properties. The pool of funds held for policyholders in 2012 included equities for the first time. This is consistent with our current investment strategy and approach to managing risk and returns.
Total investments and cash
INvEStmENt ASSEtS BACKING
POLICyhOLdERS’ FUNdS
INvEStmENt ASSEtS BACKING
ShAREhOLdERS’ FUNdS tOtAL
AS At 31 dECEmBER 2012 US$m
2011 US$m
2012 US$m
2011 US$m
2012 US$m
2011 US$m
Cash 1,369 1,001 656 456 2,025 1,457Short-term money 5,520 4,569 2,646 2,081 8,166 6,650Fixed interest securities and other 14,319 13,390 6,863 6,100 21,182 19,490Equities 33 — 90 326 123 326Investment properties 1 20 — 9 101 29 101Total investments and cash 21,261 18,960 10,264 9,064 31,525 28,024
1 2011 includes $73 million of property classified as assets held for sale.
25

Spotlight on crop insurance
Crop insurance is an industry with deep roots in the United States. The importance of crops to the nation's food supply and economy has been recognised for a long time. With private crop insurance companies dating back to the 1880s, the Great Depression saw the introduction of government-sponsored crop insurance with the passing of the Federal Crop Insurance Act in 1938.
In 1980, the private sector and US Government were brought together through the passing of the Federal Crop Insurance Act that saw insurers and the government share underwriting profits and losses through standard agreements that can vary by crop risk and by state.
Today, there are more than 16,000 agents and adjusters in the program and crop insurance is considered the primary safety net for the farming community. Some 85% to 90% of all US cropland is covered by the federal crop insurance program, with corn, soybeans and wheat comprising more than 75% of the insured crops. The remaining 25% is made of up more than 100 different crops.
“Crop insurance stabilises our food supply and rural America,” says Greg Deal, NAU Country’s President and Chief Executive Officer. “It has become an important risk management tool available for most farmers because it is a public-private partnership that limits taxpayer exposure to risk and helps farmers get back on their feet when disaster strikes.”
Food securityOnce they are sown in the ground, there is never any certainty that crops will make it to harvest time. QBE makes it possible for farmers in the United States to be certain that they will make it to the next planting season if disaster strikes.
26

Oth
er in
form
ation
6
Fin
ancial
repo
rt
5
Go
vern
ance
3
Directo
rs' rep
ort
4
QB
E In
suran
ce Gro
up
A
nn
ual rep
ort 20
12B
usin
ess rev
iew
2
High
lights
& o
verv
iew
1
QBE’s NAU Country Insurance is the third largest writer of multi-peril crop insurance in the US, authorised by the US government to protect farmers against weather-related and other unavoidable causes of crop loss.
27
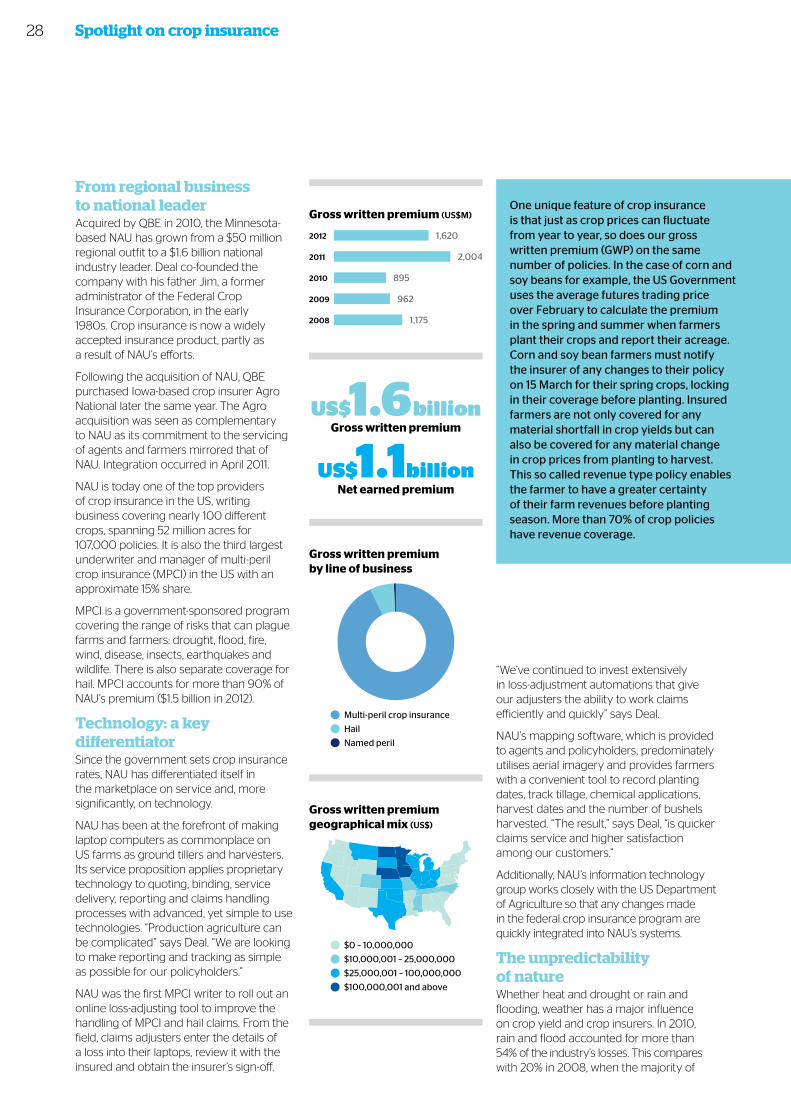
One unique feature of crop insurance is that just as crop prices can fluctuate from year to year, so does our gross written premium (GWP) on the same number of policies. In the case of corn and soy beans for example, the US Government uses the average futures trading price over February to calculate the premium in the spring and summer when farmers plant their crops and report their acreage. Corn and soy bean farmers must notify the insurer of any changes to their policy on 15 March for their spring crops, locking in their coverage before planting. Insured farmers are not only covered for any material shortfall in crop yields but can also be covered for any material change in crop prices from planting to harvest. This so called revenue type policy enables the farmer to have a greater certainty of their farm revenues before planting season. More than 70% of crop policies have revenue coverage.
“We’ve continued to invest extensively in loss-adjustment automations that give our adjusters the ability to work claims efficiently and quickly” says Deal.
NAU’s mapping software, which is provided to agents and policyholders, predominately utilises aerial imagery and provides farmers with a convenient tool to record planting dates, track tillage, chemical applications, harvest dates and the number of bushels harvested. “The result,” says Deal, “is quicker claims service and higher satisfaction among our customers.”
Additionally, NAU’s information technology group works closely with the US Department of Agriculture so that any changes made in the federal crop insurance program are quickly integrated into NAU’s systems.
The unpredictability of natureWhether heat and drought or rain and flooding, weather has a major influence on crop yield and crop insurers. In 2010, rain and flood accounted for more than 54% of the industry’s losses. This compares with 20% in 2008, when the majority of
From regional business to national leaderAcquired by QBE in 2010, the Minnesota-based NAU has grown from a $50 million regional outfit to a $1.6 billion national industry leader. Deal co-founded the company with his father Jim, a former administrator of the Federal Crop Insurance Corporation, in the early 1980s. Crop insurance is now a widely accepted insurance product, partly as a result of NAU’s efforts.
Following the acquisition of NAU, QBE purchased Iowa-based crop insurer Agro National later the same year. The Agro acquisition was seen as complementary to NAU as its commitment to the servicing of agents and farmers mirrored that of NAU. Integration occurred in April 2011.
NAU is today one of the top providers of crop insurance in the US, writing business covering nearly 100 different crops, spanning 52 million acres for 107,000 policies. It is also the third largest underwriter and manager of multi-peril crop insurance (MPCI) in the US with an approximate 15% share.
MPCI is a government-sponsored program covering the range of risks that can plague farms and farmers: drought, flood, fire, wind, disease, insects, earthquakes and wildlife. There is also separate coverage for hail. MPCI accounts for more than 90% of NAU’s premium ($1.5 billion in 2012).
Technology: a key differentiatorSince the government sets crop insurance rates, NAU has differentiated itself in the marketplace on service and, more significantly, on technology.
NAU has been at the forefront of making laptop computers as commonplace on US farms as ground tillers and harvesters. Its service proposition applies proprietary technology to quoting, binding, service delivery, reporting and claims handling processes with advanced, yet simple to use technologies. “Production agriculture can be complicated” says Deal. “We are looking to make reporting and tracking as simple as possible for our policyholders.”
NAU was the first MPCI writer to roll out an online loss-adjusting tool to improve the handling of MPCI and hail claims. From the field, claims adjusters enter the details of a loss into their laptops, review it with the insured and obtain the insurer’s sign-off.
Spotlight on crop insurance
US$1.6billion
US$1.1billion
Gross written premium
Net earned premium
Gross written premium (US$M)
1,620
2,004
895
962
1,175
2012
2011
2010
2009
2008
Gross written premium by line of business Named peril
Hail
MPCI
Multi-peril crop insurance
Hail
Named peril
Gross written premium geographical mix (US$)
$0 – 10,000,000
$10,000,001 – 25,000,000
$25,000,001 – 100,000,000
$100,000,001 and above
28

claims originated from drought and changes in commodity prices. In 2012, the US Midwest regularly faced triple-digit fahrenheit temperatures and its worst drought conditions in 50 years.
“Uncertainty is a way of life for our farm customers” says Deal. “We can’t predict, for example, when a hailstorm will strike. In crop insurance you’re always looking out the window or checking the weather forecast.”
The drought, combined with higher harvest prices, produced revenue losses for farmers unseen for many years. Some regions had significant yield loss, which contributed to large claims not normally seen in the US Corn Belt. Additionally, hail losses were higher than normal, mostly from storms that hit Minnesota. “We led the industry in processing claims and undertaking adjustment work to close out the season” says Deal.
“Our outstanding claims service should propel further 2013 growth” says Deal, adding that historically NAU has seen a direct correlation of higher volume
claims years followed by significant increases in business. “This has been a great opportunity for our claims team to showcase its service excellence” he says.
“Whatever the conditions” Deal says, “NAU is providing peace of mind to farmers through our risk management and our insurance products, as well as the services we provide to ensure that all claims are paid as quickly and accurately as possible – and that’s particularly relevant in a year where claims will be significant.
“Today we are well prepared to quickly deliver claim cheques to our farmers that will be hit with lower production from the drought and other perils. We believe the future looks very bright for the growth of crop business at QBE.”
While crop performance was impacted by hail storms in 2011 and drought in 2012, the long-term profitability of this business is demonstrated by an average combined operating ratio of 88% over the last 10 years.
Oth
er in
form
ation
6
Fin
ancial
repo
rt
5
Go
vern
ance
3
Directo
rs' rep
ort
4
QB
E In
suran
ce Gro
up
A
nn
ual rep
ort 20
12B
usin
ess rev
iew
2
High
lights
& o
verv
iew
1
Applying proprietary technology to quoting, binding, service delivery, reporting and claims handling, NAU has been making laptop computers as commonplace on US farms as ground tillers and harvesters.
Utilising the latest technology, NAU’s iPad app, EASYmobility, makes it simple and efficient for our policyholders to manage their policies and keep them up to date.
29
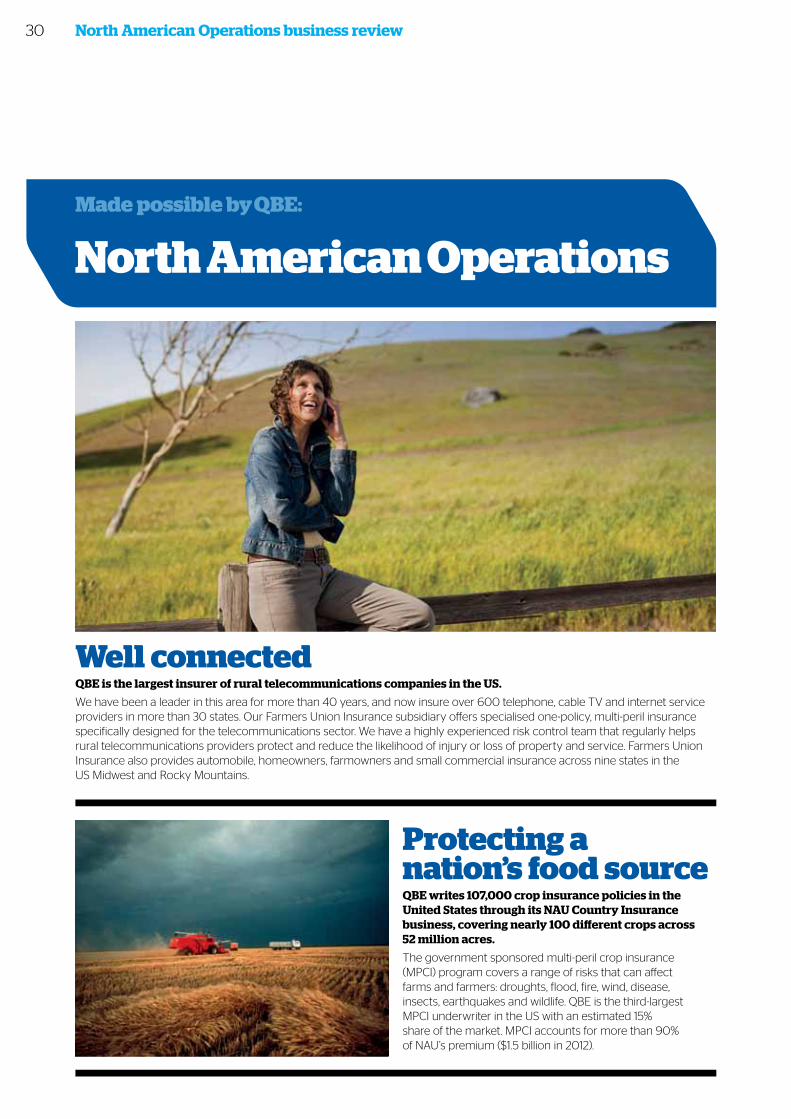
North American Operations business review
Made possible by QBE:
North American Operations
Protecting a nation’s food sourceQBE writes 107,000 crop insurance policies in the United States through its NAU Country Insurance business, covering nearly 100 different crops across 52 million acres.
The government sponsored multi-peril crop insurance (MPCI) program covers a range of risks that can affect farms and farmers: droughts, flood, fire, wind, disease, insects, earthquakes and wildlife. QBE is the third-largest MPCI underwriter in the US with an estimated 15% share of the market. MPCI accounts for more than 90% of NAU’s premium ($1.5 billion in 2012).
Well connectedQBE is the largest insurer of rural telecommunications companies in the US.
We have been a leader in this area for more than 40 years, and now insure over 600 telephone, cable TV and internet service providers in more than 30 states. Our Farmers Union Insurance subsidiary offers specialised one-policy, multi-peril insurance specifically designed for the telecommunications sector. We have a highly experienced risk control team that regularly helps rural telecommunications providers protect and reduce the likelihood of injury or loss of property and service. Farmers Union Insurance also provides automobile, homeowners, farmowners and small commercial insurance across nine states in the US Midwest and Rocky Mountains.
30

Oth
er in
form
ation
6
Fin
ancial
repo
rt
5
Go
vern
ance
3
Directo
rs' rep
ort
4
QB
E In
suran
ce Gro
up
A
nn
ual rep
ort 20
12B
usin
ess rev
iew
2
High
lights
& o
verv
iew
1
High-rise paradiseQBE is a major provider of commercial property insurance to apartment buildings located around the coastal areas of southern Florida. One of our primary niches is wind and hail coverage for superior wind-resistive condominiums.
Winter wonderland Skating in Central Park is a winter tradition for New Yorkers, many of whom have tied their skates for the first time on this ice.
The venue has featured in films such as Love Story and Serendipity, setting visitors beneath the magical New York skyline. QBE provides insurance for the 33,000 square foot rink, which in the summer months is replaced with an amusement park.
Building AmericaQBE serves 17 of the top 20 homebuilders in the US.
Builders with a licensed agency can offer insurance products directly to their customers. As an alternative to forming a licensed agency, QBE also offers homebuilders arrangements and marketing service agreements which allow home buyers to get coverage quickly so they can close their loans and move in on time.
Four-legged coverageQBE covers 20% of the insured pets in the US.
We offer a number of products ranging from accident-only coverage to broad, comprehensive all-risks insurance cover. QBE covers costs related to accidents and illnesses for dogs and cats, with rates and coverage eligibility established based on age, breed, and coverage type. We also offer coverage to animal shelters through our Pet Point Shelter Care program, which mostly deals with younger animals. This includes a one month free gift insurance policy to owners of newly adopted pets from shelters.
Keeping shopQBE provides property insurance for some of the largest retailers in the US. We provide coverage to many familiar retailing brands with hundreds of stores across the US.
Ten pinsQBE is one of North America’s largest insurers of independent bowling centres. We offer a comprehensive insurance program that is endorsed by the Bowling Proprietors Association of America.
31
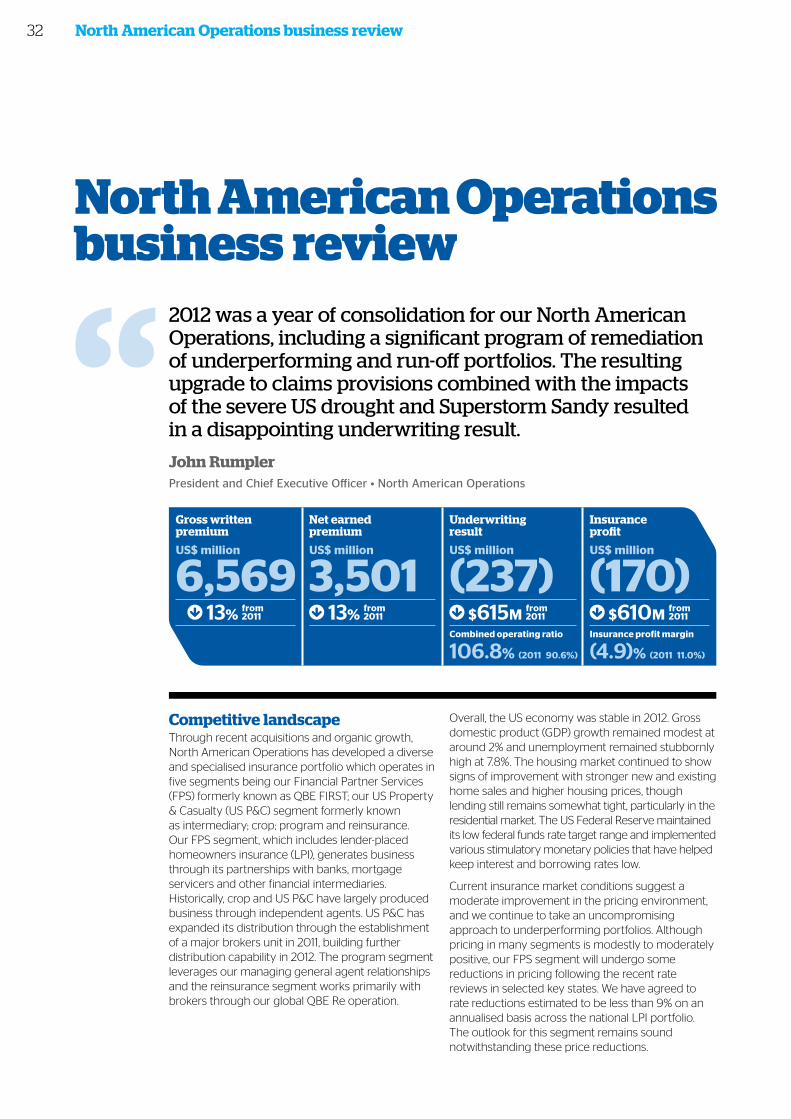
North American Operations business review
North American Operations business review
2012 was a year of consolidation for our North American Operations, including a significant program of remediation of underperforming and run-off portfolios. The resulting upgrade to claims provisions combined with the impacts of the severe US drought and Superstorm Sandy resulted in a disappointing underwriting result.
John Rumpler President and Chief Executive Officer • North American Operations
Gross written premium
Net earned premium
Underwriting result
Insurance profit
US$ million
6,569US$ million
3,501US$ million
(237)US$ million
(170) 13% from
2011 13% from 2011 $615M from
2011
106.8% (2011 90.6%) (4.9)% (2011 11.0%)
$610M from 2011
Combined operating ratio Insurance profit margin
Competitive landscapeThrough recent acquisitions and organic growth, North American Operations has developed a diverse and specialised insurance portfolio which operates in five segments being our Financial Partner Services (FPS) formerly known as QBE FIRST; our US Property & Casualty (US P&C) segment formerly known as intermediary; crop; program and reinsurance. Our FPS segment, which includes lender-placed homeowners insurance (LPI), generates business through its partnerships with banks, mortgage servicers and other financial intermediaries. Historically, crop and US P&C have largely produced business through independent agents. US P&C has expanded its distribution through the establishment of a major brokers unit in 2011, building further distribution capability in 2012. The program segment leverages our managing general agent relationships and the reinsurance segment works primarily with brokers through our global QBE Re operation.
Overall, the US economy was stable in 2012. Gross domestic product (GDP) growth remained modest at around 2% and unemployment remained stubbornly high at 7.8%. The housing market continued to show signs of improvement with stronger new and existing home sales and higher housing prices, though lending still remains somewhat tight, particularly in the residential market. The US Federal Reserve maintained its low federal funds rate target range and implemented various stimulatory monetary policies that have helped keep interest and borrowing rates low.
Current insurance market conditions suggest a moderate improvement in the pricing environment, and we continue to take an uncompromising approach to underperforming portfolios. Although pricing in many segments is modestly to moderately positive, our FPS segment will undergo some reductions in pricing following the recent rate reviews in selected key states. We have agreed to rate reductions estimated to be less than 9% on an annualised basis across the national LPI portfolio. The outlook for this segment remains sound notwithstanding these price reductions.
32
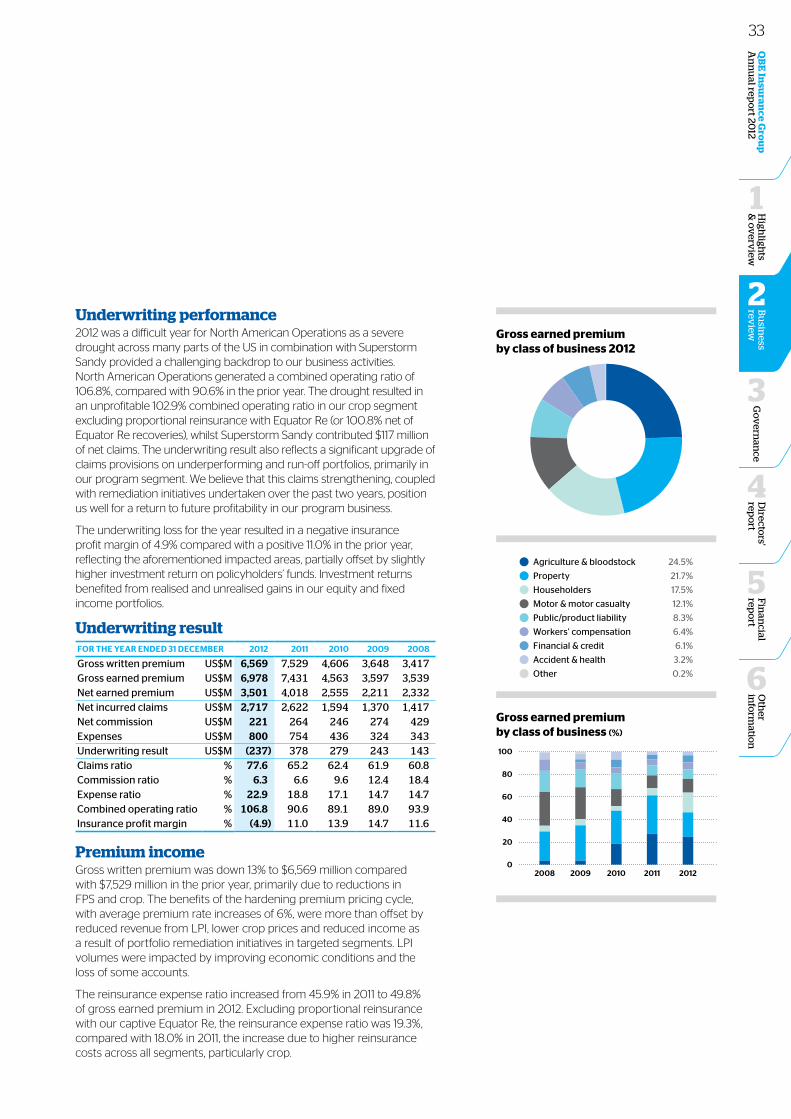
Oth
er in
form
ation
6
Fin
ancial
repo
rt
5
Go
vern
ance
3
Directo
rs' rep
ort
4
QB
E In
suran
ce Gro
up
A
nn
ual rep
ort 20
12B
usin
ess rev
iew
2
High
lights
& o
verv
iew
1
Gross earned premium by class of business (%)
0
20
40
60
80
100
Marine
Accident
Fin
WC
Liability
Motor
Householders
Property
Agri2008 2009 2010 2011 2012
Agriculture and bloodstock
Property
Householders
Motor and motor casualty
Public/product liability
Workers’ compensation
Financial and credit
Accident and health
Other
Gross earned premium by class of business 2012 Other
Accident
Fin
WC
Liability
Motor
Householders
Property
Agri
Property 21.7%
Householders 17.5%
Motor & motor casualty 12.1%
Public/product liability 8.3%
Workers’ compensation 6.4%
Financial & credit 6.1%
Accident & health 3.2%
Agriculture & bloodstock 24.5%
Other 0.2%
Underwriting performance2012 was a difficult year for North American Operations as a severe drought across many parts of the US in combination with Superstorm Sandy provided a challenging backdrop to our business activities. North American Operations generated a combined operating ratio of 106.8%, compared with 90.6% in the prior year. The drought resulted in an unprofitable 102.9% combined operating ratio in our crop segment excluding proportional reinsurance with Equator Re (or 100.8% net of Equator Re recoveries), whilst Superstorm Sandy contributed $117 million of net claims. The underwriting result also reflects a significant upgrade of claims provisions on underperforming and run-off portfolios, primarily in our program segment. We believe that this claims strengthening, coupled with remediation initiatives undertaken over the past two years, position us well for a return to future profitability in our program business.
The underwriting loss for the year resulted in a negative insurance profit margin of 4.9% compared with a positive 11.0% in the prior year, reflecting the aforementioned impacted areas, partially offset by slightly higher investment return on policyholders’ funds. Investment returns benefited from realised and unrealised gains in our equity and fixed income portfolios.
Underwriting resultFOR thE yEAR ENdEd 31 dECEmBER 2012 2011 2010 2009 2008
Gross written premium US$M 6,569 7,529 4,606 3,648 3,417Gross earned premium US$M 6,978 7,431 4,563 3,597 3,539Net earned premium US$M 3,501 4,018 2,555 2,211 2,332Net incurred claims US$M 2,717 2,622 1,594 1,370 1,417Net commission US$M 221 264 246 274 429Expenses US$M 800 754 436 324 343Underwriting result US$M (237) 378 279 243 143Claims ratio % 77.6 65.2 62.4 61.9 60.8Commission ratio % 6.3 6.6 9.6 12.4 18.4Expense ratio % 22.9 18.8 17.1 14.7 14.7Combined operating ratio % 106.8 90.6 89.1 89.0 93.9Insurance profit margin % (4.9) 11.0 13.9 14.7 11.6
Premium incomeGross written premium was down 13% to $6,569 million compared with $7,529 million in the prior year, primarily due to reductions in FPS and crop. The benefits of the hardening premium pricing cycle, with average premium rate increases of 6%, were more than offset by reduced revenue from LPI, lower crop prices and reduced income as a result of portfolio remediation initiatives in targeted segments. LPI volumes were impacted by improving economic conditions and the loss of some accounts.
The reinsurance expense ratio increased from 45.9% in 2011 to 49.8% of gross earned premium in 2012. Excluding proportional reinsurance with our captive Equator Re, the reinsurance expense ratio was 19.3%, compared with 18.0% in 2011, the increase due to higher reinsurance costs across all segments, particularly crop.
33
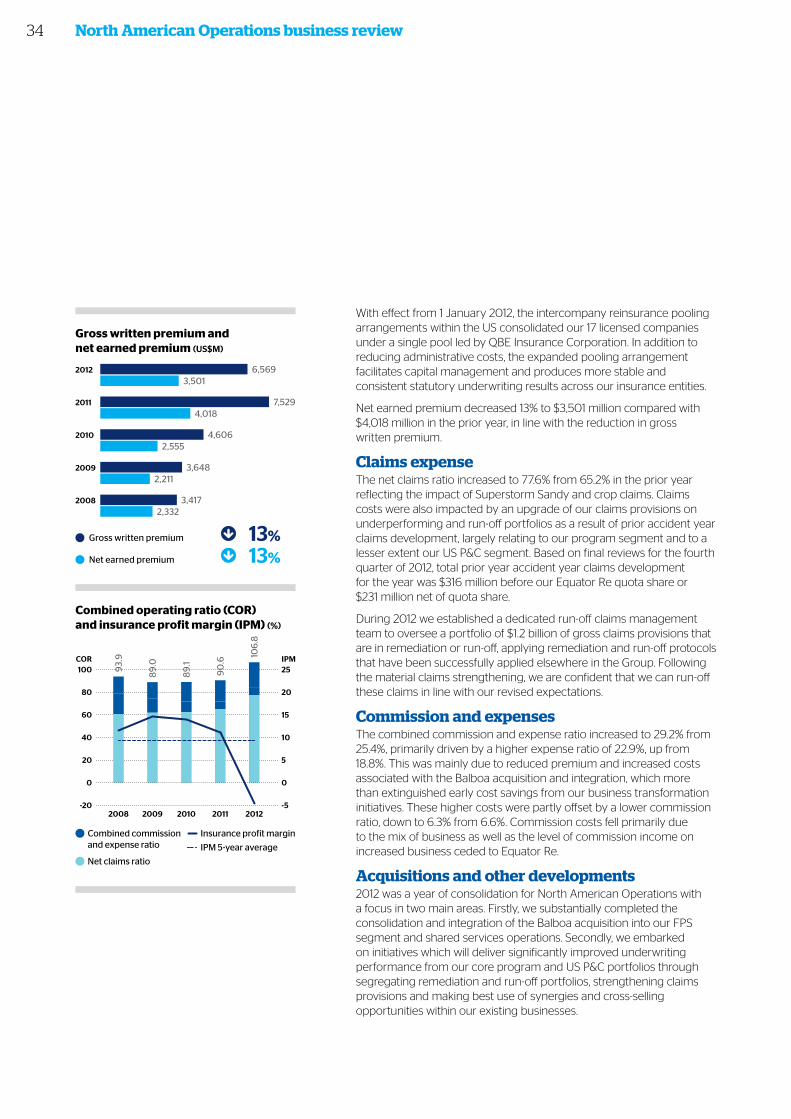
With effect from 1 January 2012, the intercompany reinsurance pooling arrangements within the US consolidated our 17 licensed companies under a single pool led by QBE Insurance Corporation. In addition to reducing administrative costs, the expanded pooling arrangement facilitates capital management and produces more stable and consistent statutory underwriting results across our insurance entities.
Net earned premium decreased 13% to $3,501 million compared with $4,018 million in the prior year, in line with the reduction in gross written premium.
Claims expenseThe net claims ratio increased to 77.6% from 65.2% in the prior year reflecting the impact of Superstorm Sandy and crop claims. Claims costs were also impacted by an upgrade of our claims provisions on underperforming and run-off portfolios as a result of prior accident year claims development, largely relating to our program segment and to a lesser extent our US P&C segment. Based on final reviews for the fourth quarter of 2012, total prior year accident year claims development for the year was $316 million before our Equator Re quota share or $231 million net of quota share.
During 2012 we established a dedicated run-off claims management team to oversee a portfolio of $1.2 billion of gross claims provisions that are in remediation or run-off, applying remediation and run-off protocols that have been successfully applied elsewhere in the Group. Following the material claims strengthening, we are confident that we can run-off these claims in line with our revised expectations.
Commission and expensesThe combined commission and expense ratio increased to 29.2% from 25.4%, primarily driven by a higher expense ratio of 22.9%, up from 18.8%. This was mainly due to reduced premium and increased costs associated with the Balboa acquisition and integration, which more than extinguished early cost savings from our business transformation initiatives. These higher costs were partly offset by a lower commission ratio, down to 6.3% from 6.6%. Commission costs fell primarily due to the mix of business as well as the level of commission income on increased business ceded to Equator Re.
Acquisitions and other developments2012 was a year of consolidation for North American Operations with a focus in two main areas. Firstly, we substantially completed the consolidation and integration of the Balboa acquisition into our FPS segment and shared services operations. Secondly, we embarked on initiatives which will deliver significantly improved underwriting performance from our core program and US P&C portfolios through segregating remediation and run-off portfolios, strengthening claims provisions and making best use of synergies and cross-selling opportunities within our existing businesses.
North American Operations business review
Combined operating ratio (COR) and insurance profit margin (IPM) (%)
0
20
40
60
80
100
0
5
10
15
20
25
-20 -5
93.
9
89
.0
89
.1
90
.6
106
.8
2008 2009 2010 2011 2012
COR IPM
Combined commission and expense ratio
Net claims ratio
Insurance profit margin
IPM 5-year average
Gross written premium and net earned premium (US$M)
6,5693,501
7,5294,018
4,6062,555
3,6482,211
3,4172,332
2012
2011
2010
2009
2008
Gross written premium 13%
Net earned premium 13%
34
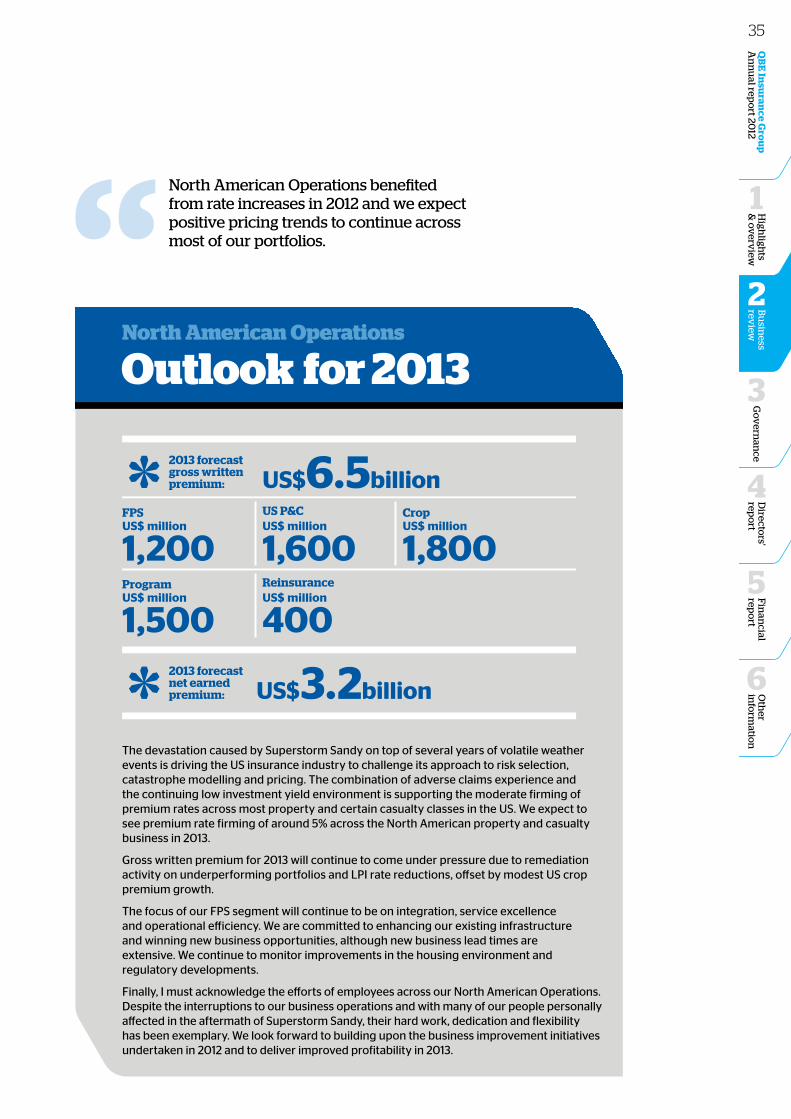
Oth
er in
form
ation
6
Fin
ancial
repo
rt
5
Go
vern
ance
3
Directo
rs' rep
ort
4
QB
E In
suran
ce Gro
up
A
nn
ual rep
ort 20
12B
usin
ess rev
iew
2
High
lights
& o
verv
iew
1
Outlook for 2013North American Operations
2013 forecast gross written premium:
The devastation caused by Superstorm Sandy on top of several years of volatile weather events is driving the US insurance industry to challenge its approach to risk selection, catastrophe modelling and pricing. The combination of adverse claims experience and the continuing low investment yield environment is supporting the moderate firming of premium rates across most property and certain casualty classes in the US. We expect to see premium rate firming of around 5% across the North American property and casualty business in 2013.
Gross written premium for 2013 will continue to come under pressure due to remediation activity on underperforming portfolios and LPI rate reductions, offset by modest US crop premium growth.
The focus of our FPS segment will continue to be on integration, service excellence and operational efficiency. We are committed to enhancing our existing infrastructure and winning new business opportunities, although new business lead times are extensive. We continue to monitor improvements in the housing environment and regulatory developments.
Finally, I must acknowledge the efforts of employees across our North American Operations. Despite the interruptions to our business operations and with many of our people personally affected in the aftermath of Superstorm Sandy, their hard work, dedication and flexibility has been exemplary. We look forward to building upon the business improvement initiatives undertaken in 2012 and to deliver improved profitability in 2013.
US$6.5billion
North American Operations benefited from rate increases in 2012 and we expect positive pricing trends to continue across most of our portfolios.
FPSUS$ million
1,200ProgramUS$ million
1,500
US P&CUS$ million
1,600ReinsuranceUS$ million
400
CropUS$ million
1,800
2013 forecast net earned premium: US$3.2billion
35
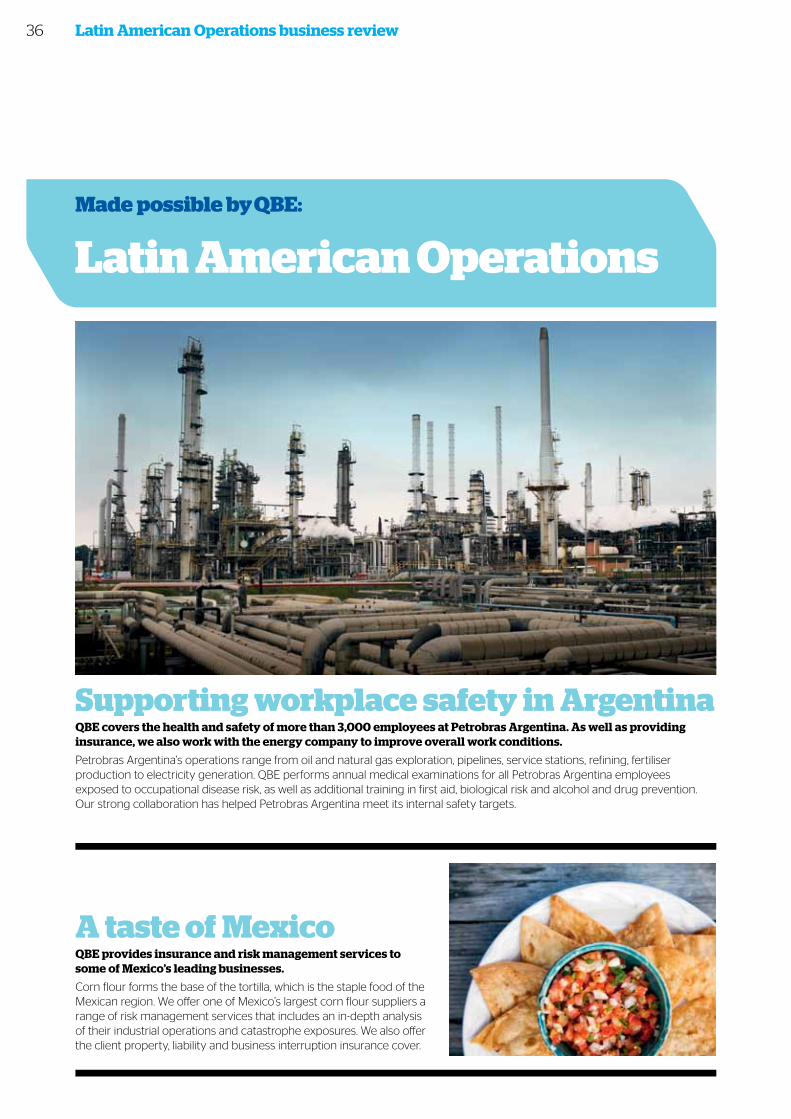
Latin American Operations business review
Made possible by QBE:
Latin American Operations
A taste of MexicoQBE provides insurance and risk management services to some of Mexico’s leading businesses.
Corn flour forms the base of the tortilla, which is the staple food of the Mexican region. We offer one of Mexico’s largest corn flour suppliers a range of risk management services that includes an in-depth analysis of their industrial operations and catastrophe exposures. We also offer the client property, liability and business interruption insurance cover.
Supporting workplace safety in ArgentinaQBE covers the health and safety of more than 3,000 employees at Petrobras Argentina. As well as providing insurance, we also work with the energy company to improve overall work conditions.
Petrobras Argentina’s operations range from oil and natural gas exploration, pipelines, service stations, refining, fertiliser production to electricity generation. QBE performs annual medical examinations for all Petrobras Argentina employees exposed to occupational disease risk, as well as additional training in first aid, biological risk and alcohol and drug prevention. Our strong collaboration has helped Petrobras Argentina meet its internal safety targets.
36

Oth
er in
form
ation
6
Fin
ancial
repo
rt
5
Go
vern
ance
3
Directo
rs' rep
ort
4
QB
E In
suran
ce Gro
up
A
nn
ual rep
ort 20
12B
usin
ess rev
iew
2
High
lights
& o
verv
iew
1
Landmark coverage QBE provides earthquake and terrorism insurance cover on numerous properties across Colombia.
Properties covered by QBE include several key Colombian office buildings and historic landmarks. QBE also has an agreement with the Colombian National Penitentiary Institute to provide health insurance to the country’s prison population.
24/7 serviceQBE insures the motor and cargo fleet of Argentina’s largest industrial group, Techint.
The Argentinian-Italian conglomerate’s operations range from engineering, construction, oil and gas exploration, steel making to healthcare. We provide insurance cover for all of Techint’s import and export cargo needs and a QBE claims adjuster works exclusively with Techint to assess claims costs. In addition, we provide a 24/7 cargo control service allowing Techint to load and unload cargo at any hour to boost its productivity.
No place like itQBE has worked closely with a leading retailer to increase homeowner insurance take up in the Brazilian state of Espírito Santo.
Home owner insurance is not widespread in Brazil; however, the first 12 months of a distribution agreement between QBE and the retailer saw 25,000 families in the state take a homeowner’s policy for the first time. Our policies, which start from as little as $50 a year, cover fire, lightning, explosion, robbery, personal liability and have a home emergency assistance component.
Pick-up coverQBE provides property cover for Toyota’s sole car manufacturing plant in Argentina. We also provide product liability cover for the estimated 70,000 vehicles manufactured at the factory each year, including Hilux pick-ups.
Loss controlQBE provides general liability coverage for nine municipalities in Puerto Rico. We provide loss control services to the ‘municipios’ including risk surveys which recommend ways to reduce claims and losses.
Job protectionQBE provides unemployment insurance for 280,000 credit card holders of Banco del Pichincha, the largest private bank in Ecuador.
37
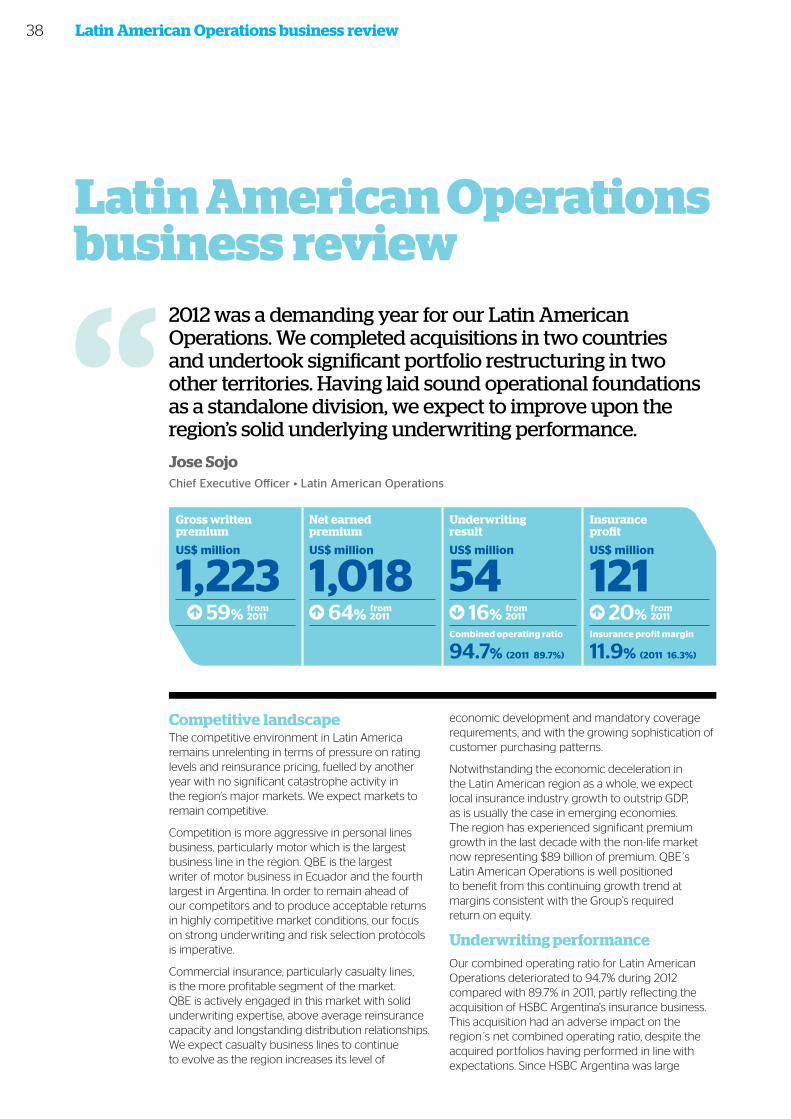
Competitive landscapeThe competitive environment in Latin America remains unrelenting in terms of pressure on rating levels and reinsurance pricing, fuelled by another year with no significant catastrophe activity in the region’s major markets. We expect markets to remain competitive.
Competition is more aggressive in personal lines business, particularly motor which is the largest business line in the region. QBE is the largest writer of motor business in Ecuador and the fourth largest in Argentina. In order to remain ahead of our competitors and to produce acceptable returns in highly competitive market conditions, our focus on strong underwriting and risk selection protocols is imperative.
Commercial insurance, particularly casualty lines, is the more profitable segment of the market. QBE is actively engaged in this market with solid underwriting expertise, above average reinsurance capacity and longstanding distribution relationships. We expect casualty business lines to continue to evolve as the region increases its level of
economic development and mandatory coverage requirements, and with the growing sophistication of customer purchasing patterns.
Notwithstanding the economic deceleration in the Latin American region as a whole, we expect local insurance industry growth to outstrip GDP, as is usually the case in emerging economies. The region has experienced significant premium growth in the last decade with the non-life market now representing $89 billion of premium. QBE s Latin American Operations is well positioned to benefit from this continuing growth trend at margins consistent with the Group’s required return on equity.
Underwriting performanceOur combined operating ratio for Latin American Operations deteriorated to 94.7% during 2012 compared with 89.7% in 2011, partly reflecting the acquisition of HSBC Argentina's insurance business. This acquisition had an adverse impact on the region s net combined operating ratio, despite the acquired portfolios having performed in line with expectations. Since HSBC Argentina was large
Latin American Operations business review
Latin American Operations business review
2012 was a demanding year for our Latin American Operations. We completed acquisitions in two countries and undertook significant portfolio restructuring in two other territories. Having laid sound operational foundations as a standalone division, we expect to improve upon the region’s solid underlying underwriting performance.
Jose Sojo Chief Executive Officer • Latin American Operations
Gross written premium
Net earned premium
Underwriting result
Insurance profit
US$ million
1,223US$ million
1,018US$ million
54US$ million
121 59% from
2011 64% from 2011 16% from
2011
94.7% (2011 89.7%) 11.9% (2011 16.3%)
20% from 2011
Combined operating ratio Insurance profit margin
38
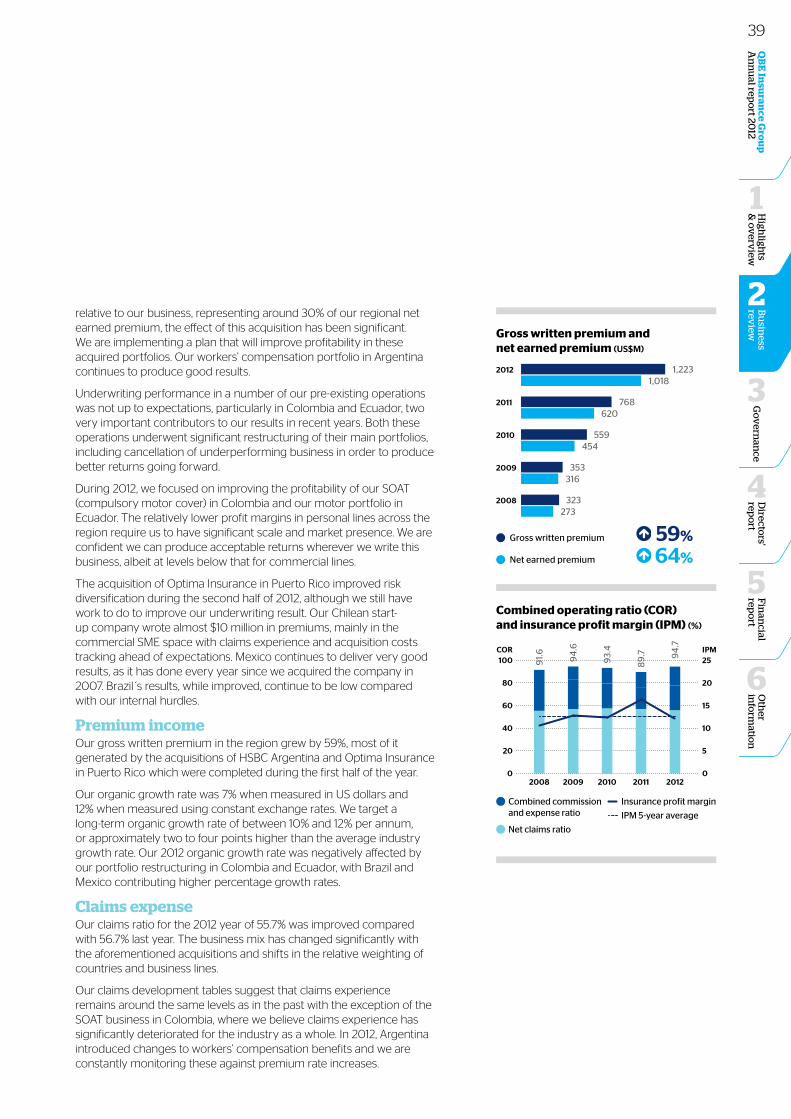
relative to our business, representing around 30% of our regional net earned premium, the effect of this acquisition has been significant. We are implementing a plan that will improve profitability in these acquired portfolios. Our workers’ compensation portfolio in Argentina continues to produce good results.
Underwriting performance in a number of our pre-existing operations was not up to expectations, particularly in Colombia and Ecuador, two very important contributors to our results in recent years. Both these operations underwent significant restructuring of their main portfolios, including cancellation of underperforming business in order to produce better returns going forward.
During 2012, we focused on improving the profitability of our SOAT (compulsory motor cover) in Colombia and our motor portfolio in Ecuador. The relatively lower profit margins in personal lines across the region require us to have significant scale and market presence. We are confident we can produce acceptable returns wherever we write this business, albeit at levels below that for commercial lines.
The acquisition of Optima Insurance in Puerto Rico improved risk diversification during the second half of 2012, although we still have work to do to improve our underwriting result. Our Chilean start-up company wrote almost $10 million in premiums, mainly in the commercial SME space with claims experience and acquisition costs tracking ahead of expectations. Mexico continues to deliver very good results, as it has done every year since we acquired the company in 2007. Brazil s results, while improved, continue to be low compared with our internal hurdles.
Premium incomeOur gross written premium in the region grew by 59%, most of it generated by the acquisitions of HSBC Argentina and Optima Insurance in Puerto Rico which were completed during the first half of the year.
Our organic growth rate was 7% when measured in US dollars and 12% when measured using constant exchange rates. We target a long-term organic growth rate of between 10% and 12% per annum, or approximately two to four points higher than the average industry growth rate. Our 2012 organic growth rate was negatively affected by our portfolio restructuring in Colombia and Ecuador, with Brazil and Mexico contributing higher percentage growth rates.
Claims expenseOur claims ratio for the 2012 year of 55.7% was improved compared with 56.7% last year. The business mix has changed significantly with the aforementioned acquisitions and shifts in the relative weighting of countries and business lines.
Our claims development tables suggest that claims experience remains around the same levels as in the past with the exception of the SOAT business in Colombia, where we believe claims experience has significantly deteriorated for the industry as a whole. In 2012, Argentina introduced changes to workers’ compensation benefits and we are constantly monitoring these against premium rate increases.
Oth
er in
form
ation
6
Fin
ancial
repo
rt
5
Go
vern
ance
3
Directo
rs' rep
ort
4
QB
E In
suran
ce Gro
up
A
nn
ual rep
ort 20
12B
usin
ess rev
iew
2
High
lights
& o
verv
iew
1
Gross written premium and net earned premium (US$M)
1,2231,018
768620
559454
353316
323273
2012
2011
2010
2009
2008
Gross written premium
Net earned premium
59%
64%
Combined operating ratio (COR) and insurance profit margin (IPM) (%)
0
20
40
60
80
100
0
5
10
15
20
2591.
6
94
.6
93.
4
89
.7 94
.7
2008 2009 2010 2011 2012
COR IPM
Combined commission and expense ratio
Net claims ratio
Insurance profit margin
IPM 5-year average
39
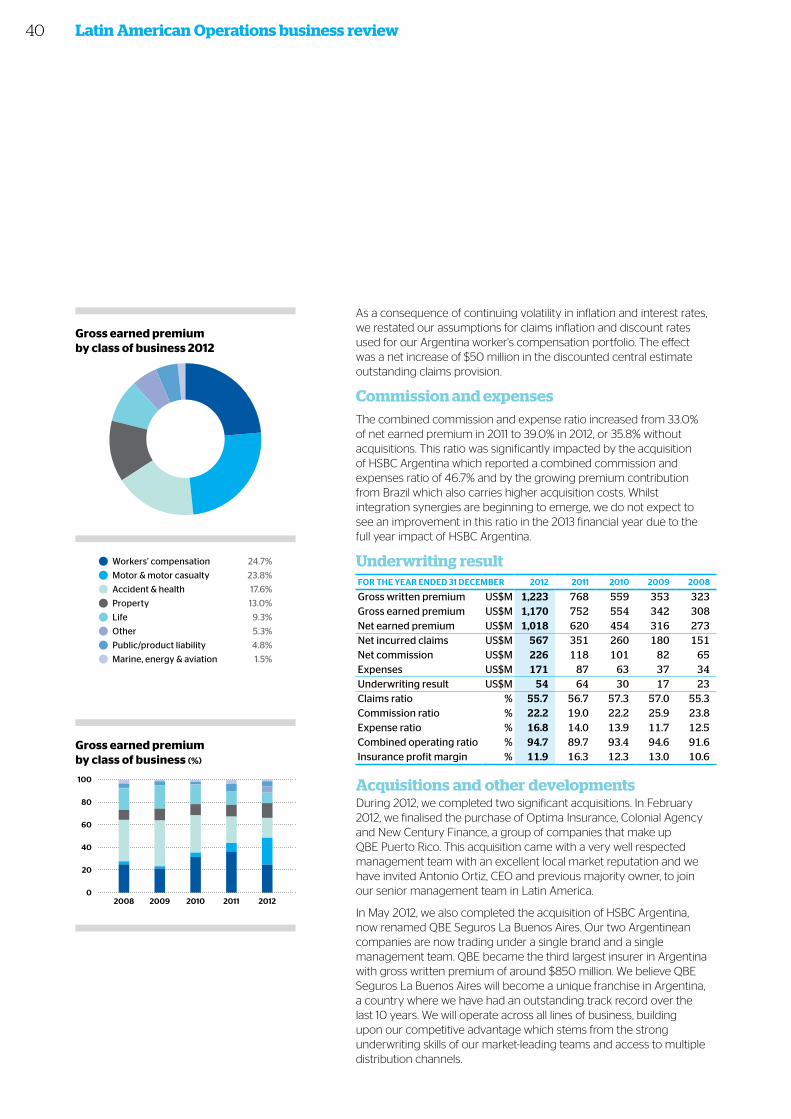
As a consequence of continuing volatility in inflation and interest rates, we restated our assumptions for claims inflation and discount rates used for our Argentina worker's compensation portfolio. The effect was a net increase of $50 million in the discounted central estimate outstanding claims provision.
Commission and expensesThe combined commission and expense ratio increased from 33.0% of net earned premium in 2011 to 39.0% in 2012, or 35.8% without acquisitions. This ratio was significantly impacted by the acquisition of HSBC Argentina which reported a combined commission and expenses ratio of 46.7% and by the growing premium contribution from Brazil which also carries higher acquisition costs. Whilst integration synergies are beginning to emerge, we do not expect to see an improvement in this ratio in the 2013 financial year due to the full year impact of HSBC Argentina.
Underwriting resultFOR thE yEAR ENdEd 31 dECEmBER 2012 2011 2010 2009 2008
Gross written premium US$M 1,223 768 559 353 323Gross earned premium US$M 1,170 752 554 342 308Net earned premium US$M 1,018 620 454 316 273Net incurred claims US$M 567 351 260 180 151Net commission US$M 226 118 101 82 65Expenses US$M 171 87 63 37 34Underwriting result US$M 54 64 30 17 23Claims ratio % 55.7 56.7 57.3 57.0 55.3Commission ratio % 22.2 19.0 22.2 25.9 23.8Expense ratio % 16.8 14.0 13.9 11.7 12.5Combined operating ratio % 94.7 89.7 93.4 94.6 91.6Insurance profit margin % 11.9 16.3 12.3 13.0 10.6
Acquisitions and other developmentsDuring 2012, we completed two significant acquisitions. In February 2012, we finalised the purchase of Optima Insurance, Colonial Agency and New Century Finance, a group of companies that make up QBE Puerto Rico. This acquisition came with a very well respected management team with an excellent local market reputation and we have invited Antonio Ortiz, CEO and previous majority owner, to join our senior management team in Latin America.
In May 2012, we also completed the acquisition of HSBC Argentina, now renamed QBE Seguros La Buenos Aires. Our two Argentinean companies are now trading under a single brand and a single management team. QBE became the third largest insurer in Argentina with gross written premium of around $850 million. We believe QBE Seguros La Buenos Aires will become a unique franchise in Argentina, a country where we have had an outstanding track record over the last 10 years. We will operate across all lines of business, building upon our competitive advantage which stems from the strong underwriting skills of our market-leading teams and access to multiple distribution channels.
Latin American Operations business review
Gross earned premium by class of business (%)
0
20
40
60
80
100
Marine
Liability
Other
Life
Property
Accident
Motor
WC
2008 2009 2010 2011 2012
Workers’ compensation 24.7%
Motor and motor casualty 23.8%
Accident and health 17.6%
Property 13.0%
Life 9.3%
Other 5.3%
Public/product liability 4.8%
Marine, energy and aviation 1.5%
Gross earned premium by class of business 2012 Marine
Liability
Other
Life
Property
Accident
WC
Motor
Workers’ compensation 24.7%
Motor & motor casualty 23.8%
Accident & health 17.6%
Property 13.0%
Life 9.3%
Other 5.3%
Public/product liability 4.8%
Marine, energy & aviation 1.5%
Property 13.0%
Motor and motor casualty 23.8%
Agriculture and bloodstock XX%
Public/product liability 4.8%
Marine, energy and aviation 1.5%
Workers’ compensation 24.7%
Householders XX%
Financial and credit XX%
Accident and health 17.6%
Life 9.3%
Other 5.3%
40
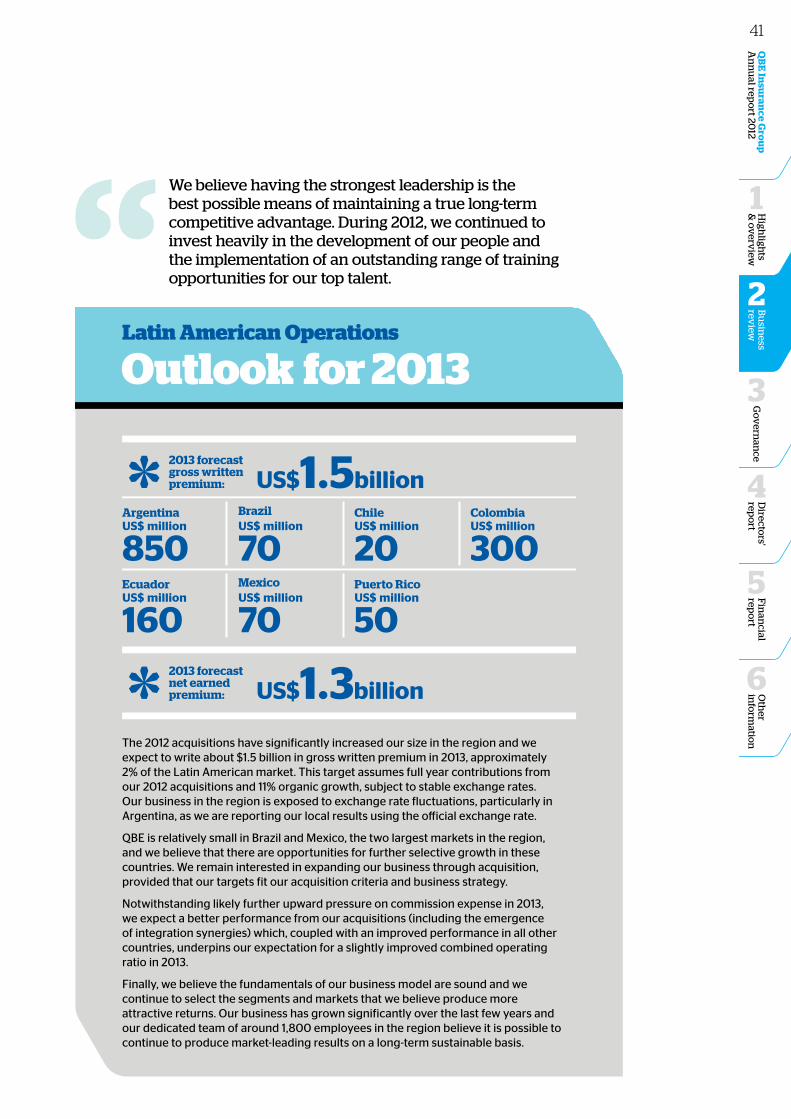
Oth
er in
form
ation
6
Fin
ancial
repo
rt
5
Go
vern
ance
3
Directo
rs' rep
ort
4
QB
E In
suran
ce Gro
up
A
nn
ual rep
ort 20
12B
usin
ess rev
iew
2
High
lights
& o
verv
iew
1
Outlook for 2013Latin American Operations
The 2012 acquisitions have significantly increased our size in the region and we expect to write about $1.5 billion in gross written premium in 2013, approximately 2% of the Latin American market. This target assumes full year contributions from our 2012 acquisitions and 11% organic growth, subject to stable exchange rates. Our business in the region is exposed to exchange rate fluctuations, particularly in Argentina, as we are reporting our local results using the official exchange rate.
QBE is relatively small in Brazil and Mexico, the two largest markets in the region, and we believe that there are opportunities for further selective growth in these countries. We remain interested in expanding our business through acquisition, provided that our targets fit our acquisition criteria and business strategy.
Notwithstanding likely further upward pressure on commission expense in 2013, we expect a better performance from our acquisitions (including the emergence of integration synergies) which, coupled with an improved performance in all other countries, underpins our expectation for a slightly improved combined operating ratio in 2013.
Finally, we believe the fundamentals of our business model are sound and we continue to select the segments and markets that we believe produce more attractive returns. Our business has grown significantly over the last few years and our dedicated team of around 1,800 employees in the region believe it is possible to continue to produce market-leading results on a long-term sustainable basis.
We believe having the strongest leadership is the best possible means of maintaining a true long-term competitive advantage. During 2012, we continued to invest heavily in the development of our people and the implementation of an outstanding range of training opportunities for our top talent.
2013 forecast gross written premium:
ArgentinaUS$ million
850EcuadorUS$ million
160
BrazilUS$ million
70MexicoUS$ million
70
Chile US$ million
20Puerto Rico US$ million
50
Colombia US$ million
300
US$1.5billion
2013 forecast net earned premium: US$1.3billion
41
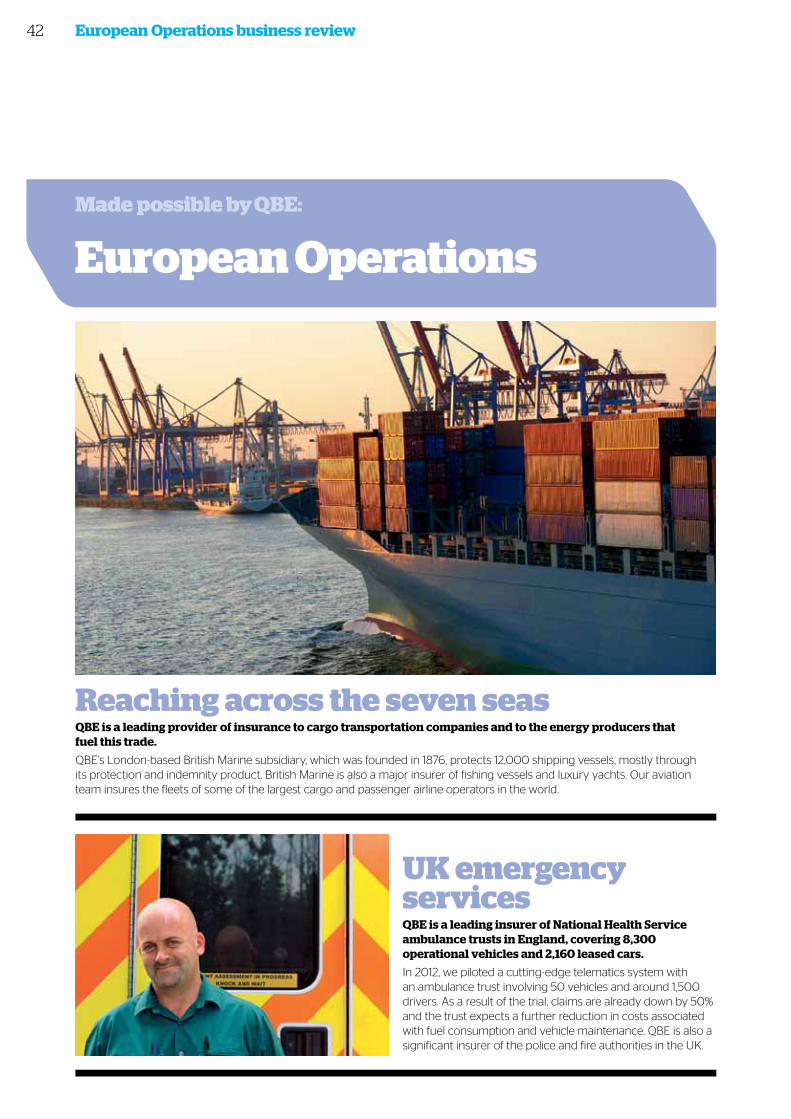
European Operations business review
Made possible by QBE:
European Operations
UK emergency servicesQBE is a leading insurer of National Health Service ambulance trusts in England, covering 8,300 operational vehicles and 2,160 leased cars.
In 2012, we piloted a cutting-edge telematics system with an ambulance trust involving 50 vehicles and around 1,500 drivers. As a result of the trial, claims are already down by 50% and the trust expects a further reduction in costs associated with fuel consumption and vehicle maintenance. QBE is also a significant insurer of the police and fire authorities in the UK.
Reaching across the seven seasQBE is a leading provider of insurance to cargo transportation companies and to the energy producers that fuel this trade.
QBE’s London-based British Marine subsidiary, which was founded in 1876, protects 12,000 shipping vessels, mostly through its protection and indemnity product. British Marine is also a major insurer of fishing vessels and luxury yachts. Our aviation team insures the fleets of some of the largest cargo and passenger airline operators in the world.
42

Oth
er in
form
ation
6
Fin
ancial
repo
rt
5
Go
vern
ance
3
Directo
rs' rep
ort
4
QB
E In
suran
ce Gro
up
A
nn
ual rep
ort 20
12B
usin
ess rev
iew
2
High
lights
& o
verv
iew
1
Energetic enterpriseOur specialist energy underwriters lead a diverse portfolio of offshore and onshore energy risks worldwide.
In particular, we specialise in offshore insurance for assets located in the North Sea, the Far East, Australia and throughout the Americas. We are one of the top insurers that provide cover for wellheads, refineries and petrochemical plants in the Middle East and Asia.
Transporting LondonQBE has signed a five year agreement to provide liability, motor, property, medical liability and commercial crime insurance to Transport for London (TfL).
TfL is the body responsible for London’s transit system: buses, the London Underground and Overground, Docklands Light Railway, Victoria Coach Station and London River Services. More than 24 million journeys are made on the TfL network each day.
Covering ChernobylQBE provides insurance cover to the German company which supplies steel to one of the world's most complex engineering projects, the New Safe Confinement structure at the Chernobyl nuclear plant.
The steel will form part of a 110 metre high structure that will be assembled near the site of the 1986 nuclear accident and then slid in place to cover the remains of the reactor. The 29,000 tonne, 257 metre wide confinement structure will allow for the future dismantling and decommissioning of the damaged reactor.
A modern legendQBE is the preferred insurer for the 6,500 member Harley-Davidson Club of Denmark. Founded in 1976, the club’s goal is to help spread the knowledge of Harley-Davidson in Denmark and help people share their common interest in the iconic motorcycle brand. Their relationship with QBE has developed over the years so that today QBE insures 3,912 Harleys, including classic models from the 1930s.
Peace of mindQBE is the sole provider of travel insurance products for three of the largest and most prestigious international airlines, protecting thousands of passengers a year. Policies are purchased seamlessly as part of the on-line ticket booking process, with QBE’s in-house assistance company, QBE Assist, providing invaluable support with medical emergencies and repatriations on all such policies.
Precious dropQBE insures Italy's 21,000 kilometre Acquedotto Pugliese, Europe’s largest drinking water network by size and waterflow. QBE provides third party, employers’ liability and property cover for the water distributor, which serves around four million customers in the regions of Puglia, Basilicata and Campania.
43
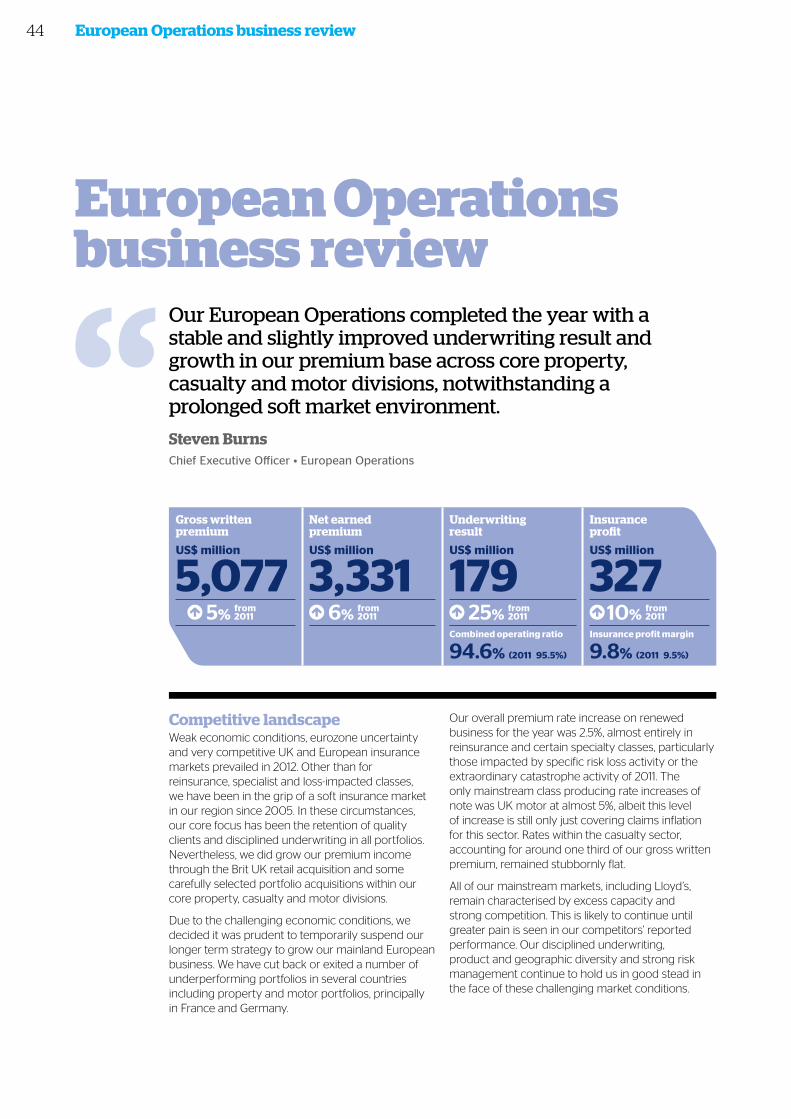
Competitive landscapeWeak economic conditions, eurozone uncertainty and very competitive UK and European insurance markets prevailed in 2012. Other than for reinsurance, specialist and loss-impacted classes, we have been in the grip of a soft insurance market in our region since 2005. In these circumstances, our core focus has been the retention of quality clients and disciplined underwriting in all portfolios. Nevertheless, we did grow our premium income through the Brit UK retail acquisition and some carefully selected portfolio acquisitions within our core property, casualty and motor divisions.
Due to the challenging economic conditions, we decided it was prudent to temporarily suspend our longer term strategy to grow our mainland European business. We have cut back or exited a number of underperforming portfolios in several countries including property and motor portfolios, principally in France and Germany.
Our overall premium rate increase on renewed business for the year was 2.5%, almost entirely in reinsurance and certain specialty classes, particularly those impacted by specific risk loss activity or the extraordinary catastrophe activity of 2011. The only mainstream class producing rate increases of note was UK motor at almost 5%, albeit this level of increase is still only just covering claims inflation for this sector. Rates within the casualty sector, accounting for around one third of our gross written premium, remained stubbornly flat.
All of our mainstream markets, including Lloyd’s, remain characterised by excess capacity and strong competition. This is likely to continue until greater pain is seen in our competitors’ reported performance. Our disciplined underwriting, product and geographic diversity and strong risk management continue to hold us in good stead in the face of these challenging market conditions.
European Operations business review
European Operations business review
Our European Operations completed the year with a stable and slightly improved underwriting result and growth in our premium base across core property, casualty and motor divisions, notwithstanding a prolonged soft market environment.
Steven Burns Chief Executive Officer • European Operations
Gross written premium
Net earned premium
Underwriting result
Insurance profit
US$ million
5,077US$ million
3,331US$ million
179US$ million
327 5% from
2011 6% from 2011 25% from
2011
94.6% (2011 95.5%) 9.8% (2011 9.5%)
10% from 2011
Combined operating ratio Insurance profit margin
44
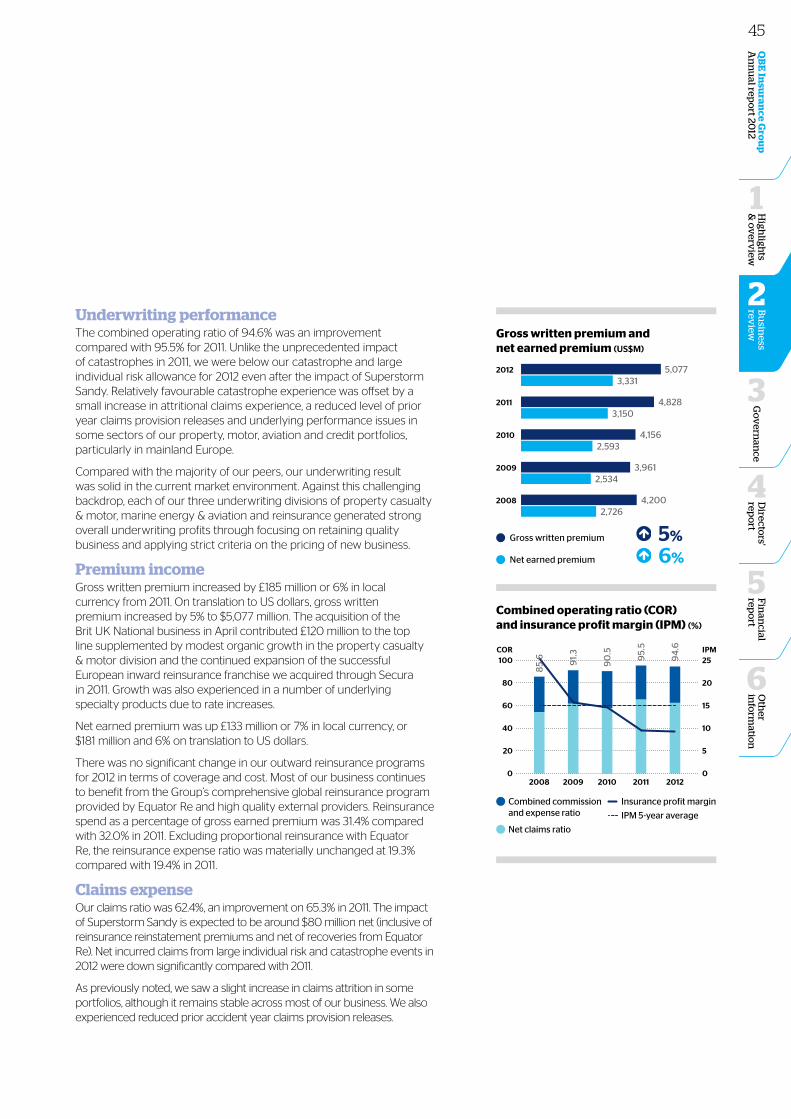
Underwriting performanceThe combined operating ratio of 94.6% was an improvement compared with 95.5% for 2011. Unlike the unprecedented impact of catastrophes in 2011, we were below our catastrophe and large individual risk allowance for 2012 even after the impact of Superstorm Sandy. Relatively favourable catastrophe experience was offset by a small increase in attritional claims experience, a reduced level of prior year claims provision releases and underlying performance issues in some sectors of our property, motor, aviation and credit portfolios, particularly in mainland Europe.
Compared with the majority of our peers, our underwriting result was solid in the current market environment. Against this challenging backdrop, each of our three underwriting divisions of property casualty & motor, marine energy & aviation and reinsurance generated strong overall underwriting profits through focusing on retaining quality business and applying strict criteria on the pricing of new business.
Premium incomeGross written premium increased by £185 million or 6% in local currency from 2011. On translation to US dollars, gross written premium increased by 5% to $5,077 million. The acquisition of the Brit UK National business in April contributed £120 million to the top line supplemented by modest organic growth in the property casualty & motor division and the continued expansion of the successful European inward reinsurance franchise we acquired through Secura in 2011. Growth was also experienced in a number of underlying specialty products due to rate increases.
Net earned premium was up £133 million or 7% in local currency, or $181 million and 6% on translation to US dollars.
There was no significant change in our outward reinsurance programs for 2012 in terms of coverage and cost. Most of our business continues to benefit from the Group’s comprehensive global reinsurance program provided by Equator Re and high quality external providers. Reinsurance spend as a percentage of gross earned premium was 31.4% compared with 32.0% in 2011. Excluding proportional reinsurance with Equator Re, the reinsurance expense ratio was materially unchanged at 19.3% compared with 19.4% in 2011.
Claims expenseOur claims ratio was 62.4%, an improvement on 65.3% in 2011. The impact of Superstorm Sandy is expected to be around $80 million net (inclusive of reinsurance reinstatement premiums and net of recoveries from Equator Re). Net incurred claims from large individual risk and catastrophe events in 2012 were down significantly compared with 2011.
As previously noted, we saw a slight increase in claims attrition in some portfolios, although it remains stable across most of our business. We also experienced reduced prior accident year claims provision releases.
Oth
er in
form
ation
6
Fin
ancial
repo
rt
5
Go
vern
ance
3
Directo
rs' rep
ort
4
QB
E In
suran
ce Gro
up
A
nn
ual rep
ort 20
12B
usin
ess rev
iew
2
High
lights
& o
verv
iew
1
Gross written premium and net earned premium (US$M)
5,0773,331
4,8283,150
4,1562,593
3,9612,534
4,2002,726
2012
2011
2010
2009
2008
Gross written premium 5%
Net earned premium 6%
Combined operating ratio (COR) and insurance profit margin (IPM) (%)
0
20
40
60
80
100
0
5
10
15
20
25
85.
6
91.
3
90
.5
95.
5
94
.6
2008 2009 2010 2011 2012
COR IPM
Combined commission and expense ratio
Net claims ratio
Insurance profit margin
IPM 5-year average
45
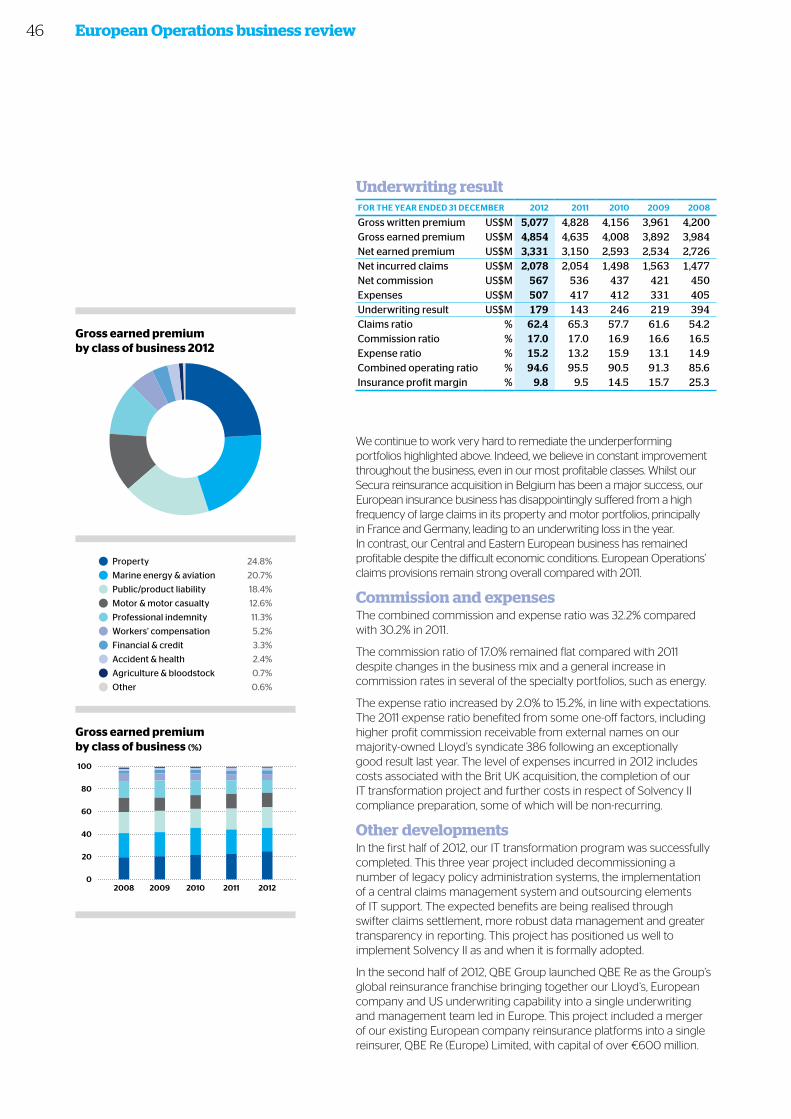
We continue to work very hard to remediate the underperforming portfolios highlighted above. Indeed, we believe in constant improvement throughout the business, even in our most profitable classes. Whilst our Secura reinsurance acquisition in Belgium has been a major success, our European insurance business has disappointingly suffered from a high frequency of large claims in its property and motor portfolios, principally in France and Germany, leading to an underwriting loss in the year. In contrast, our Central and Eastern European business has remained profitable despite the difficult economic conditions. European Operations’ claims provisions remain strong overall compared with 2011.
Commission and expensesThe combined commission and expense ratio was 32.2% compared with 30.2% in 2011.
The commission ratio of 17.0% remained flat compared with 2011 despite changes in the business mix and a general increase in commission rates in several of the specialty portfolios, such as energy.
The expense ratio increased by 2.0% to 15.2%, in line with expectations. The 2011 expense ratio benefited from some one-off factors, including higher profit commission receivable from external names on our majority-owned Lloyd’s syndicate 386 following an exceptionally good result last year. The level of expenses incurred in 2012 includes costs associated with the Brit UK acquisition, the completion of our IT transformation project and further costs in respect of Solvency II compliance preparation, some of which will be non-recurring.
Other developmentsIn the first half of 2012, our IT transformation program was successfully completed. This three year project included decommissioning a number of legacy policy administration systems, the implementation of a central claims management system and outsourcing elements of IT support. The expected benefits are being realised through swifter claims settlement, more robust data management and greater transparency in reporting. This project has positioned us well to implement Solvency II as and when it is formally adopted.
In the second half of 2012, QBE Group launched QBE Re as the Group’s global reinsurance franchise bringing together our Lloyd’s, European company and US underwriting capability into a single underwriting and management team led in Europe. This project included a merger of our existing European company reinsurance platforms into a single reinsurer, QBE Re (Europe) Limited, with capital of over €600 million.
Underwriting resultFOR thE yEAR ENdEd 31 dECEmBER 2012 2011 2010 2009 2008
Gross written premium US$M 5,077 4,828 4,156 3,961 4,200Gross earned premium US$M 4,854 4,635 4,008 3,892 3,984Net earned premium US$M 3,331 3,150 2,593 2,534 2,726Net incurred claims US$M 2,078 2,054 1,498 1,563 1,477Net commission US$M 567 536 437 421 450Expenses US$M 507 417 412 331 405Underwriting result US$M 179 143 246 219 394Claims ratio % 62.4 65.3 57.7 61.6 54.2Commission ratio % 17.0 17.0 16.9 16.6 16.5Expense ratio % 15.2 13.2 15.9 13.1 14.9Combined operating ratio % 94.6 95.5 90.5 91.3 85.6Insurance profit margin % 9.8 9.5 14.5 15.7 25.3
European Operations business review
Gross earned premium by class of business (%)
0
20
40
60
80
100
Other
Agri
Accident
Fin
WC
Prof Indem
Motor
Liability
Marine
Property
2008 2009 2010 2011 2012
Property
Marine, energy and aviation
Public/product liability
Motor and motor casualty
Professional indemnity
Workers’ compensation
Financial and credit
Accident and health
Agriculture and bloodstock
Other
Gross earned premium by class of business 2012 Other
Agri
Accident
Fin
WC
Prof Indem
Motor
Liability
Marine
Property
Property 24.8%
Marine energy & aviation 20.7%
Public/product liability 18.4%
Motor & motor casualty 12.6%
Professional indemnity 11.3%
Workers’ compensation 5.2%
Financial & credit 3.3%
Accident & health 2.4%
Agriculture & bloodstock 0.7%
Other 0.6%
46
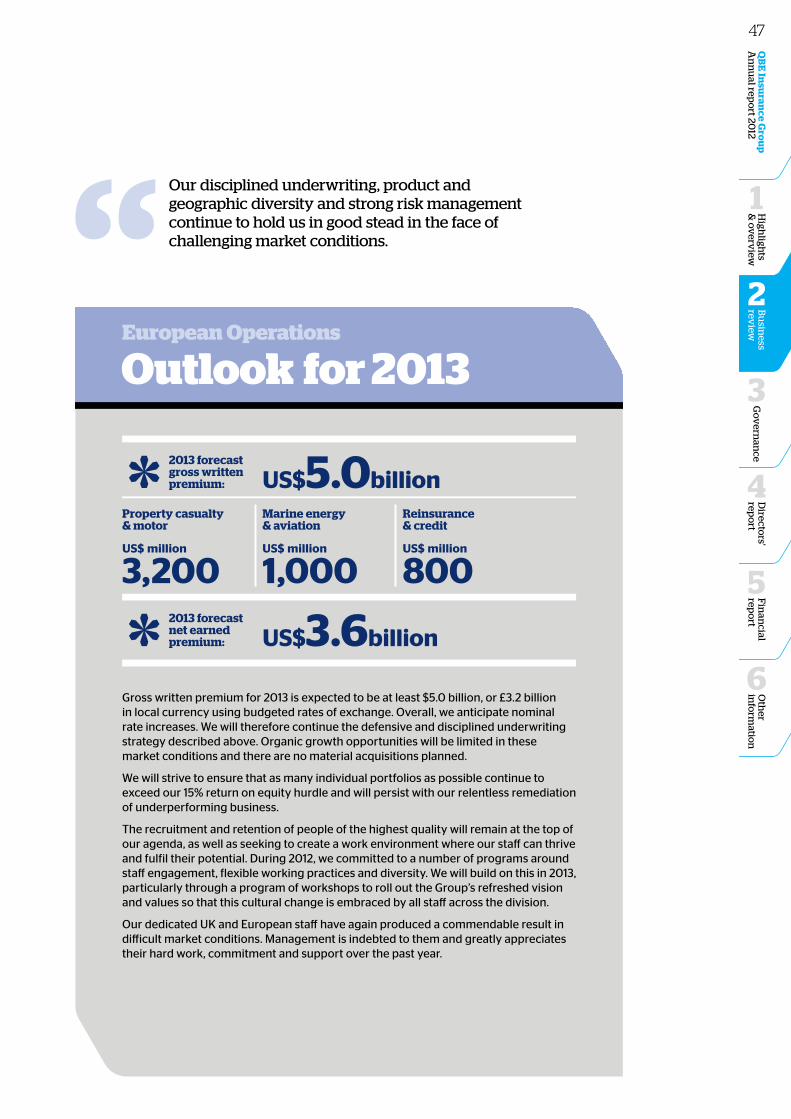
Oth
er in
form
ation
6
Fin
ancial
repo
rt
5
Go
vern
ance
3
Directo
rs' rep
ort
4
QB
E In
suran
ce Gro
up
A
nn
ual rep
ort 20
12B
usin
ess rev
iew
2
High
lights
& o
verv
iew
1
Gross written premium for 2013 is expected to be at least $5.0 billion, or £3.2 billion in local currency using budgeted rates of exchange. Overall, we anticipate nominal rate increases. We will therefore continue the defensive and disciplined underwriting strategy described above. Organic growth opportunities will be limited in these market conditions and there are no material acquisitions planned.
We will strive to ensure that as many individual portfolios as possible continue to exceed our 15% return on equity hurdle and will persist with our relentless remediation of underperforming business.
The recruitment and retention of people of the highest quality will remain at the top of our agenda, as well as seeking to create a work environment where our staff can thrive and fulfil their potential. During 2012, we committed to a number of programs around staff engagement, flexible working practices and diversity. We will build on this in 2013, particularly through a program of workshops to roll out the Group’s refreshed vision and values so that this cultural change is embraced by all staff across the division.
Our dedicated UK and European staff have again produced a commendable result in difficult market conditions. Management is indebted to them and greatly appreciates their hard work, commitment and support over the past year.
Outlook for 2013European Operations
Our disciplined underwriting, product and geographic diversity and strong risk management continue to hold us in good stead in the face of challenging market conditions.
2013 forecast gross written premium:
Property casualty & motor
Marine energy & aviation
Reinsurance & credit
US$ million
3,200US$ million
1,000US$ million
800
US$5.0billion
2013 forecast net earned premium: US$3.6billion
47

Australian & New Zealand Operations business review
Made possible by QBE:
Australian & New Zealand Operations
Formidable powerQBE is a major player in New Zealand's energy sector, insuring a number of top energy generators and suppliers.
These companies in turn supply hundreds of thousands of New Zealand businesses and domestic customers with their daily power needs. From traditional power generation to low fuel-cost hydro dams and geothermal power fields, QBE insures the power stations, dams and fields producing the power and the substations and transmission pipelines which deliver power into major industries, businesses and homes.
A resourceful partnerQBE is a major insurer of the mining sector in Australia, from leading global players to specialist service providers and smaller operations.
We insure more than 75 companies, ranging from coal miners in the Queensland Bowen Basin and New South Wales Hunter Valley to the iron ore mines of Western Australia’s Pilbara. QBE’s involvement in the mining sector includes industrial special risk, business interruption and liability insurance for mobile plant and equipment. This industry accounts for more than 6% of Australia’s GDP, contributing $121 billion a year including $35 billion in new capital investment.
48

Oth
er in
form
ation
6
Fin
ancial
repo
rt
5
Go
vern
ance
3
Directo
rs' rep
ort
4
QB
E In
suran
ce Gro
up
A
nn
ual rep
ort 20
12B
usin
ess rev
iew
2
High
lights
& o
verv
iew
1Play it safeQBE offers sports insurance designed to protect the members of sports clubs and associations if they are injured while participating in, training in or officiating at club activities.
We insure the whole Australian rugby union community, which covers more than 90,000 registered players from 770 clubs including the national team, the Wallabies. QBE provides the travel insurance for all of Australia’s representative rugby teams when they tour overseas. We also provide personal accident insurance to professional jockeys across Australia who, according to the Medical Journal of Australia, are members of one of the country’s most dangerous professions.
The sky is the limitQBE is Australia and New Zealand’s largest aviation insurer, providing a range of products, including hull and liability cover.
We have been involved with the aviation industry for more than 50 years and our team includes pilots, engineers and aircraft owners who have vast experience in underwriting, claims handling and providing value added service and safety support to the aviation industry.
A national iconQBE is proud to provide insurance to Surf Life Saving Australia (SLSA), the country's major water safety and rescue authority.
SLSA has more than 165,000 members and 500 affiliated surf life saving entities. QBE insures around 1,100 motor vehicles and 700 vessels on behalf of clubs nationwide. We also offer property, equipment and machinery breakdown and workers' compensation to SLSA.
Sydney SwansQBE has been the Principal Partner of the Sydney Swans for 27 years. Our commitment to the Swans reflects our business philosophy of creating and growing long-term, mutually rewarding partnerships. Recognised as one of the most enduring relationships in Australian sport, we’ve been behind the Swans through the highs and lows, providing support when required and celebrating fantastic achievements, including their successful 2012 AFL Premiership.
SuperyachtsQBE is a leader in underwriting specialist superyacht builders in New Zealand. The country’s superyacht sector is worth around $200 million annually, building 40-50 metre super-large sailing yachts and motor yachts, as well as 30 metre high-tech composite construction vessels. New Zealand is renowned for its engineering and construction of racing yachts.
StudiousQBE provides insurance to a range of education institutions, from primary and secondary schools to universities. We insure around 400 education institutions, catering for 500,000 students.
49
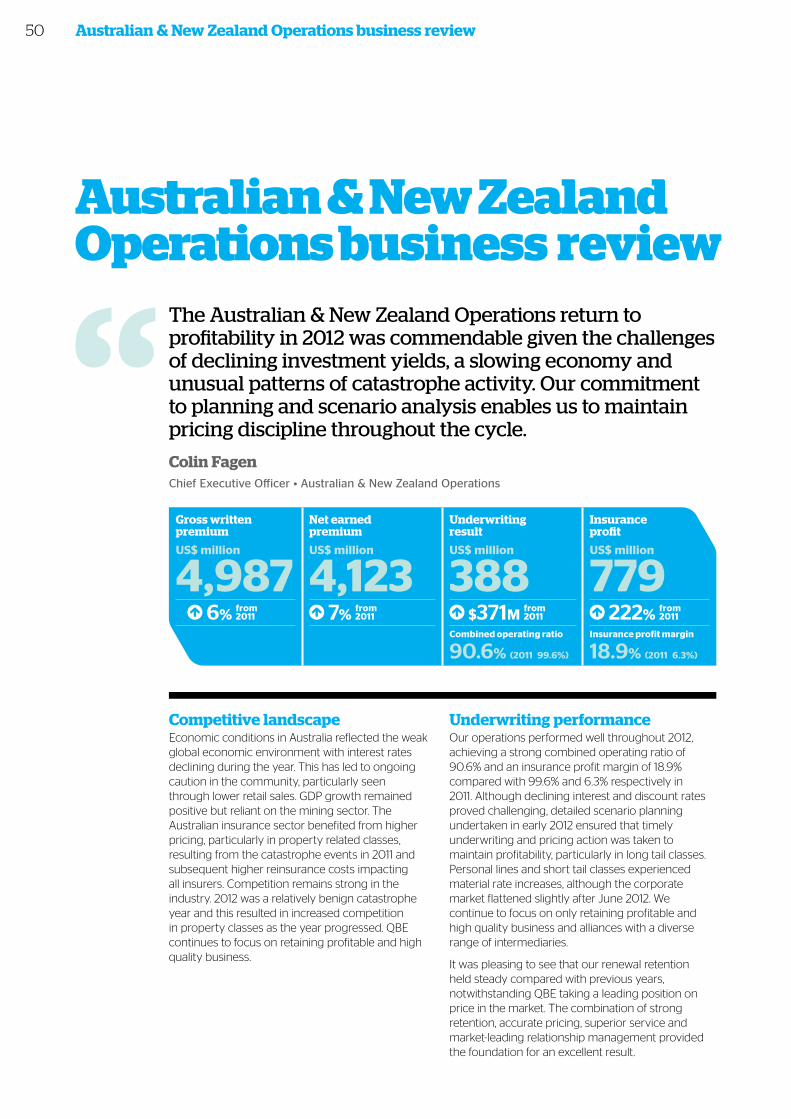
Competitive landscapeEconomic conditions in Australia reflected the weak global economic environment with interest rates declining during the year. This has led to ongoing caution in the community, particularly seen through lower retail sales. GDP growth remained positive but reliant on the mining sector. The Australian insurance sector benefited from higher pricing, particularly in property related classes, resulting from the catastrophe events in 2011 and subsequent higher reinsurance costs impacting all insurers. Competition remains strong in the industry. 2012 was a relatively benign catastrophe year and this resulted in increased competition in property classes as the year progressed. QBE continues to focus on retaining profitable and high quality business.
Underwriting performanceOur operations performed well throughout 2012, achieving a strong combined operating ratio of 90.6% and an insurance profit margin of 18.9% compared with 99.6% and 6.3% respectively in 2011. Although declining interest and discount rates proved challenging, detailed scenario planning undertaken in early 2012 ensured that timely underwriting and pricing action was taken to maintain profitability, particularly in long tail classes. Personal lines and short tail classes experienced material rate increases, although the corporate market flattened slightly after June 2012. We continue to focus on only retaining profitable and high quality business and alliances with a diverse range of intermediaries.
It was pleasing to see that our renewal retention held steady compared with previous years, notwithstanding QBE taking a leading position on price in the market. The combination of strong retention, accurate pricing, superior service and market-leading relationship management provided the foundation for an excellent result.
Australian & New Zealand Operations business review
Australian & New Zealand Operations business review
The Australian & New Zealand Operations return to profitability in 2012 was commendable given the challenges of declining investment yields, a slowing economy and unusual patterns of catastrophe activity. Our commitment to planning and scenario analysis enables us to maintain pricing discipline throughout the cycle.
Colin Fagen Chief Executive Officer • Australian & New Zealand Operations
Gross written premium
Net earned premium
Underwriting result
Insurance profit
US$ million
4,987US$ million
4,123US$ million
388US$ million
779 6% from
2011 7% from 2011 $371M from
2011
90.6% (2011 99.6%) 18.9% (2011 6.3%)
222% from 2011
Combined operating ratio Insurance profit margin
50
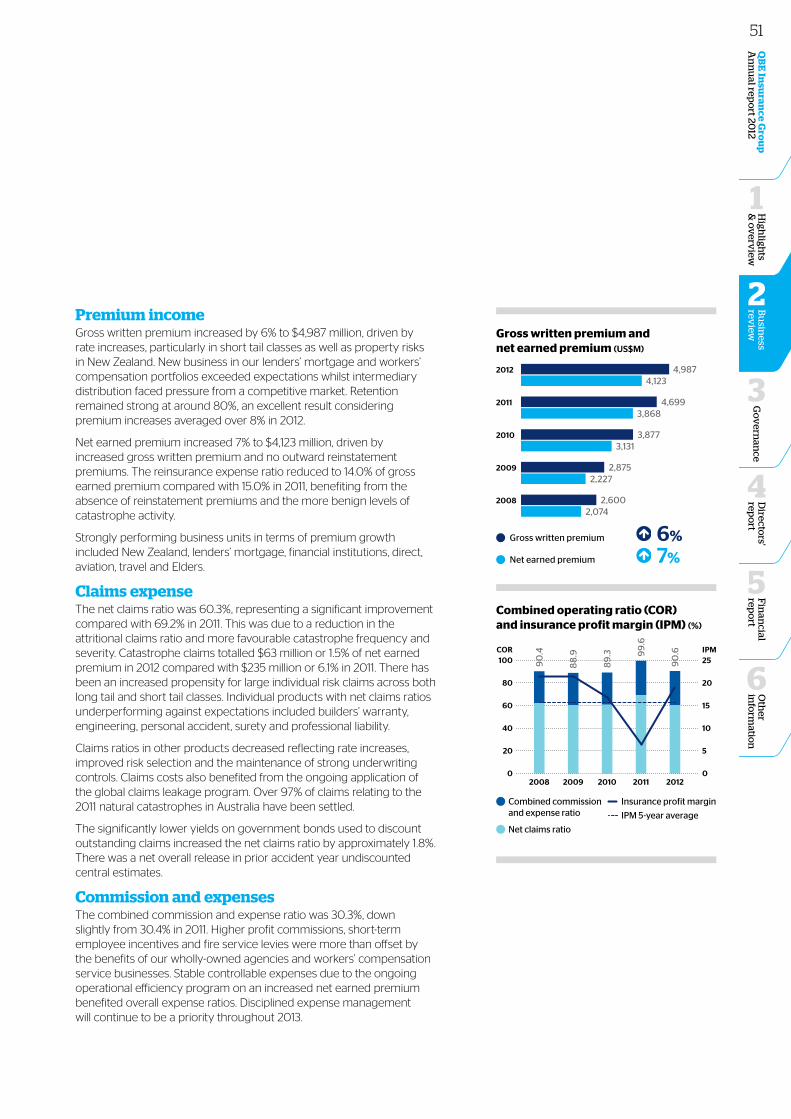
Premium incomeGross written premium increased by 6% to $4,987 million, driven by rate increases, particularly in short tail classes as well as property risks in New Zealand. New business in our lenders’ mortgage and workers’ compensation portfolios exceeded expectations whilst intermediary distribution faced pressure from a competitive market. Retention remained strong at around 80%, an excellent result considering premium increases averaged over 8% in 2012.
Net earned premium increased 7% to $4,123 million, driven by increased gross written premium and no outward reinstatement premiums. The reinsurance expense ratio reduced to 14.0% of gross earned premium compared with 15.0% in 2011, benefiting from the absence of reinstatement premiums and the more benign levels of catastrophe activity.
Strongly performing business units in terms of premium growth included New Zealand, lenders’ mortgage, financial institutions, direct, aviation, travel and Elders.
Claims expenseThe net claims ratio was 60.3%, representing a significant improvement compared with 69.2% in 2011. This was due to a reduction in the attritional claims ratio and more favourable catastrophe frequency and severity. Catastrophe claims totalled $63 million or 1.5% of net earned premium in 2012 compared with $235 million or 6.1% in 2011. There has been an increased propensity for large individual risk claims across both long tail and short tail classes. Individual products with net claims ratios underperforming against expectations included builders’ warranty, engineering, personal accident, surety and professional liability.
Claims ratios in other products decreased reflecting rate increases, improved risk selection and the maintenance of strong underwriting controls. Claims costs also benefited from the ongoing application of the global claims leakage program. Over 97% of claims relating to the 2011 natural catastrophes in Australia have been settled.
The significantly lower yields on government bonds used to discount outstanding claims increased the net claims ratio by approximately 1.8%. There was a net overall release in prior accident year undiscounted central estimates.
Commission and expensesThe combined commission and expense ratio was 30.3%, down slightly from 30.4% in 2011. Higher profit commissions, short-term employee incentives and fire service levies were more than offset by the benefits of our wholly-owned agencies and workers’ compensation service businesses. Stable controllable expenses due to the ongoing operational efficiency program on an increased net earned premium benefited overall expense ratios. Disciplined expense management will continue to be a priority throughout 2013.
Oth
er in
form
ation
6
Fin
ancial
repo
rt
5
Go
vern
ance
3
Directo
rs' rep
ort
4
QB
E In
suran
ce Gro
up
A
nn
ual rep
ort 20
12B
usin
ess rev
iew
2
High
lights
& o
verv
iew
1
Gross written premium and net earned premium (US$M)
4,9874,123
4,6993,868
3,8773,131
2,8752,227
2,6002,074
2012
2011
2010
2009
2008
Gross written premium 6%
Net earned premium 7%
Combined operating ratio (COR) and insurance profit margin (IPM) (%)
0
20
40
60
80
100
0
5
10
15
20
25
0
20
40
60
80
100Commission
Net claim
2008
90
.4
88
.9
89
.3 99
.6
90
.6
2008 2009 2010 2011 2012
COR IPM
Combined commission and expense ratio
Net claims ratio
Insurance profit margin
IPM 5-year average
51
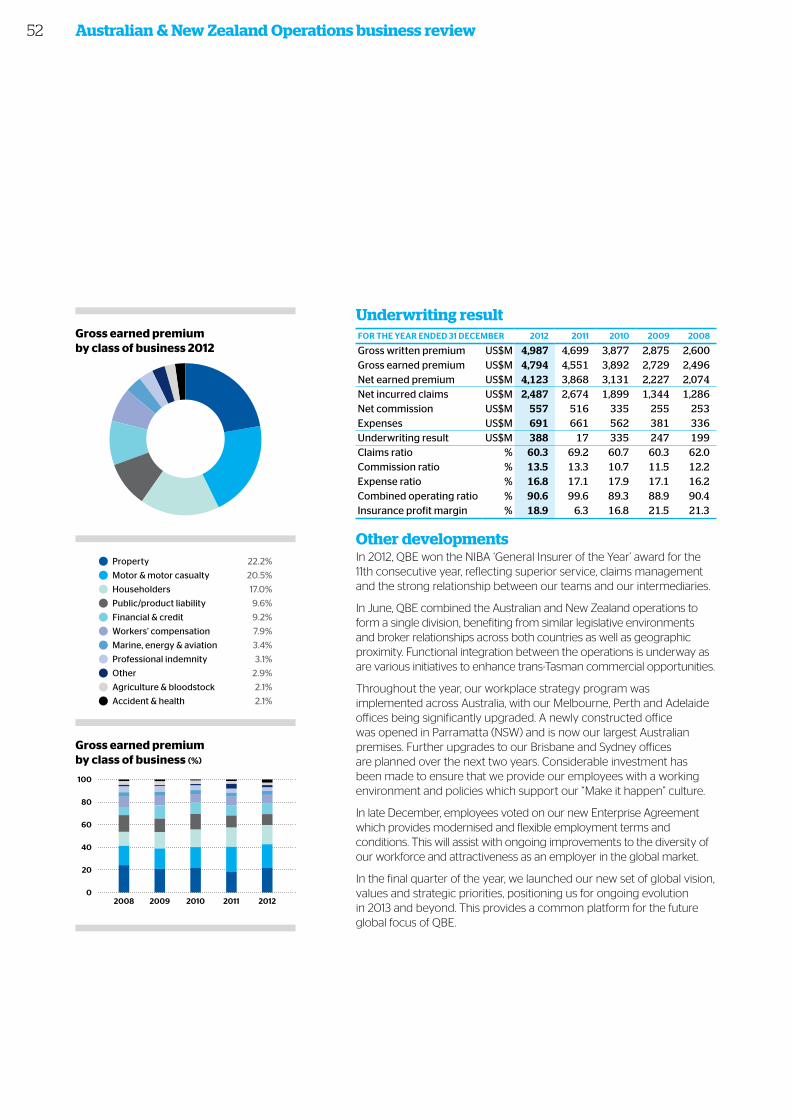
Underwriting resultFOR thE yEAR ENdEd 31 dECEmBER 2012 2011 2010 2009 2008
Gross written premium US$M 4,987 4,699 3,877 2,875 2,600Gross earned premium US$M 4,794 4,551 3,892 2,729 2,496Net earned premium US$M 4,123 3,868 3,131 2,227 2,074Net incurred claims US$M 2,487 2,674 1,899 1,344 1,286Net commission US$M 557 516 335 255 253Expenses US$M 691 661 562 381 336Underwriting result US$M 388 17 335 247 199Claims ratio % 60.3 69.2 60.7 60.3 62.0Commission ratio % 13.5 13.3 10.7 11.5 12.2Expense ratio % 16.8 17.1 17.9 17.1 16.2Combined operating ratio % 90.6 99.6 89.3 88.9 90.4Insurance profit margin % 18.9 6.3 16.8 21.5 21.3
Other developmentsIn 2012, QBE won the NIBA ‘General Insurer of the Year’ award for the 11th consecutive year, reflecting superior service, claims management and the strong relationship between our teams and our intermediaries.
In June, QBE combined the Australian and New Zealand operations to form a single division, benefiting from similar legislative environments and broker relationships across both countries as well as geographic proximity. Functional integration between the operations is underway as are various initiatives to enhance trans-Tasman commercial opportunities.
Throughout the year, our workplace strategy program was implemented across Australia, with our Melbourne, Perth and Adelaide offices being significantly upgraded. A newly constructed office was opened in Parramatta (NSW) and is now our largest Australian premises. Further upgrades to our Brisbane and Sydney offices are planned over the next two years. Considerable investment has been made to ensure that we provide our employees with a working environment and policies which support our “Make it happen” culture.
In late December, employees voted on our new Enterprise Agreement which provides modernised and flexible employment terms and conditions. This will assist with ongoing improvements to the diversity of our workforce and attractiveness as an employer in the global market.
In the final quarter of the year, we launched our new set of global vision, values and strategic priorities, positioning us for ongoing evolution in 2013 and beyond. This provides a common platform for the future global focus of QBE.
Australian & New Zealand Operations business review
Gross earned premium by class of business (%)
0
20
40
60
80
100
Other
Accident
Agri
Prof Indem
Marine
WC
Fin
Liability
Householders
Motor
Property
2008 2009 2010 2011 2012
Property
Motor and motor casualty
Agriculture and bloodstock
Public/product liability
Marine, energy and aviation
Workers’ compensation
Householders
Financial and credit
Professional indemnity
Accident and health
Other
Gross earned premium by class of business 2012 Accident
Agri
Other
Prof Indem
Marine
WC
Fin
Liability
Householders
Motor
Property
Property 22.2%
Motor & motor casualty 20.5%
Householders 17.0%
Public/product liability 9.6%
Financial & credit 9.2%
Workers’ compensation 7.9%
Marine, energy & aviation 3.4%
Professional indemnity 3.1%
Other 2.9%
Agriculture & bloodstock 2.1%
Accident & health 2.1%
52
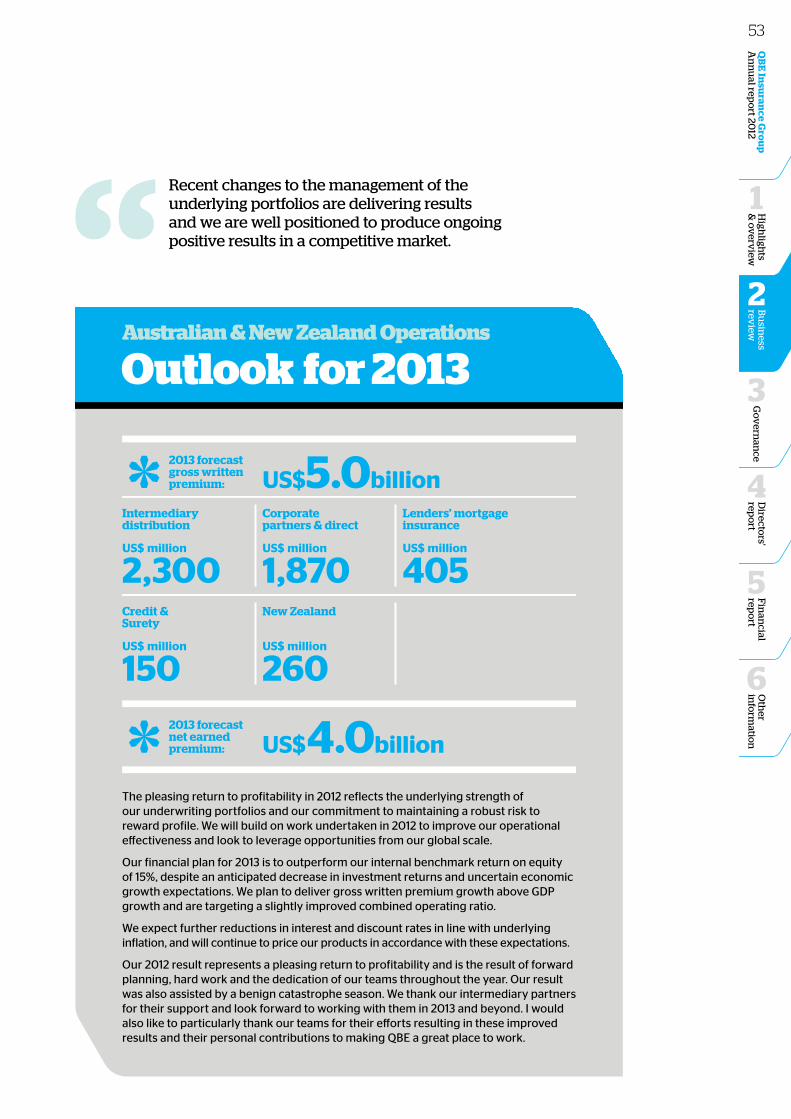
Oth
er in
form
ation
6
Fin
ancial
repo
rt
5
Go
vern
ance
3
Directo
rs' rep
ort
4
QB
E In
suran
ce Gro
up
A
nn
ual rep
ort 20
12B
usin
ess rev
iew
2
High
lights
& o
verv
iew
1
Outlook for 2013Australian & New Zealand Operations
The pleasing return to profitability in 2012 reflects the underlying strength of our underwriting portfolios and our commitment to maintaining a robust risk to reward profile. We will build on work undertaken in 2012 to improve our operational effectiveness and look to leverage opportunities from our global scale.
Our financial plan for 2013 is to outperform our internal benchmark return on equity of 15%, despite an anticipated decrease in investment returns and uncertain economic growth expectations. We plan to deliver gross written premium growth above GDP growth and are targeting a slightly improved combined operating ratio.
We expect further reductions in interest and discount rates in line with underlying inflation, and will continue to price our products in accordance with these expectations.
Our 2012 result represents a pleasing return to profitability and is the result of forward planning, hard work and the dedication of our teams throughout the year. Our result was also assisted by a benign catastrophe season. We thank our intermediary partners for their support and look forward to working with them in 2013 and beyond. I would also like to particularly thank our teams for their efforts resulting in these improved results and their personal contributions to making QBE a great place to work.
Recent changes to the management of the underlying portfolios are delivering results and we are well positioned to produce ongoing positive results in a competitive market.
2013 forecast gross written premium:
Intermediary distribution
Credit & Surety
Corporate partners & direct
New Zealand
Lenders' mortgage insurance
US$ million
2,300
US$ million
150
US$ million
1,870
US$ million
260
US$ million
405
US$5.0billion
2013 forecast net earned premium: US$4.0billion
53

Asia Pacific Operations business review
Star attractionsSome of Singapore’s most iconic attractions and events are insured by QBE.
QBE provides coverage to some of Singapore’s key tourist landmarks and pieces of infrastructure. We also insure several major sporting events in Singapore. Despite the slowdown in the global economy, tourism has been one of the city-state’s most successful industries in recent years. The number of international arrivals in Singapore grew 36% to a record 13.2 million in the two years to 2012.
All types of transport, on road and railQBE is one of the main insurers of transport in Hong Kong.
QBE provides project workers' compensation and public liability insurance to MTR, the operator of Hong Kong’s mass transit system which carries 5.3 million passengers each weekday. We have been the insurer of one of Hong Kong’s main bus companies, Citybus, for more than 10 years, insuring their fleet of around 1,000 buses. Up to one quarter of the registered motorcycles in Hong Kong are insured with QBE and we are a leading private car insurer in the territory.
Made possible by QBE:
Asia Pacific Operations
54

Oth
er in
form
ation
6
Fin
ancial
repo
rt
5
Go
vern
ance
3
Directo
rs' rep
ort
4
QB
E In
suran
ce Gro
up
A
nn
ual rep
ort 20
12B
usin
ess rev
iew
2
High
lights
& o
verv
iew
1
Indian trade routeQBE offers a range of specialty marine products through its Indian joint venture, Raheja QBE.
Raheja QBE offers port and terminal operators' liability and multimodal transit operators' liability insurance to some of the largest port and container terminal companies in India.
A city of lightsQBE plays a key role in helping to insure the backbone of the Macau economy – casinos.
Some of the territory’s main landmarks have industrial special risks insurance with QBE. We have also provided coverage to some of Macau's main construction projects.
Powering up AsiaQBE provides coverage to some of Southeast Asia’s major electricity providers.
We provide insurance to operators of gas-powered power plants throughout Southeast Asia. QBE also offers coverage to companies which generate solar, biomass and wind-generated electricity in the region. Renewable energy is expected to play an increasingly important role in the region where the demand for energy is expected to nearly double by 2030.
Vital connectionQBE insures one of the Philippines' main arterial roadways, the 84 kilometre North Luzon Expressway (NLEx). Operated by the Manila North Tollways Corporation, the NLEx upgrade was completed in 2005, making it one of the most modern toll roads in the region. The redevelopment of the NLEx is seen as a major element in the economic regeneration of the central and northern part of the Philippines’ most populous island, Luzon.
A healthy futureWe are the lead insurer of New Caledonia’s largest non-mining project – the Koutio multi-medical centre. The $400 million project, which is covered by a QBE construction all risks (CAR) and maintenance insurance contract, will include a medical research centre and New Caledonia's main hospital. QBE is also the lead CAR insurer of the project to upgrade New Caledonia’s main international airport.
LuxuryQBE insures all the merchandise and equipment for several luxury brand stores in Jakarta. We also provide property all risks insurance for a major shopping mall in the Indonesian capital.
55
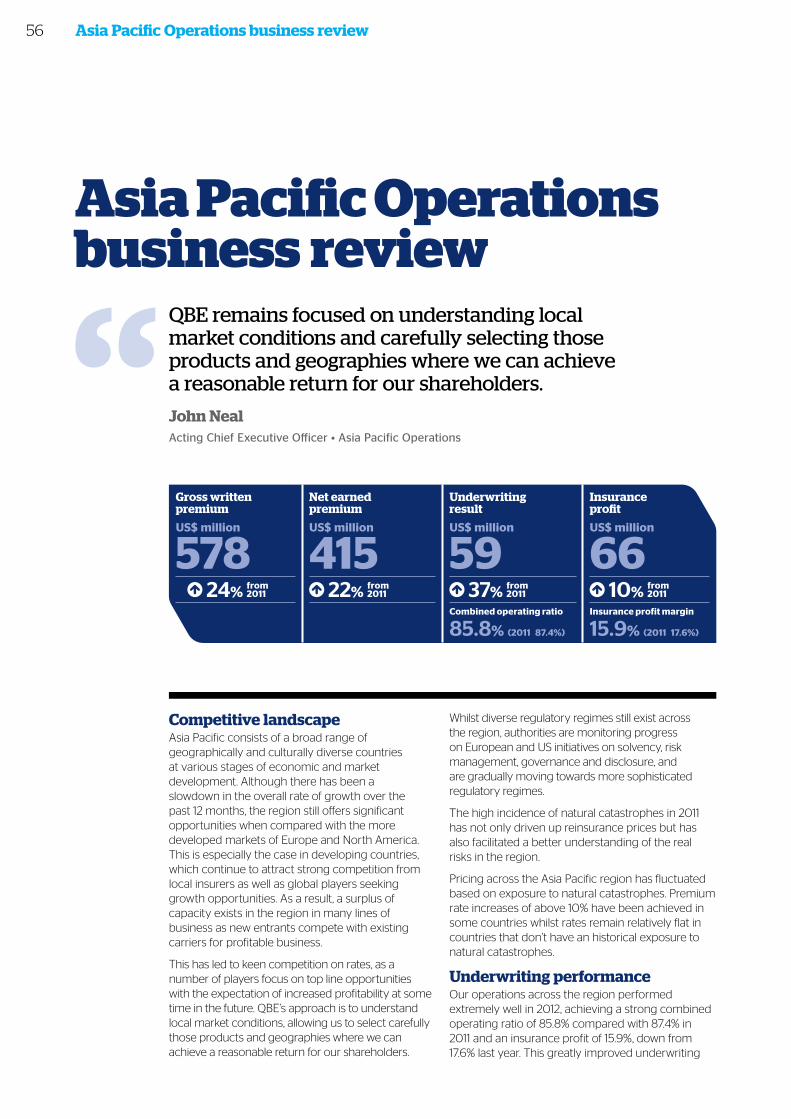
Competitive landscapeAsia Pacific consists of a broad range of geographically and culturally diverse countries at various stages of economic and market development. Although there has been a slowdown in the overall rate of growth over the past 12 months, the region still offers significant opportunities when compared with the more developed markets of Europe and North America. This is especially the case in developing countries, which continue to attract strong competition from local insurers as well as global players seeking growth opportunities. As a result, a surplus of capacity exists in the region in many lines of business as new entrants compete with existing carriers for profitable business.
This has led to keen competition on rates, as a number of players focus on top line opportunities with the expectation of increased profitability at some time in the future. QBE’s approach is to understand local market conditions, allowing us to select carefully those products and geographies where we can achieve a reasonable return for our shareholders.
Whilst diverse regulatory regimes still exist across the region, authorities are monitoring progress on European and US initiatives on solvency, risk management, governance and disclosure, and are gradually moving towards more sophisticated regulatory regimes.
The high incidence of natural catastrophes in 2011 has not only driven up reinsurance prices but has also facilitated a better understanding of the real risks in the region.
Pricing across the Asia Pacific region has fluctuated based on exposure to natural catastrophes. Premium rate increases of above 10% have been achieved in some countries whilst rates remain relatively flat in countries that don’t have an historical exposure to natural catastrophes.
Underwriting performanceOur operations across the region performed extremely well in 2012, achieving a strong combined operating ratio of 85.8% compared with 87.4% in 2011 and an insurance profit of 15.9%, down from 17.6% last year. This greatly improved underwriting
Asia Pacific Operations business review
Asia Pacific Operations business review
QBE remains focused on understanding local market conditions and carefully selecting those products and geographies where we can achieve a reasonable return for our shareholders.
John Neal Acting Chief Executive Officer • Asia Pacific Operations
Gross written premium
Net earned premium
Underwriting result
Insurance profit
US$ million
578US$ million
415US$ million
59US$ million
66 24% from
2011 22% from 2011 37% from
2011
85.8% (2011 87.4%) 15.9% (2011 17.6%)
10% from 2011
Combined operating ratio Insurance profit margin
56
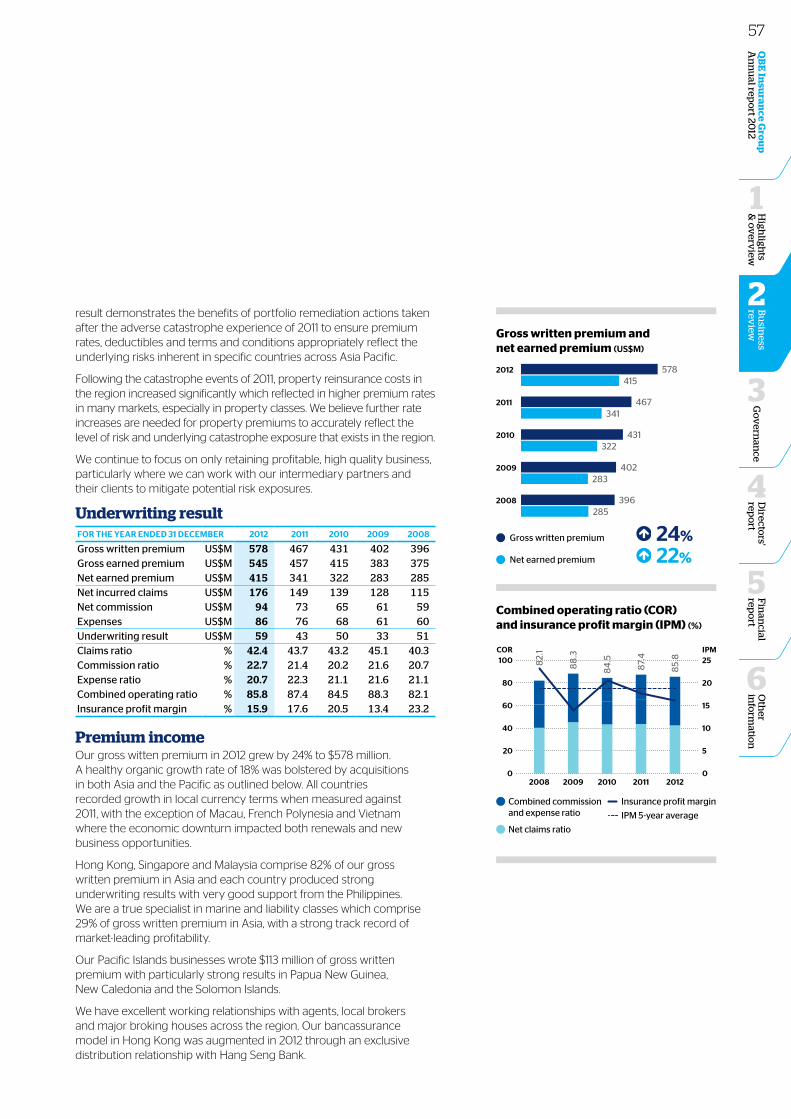
result demonstrates the benefits of portfolio remediation actions taken after the adverse catastrophe experience of 2011 to ensure premium rates, deductibles and terms and conditions appropriately reflect the underlying risks inherent in specific countries across Asia Pacific.
Following the catastrophe events of 2011, property reinsurance costs in the region increased significantly which reflected in higher premium rates in many markets, especially in property classes. We believe further rate increases are needed for property premiums to accurately reflect the level of risk and underlying catastrophe exposure that exists in the region.
We continue to focus on only retaining profitable, high quality business, particularly where we can work with our intermediary partners and their clients to mitigate potential risk exposures.
Underwriting resultFOR thE yEAR ENdEd 31 dECEmBER 2012 2011 2010 2009 2008
Gross written premium US$M 578 467 431 402 396Gross earned premium US$M 545 457 415 383 375Net earned premium US$M 415 341 322 283 285Net incurred claims US$M 176 149 139 128 115Net commission US$M 94 73 65 61 59Expenses US$M 86 76 68 61 60Underwriting result US$M 59 43 50 33 51Claims ratio % 42.4 43.7 43.2 45.1 40.3Commission ratio % 22.7 21.4 20.2 21.6 20.7Expense ratio % 20.7 22.3 21.1 21.6 21.1Combined operating ratio % 85.8 87.4 84.5 88.3 82.1Insurance profit margin % 15.9 17.6 20.5 13.4 23.2
Premium incomeOur gross witten premium in 2012 grew by 24% to $578 million. A healthy organic growth rate of 18% was bolstered by acquisitions in both Asia and the Pacific as outlined below. All countries recorded growth in local currency terms when measured against 2011, with the exception of Macau, French Polynesia and Vietnam where the economic downturn impacted both renewals and new business opportunities.
Hong Kong, Singapore and Malaysia comprise 82% of our gross written premium in Asia and each country produced strong underwriting results with very good support from the Philippines. We are a true specialist in marine and liability classes which comprise 29% of gross written premium in Asia, with a strong track record of market-leading profitability.
Our Pacific Islands businesses wrote $113 million of gross written premium with particularly strong results in Papua New Guinea, New Caledonia and the Solomon Islands.
We have excellent working relationships with agents, local brokers and major broking houses across the region. Our bancassurance model in Hong Kong was augmented in 2012 through an exclusive distribution relationship with Hang Seng Bank.
Oth
er in
form
ation
6
Fin
ancial
repo
rt
5
Go
vern
ance
3
Directo
rs' rep
ort
4
QB
E In
suran
ce Gro
up
A
nn
ual rep
ort 20
12B
usin
ess rev
iew
2
High
lights
& o
verv
iew
1
Gross written premium and net earned premium (US$M)
578415
467341
431322
402283
396285
2012
2011
2010
2009
2008
Gross written premium 24%
Net earned premium 22%
Combined operating ratio (COR) and insurance profit margin (IPM) (%)
0
20
40
60
80
100
0
5
10
15
20
2582.
1
88
.3
84
.5
87.
4
85.
8
2008 2009 2010 2011 2012
COR IPM
Combined commission and expense ratio
Net claims ratio
Insurance profit margin
IPM 5-year average
57
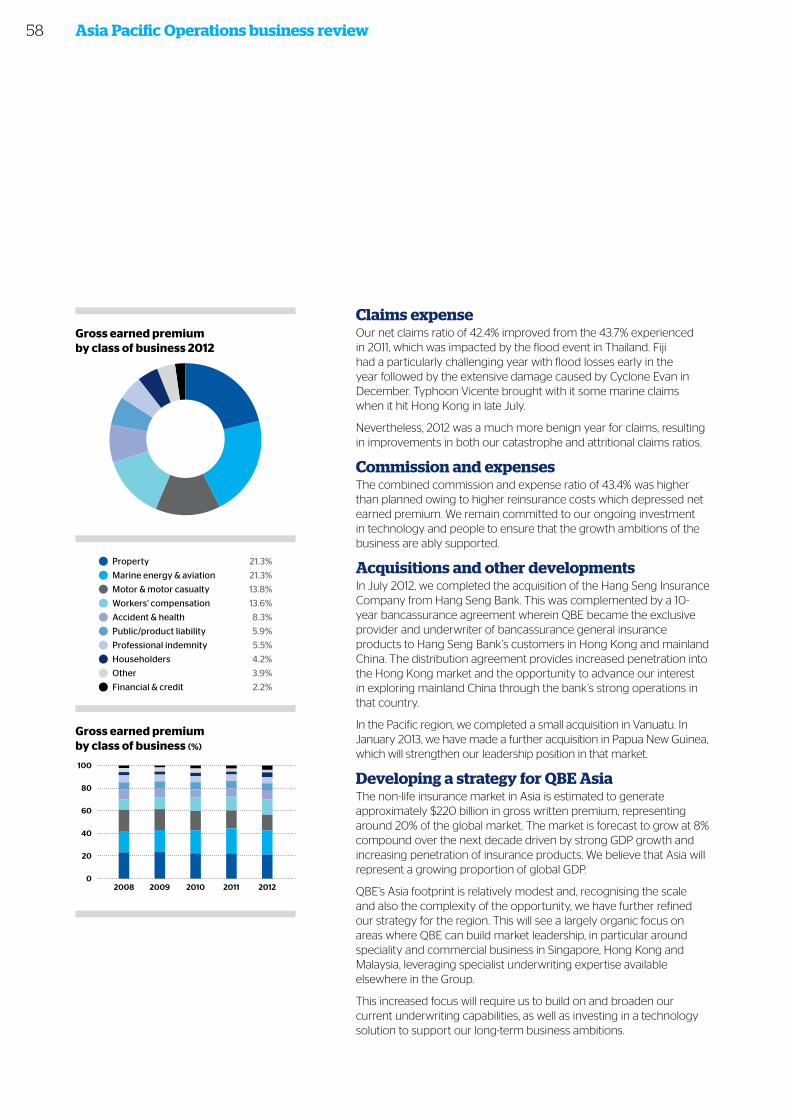
Claims expenseOur net claims ratio of 42.4% improved from the 43.7% experienced in 2011, which was impacted by the flood event in Thailand. Fiji had a particularly challenging year with flood losses early in the year followed by the extensive damage caused by Cyclone Evan in December. Typhoon Vicente brought with it some marine claims when it hit Hong Kong in late July.
Nevertheless, 2012 was a much more benign year for claims, resulting in improvements in both our catastrophe and attritional claims ratios.
Commission and expensesThe combined commission and expense ratio of 43.4% was higher than planned owing to higher reinsurance costs which depressed net earned premium. We remain committed to our ongoing investment in technology and people to ensure that the growth ambitions of the business are ably supported.
Acquisitions and other developmentsIn July 2012, we completed the acquisition of the Hang Seng Insurance Company from Hang Seng Bank. This was complemented by a 10-year bancassurance agreement wherein QBE became the exclusive provider and underwriter of bancassurance general insurance products to Hang Seng Bank’s customers in Hong Kong and mainland China. The distribution agreement provides increased penetration into the Hong Kong market and the opportunity to advance our interest in exploring mainland China through the bank’s strong operations in that country.
In the Pacific region, we completed a small acquisition in Vanuatu. In January 2013, we have made a further acquisition in Papua New Guinea, which will strengthen our leadership position in that market.
Developing a strategy for QBE Asia The non-life insurance market in Asia is estimated to generate approximately $220 billion in gross written premium, representing around 20% of the global market. The market is forecast to grow at 8% compound over the next decade driven by strong GDP growth and increasing penetration of insurance products. We believe that Asia will represent a growing proportion of global GDP.
QBE’s Asia footprint is relatively modest and, recognising the scale and also the complexity of the opportunity, we have further refined our strategy for the region. This will see a largely organic focus on areas where QBE can build market leadership, in particular around speciality and commercial business in Singapore, Hong Kong and Malaysia, leveraging specialist underwriting expertise available elsewhere in the Group.
This increased focus will require us to build on and broaden our current underwriting capabilities, as well as investing in a technology solution to support our long-term business ambitions.
Asia Pacific Operations business review
Gross earned premium by class of business (%)
0
20
40
60
80
100
Other
Fin
Householders
Prof Indem
Liability
Accident
WC
Motor
Marine
Property
2008 2009 2010 2011 2012
Property 21.3%
Marine, energy and aviation 21.3%
Motor and motor casualty 13.8%
Workers’ compensation 13.6%
Accident and health 8.3%
Public/product liability 5.9%
Professional indemnity 5.5%
Householders 4.2%
Financial and credit 2.2%
Other 3.9%
Gross earned premium by class of business 2012 Fin
Other
Householders
Prof Indem
Liability
Accident
WC
Motor
Marine
Property
Property 21.3%
Marine energy & aviation 21.3%
Motor & motor casualty 13.8%
Workers’ compensation 13.6%
Accident & health 8.3%
Public/product liability 5.9%
Professional indemnity 5.5%
Householders 4.2%
Other 3.9%
Financial & credit 2.2%
58
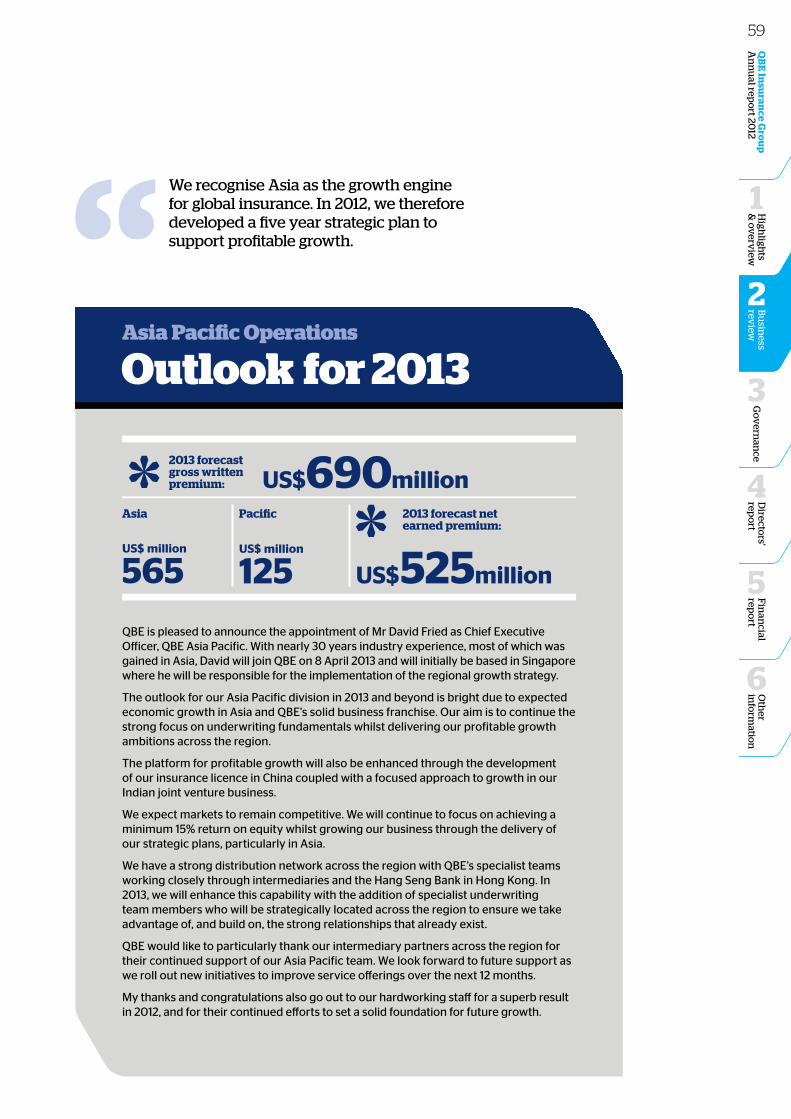
Oth
er in
form
ation
6
Fin
ancial
repo
rt
5
Go
vern
ance
3
Directo
rs' rep
ort
4
QB
E In
suran
ce Gro
up
A
nn
ual rep
ort 20
12B
usin
ess rev
iew
2
High
lights
& o
verv
iew
1
Outlook for 2013Asia Pacific Operations
QBE is pleased to announce the appointment of Mr David Fried as Chief Executive Officer, QBE Asia Pacific. With nearly 30 years industry experience, most of which was gained in Asia, David will join QBE on 8 April 2013 and will initially be based in Singapore where he will be responsible for the implementation of the regional growth strategy.
The outlook for our Asia Pacific division in 2013 and beyond is bright due to expected economic growth in Asia and QBE’s solid business franchise. Our aim is to continue the strong focus on underwriting fundamentals whilst delivering our profitable growth ambitions across the region.
The platform for profitable growth will also be enhanced through the development of our insurance licence in China coupled with a focused approach to growth in our Indian joint venture business.
We expect markets to remain competitive. We will continue to focus on achieving a minimum 15% return on equity whilst growing our business through the delivery of our strategic plans, particularly in Asia.
We have a strong distribution network across the region with QBE’s specialist teams working closely through intermediaries and the Hang Seng Bank in Hong Kong. In 2013, we will enhance this capability with the addition of specialist underwriting team members who will be strategically located across the region to ensure we take advantage of, and build on, the strong relationships that already exist.
QBE would like to particularly thank our intermediary partners across the region for their continued support of our Asia Pacific team. We look forward to future support as we roll out new initiatives to improve service offerings over the next 12 months.
My thanks and congratulations also go out to our hardworking staff for a superb result in 2012, and for their continued efforts to set a solid foundation for future growth.
We recognise Asia as the growth engine for global insurance. In 2012, we therefore developed a five year strategic plan to support profitable growth.
2013 forecast gross written premium:
Asia Pacific
US$ million
565US$ million
125
US$690million2013 forecast net earned premium:
US$525million
59
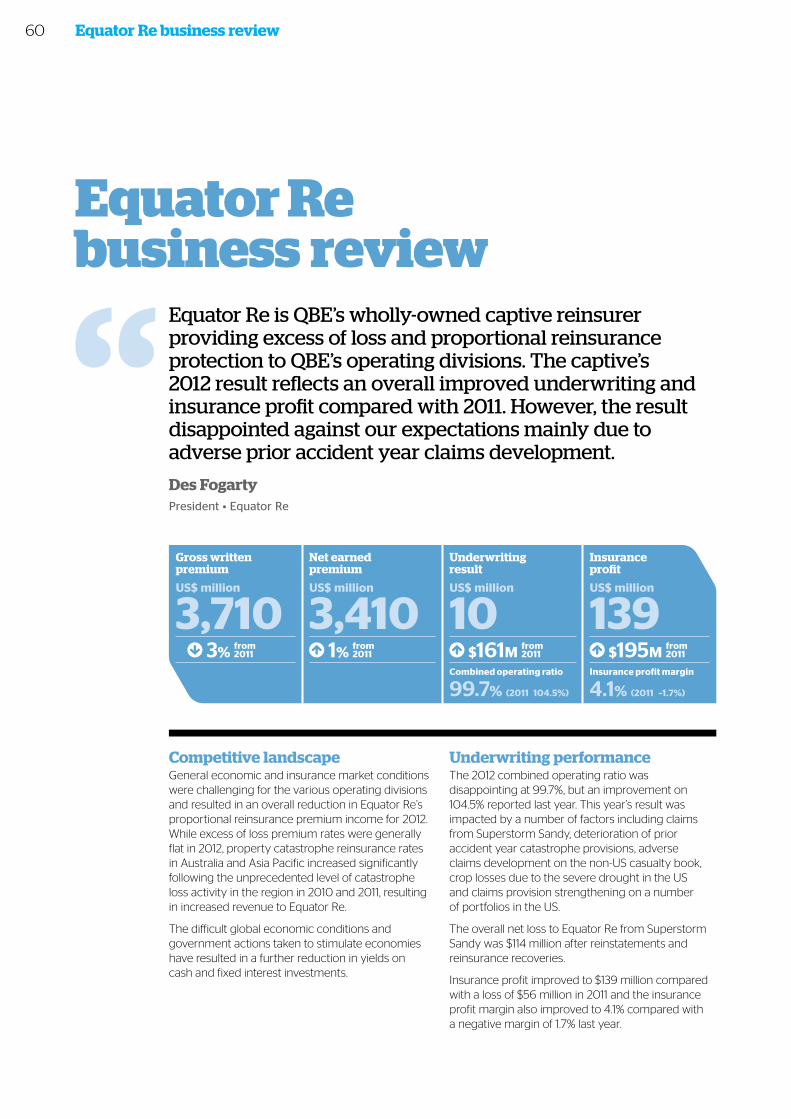
Competitive landscapeGeneral economic and insurance market conditions were challenging for the various operating divisions and resulted in an overall reduction in Equator Re’s proportional reinsurance premium income for 2012. While excess of loss premium rates were generally flat in 2012, property catastrophe reinsurance rates in Australia and Asia Pacific increased significantly following the unprecedented level of catastrophe loss activity in the region in 2010 and 2011, resulting in increased revenue to Equator Re.
The difficult global economic conditions and government actions taken to stimulate economies have resulted in a further reduction in yields on cash and fixed interest investments.
Underwriting performanceThe 2012 combined operating ratio was disappointing at 99.7%, but an improvement on 104.5% reported last year. This year’s result was impacted by a number of factors including claims from Superstorm Sandy, deterioration of prior accident year catastrophe provisions, adverse claims development on the non-US casualty book, crop losses due to the severe drought in the US and claims provision strengthening on a number of portfolios in the US.
The overall net loss to Equator Re from Superstorm Sandy was $114 million after reinstatements and reinsurance recoveries.
Insurance profit improved to $139 million compared with a loss of $56 million in 2011 and the insurance profit margin also improved to 4.1% compared with a negative margin of 1.7% last year.
Equator Re business review
Equator Re business review
Equator Re is QBE’s wholly-owned captive reinsurer providing excess of loss and proportional reinsurance protection to QBE’s operating divisions. The captive’s 2012 result reflects an overall improved underwriting and insurance profit compared with 2011. However, the result disappointed against our expectations mainly due to adverse prior accident year claims development.
Des Fogarty President • Equator Re
Gross written premium
Net earned premium
Underwriting result
Insurance profit
US$ million
3,710US$ million
3,410US$ million
10US$ million
139 3% from
2011 1% from 2011 $161M from
2011
99.7% (2011 104.5%) 4.1% (2011 –1.7%)
$195M from 2011
Combined operating ratio Insurance profit margin
60
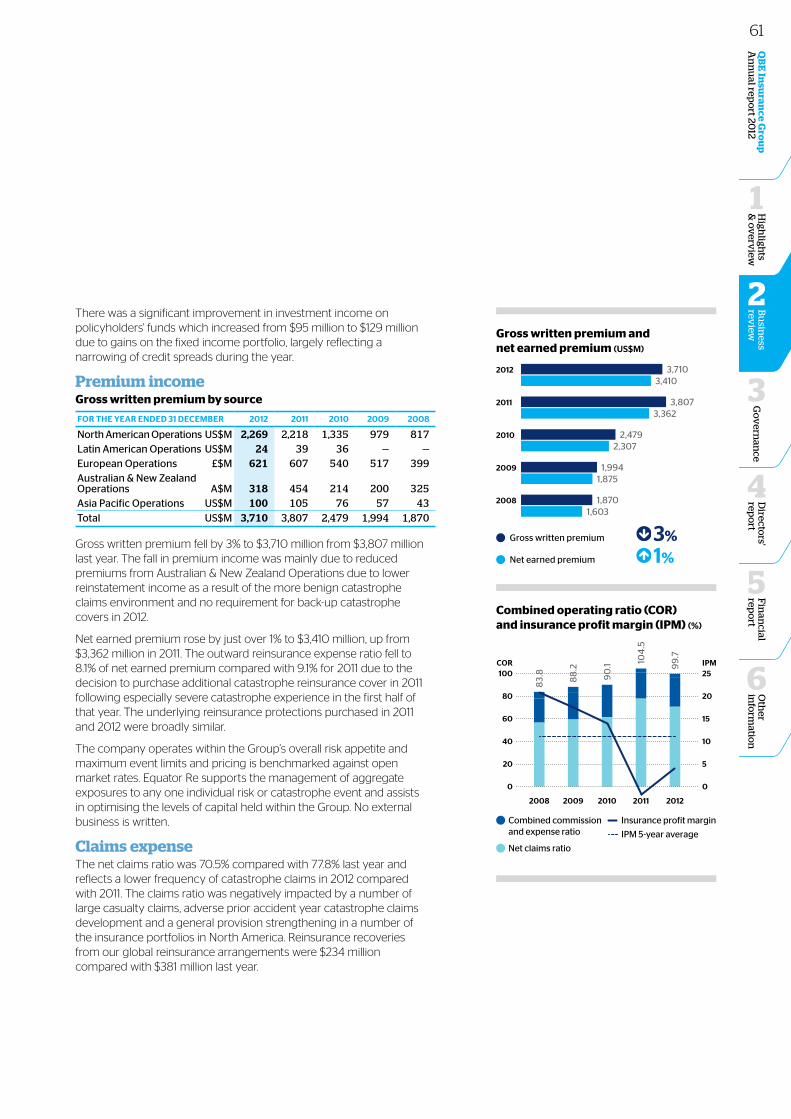
There was a significant improvement in investment income on policyholders' funds which increased from $95 million to $129 million due to gains on the fixed income portfolio, largely reflecting a narrowing of credit spreads during the year.
Premium incomeGross written premium by source
FOR thE yEAR ENdEd 31 dECEmBER 2012 2011 2010 2009 2008
North American Operations US$M 2,269 2,218 1,335 979 817Latin American Operations US$M 24 39 36 — —European Operations £$M 621 607 540 517 399Australian & New Zealand Operations A$M 318 454 214 200 325Asia Pacific Operations US$M 100 105 76 57 43Total US$M 3,710 3,807 2,479 1,994 1,870
Gross written premium fell by 3% to $3,710 million from $3,807 million last year. The fall in premium income was mainly due to reduced premiums from Australian & New Zealand Operations due to lower reinstatement income as a result of the more benign catastrophe claims environment and no requirement for back-up catastrophe covers in 2012.
Net earned premium rose by just over 1% to $3,410 million, up from $3,362 million in 2011. The outward reinsurance expense ratio fell to 8.1% of net earned premium compared with 9.1% for 2011 due to the decision to purchase additional catastrophe reinsurance cover in 2011 following especially severe catastrophe experience in the first half of that year. The underlying reinsurance protections purchased in 2011 and 2012 were broadly similar.
The company operates within the Group’s overall risk appetite and maximum event limits and pricing is benchmarked against open market rates. Equator Re supports the management of aggregate exposures to any one individual risk or catastrophe event and assists in optimising the levels of capital held within the Group. No external business is written.
Claims expenseThe net claims ratio was 70.5% compared with 77.8% last year and reflects a lower frequency of catastrophe claims in 2012 compared with 2011. The claims ratio was negatively impacted by a number of large casualty claims, adverse prior accident year catastrophe claims development and a general provision strengthening in a number of the insurance portfolios in North America. Reinsurance recoveries from our global reinsurance arrangements were $234 million compared with $381 million last year.
Oth
er in
form
ation
6
Fin
ancial
repo
rt
5
Go
vern
ance
3
Directo
rs' rep
ort
4
QB
E In
suran
ce Gro
up
A
nn
ual rep
ort 20
12B
usin
ess rev
iew
2
High
lights
& o
verv
iew
1
Gross written premium and net earned premium (US$M)
3,7103,410
3,8073,362
2,4792,307
1,9941,875
1,8701,603
2012
2011
2010
2009
2008
Gross written premium
Net earned premium
3%
1%
Combined operating ratio (COR) and insurance profit margin (IPM) (%)
0
20
40
60
80
100
0
5
10
15
20
25
83.
8
88
.2
90
.1 104
.5
99
.7
2008 2009 2010 2011 2012
COR IPM
Combined commission and expense ratio
Net claims ratio
Insurance profit margin
IPM 5-year average
61
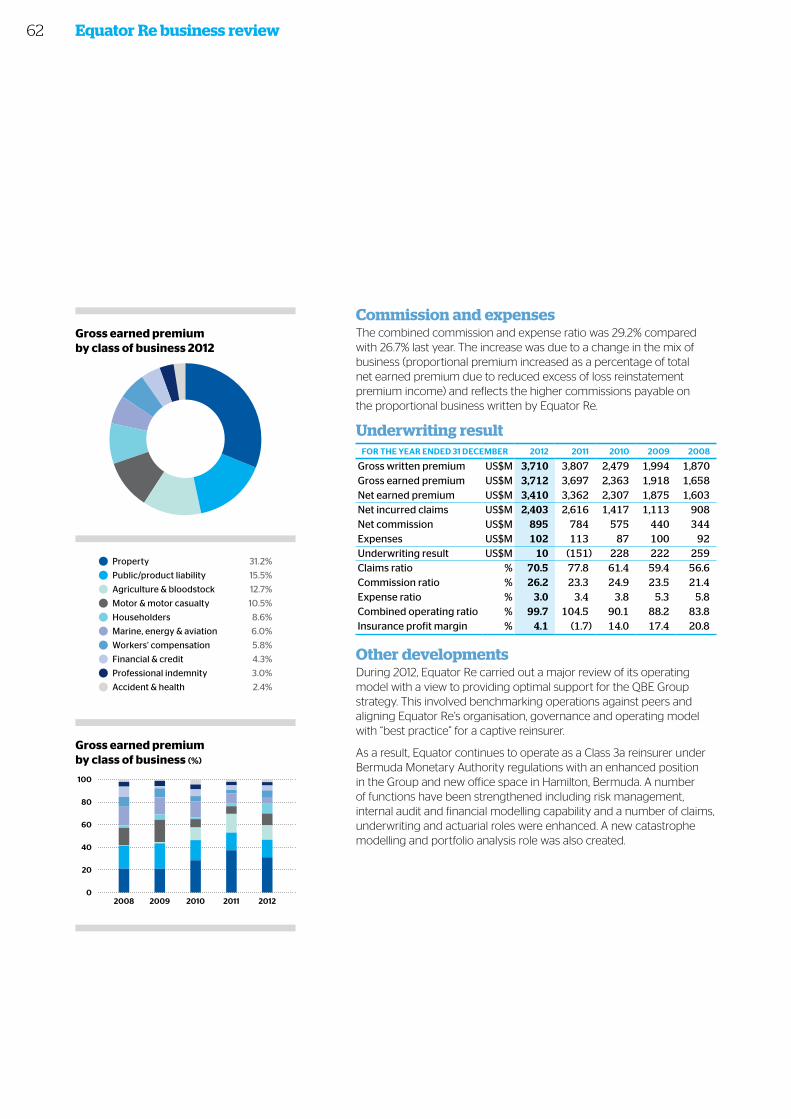
Commission and expensesThe combined commission and expense ratio was 29.2% compared with 26.7% last year. The increase was due to a change in the mix of business (proportional premium increased as a percentage of total net earned premium due to reduced excess of loss reinstatement premium income) and reflects the higher commissions payable on the proportional business written by Equator Re.
Underwriting resultFOR thE yEAR ENdEd 31 dECEmBER 2012 2011 2010 2009 2008
Gross written premium US$M 3,710 3,807 2,479 1,994 1,870Gross earned premium US$M 3,712 3,697 2,363 1,918 1,658Net earned premium US$M 3,410 3,362 2,307 1,875 1,603Net incurred claims US$M 2,403 2,616 1,417 1,113 908Net commission US$M 895 784 575 440 344Expenses US$M 102 113 87 100 92Underwriting result US$M 10 (151) 228 222 259Claims ratio % 70.5 77.8 61.4 59.4 56.6Commission ratio % 26.2 23.3 24.9 23.5 21.4Expense ratio % 3.0 3.4 3.8 5.3 5.8Combined operating ratio % 99.7 104.5 90.1 88.2 83.8Insurance profit margin % 4.1 (1.7) 14.0 17.4 20.8
Other developmentsDuring 2012, Equator Re carried out a major review of its operating model with a view to providing optimal support for the QBE Group strategy. This involved benchmarking operations against peers and aligning Equator Re’s organisation, governance and operating model with “best practice” for a captive reinsurer.
As a result, Equator continues to operate as a Class 3a reinsurer under Bermuda Monetary Authority regulations with an enhanced position in the Group and new office space in Hamilton, Bermuda. A number of functions have been strengthened including risk management, internal audit and financial modelling capability and a number of claims, underwriting and actuarial roles were enhanced. A new catastrophe modelling and portfolio analysis role was also created.
Equator Re business review
Gross earned premium by class of business (%)
0
20
40
60
80
100
Accident
Prof Indem
Fin
WC
Marine
Householders
Motor
Agri
Liability
Property
2008 2009 2010 2011 2012
Property 31.2%
Public/product liability 15.5%
Agriculture and bloodstock 12.7%
Motor and motor casualty 10.5%
Householders 8.6%
Marine, energy and aviation 6.0%
Workers’ compensation 5.8%
Financial and credit 4.3%
Professional indemnity 3.0%
Accident and health 2.4%
Gross earned premium by class of business 2012 Accident
Prof Indem
Fin
WC
Marine
Householders
Motor
Agri
Liability
Property
Property 31.2%
Public/product liability 15.5%
Agriculture & bloodstock 12.7%
Motor & motor casualty 10.5%
Householders 8.6%
Marine, energy & aviation 6.0%
Workers’ compensation 5.8%
Financial & credit 4.3%
Professional indemnity 3.0%
Accident & health 2.4%
62
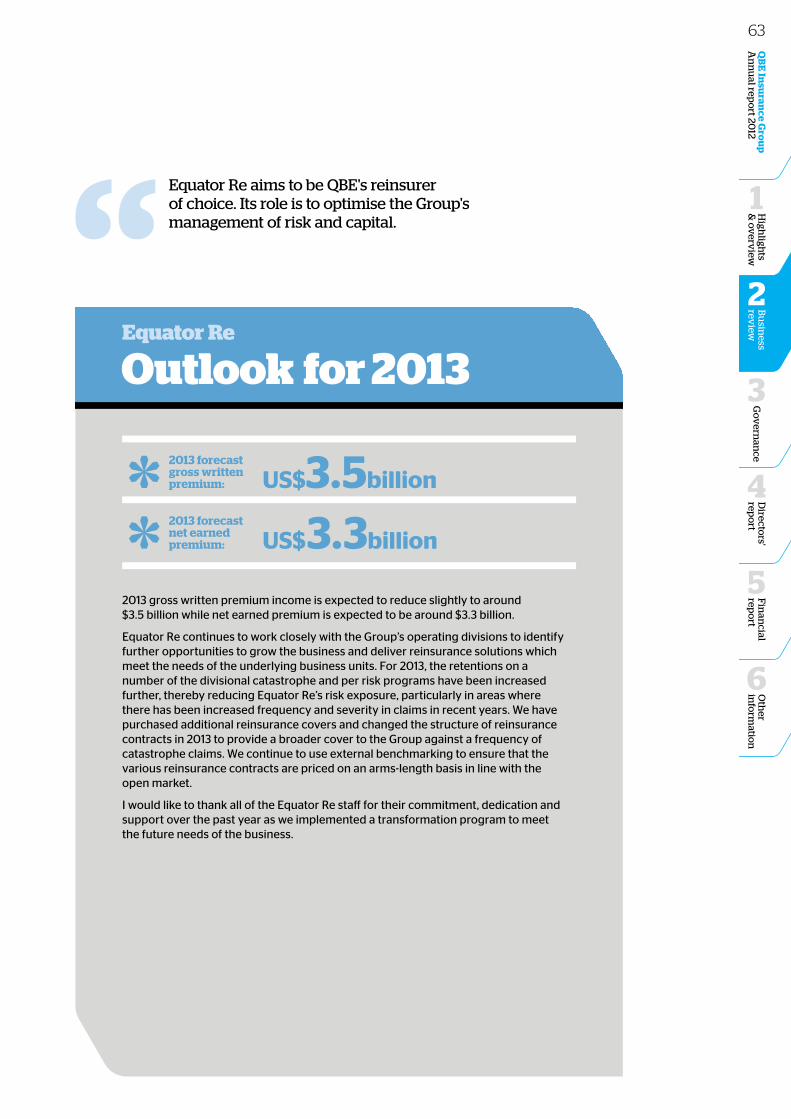
Oth
er in
form
ation
6
Fin
ancial
repo
rt
5
Go
vern
ance
3
Directo
rs' rep
ort
4
QB
E In
suran
ce Gro
up
A
nn
ual rep
ort 20
12B
usin
ess rev
iew
2
High
lights
& o
verv
iew
1
Outlook for 2013Equator Re
2013 gross written premium income is expected to reduce slightly to around $3.5 billion while net earned premium is expected to be around $3.3 billion.
Equator Re continues to work closely with the Group’s operating divisions to identify further opportunities to grow the business and deliver reinsurance solutions which meet the needs of the underlying business units. For 2013, the retentions on a number of the divisional catastrophe and per risk programs have been increased further, thereby reducing Equator Re’s risk exposure, particularly in areas where there has been increased frequency and severity in claims in recent years. We have purchased additional reinsurance covers and changed the structure of reinsurance contracts in 2013 to provide a broader cover to the Group against a frequency of catastrophe claims. We continue to use external benchmarking to ensure that the various reinsurance contracts are priced on an arms-length basis in line with the open market.
I would like to thank all of the Equator Re staff for their commitment, dedication and support over the past year as we implemented a transformation program to meet the future needs of the business.
Equator Re aims to be QBE's reinsurer of choice. Its role is to optimise the Group's management of risk and capital.
2013 forecast gross written premium: US$3.5billion
2013 forecast net earned premium: US$3.3billion
63
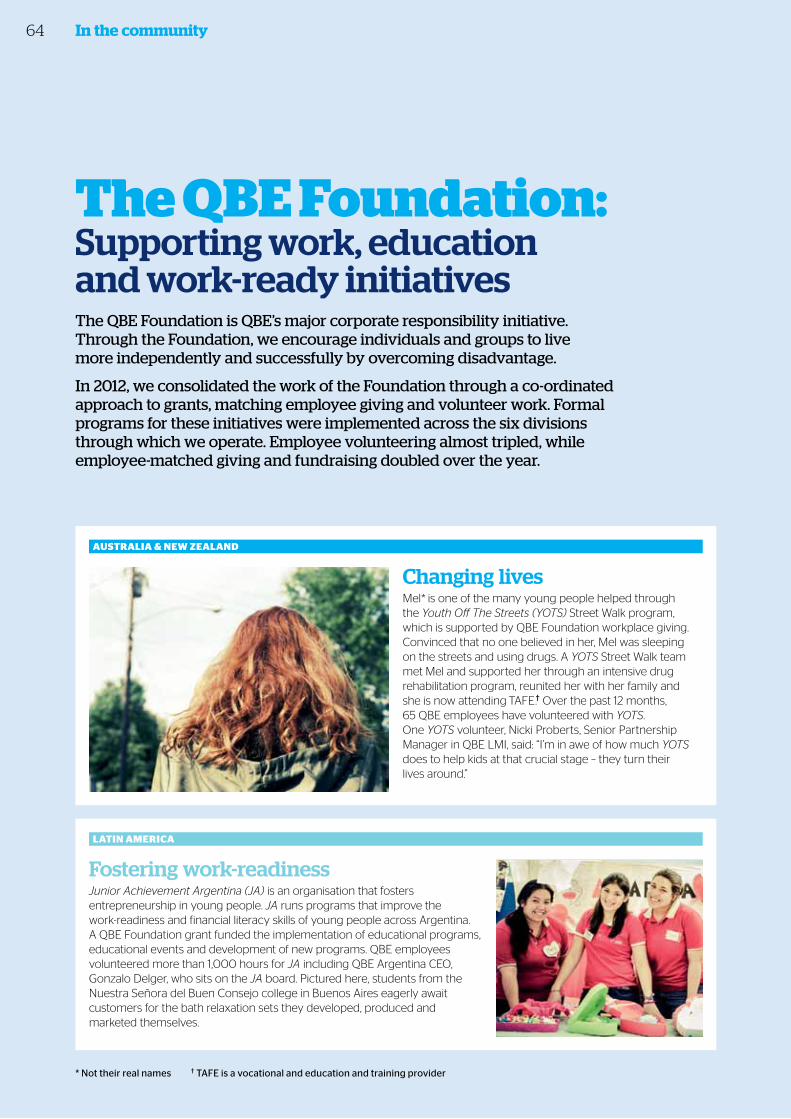
In the community
Changing livesMel* is one of the many young people helped through the Youth Off The Streets (YOTS) Street Walk program, which is supported by QBE Foundation workplace giving. Convinced that no one believed in her, Mel was sleeping on the streets and using drugs. A YOTS Street Walk team met Mel and supported her through an intensive drug rehabilitation program, reunited her with her family and she is now attending TAFE.† Over the past 12 months, 65 QBE employees have volunteered with YOTS. One YOTS volunteer, Nicki Proberts, Senior Partnership Manager in QBE LMI, said: “I’m in awe of how much YOTS does to help kids at that crucial stage – they turn their lives around.”
* Not their real names † TAFE is a vocational and education and training provider
Fostering work-readiness Junior Achievement Argentina (JA) is an organisation that fosters entrepreneurship in young people. JA runs programs that improve the work-readiness and financial literacy skills of young people across Argentina. A QBE Foundation grant funded the implementation of educational programs, educational events and development of new programs. QBE employees volunteered more than 1,000 hours for JA including QBE Argentina CEO, Gonzalo Delger, who sits on the JA board. Pictured here, students from the Nuestra Señora del Buen Consejo college in Buenos Aires eagerly await customers for the bath relaxation sets they developed, produced and marketed themselves.
The QBE Foundation: Supporting work, education and work-ready initiativesThe QBE Foundation is QBE’s major corporate responsibility initiative. Through the Foundation, we encourage individuals and groups to live more independently and successfully by overcoming disadvantage.
In 2012, we consolidated the work of the Foundation through a co-ordinated approach to grants, matching employee giving and volunteer work. Formal programs for these initiatives were implemented across the six divisions through which we operate. Employee volunteering almost tripled, while employee-matched giving and fundraising doubled over the year.
AustrAliA & New ZeAlANd
lAtiN AmericA
64
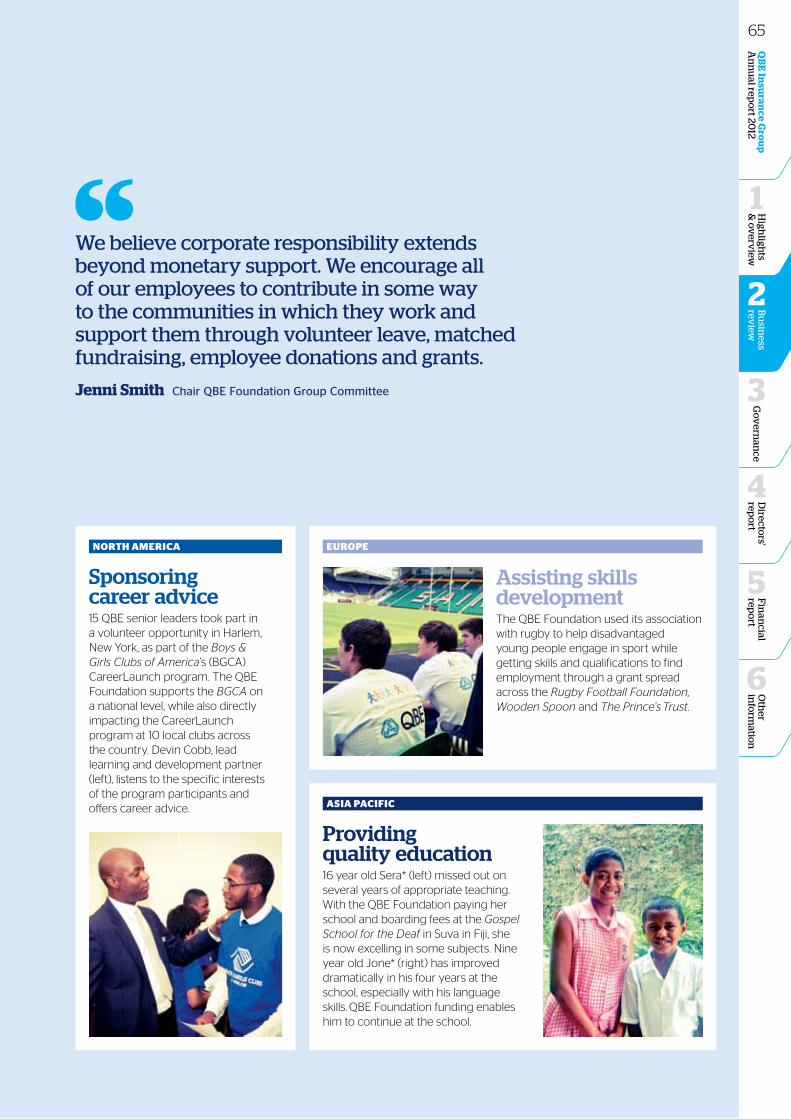
Oth
er in
form
ation
6
Fin
ancial
repo
rt
5
Go
vern
ance
3
Directo
rs' rep
ort
4
QB
E In
suran
ce Gro
up
A
nn
ual rep
ort 20
12B
usin
ess rev
iew
2
High
lights
& o
verv
iew
1We believe corporate responsibility extends beyond monetary support. We encourage all of our employees to contribute in some way to the communities in which they work and support them through volunteer leave, matched fundraising, employee donations and grants.
Jenni Smith Chair QBE Foundation Group Committee
Providing quality education 16 year old Sera* (left) missed out on several years of appropriate teaching. With the QBE Foundation paying her school and boarding fees at the Gospel School for the Deaf in Suva in Fiji, she is now excelling in some subjects. Nine year old Jone* (right) has improved dramatically in his four years at the school, especially with his language skills. QBE Foundation funding enables him to continue at the school.
Sponsoring career advice15 QBE senior leaders took part in a volunteer opportunity in Harlem, New York, as part of the Boys & Girls Clubs of America’s (BGCA) CareerLaunch program. The QBE Foundation supports the BGCA on a national level, while also directly impacting the CareerLaunch program at 10 local clubs across the country. Devin Cobb, lead learning and development partner (left), listens to the specific interests of the program participants and offers career advice.
Assisting skills developmentThe QBE Foundation used its association with rugby to help disadvantaged young people engage in sport while getting skills and qualifications to find employment through a grant spread across the Rugby Football Foundation, Wooden Spoon and The Prince’s Trust.
AsiA PAcific
North AmericA euroPe
65
Group Chief Risk Officer’s report
QBE seeks to only take on risks that fall within the Group’s stated risk appetite and aims to manage them in a way to achieve an optimal return overall. The Group’s risk management framework is designed to support this approach and enhance decision making by our people. A strong approach to risk management informs our decision making and enables us to measure and judge our risk exposures. Ultimately, this gives us greater confidence and expands our capacity to take on risks to improve our returns.
Our risk management framework aims to ensure that decisions across all categories of risk are conscious and transparent across the Group. The framework seeks to provide a support network to ensure our employees' decisions are in the best interests of all QBE stakeholders.
Risk management involves good governance and ensuring that the decisions QBE makes are founded on solid risk assessment. This means clearly identifying the different
types of risks and assessing them against clear appetites and tolerances for each type of risk.
Following a record level of catastrophes in 2011, 2012 saw a much lower level of catastrophe claims. QBE experienced some deterioration in estimates of 2011 catastrophe claims, primarily related to the devastating Christchurch earthquakes and Thai floods. Multiple seismic events and changes in building codes and associated costs have made estimation difficult for Christchurch and the widespread impact and last quarter timing of the Thailand floods resulted in some late reporting of claims. The largest 2012 year claims came from the crop business in the US caused by the worst drought in decades and Superstorm Sandy on the US East Coast during the fourth quarter.
The underwriting risk management in place in QBE’s crop business, combined with reinsurance designed to cap underwriting losses at just below break even, operated
Risk:Our businessQBE is in the business of managing risk. Our ability to satisfy our customers’ risk management needs is at the heart of what we do. We aim to generate wealth and maximise returns for our shareholders by pursuing opportunities that involve risk. Our people have the responsibility to ensure that the key risks are managed and controlled on a day-to-day basis. We aim to use our ability to properly manage risk to provide more certainty and improved outcomes for all of our stakeholders.
66
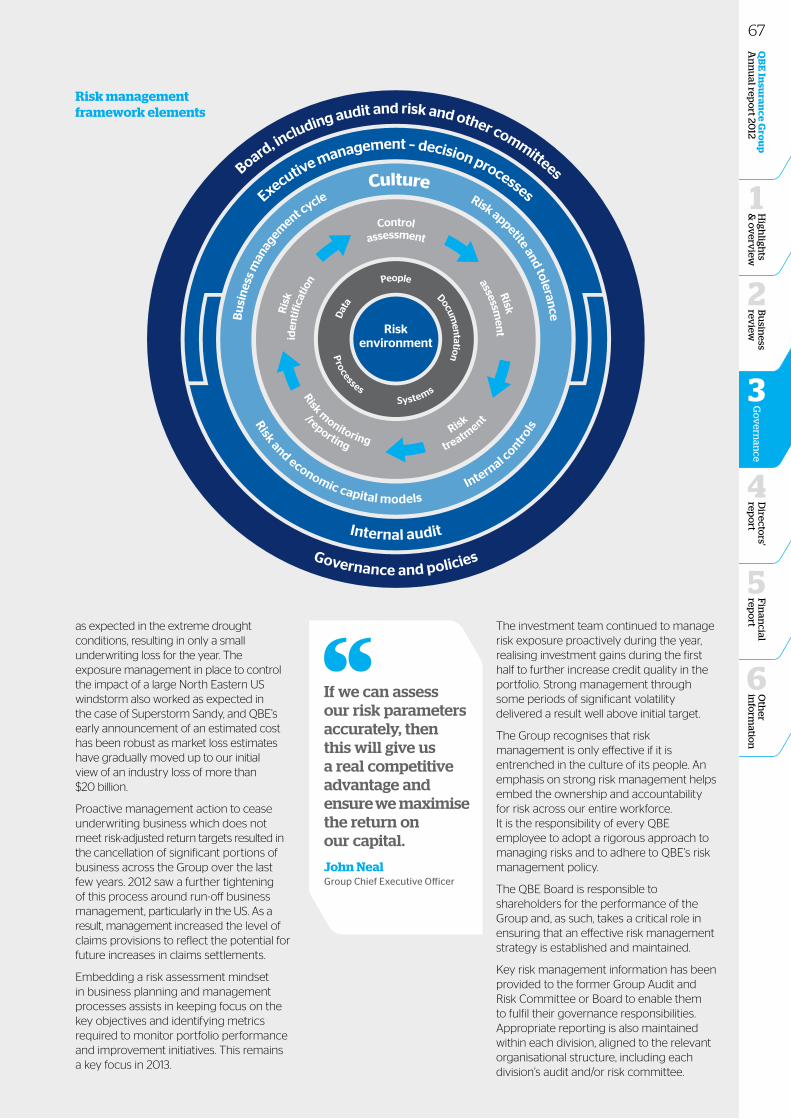
Oth
er in
form
ation
6
Fin
ancial
repo
rt
5
Bu
siness
review
2
Directo
rs' rep
ort
4
QB
E In
suran
ce Gro
up
A
nn
ual rep
ort 20
12G
ov
ernan
ce
3
High
lights
& o
verv
iew
1
as expected in the extreme drought conditions, resulting in only a small underwriting loss for the year. The exposure management in place to control the impact of a large North Eastern US windstorm also worked as expected in the case of Superstorm Sandy, and QBE’s early announcement of an estimated cost has been robust as market loss estimates have gradually moved up to our initial view of an industry loss of more than $20 billion.
Proactive management action to cease underwriting business which does not meet risk-adjusted return targets resulted in the cancellation of significant portions of business across the Group over the last few years. 2012 saw a further tightening of this process around run-off business management, particularly in the US. As a result, management increased the level of claims provisions to reflect the potential for future increases in claims settlements.
Embedding a risk assessment mindset in business planning and management processes assists in keeping focus on the key objectives and identifying metrics required to monitor portfolio performance and improvement initiatives. This remains a key focus in 2013.
The investment team continued to manage risk exposure proactively during the year, realising investment gains during the first half to further increase credit quality in the portfolio. Strong management through some periods of significant volatility delivered a result well above initial target.
The Group recognises that risk management is only effective if it is entrenched in the culture of its people. An emphasis on strong risk management helps embed the ownership and accountability for risk across our entire workforce. It is the responsibility of every QBE employee to adopt a rigorous approach to managing risks and to adhere to QBE’s risk management policy.
The QBE Board is responsible to shareholders for the performance of the Group and, as such, takes a critical role in ensuring that an effective risk management strategy is established and maintained.
Key risk management information has been provided to the former Group Audit and Risk Committee or Board to enable them to fulfil their governance responsibilities. Appropriate reporting is also maintained within each division, aligned to the relevant organisational structure, including each division’s audit and/or risk committee.
Risk management framework elements
Board, including audit and risk and other committees
Governance and policies
Executive management – decision processes
Internal audit
Bus
ines
s man
agem
ent cycle
Culture Risk appetite and toleranceControl
assessment
Ris
kid
entif
icat
ion
/reporting
Risk monitoring
treatment
Risk
Risk
assessment
Risk and economic capital models I
nternal c
ontrols
Riskenvironment
People
Documentation
Dat
a
Processes
Systems
If we can assess our risk parameters accurately, then this will give us a real competitive advantage and ensure we maximise the return on our capital.
John Neal Group Chief Executive Officer
67
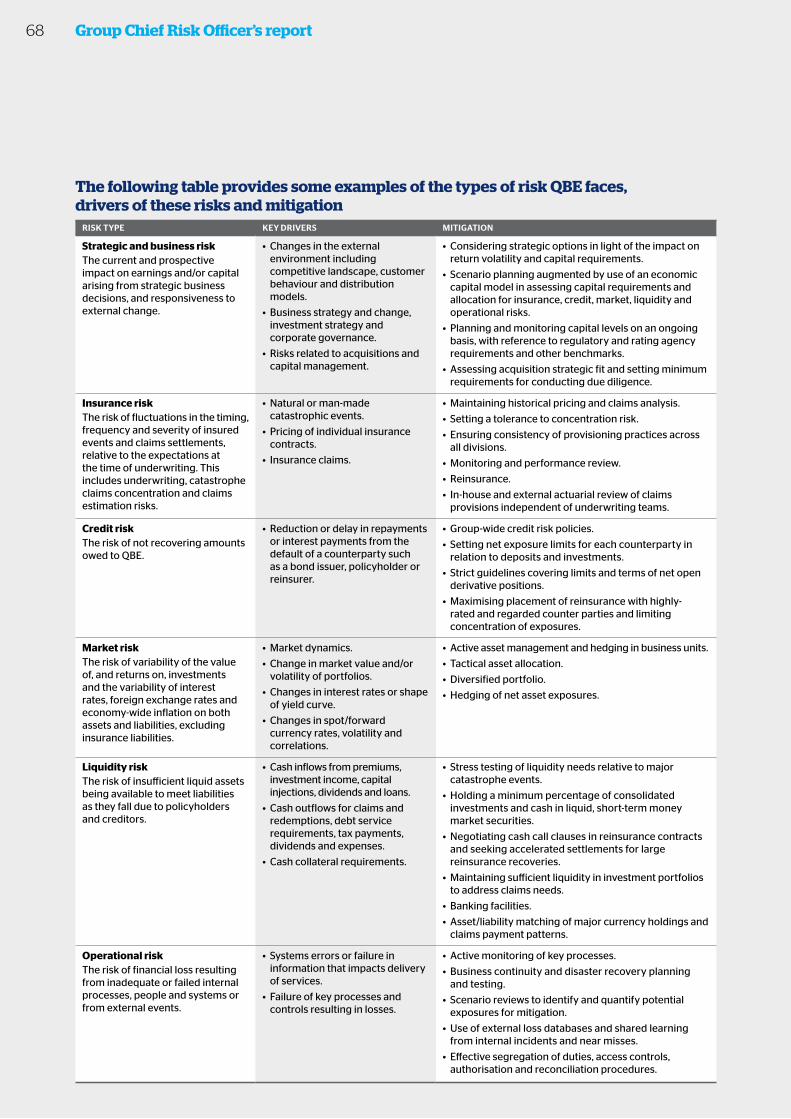
Group Chief Risk Officer’s report
The following table provides some examples of the types of risk QBE faces, drivers of these risks and mitigation
RISK tyPE KEy dRIvERS mItIGAtION
Strategic and business riskThe current and prospective impact on earnings and/or capital arising from strategic business decisions, and responsiveness to external change.
• Changes in the external environment including competitive landscape, customer behaviour and distribution models.
• Business strategy and change, investment strategy and corporate governance.
• Risks related to acquisitions and capital management.
• Considering strategic options in light of the impact on return volatility and capital requirements.
• Scenario planning augmented by use of an economic capital model in assessing capital requirements and allocation for insurance, credit, market, liquidity and operational risks.
• Planning and monitoring capital levels on an ongoing basis, with reference to regulatory and rating agency requirements and other benchmarks.
• Assessing acquisition strategic fit and setting minimum requirements for conducting due diligence.
Insurance riskThe risk of fluctuations in the timing, frequency and severity of insured events and claims settlements, relative to the expectations at the time of underwriting. This includes underwriting, catastrophe claims concentration and claims estimation risks.
• Natural or man-made catastrophic events.
• Pricing of individual insurance contracts.
• Insurance claims.
• Maintaining historical pricing and claims analysis.
• Setting a tolerance to concentration risk.
• Ensuring consistency of provisioning practices across all divisions.
• Monitoring and performance review.
• Reinsurance.
• In-house and external actuarial review of claims provisions independent of underwriting teams.
Credit riskThe risk of not recovering amounts owed to QBE.
• Reduction or delay in repayments or interest payments from the default of a counterparty such as a bond issuer, policyholder or reinsurer.
• Group-wide credit risk policies.
• Setting net exposure limits for each counterparty in relation to deposits and investments.
• Strict guidelines covering limits and terms of net open derivative positions.
• Maximising placement of reinsurance with highly-rated and regarded counter parties and limiting concentration of exposures.
Market riskThe risk of variability of the value of, and returns on, investments and the variability of interest rates, foreign exchange rates and economy-wide inflation on both assets and liabilities, excluding insurance liabilities.
• Market dynamics.
• Change in market value and/or volatility of portfolios.
• Changes in interest rates or shape of yield curve.
• Changes in spot/forward currency rates, volatility and correlations.
• Active asset management and hedging in business units.
• Tactical asset allocation.
• Diversified portfolio.
• Hedging of net asset exposures.
Liquidity riskThe risk of insufficient liquid assets being available to meet liabilities as they fall due to policyholders and creditors.
• Cash inflows from premiums, investment income, capital injections, dividends and loans.
• Cash outflows for claims and redemptions, debt service requirements, tax payments, dividends and expenses.
• Cash collateral requirements.
• Stress testing of liquidity needs relative to major catastrophe events.
• Holding a minimum percentage of consolidated investments and cash in liquid, short-term money market securities.
• Negotiating cash call clauses in reinsurance contracts and seeking accelerated settlements for large reinsurance recoveries.
• Maintaining sufficient liquidity in investment portfolios to address claims needs.
• Banking facilities.
• Asset/liability matching of major currency holdings and claims payment patterns.
Operational risk The risk of financial loss resulting from inadequate or failed internal processes, people and systems or from external events.
• Systems errors or failure in information that impacts delivery of services.
• Failure of key processes and controls resulting in losses.
• Active monitoring of key processes.
• Business continuity and disaster recovery planning and testing.
• Scenario reviews to identify and quantify potential exposures for mitigation.
• Use of external loss databases and shared learning from internal incidents and near misses.
• Effective segregation of duties, access controls, authorisation and reconciliation procedures.
68
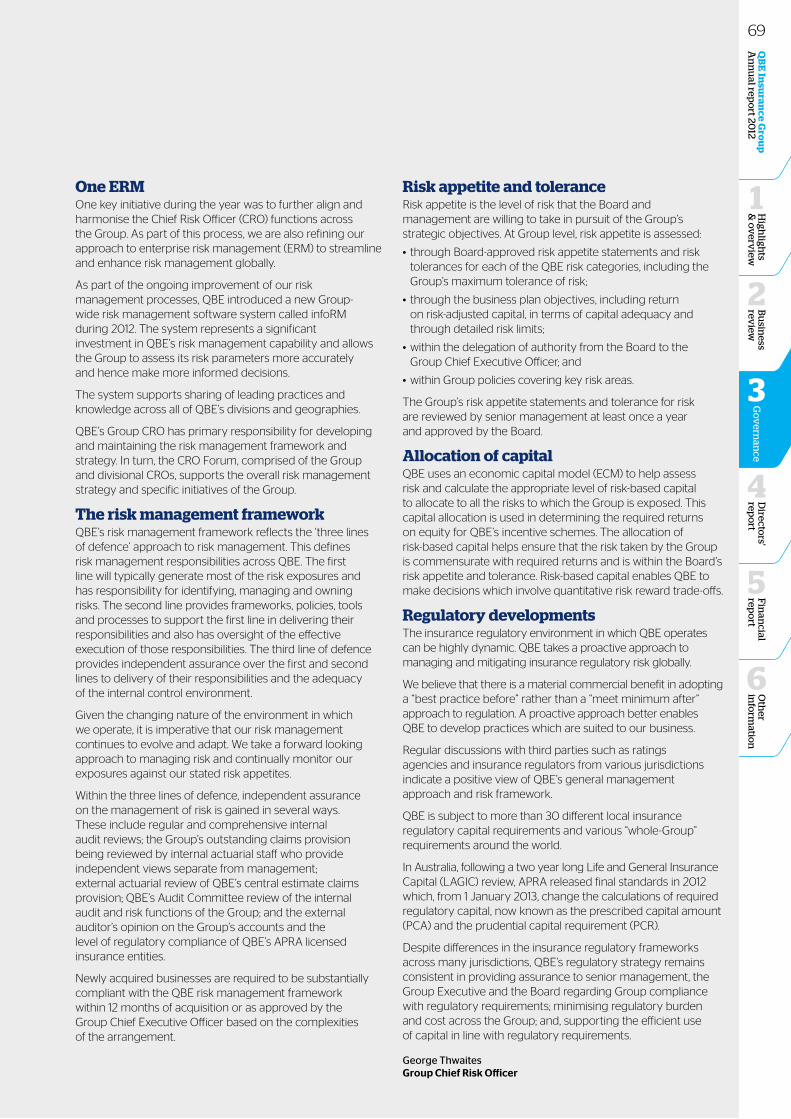
Oth
er in
form
ation
6
Fin
ancial
repo
rt
5
Bu
siness
review
2
Directo
rs' rep
ort
4
QB
E In
suran
ce Gro
up
A
nn
ual rep
ort 20
12G
ov
ernan
ce
3
High
lights
& o
verv
iew
1One ERMOne key initiative during the year was to further align and harmonise the Chief Risk Officer (CRO) functions across the Group. As part of this process, we are also refining our approach to enterprise risk management (ERM) to streamline and enhance risk management globally.
As part of the ongoing improvement of our risk management processes, QBE introduced a new Group-wide risk management software system called infoRM during 2012. The system represents a significant investment in QBE’s risk management capability and allows the Group to assess its risk parameters more accurately and hence make more informed decisions.
The system supports sharing of leading practices and knowledge across all of QBE’s divisions and geographies.
QBE’s Group CRO has primary responsibility for developing and maintaining the risk management framework and strategy. In turn, the CRO Forum, comprised of the Group and divisional CROs, supports the overall risk management strategy and specific initiatives of the Group.
The risk management frameworkQBE’s risk management framework reflects the ‘three lines of defence’ approach to risk management. This defines risk management responsibilities across QBE. The first line will typically generate most of the risk exposures and has responsibility for identifying, managing and owning risks. The second line provides frameworks, policies, tools and processes to support the first line in delivering their responsibilities and also has oversight of the effective execution of those responsibilities. The third line of defence provides independent assurance over the first and second lines to delivery of their responsibilities and the adequacy of the internal control environment.
Given the changing nature of the environment in which we operate, it is imperative that our risk management continues to evolve and adapt. We take a forward looking approach to managing risk and continually monitor our exposures against our stated risk appetites.
Within the three lines of defence, independent assurance on the management of risk is gained in several ways. These include regular and comprehensive internal audit reviews; the Group’s outstanding claims provision being reviewed by internal actuarial staff who provide independent views separate from management; external actuarial review of QBE’s central estimate claims provision; QBE’s Audit Committee review of the internal audit and risk functions of the Group; and the external auditor’s opinion on the Group’s accounts and the level of regulatory compliance of QBE’s APRA licensed insurance entities.
Newly acquired businesses are required to be substantially compliant with the QBE risk management framework within 12 months of acquisition or as approved by the Group Chief Executive Officer based on the complexities of the arrangement.
Risk appetite and toleranceRisk appetite is the level of risk that the Board and management are willing to take in pursuit of the Group’s strategic objectives. At Group level, risk appetite is assessed:
• through Board-approved risk appetite statements and risk tolerances for each of the QBE risk categories, including the Group’s maximum tolerance of risk;
• through the business plan objectives, including return on risk-adjusted capital, in terms of capital adequacy and through detailed risk limits;
•within the delegation of authority from the Board to the Group Chief Executive Officer; and
•within Group policies covering key risk areas.
The Group’s risk appetite statements and tolerance for risk are reviewed by senior management at least once a year and approved by the Board.
Allocation of capitalQBE uses an economic capital model (ECM) to help assess risk and calculate the appropriate level of risk-based capital to allocate to all the risks to which the Group is exposed. This capital allocation is used in determining the required returns on equity for QBE’s incentive schemes. The allocation of risk-based capital helps ensure that the risk taken by the Group is commensurate with required returns and is within the Board’s risk appetite and tolerance. Risk-based capital enables QBE to make decisions which involve quantitative risk reward trade-offs.
Regulatory developmentsThe insurance regulatory environment in which QBE operates can be highly dynamic. QBE takes a proactive approach to managing and mitigating insurance regulatory risk globally.
We believe that there is a material commercial benefit in adopting a “best practice before” rather than a “meet minimum after” approach to regulation. A proactive approach better enables QBE to develop practices which are suited to our business.
Regular discussions with third parties such as ratings agencies and insurance regulators from various jurisdictions indicate a positive view of QBE’s general management approach and risk framework.
QBE is subject to more than 30 different local insurance regulatory capital requirements and various “whole-Group” requirements around the world.
In Australia, following a two year long Life and General Insurance Capital (LAGIC) review, APRA released final standards in 2012 which, from 1 January 2013, change the calculations of required regulatory capital, now known as the prescribed capital amount (PCA) and the prudential capital requirement (PCR).
Despite differences in the insurance regulatory frameworks across many jurisdictions, QBE’s regulatory strategy remains consistent in providing assurance to senior management, the Group Executive and the Board regarding Group compliance with regulatory requirements; minimising regulatory burden and cost across the Group; and, supporting the efficient use of capital in line with regulatory requirements.
George Thwaites Group Chief Risk Officer
69
Board of directors
Skills, experience & knowledge
Belinda Hutchinson AM
Duncan Boyle
John Graf
John M Green
BEC, FCA, FAICD BA, FCII, FAICD BA B JURIS/LLB, FAICD, SF FIN
Chairman Independent director Independent director Independent director
Age 59 Age 61 Age 53 Age 60
Belinda Hutchinson was appointed as an independent non-executive director of QBE in September 1997 and became Chairman in July 2010. Belinda is a member of the Audit, Investment, Remuneration and Risk and Capital Committees.
Belinda is a director of AGL Energy Limited and St Vincent’s Health Australia. Belinda is also a member of the Salvation Army Eastern Territory Advisory Board and Chancellor of the University of Sydney.
Duncan Boyle was appointed as an independent non-executive director of QBE in September 2006. Duncan is Chairman of the Audit Committee and a member of the Remuneration Committee.
Duncan is a director of Clayton Utz lawyers and Stockland Trust Group and has 40 years experience in the insurance industry in Australia, New Zealand and the UK.
John Graf is based in the US and was appointed as an independent non-executive director of QBE in August 2012. John is a member of the Audit, Investment and Risk and Capital Committees.
John is the chairman, president and chief executive officer of the financial services company Forethought Financial Group, Inc. John has over 31 years experience in the US financial services industry including senior executive positions with AXA Financial Inc., American General Corporation, Conseco Inc. and John Hancock Financial Services.
John M Green was appointed as an independent non-executive director of QBE in March 2010. John is Chairman of the Risk and Capital Committee and a member of the Investment and Remuneration Committees.
John is a non-executive director of WorleyParsons Limited, a member of the Takeovers Panel in Australia, a book publisher at Pantera Press, a novelist and a business writer. As an executive director at Macquarie Bank and before that as a partner at two major law firms, John advised numerous insurance and financial services companies.
70
Oth
er in
form
ation
6
Fin
ancial
repo
rt
5
Bu
siness
review
2
Directo
rs' rep
ort
4
QB
E In
suran
ce Gro
up
A
nn
ual rep
ort 20
12G
ov
ernan
ce
3
High
lights
& o
verv
iew
1
Isabel Hudson
Charles Irby
Irene Lee
John Neal
MA, FCII FCA (England & Wales) BA, Barrister-at-law
Independent director Independent director Independent director Group Chief Executive Officer
Age 53 Age 67 Age 59 Age 48
Isabel Hudson is based in the UK and was appointed as an independent non-executive director of QBE in November 2005. Isabel is Chairman of the Remuneration Committee and is a member of the Audit Committee.
Isabel is Chairman of the National House Building Council and a director of MGM Advantage, Phoenix Group Holdings and the Pensions Regulator in the UK. She is also an ambassador of the UK charity Scope. Isabel has 32 years experience in the insurance industry in the UK and mainland Europe.
Charles Irby is based in the UK and was appointed as an independent non-executive director of QBE in June 2001. Charles is a member of the Investment Committee and the European Operations' Audit Committee.
Charles is a director of Great Portland Estates Plc and North Atlantic Smaller Companies Investment Trust Plc. Charles is also a trustee and governor of King Edwards VII’s Hospital Sister Agnes.
Irene Lee is based in Hong Kong and was appointed as an independent non-executive director of QBE in May 2002. Irene is Chairman of the Investment Committee and is a member of the Audit and Risk and Capital Committees.
Irene is the executive Chairman of Hysan Development Limited. Irene is a director of Cathay Pacific Airways Limited, CLP Holdings Limited, Sydney Symphony Limited and Noble Group Limited. She is also a member of the advisory council of JP Morgan Australia.
John Neal joined QBE in 2003 and was appointed Group Chief Executive Officer on 17 August 2012. Prior to his current role, John held the position of Chief Executive Officer of Global Underwriting Operations and prior to that held several leadership positions in QBE’s European Operations, most recently as Chief Underwriting Officer.
John has over 25 years experience in the insurance industry and before joining QBE, John was the Chief Executive of Ensign, a Lloyd’s managing agent. John developed Ensign to become the UK’s leading commercial motor insurance brand. QBE acquired Ensign in 2003.
71
John Neal
Steven Burns
Neil Drabsch
Colin Fagen
FCA FCA, FAICD, FCIS B COM, MBA
Group Chief Executive Officer
Chief Executive Officer, European Operations
Group Chief Financial Officer
Chief Executive Officer, Australian & New Zealand Operations
Age 48 Age 54 Age 64 Age 46
Group Executive Committee
Making it happen
John Neal joined QBE in 2003 and was appointed Group Chief Executive Officer on 17 August 2012. Prior to his current role, John held the position of Chief Executive Officer of Global Underwriting Operations and prior to that held several leadership positions in QBE’s European Operations, most recently as Chief Underwriting Officer.
John has over 25 years experience in the insurance industry and before joining QBE, John was the Chief Executive of Ensign, a Lloyd’s managing agent. John developed Ensign to become the UK’s leading commercial motor insurance brand. QBE acquired Ensign in 2003.
Steven Burns joined QBE through its acquisition of Limit Underwriting in 2000 and was appointed Chief Executive Officer, European Operations in 2004. Prior to his current role, Steven was Chief Executive Officer, Lloyd’s Division.
Steven has extensive experience in the insurance industry. He joined Janson Green, a Lloyd’s managing agent, in 1987 and became Finance Director prior to the agent’s acquisition by Limit Underwriting.
Steven was a member of the Council of Lloyd’s, between 2003 and 2005 and a non-executive director of the Lloyd’s Franchise Board.
Neil Drabsch joined QBE in 1991 and was appointed Group Chief Financial Officer in 1994. Prior to his current role, Neil was Group Company Secretary.
Neil has more than 46 years experience in insurance and reinsurance management, finance and accounting, including 24 years as a practicing chartered accountant.
Neil is a fellow of the Institute of Chartered Accountants, the Australian Institute of Company Directors and the Institute of Chartered Secretaries and Administrators. He also participates in a number of representative committees for the Insurance Council in relation to finance and industry matters and the development of Australian accounting standards for general insurance.
Colin Fagen joined QBE in 1998 and was appointed Chief Executive Officer, Australian Operations in 2011. This was expanded to include New Zealand Operations in 2012. Prior to his current role, Colin was the Executive General Manager, Intermediary Distribution for Australian Operations.
Colin has 22 years experience in the general insurance industry, having held a variety of operational roles. Colin is a director of the Australian and New Zealand Institute of Insurance and Finance and is also a director of the Insurance Council of Australia.
72
Oth
er in
form
ation
6
Fin
ancial
repo
rt
5
Bu
siness
review
2
Directo
rs' rep
ort
4
QB
E In
suran
ce Gro
up
A
nn
ual rep
ort 20
12G
ov
ernan
ce
3
High
lights
& o
verv
iew
1
John Rumpler
Jenni Smith
Jose Sojo
George Thwaites
FFIN, FAIEX MBA B BUS, M ECON/POL. SCIENCE B ENG (HONS), ACA
President and Chief Executive Officer, North American Operations
Group Executive Officer, People and Communications
Chief Executive Officer, Latin American Operations
Group Chief Risk Officer
Age 52 Age 50 Age 41 Age 47
John Rumpler joined QBE in 1997 and was appointed President and Chief Executive Officer, North American Operations in 2009. Prior to his current role John led the development of the Group’s international credit and surety businesses and was a member of the Australian Operations’ executive team.
John has more than 31 years experience in the banking, government and insurance industries. John is a fellow of the Australian Institute of Banking and Finance, a member of the Australian Institute of Company Directors and was the president of the International Credit and Surety Association from 2006 to 2008.
Jenni Smith joined QBE in 2003 and holds the role of Group Executive Officer, People and Communications. Jenni is also the Chair of the QBE Foundation.
Jenni has substantial international experience having held executive roles in the UK advertising and television industry. Before joining QBE, Jenni held the position of General Manager Human Resources, International at Telstra Corporation.
Jose Sojo joined QBE in 2001 and was appointed Chief Executive Officer, Latin American Operations in 2011. Prior to his current role, Jose was General Manager, Latin America where he was responsible for QBE s expansion from a one country operation to the current business in seven countries in Latin America.
Jose currently chairs the Group s Underwriting and Distribution Forum, working on several global initiatives for QBE. Jose has been involved in the insurance industry for 17 years, gaining underwriting and management experience at Gen Re and HIH Argentina. It was QBE’s acquisition of HIH Argentina in 2001 that brought Jose to QBE.
George Thwaites joined QBE in 1999 and was appointed Group Chief Risk Officer in 2005. Prior to his current role, George was Financial Controller for QBE’s Asia Pacific Operations.
George has been involved in the insurance industry for over 17 years and previously worked in the accounting profession. George has gained extensive global experience advising financial institutions across the UK, Canada and Australia.
73
QBE places importance on corporate governance and being a good corporate citizen. The Group has a vision and six ONE QBE values that recognise its customers, people, shareholders and the community. QBE believes that a culture that rewards transparency, integrity and performance will promote its long-term sustainability and the ongoing success of its business.
This corporate governance statement aims to disclose in summary form as clearly and objectively as possible QBE’s corporate governance standards and practices so that they can be readily understood by our shareholders, policyholders and other stakeholders. QBE also continues to focus on other equally important issues such as the strength of its outstanding claims provision and the quality of its reinsurance protections.
The ASX Corporate Governance Council (ASX CGC) has issued eight principles and, as part of them, made 30 recommendations. Each principle is discussed below.
ASX CGC principle 1: lay solid foundations for management and oversightBoard functionsIn accordance with its charter, the Board:
• oversees corporate governance;
• selects and supervises the Group Chief Executive Officer;
• provides direction to management;
• approves the strategies and major policies of the Group;
• monitors performance against plan;
• considers regulatory compliance;
• monitors people-related strategies (including people development and succession planning); and
• reviews information technology and other resources.
The Board ensures it has the information it requires to be effective including, where necessary, independent professional advice. A non-executive director may seek such advice at the company’s cost with the consent of the Chairman. All directors would receive a copy of such advice. Non-executive directors may attend relevant external training courses at QBE’s cost with the consent of the Chairman.
Strategic issues and management’s detailed budgets and three year business plans are reviewed at least annually by the Board. The Board receives updated forecasts during the year. Visits by non-executive directors to the Group’s offices in key locations are encouraged. To help the Board to maintain its understanding of the business and to effectively assess management, directors have regular presentations by the divisional Chief Executive Officers and other senior managers of the various divisions on topics, including budgets, three year business plans and operating performance. They have contact with senior employees at numerous times and in various forums during the year. The Board meets regularly in Australia and, due to QBE’s substantial overseas operations, usually spends five days in the UK and the US each year. Meetings are held in other overseas offices as and when the Board considers it appropriate. This year, the Board met in Hong Kong. Each meeting normally considers reports from the Group Chief Executive Officer and the Group Chief Financial Officer, together with other relevant reports. The Board regularly meets in the absence of management. The Chairman and Group Chief Executive Officer in particular, and board members in general, have substantial contact outside Board and Committee meetings.
The Board delegates responsibility to the Group Chief Executive Officer for management of the business on a day to day basis.
CommitteesThe Board is supported by several committees which meet regularly to consider the audit and risk management processes, investments, remuneration and other matters. The main committees of the Board
were the Audit and Risk Committee, the Investment Committee and the Remuneration Committee. Committees operate under a written charter approved by the Board. Any non-executive director may attend a committee meeting. The committees have free and unfettered access to QBE’s senior managers during their meetings and may consult external advisers at QBE’s cost, including requiring their attendance at committee meetings. Committee membership is reviewed regularly. The Chairman of the Remuneration Committee changed in October 2012 following Mr Bleasel’s retirement.
In addition, the Board has established for 2013 a Risk and Capital Committee to replace the previous Funding Committee. Both of these committees comprise Mr JM Green (Chairman), Mr JA Graf, Ms BJ Hutchinson AM and Ms IYL Lee. This new committee will usually meet four times a year.
As a consequence, in 2013, the Audit and Risk Committee will become the Audit Committee.
A report on each committee’s last meeting is provided to the next Board meeting. The Company Secretary acts as secretary to all committees. Details of directors’ attendance at board and committee meetings are outlined in the table of meeting attendance set out in the directors’ report on page 82.
Delegated authoritiesQBE has operated under an extensive written system of delegated authorities for many years. In particular, a written delegated authority with specified limits is approved by the Board each year to enable the Group Chief Executive Officer to conduct the Group’s business in accordance with detailed budgets and business plans. This authority deals with topics such as underwriting, reinsurance protection, claims, investments, acquisitions and expenses. The Group Chief Executive Officer delegates his authority to management throughout the Group on a selective basis taking into account expertise and past performance. Compliance with delegated authorities is closely monitored by management and adjusted as required for actual performance, market conditions and other factors. Management and the Group’s internal audit teams review compliance with delegated authorities and any breach can lead to disciplinary procedures, including dismissal in serious cases.
Evaluating senior executivesThe Remuneration Committee receives information on the performance of the Group Executive, being the senior executives as defined by the ASX CGC (namely those employees who have the opportunity to materially influence the integrity, strategy, operation and financial performance of the QBE Group).
A performance development plan (PDP) involves a meeting between the relevant member of the Group Executive, the Group Chief Executive Officer and the Group Executive Officer, People and Communications to:
• review past performance;
• discuss career opportunities; and
• consider areas of further development.
PDPs occur periodically in accordance with the process above, and several took place in 2012. In addition, the Board continually monitors the performance of the Group Executive through regular contact and reporting.
Corporate governance statement
74 Section 3: Governance
QBE Insurance Group
Annual report 2012
ASX CGC principle 2: structure the Board to add valueBoard of directorsDirectors are selected to achieve a broad range of skills, experience and expertise complementary to the Group’s insurance activities. Details of individual directors are included on pages 70 and 71 and can also be found on the QBE website at www.qbe.com. The Board currently comprises eight directors including an independent Chairman, the Group Chief Executive Officer and six independent non-executive directors applying the “independence” definition of the ASX CGC. Applying this definition, the Board has determined that a non-executive director’s relationship with QBE as a professional adviser, consultant, supplier, customer or otherwise is not material unless amounts paid under that relationship exceed 0.1% of revenue.
The roles of Chairman and Group Chief Executive Officer are not exercised by the same individual.
The period for which a director has served on a board is not part of the ASX CGC’s independence definition. Nevertheless, as a general guide, the Board has agreed that a non-executive director’s term should be approximately 10 years. The Board considers that a mandatory limit on tenure would deprive the Group of valuable and relevant corporate experience in the complex world of international general insurance and reinsurance. Ms BJ Hutchinson AM has been a non-executive director since September 1997 and Chairman since July 2010. She was re-elected as a director at the 2012 AGM. QBE’s other directors believe that Ms Hutchinson AM continues to exercise independent judgment and, through her QBE experience, makes an important contribution. They also believe that the Chairman’s experience gained from directorships in other businesses provides an advantage to QBE.
Similar reasons apply to Mr CLA Irby and Ms IYL Lee who joined the Board in June 2001 and May 2002 respectively. Mr Irby was re-elected as a director at the 2011 AGM, while Ms Lee was re-elected at the 2012 AGM. Mr Irby will retire from the Board on 31 March 2013.
The Chairman oversees the performance of the Board, its committees and each director. The Board regularly reviews its performance. The Chairman reports the overall result to the Board and it is discussed by all directors. Recommendations for either improvement or increased focus are agreed and then implemented. For the first time, the board review procedure was facilitated by an independent consultant. The procedure included written answers and questions completed confidentially by each director, the Group Executive and QBE’s company secretaries together with interviews. The consultant discussed her findings with the Chairman and Group Chief Executive Officer and then with the Board as a whole. Recommendations for either improved or increased focus were agreed and are being implemented. This review procedure is a precursor to other directors determining whether to support, via the notice of meeting, a non-executive director for re-election at an AGM. The last board review was completed in accordance with the process above in February 2013, ahead of nominating Mr JA Graf for election and Messrs DM Boyle and JM Green for re-election at the 2013 AGM. The last board review included the Audit and Risk, Investment and Remuneration Committees as the main committees of the Board. The review concluded that each committee was operating soundly and meeting the terms of its charter.
QBE’s constitution provides that no director, except the Group Chief Executive Officer, shall hold office for a continuous period in excess of three years or past the third AGM following a director’s appointment, whichever is the longer, without submission for re-election at the next AGM. Under QBE’s constitution, there is no maximum fixed term or retirement age for non-executive directors.
Directors advise the Board on an ongoing basis of any interest they have that they believe could conflict with QBE’s interests. If a potential conflict does arise, either the director concerned may
choose not to, or the Board may decide that he or she should not, receive documents or take part in board discussions whilst the matter is being considered.
Board selection processThe Board believes that its composition, including selection, appointment, renewal and retirement of members, is of such importance that it is the role of the Board as a whole to review. As a result, all directors are members of the nomination committee.
The Board believes that orderly succession and renewal contributes to strong corporate governance and is achieved by careful planning and continual review. Directors consider the size and composition of the Board regularly and at least once a year as part of the board review procedure. The Board has a skills matrix covering the competencies and experience of each member. When the need for a new director is identified, the required experience and competencies of the new director are defined in the context of this matrix and any gaps that may exist. Generally a list of potential candidates is identified based on these skills required and other issues such as geographic location and diversity criteria. External consultants may be employed where necessary to search for prospective board members. Candidates are assessed against the required skills and on their qualifications, backgrounds and personal qualities. In addition, candidates are sought who have insurance experience, a proven track record in creating shareholder value, utmost integrity, a commitment to corporate governance, the required time to commit to the position, a strategic mindset, a preparedness to constructively question and challenge and an independence of mind. The Board has adopted non-executive director nomination guidelines.
During the year, Mr LF Bleasel AM retired as a director, Mr JA Graf was appointed as a director, Mr FM O’Halloran retired as Group Chief Executive Officer and Mr JD Neal succeeded him.
ASX CGC principle 3: promote ethical and responsible decision makingGroup guidelinesThe Group has adopted a code of conduct for Australian Operations, Group head office and Group Investment division which forms the basis for the manner in which these employees perform their work involving both legal obligations and the reasonable expectations of stakeholders. The code of conduct requires that business be carried out in an open and honest manner with our customers, shareholders, employees, regulatory bodies, outside suppliers, intermediaries and the community at large. The code also deals with confidentiality, conflicts of interest and related matters. The non-executive directors have adopted a code of conduct for themselves which is substantially the same as the code above.
Other divisions have developed codes of conduct based on the Group code above, with some differences to allow for the requirements of the particular countries in which the division operates.
There are other Group policies covering anti-discrimination, employment, harassment, QBE values and behaviours, health and safety, privacy, whistle-blowing and many other business practices. These policies, like the code of conduct, are underpinned by the Group’s vision and values statements. The vision and values statements form part of the induction information given to new employees.
QBE in Australia follows the general insurance code of practice, a self-regulated code developed by the Insurance Council of Australia (ICA) relating to the provision of products and services to customers of the general insurance industry in Australia. A revised code of practice commenced in July 2012. The code is currently being reviewed by an independent consultant for the ICA. The consultant’s recommendations are expected by mid 2013.
QBE in Australia is a member of the Financial Ombudsman Service, an Australian Securities and Investment Commission (ASIC) approved external dispute resolution body which deals with general insurance disputes between consumers and insurers.
75O
ther
info
rmatio
n
6
Fin
ancial
repo
rt
5
Directo
rs' rep
ort
4
Bu
siness
review
2
Go
vern
ance
3
High
lights
& o
verv
iew
1
QB
E In
suran
ce Gro
up
A
nn
ual rep
ort 20
12
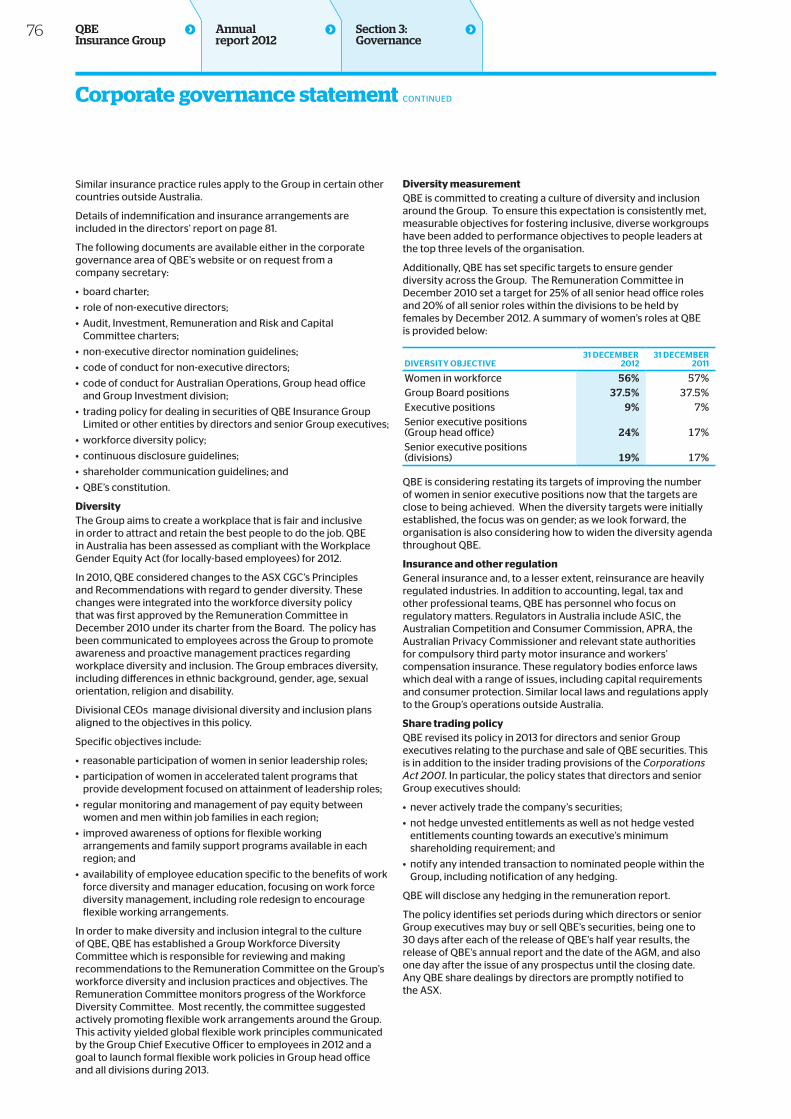
Corporate governance statement CONTINUED
Similar insurance practice rules apply to the Group in certain other countries outside Australia.
Details of indemnification and insurance arrangements are included in the directors’ report on page 81.
The following documents are available either in the corporate governance area of QBE’s website or on request from a company secretary:
• board charter;
• role of non-executive directors;
• Audit, Investment, Remuneration and Risk and Capital Committee charters;
• non-executive director nomination guidelines;
• code of conduct for non-executive directors;
• code of conduct for Australian Operations, Group head office and Group Investment division;
• trading policy for dealing in securities of QBE Insurance Group Limited or other entities by directors and senior Group executives;
• workforce diversity policy;
• continuous disclosure guidelines;
• shareholder communication guidelines; and
• QBE’s constitution.
DiversityThe Group aims to create a workplace that is fair and inclusive in order to attract and retain the best people to do the job. QBE in Australia has been assessed as compliant with the Workplace Gender Equity Act (for locally-based employees) for 2012.
In 2010, QBE considered changes to the ASX CGC’s Principles and Recommendations with regard to gender diversity. These changes were integrated into the workforce diversity policy that was first approved by the Remuneration Committee in December 2010 under its charter from the Board. The policy has been communicated to employees across the Group to promote awareness and proactive management practices regarding workplace diversity and inclusion. The Group embraces diversity, including differences in ethnic background, gender, age, sexual orientation, religion and disability.
Divisional CEOs manage divisional diversity and inclusion plans aligned to the objectives in this policy.
Specific objectives include:
• reasonable participation of women in senior leadership roles;
• participation of women in accelerated talent programs that provide development focused on attainment of leadership roles;
• regular monitoring and management of pay equity between women and men within job families in each region;
• improved awareness of options for flexible working arrangements and family support programs available in each region; and
• availability of employee education specific to the benefits of work force diversity and manager education, focusing on work force diversity management, including role redesign to encourage flexible working arrangements.
In order to make diversity and inclusion integral to the culture of QBE, QBE has established a Group Workforce Diversity Committee which is responsible for reviewing and making recommendations to the Remuneration Committee on the Group’s workforce diversity and inclusion practices and objectives. The Remuneration Committee monitors progress of the Workforce Diversity Committee. Most recently, the committee suggested actively promoting flexible work arrangements around the Group. This activity yielded global flexible work principles communicated by the Group Chief Executive Officer to employees in 2012 and a goal to launch formal flexible work policies in Group head office and all divisions during 2013.
Diversity measurementQBE is committed to creating a culture of diversity and inclusion around the Group. To ensure this expectation is consistently met, measurable objectives for fostering inclusive, diverse workgroups have been added to performance objectives to people leaders at the top three levels of the organisation.
Additionally, QBE has set specific targets to ensure gender diversity across the Group. The Remuneration Committee in December 2010 set a target for 25% of all senior head office roles and 20% of all senior roles within the divisions to be held by females by December 2012. A summary of women’s roles at QBE is provided below:
Diversity objective31 December
201231 December
2011
Women in workforce 56% 57%Group Board positions 37.5% 37.5%Executive positions 9% 7%Senior executive positions (Group head office) 24% 17%Senior executive positions (divisions) 19% 17%
QBE is considering restating its targets of improving the number of women in senior executive positions now that the targets are close to being achieved. When the diversity targets were initially established, the focus was on gender; as we look forward, the organisation is also considering how to widen the diversity agenda throughout QBE.
Insurance and other regulationGeneral insurance and, to a lesser extent, reinsurance are heavily regulated industries. In addition to accounting, legal, tax and other professional teams, QBE has personnel who focus on regulatory matters. Regulators in Australia include ASIC, the Australian Competition and Consumer Commission, APRA, the Australian Privacy Commissioner and relevant state authorities for compulsory third party motor insurance and workers’ compensation insurance. These regulatory bodies enforce laws which deal with a range of issues, including capital requirements and consumer protection. Similar local laws and regulations apply to the Group’s operations outside Australia.
Share trading policyQBE revised its policy in 2013 for directors and senior Group executives relating to the purchase and sale of QBE securities. This is in addition to the insider trading provisions of the Corporations Act 2001. In particular, the policy states that directors and senior Group executives should:
• never actively trade the company’s securities;
• not hedge unvested entitlements as well as not hedge vested entitlements counting towards an executive’s minimum shareholding requirement; and
• notify any intended transaction to nominated people within the Group, including notification of any hedging.
QBE will disclose any hedging in the remuneration report.
The policy identifies set periods during which directors or senior Group executives may buy or sell QBE’s securities, being one to 30 days after each of the release of QBE’s half year results, the release of QBE’s annual report and the date of the AGM, and also one day after the issue of any prospectus until the closing date. Any QBE share dealings by directors are promptly notified to the ASX.
76 Section 3: Governance
QBE Insurance Group
Annual report 2012
ASX CGC principle 4: safeguard integrity in financial reportingAudit CommitteeThe membership of the Audit Committee may only comprise non-executive directors. This committee normally meets four times a year. The Chairman must be a non-executive director who is not the Chairman of the Board. The current members are Mr DM Boyle (Chairman), Mr JA Graf, Ms IF Hudson, Ms BJ Hutchinson AM and Ms IYL Lee.
The role of the Audit Committee is to oversee the credibility of QBE’s financial reporting process. This includes review of:
• the financial reporting to APRA, ASIC, the ASX and shareholders;
• financial reporting risks;
• the Group’s accounting policies, practices and disclosures; and
• the scope and outcome of external and internal audits.
This committee’s scope includes reviewing the financial statements (including items such as the outstanding claims provision, and reinsurance recoveries), internal controls, financial reporting, tax compliance and significant changes in accounting policies.
Other non-executive directors normally attend Audit Committee meetings which consider the 30 June and 31 December financial reports. Meetings of this committee usually include, by invitation, the Group Chief Executive Officer, the Group Chief Financial Officer, the Group Chief Actuary, the Group Chief Risk Officer, the Group Head of Internal Audit and the external auditor. As appropriate, other relevant senior managers also attend.
The Audit Committee has free and unfettered access to the external auditor. The external auditor, the Group Head of Internal Audit and the Group Chief Actuary have free and unfettered access to this committee.
External auditor independenceQBE firmly believes that the external auditor must be, and must be seen to be, independent. The external auditor confirms its independence in relation to the 30 June and 31 December financial reports and the Audit Committee confirms this by separate enquiry. The Audit Committee has contact with the external auditor in the absence of management in relation to the 30 June and 31 December financial reports and otherwise as required. The external auditor normally confers with the Audit Committee in the absence of management as part of each meeting.
QBE has issued an internal guideline on external auditor independence. Under this guideline, the external auditor is not allowed to provide the excluded services of preparing accounting records, financial reports or asset or liability valuations. Furthermore, it cannot act in a management capacity, as a custodian of assets or as share registrar.
The Board believes some non-audit services are appropriate given the external auditor’s knowledge of the Group. QBE may engage the external auditor for non-audit services other than excluded services subject to the general principle that fees for non-audit services should not exceed 50% of all fees paid to the external auditor in any one financial year. External tax services are generally provided by an accounting firm other than the external auditor.
The external auditor has been QBE’s auditor for many years. As a diverse international group, QBE requires the services of one of a limited number of international accounting firms to act as auditor. It is the practice of QBE to review from time to time the role of the external auditor. The Corporations Act 2001, Australian professional auditing standards and the external auditor’s own policy deal with rotation and require rotation of the lead engagement partner after five years. In accordance with such policy, the lead engagement partner of the external auditor rotated in 2009 and will again in 2014.
Actuarial reviewIt is a longstanding practice of the directors to ensure that the Group’s insurance liabilities are assessed by actuaries. The Group’s outstanding claims provision is reviewed by experienced internal actuarial staff. Actuarial staff are involved in forming an independent view, separate from management, of the central estimate and the probability of adequacy of the outstanding claims provision and premium liabilities, premium rates and related matters. Around 96% of QBE’s central estimate is also reviewed by external actuaries. External actuaries are generally from organisations which are not associated with the external auditor.
CEO/CFO certificatesThe Group Chief Executive Officer and Group Chief Financial Officer provide the Board with certificates in relation to risk management and internal control as recommended by the ASX CGC and on the financial reports as required by the Corporations Act 2001.
Internal auditA global internal audit function is critical to the risk management process. QBE’s internal audit function reports to senior management and the Audit Committee on the monitoring of the Group’s worldwide operations. Internal audit provides independent assurance that the design and operation of the controls across the Group are effective. The internal audit function operates under a written charter from the Audit Committee. Other governance documents include a reporting protocol, internal audit manual, internal audit issue rating system, internal audit opinion levels and internal audit timetables. A risk-based internal audit approach is used so that higher risk activities are reviewed more frequently. The Group’s internal audit teams work together with the external auditor to provide a wide audit scope.
Investment CommitteeThe membership of the Investment Committee may only comprise non-executive directors. The Investment Committee normally meets four times a year. The Chairman must be a non-executive director who is not the Chairman of the Board. The current members are Ms IYL Lee (Chairman), Mr JA Graf, Mr JM Green, Mr CLA Irby and Ms BJ Hutchinson AM. Meetings of the Investment Committee usually include, by invitation, the Group Chief Executive Officer, the Group Chief Investment Officer and the Group Chief Financial Officer. As appropriate, other relevant senior managers also attend.
The role of the Investment Committee is to oversee QBE’s investment activities. This includes review of:
• investment objectives and strategy;
• investment risk management;
• currency, equity and fixed interest exposure limits;
• credit exposure limits with financial counterparties; and
• Group treasury.
The Investment Committee’s scope includes review of economic and investment conditions as they relate to QBE and overseeing investment performance, including the performance of any defined benefit superannuation funds sponsored by QBE.
77O
ther
info
rmatio
n
6
Fin
ancial
repo
rt
5
Directo
rs' rep
ort
4
Bu
siness
review
2
Go
vern
ance
3
High
lights
& o
verv
iew
1
QB
E In
suran
ce Gro
up
A
nn
ual rep
ort 20
12
Corporate governance statement CONTINUED
ASX CGC principle 5: make timely and balanced disclosureContinuous disclosureASX Listing Rule 3.1 requires QBE to inform the ASX immediately once QBE is or becomes aware of any information concerning it that a reasonable person would expect to have a material effect on the price or value of QBE’s shares. Procedures are in place to ensure that items which potentially require announcement to the ASX are promptly notified to Group head office for assessment and released as required. Depending upon content, either the Board or the Group Chief Executive Officer is responsible for authorising market releases. All market releases are posted promptly to the Group’s website.
QBE takes the spirit of its continuous disclosure obligations very seriously and issues frequent market releases during the year to satisfy those obligations. A list of the material releases made since 1 January 2012 is included on page 180.
ASX CGC principle 6: respect the rights of shareholdersCommunication with shareholdersThe Corporations Act 2001 no longer requires QBE to distribute an annual report to all shareholders except to those who elect to receive it. QBE also produces a half year report which is sent to all shareholders who elect to receive it. Both reports are available on the QBE website. The website also contains historical and other details on the Group. Shareholders can discuss their shareholding with either the shareholder services department or the share registrar, both located in Sydney.
The AGM is held in Sydney each year, usually in April; however, in 2013, it will be held on 27 March. Shareholders are encouraged to attend the AGM in person or by proxy. Most resolutions in the notice of meeting have explanatory notes. During the AGM, shareholders may ask questions of either the Chairman or the external auditor.
Communications with analysts, investors, media, rating agencies and othersThe Group Chief Executive Officer, Group Chief Financial Officer, Group Chief Risk Officer, General Counsel and Company Secretary, Head of Investor Relations, divisional chief executives and divisional finance officers generally deal with analysts, investors, media, rating agencies and others, taking account of regulatory guidelines including those issued by the ASX on continuous disclosure. The presentations on the 30 June and 31 December results and other major presentations are sent to the ASX before the presentations commence and are available promptly on the Group’s website. The 30 June and 31 December presentations are also webcast live and subsequently archived on the Group’s website.
ASX CGC principle 7: recognise and manage riskRisk managementQBE’s core business is the underwriting of risk. The Group’s successful performance over many years clearly establishes its substantial risk management credentials.
It is QBE’s policy to adopt a rigorous approach to managing risk throughout the Group. Risk management is a continuous process and an integral part of quality business management. QBE’s approach is to integrate risk management into the broader management processes of the organisation. It is QBE’s philosophy to ensure that risk management remains embedded in the business and that the risk makers or risk takers are themselves the risk managers.
Diversification is used as a tool to reduce the Group’s overall insurance risk profile by spreading exposures, thereby reducing the volatility of results. QBE’s approach is to diversify insurance risk, both by product and geographically. Product diversification
is achieved through a strategy of developing strong underwriting skills in a wide variety of classes of business. A combination of core and speciality products under the control of proven employees skilled in such products allows QBE to lead underwrite in many of the markets in which we operate. Geographic diversification is achieved by operating in 48 countries.
QBE has a global risk management framework that defines the risks that QBE is in business to accept and those that we are not, together with the material business risks that QBE needs to manage and the framework and standards of control that are needed to manage those risks.
The foundation of our risk management is the obligation and desire to manage our future and create wealth for our shareholders by maximising profitable opportunities through:
• achieving competitive advantage through better understanding of the risk environment in which we operate;
• optimising risk and more effectively allocating capital and resources by assessing the balance of risk and reward;
• adequate pricing of risk;
• avoiding unwelcome surprises by reducing uncertainty and volatility, such as by controlling aggregate exposures and maintaining sound reinsurance arrangements;
• complying with laws and internal procedures; and
• improving resilience to external events.
The Group has established internal controls to manage material business risks in the key areas of exposure relevant to QBE. The broad risk categories are strategic and business risk, insurance risk, credit risk, market risk, liquidity risk and operational risk. Internal controls and systems are designed to provide reasonable assurance that the assets of the Group are safeguarded, insurance and investment exposures are within desired limits, reinsurance protections are adequate, counterparties are subject to security assessment and foreign exchange exposures are within predetermined guidelines.
The Board approves a comprehensive risk management strategy (RMS) and reinsurance management strategy (REMS) annually, both of which are lodged with APRA. The RMS outlines the principles, framework and approach to risk management adopted by the Group, deals with all areas of significant business risk to the Group and outlines the Group’s risk appetite. The REMS covers topics such as the Group’s strategy in respect of the selection, approval and monitoring of all reinsurance arrangements. The Group’s reinsurance management framework is made up of the Group Reinsurance Forum (determines risk appetite and reinsurance strategy), the Group Security Committee (assesses reinsurer counterparty security), the Group Aggregate Management Committee (monitors aggregate accumulation), the Group Technical Committee (controls the adequacy of reinsurance coverage) and finally the Group Commutations Committee (facilitates Group commutation opportunities). The committees meet regularly throughout the year and report as required to the Group Reinsurance Forum.
While the RMS and REMS are approved by the Board, QBE believes that managing risk is the day to day responsibility of the Group head office and the business units, and that all staff need to understand and actively manage risk. The business units are supported by risk management teams, compliance teams and by senior management. Further information on risk management is provided on pages 66 to 69 of the annual report and in note 5 to the financial statements.
Management has reported to either the former Audit and Risk Committee (and will report to the Risk and Capital Committee or the Board on the effectiveness of QBE’s management of its material business risks.
78 Section 3: Governance
QBE Insurance Group
Annual report 2012
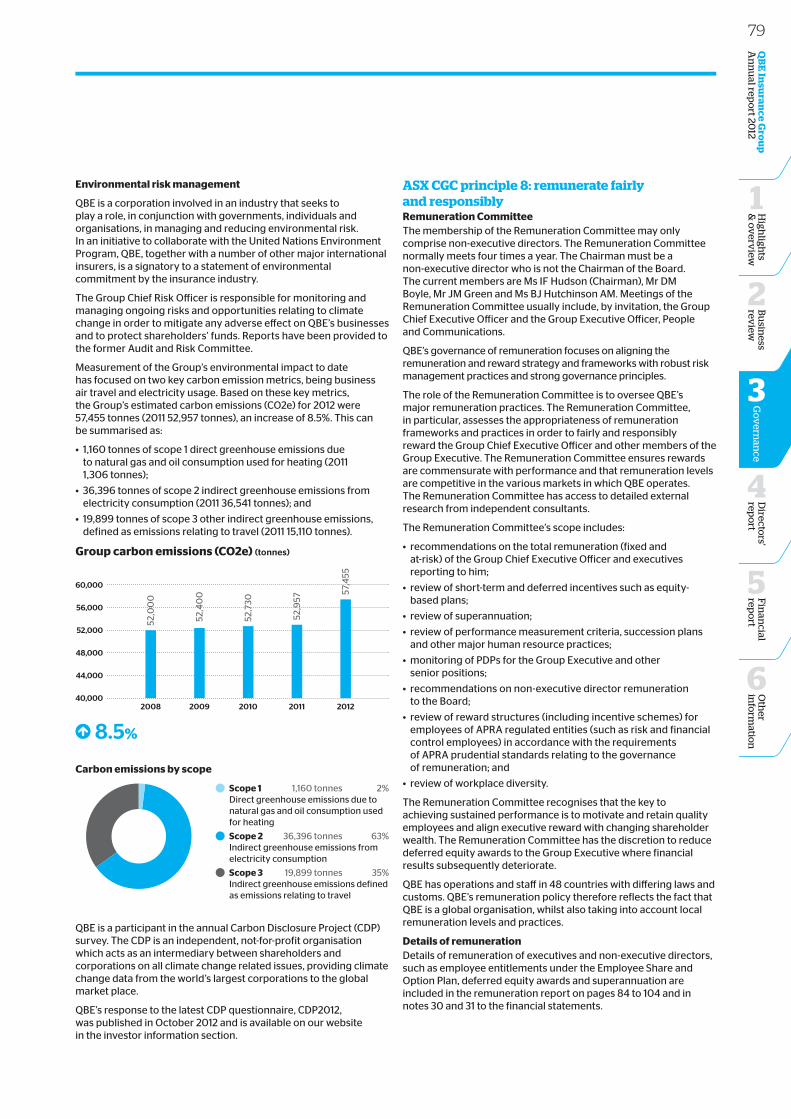
Environmental risk management
QBE is a corporation involved in an industry that seeks to play a role, in conjunction with governments, individuals and organisations, in managing and reducing environmental risk. In an initiative to collaborate with the United Nations Environment Program, QBE, together with a number of other major international insurers, is a signatory to a statement of environmental commitment by the insurance industry.
The Group Chief Risk Officer is responsible for monitoring and managing ongoing risks and opportunities relating to climate change in order to mitigate any adverse effect on QBE’s businesses and to protect shareholders’ funds. Reports have been provided to the former Audit and Risk Committee.
Measurement of the Group’s environmental impact to date has focused on two key carbon emission metrics, being business air travel and electricity usage. Based on these key metrics, the Group’s estimated carbon emissions (CO2e) for 2012 were 57,455 tonnes (2011 52,957 tonnes), an increase of 8.5%. This can be summarised as:
• 1,160 tonnes of scope 1 direct greenhouse emissions due to natural gas and oil consumption used for heating (2011 1,306 tonnes);
• 36,396 tonnes of scope 2 indirect greenhouse emissions from electricity consumption (2011 36,541 tonnes); and
• 19,899 tonnes of scope 3 other indirect greenhouse emissions, defined as emissions relating to travel (2011 15,110 tonnes).
Carbon emissions by scope
Scope 1 1,160 tonnes 2%Direct greenhouse emissions due to natural gas and oil consumption used for heating
Scope 2 36,396 tonnes 63%Indirect greenhouse emissions from electricity consumption
Scope 3 19,899 tonnes 35%Indirect greenhouse emissions defined as emissions relating to travel
Group carbon emissions (CO2e) (tonnes)
52,0
00
52,4
00
52,7
30
52,9
57
57,4
55
2008 2009 2010 2011 201240,000
44,000
48,000
52,000
56,000
60,000
8.5%
QBE is a participant in the annual Carbon Disclosure Project (CDP) survey. The CDP is an independent, not-for-profit organisation which acts as an intermediary between shareholders and corporations on all climate change related issues, providing climate change data from the world’s largest corporations to the global market place.
QBE’s response to the latest CDP questionnaire, CDP2012, was published in October 2012 and is available on our website in the investor information section.
ASX CGC principle 8: remunerate fairly and responsiblyRemuneration CommitteeThe membership of the Remuneration Committee may only comprise non-executive directors. The Remuneration Committee normally meets four times a year. The Chairman must be a non-executive director who is not the Chairman of the Board. The current members are Ms IF Hudson (Chairman), Mr DM Boyle, Mr JM Green and Ms BJ Hutchinson AM. Meetings of the Remuneration Committee usually include, by invitation, the Group Chief Executive Officer and the Group Executive Officer, People and Communications.
QBE’s governance of remuneration focuses on aligning the remuneration and reward strategy and frameworks with robust risk management practices and strong governance principles.
The role of the Remuneration Committee is to oversee QBE’s major remuneration practices. The Remuneration Committee, in particular, assesses the appropriateness of remuneration frameworks and practices in order to fairly and responsibly reward the Group Chief Executive Officer and other members of the Group Executive. The Remuneration Committee ensures rewards are commensurate with performance and that remuneration levels are competitive in the various markets in which QBE operates. The Remuneration Committee has access to detailed external research from independent consultants.
The Remuneration Committee’s scope includes:
• recommendations on the total remuneration (fixed and at-risk) of the Group Chief Executive Officer and executives reporting to him;
• review of short-term and deferred incentives such as equity-based plans;
• review of superannuation;
• review of performance measurement criteria, succession plans and other major human resource practices;
• monitoring of PDPs for the Group Executive and other senior positions;
• recommendations on non-executive director remuneration to the Board;
• review of reward structures (including incentive schemes) for employees of APRA regulated entities (such as risk and financial control employees) in accordance with the requirements of APRA prudential standards relating to the governance of remuneration; and
• review of workplace diversity.
The Remuneration Committee recognises that the key to achieving sustained performance is to motivate and retain quality employees and align executive reward with changing shareholder wealth. The Remuneration Committee has the discretion to reduce deferred equity awards to the Group Executive where financial results subsequently deteriorate.
QBE has operations and staff in 48 countries with differing laws and customs. QBE’s remuneration policy therefore reflects the fact that QBE is a global organisation, whilst also taking into account local remuneration levels and practices.
Details of remunerationDetails of remuneration of executives and non-executive directors, such as employee entitlements under the Employee Share and Option Plan, deferred equity awards and superannuation are included in the remuneration report on pages 84 to 104 and in notes 30 and 31 to the financial statements.
79O
ther
info
rmatio
n
6
Fin
ancial
repo
rt
5
Directo
rs' rep
ort
4
Bu
siness
review
2
Go
vern
ance
3
High
lights
& o
verv
iew
1
QB
E In
suran
ce Gro
up
A
nn
ual rep
ort 20
12
Directors’ report CONTINUED
FOR THE YEAR ENDED 31 DECEMBER 2012Directors’ reportFOR THE YEAR ENDED 31 DECEMBER 2012
Your directors present their report on QBE Insurance Group Limited and the entities it controlled at the end of or during the year ended 31 December 2012.
DirectorsThe following directors held office during the whole of the financial year and up to the date of this report:
DM Boyle JM Green IF Hudson BJ Hutchinson AM (Chairman) CLA Irby IYL Lee
Mr JD Neal was appointed as a director on 17 August 2012.
Mr JA Graf was appointed as a director on 20 August 2012.
Mr FM O’Halloran was a director from the beginning of the financial year until his retirement on 17 August 2012.
Mr LF Bleasel AM was a director from the beginning of the financial year until his retirement on 30 September 2012.
At the 2013 annual general meeting (AGM), Messrs Boyle and Green will retire by rotation and offer themselves for re-election and Mr Graf will offer himself for election.
Details of the directors and their qualifications are provided on pages 70 and 71.
Consolidated results2012
Us$m2011
Us$m
Gross written premium 18,434 18,291Unearned premium movement (93) (451)Gross earned premium revenue 18,341 17,840Outward reinsurance premium (2,360) (2,592)Deferred reinsurance premium movement (183) 111Outward reinsurance premium expense (2,543) (2,481)Net earned premium 15,798 15,359Net claims incurred (10,428) (10,466)Net commission (2,560) (2,291)Underwriting and other expenses (2,357) (2,108)Underwriting result 453 494Net investment income on policyholders’ funds 809 591Insurance profit 1,262 1,085Net investment income on shareholders’ funds 407 185Financing and other costs (324) (275)Share of net profits of associates 3 6Amortisation of intangibles and impairment of goodwill/intangibles (407) (133)Profit before income tax 941 868Income tax expense (161) (149)Profit after income tax 780 719Net profit attributable to non-controlling interests (19) (15)Net profit after income tax 761 704
ProfitNet profit after income tax for the year ended 31 December 2012 was $761 million, up 8% from $704 million last year. The underwriting result decreased by 8%, mainly due to an increase in the commission and expense ratio, which was partly offset by the lower net claims ratio. Net profit after tax benefited from stronger investment income due to an increase in realised and unrealised gains on our fixed interest and equity portfolios. Net profit after tax was impacted by an increase of $274 million in the amortisation and impairment of intangibles following our detailed review of the carrying values of intangible assets at the balance date. Details are provided in note 19 to the financial statements.
DividendsThe directors announce a final dividend of 10 Australian cents per share, down from 25 Australian cents per share last year. The dividend will be franked at 100%. The total dividend payout is A$593 million compared with A$956 million in 2011. The bonus share and dividend reinvestment plans continue with a discount of 1.5%.
80 QBE Insurance Group
Annual report 2012
Section 4: Directors’ report
ActivitiesThe principal activities of QBE during the year were underwriting general insurance and reinsurance risks, management of Lloyd’s syndicates and investment management.
Presentation currencyThe Group has presented this financial report in US dollars, consistent with our reporting in 2011. The US dollar is considered to be more relevant for measuring performance given that over 50% of annualised gross written premium is derived in US dollars.
Operating and financial reviewInformation on the operations (including the results of those operations) and financial position of the Group is set on pages 9 to 63 of this annual report. These pages also deal with the Group’s business strategies and prospects for future financial years.
Further information on the Group’s business strategies and prospects for future financial years has not been included in this annual report because the directors believe it would be likely to result in unreasonable prejudice to the Group.
Outstanding claims provisionThe net central estimate of outstanding claims is determined by the Group Chief Actuary after consultation with internal and external actuaries. The assessment takes into account the statistical analysis of past claims, allowance for claims incurred but not reported, reinsurance and other recoveries, future interest and inflation factors.
As in previous years, the directors consider that substantial risk margins are required over the actuarial central estimate to mitigate the potential for uncertainty in the central estimate. The probability of adequacy of the outstanding claims provision at 31 December 2012 was 87.5% compared with 86.3% last year. The APRA prudential standards provide a capital credit for outstanding claims in excess of a probability of adequacy of 75%.
Group indemnitiesArticle 115 of the company’s constitution provides that the company indemnifies past and present directors, secretaries or other officers against any liability incurred by that person as a director, secretary or other officer of the company or its controlled entities. The indemnity does not apply to any liability (excluding legal costs):
• owed to the company or its controlled entities (e.g. breach of directors’ duties);
• for a pecuniary penalty or compensation order under the Corporations Act 2001; or
• which did not arise out of conduct in good faith.
The indemnity extends to legal costs other than where:
• in civil proceedings, an exclusion above applies;
• in criminal proceedings, the person is found guilty;
• the person is liable for civil remedies in proceedings brought by the Australian Securities and Investments Commission, a corresponding regulator in another jurisdiction or a liquidator (unless as part of the investigation before proceedings are commenced); or
• the court does not grant relief after an application under the Corporations Act 2001 or corresponding legislation in another jurisdiction that the person acted honestly and having regard to all the circumstances ought fairly to be excused for negligence, default, breach of trust or breach of duty in civil proceedings.
During the year, a deed of access and indemnity was entered into with Mr Graf.
Directors’ and officers’ insuranceQBE pays a premium each year in respect of a contract insuring directors, secretaries, senior managers and employees of the Group together with any natural person who is either a trustee or a member of a policy committee for a superannuation plan established for the benefit of the Group’s employees against liabilities past, present or future. The officers of the Group covered by the insurance contract include the directors listed on pages 70 and 71, the secretary, DA Ramsay, and deputy secretary, P Smiles.
In accordance with normal commercial practice, disclosure of the amount of premium payable under, and the nature of liabilities covered by, the insurance contract is prohibited by a confidentiality clause in the contract.
No such insurance cover has been provided for the benefit of any external auditor of the Group.
Significant changesThere were no significant changes in the Group’s state of affairs during the financial year.
Likely developments and expected results of operationsLikely developments in the Group’s operations in future financial years and the expected results of those operations have been included in the review of operations on pages 9 to 63 of this annual report.
Further information on likely developments in the operations of the Group and the expected results of operations has not been included in this annual report because the directors believe it would be likely to result in unreasonable prejudice to the Group.
Environmental regulationThe Group’s operations are not subject to any significant environmental regulations under either Commonwealth, State or Territory legislation.
81O
ther
info
rmatio
n
6
Fin
ancial
repo
rt
5
Bu
siness
review
2
High
lights
& o
verv
iew
1
QB
E In
suran
ce Gro
up
A
nn
ual rep
ort 20
12G
ov
ernan
ce
3
Directo
rs' rep
ort
4
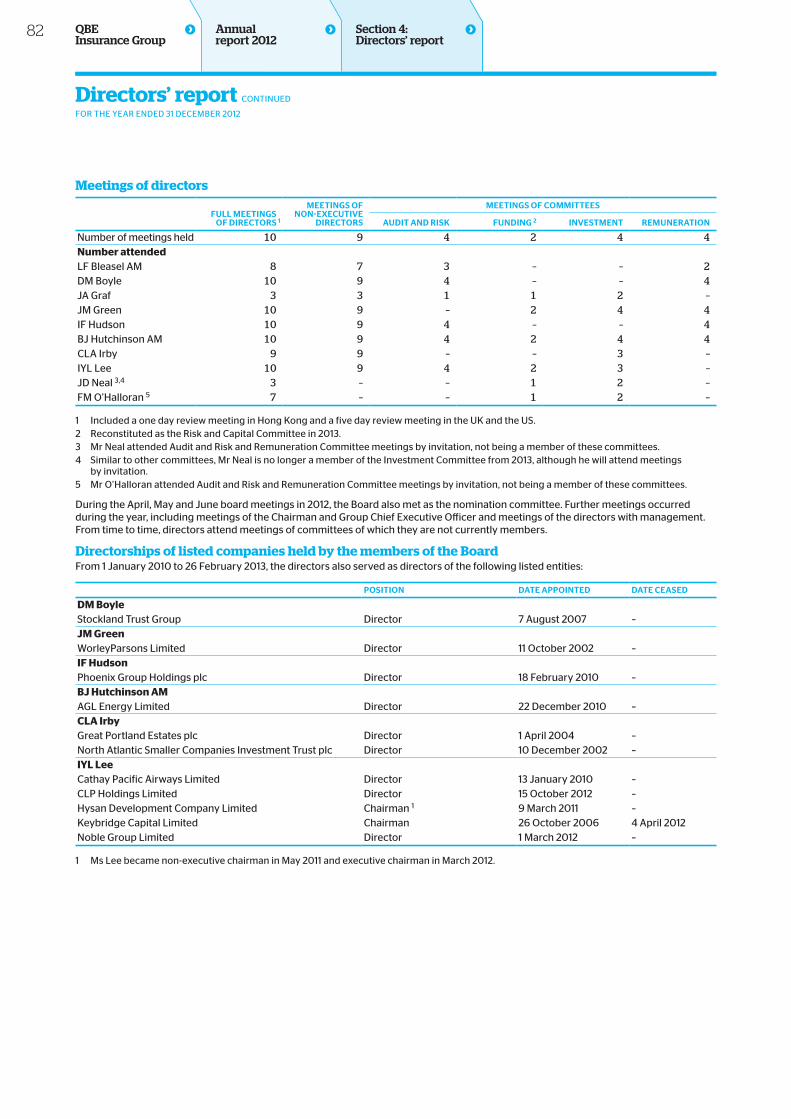
Directors’ report CONTINUED
FOR THE YEAR ENDED 31 DECEMBER 2012
Meetings of directors
FULL meetiNGs oF Directors 1
meetiNGs oFNoN-execUtive
Directors
meetiNGs oF committees
AUDit AND risk FUNDiNG 2 iNvestmeNt remUNerAtioN
Number of meetings held 10 9 4 2 4 4Number attendedLF Bleasel AM 8 7 3 – – 2DM Boyle 10 9 4 – – 4JA Graf 3 3 1 1 2 –JM Green 10 9 – 2 4 4IF Hudson 10 9 4 – – 4BJ Hutchinson AM 10 9 4 2 4 4CLA Irby 9 9 – – 3 –IYL Lee 10 9 4 2 3 –JD Neal 3,4 3 – – 1 2 –FM O’Halloran 5 7 – – 1 2 –
1 Included a one day review meeting in Hong Kong and a five day review meeting in the UK and the US.2 Reconstituted as the Risk and Capital Committee in 2013.3 Mr Neal attended Audit and Risk and Remuneration Committee meetings by invitation, not being a member of these committees.4 Similar to other committees, Mr Neal is no longer a member of the Investment Committee from 2013, although he will attend meetings
by invitation.5 Mr O’Halloran attended Audit and Risk and Remuneration Committee meetings by invitation, not being a member of these committees.
During the April, May and June board meetings in 2012, the Board also met as the nomination committee. Further meetings occurred during the year, including meetings of the Chairman and Group Chief Executive Officer and meetings of the directors with management. From time to time, directors attend meetings of committees of which they are not currently members.
Directorships of listed companies held by the members of the Board From 1 January 2010 to 26 February 2013, the directors also served as directors of the following listed entities:
PositioN DAte APPoiNteD DAte ceAseD
DM BoyleStockland Trust Group Director 7 August 2007 –JM GreenWorleyParsons Limited Director 11 October 2002 –IF HudsonPhoenix Group Holdings plc Director 18 February 2010 –BJ Hutchinson AMAGL Energy Limited Director 22 December 2010 –CLA IrbyGreat Portland Estates plc Director 1 April 2004 –North Atlantic Smaller Companies Investment Trust plc Director 10 December 2002 –IYL LeeCathay Pacific Airways Limited Director 13 January 2010 –CLP Holdings Limited Director 15 October 2012 –Hysan Development Company Limited Chairman 1 9 March 2011 –Keybridge Capital Limited Chairman 26 October 2006 4 April 2012Noble Group Limited Director 1 March 2012 –
1 Ms Lee became non-executive chairman in May 2011 and executive chairman in March 2012.
82 QBE Insurance Group
Annual report 2012
Section 4: Directors’ report
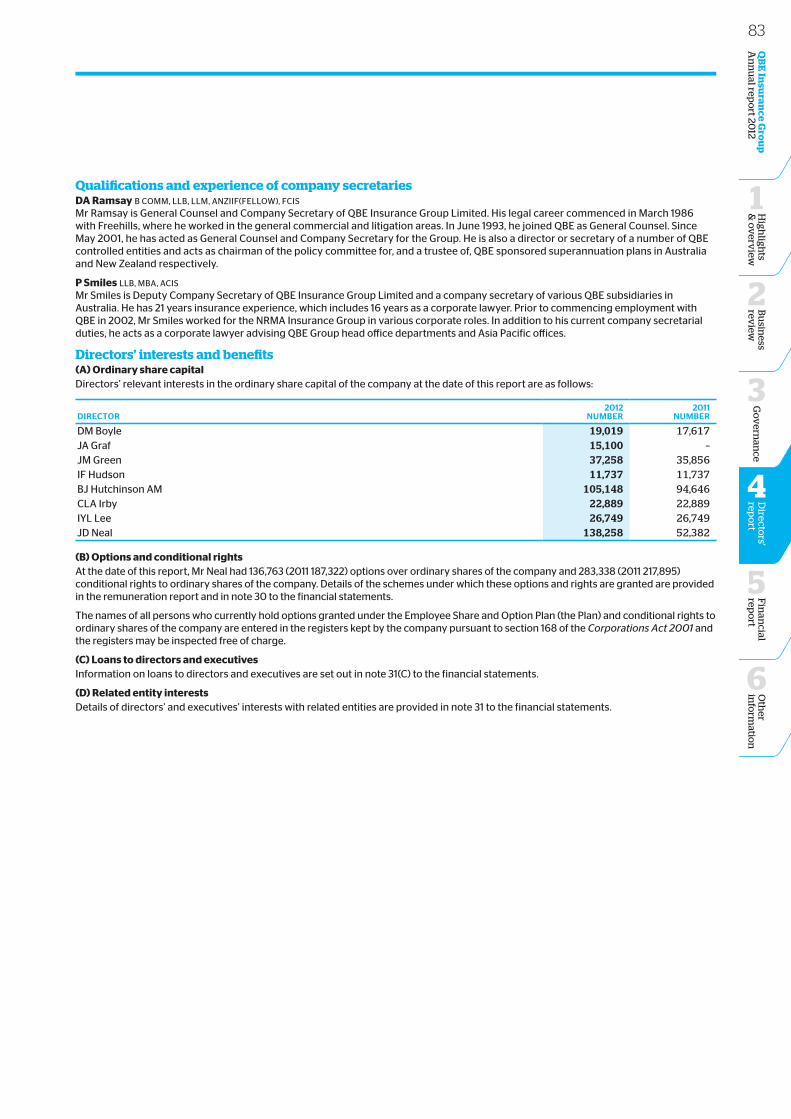
Qualifications and experience of company secretariesDA Ramsay B COMM, LLB, LLM, ANZIIF(FELLOW), FCIS Mr Ramsay is General Counsel and Company Secretary of QBE Insurance Group Limited. His legal career commenced in March 1986 with Freehills, where he worked in the general commercial and litigation areas. In June 1993, he joined QBE as General Counsel. Since May 2001, he has acted as General Counsel and Company Secretary for the Group. He is also a director or secretary of a number of QBE controlled entities and acts as chairman of the policy committee for, and a trustee of, QBE sponsored superannuation plans in Australia and New Zealand respectively.
P Smiles LLB, MBA, ACIS Mr Smiles is Deputy Company Secretary of QBE Insurance Group Limited and a company secretary of various QBE subsidiaries in Australia. He has 21 years insurance experience, which includes 16 years as a corporate lawyer. Prior to commencing employment with QBE in 2002, Mr Smiles worked for the NRMA Insurance Group in various corporate roles. In addition to his current company secretarial duties, he acts as a corporate lawyer advising QBE Group head office departments and Asia Pacific offices.
Directors’ interests and benefits(A) Ordinary share capitalDirectors’ relevant interests in the ordinary share capital of the company at the date of this report are as follows:
Director2012
NUmber2011
NUmber
DM Boyle 19,019 17,617JA Graf 15,100 –JM Green 37,258 35,856IF Hudson 11,737 11,737BJ Hutchinson AM 105,148 94,646CLA Irby 22,889 22,889IYL Lee 26,749 26,749JD Neal 138,258 52,382
(B) Options and conditional rightsAt the date of this report, Mr Neal had 136,763 (2011 187,322) options over ordinary shares of the company and 283,338 (2011 217,895) conditional rights to ordinary shares of the company. Details of the schemes under which these options and rights are granted are provided in the remuneration report and in note 30 to the financial statements.
The names of all persons who currently hold options granted under the Employee Share and Option Plan (the Plan) and conditional rights to ordinary shares of the company are entered in the registers kept by the company pursuant to section 168 of the Corporations Act 2001 and the registers may be inspected free of charge.
(C) Loans to directors and executivesInformation on loans to directors and executives are set out in note 31(C) to the financial statements.
(D) Related entity interestsDetails of directors’ and executives’ interests with related entities are provided in note 31 to the financial statements.
83O
ther
info
rmatio
n
6
Fin
ancial
repo
rt
5
Bu
siness
review
2
High
lights
& o
verv
iew
1
QB
E In
suran
ce Gro
up
A
nn
ual rep
ort 20
12G
ov
ernan
ce
3
Directo
rs' rep
ort
4
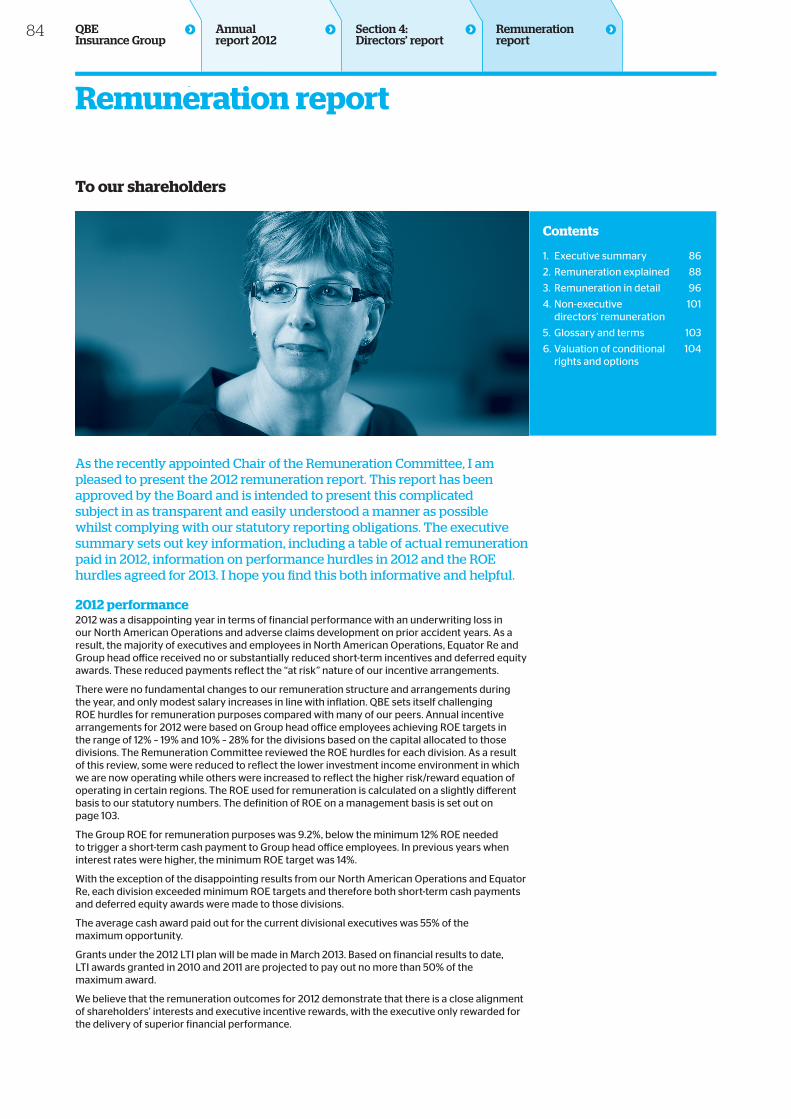
Remuneration report CONTINUED
Contents
1. Executive summary 86
2. Remuneration explained 88
3. Remuneration in detail 96
4. Non-executive directors’ remuneration
101
5. Glossary and terms 103
6. Valuation of conditional rights and options
104
To our shareholders
As the recently appointed Chair of the Remuneration Committee, I am pleased to present the 2012 remuneration report. This report has been approved by the Board and is intended to present this complicated subject in as transparent and easily understood a manner as possible whilst complying with our statutory reporting obligations. The executive summary sets out key information, including a table of actual remuneration paid in 2012, information on performance hurdles in 2012 and the ROE hurdles agreed for 2013. I hope you find this both informative and helpful.
2012 performance2012 was a disappointing year in terms of financial performance with an underwriting loss in our North American Operations and adverse claims development on prior accident years. As a result, the majority of executives and employees in North American Operations, Equator Re and Group head office received no or substantially reduced short-term incentives and deferred equity awards. These reduced payments reflect the “at risk” nature of our incentive arrangements.
There were no fundamental changes to our remuneration structure and arrangements during the year, and only modest salary increases in line with inflation. QBE sets itself challenging ROE hurdles for remuneration purposes compared with many of our peers. Annual incentive arrangements for 2012 were based on Group head office employees achieving ROE targets in the range of 12% – 19% and 10% – 28% for the divisions based on the capital allocated to those divisions. The Remuneration Committee reviewed the ROE hurdles for each division. As a result of this review, some were reduced to reflect the lower investment income environment in which we are now operating while others were increased to reflect the higher risk/reward equation of operating in certain regions. The ROE used for remuneration is calculated on a slightly different basis to our statutory numbers. The definition of ROE on a management basis is set out on page 103.
The Group ROE for remuneration purposes was 9.2%, below the minimum 12% ROE needed to trigger a short-term cash payment to Group head office employees. In previous years when interest rates were higher, the minimum ROE target was 14%.
With the exception of the disappointing results from our North American Operations and Equator Re, each division exceeded minimum ROE targets and therefore both short-term cash payments and deferred equity awards were made to those divisions.
The average cash award paid out for the current divisional executives was 55% of the maximum opportunity.
Grants under the 2012 LTI plan will be made in March 2013. Based on financial results to date, LTI awards granted in 2010 and 2011 are projected to pay out no more than 50% of the maximum award.
We believe that the remuneration outcomes for 2012 demonstrate that there is a close alignment of shareholders’ interests and executive incentive rewards, with the executive only rewarded for the delivery of superior financial performance.
Remuneration report
84 QBE Insurance Group
Section 4: Directors’ report
Annual report 2012
Remuneration report
Arrangements for 2013For 2013, the same remuneration framework will apply as in previous years, although the Group head office ROE hurdle will be reduced to a range of 9% – 16%, consistent with our business plans for 2013. This reflects a variety of market conditions, in particular the significant reduction in investment returns already referred to and which all insurers are experiencing. No changes are being made to divisional ROE targets but there will be a higher allocation of capital to the divisions, reflecting the more onerous regulatory and rating agency capital charges we are experiencing under our risk-based capital allocation model. This will make divisional ROE targets more challenging to achieve.
There are no planned changes to the deferred equity award or LTI plan for 2013.
The fees paid to the Chairman and the non-executive directors for 2013 will not increase. You will see that, at the forthcoming AGM, a resolution is proposed to increase the overall fee cap for the Board from A$2.7 million to A$3.3 million. This is to ensure that the Board has the flexibility to appoint additional non-executive directors during 2013, as appropriate, and to allow for fees to be paid to the new Risk and Capital Committee.
Executives have been awarded either zero (for the Group CEO and the President and Chief Executive Officer, North American Operations) or modest salary increases for 2013. The one exception is the Chief Executive Officer, Latin American Operations whose role has changed significantly as a result of the recent acquisitions in Argentina and Puerto Rico.
Looking beyond 2013, the Remuneration Committee has commissioned a comprehensive review of our remuneration arrangements. The appointment of a new Group CEO and the review of the Group’s strategy make this an opportune time to review remuneration. The objective of this review is not to increase packages but to ensure that at-risk pay operates as intended, motivates our management while supporting our strategy and the creation of shareholder value, and has due regard to regulatory and other market developments.
I look forward to presenting the findings of that review to you in next year’s report.
Change in key management personnelThree executives, including the former Group CEO, Frank O’Halloran, left the Group in 2012. These departures were managed in line with the provisions set out in the relevant executive’s employment contract and current termination benefits legislation in Australia.
We will be seeking shareholder approval at the 2013 AGM for the payment of a retirement allowance of A$2,340,000 gross (equal to one year’s annual fixed remuneration) to Frank O’Halloran, together with the normal resolutions to approve his 2011 and 2012 LTI awards. The retirement allowance is a contractual obligation which has been disclosed previously in annual reports and was also set out in the ASX market release we made last August.
SummaryWe remain confident that our approach to remuneration is in line with our business strategy and aims to ensure that we attract quality executives and adequately reward and incentivise our key personnel. I trust you will agree that the Remuneration Committee has acted responsibly in the steps it has taken on your behalf to align remuneration to the long-term success of all our shareholders.
Isabel Hudson chairman, remuneration committee
We have taken some important steps to improve the transparency of our remuneration arrangements for you, our shareholders. I hope you find this both informative and helpful.
85O
ther
info
rmatio
n
6
Fin
ancial
repo
rt
5
Bu
siness
review
2
High
lights
& o
verv
iew
1
QB
E In
suran
ce Gro
up
A
nn
ual rep
ort 20
12G
ov
ernan
ce
3
Directo
rs' rep
ort
4
Remuneration report CONTINUED
1. Executive summaryIn line with our reporting obligations, this report provides significant detail on the remuneration structures and practices impacting the key management personnel (KMP) of the QBE Insurance Group. In 2012, KMP included the Group CEO, executives and non-executive directors.
QBE’s remuneration strategy is to provide a market competitive remuneration structure that motivates and retains our executives while aligning their remuneration with the creation of sustained shareholder value. Our approach to achieving this is set out in detail in this report which describes the fixed remuneration paid, the short-term cash incentives, the three and five year deferred equity awards and the five year LTI plan. A detailed description of these schemes can be found on page 92.
Changes made to remuneration in 2012QBE’s longstanding ROE-based remuneration structure was maintained in 2012; however, the opportunity was taken to make some changes within this structure.
The Group head office ROE incentive scale for short-term cash payments was adjusted down from a range of 14% – 21% to 12% – 19%. This change was made to reflect a number of factors but, in particular, to reflect the lower investment income environment in which we are now operating.
Over the past four years, we have witnessed a significant reduction in investment yields, particularly for our cash and fixed interest portfolios. The low yields are expected to continue for the immediate future with a significant negative impact on the Group’s reported profit and ROE.
The Remuneration Committee believes that, in the current operating environment, the 12% – 19% ROE scale remained a challenging target for management in 2012, both as an absolute target and relative to our peers.
Divisional ROE target ranges, which are based on allocated capital, remained the same in 2012 with the exception of:
• Australian Operations: maximum ROE target was reduced from 24% to 22% for the same reasons as Group head office.
• Asia Pacific Operations and Latin American Operations: maximum ROE target ranges were increased from 24% to 28% and 26% to 28% respectively to reflect the higher risk of operating in these regions.
Details of the ROE ranges for the divisions can be found on page 92.
Remuneration paid in 2012As is clear elsewhere in this annual report, 2012 was a difficult year and produced a disappointing financial result.
We could highlight many factors which impacted our performance but, in particular, we continued to experience challenging economic conditions which impacted our investment income compared with previous years. We were hit by Superstorm Sandy which cost $335 million and we strengthened our claims provisions by $464 million due to adverse prior year claims development.
Against the background of these challenges, management has continued to focus on the underlying quality of our insurance business.
Short‑term cash incentives and deferred equity awardsThe Group ROE was 9.2%, below the minimum 12% ROE needed to trigger a short-term cash payment to Group head office executives. As a result, and for the second year running, no cash payments under our incentive plans were made for short-term performance to Group head office executives. As the three and five year deferred equity awards are contingent on the payment of a short-term incentive, there were, again for the second year running, no deferred equity awards for Group head office executives.
Each division has its own ROE targets which use a capital allocation based on the requirements for a Standard & Poor’s A+ credit rating. With the exception of North American Operations and Equator Re, each division met or exceeded its minimum ROE target and therefore both short-term cash payments and deferred equity awards will be made. The disappointing outcome in North America resulted in a divisional ROE of 1.9%, well below the threshold of 15%, and no cash or deferred equity awards were made to the President and Chief Executive Officer, North American Operations.
The average cash award paid out for the current divisional CEOs was 55% of the maximum opportunity.
Long‑term incentivesThe five year long-term incentives awarded in 2010 and 2011 are currently projected to pay out no more than 50%. The 50% of the LTI which is based on diluted EPS increasing by a compound average of 7.5% per annum over five years is currently not being achieved; however, the 50% of the LTI award which is based on the Group’s average ROE and COR for five years being in the top 10% of the 50 largest global insurers and reinsurers is being achieved, reflecting the competitive performance of the Group when measured against our peers.
QBE's remuneration strategy is to provide a market competitive remuneration structure that motivates and retains executives while aligning their remuneration with sustained shareholder value.
86 QBE Insurance Group
Section 4: Directors’ report
Annual report 2012
Remuneration report
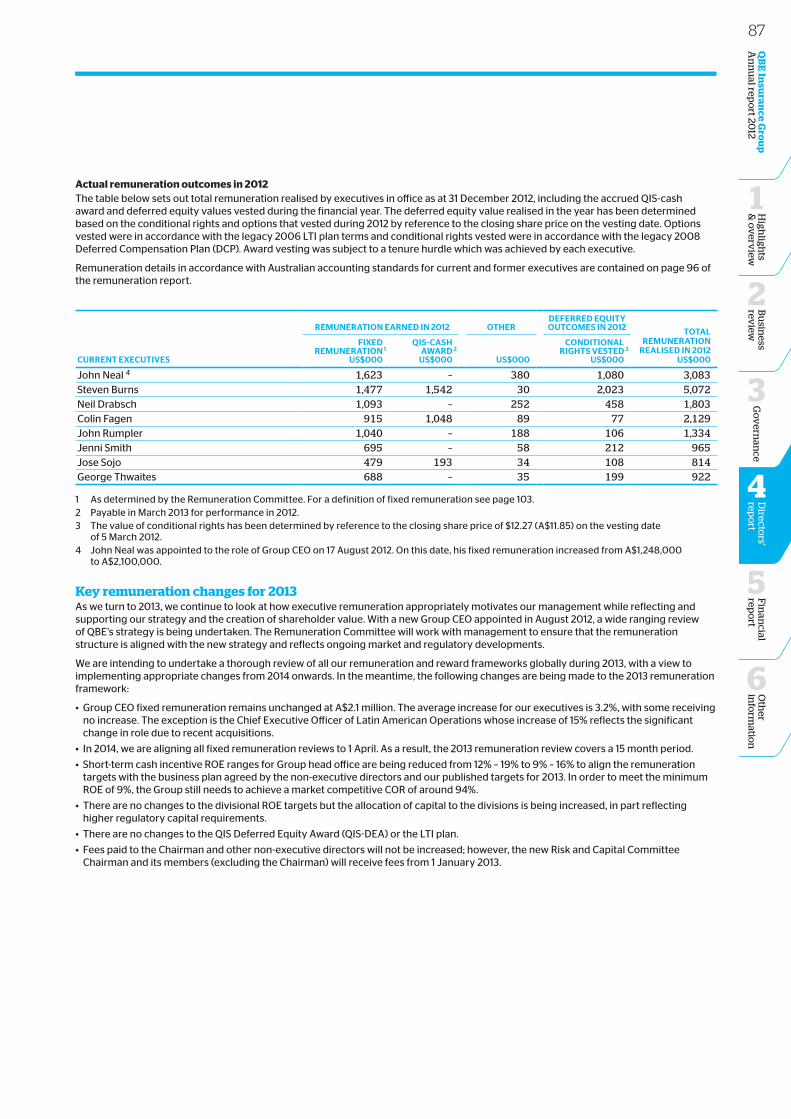
Actual remuneration outcomes in 2012The table below sets out total remuneration realised by executives in office as at 31 December 2012, including the accrued QIS-cash award and deferred equity values vested during the financial year. The deferred equity value realised in the year has been determined based on the conditional rights and options that vested during 2012 by reference to the closing share price on the vesting date. Options vested were in accordance with the legacy 2006 LTI plan terms and conditional rights vested were in accordance with the legacy 2008 Deferred Compensation Plan (DCP). Award vesting was subject to a tenure hurdle which was achieved by each executive.
Remuneration details in accordance with Australian accounting standards for current and former executives are contained on page 96 of the remuneration report.
remUNerAtioN eArNeD iN 2012 otHerDeFerreD eqUity oUtcomes iN 2012 totAL
remUNerAtioNreALiseD iN 2012
Us$000cUrreNt execUtives
FixeD remUNerAtioN 1
Us$000
qis-cAsHAwArD 2
Us$000 Us$000
coNDitioNALriGHts vesteD 3
Us$000
John Neal 4 1,623 – 380 1,080 3,083Steven Burns 1,477 1,542 30 2,023 5,072Neil Drabsch 1,093 – 252 458 1,803Colin Fagen 915 1,048 89 77 2,129John Rumpler 1,040 – 188 106 1,334Jenni Smith 695 – 58 212 965Jose Sojo 479 193 34 108 814George Thwaites 688 – 35 199 922
1 As determined by the Remuneration Committee. For a definition of fixed remuneration see page 103.2 Payable in March 2013 for performance in 2012.3 The value of conditional rights has been determined by reference to the closing share price of $12.27 (A$11.85) on the vesting date
of 5 March 2012.4 John Neal was appointed to the role of Group CEO on 17 August 2012. On this date, his fixed remuneration increased from A$1,248,000
to A$2,100,000.
Key remuneration changes for 2013As we turn to 2013, we continue to look at how executive remuneration appropriately motivates our management while reflecting and supporting our strategy and the creation of shareholder value. With a new Group CEO appointed in August 2012, a wide ranging review of QBE’s strategy is being undertaken. The Remuneration Committee will work with management to ensure that the remuneration structure is aligned with the new strategy and reflects ongoing market and regulatory developments.
We are intending to undertake a thorough review of all our remuneration and reward frameworks globally during 2013, with a view to implementing appropriate changes from 2014 onwards. In the meantime, the following changes are being made to the 2013 remuneration framework:
• Group CEO fixed remuneration remains unchanged at A$2.1 million. The average increase for our executives is 3.2%, with some receiving no increase. The exception is the Chief Executive Officer of Latin American Operations whose increase of 15% reflects the significant change in role due to recent acquisitions.
• In 2014, we are aligning all fixed remuneration reviews to 1 April. As a result, the 2013 remuneration review covers a 15 month period.
• Short-term cash incentive ROE ranges for Group head office are being reduced from 12% – 19% to 9% – 16% to align the remuneration targets with the business plan agreed by the non-executive directors and our published targets for 2013. In order to meet the minimum ROE of 9%, the Group still needs to achieve a market competitive COR of around 94%.
• There are no changes to the divisional ROE targets but the allocation of capital to the divisions is being increased, in part reflecting higher regulatory capital requirements.
• There are no changes to the QIS Deferred Equity Award (QIS-DEA) or the LTI plan.
• Fees paid to the Chairman and other non-executive directors will not be increased; however, the new Risk and Capital Committee Chairman and its members (excluding the Chairman) will receive fees from 1 January 2013.
87O
ther
info
rmatio
n
6
Fin
ancial
repo
rt
5
Bu
siness
review
2
High
lights
& o
verv
iew
1
QB
E In
suran
ce Gro
up
A
nn
ual rep
ort 20
12G
ov
ernan
ce
3
Directo
rs' rep
ort
4
Remuneration report CONTINUED
2. Remuneration explained The information presented in the 2012 remuneration report has been prepared and audited in accordance with the disclosure requirements of the Corporations Act 2001. The report sets out remuneration details of the KMP of QBE Insurance Group. In 2012, KMP included the Group Chief Executive Officer, divisional and head office executives and non-executive directors.
NAme PositioN coUNtry oF resiDeNce term As kmP iN 2012
Current KMP executivesJohn Neal 1 Group Chief Executive Officer Australia 1 January – 31 DecemberSteven Burns Chief Executive Officer, European Operations United Kingdom 1 January – 31 DecemberNeil Drabsch Group Chief Financial Officer Australia 1 January – 31 DecemberColin Fagen Chief Executive Officer,
Australian & New Zealand OperationsAustralia 1 January – 31 December
John Rumpler President and Chief Executive Officer, North American Operations
America 1 January – 31 December
Jenni Smith Group Executive Officer, People and Communications
Australia 1 January – 31 December
Jose Sojo Chief Executive Officer, Latin American Operations Argentina 16 January – 31 DecemberGeorge Thwaites Group Chief Risk Officer Australia 1 January – 31 December
Former KMP executivesGary Brader 2 Group Chief Investment Officer Australia 1 January – 1 May Des Fogarty 2 President, Equator Re Ireland/Bermuda 1 January – 1 MayDuncan Ramsay 2 Group General Counsel and Company Secretary Australia 1 January – 1 May
KMP executives who left during 2012Michael Goodwin 3 Chief Executive Officer, Asia Pacific Operations Singapore 1 January – 27 JulyBlair Nicholls 4 Group Chief Actuarial Officer and
Head of ReinsuranceAustralia 1 January – 1 May
Frank O’Halloran 5 Group Chief Executive Officer Australia 1 January – 17 August
Non‑executive directorsDuncan Boyle Non-executive director Australia 1 January – 31 DecemberJohn Graf 6 Non-executive director America 20 August – 31 DecemberJohn Green Non-executive director Australia 1 January – 31 DecemberIsabel Hudson Non-executive director United Kingdom 1 January – 31 DecemberBelinda Hutchinson AM Chairman, non-executive director Australia 1 January – 31 DecemberCharles Irby Non-executive director United Kingdom 1 January – 31 DecemberIrene Lee Non-executive director Hong Kong 1 January – 31 December
Non‑executive directors who left during 2012Len Bleasel AM 7 Non-executive director Australia 1 January – 30 September
1 John Neal was appointed to the role of Group Chief Executive Officer on 17 August 2012. From 1 January to 16 August 2012, John Neal held the role of Chief Executive Officer, Global Underwriting Operations.
2 Gary Brader, Des Fogarty and Duncan Ramsay ceased being KMP on 1 May 2012 as a result of the Group Executive restructure.3 Michael Goodwin ceased being a KMP on 27 July 2012. His secondment to Singapore was concluded on 27 January 2013.4 Blair Nicholls ceased being a KMP on 1 May 2012. His position was made redundant on 31 October 2012.5 Frank O’Halloran retired from the role of Group Chief Executive Officer on 17 August 2012. In accordance with his notice period,
Frank O’Halloran’s termination was effective 28 August 2012.6 John Graf was appointed to the position of non-executive director on 20 August 2012. 7 Len Bleasel retired from his position of non-executive director on 30 September 2012.
88 QBE Insurance Group
Section 4: Directors’ report
Annual report 2012
Remuneration report
What is the role of the Remuneration Committee?The Remuneration Committee has overall governance responsibility for executive remuneration structures and outcomes to ensure that remuneration frameworks are aligned with robust risk management practices and strong guiding principles. The Remuneration Committee annually reviews the Group remuneration policy to ensure that fixed remuneration is appropriately positioned relative to the market and at-risk rewards remain linked to QBE’s financial targets, investment performance targets and strategic business objectives.
In addition, the Remuneration Committee oversees the remuneration and incentive scheme structures for employees of APRA regulated entities (such as risk and financial control employees) in accordance with its governance prudential standard CPS 510.
The key responsibilities of the Remuneration Committee are summarised below:
• reviewing and recommending for approval to the QBE Group Board:
— remuneration strategy and framework for the executives and non-executive directors
— contractual arrangements for the Group CEO and other executives
— fixed remuneration and at-risk reward for the Group CEO
— Group remuneration policy
• reviewing and approving:
— contractual arrangements for executives not involving remuneration
— executive termination payments
— reward structures and incentive schemes in line with APRA’s prudential standard on remuneration
— major human resources policies relating to incentive schemes, equity schemes and superannuation plans
• overseeing and monitoring:
— the executive succession planning framework
— compliance with statutory remuneration reporting disclosures
Further details on the role and scope of the Remuneration Committee are set out in the QBE Remuneration Committee charter (published on www.qbe.com).
The Committee has overall governance responsibility for executive remuneration structures and outcomes to ensure that remuneration frameworks are aligned with robust risk management practices and strong guiding principles.
89O
ther
info
rmatio
n
6
Fin
ancial
repo
rt
5
Bu
siness
review
2
High
lights
& o
verv
iew
1
QB
E In
suran
ce Gro
up
A
nn
ual rep
ort 20
12G
ov
ernan
ce
3
Directo
rs' rep
ort
4
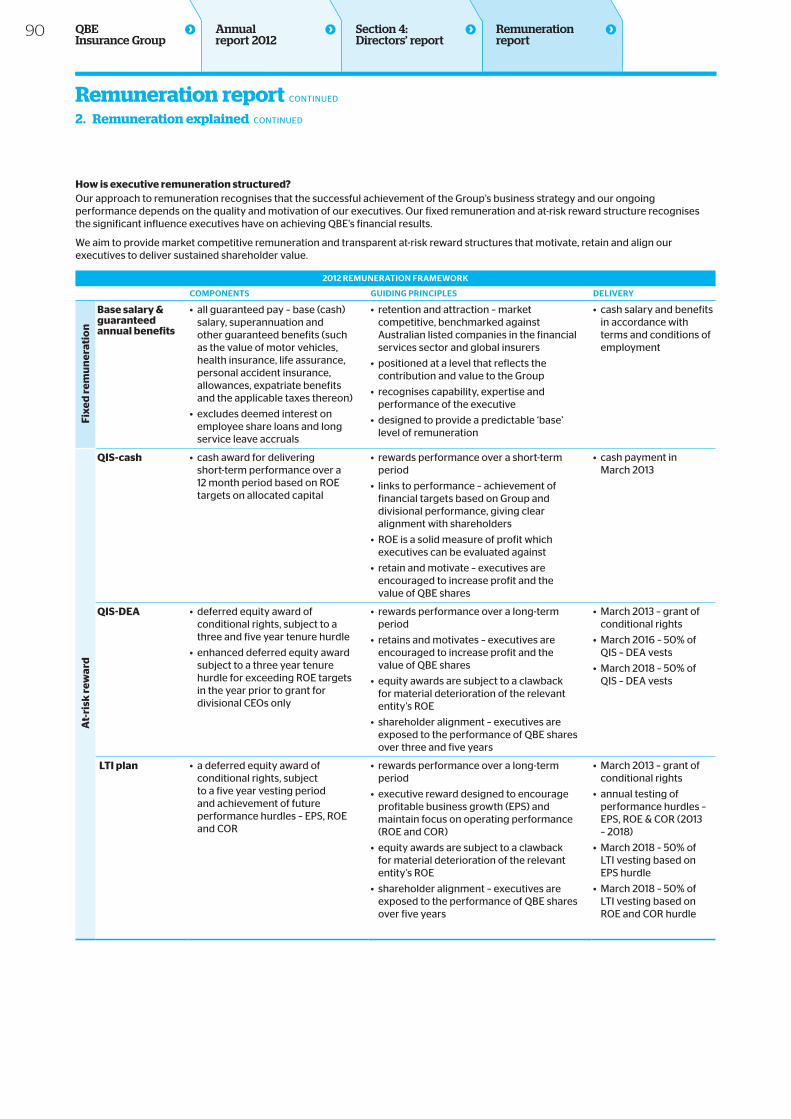
Remuneration report CONTINUEDRemuneration report CONTINUED
2. Remuneration explained CONTINUED
How is executive remuneration structured?Our approach to remuneration recognises that the successful achievement of the Group’s business strategy and our ongoing performance depends on the quality and motivation of our executives. Our fixed remuneration and at-risk reward structure recognises the significant influence executives have on achieving QBE’s financial results.
We aim to provide market competitive remuneration and transparent at-risk reward structures that motivate, retain and align our executives to deliver sustained shareholder value.
2012 remUNerAtioN FrAmework
comPoNeNts GUiDiNG PriNciPLes DeLivery
Fixe
d r
emu
ner
atio
n
Base salary & guaranteed annual benefits
• all guaranteed pay – base (cash) salary, superannuation and other guaranteed benefits (such as the value of motor vehicles, health insurance, life assurance, personal accident insurance, allowances, expatriate benefits and the applicable taxes thereon)
• excludes deemed interest on employee share loans and long service leave accruals
• retention and attraction – market competitive, benchmarked against Australian listed companies in the financial services sector and global insurers
• positioned at a level that reflects the contribution and value to the Group
• recognises capability, expertise and performance of the executive
• designed to provide a predictable ‘base’ level of remuneration
• cash salary and benefits in accordance with terms and conditions of employment
At‑
risk
rew
ard
QIS‑cash • cash award for delivering short-term performance over a 12 month period based on ROE targets on allocated capital
• rewards performance over a short-term period
• links to performance – achievement of financial targets based on Group and divisional performance, giving clear alignment with shareholders
• ROE is a solid measure of profit which executives can be evaluated against
• retain and motivate – executives are encouraged to increase profit and the value of QBE shares
• cash payment in March 2013
QIS-DEA • deferred equity award of conditional rights, subject to a three and five year tenure hurdle
• enhanced deferred equity award subject to a three year tenure hurdle for exceeding ROE targets in the year prior to grant for divisional CEOs only
• rewards performance over a long-term period
• retains and motivates – executives are encouraged to increase profit and the value of QBE shares
• equity awards are subject to a clawback for material deterioration of the relevant entity’s ROE
• shareholder alignment – executives are exposed to the performance of QBE shares over three and five years
• March 2013 – grant of conditional rights
• March 2016 – 50% of QIS – DEA vests
• March 2018 – 50% of QIS – DEA vests
LTI plan • a deferred equity award of conditional rights, subject to a five year vesting period and achievement of future performance hurdles – EPS, ROE and COR
• rewards performance over a long-term period
• executive reward designed to encourage profitable business growth (EPS) and maintain focus on operating performance (ROE and COR)
• equity awards are subject to a clawback for material deterioration of the relevant entity’s ROE
• shareholder alignment – executives are exposed to the performance of QBE shares over five years
• March 2013 – grant of conditional rights
• annual testing of performance hurdles – EPS, ROE & COR (2013 – 2018)
• March 2018 – 50% of LTI vesting based on EPS hurdle
• March 2018 – 50% of LTI vesting based on ROE and COR hurdle
90 QBE Insurance Group
Section 4: Directors’ report
Annual report 2012
Remuneration report
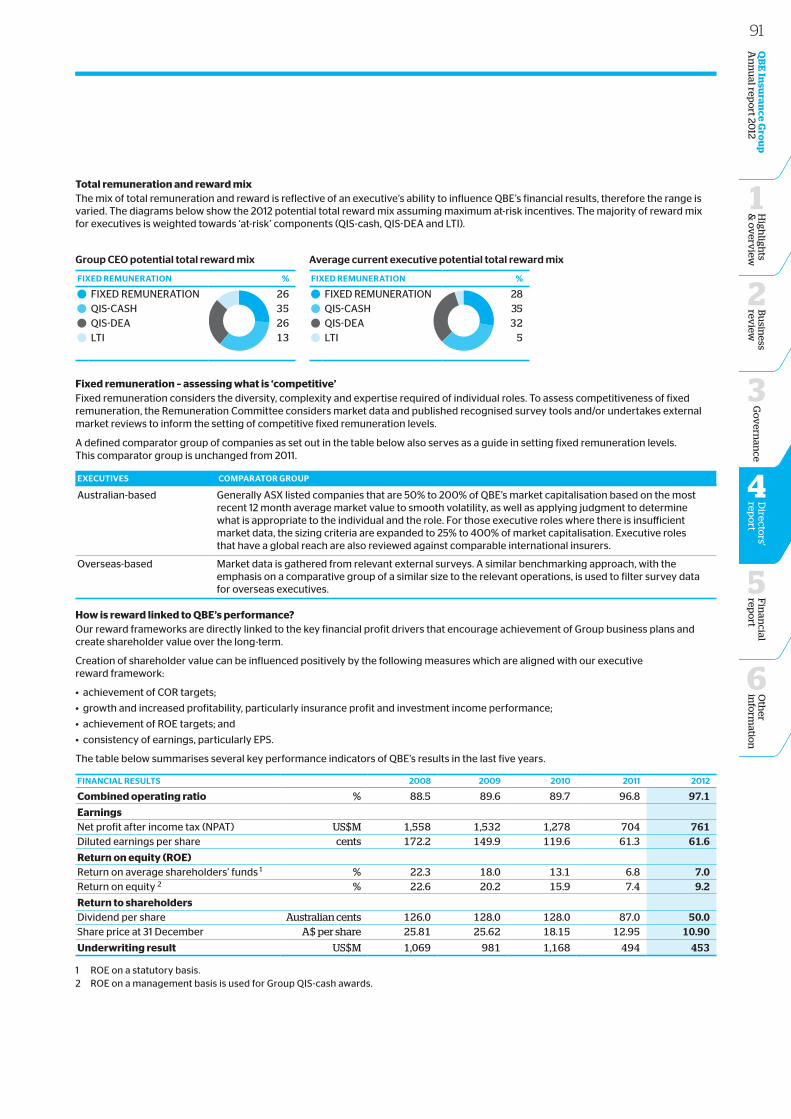
Total remuneration and reward mixThe mix of total remuneration and reward is reflective of an executive’s ability to influence QBE’s financial results, therefore the range is varied. The diagrams below show the 2012 potential total reward mix assuming maximum at-risk incentives. The majority of reward mix for executives is weighted towards ‘at-risk’ components (QIS-cash, QIS-DEA and LTI).
Group ceo potential total reward mix
FixeD remUNerAtioN %
FIXED REMUNERATION 26QIS-CASH 35QIS-DEA 26LTI 13
Average current executive potential total reward mix
FixeD remUNerAtioN %
FIXED REMUNERATION 28QIS-CASH 35QIS-DEA 32LTI 5
Fixed remuneration – assessing what is ‘competitive’Fixed remuneration considers the diversity, complexity and expertise required of individual roles. To assess competitiveness of fixed remuneration, the Remuneration Committee considers market data and published recognised survey tools and/or undertakes external market reviews to inform the setting of competitive fixed remuneration levels.
A defined comparator group of companies as set out in the table below also serves as a guide in setting fixed remuneration levels. This comparator group is unchanged from 2011.
execUtives comPArAtor GroUP
Australian-based Generally ASX listed companies that are 50% to 200% of QBE’s market capitalisation based on the most recent 12 month average market value to smooth volatility, as well as applying judgment to determine what is appropriate to the individual and the role. For those executive roles where there is insufficient market data, the sizing criteria are expanded to 25% to 400% of market capitalisation. Executive roles that have a global reach are also reviewed against comparable international insurers.
Overseas-based Market data is gathered from relevant external surveys. A similar benchmarking approach, with the emphasis on a comparative group of a similar size to the relevant operations, is used to filter survey data for overseas executives.
How is reward linked to QBE’s performance?Our reward frameworks are directly linked to the key financial profit drivers that encourage achievement of Group business plans and create shareholder value over the long-term.
Creation of shareholder value can be influenced positively by the following measures which are aligned with our executive reward framework:
• achievement of COR targets;
• growth and increased profitability, particularly insurance profit and investment income performance;
• achievement of ROE targets; and
• consistency of earnings, particularly EPS.
The table below summarises several key performance indicators of QBE’s results in the last five years.
FiNANciAL resULts 2008 2009 2010 2011 2012
Combined operating ratio % 88.5 89.6 89.7 96.8 97.1
EarningsNet profit after income tax (NPAT) US$M 1,558 1,532 1,278 704 761Diluted earnings per share cents 172.2 149.9 119.6 61.3 61.6
Return on equity (ROE)Return on average shareholders’ funds 1 % 22.3 18.0 13.1 6.8 7.0Return on equity 2 % 22.6 20.2 15.9 7.4 9.2
Return to shareholdersDividend per share Australian cents 126.0 128.0 128.0 87.0 50.0Share price at 31 December A$ per share 25.81 25.62 18.15 12.95 10.90
Underwriting result US$M 1,069 981 1,168 494 453
1 ROE on a statutory basis.2 ROE on a management basis is used for Group QIS-cash awards.
91O
ther
info
rmatio
n
6
Fin
ancial
repo
rt
5
Bu
siness
review
2
High
lights
& o
verv
iew
1
QB
E In
suran
ce Gro
up
A
nn
ual rep
ort 20
12G
ov
ernan
ce
3
Directo
rs' rep
ort
4
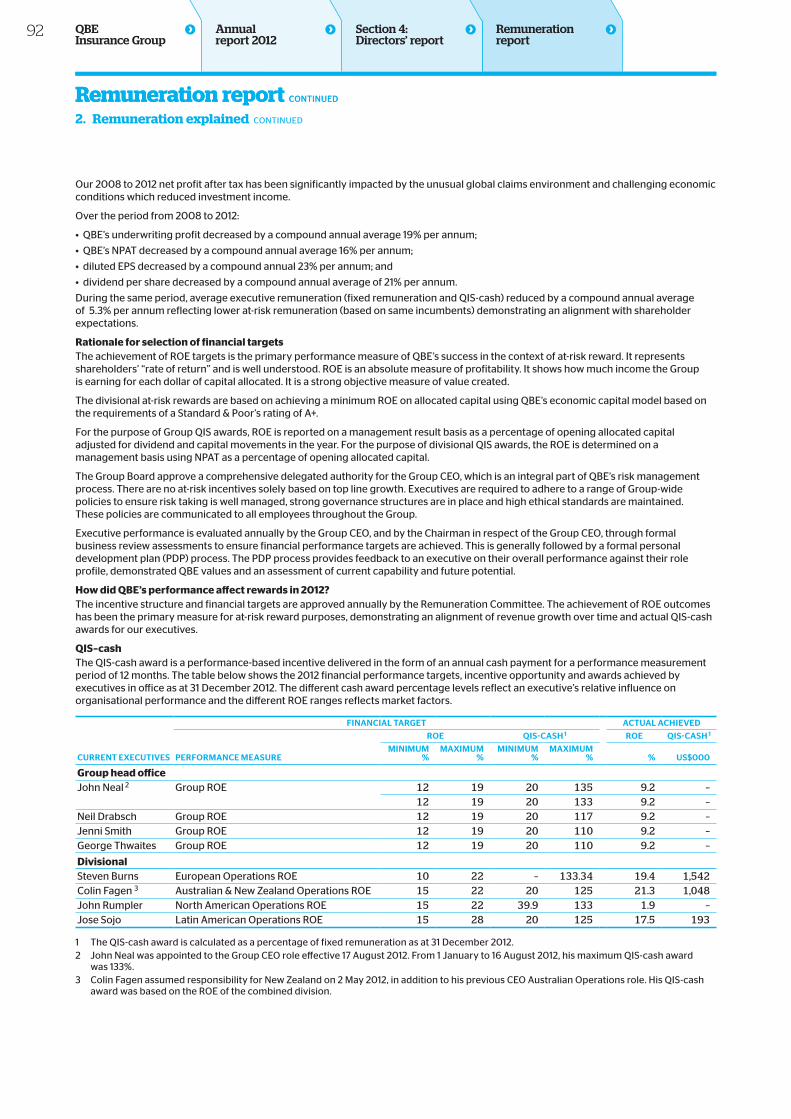
Remuneration report CONTINUEDRemuneration report CONTINUED
2. Remuneration explained CONTINUED
Our 2008 to 2012 net profit after tax has been significantly impacted by the unusual global claims environment and challenging economic conditions which reduced investment income.
Over the period from 2008 to 2012:
• QBE’s underwriting profit decreased by a compound annual average 19% per annum;
• QBE’s NPAT decreased by a compound annual average 16% per annum;
• diluted EPS decreased by a compound annual 23% per annum; and
• dividend per share decreased by a compound annual average of 21% per annum.
During the same period, average executive remuneration (fixed remuneration and QIS-cash) reduced by a compound annual average of 5.3% per annum reflecting lower at-risk remuneration (based on same incumbents) demonstrating an alignment with shareholder expectations.
Rationale for selection of financial targetsThe achievement of ROE targets is the primary performance measure of QBE’s success in the context of at-risk reward. It represents shareholders’ “rate of return” and is well understood. ROE is an absolute measure of profitability. It shows how much income the Group is earning for each dollar of capital allocated. It is a strong objective measure of value created.
The divisional at-risk rewards are based on achieving a minimum ROE on allocated capital using QBE’s economic capital model based on the requirements of a Standard & Poor’s rating of A+.
For the purpose of Group QIS awards, ROE is reported on a management result basis as a percentage of opening allocated capital adjusted for dividend and capital movements in the year. For the purpose of divisional QIS awards, the ROE is determined on a management basis using NPAT as a percentage of opening allocated capital.
The Group Board approve a comprehensive delegated authority for the Group CEO, which is an integral part of QBE’s risk management process. There are no at-risk incentives solely based on top line growth. Executives are required to adhere to a range of Group-wide policies to ensure risk taking is well managed, strong governance structures are in place and high ethical standards are maintained. These policies are communicated to all employees throughout the Group.
Executive performance is evaluated annually by the Group CEO, and by the Chairman in respect of the Group CEO, through formal business review assessments to ensure financial performance targets are achieved. This is generally followed by a formal personal development plan (PDP) process. The PDP process provides feedback to an executive on their overall performance against their role profile, demonstrated QBE values and an assessment of current capability and future potential.
How did QBE’s performance affect rewards in 2012?The incentive structure and financial targets are approved annually by the Remuneration Committee. The achievement of ROE outcomes has been the primary measure for at-risk reward purposes, demonstrating an alignment of revenue growth over time and actual QIS-cash awards for our executives.
QIS–cashThe QIS-cash award is a performance-based incentive delivered in the form of an annual cash payment for a performance measurement period of 12 months. The table below shows the 2012 financial performance targets, incentive opportunity and awards achieved by executives in office as at 31 December 2012. The different cash award percentage levels reflect an executive’s relative influence on organisational performance and the different ROE ranges reflects market factors.
cUrreNt execUtives
FiNANciAL tArGet ActUAL AcHieveD
PerFormANce meAsUre
roe qis-cAsH 1 roe qis-cAsH 1
miNimUm%
mAximUm%
miNimUm%
mAximUm% % Us$000
Group head officeJohn Neal 2 Group ROE 12 19 20 135 9.2 –
12 19 20 133 9.2 –Neil Drabsch Group ROE 12 19 20 117 9.2 –Jenni Smith Group ROE 12 19 20 110 9.2 –George Thwaites Group ROE 12 19 20 110 9.2 –
DivisionalSteven Burns European Operations ROE 10 22 – 133.34 19.4 1,542Colin Fagen 3 Australian & New Zealand Operations ROE 15 22 20 125 21.3 1,048John Rumpler North American Operations ROE 15 22 39.9 133 1.9 –Jose Sojo Latin American Operations ROE 15 28 20 125 17.5 193
1 The QIS-cash award is calculated as a percentage of fixed remuneration as at 31 December 2012.2 John Neal was appointed to the Group CEO role effective 17 August 2012. From 1 January to 16 August 2012, his maximum QIS-cash award
was 133%. 3 Colin Fagen assumed responsibility for New Zealand on 2 May 2012, in addition to his previous CEO Australian Operations role. His QIS-cash
award was based on the ROE of the combined division.
92 QBE Insurance Group
Section 4: Directors’ report
Annual report 2012
Remuneration report
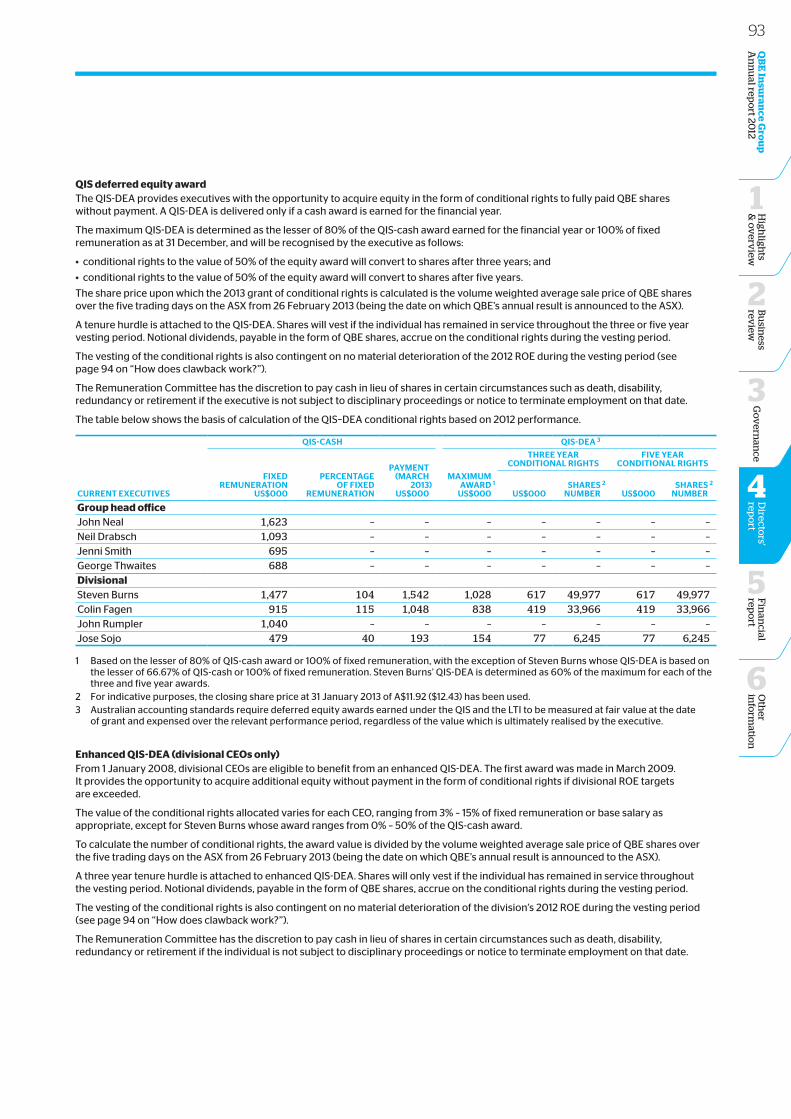
QIS deferred equity awardThe QIS-DEA provides executives with the opportunity to acquire equity in the form of conditional rights to fully paid QBE shares without payment. A QIS-DEA is delivered only if a cash award is earned for the financial year.
The maximum QIS-DEA is determined as the lesser of 80% of the QIS-cash award earned for the financial year or 100% of fixed remuneration as at 31 December, and will be recognised by the executive as follows:
• conditional rights to the value of 50% of the equity award will convert to shares after three years; and
• conditional rights to the value of 50% of the equity award will convert to shares after five years.
The share price upon which the 2013 grant of conditional rights is calculated is the volume weighted average sale price of QBE shares over the five trading days on the ASX from 26 February 2013 (being the date on which QBE’s annual result is announced to the ASX).
A tenure hurdle is attached to the QIS-DEA. Shares will vest if the individual has remained in service throughout the three or five year vesting period. Notional dividends, payable in the form of QBE shares, accrue on the conditional rights during the vesting period.
The vesting of the conditional rights is also contingent on no material deterioration of the 2012 ROE during the vesting period (see page 94 on “How does clawback work?”).
The Remuneration Committee has the discretion to pay cash in lieu of shares in certain circumstances such as death, disability, redundancy or retirement if the executive is not subject to disciplinary proceedings or notice to terminate employment on that date.
The table below shows the basis of calculation of the QIS–DEA conditional rights based on 2012 performance.
cUrreNt execUtives
qis-cAsH qis-DeA 3
FixeD remUNerAtioN
Us$000
PerceNtAGeoF FixeD
remUNerAtioN
PAymeNt (mArcH
2013)Us$000
mAximUmAwArD 1
Us$000
tHree yeAr coNDitioNAL riGHts
Five yeAr coNDitioNAL riGHts
Us$000
sHAres 2
NUmber Us$000sHAres 2
NUmber
Group head officeJohn Neal 1,623 – – – – – – –Neil Drabsch 1,093 – – – – – – –Jenni Smith 695 – – – – – – –George Thwaites 688 – – – – – – –DivisionalSteven Burns 1,477 104 1,542 1,028 617 49,977 617 49,977Colin Fagen 915 115 1,048 838 419 33,966 419 33,966John Rumpler 1,040 – – – – – – –Jose Sojo 479 40 193 154 77 6,245 77 6,245
1 Based on the lesser of 80% of QIS-cash award or 100% of fixed remuneration, with the exception of Steven Burns whose QIS-DEA is based on the lesser of 66.67% of QIS-cash or 100% of fixed remuneration. Steven Burns’ QIS-DEA is determined as 60% of the maximum for each of the three and five year awards.
2 For indicative purposes, the closing share price at 31 January 2013 of A$11.92 ($12.43) has been used.3 Australian accounting standards require deferred equity awards earned under the QIS and the LTI to be measured at fair value at the date
of grant and expensed over the relevant performance period, regardless of the value which is ultimately realised by the executive.
Enhanced QIS-DEA (divisional CEOs only)From 1 January 2008, divisional CEOs are eligible to benefit from an enhanced QIS-DEA. The first award was made in March 2009. It provides the opportunity to acquire additional equity without payment in the form of conditional rights if divisional ROE targets are exceeded.
The value of the conditional rights allocated varies for each CEO, ranging from 3% – 15% of fixed remuneration or base salary as appropriate, except for Steven Burns whose award ranges from 0% – 50% of the QIS-cash award.
To calculate the number of conditional rights, the award value is divided by the volume weighted average sale price of QBE shares over the five trading days on the ASX from 26 February 2013 (being the date on which QBE’s annual result is announced to the ASX).
A three year tenure hurdle is attached to enhanced QIS-DEA. Shares will only vest if the individual has remained in service throughout the vesting period. Notional dividends, payable in the form of QBE shares, accrue on the conditional rights during the vesting period.
The vesting of the conditional rights is also contingent on no material deterioration of the division’s 2012 ROE during the vesting period (see page 94 on “How does clawback work?”).
The Remuneration Committee has the discretion to pay cash in lieu of shares in certain circumstances such as death, disability, redundancy or retirement if the individual is not subject to disciplinary proceedings or notice to terminate employment on that date.
93O
ther
info
rmatio
n
6
Fin
ancial
repo
rt
5
Bu
siness
review
2
High
lights
& o
verv
iew
1
QB
E In
suran
ce Gro
up
A
nn
ual rep
ort 20
12G
ov
ernan
ce
3
Directo
rs' rep
ort
4
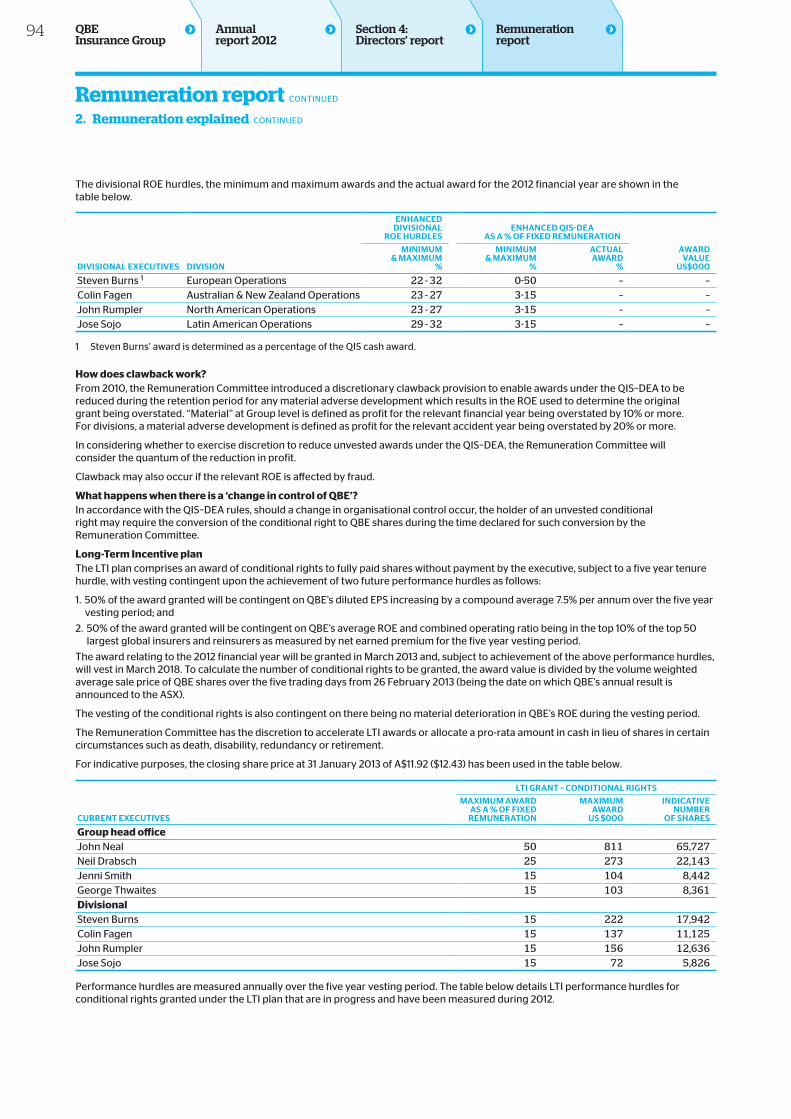
Remuneration report CONTINUEDRemuneration report CONTINUED
2. Remuneration explained CONTINUED
The divisional ROE hurdles, the minimum and maximum awards and the actual award for the 2012 financial year are shown in the table below.
DivisioNAL execUtives DivisioN
eNHANceDDivisioNAL
roe HUrDLeseNHANceD qis-DeA
As A % oF FixeD remUNerAtioN
miNimUm & mAximUm
%
miNimUm & mAximUm
%
ActUAL AwArD
%
AwArD vALUe
Us$000
Steven Burns 1 European Operations 22 - 32 0-50 – –Colin Fagen Australian & New Zealand Operations 23 - 27 3-15 – –John Rumpler North American Operations 23 - 27 3-15 – –Jose Sojo Latin American Operations 29 - 32 3-15 – –
1 Steven Burns’ award is determined as a percentage of the QIS cash award.
How does clawback work?From 2010, the Remuneration Committee introduced a discretionary clawback provision to enable awards under the QIS–DEA to be reduced during the retention period for any material adverse development which results in the ROE used to determine the original grant being overstated. “Material” at Group level is defined as profit for the relevant financial year being overstated by 10% or more. For divisions, a material adverse development is defined as profit for the relevant accident year being overstated by 20% or more.
In considering whether to exercise discretion to reduce unvested awards under the QIS–DEA, the Remuneration Committee will consider the quantum of the reduction in profit.
Clawback may also occur if the relevant ROE is affected by fraud.
What happens when there is a ‘change in control of QBE’?In accordance with the QIS–DEA rules, should a change in organisational control occur, the holder of an unvested conditional right may require the conversion of the conditional right to QBE shares during the time declared for such conversion by the Remuneration Committee.
Long‑Term Incentive planThe LTI plan comprises an award of conditional rights to fully paid shares without payment by the executive, subject to a five year tenure hurdle, with vesting contingent upon the achievement of two future performance hurdles as follows:
1. 50% of the award granted will be contingent on QBE’s diluted EPS increasing by a compound average 7.5% per annum over the five year vesting period; and
2. 50% of the award granted will be contingent on QBE’s average ROE and combined operating ratio being in the top 10% of the top 50 largest global insurers and reinsurers as measured by net earned premium for the five year vesting period.
The award relating to the 2012 financial year will be granted in March 2013 and, subject to achievement of the above performance hurdles, will vest in March 2018. To calculate the number of conditional rights to be granted, the award value is divided by the volume weighted average sale price of QBE shares over the five trading days from 26 February 2013 (being the date on which QBE’s annual result is announced to the ASX).
The vesting of the conditional rights is also contingent on there being no material deterioration in QBE’s ROE during the vesting period.
The Remuneration Committee has the discretion to accelerate LTI awards or allocate a pro-rata amount in cash in lieu of shares in certain circumstances such as death, disability, redundancy or retirement.
For indicative purposes, the closing share price at 31 January 2013 of A$11.92 ($12.43) has been used in the table below.
cUrreNt execUtives
Lti GrANt – coNDitioNAL riGHts
mAximUm AwArD As A % oF FixeD
remUNerAtioN
mAximUm AwArD
Us $000
iNDicAtiveNUmber
oF sHAres
Group head officeJohn Neal 50 811 65,727Neil Drabsch 25 273 22,143Jenni Smith 15 104 8,442George Thwaites 15 103 8,361DivisionalSteven Burns 15 222 17,942Colin Fagen 15 137 11,125John Rumpler 15 156 12,636Jose Sojo 15 72 5,826
Performance hurdles are measured annually over the five year vesting period. The table below details LTI performance hurdles for conditional rights granted under the LTI plan that are in progress and have been measured during 2012.
94 QBE Insurance Group
Section 4: Directors’ report
Annual report 2012
Remuneration report
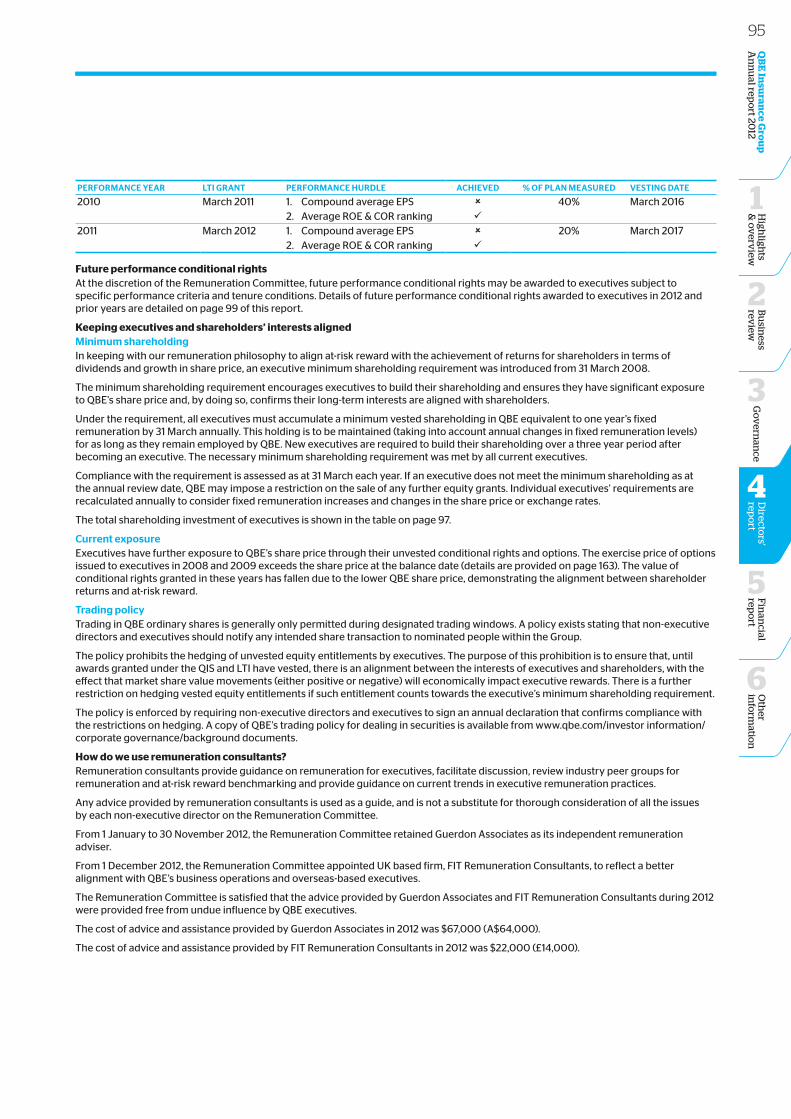
PerFormANce yeAr Lti GrANt PerFormANce HUrDLe AcHieveD % oF PLAN meAsUreD vestiNG DAte
2010 March 2011 1. Compound average EPS û 40% March 20162. Average ROE & COR ranking ü
2011 March 2012 1. Compound average EPS û 20% March 20172. Average ROE & COR ranking ü
Future performance conditional rightsAt the discretion of the Remuneration Committee, future performance conditional rights may be awarded to executives subject to specific performance criteria and tenure conditions. Details of future performance conditional rights awarded to executives in 2012 and prior years are detailed on page 99 of this report.
Keeping executives and shareholders’ interests alignedminimum shareholdingIn keeping with our remuneration philosophy to align at-risk reward with the achievement of returns for shareholders in terms of dividends and growth in share price, an executive minimum shareholding requirement was introduced from 31 March 2008.
The minimum shareholding requirement encourages executives to build their shareholding and ensures they have significant exposure to QBE’s share price and, by doing so, confirms their long-term interests are aligned with shareholders.
Under the requirement, all executives must accumulate a minimum vested shareholding in QBE equivalent to one year’s fixed remuneration by 31 March annually. This holding is to be maintained (taking into account annual changes in fixed remuneration levels) for as long as they remain employed by QBE. New executives are required to build their shareholding over a three year period after becoming an executive. The necessary minimum shareholding requirement was met by all current executives.
Compliance with the requirement is assessed as at 31 March each year. If an executive does not meet the minimum shareholding as at the annual review date, QBE may impose a restriction on the sale of any further equity grants. Individual executives’ requirements are recalculated annually to consider fixed remuneration increases and changes in the share price or exchange rates.
The total shareholding investment of executives is shown in the table on page 97.
current exposureExecutives have further exposure to QBE’s share price through their unvested conditional rights and options. The exercise price of options issued to executives in 2008 and 2009 exceeds the share price at the balance date (details are provided on page 163). The value of conditional rights granted in these years has fallen due to the lower QBE share price, demonstrating the alignment between shareholder returns and at-risk reward.
trading policyTrading in QBE ordinary shares is generally only permitted during designated trading windows. A policy exists stating that non-executive directors and executives should notify any intended share transaction to nominated people within the Group.
The policy prohibits the hedging of unvested equity entitlements by executives. The purpose of this prohibition is to ensure that, until awards granted under the QIS and LTI have vested, there is an alignment between the interests of executives and shareholders, with the effect that market share value movements (either positive or negative) will economically impact executive rewards. There is a further restriction on hedging vested equity entitlements if such entitlement counts towards the executive’s minimum shareholding requirement.
The policy is enforced by requiring non-executive directors and executives to sign an annual declaration that confirms compliance with the restrictions on hedging. A copy of QBE’s trading policy for dealing in securities is available from www.qbe.com/investor information/corporate governance/background documents.
How do we use remuneration consultants?Remuneration consultants provide guidance on remuneration for executives, facilitate discussion, review industry peer groups for remuneration and at-risk reward benchmarking and provide guidance on current trends in executive remuneration practices.
Any advice provided by remuneration consultants is used as a guide, and is not a substitute for thorough consideration of all the issues by each non-executive director on the Remuneration Committee.
From 1 January to 30 November 2012, the Remuneration Committee retained Guerdon Associates as its independent remuneration adviser.
From 1 December 2012, the Remuneration Committee appointed UK based firm, FIT Remuneration Consultants, to reflect a better alignment with QBE’s business operations and overseas-based executives.
The Remuneration Committee is satisfied that the advice provided by Guerdon Associates and FIT Remuneration Consultants during 2012 were provided free from undue influence by QBE executives.
The cost of advice and assistance provided by Guerdon Associates in 2012 was $67,000 (A$64,000).
The cost of advice and assistance provided by FIT Remuneration Consultants in 2012 was $22,000 (£14,000).
95O
ther
info
rmatio
n
6
Fin
ancial
repo
rt
5
Bu
siness
review
2
High
lights
& o
verv
iew
1
QB
E In
suran
ce Gro
up
A
nn
ual rep
ort 20
12G
ov
ernan
ce
3
Directo
rs' rep
ort
4
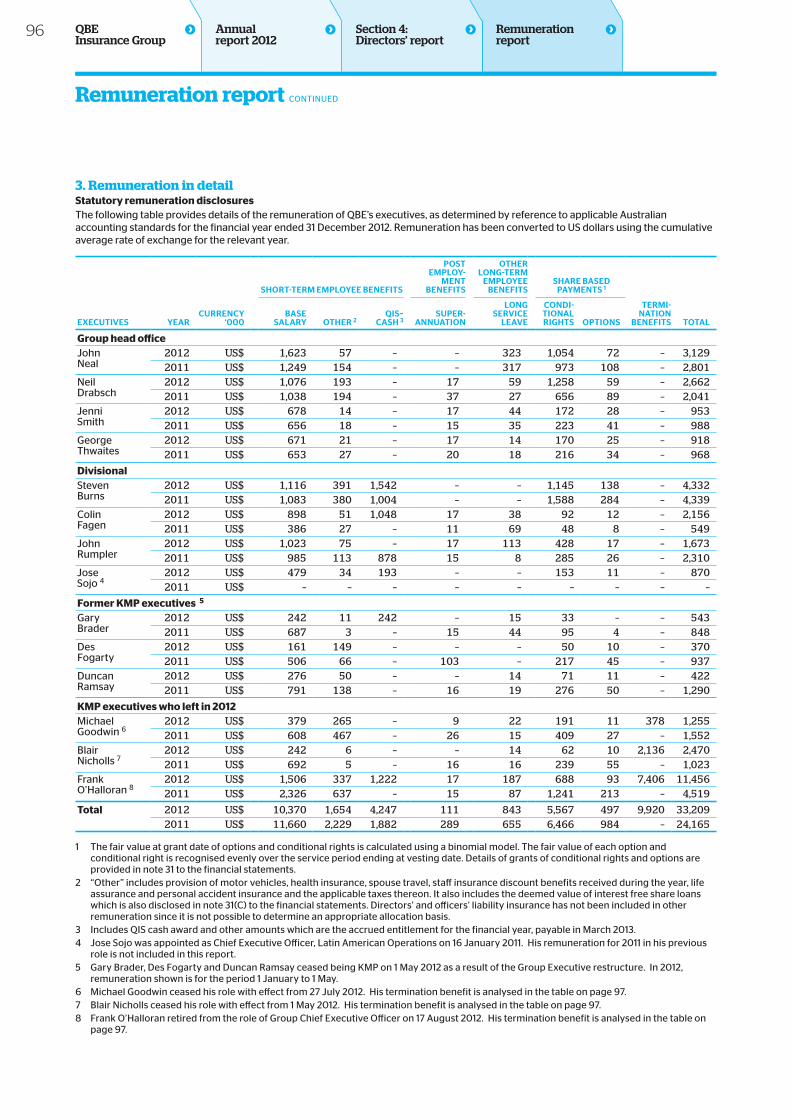
Remuneration report CONTINUEDRemuneration report CONTINUED
3. Remuneration in detail Statutory remuneration disclosuresThe following table provides details of the remuneration of QBE’s executives, as determined by reference to applicable Australian accounting standards for the financial year ended 31 December 2012. Remuneration has been converted to US dollars using the cumulative average rate of exchange for the relevant year.
execUtives yeArcUrreNcy
‘000
sHort-term emPLoyee beNeFits
Post emPLoy-
meNt beNeFits
otHer LoNG-term
emPLoyee beNeFits
sHAre bAseD PAymeNts 1
termi-NAtioN
beNeFits totALbAse
sALAry otHer 2qis–
cAsH 3sUPer-
ANNUAtioN
LoNG service
LeAve
coNDi-tioNAL riGHts oPtioNs
Group head officeJohn Neal
2012 US$ 1,623 57 – – 323 1,054 72 – 3,1292011 US$ 1,249 154 – – 317 973 108 – 2,801
Neil Drabsch
2012 US$ 1,076 193 – 17 59 1,258 59 – 2,6622011 US$ 1,038 194 – 37 27 656 89 – 2,041
Jenni Smith
2012 US$ 678 14 – 17 44 172 28 – 9532011 US$ 656 18 – 15 35 223 41 – 988
George Thwaites
2012 US$ 671 21 – 17 14 170 25 – 9182011 US$ 653 27 – 20 18 216 34 – 968
DivisionalSteven Burns
2012 US$ 1,116 391 1,542 – – 1,145 138 – 4,3322011 US$ 1,083 380 1,004 – – 1,588 284 – 4,339
Colin Fagen
2012 US$ 898 51 1,048 17 38 92 12 – 2,1562011 US$ 386 27 – 11 69 48 8 – 549
John Rumpler
2012 US$ 1,023 75 – 17 113 428 17 – 1,6732011 US$ 985 113 878 15 8 285 26 – 2,310
Jose Sojo 4
2012 US$ 479 34 193 – – 153 11 – 8702011 US$ – – – – – – – – –
Former KMP executives 5
Gary Brader
2012 US$ 242 11 242 – 15 33 – – 5432011 US$ 687 3 – 15 44 95 4 – 848
Des Fogarty
2012 US$ 161 149 – – – 50 10 – 3702011 US$ 506 66 – 103 – 217 45 – 937
Duncan Ramsay
2012 US$ 276 50 – – 14 71 11 – 4222011 US$ 791 138 – 16 19 276 50 – 1,290
KMP executives who left in 2012Michael Goodwin 6
2012 US$ 379 265 – 9 22 191 11 378 1,2552011 US$ 608 467 – 26 15 409 27 – 1,552
Blair Nicholls 7
2012 US$ 242 6 – – 14 62 10 2,136 2,4702011 US$ 692 5 – 16 16 239 55 – 1,023
Frank O’Halloran 8
2012 US$ 1,506 337 1,222 17 187 688 93 7,406 11,4562011 US$ 2,326 637 – 15 87 1,241 213 – 4,519
Total 2012 US$ 10,370 1,654 4,247 111 843 5,567 497 9,920 33,2092011 US$ 11,660 2,229 1,882 289 655 6,466 984 – 24,165
1 The fair value at grant date of options and conditional rights is calculated using a binomial model. The fair value of each option and conditional right is recognised evenly over the service period ending at vesting date. Details of grants of conditional rights and options are provided in note 31 to the financial statements.
2 “Other” includes provision of motor vehicles, health insurance, spouse travel, staff insurance discount benefits received during the year, life assurance and personal accident insurance and the applicable taxes thereon. It also includes the deemed value of interest free share loans which is also disclosed in note 31(C) to the financial statements. Directors’ and officers’ liability insurance has not been included in other remuneration since it is not possible to determine an appropriate allocation basis.
3 Includes QIS cash award and other amounts which are the accrued entitlement for the financial year, payable in March 2013. 4 Jose Sojo was appointed as Chief Executive Officer, Latin American Operations on 16 January 2011. His remuneration for 2011 in his previous
role is not included in this report.5 Gary Brader, Des Fogarty and Duncan Ramsay ceased being KMP on 1 May 2012 as a result of the Group Executive restructure. In 2012,
remuneration shown is for the period 1 January to 1 May.6 Michael Goodwin ceased his role with effect from 27 July 2012. His termination benefit is analysed in the table on page 97.7 Blair Nicholls ceased his role with effect from 1 May 2012. His termination benefit is analysed in the table on page 97.8 Frank O’Halloran retired from the role of Group Chief Executive Officer on 17 August 2012. His termination benefit is analysed in the table on
page 97.
96 QBE Insurance Group
Section 4: Directors’ report
Annual report 2012
Remuneration report
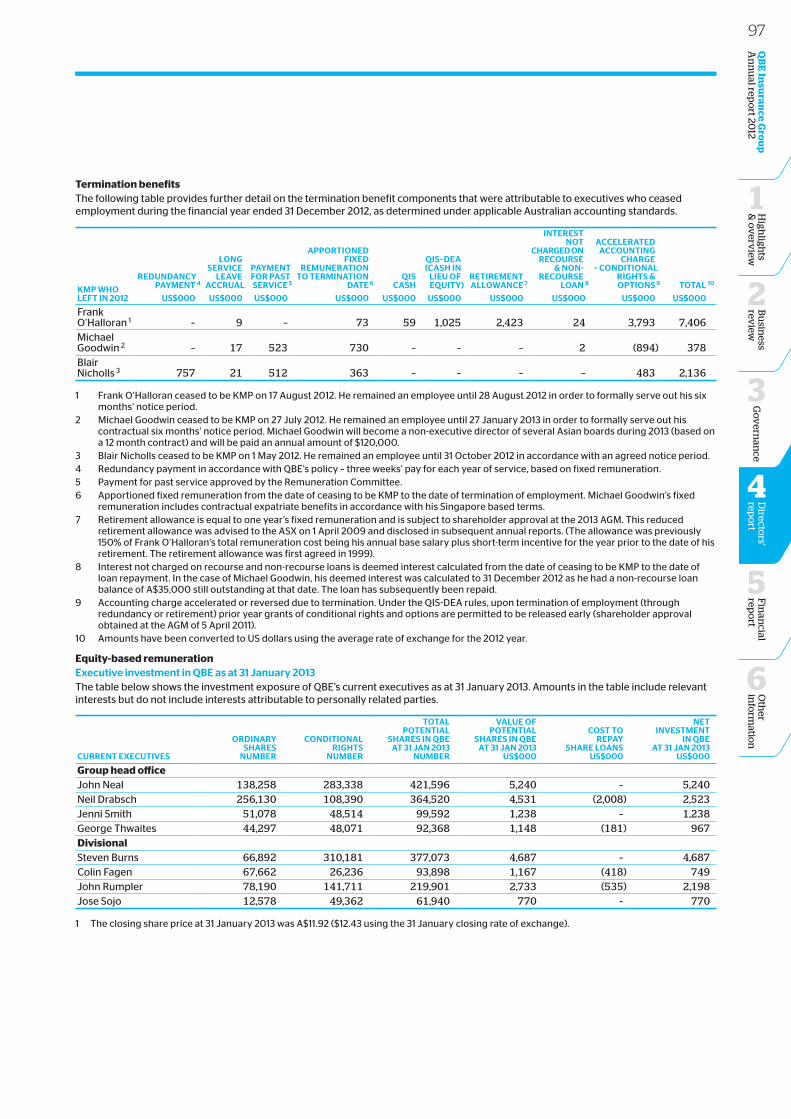
Termination benefitsThe following table provides further detail on the termination benefit components that were attributable to executives who ceased employment during the financial year ended 31 December 2012, as determined under applicable Australian accounting standards.
kmP wHo LeFt iN 2012
reDUNDANcyPAymeNt 4
LoNG service
LeAveAccrUAL
PAymeNt For PAstservice 5
APPortioNeDFixeD
remUNerAtioN to termiNAtioN
DAte 6qis
cAsH
qis–DeA (cAsH iN
LieU oFeqUity)
retiremeNtALLowANce 7
iNterest Not
cHArGeD oN recoUrse
& NoN-recoUrse
LoAN 8
AcceLerAteDAccoUNtiNG
cHArGe– coNDitioNAL
riGHts &oPtioNs 9 totAL 10
Us$000 Us$000 Us$000 Us$000 Us$000 Us$000 Us$000 Us$000 Us$000 Us$000
Frank O’Halloran 1 – 9 – 73 59 1,025 2,423 24 3,793 7,406Michael Goodwin 2 – 17 523 730 – – – 2 (894) 378Blair Nicholls 3 757 21 512 363 – – – – 483 2,136
1 Frank O’Halloran ceased to be KMP on 17 August 2012. He remained an employee until 28 August 2012 in order to formally serve out his six months’ notice period.
2 Michael Goodwin ceased to be KMP on 27 July 2012. He remained an employee until 27 January 2013 in order to formally serve out his contractual six months’ notice period. Michael Goodwin will become a non-executive director of several Asian boards during 2013 (based on a 12 month contract) and will be paid an annual amount of $120,000.
3 Blair Nicholls ceased to be KMP on 1 May 2012. He remained an employee until 31 October 2012 in accordance with an agreed notice period. 4 Redundancy payment in accordance with QBE’s policy – three weeks’ pay for each year of service, based on fixed remuneration.5 Payment for past service approved by the Remuneration Committee. 6 Apportioned fixed remuneration from the date of ceasing to be KMP to the date of termination of employment. Michael Goodwin’s fixed
remuneration includes contractual expatriate benefits in accordance with his Singapore based terms.7 Retirement allowance is equal to one year’s fixed remuneration and is subject to shareholder approval at the 2013 AGM. This reduced
retirement allowance was advised to the ASX on 1 April 2009 and disclosed in subsequent annual reports. (The allowance was previously 150% of Frank O’Halloran’s total remuneration cost being his annual base salary plus short-term incentive for the year prior to the date of his retirement. The retirement allowance was first agreed in 1999).
8 Interest not charged on recourse and non-recourse loans is deemed interest calculated from the date of ceasing to be KMP to the date of loan repayment. In the case of Michael Goodwin, his deemed interest was calculated to 31 December 2012 as he had a non-recourse loan balance of A$35,000 still outstanding at that date. The loan has subsequently been repaid.
9 Accounting charge accelerated or reversed due to termination. Under the QIS-DEA rules, upon termination of employment (through redundancy or retirement) prior year grants of conditional rights and options are permitted to be released early (shareholder approval obtained at the AGM of 5 April 2011).
10 Amounts have been converted to US dollars using the average rate of exchange for the 2012 year.
Equity‑based remunerationexecutive investment in qbe as at 31 january 2013The table below shows the investment exposure of QBE’s current executives as at 31 January 2013. Amounts in the table include relevant interests but do not include interests attributable to personally related parties.
cUrreNt execUtives
orDiNAry sHAres
NUmber
coNDitioNAL riGHts
NUmber
totAL PoteNtiAL
sHAres iN qbe At 31 jAN 2013
NUmber
vALUe oF PoteNtiAL
sHAres iN qbe At 31 jAN 2013
Us$000
cost to rePAy
sHAre LoANsUs$000
Net iNvestmeNt
iN qbe At 31 jAN 2013
Us$000
Group head officeJohn Neal 138,258 283,338 421,596 5,240 – 5,240Neil Drabsch 256,130 108,390 364,520 4,531 (2,008) 2,523Jenni Smith 51,078 48,514 99,592 1,238 – 1,238George Thwaites 44,297 48,071 92,368 1,148 (181) 967DivisionalSteven Burns 66,892 310,181 377,073 4,687 – 4,687Colin Fagen 67,662 26,236 93,898 1,167 (418) 749John Rumpler 78,190 141,711 219,901 2,733 (535) 2,198Jose Sojo 12,578 49,362 61,940 770 – 770
1 The closing share price at 31 January 2013 was A$11.92 ($12.43 using the 31 January closing rate of exchange).
97O
ther
info
rmatio
n
6
Fin
ancial
repo
rt
5
Bu
siness
review
2
High
lights
& o
verv
iew
1
QB
E In
suran
ce Gro
up
A
nn
ual rep
ort 20
12G
ov
ernan
ce
3
Directo
rs' rep
ort
4
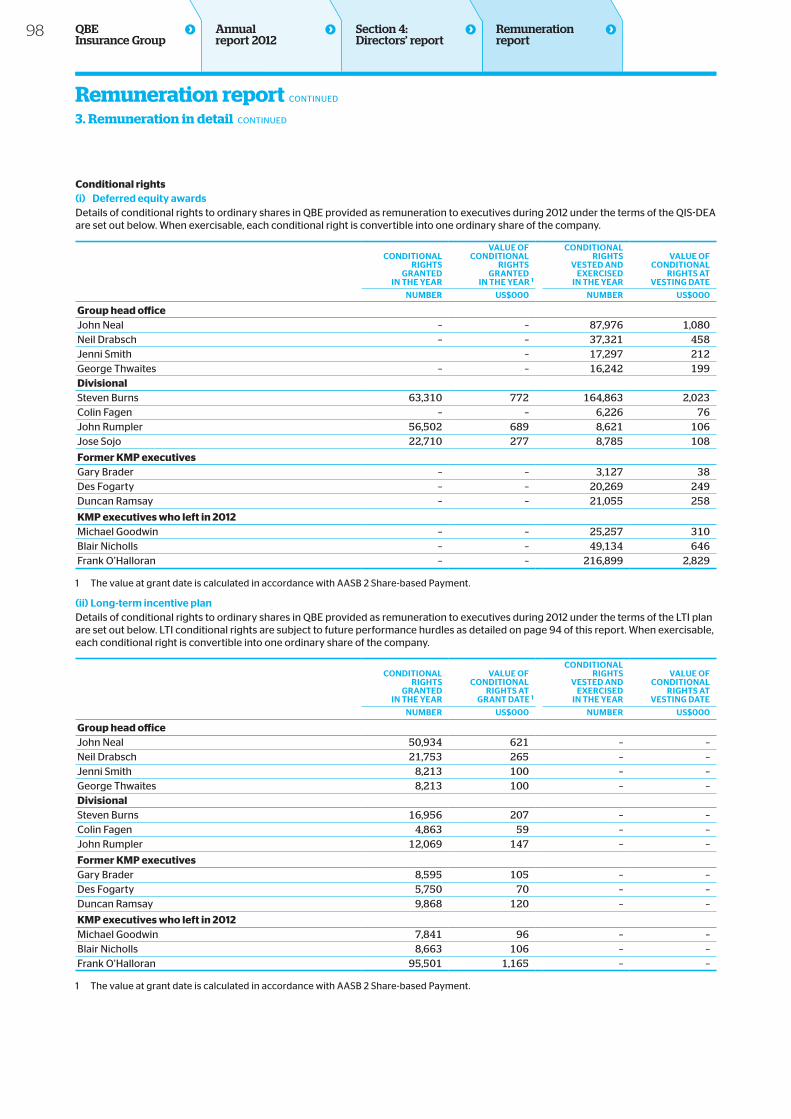
Remuneration report CONTINUEDRemuneration report CONTINUED
3. Remuneration in detail CONTINUED
Conditional rights(i) Deferred equity awardsDetails of conditional rights to ordinary shares in QBE provided as remuneration to executives during 2012 under the terms of the QIS-DEA are set out below. When exercisable, each conditional right is convertible into one ordinary share of the company.
coNDitioNAL riGHts
GrANteD iN tHe yeAr
vALUe oF coNDitioNAL
riGHts GrANteD
iN tHe yeAr 1
coNDitioNAL riGHts
vesteD ANDexerciseD
iN tHe yeAr
vALUe oFcoNDitioNAL
riGHts At vestiNG DAte
NUmber Us$000 NUmber Us$000
Group head officeJohn Neal – – 87,976 1,080 Neil Drabsch – – 37,321 458 Jenni Smith – 17,297 212 George Thwaites – – 16,242 199 DivisionalSteven Burns 63,310 772 164,863 2,023 Colin Fagen – – 6,226 76 John Rumpler 56,502 689 8,621 106 Jose Sojo 22,710 277 8,785 108
Former KMP executivesGary Brader – – 3,127 38 Des Fogarty – – 20,269 249 Duncan Ramsay – – 21,055 258
KMP executives who left in 2012Michael Goodwin – – 25,257 310 Blair Nicholls – – 49,134 646 Frank O’Halloran – – 216,899 2,829
1 The value at grant date is calculated in accordance with AASB 2 Share-based Payment.
(ii) Long-term incentive planDetails of conditional rights to ordinary shares in QBE provided as remuneration to executives during 2012 under the terms of the LTI plan are set out below. LTI conditional rights are subject to future performance hurdles as detailed on page 94 of this report. When exercisable, each conditional right is convertible into one ordinary share of the company.
coNDitioNAL riGHts
GrANteD iN tHe yeAr
vALUe oF coNDitioNAL
riGHts At GrANt DAte 1
coNDitioNAL riGHts
vesteD AND exerciseD
iN tHe yeAr
vALUe oF coNDitioNAL
riGHts At vestiNG DAte
NUmber Us$000 NUmber Us$000
Group head officeJohn Neal 50,934 621 – –Neil Drabsch 21,753 265 – –Jenni Smith 8,213 100 – –George Thwaites 8,213 100 – –DivisionalSteven Burns 16,956 207 – –Colin Fagen 4,863 59 – –John Rumpler 12,069 147 – –
Former KMP executivesGary Brader 8,595 105 – –Des Fogarty 5,750 70 – –Duncan Ramsay 9,868 120 – –
KMP executives who left in 2012Michael Goodwin 7,841 96 – –Blair Nicholls 8,663 106 – –Frank O’Halloran 95,501 1,165 – –
1 The value at grant date is calculated in accordance with AASB 2 Share-based Payment.
98 QBE Insurance Group
Section 4: Directors’ report
Annual report 2012
Remuneration report
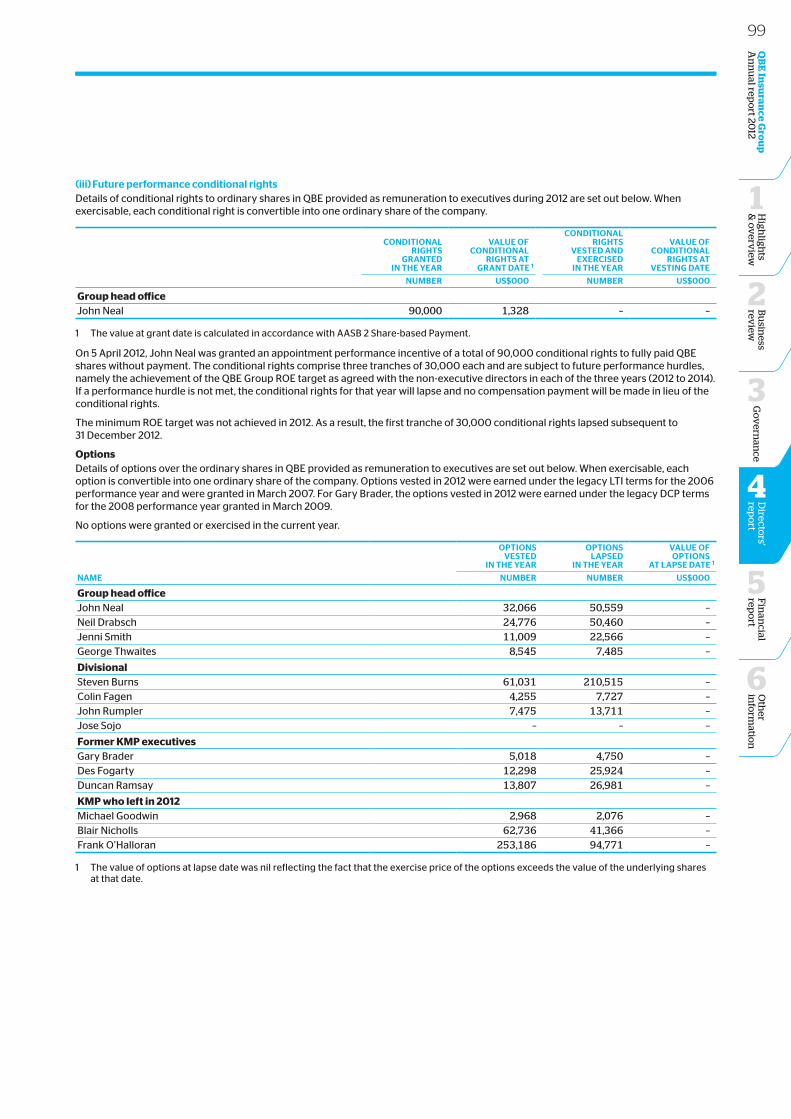
(iii) Future performance conditional rightsDetails of conditional rights to ordinary shares in QBE provided as remuneration to executives during 2012 are set out below. When exercisable, each conditional right is convertible into one ordinary share of the company.
coNDitioNALriGHts
GrANteD iN tHe yeAr
vALUe oFcoNDitioNAL
riGHts At GrANt DAte 1
coNDitioNALriGHts
vesteD ANDexerciseD
iN tHe yeAr
vALUe oFcoNDitioNAL
riGHts At vestiNG DAte
NUmber Us$000 NUmber Us$000
Group head officeJohn Neal 90,000 1,328 – –
1 The value at grant date is calculated in accordance with AASB 2 Share-based Payment.
On 5 April 2012, John Neal was granted an appointment performance incentive of a total of 90,000 conditional rights to fully paid QBE shares without payment. The conditional rights comprise three tranches of 30,000 each and are subject to future performance hurdles, namely the achievement of the QBE Group ROE target as agreed with the non-executive directors in each of the three years (2012 to 2014). If a performance hurdle is not met, the conditional rights for that year will lapse and no compensation payment will be made in lieu of the conditional rights.
The minimum ROE target was not achieved in 2012. As a result, the first tranche of 30,000 conditional rights lapsed subsequent to 31 December 2012.
OptionsDetails of options over the ordinary shares in QBE provided as remuneration to executives are set out below. When exercisable, each option is convertible into one ordinary share of the company. Options vested in 2012 were earned under the legacy LTI terms for the 2006 performance year and were granted in March 2007. For Gary Brader, the options vested in 2012 were earned under the legacy DCP terms for the 2008 performance year granted in March 2009.
No options were granted or exercised in the current year.
NAme
oPtioNs vesteD
iN tHe yeAr
oPtioNs LAPseD
iN tHe yeAr
vALUe oF oPtioNs
At LAPse DAte 1
NUmber NUmber Us$000
Group head officeJohn Neal 32,066 50,559 –Neil Drabsch 24,776 50,460 –Jenni Smith 11,009 22,566 –George Thwaites 8,545 7,485 –
DivisionalSteven Burns 61,031 210,515 –Colin Fagen 4,255 7,727 –John Rumpler 7,475 13,711 –Jose Sojo – – –
Former KMP executivesGary Brader 5,018 4,750 –Des Fogarty 12,298 25,924 –Duncan Ramsay 13,807 26,981 –
KMP who left in 2012Michael Goodwin 2,968 2,076 –Blair Nicholls 62,736 41,366 –Frank O’Halloran 253,186 94,771 –
1 The value of options at lapse date was nil reflecting the fact that the exercise price of the options exceeds the value of the underlying shares at that date.
99O
ther
info
rmatio
n
6
Fin
ancial
repo
rt
5
Bu
siness
review
2
High
lights
& o
verv
iew
1
QB
E In
suran
ce Gro
up
A
nn
ual rep
ort 20
12G
ov
ernan
ce
3
Directo
rs' rep
ort
4
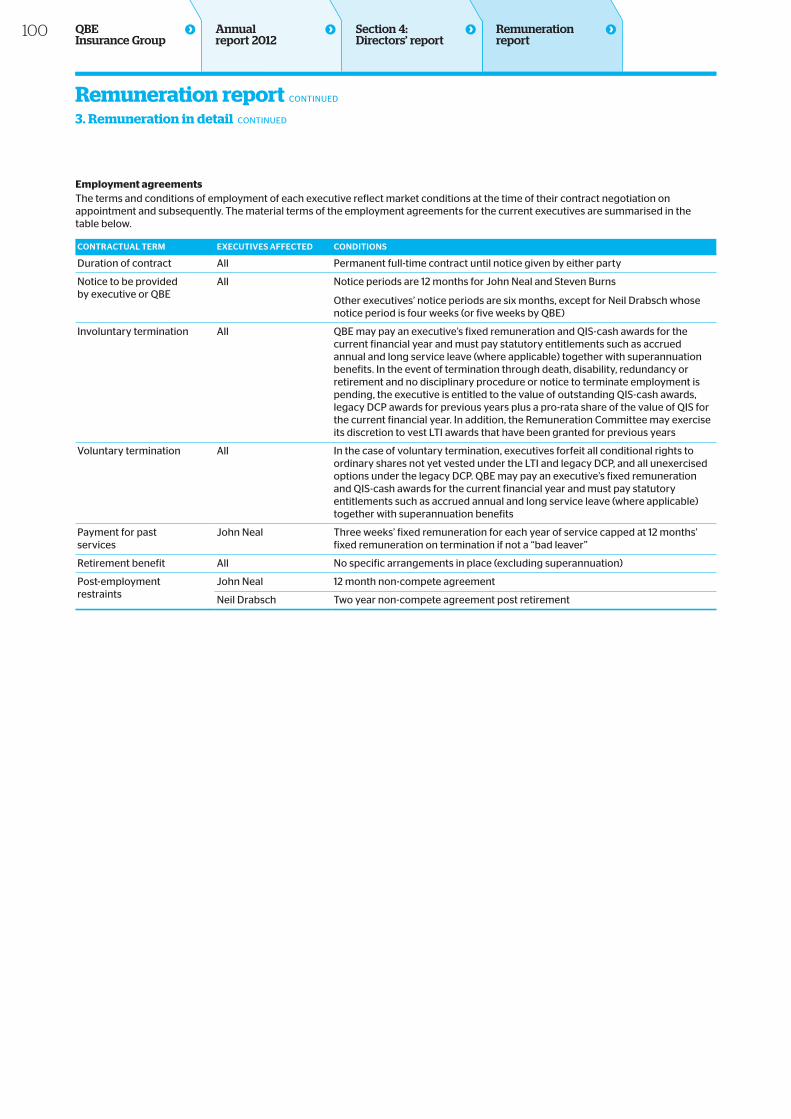
Remuneration report CONTINUEDRemuneration report CONTINUED
3. Remuneration in detail CONTINUED
Employment agreementsThe terms and conditions of employment of each executive reflect market conditions at the time of their contract negotiation on appointment and subsequently. The material terms of the employment agreements for the current executives are summarised in the table below.
coNtrActUAL term execUtives AFFecteD coNDitioNs
Duration of contract All Permanent full-time contract until notice given by either party
Notice to be provided by executive or QBE
All Notice periods are 12 months for John Neal and Steven Burns
Other executives’ notice periods are six months, except for Neil Drabsch whose notice period is four weeks (or five weeks by QBE)
Involuntary termination All QBE may pay an executive’s fixed remuneration and QIS-cash awards for the current financial year and must pay statutory entitlements such as accrued annual and long service leave (where applicable) together with superannuation benefits. In the event of termination through death, disability, redundancy or retirement and no disciplinary procedure or notice to terminate employment is pending, the executive is entitled to the value of outstanding QIS-cash awards, legacy DCP awards for previous years plus a pro-rata share of the value of QIS for the current financial year. In addition, the Remuneration Committee may exercise its discretion to vest LTI awards that have been granted for previous years
Voluntary termination All In the case of voluntary termination, executives forfeit all conditional rights to ordinary shares not yet vested under the LTI and legacy DCP, and all unexercised options under the legacy DCP. QBE may pay an executive’s fixed remuneration and QIS-cash awards for the current financial year and must pay statutory entitlements such as accrued annual and long service leave (where applicable) together with superannuation benefits
Payment for past services
John Neal Three weeks’ fixed remuneration for each year of service capped at 12 months’ fixed remuneration on termination if not a “bad leaver”
Retirement benefit All No specific arrangements in place (excluding superannuation)
Post-employment restraints
John Neal 12 month non-compete agreement
Neil Drabsch Two year non-compete agreement post retirement
100 QBE Insurance Group
Section 4: Directors’ report
Annual report 2012
Remuneration report
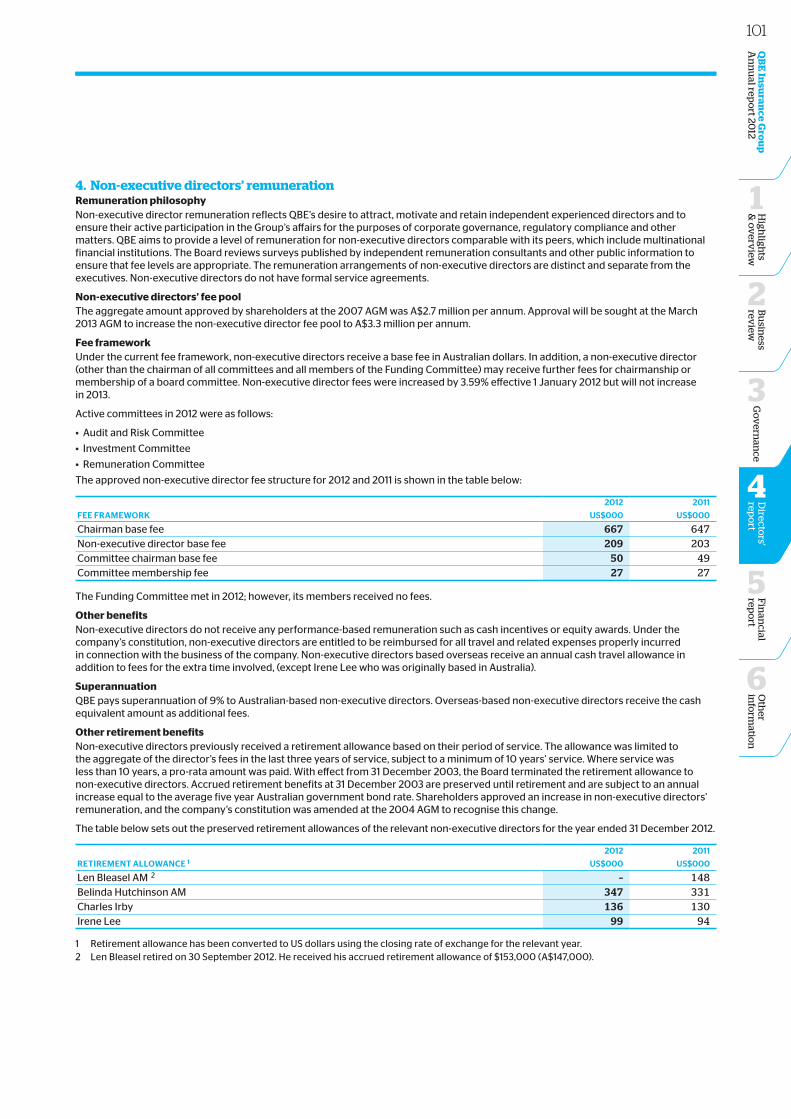
4. Non-executive directors’ remunerationRemuneration philosophy Non-executive director remuneration reflects QBE’s desire to attract, motivate and retain independent experienced directors and to ensure their active participation in the Group’s affairs for the purposes of corporate governance, regulatory compliance and other matters. QBE aims to provide a level of remuneration for non-executive directors comparable with its peers, which include multinational financial institutions. The Board reviews surveys published by independent remuneration consultants and other public information to ensure that fee levels are appropriate. The remuneration arrangements of non-executive directors are distinct and separate from the executives. Non-executive directors do not have formal service agreements.
Non‑executive directors’ fee poolThe aggregate amount approved by shareholders at the 2007 AGM was A$2.7 million per annum. Approval will be sought at the March 2013 AGM to increase the non-executive director fee pool to A$3.3 million per annum.
Fee frameworkUnder the current fee framework, non-executive directors receive a base fee in Australian dollars. In addition, a non-executive director (other than the chairman of all committees and all members of the Funding Committee) may receive further fees for chairmanship or membership of a board committee. Non-executive director fees were increased by 3.59% effective 1 January 2012 but will not increase in 2013.
Active committees in 2012 were as follows:
• Audit and Risk Committee
• Investment Committee
• Remuneration Committee
The approved non-executive director fee structure for 2012 and 2011 is shown in the table below:
Fee FrAmework
2012 2011
Us$000 Us$000
Chairman base fee 667 647Non-executive director base fee 209 203Committee chairman base fee 50 49Committee membership fee 27 27
The Funding Committee met in 2012; however, its members received no fees.
Other benefitsNon-executive directors do not receive any performance-based remuneration such as cash incentives or equity awards. Under the company’s constitution, non-executive directors are entitled to be reimbursed for all travel and related expenses properly incurred in connection with the business of the company. Non-executive directors based overseas receive an annual cash travel allowance in addition to fees for the extra time involved, (except Irene Lee who was originally based in Australia).
SuperannuationQBE pays superannuation of 9% to Australian-based non-executive directors. Overseas-based non-executive directors receive the cash equivalent amount as additional fees.
Other retirement benefitsNon-executive directors previously received a retirement allowance based on their period of service. The allowance was limited to the aggregate of the director’s fees in the last three years of service, subject to a minimum of 10 years’ service. Where service was less than 10 years, a pro-rata amount was paid. With effect from 31 December 2003, the Board terminated the retirement allowance to non-executive directors. Accrued retirement benefits at 31 December 2003 are preserved until retirement and are subject to an annual increase equal to the average five year Australian government bond rate. Shareholders approved an increase in non-executive directors’ remuneration, and the company’s constitution was amended at the 2004 AGM to recognise this change.
The table below sets out the preserved retirement allowances of the relevant non-executive directors for the year ended 31 December 2012.
retiremeNt ALLowANce 12012 2011
Us$000 Us$000
Len Bleasel AM 2 – 148Belinda Hutchinson AM 347 331Charles Irby 136 130Irene Lee 99 94
1 Retirement allowance has been converted to US dollars using the closing rate of exchange for the relevant year.2 Len Bleasel retired on 30 September 2012. He received his accrued retirement allowance of $153,000 (A$147,000).
101O
ther
info
rmatio
n
6
Fin
ancial
repo
rt
5
Bu
siness
review
2
High
lights
& o
verv
iew
1
QB
E In
suran
ce Gro
up
A
nn
ual rep
ort 20
12G
ov
ernan
ce
3
Directo
rs' rep
ort
4
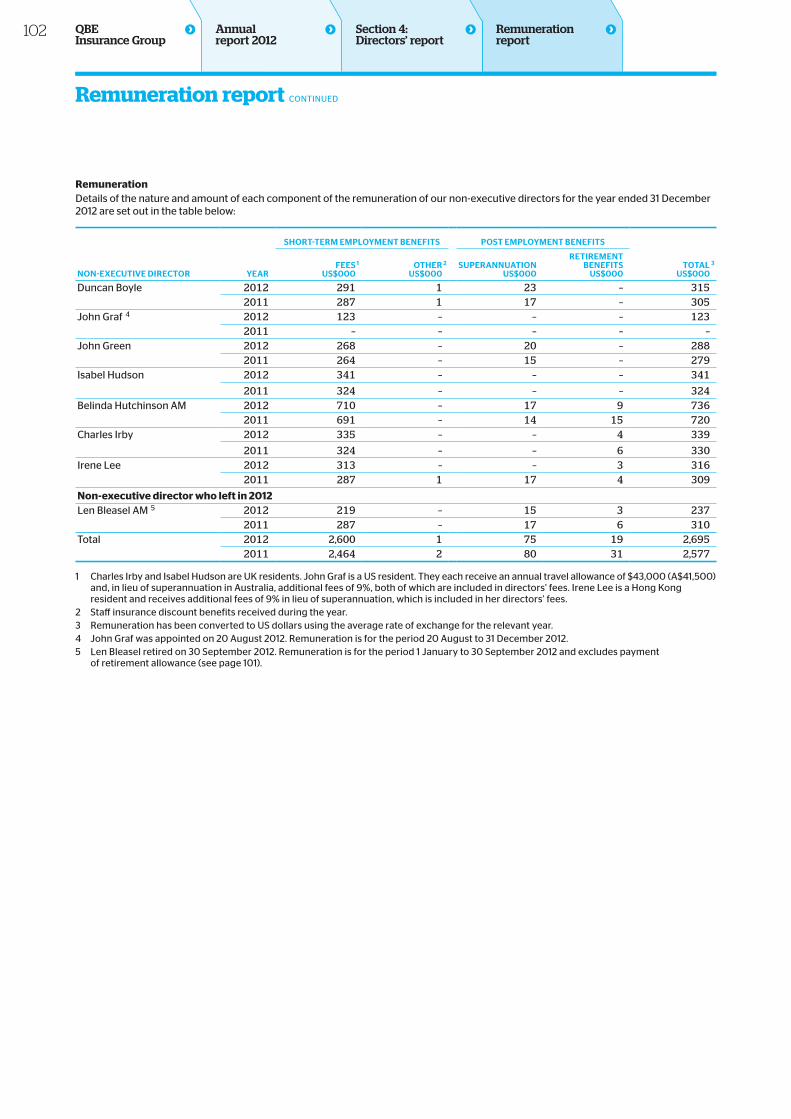
Remuneration report CONTINUED
RemunerationDetails of the nature and amount of each component of the remuneration of our non-executive directors for the year ended 31 December 2012 are set out in the table below:
NoN-execUtive Director yeAr
sHort-term emPLoymeNt beNeFits Post emPLoymeNt beNeFits
totAL 3Us$000
Fees 1
Us$000otHer 2
Us$000sUPerANNUAtioN
Us$000
retiremeNtbeNeFits
Us$000
Duncan Boyle 2012 291 1 23 – 3152011 287 1 17 – 305
John Graf 4 2012 123 – – – 1232011 – – – – –
John Green 2012 268 – 20 – 2882011 264 – 15 – 279
Isabel Hudson 2012 341 – – – 341
2011 324 – – – 324Belinda Hutchinson AM 2012 710 – 17 9 736
2011 691 – 14 15 720Charles Irby 2012 335 – – 4 339
2011 324 – – 6 330Irene Lee 2012 313 – – 3 316
2011 287 1 17 4 309
Non‑executive director who left in 2012Len Bleasel AM 5 2012 219 – 15 3 237
2011 287 – 17 6 310Total 2012 2,600 1 75 19 2,695
2011 2,464 2 80 31 2,577
1 Charles Irby and Isabel Hudson are UK residents. John Graf is a US resident. They each receive an annual travel allowance of $43,000 (A$41,500) and, in lieu of superannuation in Australia, additional fees of 9%, both of which are included in directors’ fees. Irene Lee is a Hong Kong resident and receives additional fees of 9% in lieu of superannuation, which is included in her directors’ fees.
2 Staff insurance discount benefits received during the year. 3 Remuneration has been converted to US dollars using the average rate of exchange for the relevant year.4 John Graf was appointed on 20 August 2012. Remuneration is for the period 20 August to 31 December 2012.5 Len Bleasel retired on 30 September 2012. Remuneration is for the period 1 January to 30 September 2012 and excludes payment
of retirement allowance (see page 101).
102 QBE Insurance Group
Section 4: Directors’ report
Annual report 2012
Remuneration report
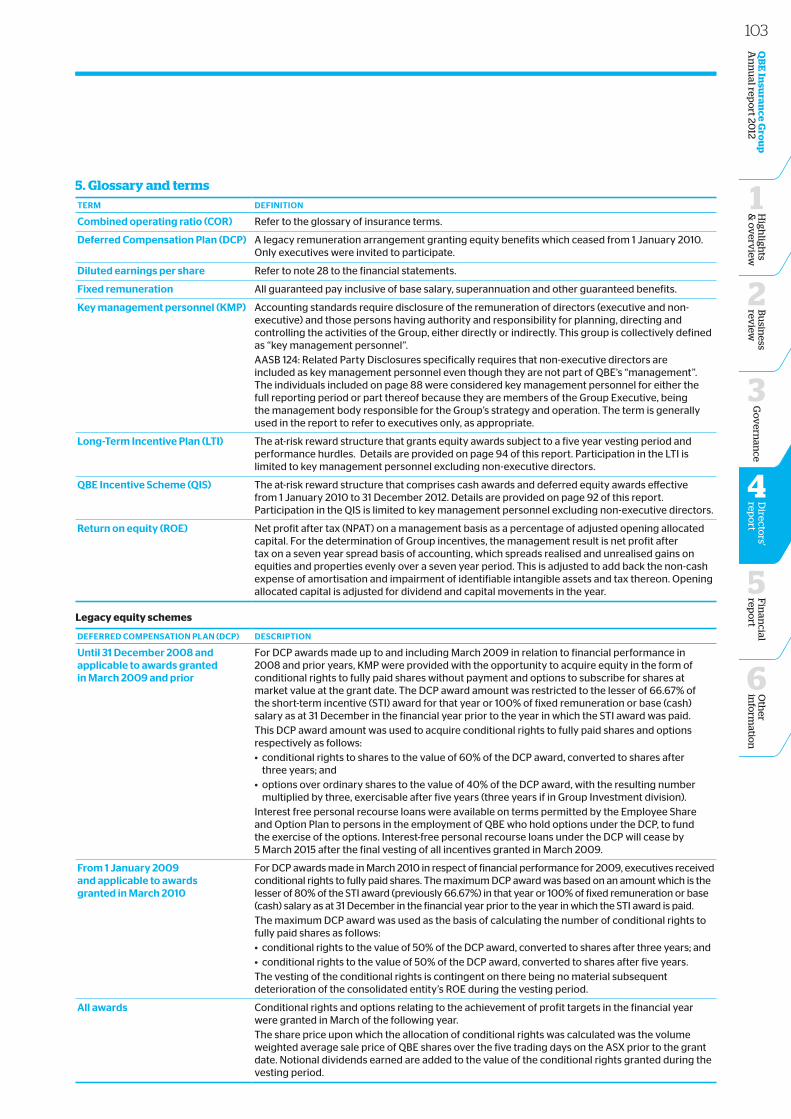
5. Glossary and terms term DeFiNitioN
combined operating ratio (cor) Refer to the glossary of insurance terms.
Deferred compensation Plan (DcP) A legacy remuneration arrangement granting equity benefits which ceased from 1 January 2010. Only executives were invited to participate.
Diluted earnings per share Refer to note 28 to the financial statements.
Fixed remuneration All guaranteed pay inclusive of base salary, superannuation and other guaranteed benefits.
key management personnel (kmP) Accounting standards require disclosure of the remuneration of directors (executive and non-executive) and those persons having authority and responsibility for planning, directing and controlling the activities of the Group, either directly or indirectly. This group is collectively defined as “key management personnel”. AASB 124: Related Party Disclosures specifically requires that non-executive directors are included as key management personnel even though they are not part of QBE’s “management”. The individuals included on page 88 were considered key management personnel for either the full reporting period or part thereof because they are members of the Group Executive, being the management body responsible for the Group’s strategy and operation. The term is generally used in the report to refer to executives only, as appropriate.
Long-term incentive Plan (Lti) The at-risk reward structure that grants equity awards subject to a five year vesting period and performance hurdles. Details are provided on page 94 of this report. Participation in the LTI is limited to key management personnel excluding non-executive directors.
qbe incentive scheme (qis) The at-risk reward structure that comprises cash awards and deferred equity awards effective from 1 January 2010 to 31 December 2012. Details are provided on page 92 of this report. Participation in the QIS is limited to key management personnel excluding non-executive directors.
return on equity (roe) Net profit after tax (NPAT) on a management basis as a percentage of adjusted opening allocated capital. For the determination of Group incentives, the management result is net profit after tax on a seven year spread basis of accounting, which spreads realised and unrealised gains on equities and properties evenly over a seven year period. This is adjusted to add back the non-cash expense of amortisation and impairment of identifiable intangible assets and tax thereon. Opening allocated capital is adjusted for dividend and capital movements in the year.
Legacy equity schemes
DeFerreD comPeNsAtioN PLAN (DcP) DescriPtioN
Until 31 December 2008 and applicable to awards granted in march 2009 and prior
For DCP awards made up to and including March 2009 in relation to financial performance in 2008 and prior years, KMP were provided with the opportunity to acquire equity in the form of conditional rights to fully paid shares without payment and options to subscribe for shares at market value at the grant date. The DCP award amount was restricted to the lesser of 66.67% of the short-term incentive (STI) award for that year or 100% of fixed remuneration or base (cash) salary as at 31 December in the financial year prior to the year in which the STI award was paid.This DCP award amount was used to acquire conditional rights to fully paid shares and options respectively as follows:• conditional rights to shares to the value of 60% of the DCP award, converted to shares after
three years; and• options over ordinary shares to the value of 40% of the DCP award, with the resulting number
multiplied by three, exercisable after five years (three years if in Group Investment division).Interest free personal recourse loans were available on terms permitted by the Employee Share and Option Plan to persons in the employment of QBE who hold options under the DCP, to fund the exercise of the options. Interest-free personal recourse loans under the DCP will cease by 5 March 2015 after the final vesting of all incentives granted in March 2009.
From 1 january 2009 and applicable to awards granted in march 2010
For DCP awards made in March 2010 in respect of financial performance for 2009, executives received conditional rights to fully paid shares. The maximum DCP award was based on an amount which is the lesser of 80% of the STI award (previously 66.67%) in that year or 100% of fixed remuneration or base (cash) salary as at 31 December in the financial year prior to the year in which the STI award is paid. The maximum DCP award was used as the basis of calculating the number of conditional rights to fully paid shares as follows: • conditional rights to the value of 50% of the DCP award, converted to shares after three years; and • conditional rights to the value of 50% of the DCP award, converted to shares after five years.The vesting of the conditional rights is contingent on there being no material subsequent deterioration of the consolidated entity’s ROE during the vesting period.
All awards Conditional rights and options relating to the achievement of profit targets in the financial year were granted in March of the following year. The share price upon which the allocation of conditional rights was calculated was the volume weighted average sale price of QBE shares over the five trading days on the ASX prior to the grant date. Notional dividends earned are added to the value of the conditional rights granted during the vesting period.
103O
ther
info
rmatio
n
6
Fin
ancial
repo
rt
5
Bu
siness
review
2
High
lights
& o
verv
iew
1
QB
E In
suran
ce Gro
up
A
nn
ual rep
ort 20
12G
ov
ernan
ce
3
Directo
rs' rep
ort
4
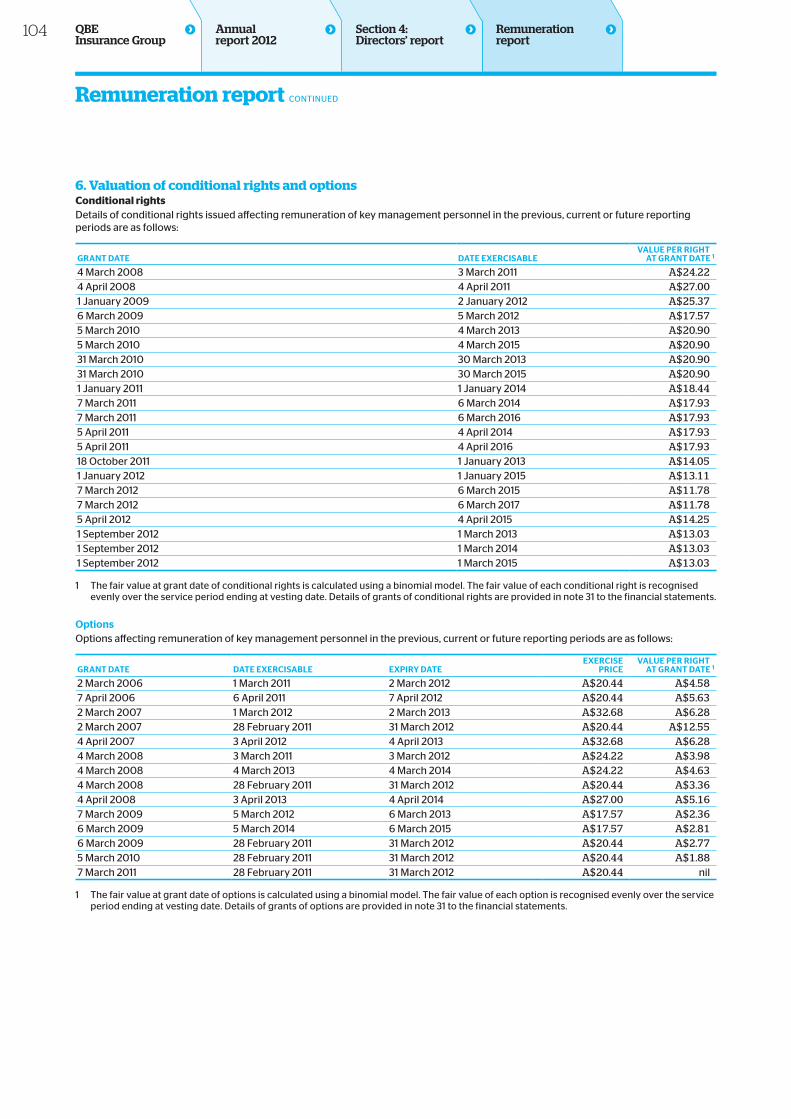
Remuneration report CONTINUEDRemuneration report CONTINUED
6. Valuation of conditional rights and optionsConditional rightsDetails of conditional rights issued affecting remuneration of key management personnel in the previous, current or future reporting periods are as follows:
GrANt DAte DAte exercisAbLevALUe Per riGHt
At GrANt DAte 1
4 March 2008 3 March 2011 A$24.224 April 2008 4 April 2011 A$27.001 January 2009 2 January 2012 A$25.376 March 2009 5 March 2012 A$17.575 March 2010 4 March 2013 A$20.905 March 2010 4 March 2015 A$20.9031 March 2010 30 March 2013 A$20.9031 March 2010 30 March 2015 A$20.901 January 2011 1 January 2014 A$18.447 March 2011 6 March 2014 A$17.937 March 2011 6 March 2016 A$17.935 April 2011 4 April 2014 A$17.935 April 2011 4 April 2016 A$17.9318 October 2011 1 January 2013 A$14.051 January 2012 1 January 2015 A$13.117 March 2012 6 March 2015 A$11.787 March 2012 6 March 2017 A$11.785 April 2012 4 April 2015 A$14.251 September 2012 1 March 2013 A$13.031 September 2012 1 March 2014 A$13.031 September 2012 1 March 2015 A$13.03
1 The fair value at grant date of conditional rights is calculated using a binomial model. The fair value of each conditional right is recognised evenly over the service period ending at vesting date. Details of grants of conditional rights are provided in note 31 to the financial statements.
optionsOptions affecting remuneration of key management personnel in the previous, current or future reporting periods are as follows:
GrANt DAte DAte exercisAbLe exPiry DAteexercise
PricevALUe Per riGHt
At GrANt DAte 1
2 March 2006 1 March 2011 2 March 2012 A$20.44 A$4.587 April 2006 6 April 2011 7 April 2012 A$20.44 A$5.632 March 2007 1 March 2012 2 March 2013 A$32.68 A$6.282 March 2007 28 February 2011 31 March 2012 A$20.44 A$12.554 April 2007 3 April 2012 4 April 2013 A$32.68 A$6.284 March 2008 3 March 2011 3 March 2012 A$24.22 A$3.984 March 2008 4 March 2013 4 March 2014 A$24.22 A$4.634 March 2008 28 February 2011 31 March 2012 A$20.44 A$3.364 April 2008 3 April 2013 4 April 2014 A$27.00 A$5.167 March 2009 5 March 2012 6 March 2013 A$17.57 A$2.366 March 2009 5 March 2014 6 March 2015 A$17.57 A$2.816 March 2009 28 February 2011 31 March 2012 A$20.44 A$2.775 March 2010 28 February 2011 31 March 2012 A$20.44 A$1.887 March 2011 28 February 2011 31 March 2012 A$20.44 nil
1 The fair value at grant date of options is calculated using a binomial model. The fair value of each option is recognised evenly over the service period ending at vesting date. Details of grants of options are provided in note 31 to the financial statements.
104 QBE Insurance Group
Section 4: Directors’ report
Annual report 2012
Remuneration report
AuditorPricewaterhouseCoopers, Chartered Accountants, continue in office in accordance with section 327B of the Corporations Act 2001.
Non-audit servicesDuring the year, PricewaterhouseCoopers has performed certain other services in addition to its statutory duties.
The Board of directors has considered the position and, in accordance with the advice received from the Audit Committee, is satisfied that the provision of the non-audit services is compatible with the general standard of independence for auditors imposed by the Corporations Act 2001. The directors are satisfied that the provision of non-audit services by the auditor, as provided in note 35 to the financial statements, did not compromise the auditor independence requirements of the Corporations Act 2001 for the following reasons:
• all non-audit services have been reviewed by the Audit Committee to ensure that they do not impact the impartiality and objectivity of the auditor; and
• none of the services undermine the general principles relating to auditor independence as set out in APES 110: Code of Ethics for Professional Accountants.
A copy of the auditor’s independence declaration required under section 307C of the Corporations Act 2001 is set out on page 106.
Details of amounts paid or payable to PricewaterhouseCoopers for audit and non-audit services are provided in note 35 to the financial statements.
Rounding of amountsThe company is of a kind referred to in the ASIC class order 98/100 dated 10 July 1998 (as amended by class order 04/667 dated 15 July 2004) relating to the “rounding off” of amounts in the directors’ report. Amounts have been rounded off in the directors’ report to the nearest million dollars or, in certain cases, to the nearest thousand dollars in accordance with that class order.
Signed in SYDNEY this 26th day of February 2013 in accordance with a resolution of the directors.
BJ Hutchinson AM Director
JD Neal Director
Directors’ report CONTINUED
FOR THE YEAR ENDED 31 DECEMBER 2012
105O
ther
info
rmatio
n
6
Fin
ancial
repo
rt
5
Bu
siness
review
2
High
lights
& o
verv
iew
1
QB
E In
suran
ce Gro
up
A
nn
ual rep
ort 20
12G
ov
ernan
ce
3
Directo
rs' rep
ort
4
Directors’ report CONTINUED
FOR THE YEAR ENDED 31 DECEMBER 2012
Liability limited by a scheme approved under Professional Standards Legislation
Auditor’s independence declaration for the year ended 31 December 2012
As lead auditor for the audit of QBE Insurance Group Limited for the year ended 31 December 2012, I declare that, to the best of my knowledge and belief, there have been:
(a) no contraventions of the auditor independence requirements of the Corporations Act 2001 in relation to the audit; and
(b) no contraventions of any applicable code of professional conduct in relation to the audit.
This declaration is in respect of QBE Insurance Group Limited and the entities it controlled during the period.
KG Smith Partner, Pricewaterhousecoopers
Sydney 26 February 2013
106 QBE Insurance Group
Annual report 2012
Section 4: Directors’ report
Financial statementsconsolidated statement of comprehensive income 108
consolidated balance sheet 109
consolidated statement of changes in equity 1 10
consolidated statement of cash flows 1 1 1
Notes to the financial statements 1 Summary of significant accounting policies 1 1 22 New accounting standards and amendments 1 1 73 Segment information 1 1 74 Critical accounting estimates and judgments 1 1 95 Risk management 1 2 36 Income and expenses 1307 Investment income 1 3 18 Claims incurred 1 3 29 Income tax 1 3 310 Cash and cash equivalents 1 3 311 Investments 1 3 412 Derivative financial instruments 1 3 513 Trade and other receivables 13614 Deferred insurance costs 13615 Property, plant and equipment 1 3 716 Deferred income tax 13817 Investment properties 13918 Investment in associates 14019 Intangible assets 14020 Trade and other payables 14 321 Unearned premium 14 322 Outstanding claims 14 423 Provisions 14624 Defined benefit plans 14625 Borrowings 14926 Equity 1 5 127 Dividends 1 5 328 Earnings per share 1 5 429 Business combinations 1 5 430 Share based payments 15631 Key management personnel 1 6 132 Contingent liabilities 16633 Capital expenditure commitments 16634 Operating lease commitments 16635 Remuneration of auditors 16736 Related parties 16737 Ultimate parent entity financial information 1 7 2
Directors’ declaration 1 7 3
This financial report includes the consolidated financial statements for QBE Insurance Group Limited (the ultimate parent entity or the company) and its controlled entities (QBE or the Group). All amounts in the financial report are presented in US dollars unless otherwise stated.QBE Insurance Group Limited is a company limited by shares, incorporated and domiciled in Australia. Its registered office is located at:Level 2, 82 Pitt Street Sydney NSW 2000 AustraliaA description of the nature of the Group’s operations and its principal activities is included on pages 9 to 63, none of which is part of this financial report.The financial report was authorised for issue by the directors on 26 February 2013.Through the use of the internet, we have ensured that our corporate reporting is timely, complete and available globally at minimum cost to the company. All material press releases, financial reports and other information are available at our QBE investor centre on our website: www.qbe.com.
Financial report contents
107O
ther
info
rmatio
n
6
Directo
rs' rep
ort
4
Fin
ancial
repo
rt
5
QB
E In
suran
ce Gro
up
A
nn
ual rep
ort 20
12B
usin
ess rev
iew
2
Go
vern
ance
3
High
lights
& o
verv
iew
1
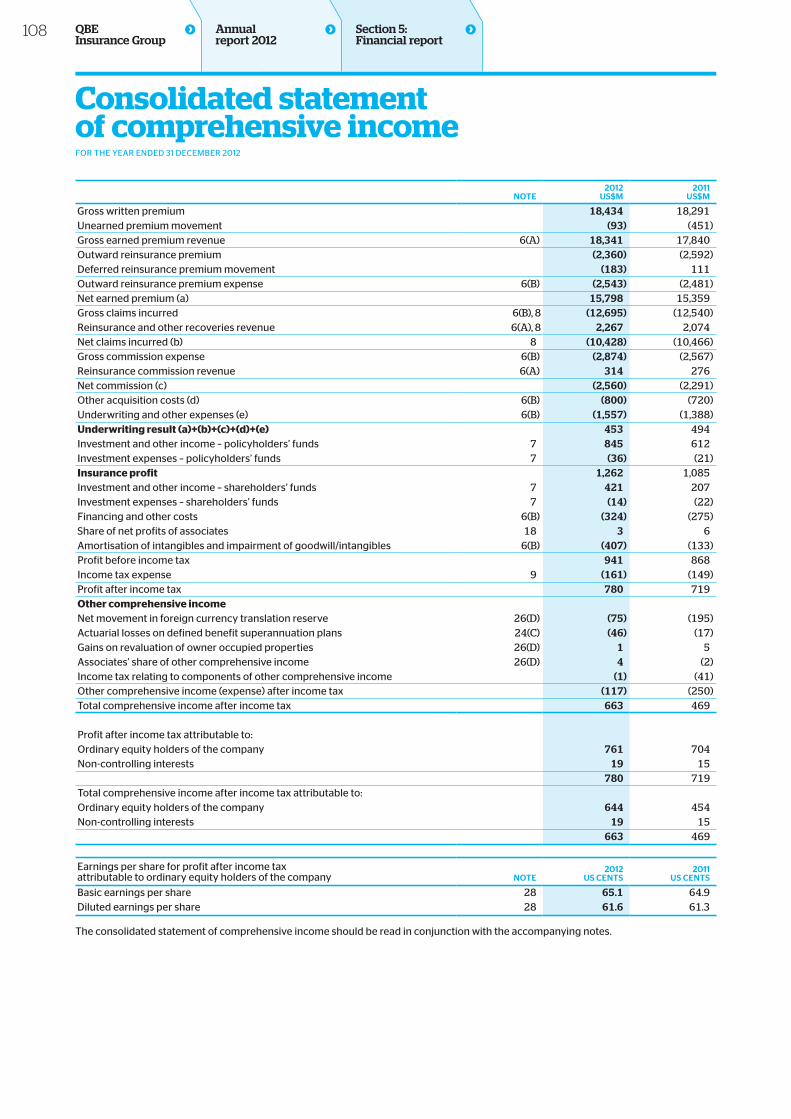
Note2012
Us$m2011
Us$m
Gross written premium 18,434 18,291Unearned premium movement (93) (451)Gross earned premium revenue 6(A) 18,341 17,840Outward reinsurance premium (2,360) (2,592)Deferred reinsurance premium movement (183) 111Outward reinsurance premium expense 6(B) (2,543) (2,481)Net earned premium (a) 15,798 15,359Gross claims incurred 6(B), 8 (12,695) (12,540)Reinsurance and other recoveries revenue 6(A), 8 2,267 2,074Net claims incurred (b) 8 (10,428) (10,466)Gross commission expense 6(B) (2,874) (2,567)Reinsurance commission revenue 6(A) 314 276Net commission (c) (2,560) (2,291)Other acquisition costs (d) 6(B) (800) (720)Underwriting and other expenses (e) 6(B) (1,557) (1,388)Underwriting result (a)+(b)+(c)+(d)+(e) 453 494Investment and other income – policyholders’ funds 7 845 612Investment expenses – policyholders’ funds 7 (36) (21)Insurance profit 1,262 1,085Investment and other income – shareholders’ funds 7 421 207Investment expenses – shareholders’ funds 7 (14) (22)Financing and other costs 6(B) (324) (275)Share of net profits of associates 18 3 6Amortisation of intangibles and impairment of goodwill/intangibles 6(B) (407) (133)Profit before income tax 941 868Income tax expense 9 (161) (149)Profit after income tax 780 719Other comprehensive income Net movement in foreign currency translation reserve 26(D) (75) (195)Actuarial losses on defined benefit superannuation plans 24(C) (46) (17)Gains on revaluation of owner occupied properties 26(D) 1 5Associates’ share of other comprehensive income 26(D) 4 (2)Income tax relating to components of other comprehensive income (1) (41)Other comprehensive income (expense) after income tax (117) (250)Total comprehensive income after income tax 663 469
Profit after income tax attributable to: Ordinary equity holders of the company 761 704Non-controlling interests 19 15 780 719Total comprehensive income after income tax attributable to: Ordinary equity holders of the company 644 454Non-controlling interests 19 15 663 469
Earnings per share for profit after income taxattributable to ordinary equity holders of the company Note
2012 Us ceNts
2011Us ceNts
Basic earnings per share 28 65.1 64.9Diluted earnings per share 28 61.6 61.3
The consolidated statement of comprehensive income should be read in conjunction with the accompanying notes.
Section 5: Financial report
Consolidated statement of comprehensive incomeFOR THE YEAR ENDED 31 DECEMBER 2012
108 QBE Insurance Group
Annual report 2012
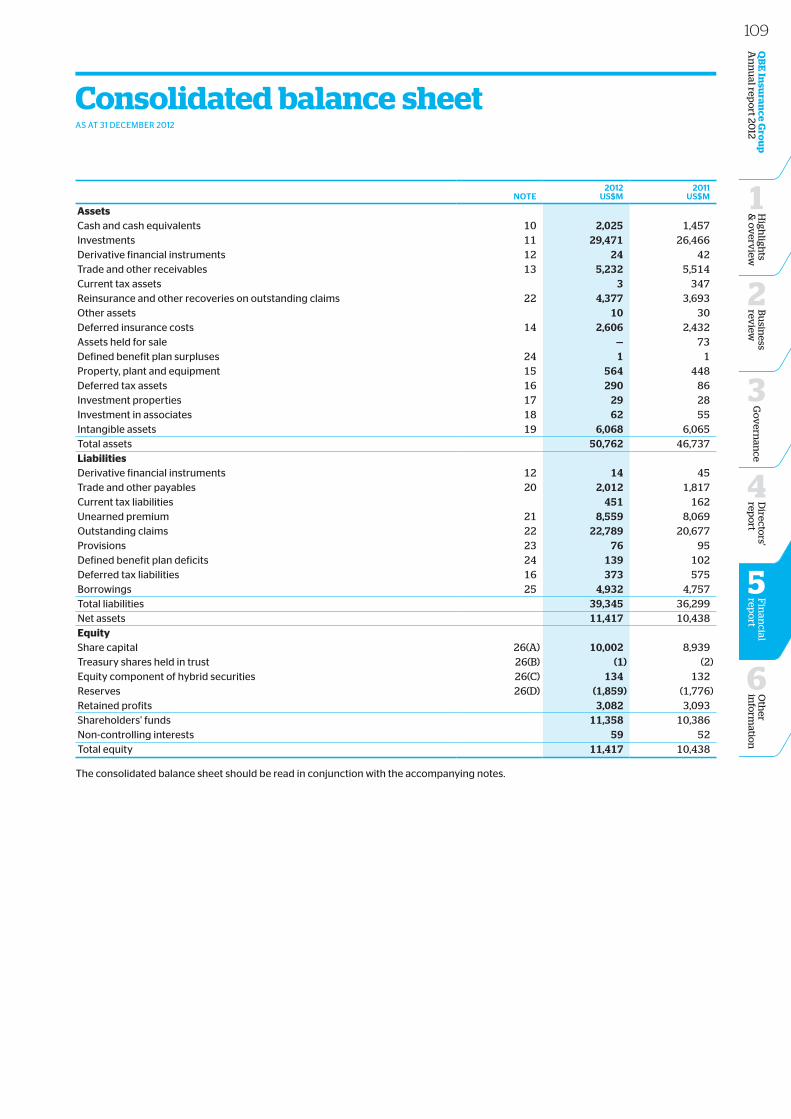
Note2012
Us$m2011
Us$m
Assets Cash and cash equivalents 10 2,025 1,457Investments 11 29,471 26,466Derivative financial instruments 12 24 42Trade and other receivables 13 5,232 5,514Current tax assets 3 347Reinsurance and other recoveries on outstanding claims 22 4,377 3,693Other assets 10 30Deferred insurance costs 14 2,606 2,432Assets held for sale — 73Defined benefit plan surpluses 24 1 1Property, plant and equipment 15 564 448Deferred tax assets 16 290 86Investment properties 17 29 28Investment in associates 18 62 55Intangible assets 19 6,068 6,065Total assets 50,762 46,737Liabilities Derivative financial instruments 12 14 45Trade and other payables 20 2,012 1,817Current tax liabilities 451 162Unearned premium 21 8,559 8,069Outstanding claims 22 22,789 20,677Provisions 23 76 95Defined benefit plan deficits 24 139 102Deferred tax liabilities 16 373 575Borrowings 25 4,932 4,757Total liabilities 39,345 36,299Net assets 11,417 10,438Equity Share capital 26(A) 10,002 8,939Treasury shares held in trust 26(B) (1) (2)Equity component of hybrid securities 26(C) 134 132Reserves 26(D) (1,859) (1,776)Retained profits 3,082 3,093Shareholders’ funds 11,358 10,386Non-controlling interests 59 52Total equity 11,417 10,438
The consolidated balance sheet should be read in conjunction with the accompanying notes.
Consolidated balance sheetAS AT 31 DECEMBER 2012
109O
ther
info
rmatio
n
6
Directo
rs' rep
ort
4
Fin
ancial
repo
rt
5
QB
E In
suran
ce Gro
up
A
nn
ual rep
ort 20
12B
usin
ess rev
iew
2
Go
vern
ance
3
High
lights
& o
verv
iew
1
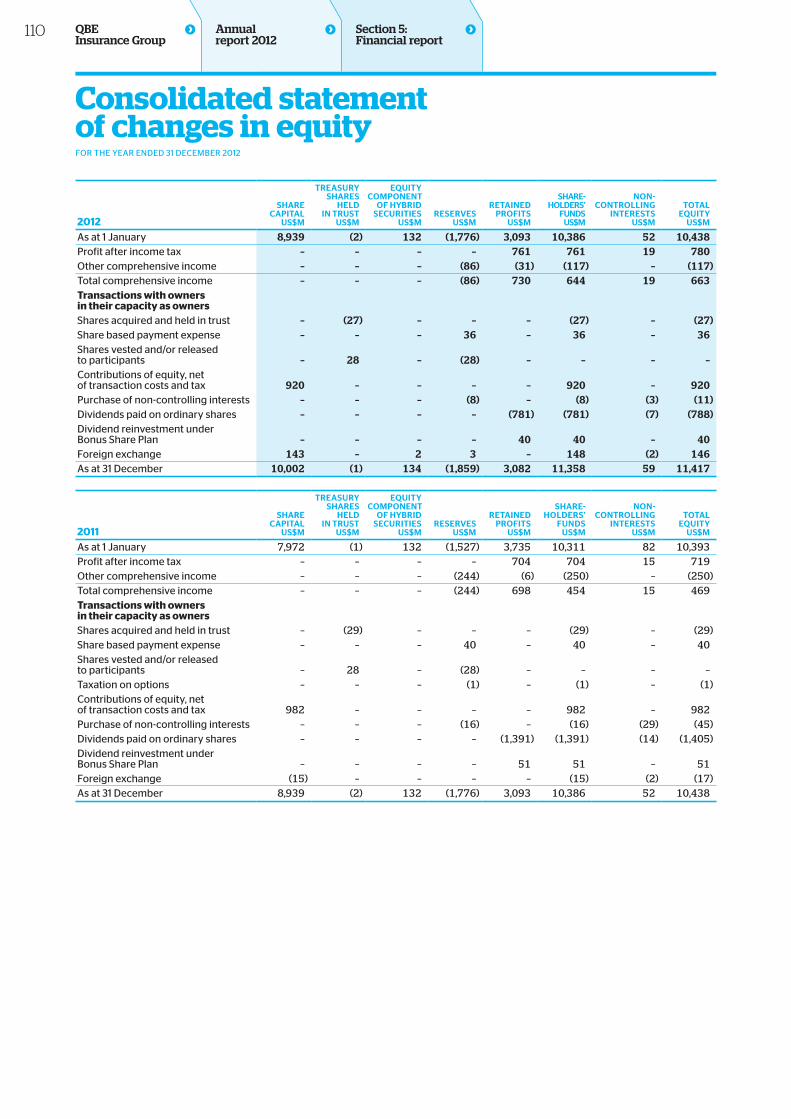
2012
sHArecAPitAL
Us$m
treAsUrysHAres
HeLDiN trUst
Us$m
eqUitycomPoNeNt
oF HybriDsecUrities
Us$mreserves
Us$m
retAiNeDProFits
Us$m
sHAre-HoLDers’
FUNDsUs$m
NoN-coNtroLLiNG
iNterestsUs$m
totALeqUity
Us$m
As at 1 January 8,939 (2) 132 (1,776) 3,093 10,386 52 10,438Profit after income tax – – – – 761 761 19 780Other comprehensive income – – – (86) (31) (117) – (117)Total comprehensive income – – – (86) 730 644 19 663Transactions with owners in their capacity as ownersShares acquired and held in trust – (27) – – – (27) – (27)Share based payment expense – – – 36 – 36 – 36Shares vested and/or released to participants – 28 – (28) – – – –Contributions of equity, net of transaction costs and tax 920 – – – – 920 – 920Purchase of non-controlling interests – – – (8) – (8) (3) (11)Dividends paid on ordinary shares – – – – (781) (781) (7) (788)Dividend reinvestment under Bonus Share Plan – – – – 40 40 – 40Foreign exchange 143 – 2 3 – 148 (2) 146As at 31 December 10,002 (1) 134 (1,859) 3,082 11,358 59 11,417
2011
sHArecAPitAL
Us$m
treAsUrysHAres
HeLDiN trUst
Us$m
eqUitycomPoNeNt
oF HybriDsecUrities
Us$m
reserves
Us$m
retAiNeDProFits
Us$m
sHAre-HoLDers’
FUNDsUs$m
NoN-coNtroLLiNG
iNterestsUs$m
totALeqUity
Us$m
As at 1 January 7,972 (1) 132 (1,527) 3,735 10,311 82 10,393Profit after income tax – – – – 704 704 15 719Other comprehensive income – – – (244) (6) (250) – (250)Total comprehensive income – – – (244) 698 454 15 469Transactions with owners in their capacity as owners Shares acquired and held in trust – (29) – – – (29) – (29)Share based payment expense – – – 40 – 40 – 40Shares vested and/or released to participants – 28 – (28) – – – –Taxation on options – – – (1) – (1) – (1)Contributions of equity, net of transaction costs and tax 982 – – – – 982 – 982Purchase of non-controlling interests – – – (16) – (16) (29) (45)Dividends paid on ordinary shares – – – – (1,391) (1,391) (14) (1,405)Dividend reinvestment under Bonus Share Plan – – – – 51 51 – 51Foreign exchange (15) – – – – (15) (2) (17)As at 31 December 8,939 (2) 132 (1,776) 3,093 10,386 52 10,438
Section 5: Financial report
Consolidated statement of changes in equityFOR THE YEAR ENDED 31 DECEMBER 2012
110 QBE Insurance Group
Annual report 2012
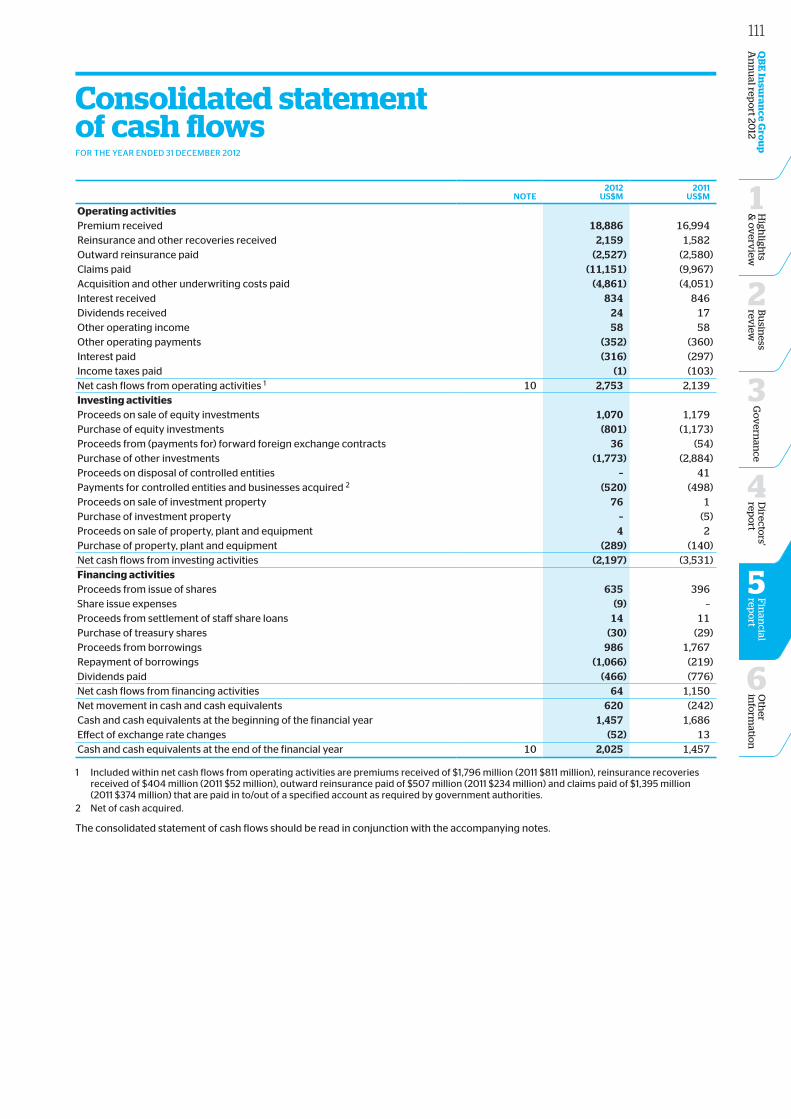
Note2012
Us$m2011
Us$m
Operating activities Premium received 18,886 16,994Reinsurance and other recoveries received 2,159 1,582Outward reinsurance paid (2,527) (2,580)Claims paid (11,151) (9,967)Acquisition and other underwriting costs paid (4,861) (4,051)Interest received 834 846Dividends received 24 17Other operating income 58 58Other operating payments (352) (360)Interest paid (316) (297)Income taxes paid (1) (103)Net cash flows from operating activities 1 10 2,753 2,139Investing activities Proceeds on sale of equity investments 1,070 1,179Purchase of equity investments (801) (1,173)Proceeds from (payments for) forward foreign exchange contracts 36 (54)Purchase of other investments (1,773) (2,884)Proceeds on disposal of controlled entities – 41Payments for controlled entities and businesses acquired 2 (520) (498)Proceeds on sale of investment property 76 1Purchase of investment property – (5)Proceeds on sale of property, plant and equipment 4 2Purchase of property, plant and equipment (289) (140)Net cash flows from investing activities (2,197) (3,531)Financing activities Proceeds from issue of shares 635 396Share issue expenses (9) –Proceeds from settlement of staff share loans 14 11Purchase of treasury shares (30) (29)Proceeds from borrowings 986 1,767Repayment of borrowings (1,066) (219)Dividends paid (466) (776)Net cash flows from financing activities 64 1,150Net movement in cash and cash equivalents 620 (242)Cash and cash equivalents at the beginning of the financial year 1,457 1,686Effect of exchange rate changes (52) 13Cash and cash equivalents at the end of the financial year 10 2,025 1,457
1 Included within net cash flows from operating activities are premiums received of $1,796 million (2011 $811 million), reinsurance recoveries received of $404 million (2011 $52 million), outward reinsurance paid of $507 million (2011 $234 million) and claims paid of $1,395 million (2011 $374 million) that are paid in to/out of a specified account as required by government authorities.
2 Net of cash acquired.
The consolidated statement of cash flows should be read in conjunction with the accompanying notes.
Consolidated statement of cash flowsFOR THE YEAR ENDED 31 DECEMBER 2012
111O
ther
info
rmatio
n
6
Directo
rs' rep
ort
4
Fin
ancial
repo
rt
5
QB
E In
suran
ce Gro
up
A
nn
ual rep
ort 20
12B
usin
ess rev
iew
2
Go
vern
ance
3
High
lights
& o
verv
iew
1
1. Summary of significant accounting policiesThe principal accounting policies adopted in the preparation of the financial report are set out below. These policies have been consistently applied to all the years presented unless otherwise stated. The financial report includes the consolidated financial statements for QBE Insurance Group Limited (the company), its controlled entities (QBE or the Group) and its associates.
(A) Basis of preparation This general purpose financial report has been prepared in accordance with Australian accounting standards, other authoritative pronouncements of the Australian Accounting Standards Board (AASB), Urgent Issues Group Interpretations and the requirements of the Corporations Act 2001. The Group has applied all new accounting standards and amendments that are mandatory for the first time in the current financial year. The adoption of these standards did not have any impact on the current period or any prior period and is not likely to affect future periods.
(i) compliance with iFrsThe financial report complies with International Financial Reporting Standards (IFRS) as issued by the International Accounting Standards Board.
(ii) Historical cost conventionThese financial statements have been prepared under the historical cost convention, as modified by certain exceptions noted in the financial report, with the principal exceptions being the measurement of financial assets at fair value and the measurement of the outstanding claims liability and related reinsurance and other recoveries at present value. Refer to note 4.
The preparation of the financial statements requires the use of certain critical accounting estimates. It also requires management to exercise judgment in the process of applying the Group’s accounting policies. The areas involving a higher degree of judgment or complexity, or areas where assumptions or estimates are significant, are disclosed in note 4.
(iii) Presentation currencyThe presentation currency used in the preparation of the financial report is US dollars. The Group has selected a US dollar presentation currency because a significant proportion of its underwriting activity is denominated in US dollars. The US dollar is also the currency which is widely understood by the global insurance industry, international investors and analysts.
(B) Principles of consolidation(i) controlled entitiesThe consolidated financial statements incorporate the assets and liabilities of all entities controlled by the company as at 31 December 2012 and the results of all controlled entities for the financial year then ended. Control is defined as the power to govern the financial and operating policies, generally accompanying a shareholding of more than one-half of the voting rights. The effects of all transactions between controlled entities are eliminated in full. Non-controlling interests in the results and equity of controlled entities are shown separately in the consolidated statement of comprehensive income and balance sheet.
Where control of an entity commences during a financial year, its results are included in the consolidated statement of comprehensive income from the date on which control commences. Where control of an entity ceases during a financial year, its results are included for that part of the year during which the control existed.
(ii) business combinations Business combinations are accounted for using the acquisition method when control of an entity or business is obtained. The cost of an acquisition is measured as the fair value of the assets given, equity instruments issued and liabilities incurred or assumed at the date of exchange. Identifiable assets acquired and liabilities
and contingent liabilities assumed in a business combination are measured initially at their fair values at the acquisition date, irrespective of the extent of any non-controlling interest. The excess of the cost of acquisition over the fair value of the Group’s share of the identifiable net assets acquired is recorded as goodwill. If the cost of acquisition is less than the fair value of the net assets of the controlled entity acquired, the difference is recognised directly in profit or loss. Costs of acquisition are expensed as incurred.
Where a cash settlement on acquisition is deferred, the future payable is discounted to present value. Where a cash settlement on acquisition is contingent on the outcome of uncertain future events, the fair value of the obligation is classified as a liability and is subsequently remeasured through profit or loss.
Non-controlling interests in an acquiree are recognised either at fair value or at the non-controlling interest’s proportionate share of the acquiree’s net identifiable assets. This decision is made on an acquisition-by-acquisition basis.
(iii) AssociatesEntities over which significant influence is exercised are accounted for using equity accounting principles. Significant influence is presumed to exist where between 20% and 50% of the voting rights of an entity are held, but can also arise where less than 20% is held through active involvement and influencing policy decisions affecting the entity. The investment is initially recognised at cost (fair value of consideration provided plus directly attributable costs) and is subsequently adjusted for the post-acquisition change in the associate’s net assets. The Group’s share of the profit or loss of the associate is included in the profit or loss of the Group and disclosed as a separate line in the statement of comprehensive income.
Distributions received reduce the carrying amount of the investment. Movements in the total equity of the associate, being those movements that are not recognised in the profit or loss or other comprehensive income, are recognised directly in equity of the Group and disclosed in the statement of changes in equity. The investments are reviewed annually for impairment.
When the Group’s share of losses exceeds its interest in the associate, the carrying amount of the investment is reduced to nil and recognition of further losses is discontinued except to the extent that the Group has incurred obligations or made payments on behalf of the associate.
(C) Premium revenuePremium comprises amounts charged to policyholders, excluding taxes collected on behalf of third parties. The earned portion of premium received and receivable, including unclosed business, is recognised as revenue. Premium on unclosed business is brought to account based upon the pattern of booking of renewals and new business.
(D) Unearned premiumUnearned premium is calculated based on the term of the risk and in accordance with the expected pattern of the incidence of risk underwritten, using either the daily pro-rata method or the 24ths method, adjusted where appropriate for seasonality.
At each balance sheet date, the adequacy of the unearned premium liability is assessed on a net of reinsurance basis against the present value of the expected future cash flows relating to potential future claims in respect of the relevant insurance contracts, plus an additional risk margin to reflect the inherent uncertainty of the central estimate. The assessment is carried out at the operating segment level, being a portfolio of contracts subject to broadly similar risks and which are managed together as a single portfolio. If the present value of expected future cash flows relating to future claims plus the additional risk margin exceeds the unearned premium liability less related intangible assets and related deferred acquisition costs, then the unearned premium liability is deemed to be deficient. The resulting deficiency is recognised immediately through profit or loss.
Section 5: Financial report
Notes to the financial statementsFOR THE YEAR ENDED 31 DECEMBER 2012
112 QBE Insurance Group
Annual report 2012
(E) Outward reinsurancePremium ceded to reinsurers is recognised as an expense from the attachment date over the period of indemnity of the reinsurance contract in accordance with the expected pattern of the incidence of risk. Accordingly, a portion of outward reinsurance premium is treated as a prepayment at the balance sheet date.
(F) ClaimsThe provision for outstanding claims is measured as the central estimate of the present value of expected future claims payments plus a risk margin. The expected future payments include those in relation to claims reported but not yet paid; claims incurred but not reported (IBNR); claims incurred but not enough reported (IBNER); and estimated claims handling costs. Claims expense represents claims payments adjusted for the movement in the outstanding claims liability.
The expected future payments are discounted to present value using a risk-free rate.
A risk margin is applied to the central estimate, net of reinsurance and other recoveries, to reflect the inherent uncertainty in the central estimate.
(G) Reinsurance and other recoveries Reinsurance and other recoveries on paid claims, reported claims not yet paid, IBNR and IBNER are recognised as revenue.
Amounts recoverable are assessed in a manner similar to the assessment of outstanding claims. Recoveries are measured as the present value of the expected future receipts, calculated on the same basis as the provision for outstanding claims.
(H) Acquisition costsAcquisition costs (which include commission costs) are the costs associated with obtaining and recording insurance contracts. Acquisition costs are capitalised when they relate to the acquisition of new business or the renewal of existing business and are referred to as deferred acquisition costs. These costs are amortised on the same basis as the earning pattern of the premium, over the period of the insurance contract to which they relate. At the reporting date, deferred acquisition costs represent the capitalised costs that relate to the unearned premium. Acquisition costs are deferred in recognition of their future benefit and are measured at the lower of cost and recoverable amount.
(I) Investment incomeInterest income is recognised on an accruals basis. Dividends are recognised when the right to receive payment is established. Investment income includes realised and unrealised gains or losses on financial assets which are reported on a combined basis as fair value gains or losses on financial assets.
(J) TaxationThe income tax expense or revenue for the period is the tax payable on the current period’s taxable income based on the applicable income tax rate for each jurisdiction, adjusted for changes in deferred tax assets and liabilities attributable to temporary differences and to unused tax losses.
The current income tax charge is calculated on the basis of the tax laws enacted or substantively enacted at the end of the reporting period in the countries where the company’s subsidiaries and associates operate and generate taxable income. Management periodically evaluates positions taken in tax returns with respect to situations in which applicable tax regulation is subject to interpretation and establishes provisions where appropriate on the basis of amounts expected to be paid to the tax authorities.
Deferred income tax is provided in full, using the liability method, on temporary differences arising between the tax bases of assets and liabilities and their carrying amounts in the consolidated financial statements. Deferred tax liabilities are not recognised if they arise from the initial recognition of goodwill. Deferred income tax is also not accounted for if it arises from initial recognition
of an asset or liability, in a transaction other than a business combination, that at the time of the transaction affects neither accounting nor taxable profit or loss. Deferred income tax is determined using tax rates (and laws) that have been enacted or substantially enacted by the end of the reporting period and are expected to apply when the related deferred income tax asset is realised or the deferred income tax liability is settled.
Deferred tax assets are recognised for deductible temporary differences and unused tax losses only if it is probable that future taxable amounts will be available to utilise those temporary differences and losses.
Deferred tax assets and liabilities are not recognised for temporary differences between the carrying amount and tax bases of investments in foreign operations where the company is able to control the timing of the reversal of the temporary differences and it is probable that the differences will not reverse in the foreseeable future.
Deferred tax assets and liabilities are offset when there is a legally enforceable right to offset current tax assets and liabilities and when the deferred tax balances relate to the same taxation authority. Current tax assets and tax liabilities are offset where the entity has a legally enforceable right to offset and intends either to settle on a net basis, or to realise the asset and settle the liability simultaneously.
The company and its wholly-owned Australian controlled entities have implemented the tax consolidation legislation. As a consequence, these entities are taxed as a single entity and the deferred tax assets and liabilities of these entities are offset in the consolidated financial statements.
Current and deferred tax is recognised in profit or loss, except to the extent that it relates to items recognised in other comprehensive income or directly in equity. In this case, the tax is also recognised in other comprehensive income or directly in equity, as appropriate.
(K) Insurance profitInsurance profit is derived by adding investment income on assets backing policyholders’ funds to the underwriting result.
(L) Cash and cash equivalentsCash and cash equivalents includes cash at bank and on hand and deposits at call which are readily convertible to cash on hand and which are used for operational cash requirements.
(M) InvestmentsInvestments comprise interest-bearing assets, equities and equity derivative financial instruments. Investments are designated as fair value through profit or loss on initial recognition. They are initially recorded at fair value, being the cost of acquisition excluding transaction costs, and are subsequently remeasured to fair value at each reporting date. The policy of management is to designate a group of financial assets or financial liabilities at fair value through profit or loss when that group is both managed and its performance evaluated on a fair value basis for both internal and external reporting in accordance with the Group’s documented investment strategy.
For securities traded in an active market, the fair value is determined by reference to published closing bid price quotations. For securities that are not traded and securities that are traded in a market that is not active, fair value is determined using valuation techniques generally by reference to the fair value of recent arm’s length transactions involving the same or similar instruments. Fixed and floating rate securities are valued using independently sourced valuations. Discounted cash flow analysis or option pricing models may be used for a small number of investments.
All purchases and sales of investments that require delivery of the asset within the time frame established by regulation or market convention (“regular way” transactions) are recognised
113O
ther
info
rmatio
n
6
Directo
rs' rep
ort
4
Fin
ancial
repo
rt
5
QB
E In
suran
ce Gro
up
A
nn
ual rep
ort 20
12B
usin
ess rev
iew
2
Go
vern
ance
3
High
lights
& o
verv
iew
1
at trade date, being the date on which the Group commits to buy or sell the asset. Investments are derecognised when the right to receive future cash flows from the asset has expired or has been transferred and the Group has transferred substantially all the risks and rewards of ownership.
(N) Derivative financial instrumentsThe Group is subject to currency, interest rate, price, credit and liquidity risks. Derivative financial instruments (derivatives) may be used to manage these risks.
Derivatives are initially recognised at fair value, being generally the transaction price on the date a derivative contract is entered into, and are subsequently remeasured to their fair value. The method of recognising the resulting gain or loss depends on whether the derivative is designated as a hedging instrument and the nature of the item being hedged. Derivatives which are not part of a hedging relationship are valued at fair value through profit or loss. Derivatives which are part of a hedging relationship are accounted for as set out in note 1(O).
For derivatives traded in an active market, the fair value of derivatives presented as assets is determined by reference to published closing bid price quotations and the fair value of derivatives presented as liabilities is determined by reference to published closing ask price quotations. For derivatives that are not traded or which are traded in a market that is not sufficiently active, fair value is determined using generally accepted valuation techniques.
(O) Hedging transactionsBorrowings and derivatives held for risk management purposes which meet the criteria specified in AASB 139: Financial Instruments: Recognition and Measurement are accounted for using fair value hedge accounting, cash flow hedge accounting, or hedging of a net investment in a foreign operation accounting, as appropriate to the risks being hedged.
In accordance with the criteria for hedge accounting, when a financial instrument is designated as a hedge, the relevant entity formally documents the relationship between the hedging instrument and hedged item as well as its risk management objectives and its strategy for undertaking the various hedging transactions. The relevant entity also documents its assessment, both at hedge inception and on an ongoing basis, of whether the hedging instruments are highly effective in offsetting changes in fair values or cash flows of hedged items.
Hedge accounting is discontinued when:
• the hedge no longer meets the criteria for hedge accounting;
• the hedging instrument expires or is sold, terminated or exercised;
• the hedged item matures, is sold or repaid; or
• the entity revokes the designation.
(i) Fair value hedge accountingChanges in the fair value of derivatives that qualify and are designated as fair value hedges are recognised through profit or loss, together with changes in the fair value of the hedged asset or liability that are attributable to the hedged risk. If the hedge no longer meets the criteria for hedge accounting, the fair value hedging adjustment cumulatively made to the carrying value of the hedged item is, for items carried at amortised cost, amortised over the period to maturity of the previously designated hedge relationship using the effective interest method. If the hedged item is sold or repaid, the unamortised fair value adjustment is recognised immediately through profit or loss.
(ii) cash flow hedge accountingFor qualifying cash flow hedges, the fair value gain or loss associated with the effective portion of the cash flow hedge is initially recognised directly in shareholders’ equity and transferred to profit or loss in the period when the hedged
item will affect profit or loss. The gain or loss on any ineffective portion of the hedging instrument is recognised through profit or loss immediately. When a hedging instrument expires or is sold, or when a hedge no longer meets the criteria for hedge accounting, any cumulative gain or loss existing in equity at that time remains in equity and is recognised when the hedged item affects profit or loss. When a transaction is no longer expected to occur, the cumulative gain or loss that was recognised in equity is immediately recognised through profit or loss.
(iii) Hedges of net investments in foreign operationsHedges of net investments in foreign operations are accounted for in a manner similar to cash flow hedges. The gain or loss on the effective portion of the hedging instrument is recognised directly in equity and the gain or loss on the ineffective portion is recognised immediately through profit or loss. The cumulative gain or loss previously recognised in equity is recognised through profit or loss on the disposal or partial disposal of the foreign operation.
(P) ReceivablesReceivables are recognised at amounts receivable less a provision for impairment. A provision for impairment is established when there is objective evidence that the Group will not be able to collect all amounts due according to the original term of the receivable. Any increase or decrease in the provision for impairment is recognised in profit or loss within underwriting expenses. When a receivable is uncollectable, it is written off against the provision for impairment account. Subsequent recoveries of amounts previously written off are credited against underwriting expenses in profit or loss.
(Q) BorrowingsBorrowings are initially measured at fair value net of transaction costs directly attributable to the transaction and are subsequently measured at amortised cost. Any difference between the proceeds and the redemption amount is recognised through profit or loss over the period of the financial liability using the effective interest method.
Hybrid securities are those which have both liability and equity components. On issue of hybrid securities, the fair value of the liability component, being the obligation to make future payments of principal and interest to investors, is calculated using a market interest rate for an equivalent non-convertible note. The residual amount, representing the fair value of the conversion option, is included in equity with no recognition of any change in the value of the option in subsequent periods. The liability is included in borrowings and carried on an amortised cost basis with interest on the securities recognised as financing costs using the effective interest method until the liability is extinguished on conversion or maturity of the securities.
(R) Investment propertiesInvestment properties, being those properties held for rental income and capital appreciation, are valued by reference to external market valuations at fair value through profit or loss.
(S) Property, plant and equipmentOwner occupied properties are measured at fair value by reference to external market valuations. When a revaluation increases the carrying value of a property, the increase is credited to the revaluation reserve in equity and recognised in other comprehensive income. To the extent that the increase reverses a decrease previously recognised in profit or loss, the increase is first recognised through profit or loss.
When an asset’s carrying amount is decreased as a result of a revaluation, the decrease is recognised through profit or loss. To the extent that the decrease reverses an increase previously recognised in other comprehensive income, the decrease is first recognised in other comprehensive income.
All other plant and equipment is stated at historical cost less accumulated depreciation and impairment.
Section 5: Financial report
Notes to the financial statements CONTINUED
FOR THE YEAR ENDED 31 DECEMBER 2012
1. Summary of significant accounting policies CONTINUED
114 QBE Insurance Group
Annual report 2012
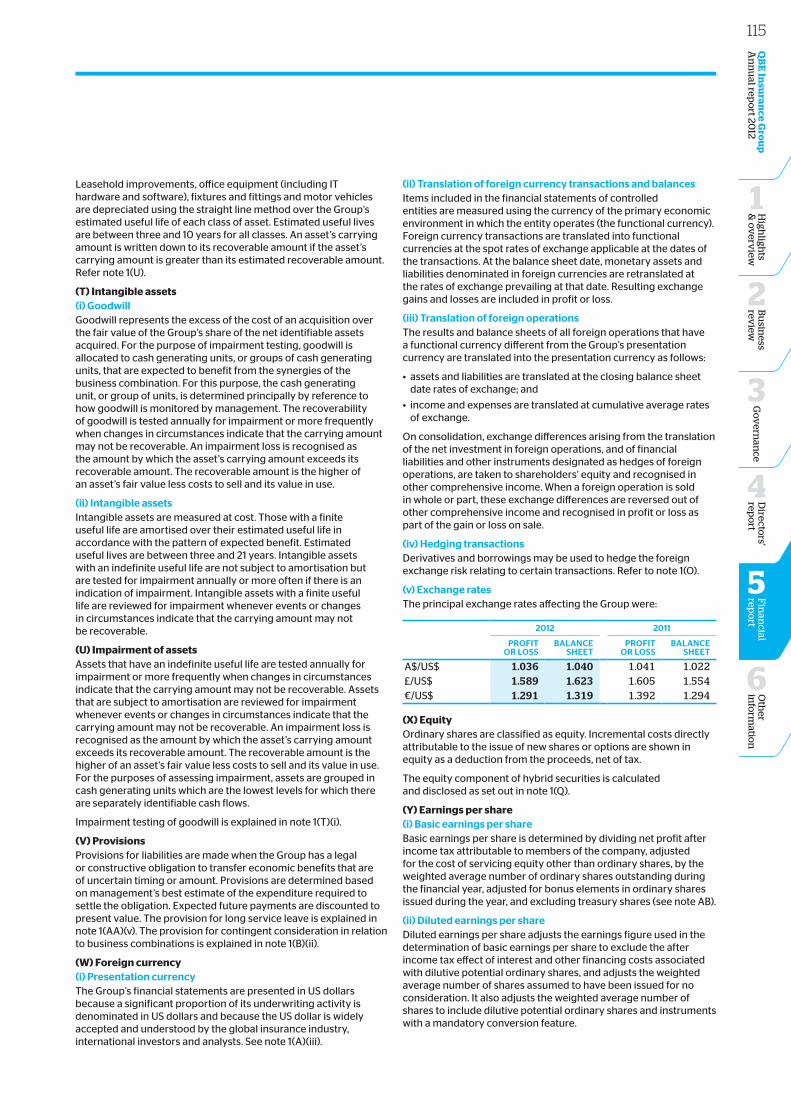
Leasehold improvements, office equipment (including IT hardware and software), fixtures and fittings and motor vehicles are depreciated using the straight line method over the Group’s estimated useful life of each class of asset. Estimated useful lives are between three and 10 years for all classes. An asset’s carrying amount is written down to its recoverable amount if the asset’s carrying amount is greater than its estimated recoverable amount. Refer note 1(U).
(T) Intangible assets(i) GoodwillGoodwill represents the excess of the cost of an acquisition over the fair value of the Group’s share of the net identifiable assets acquired. For the purpose of impairment testing, goodwill is allocated to cash generating units, or groups of cash generating units, that are expected to benefit from the synergies of the business combination. For this purpose, the cash generating unit, or group of units, is determined principally by reference to how goodwill is monitored by management. The recoverability of goodwill is tested annually for impairment or more frequently when changes in circumstances indicate that the carrying amount may not be recoverable. An impairment loss is recognised as the amount by which the asset’s carrying amount exceeds its recoverable amount. The recoverable amount is the higher of an asset’s fair value less costs to sell and its value in use.
(ii) intangible assetsIntangible assets are measured at cost. Those with a finite useful life are amortised over their estimated useful life in accordance with the pattern of expected benefit. Estimated useful lives are between three and 21 years. Intangible assets with an indefinite useful life are not subject to amortisation but are tested for impairment annually or more often if there is an indication of impairment. Intangible assets with a finite useful life are reviewed for impairment whenever events or changes in circumstances indicate that the carrying amount may not be recoverable.
(U) Impairment of assetsAssets that have an indefinite useful life are tested annually for impairment or more frequently when changes in circumstances indicate that the carrying amount may not be recoverable. Assets that are subject to amortisation are reviewed for impairment whenever events or changes in circumstances indicate that the carrying amount may not be recoverable. An impairment loss is recognised as the amount by which the asset’s carrying amount exceeds its recoverable amount. The recoverable amount is the higher of an asset’s fair value less costs to sell and its value in use. For the purposes of assessing impairment, assets are grouped in cash generating units which are the lowest levels for which there are separately identifiable cash flows.
Impairment testing of goodwill is explained in note 1(T)(i).
(V) Provisions Provisions for liabilities are made when the Group has a legal or constructive obligation to transfer economic benefits that are of uncertain timing or amount. Provisions are determined based on management’s best estimate of the expenditure required to settle the obligation. Expected future payments are discounted to present value. The provision for long service leave is explained in note 1(AA)(v). The provision for contingent consideration in relation to business combinations is explained in note 1(B)(ii).
(W) Foreign currency (i) Presentation currencyThe Group’s financial statements are presented in US dollars because a significant proportion of its underwriting activity is denominated in US dollars and because the US dollar is widely accepted and understood by the global insurance industry, international investors and analysts. See note 1(A)(iii).
(ii) translation of foreign currency transactions and balancesItems included in the financial statements of controlled entities are measured using the currency of the primary economic environment in which the entity operates (the functional currency). Foreign currency transactions are translated into functional currencies at the spot rates of exchange applicable at the dates of the transactions. At the balance sheet date, monetary assets and liabilities denominated in foreign currencies are retranslated at the rates of exchange prevailing at that date. Resulting exchange gains and losses are included in profit or loss.
(iii) translation of foreign operationsThe results and balance sheets of all foreign operations that have a functional currency different from the Group’s presentation currency are translated into the presentation currency as follows:
• assets and liabilities are translated at the closing balance sheet date rates of exchange; and
• income and expenses are translated at cumulative average rates of exchange.
On consolidation, exchange differences arising from the translation of the net investment in foreign operations, and of financial liabilities and other instruments designated as hedges of foreign operations, are taken to shareholders’ equity and recognised in other comprehensive income. When a foreign operation is sold in whole or part, these exchange differences are reversed out of other comprehensive income and recognised in profit or loss as part of the gain or loss on sale.
(iv) Hedging transactionsDerivatives and borrowings may be used to hedge the foreign exchange risk relating to certain transactions. Refer to note 1(O).
(v) exchange ratesThe principal exchange rates affecting the Group were:
2012 2011
ProFit or Loss
bALANce sHeet
ProFit or Loss
bALANce sHeet
A$/US$ 1.036 1.040 1.041 1.022£/US$ 1.589 1.623 1.605 1.554€/US$ 1.291 1.319 1.392 1.294
(X) EquityOrdinary shares are classified as equity. Incremental costs directly attributable to the issue of new shares or options are shown in equity as a deduction from the proceeds, net of tax.
The equity component of hybrid securities is calculated and disclosed as set out in note 1(Q).
(Y) Earnings per share (i) basic earnings per shareBasic earnings per share is determined by dividing net profit after income tax attributable to members of the company, adjusted for the cost of servicing equity other than ordinary shares, by the weighted average number of ordinary shares outstanding during the financial year, adjusted for bonus elements in ordinary shares issued during the year, and excluding treasury shares (see note AB).
(ii) Diluted earnings per shareDiluted earnings per share adjusts the earnings figure used in the determination of basic earnings per share to exclude the after income tax effect of interest and other financing costs associated with dilutive potential ordinary shares, and adjusts the weighted average number of shares assumed to have been issued for no consideration. It also adjusts the weighted average number of shares to include dilutive potential ordinary shares and instruments with a mandatory conversion feature.
115O
ther
info
rmatio
n
6
Directo
rs' rep
ort
4
Fin
ancial
repo
rt
5
QB
E In
suran
ce Gro
up
A
nn
ual rep
ort 20
12B
usin
ess rev
iew
2
Go
vern
ance
3
High
lights
& o
verv
iew
1
(Z) DividendsProvision is made for dividends which are declared, being appropriately authorised and no longer at the discretion of the entity, on or before the end of the financial year but not distributed at the balance sheet date.
(AA) Employee benefits(i) superannuationThe Group participates in a number of superannuation plans and contributes to these plans in accordance with plan rules and actuarial recommendations, which are designed to ensure that each plan’s funding provides sufficient assets to meet its liabilities.
Defined contribution plansDefined contribution plans are post-employment benefit plans under which an entity pays a fixed contribution into a fund during the course of employment and has no legal or constructive obligation to pay further contributions if the fund does not hold sufficient assets to pay all employee benefits relating to employee service in the current and prior periods. Contributions to defined contribution plans are expensed as incurred.
Defined benefit plansDefined benefit plans are post-employment benefit plans other than defined contribution plans. The liability recognised in the balance sheet in respect of defined benefit superannuation plans is the present value of the defined benefit obligation at the balance sheet date less the fair value of plan assets, adjusted for any unrecognised past service costs. The defined benefit obligation is calculated annually by independent actuaries using the projected unit credit method. The present value of the defined benefit obligation is determined by discounting the estimated future cash outflows using interest rates of high quality corporate or government bonds that are denominated in the currency in which the benefits will be paid, and that have a term to maturity approximating the term of the related superannuation liability. Actuarial gains and losses arising from experience adjustments and changes in actuarial assumptions are recognised directly in equity and shown in other comprehensive income. Past service costs are recognised immediately in profit or loss, unless the changes to the superannuation plan are conditional on the employees remaining in service for a specified period of time (the vesting period), in which case the past service costs are amortised on a straight line basis over the vesting period.
(ii) share based paymentsShare based remuneration is provided in various forms to eligible employees and executives. All of the arrangements are equity settled, share based payments. The fair value of the employee services received in exchange for the grant of those instruments is recognised as an expense. The total amount to be expensed over the vesting period is determined by reference to the fair value of the instruments granted, excluding the impact of any non-market vesting conditions. The fair value at grant date of the options and conditional rights is calculated using a binomial model. The fair value of each instrument is recognised evenly over the service period ending at the vesting date. Non-market vesting conditions are included in assumptions about the number of instruments that are expected to become exercisable.
At each balance sheet date, the Group revises its estimates of the number of options that are expected to become exercisable due to the achievement of vesting conditions. The Group recognises the impact of the revision of original estimates, if any, in profit or loss with a corresponding adjustment to equity.
(iii) Profit sharing and bonus plansThe Group recognises a liability and an expense for bonuses and profit sharing based on a formula that takes into consideration the profit attributable to the company’s shareholders.
(iv) termination benefitsTermination benefits are payable when employment is terminated before the normal retirement date or when an employee accepts voluntary redundancy in exchange for these benefits. The Group recognises termination benefits when it has demonstrably committed to either:
• terminating the employment of current employees according to a detailed formal plan without possibility of withdrawal; or
• providing termination benefits as a result of an offer made to encourage voluntary redundancy.
(v) Long service leaveThe provision for long service leave is measured as the present value of expected future payments to be made in respect of services provided by employees up to the reporting date using the projected unit credit method. Benefits due more than 12 months after the balance sheet date are discounted to present value.
(AB) Treasury shares held in trustTreasury shares are shares in the Group that are held by trusts for the purpose of satisfying the company’s obligations under the Employee Share and Option Plan (the Plan). The assets, liabilities and results of share based remuneration trusts are included in the balance sheet and results of the Group. Any shares in the company held by a trust are measured at cost (including any attributable acquisition costs). No gain or loss is recognised in profit or loss on the sale, cancellation or reissue of these shares. On consolidation, these shares are presented on the balance sheet as treasury shares held in trust and represent a reduction in equity.
(AC) LeasesLeases in which a significant portion of the risks and rewards of ownership are retained by the lessor are classified as operating leases. Payments made under operating leases (net of any incentives received from the lessor) are charged to profit or loss on a straight line basis over the period of the lease.
(AD) Rounding of amountsThe company is of a kind referred to in the ASIC class order 98/100 dated 10 July 1998 (as amended by class order 04/667 dated 15 July 2004) relating to the “rounding off” of amounts in the financial statements. Amounts have been rounded off in the financial statements to the nearest million dollars or, in certain cases, to the nearest thousand dollars in accordance with that class order.
(AE) Segment reportingOperating segments are reported in a manner consistent with the internal reporting provided to the Group Executive, being the management body responsible for the Group’s strategy and operations, and the Group Board of directors.
(AF) Ultimate parent entity financial informationShares in controlled entities are recorded at cost less a provision for impairment in the ultimate parent entity balance sheet.
Section 5: Financial report
Notes to the financial statements CONTINUED
FOR THE YEAR ENDED 31 DECEMBER 2012
1. Summary of significant accounting policies CONTINUED
116 QBE Insurance Group
Annual report 2012
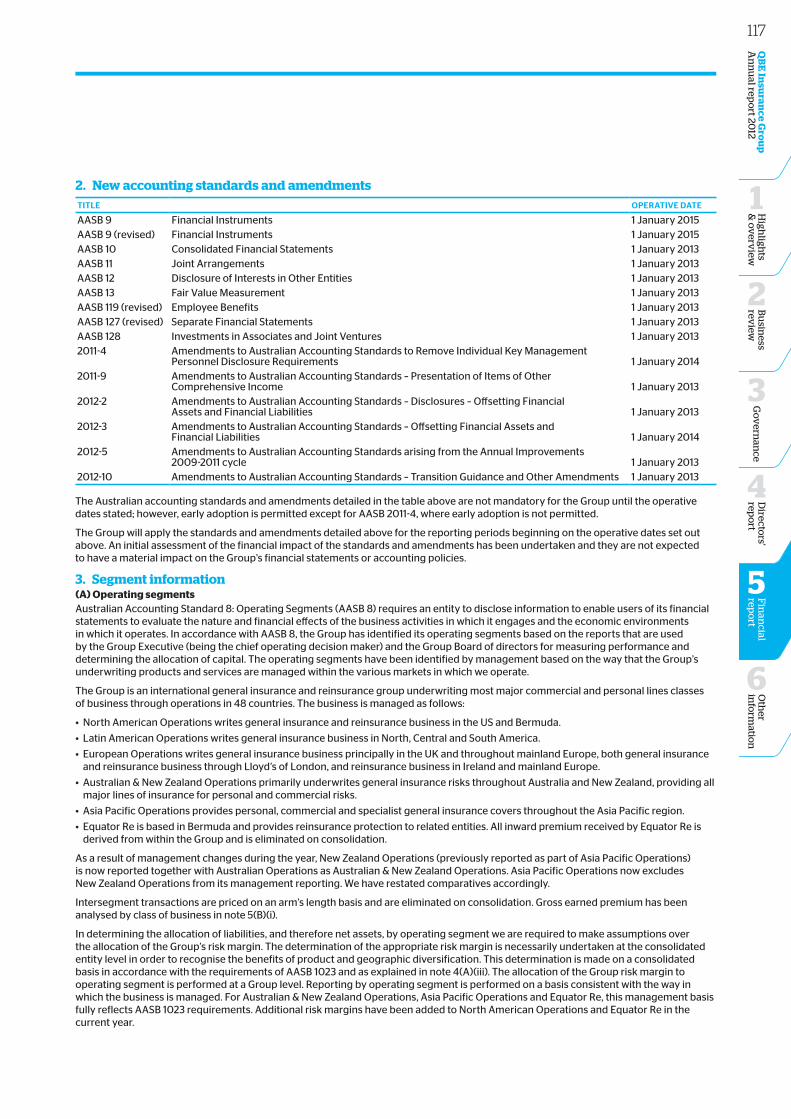
2. New accounting standards and amendmentstitLe oPerAtive DAte
AASB 9 Financial Instruments 1 January 2015AASB 9 (revised) Financial Instruments 1 January 2015AASB 10 Consolidated Financial Statements 1 January 2013AASB 11 Joint Arrangements 1 January 2013AASB 12 Disclosure of Interests in Other Entities 1 January 2013AASB 13 Fair Value Measurement 1 January 2013AASB 119 (revised) Employee Benefits 1 January 2013AASB 127 (revised) Separate Financial Statements 1 January 2013AASB 128 Investments in Associates and Joint Ventures 1 January 20132011-4 Amendments to Australian Accounting Standards to Remove Individual Key Management
Personnel Disclosure Requirements 1 January 20142011-9 Amendments to Australian Accounting Standards – Presentation of Items of Other
Comprehensive Income 1 January 20132012-2 Amendments to Australian Accounting Standards – Disclosures – Offsetting Financial
Assets and Financial Liabilities 1 January 20132012-3 Amendments to Australian Accounting Standards – Offsetting Financial Assets and
Financial Liabilities 1 January 20142012-5 Amendments to Australian Accounting Standards arising from the Annual Improvements
2009-2011 cycle 1 January 20132012-10 Amendments to Australian Accounting Standards – Transition Guidance and Other Amendments 1 January 2013
The Australian accounting standards and amendments detailed in the table above are not mandatory for the Group until the operative dates stated; however, early adoption is permitted except for AASB 2011-4, where early adoption is not permitted.
The Group will apply the standards and amendments detailed above for the reporting periods beginning on the operative dates set out above. An initial assessment of the financial impact of the standards and amendments has been undertaken and they are not expected to have a material impact on the Group’s financial statements or accounting policies.
3. Segment information(A) Operating segmentsAustralian Accounting Standard 8: Operating Segments (AASB 8) requires an entity to disclose information to enable users of its financial statements to evaluate the nature and financial effects of the business activities in which it engages and the economic environments in which it operates. In accordance with AASB 8, the Group has identified its operating segments based on the reports that are used by the Group Executive (being the chief operating decision maker) and the Group Board of directors for measuring performance and determining the allocation of capital. The operating segments have been identified by management based on the way that the Group’s underwriting products and services are managed within the various markets in which we operate.
The Group is an international general insurance and reinsurance group underwriting most major commercial and personal lines classes of business through operations in 48 countries. The business is managed as follows:
• North American Operations writes general insurance and reinsurance business in the US and Bermuda.
• Latin American Operations writes general insurance business in North, Central and South America.
• European Operations writes general insurance business principally in the UK and throughout mainland Europe, both general insurance and reinsurance business through Lloyd’s of London, and reinsurance business in Ireland and mainland Europe.
• Australian & New Zealand Operations primarily underwrites general insurance risks throughout Australia and New Zealand, providing all major lines of insurance for personal and commercial risks.
• Asia Pacific Operations provides personal, commercial and specialist general insurance covers throughout the Asia Pacific region.
• Equator Re is based in Bermuda and provides reinsurance protection to related entities. All inward premium received by Equator Re is derived from within the Group and is eliminated on consolidation.
As a result of management changes during the year, New Zealand Operations (previously reported as part of Asia Pacific Operations) is now reported together with Australian Operations as Australian & New Zealand Operations. Asia Pacific Operations now excludes New Zealand Operations from its management reporting. We have restated comparatives accordingly.
Intersegment transactions are priced on an arm’s length basis and are eliminated on consolidation. Gross earned premium has been analysed by class of business in note 5(B)(i).
In determining the allocation of liabilities, and therefore net assets, by operating segment we are required to make assumptions over the allocation of the Group’s risk margin. The determination of the appropriate risk margin is necessarily undertaken at the consolidated entity level in order to recognise the benefits of product and geographic diversification. This determination is made on a consolidated basis in accordance with the requirements of AASB 1023 and as explained in note 4(A)(iii). The allocation of the Group risk margin to operating segment is performed at a Group level. Reporting by operating segment is performed on a basis consistent with the way in which the business is managed. For Australian & New Zealand Operations, Asia Pacific Operations and Equator Re, this management basis fully reflects AASB 1023 requirements. Additional risk margins have been added to North American Operations and Equator Re in the current year.
117O
ther
info
rmatio
n
6
Directo
rs' rep
ort
4
Fin
ancial
repo
rt
5
QB
E In
suran
ce Gro
up
A
nn
ual rep
ort 20
12B
usin
ess rev
iew
2
Go
vern
ance
3
High
lights
& o
verv
iew
1
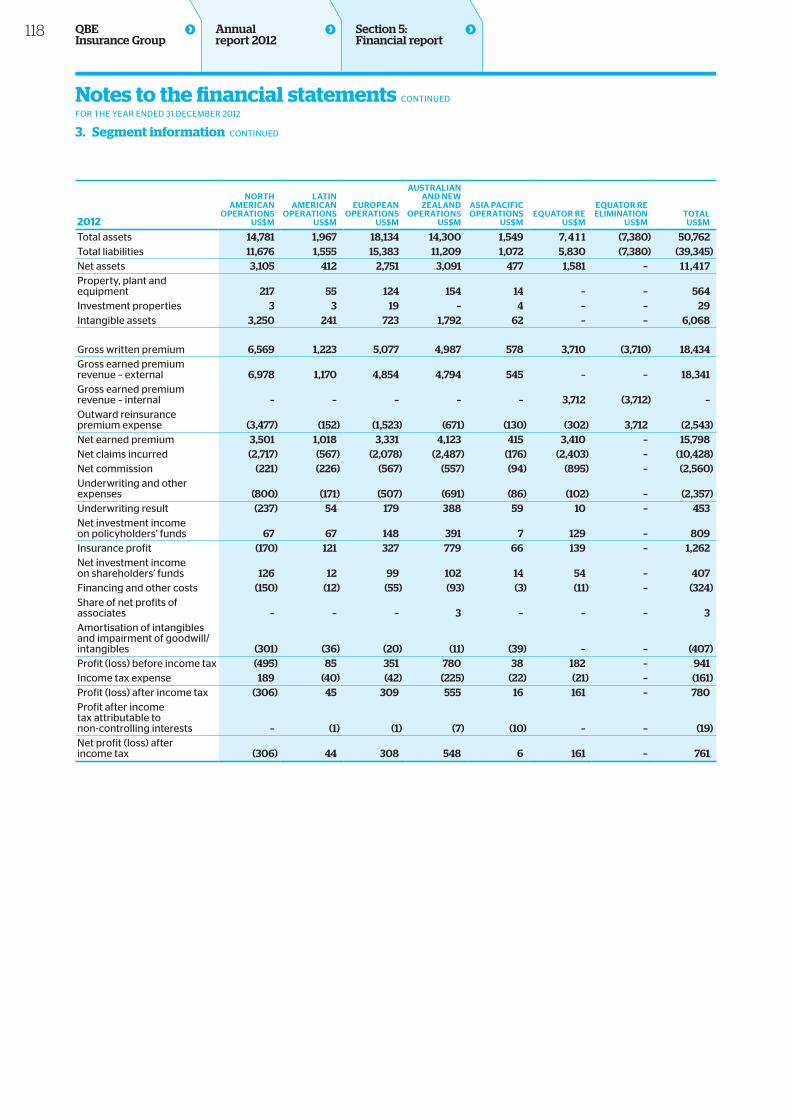
2012
NortHAmericAN
oPerAtioNsUs$m
LAtiNAmericAN
oPerAtioNsUs$m
eUroPeANoPerAtioNs
Us$m
AUstrALiANAND NewZeALAND
oPerAtioNsUs$m
AsiA PAciFicoPerAtioNs
Us$meqUAtor re
Us$m
eqUAtor reeLimiNAtioN
Us$mtotAL
Us$m
Total assets 14,781 1,967 18,134 14,300 1,549 7, 4 1 1 (7,380) 50,762Total liabilities 11,676 1,555 15,383 11,209 1,072 5,830 (7,380) (39,345)Net assets 3,105 412 2,751 3,091 477 1,581 – 1 1 ,4 17Property, plant and equipment 217 55 124 154 14 – – 564Investment properties 3 3 19 – 4 – – 29Intangible assets 3,250 241 723 1,792 62 – – 6,068
Gross written premium 6,569 1,223 5,077 4,987 578 3,710 (3,710) 18,434Gross earned premium revenue – external 6,978 1,170 4,854 4,794 545 – – 18,341Gross earned premium revenue – internal – – – – – 3,712 (3,712) –Outward reinsurance premium expense (3,477) (152) (1,523) (671) (130) (302) 3,712 (2,543)Net earned premium 3,501 1,018 3,331 4,123 415 3,410 – 15,798Net claims incurred (2,717) (567) (2,078) (2,487) (176) (2,403) – (10,428)Net commission (221) (226) (567) (557) (94) (895) – (2,560)Underwriting and other expenses (800) (171) (507) (691) (86) (102) – (2,357)Underwriting result (237) 54 179 388 59 10 – 453Net investment income on policyholders’ funds 67 67 148 391 7 129 – 809Insurance profit (170) 121 327 779 66 139 – 1,262Net investment income on shareholders’ funds 126 12 99 102 14 54 – 407Financing and other costs (150) (12) (55) (93) (3) (11) – (324)Share of net profits of associates – – – 3 – – – 3Amortisation of intangibles and impairment of goodwill/intangibles (301) (36) (20) (11) (39) – – (407)Profit (loss) before income tax (495) 85 351 780 38 182 – 941Income tax expense 189 (40) (42) (225) (22) (21) – (161)Profit (loss) after income tax (306) 45 309 555 16 161 – 780Profit after income tax attributable to non-controlling interests – (1) (1) (7) (10) – – (19)Net profit (loss) after income tax (306) 44 308 548 6 161 – 761
Section 5: Financial report
Notes to the financial statements CONTINUED
FOR THE YEAR ENDED 31 DECEMBER 2012
3. Segment information CONTINUED
118 QBE Insurance Group
Annual report 2012
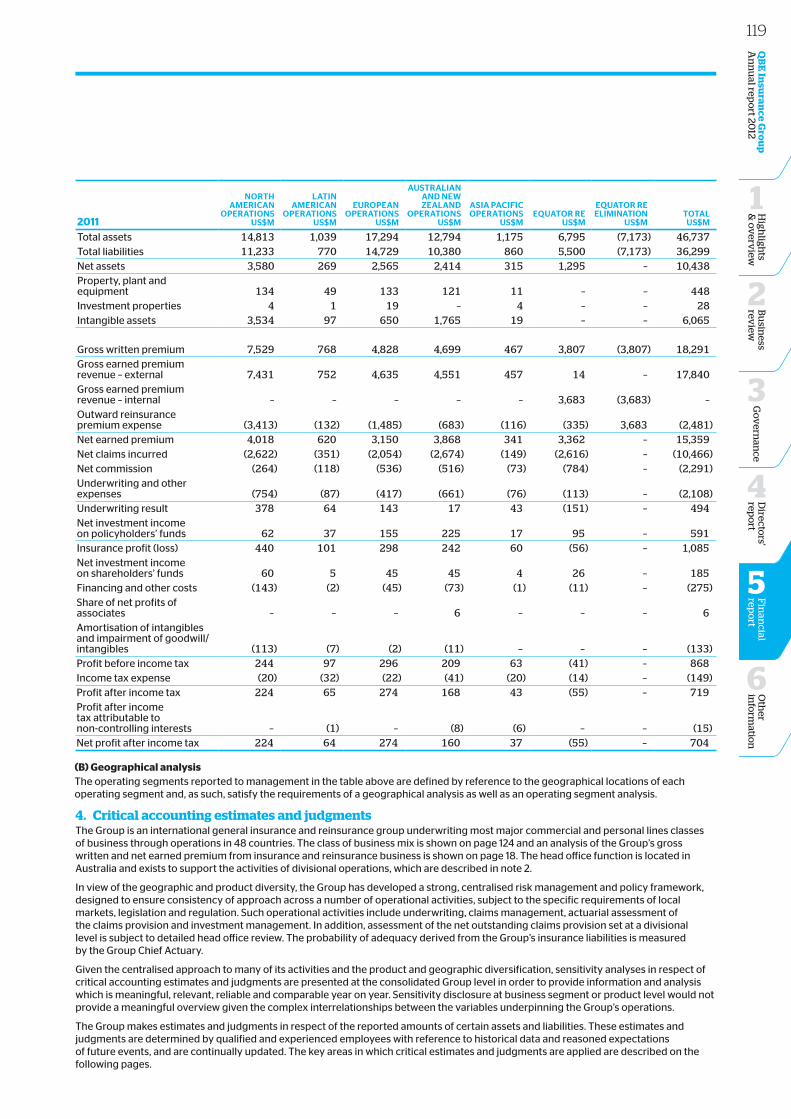
2011
NortHAmericAN
oPerAtioNsUs$m
LAtiNAmericAN
oPerAtioNsUs$m
eUroPeANoPerAtioNs
Us$m
AUstrALiANAND NewZeALAND
oPerAtioNsUs$m
AsiA PAciFicoPerAtioNs
Us$meqUAtor re
Us$m
eqUAtor reeLimiNAtioN
Us$mtotAL
Us$m
Total assets 14,813 1,039 17,294 12,794 1,175 6,795 (7,173) 46,737Total liabilities 11,233 770 14,729 10,380 860 5,500 (7,173) 36,299Net assets 3,580 269 2,565 2,414 315 1,295 – 10,438Property, plant and equipment 134 49 133 121 11 – – 448Investment properties 4 1 19 – 4 – – 28Intangible assets 3,534 97 650 1,765 19 – – 6,065
Gross written premium 7,529 768 4,828 4,699 467 3,807 (3,807) 18,291Gross earned premium revenue – external 7,431 752 4,635 4,551 457 14 – 17,840Gross earned premium revenue – internal – – – – – 3,683 (3,683) –Outward reinsurance premium expense (3,413) (132) (1,485) (683) (116) (335) 3,683 (2,481)Net earned premium 4,018 620 3,150 3,868 341 3,362 – 15,359Net claims incurred (2,622) (351) (2,054) (2,674) (149) (2,616) – (10,466)Net commission (264) (118) (536) (516) (73) (784) – (2,291)Underwriting and other expenses (754) (87) (417) (661) (76) (113) – (2,108)Underwriting result 378 64 143 17 43 (151) – 494Net investment income on policyholders’ funds 62 37 155 225 17 95 – 591Insurance profit (loss) 440 101 298 242 60 (56) – 1,085Net investment income on shareholders’ funds 60 5 45 45 4 26 – 185Financing and other costs (143) (2) (45) (73) (1) (11) – (275)Share of net profits of associates – – – 6 – – – 6Amortisation of intangibles and impairment of goodwill/intangibles (113) (7) (2) (11) – – – (133)Profit before income tax 244 97 296 209 63 (41) – 868Income tax expense (20) (32) (22) (41) (20) (14) – (149)Profit after income tax 224 65 274 168 43 (55) – 719Profit after income tax attributable to non-controlling interests – (1) – (8) (6) – – (15)Net profit after income tax 224 64 274 160 37 (55) – 704
(B) Geographical analysisThe operating segments reported to management in the table above are defined by reference to the geographical locations of each operating segment and, as such, satisfy the requirements of a geographical analysis as well as an operating segment analysis.
4. Critical accounting estimates and judgmentsThe Group is an international general insurance and reinsurance group underwriting most major commercial and personal lines classes of business through operations in 48 countries. The class of business mix is shown on page 124 and an analysis of the Group’s gross written and net earned premium from insurance and reinsurance business is shown on page 18. The head office function is located in Australia and exists to support the activities of divisional operations, which are described in note 2.
In view of the geographic and product diversity, the Group has developed a strong, centralised risk management and policy framework, designed to ensure consistency of approach across a number of operational activities, subject to the specific requirements of local markets, legislation and regulation. Such operational activities include underwriting, claims management, actuarial assessment of the claims provision and investment management. In addition, assessment of the net outstanding claims provision set at a divisional level is subject to detailed head office review. The probability of adequacy derived from the Group’s insurance liabilities is measured by the Group Chief Actuary.
Given the centralised approach to many of its activities and the product and geographic diversification, sensitivity analyses in respect of critical accounting estimates and judgments are presented at the consolidated Group level in order to provide information and analysis which is meaningful, relevant, reliable and comparable year on year. Sensitivity disclosure at business segment or product level would not provide a meaningful overview given the complex interrelationships between the variables underpinning the Group’s operations.
The Group makes estimates and judgments in respect of the reported amounts of certain assets and liabilities. These estimates and judgments are determined by qualified and experienced employees with reference to historical data and reasoned expectations of future events, and are continually updated. The key areas in which critical estimates and judgments are applied are described on the following pages.
119O
ther
info
rmatio
n
6
Directo
rs' rep
ort
4
Fin
ancial
repo
rt
5
QB
E In
suran
ce Gro
up
A
nn
ual rep
ort 20
12B
usin
ess rev
iew
2
Go
vern
ance
3
High
lights
& o
verv
iew
1
(A) Outstanding claims provisionThe Group’s net outstanding claims provision comprises:
• the gross central estimate of expected future claims payments;
• amounts recoverable from reinsurers based on the gross central estimate;
• a reduction to reflect the discount to present value using risk-free rates of return to reflect the time value of money; and
• a risk margin that reflects the inherent uncertainty in the net discounted central estimate.
A net discounted central estimate is intended to represent the mean of the distribution of the expected future cash flows. As the Group requires a higher probability that estimates will be adequate over time, a risk margin is added to the net discounted central estimate to determine the outstanding claims provision.
(i) central estimateThe provision for expected future payments includes those in relation to claims reported but not yet paid; claims incurred but not reported (IBNR); claims incurred but not enough reported (IBNER); and estimated claims handling costs, being the direct and indirect expenses incurred in the settlement of claims.
The estimation of IBNR is generally subject to a greater degree of uncertainty than the estimation of the cost of settling claims already notified to the Group, where more information about the claims is generally available. Liability and other long tail classes of business, where claims settlement may not happen for many years after the event giving rise to the claim, typically display greater variability between initial estimates and final settlement due to delays in reporting claims, uncertainty in respect of court awards and future claims inflation. Claims in respect of property and other short tail classes are typically reported and settled sooner after the claim event, giving rise to more certainty. The estimation techniques and assumptions used in determining the central estimate are described below.
The Group’s process for establishing the central estimate involves extensive consultation with internal and external actuaries, claims managers, underwriters and other senior management. This process includes quarterly in-house claims review meetings attended by senior divisional and Group management and detailed review by external actuaries at least annually. The risk management procedures related to the actuarial function are explained further in note 5.
The determination of the amounts that the Group will ultimately pay for claims arising under insurance and reinsurance contracts involves a number of critical assumptions. Some of the uncertainties impacting these assumptions are as follows:
• changes in patterns of claims incidence, reporting and payment;
• volatility in the estimation of future costs for long tail insurance classes due to the longer period of time that elapses before a definitive determination of the ultimate claims cost can be made;
• incidence of catastrophic events close to the balance sheet date;
• changes in the legal environment, including the interpretation of liability laws and the quantum of damages; and
• social and economic trends, for example price and wage inflation and interest rates.
The potential impact of changes in key assumptions used in the determination of the central estimate and the probability of adequacy of the central estimate on the Group’s profit or loss are summarised in note 4(A)(v).
Central estimates for each class of business are determined by reference to a variety of estimation techniques, generally based on a statistical analysis of historical experience which assumes an underlying pattern of claims development and payment. The final selected central estimates are based on a judgmental
consideration of the results of each method and qualitative information, for example, the class of business, the maturity of the portfolio and the expected term to settlement of the class. Projections are based on both historical experience and external benchmarks where relevant.
Central estimates are calculated gross of any reinsurance recoveries. A separate estimate is made of the amounts recoverable from reinsurers based on the gross central estimate.
The net central estimate is discounted at risk-free rates of return to reflect the time value of money. Details of the key assumptions applied in the discounting process are summarised in note 4(A)(iv).
(ii) Assets arising from contracts with reinsurersAssets arising from reinsurance recoveries under contracts with the Group’s reinsurers are determined using the same methods described above. In addition, the recoverability of these assets is assessed at each balance sheet date to ensure that the balances properly reflect the amounts that will ultimately be received, taking into account counterparty credit risk and the contractual terms of the reinsurance contract. Counterparty credit risk in relation to reinsurance assets is considered in note 5.
(iii) risk marginRisk margins are determined by management and are held to mitigate the potential for uncertainty in the central estimate. The determination of the appropriate level of risk margin takes into account similar factors to those used to determine the central estimate, such as:
• change in the mix of business, in particular the mix of short tail and long tail business and the overall weighted average term to settlement;
• prior accident year claims development; and
• the level of uncertainty in the net discounted central estimate due to actuarial estimation, data quality issues, variability of key discount and inflation assumptions and economic and legislative uncertainty.
The variability by class of business is measured using techniques similar to those used in determining the central estimate. These techniques determine a range of possible outcomes of ultimate payments and assign a likelihood to outcomes at different levels. These techniques use standard statistical distributions, and the measure of variability is referred to as the coefficient of variation. The potential impact of changes in the coefficient of variation assumptions on the Group’s profit or loss is summarised in note 4(A)(v).
The appropriate risk margin for two or more classes of business or for two or more geographic locations combined is likely to be less than the sum of the risk margins for the individual classes. This reflects the benefit of diversification in general insurance. The statistical measure used to determine diversification is called the correlation. The higher the correlation between two classes of business, the more likely it is that a negative outcome in one class will correspond to a negative outcome in the other class. For example, high correlation exists between classes of business affected by court cases involving bodily injury claims such as motor third party liability (CTP), workers’ compensation and public liability.
The risk margin for the Group is determined by analysing the variability of each class of business and the correlation between classes of business and divisions. Correlations are determined for aggregations of classes of business, where appropriate, at the divisional level. Whilst there are estimation techniques for determining correlations, they are difficult to apply. The correlations adopted by the Group are generally derived from industry analysis, the Group’s historical experience and the judgment of experienced and qualified actuaries.
Section 5: Financial report
Notes to the financial statements CONTINUED
FOR THE YEAR ENDED 31 DECEMBER 2012
4. Critical accounting estimates and judgments CONTINUED
120 QBE Insurance Group
Annual report 2012
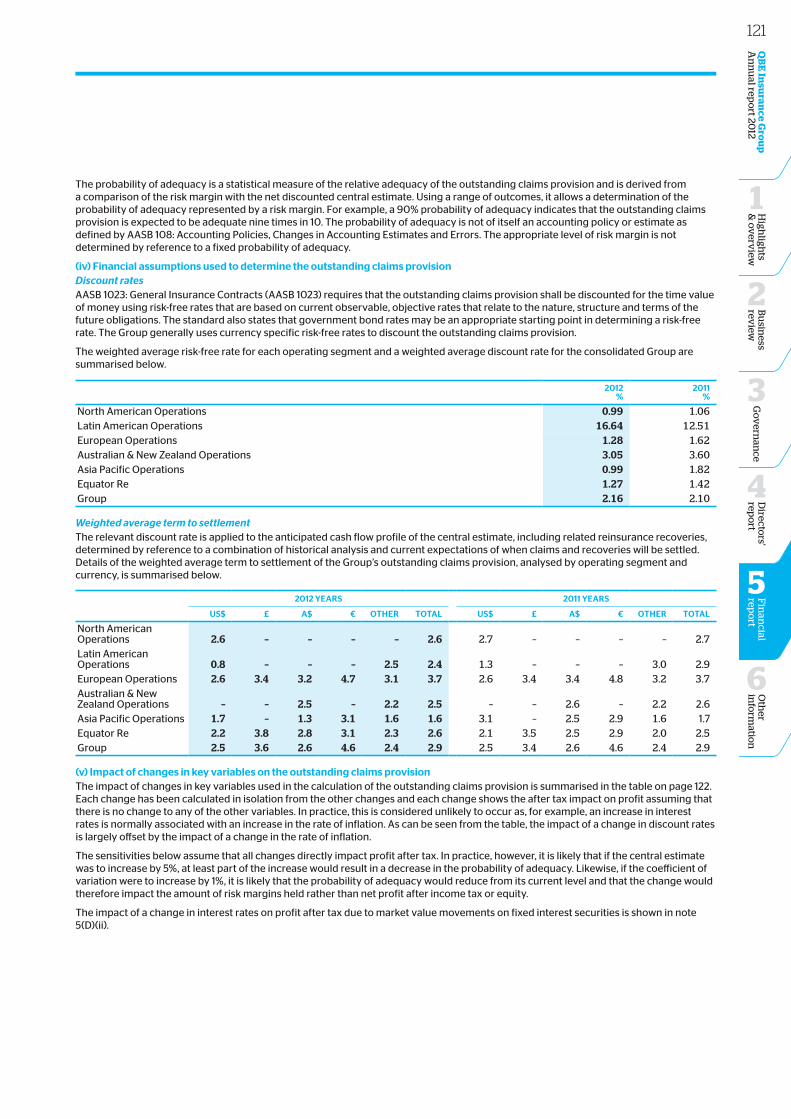
The probability of adequacy is a statistical measure of the relative adequacy of the outstanding claims provision and is derived from a comparison of the risk margin with the net discounted central estimate. Using a range of outcomes, it allows a determination of the probability of adequacy represented by a risk margin. For example, a 90% probability of adequacy indicates that the outstanding claims provision is expected to be adequate nine times in 10. The probability of adequacy is not of itself an accounting policy or estimate as defined by AASB 108: Accounting Policies, Changes in Accounting Estimates and Errors. The appropriate level of risk margin is not determined by reference to a fixed probability of adequacy.
(iv) Financial assumptions used to determine the outstanding claims provisionDiscount ratesAASB 1023: General Insurance Contracts (AASB 1023) requires that the outstanding claims provision shall be discounted for the time value of money using risk-free rates that are based on current observable, objective rates that relate to the nature, structure and terms of the future obligations. The standard also states that government bond rates may be an appropriate starting point in determining a risk-free rate. The Group generally uses currency specific risk-free rates to discount the outstanding claims provision.
The weighted average risk-free rate for each operating segment and a weighted average discount rate for the consolidated Group are summarised below.
2012%
2011%
North American Operations 0.99 1.06Latin American Operations 16.64 12.51European Operations 1.28 1.62Australian & New Zealand Operations 3.05 3.60Asia Pacific Operations 0.99 1.82Equator Re 1.27 1.42Group 2.16 2.10
Weighted average term to settlementThe relevant discount rate is applied to the anticipated cash flow profile of the central estimate, including related reinsurance recoveries, determined by reference to a combination of historical analysis and current expectations of when claims and recoveries will be settled. Details of the weighted average term to settlement of the Group’s outstanding claims provision, analysed by operating segment and currency, is summarised below.
2012 yeArs 2011 yeArs
Us$ £ A$ € otHer totAL Us$ £ A$ € otHer totAL
North American Operations 2.6 – – – – 2.6 2.7 – – – – 2.7Latin American Operations 0.8 – – – 2.5 2.4 1.3 – – – 3.0 2.9European Operations 2.6 3.4 3.2 4.7 3.1 3.7 2.6 3.4 3.4 4.8 3.2 3.7Australian & New Zealand Operations – – 2.5 – 2.2 2.5 – – 2.6 – 2.2 2.6Asia Pacific Operations 1.7 – 1.3 3.1 1.6 1.6 3.1 – 2.5 2.9 1.6 1.7Equator Re 2.2 3.8 2.8 3.1 2.3 2.6 2.1 3.5 2.5 2.9 2.0 2.5Group 2.5 3.6 2.6 4.6 2.4 2.9 2.5 3.4 2.6 4.6 2.4 2.9
(v) impact of changes in key variables on the outstanding claims provisionThe impact of changes in key variables used in the calculation of the outstanding claims provision is summarised in the table on page 122. Each change has been calculated in isolation from the other changes and each change shows the after tax impact on profit assuming that there is no change to any of the other variables. In practice, this is considered unlikely to occur as, for example, an increase in interest rates is normally associated with an increase in the rate of inflation. As can be seen from the table, the impact of a change in discount rates is largely offset by the impact of a change in the rate of inflation.
The sensitivities below assume that all changes directly impact profit after tax. In practice, however, it is likely that if the central estimate was to increase by 5%, at least part of the increase would result in a decrease in the probability of adequacy. Likewise, if the coefficient of variation were to increase by 1%, it is likely that the probability of adequacy would reduce from its current level and that the change would therefore impact the amount of risk margins held rather than net profit after income tax or equity.
The impact of a change in interest rates on profit after tax due to market value movements on fixed interest securities is shown in note 5(D)(ii).
121O
ther
info
rmatio
n
6
Directo
rs' rep
ort
4
Fin
ancial
repo
rt
5
QB
E In
suran
ce Gro
up
A
nn
ual rep
ort 20
12B
usin
ess rev
iew
2
Go
vern
ance
3
High
lights
& o
verv
iew
1
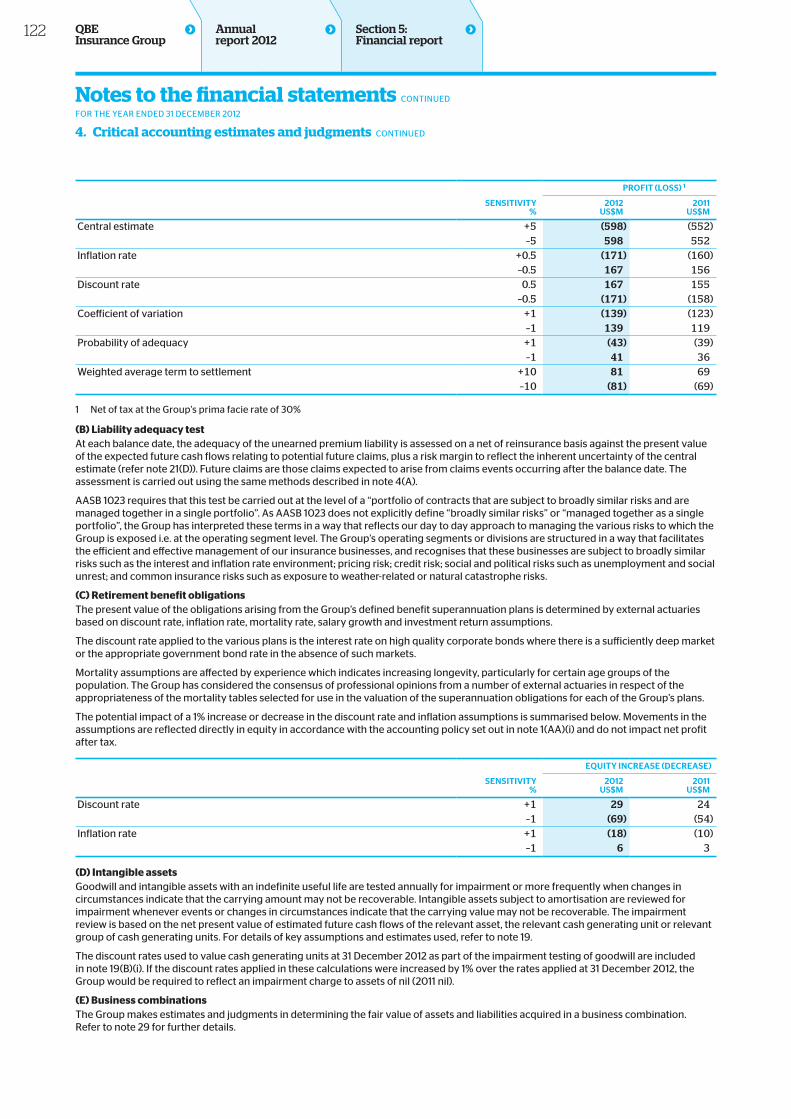
seNsitivity%
ProFit (Loss) 1
2012Us$m
2011Us$m
Central estimate +5 (598) (552)–5 598 552
Inflation rate +0.5 (171) (160)–0.5 167 156
Discount rate 0.5 167 155–0.5 (171) (158)
Coefficient of variation +1 (139) (123)–1 139 119
Probability of adequacy +1 (43) (39)–1 41 36
Weighted average term to settlement +10 81 69–10 (81) (69)
1 Net of tax at the Group’s prima facie rate of 30%
(B) Liability adequacy testAt each balance date, the adequacy of the unearned premium liability is assessed on a net of reinsurance basis against the present value of the expected future cash flows relating to potential future claims, plus a risk margin to reflect the inherent uncertainty of the central estimate (refer note 21(D)). Future claims are those claims expected to arise from claims events occurring after the balance date. The assessment is carried out using the same methods described in note 4(A).
AASB 1023 requires that this test be carried out at the level of a “portfolio of contracts that are subject to broadly similar risks and are managed together in a single portfolio”. As AASB 1023 does not explicitly define “broadly similar risks” or “managed together as a single portfolio”, the Group has interpreted these terms in a way that reflects our day to day approach to managing the various risks to which the Group is exposed i.e. at the operating segment level. The Group’s operating segments or divisions are structured in a way that facilitates the efficient and effective management of our insurance businesses, and recognises that these businesses are subject to broadly similar risks such as the interest and inflation rate environment; pricing risk; credit risk; social and political risks such as unemployment and social unrest; and common insurance risks such as exposure to weather-related or natural catastrophe risks.
(C) Retirement benefit obligationsThe present value of the obligations arising from the Group’s defined benefit superannuation plans is determined by external actuaries based on discount rate, inflation rate, mortality rate, salary growth and investment return assumptions.
The discount rate applied to the various plans is the interest rate on high quality corporate bonds where there is a sufficiently deep market or the appropriate government bond rate in the absence of such markets.
Mortality assumptions are affected by experience which indicates increasing longevity, particularly for certain age groups of the population. The Group has considered the consensus of professional opinions from a number of external actuaries in respect of the appropriateness of the mortality tables selected for use in the valuation of the superannuation obligations for each of the Group’s plans.
The potential impact of a 1% increase or decrease in the discount rate and inflation assumptions is summarised below. Movements in the assumptions are reflected directly in equity in accordance with the accounting policy set out in note 1(AA)(i) and do not impact net profit after tax.
seNsitivity%
eqUity iNcreAse (DecreAse)
2012Us$m
2011Us$m
Discount rate +1 29 24–1 (69) (54)
Inflation rate +1 (18) (10)–1 6 3
(D) Intangible assetsGoodwill and intangible assets with an indefinite useful life are tested annually for impairment or more frequently when changes in circumstances indicate that the carrying amount may not be recoverable. Intangible assets subject to amortisation are reviewed for impairment whenever events or changes in circumstances indicate that the carrying value may not be recoverable. The impairment review is based on the net present value of estimated future cash flows of the relevant asset, the relevant cash generating unit or relevant group of cash generating units. For details of key assumptions and estimates used, refer to note 19.
The discount rates used to value cash generating units at 31 December 2012 as part of the impairment testing of goodwill are included in note 19(B)(i). If the discount rates applied in these calculations were increased by 1% over the rates applied at 31 December 2012, the Group would be required to reflect an impairment charge to assets of nil (2011 nil).
(E) Business combinationsThe Group makes estimates and judgments in determining the fair value of assets and liabilities acquired in a business combination. Refer to note 29 for further details.
Section 5: Financial report
Notes to the financial statements CONTINUED
FOR THE YEAR ENDED 31 DECEMBER 2012
4. Critical accounting estimates and judgments CONTINUED
122 QBE Insurance Group
Annual report 2012
5. Risk ManagementAn overview of the Group’s risk management framework is provided in the risk management statement on pages 66 to 69 and in the risk management section of the corporate governance statement on pages 78 and 79.
The Group’s risk management policy, strategy and framework are embedded in the head office function and in each of the divisional operations, ensuring a consistent approach to managing risk across the organisation. The Board annually approves a comprehensive risk management strategy (RMS) and a reinsurance management strategy (REMS), both of which are lodged with the Australian Prudential Regulation Authority (APRA).
The Group’s risk management policy objectives are to:
• achieve competitive advantage through better understanding the risk environment in which QBE operates;
• optimise risk and more effectively allocate capital and resources by assessing the balance of risk and reward; and
• avoid unwelcome surprises by reducing uncertainty and volatility.
It is QBE’s policy to adopt a rigorous approach to managing risk throughout the Group. Risk management is a continuous process and an integral part of quality business management. QBE’s approach is to integrate risk management into the broader management processes of the organisation. It is QBE’s philosophy to ensure that risk management remains embedded in the business and that the risk makers or risk takers are themselves the risk managers. Specifically, the management of risk must occur at each point in the business management cycle.
Risk management is a key part of our governance structure and our strategic and business planning. It underpins the setting of limits and authorities and it is embedded in the monitoring and evaluation of performance. This holistic approach to risk management allows all of the Group’s risks to be managed in an integrated manner.
QBE’s global risk management framework defines the risks that QBE is exposed to and sets out the framework to manage those risks and meet strategic objectives whilst taking into account the creation of value for our shareholders. The framework is made up of complementary elements that are embedded throughout the business management cycle and culture. Key aspects include: governance, risk appetite and tolerance, delegated authorities, risk policies, measurement and modelling, risk and control self assessment, risk treatment, optimisation and ongoing improvement through management action plans and risk and performance monitoring.
A fundamental part of the Group’s overall risk management strategy is the effective governance and management of the risks that impact the amount, timing and uncertainty of cash flows from insurance contracts. The operating activities of the Group expose it to risks such as market risk, credit risk and liquidity risk. The Group’s risk management framework recognises the unpredictability of financial markets and seeks to minimise potential adverse effects on its financial performance. The Group has established internal controls to manage risk in the key areas of exposure relevant to its business.
QBE’s risk profile is described under the following broad risk categories:
• Strategic and business risk
• Insurance risk
• Credit risk
• Market risk
• Liquidity risk
• Operational risk
Each of these is described more fully in sections (A) to (F) below.
(A) Strategic and business riskStrategic risk refers to the current and prospective impact on earnings and/or capital arising from strategic business decisions, implementation of decisions and responsiveness to external change. This includes risks associated with business strategy and change, investment strategy and corporate governance. Of particular relevance are acquisition and capital management risk.
(i) Acquisition riskThe Group’s strategy of growth by acquisition exposes it to additional risks. Acquisition risks are principally managed by the Group’s controls over the selection of potential acquisitions, due diligence, negotiation of warranties and indemnities and subsequent integration processes. QBE has experienced due diligence teams in each operating division and has documented minimum requirements for carrying out due diligence.
(ii) capital management riskAustralian and overseas controlled entities are subject to extensive prudential and other forms of regulation in the jurisdictions in which they conduct business. Prudential regulation is generally designed to protect policyholders. Regulation covers a number of areas including solvency, change in control and capital movement limitations. The regulatory environment in Australia and overseas continues to evolve in response to economic, political and industry developments. QBE works closely with regulators and monitors regulatory developments across its global operations to assess their potential impact on its ability to meet solvency and other requirements. Refer to note 26(E).
(B) Insurance riskInsurance risk is the risk of fluctuations in the timing, frequency and severity of insured events and claims settlements, relative to the expectations at the time of underwriting. This includes underwriting, catastrophe claims concentration and claims estimation risks. The risks inherent in any single insurance contract are the possibility of the insured event occurring and the uncertainty of the amount of the resulting claim. By the very nature of an insurance contract, these risks are random and unpredictable. In relation to the pricing of individual insurance contracts and the determination of the level of the outstanding claims provision in relation to a portfolio of insurance contracts, the principal risk is that the ultimate claims payments will exceed the carrying amount of the provision established.
Experience shows that the larger the portfolio of similar insurance contracts, the smaller the relative variability around the expected outcome will be. In addition, a more diversified insurance and reinsurance group is less likely to be affected by a change in any one specific portfolio. The Group has developed its underwriting strategy to diversify the type of insurance risks accepted and, within each of these categories, to achieve a sufficiently large population of risks to reduce the variability of the expected outcome.
QBE has established the following protocols to manage its insurance risk across the underwriting, claims and actuarial disciplines.
(i) Underwriting risksSelection and pricing of risksUnderwriting authority is delegated to experienced underwriters for the forthcoming year following a detailed retrospective and prospective analysis of each class of business as part of the Group’s annual business planning process. Delegated authorities reflect the level of risk which QBE is prepared to take.
123O
ther
info
rmatio
n
6
Directo
rs' rep
ort
4
Fin
ancial
repo
rt
5
QB
E In
suran
ce Gro
up
A
nn
ual rep
ort 20
12B
usin
ess rev
iew
2
Go
vern
ance
3
High
lights
& o
verv
iew
1
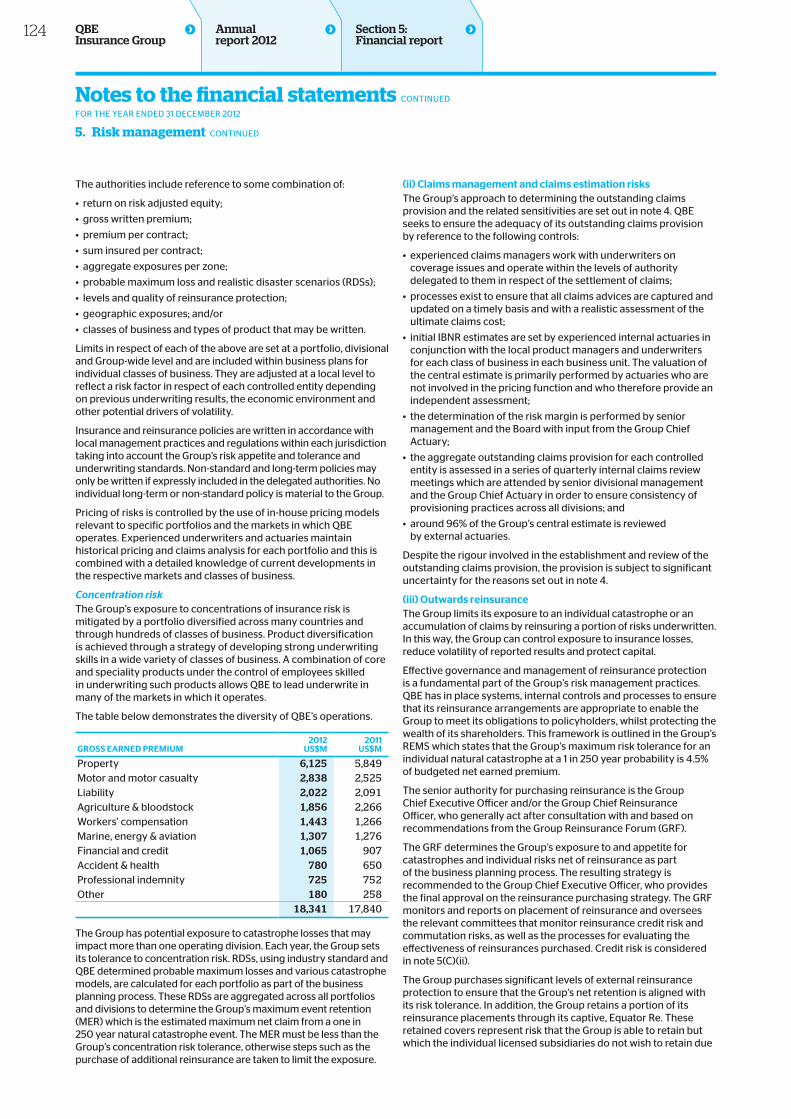
The authorities include reference to some combination of:
• return on risk adjusted equity;
• gross written premium;
• premium per contract;
• sum insured per contract;
• aggregate exposures per zone;
• probable maximum loss and realistic disaster scenarios (RDSs);
• levels and quality of reinsurance protection;
• geographic exposures; and/or
• classes of business and types of product that may be written.
Limits in respect of each of the above are set at a portfolio, divisional and Group-wide level and are included within business plans for individual classes of business. They are adjusted at a local level to reflect a risk factor in respect of each controlled entity depending on previous underwriting results, the economic environment and other potential drivers of volatility.
Insurance and reinsurance policies are written in accordance with local management practices and regulations within each jurisdiction taking into account the Group’s risk appetite and tolerance and underwriting standards. Non-standard and long-term policies may only be written if expressly included in the delegated authorities. No individual long-term or non-standard policy is material to the Group.
Pricing of risks is controlled by the use of in-house pricing models relevant to specific portfolios and the markets in which QBE operates. Experienced underwriters and actuaries maintain historical pricing and claims analysis for each portfolio and this is combined with a detailed knowledge of current developments in the respective markets and classes of business.
Concentration riskThe Group’s exposure to concentrations of insurance risk is mitigated by a portfolio diversified across many countries and through hundreds of classes of business. Product diversification is achieved through a strategy of developing strong underwriting skills in a wide variety of classes of business. A combination of core and speciality products under the control of employees skilled in underwriting such products allows QBE to lead underwrite in many of the markets in which it operates.
The table below demonstrates the diversity of QBE’s operations.
Gross eArNeD PremiUm2012
Us$m2011
Us$m
Property 6,125 5,849Motor and motor casualty 2,838 2,525Liability 2,022 2,091Agriculture & bloodstock 1,856 2,266Workers’ compensation 1,443 1,266Marine, energy & aviation 1,307 1,276Financial and credit 1,065 907Accident & health 780 650Professional indemnity 725 752Other 180 258 18,341 17,840
The Group has potential exposure to catastrophe losses that may impact more than one operating division. Each year, the Group sets its tolerance to concentration risk. RDSs, using industry standard and QBE determined probable maximum losses and various catastrophe models, are calculated for each portfolio as part of the business planning process. These RDSs are aggregated across all portfolios and divisions to determine the Group’s maximum event retention (MER) which is the estimated maximum net claim from a one in 250 year natural catastrophe event. The MER must be less than the Group’s concentration risk tolerance, otherwise steps such as the purchase of additional reinsurance are taken to limit the exposure.
(ii) claims management and claims estimation risks The Group’s approach to determining the outstanding claims provision and the related sensitivities are set out in note 4. QBE seeks to ensure the adequacy of its outstanding claims provision by reference to the following controls:
• experienced claims managers work with underwriters on coverage issues and operate within the levels of authority delegated to them in respect of the settlement of claims;
• processes exist to ensure that all claims advices are captured and updated on a timely basis and with a realistic assessment of the ultimate claims cost;
• initial IBNR estimates are set by experienced internal actuaries in conjunction with the local product managers and underwriters for each class of business in each business unit. The valuation of the central estimate is primarily performed by actuaries who are not involved in the pricing function and who therefore provide an independent assessment;
• the determination of the risk margin is performed by senior management and the Board with input from the Group Chief Actuary;
• the aggregate outstanding claims provision for each controlled entity is assessed in a series of quarterly internal claims review meetings which are attended by senior divisional management and the Group Chief Actuary in order to ensure consistency of provisioning practices across all divisions; and
• around 96% of the Group’s central estimate is reviewed by external actuaries.
Despite the rigour involved in the establishment and review of the outstanding claims provision, the provision is subject to significant uncertainty for the reasons set out in note 4.
(iii) outwards reinsurance The Group limits its exposure to an individual catastrophe or an accumulation of claims by reinsuring a portion of risks underwritten. In this way, the Group can control exposure to insurance losses, reduce volatility of reported results and protect capital.
Effective governance and management of reinsurance protection is a fundamental part of the Group’s risk management practices. QBE has in place systems, internal controls and processes to ensure that its reinsurance arrangements are appropriate to enable the Group to meet its obligations to policyholders, whilst protecting the wealth of its shareholders. This framework is outlined in the Group’s REMS which states that the Group’s maximum risk tolerance for an individual natural catastrophe at a 1 in 250 year probability is 4.5% of budgeted net earned premium.
The senior authority for purchasing reinsurance is the Group Chief Executive Officer and/or the Group Chief Reinsurance Officer, who generally act after consultation with and based on recommendations from the Group Reinsurance Forum (GRF).
The GRF determines the Group’s exposure to and appetite for catastrophes and individual risks net of reinsurance as part of the business planning process. The resulting strategy is recommended to the Group Chief Executive Officer, who provides the final approval on the reinsurance purchasing strategy. The GRF monitors and reports on placement of reinsurance and oversees the relevant committees that monitor reinsurance credit risk and commutation risks, as well as the processes for evaluating the effectiveness of reinsurances purchased. Credit risk is considered in note 5(C)(ii).
The Group purchases significant levels of external reinsurance protection to ensure that the Group’s net retention is aligned with its risk tolerance. In addition, the Group retains a portion of its reinsurance placements through its captive, Equator Re. These retained covers represent risk that the Group is able to retain but which the individual licensed subsidiaries do not wish to retain due
Section 5: Financial report
Notes to the financial statements CONTINUED
FOR THE YEAR ENDED 31 DECEMBER 2012
5. Risk management CONTINUED
124 QBE Insurance Group
Annual report 2012
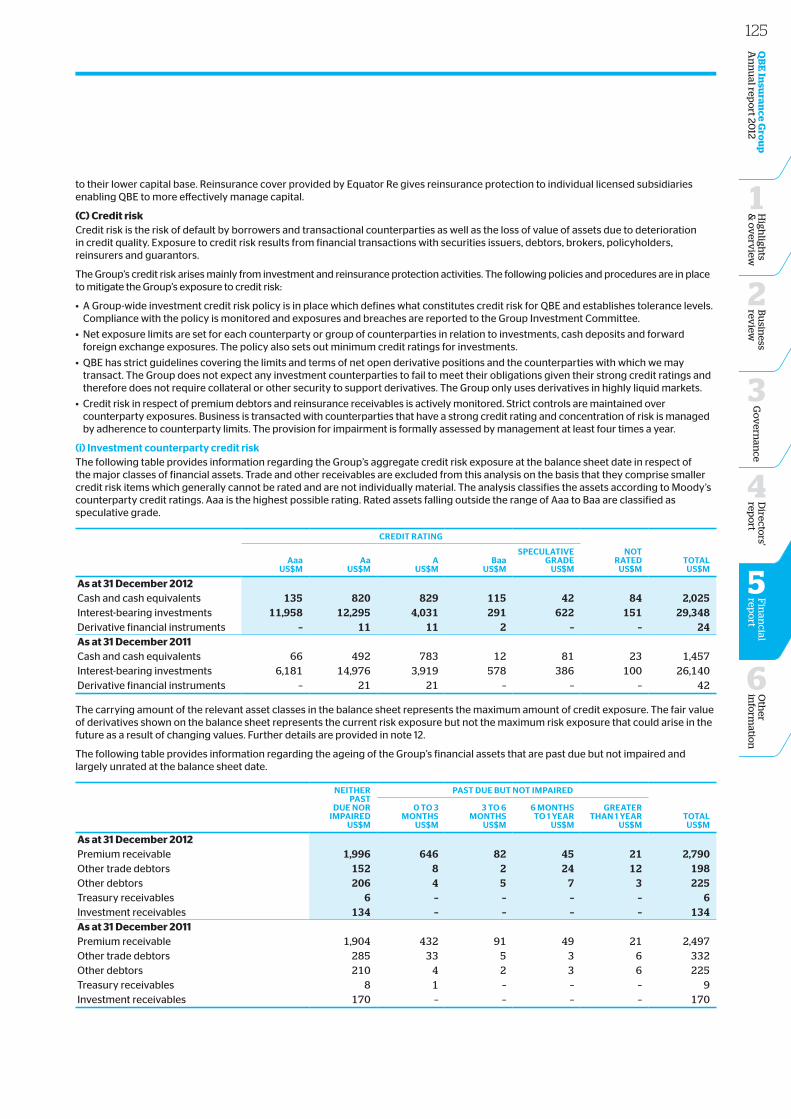
to their lower capital base. Reinsurance cover provided by Equator Re gives reinsurance protection to individual licensed subsidiaries enabling QBE to more effectively manage capital.
(C) Credit risk Credit risk is the risk of default by borrowers and transactional counterparties as well as the loss of value of assets due to deterioration in credit quality. Exposure to credit risk results from financial transactions with securities issuers, debtors, brokers, policyholders, reinsurers and guarantors.
The Group’s credit risk arises mainly from investment and reinsurance protection activities. The following policies and procedures are in place to mitigate the Group’s exposure to credit risk:
• A Group-wide investment credit risk policy is in place which defines what constitutes credit risk for QBE and establishes tolerance levels. Compliance with the policy is monitored and exposures and breaches are reported to the Group Investment Committee.
• Net exposure limits are set for each counterparty or group of counterparties in relation to investments, cash deposits and forward foreign exchange exposures. The policy also sets out minimum credit ratings for investments.
• QBE has strict guidelines covering the limits and terms of net open derivative positions and the counterparties with which we may transact. The Group does not expect any investment counterparties to fail to meet their obligations given their strong credit ratings and therefore does not require collateral or other security to support derivatives. The Group only uses derivatives in highly liquid markets.
• Credit risk in respect of premium debtors and reinsurance receivables is actively monitored. Strict controls are maintained over counterparty exposures. Business is transacted with counterparties that have a strong credit rating and concentration of risk is managed by adherence to counterparty limits. The provision for impairment is formally assessed by management at least four times a year.
(i) investment counterparty credit riskThe following table provides information regarding the Group’s aggregate credit risk exposure at the balance sheet date in respect of the major classes of financial assets. Trade and other receivables are excluded from this analysis on the basis that they comprise smaller credit risk items which generally cannot be rated and are not individually material. The analysis classifies the assets according to Moody’s counterparty credit ratings. Aaa is the highest possible rating. Rated assets falling outside the range of Aaa to Baa are classified as speculative grade.
creDit rAtiNG
NotrAteD
Us$mtotAL
Us$mAaa
Us$mAa
Us$mA
Us$mbaa
Us$m
sPecULAtiveGrADe
Us$m
As at 31 December 2012 Cash and cash equivalents 135 820 829 115 42 84 2,025Interest-bearing investments 11,958 12,295 4,031 291 622 151 29,348Derivative financial instruments – 11 11 2 – – 24 As at 31 December 2011Cash and cash equivalents 66 492 783 12 81 23 1,457Interest-bearing investments 6,181 14,976 3,919 578 386 100 26,140Derivative financial instruments – 21 21 – – – 42
The carrying amount of the relevant asset classes in the balance sheet represents the maximum amount of credit exposure. The fair value of derivatives shown on the balance sheet represents the current risk exposure but not the maximum risk exposure that could arise in the future as a result of changing values. Further details are provided in note 12.
The following table provides information regarding the ageing of the Group’s financial assets that are past due but not impaired and largely unrated at the balance sheet date.
NeitHerPAst
DUe NorimPAireD
Us$m
PAst DUe bUt Not imPAireD
totALUs$m
0 to 3moNtHs
Us$m
3 to 6moNtHs
Us$m
6 moNtHsto 1 yeAr
Us$m
GreAtertHAN 1 yeAr
Us$m
As at 31 December 2012 Premium receivable 1,996 646 82 45 21 2,790 Other trade debtors 152 8 2 24 12 198Other debtors 206 4 5 7 3 225 Treasury receivables 6 – – – – 6 Investment receivables 134 – – – – 134 As at 31 December 2011Premium receivable 1,904 432 91 49 21 2,497Other trade debtors 285 33 5 3 6 332Other debtors 210 4 2 3 6 225Treasury receivables 8 1 – – – 9Investment receivables 170 – – – – 170
125O
ther
info
rmatio
n
6
Directo
rs' rep
ort
4
Fin
ancial
repo
rt
5
QB
E In
suran
ce Gro
up
A
nn
ual rep
ort 20
12B
usin
ess rev
iew
2
Go
vern
ance
3
High
lights
& o
verv
iew
1
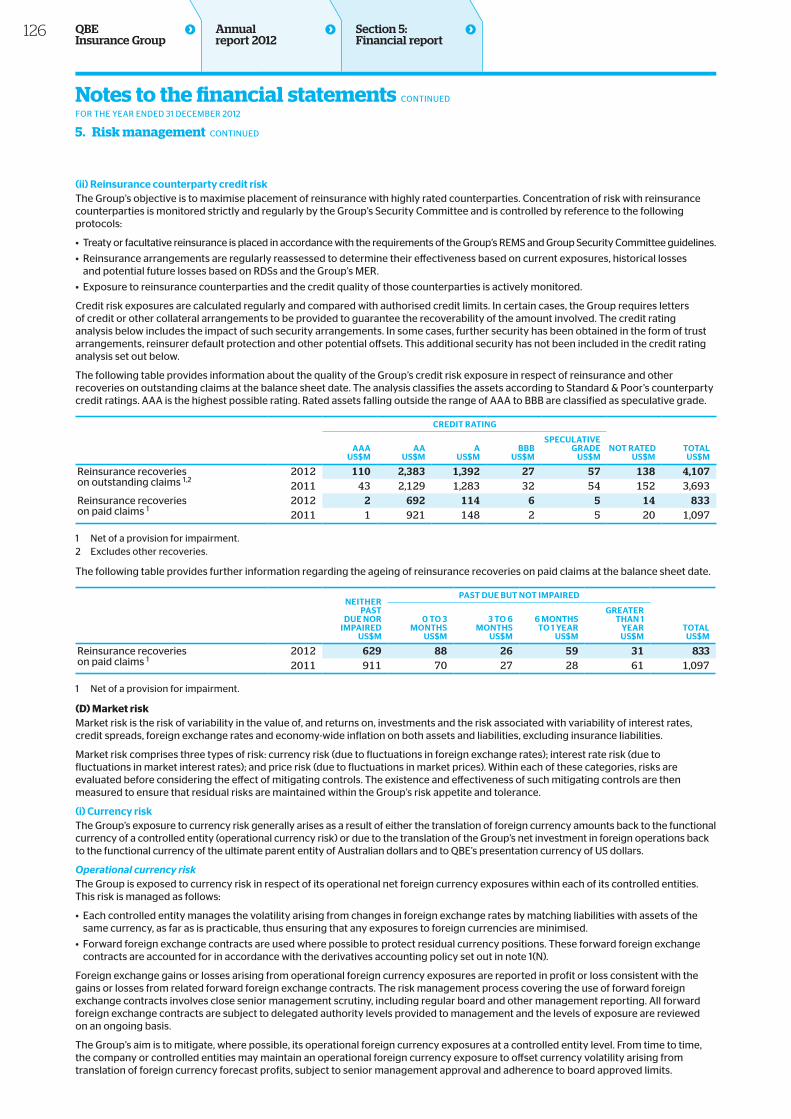
(ii) reinsurance counterparty credit riskThe Group’s objective is to maximise placement of reinsurance with highly rated counterparties. Concentration of risk with reinsurance counterparties is monitored strictly and regularly by the Group’s Security Committee and is controlled by reference to the following protocols:
• Treaty or facultative reinsurance is placed in accordance with the requirements of the Group’s REMS and Group Security Committee guidelines.
• Reinsurance arrangements are regularly reassessed to determine their effectiveness based on current exposures, historical losses and potential future losses based on RDSs and the Group’s MER.
• Exposure to reinsurance counterparties and the credit quality of those counterparties is actively monitored.
Credit risk exposures are calculated regularly and compared with authorised credit limits. In certain cases, the Group requires letters of credit or other collateral arrangements to be provided to guarantee the recoverability of the amount involved. The credit rating analysis below includes the impact of such security arrangements. In some cases, further security has been obtained in the form of trust arrangements, reinsurer default protection and other potential offsets. This additional security has not been included in the credit rating analysis set out below.
The following table provides information about the quality of the Group’s credit risk exposure in respect of reinsurance and other recoveries on outstanding claims at the balance sheet date. The analysis classifies the assets according to Standard & Poor’s counterparty credit ratings. AAA is the highest possible rating. Rated assets falling outside the range of AAA to BBB are classified as speculative grade.
creDit rAtiNG
Not rAteDUs$m
totALUs$m
AAAUs$m
AAUs$m
AUs$m
bbbUs$m
sPecULAtiveGrADe
Us$m
Reinsurance recoveries on outstanding claims 1,2
2012 110 2,383 1,392 27 57 138 4,1072011 43 2,129 1,283 32 54 152 3,693
Reinsurance recoverieson paid claims 1
2012 2 692 114 6 5 14 8332011 1 921 148 2 5 20 1,097
1 Net of a provision for impairment.2 Excludes other recoveries.
The following table provides further information regarding the ageing of reinsurance recoveries on paid claims at the balance sheet date.
NeitHerPAst
DUe Nor imPAireD
Us$m
PAst DUe bUt Not imPAireD
totALUs$m
0 to 3moNtHs
Us$m
3 to 6moNtHs
Us$m
6 moNtHs to 1 yeAr
Us$m
GreAtertHAN 1
yeArUs$m
Reinsurance recoverieson paid claims 1
2012 629 88 26 59 31 8332011 911 70 27 28 61 1,097
1 Net of a provision for impairment.
(D) Market riskMarket risk is the risk of variability in the value of, and returns on, investments and the risk associated with variability of interest rates, credit spreads, foreign exchange rates and economy-wide inflation on both assets and liabilities, excluding insurance liabilities.
Market risk comprises three types of risk: currency risk (due to fluctuations in foreign exchange rates); interest rate risk (due to fluctuations in market interest rates); and price risk (due to fluctuations in market prices). Within each of these categories, risks are evaluated before considering the effect of mitigating controls. The existence and effectiveness of such mitigating controls are then measured to ensure that residual risks are maintained within the Group’s risk appetite and tolerance.
(i) currency riskThe Group’s exposure to currency risk generally arises as a result of either the translation of foreign currency amounts back to the functional currency of a controlled entity (operational currency risk) or due to the translation of the Group’s net investment in foreign operations back to the functional currency of the ultimate parent entity of Australian dollars and to QBE’s presentation currency of US dollars.
Operational currency riskThe Group is exposed to currency risk in respect of its operational net foreign currency exposures within each of its controlled entities. This risk is managed as follows:
• Each controlled entity manages the volatility arising from changes in foreign exchange rates by matching liabilities with assets of the same currency, as far as is practicable, thus ensuring that any exposures to foreign currencies are minimised.
• Forward foreign exchange contracts are used where possible to protect residual currency positions. These forward foreign exchange contracts are accounted for in accordance with the derivatives accounting policy set out in note 1(N).
Foreign exchange gains or losses arising from operational foreign currency exposures are reported in profit or loss consistent with the gains or losses from related forward foreign exchange contracts. The risk management process covering the use of forward foreign exchange contracts involves close senior management scrutiny, including regular board and other management reporting. All forward foreign exchange contracts are subject to delegated authority levels provided to management and the levels of exposure are reviewed on an ongoing basis.
The Group’s aim is to mitigate, where possible, its operational foreign currency exposures at a controlled entity level. From time to time, the company or controlled entities may maintain an operational foreign currency exposure to offset currency volatility arising from translation of foreign currency forecast profits, subject to senior management approval and adherence to board approved limits.
Section 5: Financial report
Notes to the financial statements CONTINUED
FOR THE YEAR ENDED 31 DECEMBER 2012
5. Risk management CONTINUED
126 QBE Insurance Group
Annual report 2012
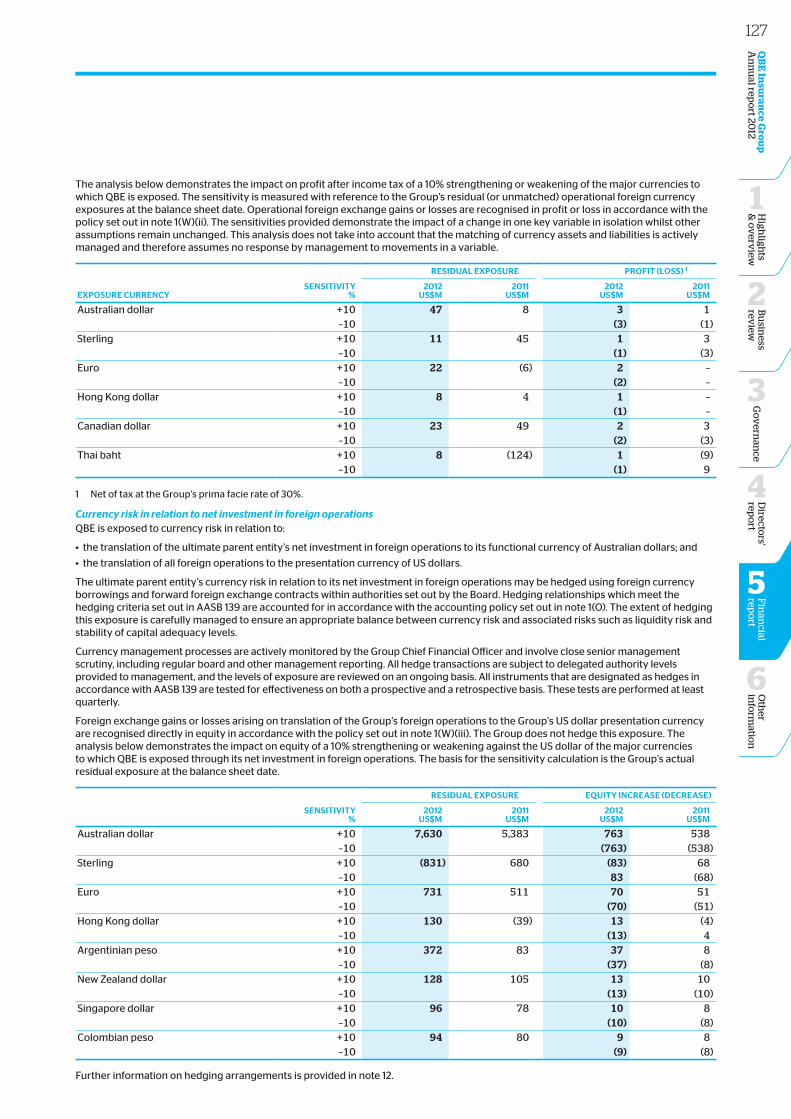
The analysis below demonstrates the impact on profit after income tax of a 10% strengthening or weakening of the major currencies to which QBE is exposed. The sensitivity is measured with reference to the Group’s residual (or unmatched) operational foreign currency exposures at the balance sheet date. Operational foreign exchange gains or losses are recognised in profit or loss in accordance with the policy set out in note 1(W)(ii). The sensitivities provided demonstrate the impact of a change in one key variable in isolation whilst other assumptions remain unchanged. This analysis does not take into account that the matching of currency assets and liabilities is actively managed and therefore assumes no response by management to movements in a variable.
exPosUre cUrreNcyseNsitivity
%
resiDUAL exPosUre ProFit (Loss) 1
2012Us$m
2011Us$m
2012Us$m
2011Us$m
Australian dollar +10 47 8 3 1–10 (3) (1)
Sterling +10 11 45 1 3 –10 (1) (3)Euro +10 22 (6) 2 – –10 (2) –Hong Kong dollar +10 8 4 1 – –10 (1) –Canadian dollar +10 23 49 2 3 –10 (2) (3)Thai baht +10 8 (124) 1 (9) –10 (1) 9
1 Net of tax at the Group’s prima facie rate of 30%.
Currency risk in relation to net investment in foreign operationsQBE is exposed to currency risk in relation to:
• the translation of the ultimate parent entity’s net investment in foreign operations to its functional currency of Australian dollars; and
• the translation of all foreign operations to the presentation currency of US dollars.
The ultimate parent entity’s currency risk in relation to its net investment in foreign operations may be hedged using foreign currency borrowings and forward foreign exchange contracts within authorities set out by the Board. Hedging relationships which meet the hedging criteria set out in AASB 139 are accounted for in accordance with the accounting policy set out in note 1(O). The extent of hedging this exposure is carefully managed to ensure an appropriate balance between currency risk and associated risks such as liquidity risk and stability of capital adequacy levels.
Currency management processes are actively monitored by the Group Chief Financial Officer and involve close senior management scrutiny, including regular board and other management reporting. All hedge transactions are subject to delegated authority levels provided to management, and the levels of exposure are reviewed on an ongoing basis. All instruments that are designated as hedges in accordance with AASB 139 are tested for effectiveness on both a prospective and a retrospective basis. These tests are performed at least quarterly.
Foreign exchange gains or losses arising on translation of the Group’s foreign operations to the Group’s US dollar presentation currency are recognised directly in equity in accordance with the policy set out in note 1(W)(iii). The Group does not hedge this exposure. The analysis below demonstrates the impact on equity of a 10% strengthening or weakening against the US dollar of the major currencies to which QBE is exposed through its net investment in foreign operations. The basis for the sensitivity calculation is the Group’s actual residual exposure at the balance sheet date.
seNsitivity%
resiDUAL exPosUre eqUity iNcreAse (DecreAse)
2012Us$m
2011Us$m
2012Us$m
2011Us$m
Australian dollar +10 7,630 5,383 763 538–10 (763) (538)
Sterling +10 (831) 680 (83) 68–10 83 (68)
Euro +10 731 511 70 51–10 (70) (51)
Hong Kong dollar +10 130 (39) 13 (4)–10 (13) 4
Argentinian peso +10 372 83 37 8–10 (37) (8)
New Zealand dollar +10 128 105 13 10–10 (13) (10)
Singapore dollar +10 96 78 10 8–10 (10) (8)
Colombian peso +10 94 80 9 8–10 (9) (8)
Further information on hedging arrangements is provided in note 12.
127O
ther
info
rmatio
n
6
Directo
rs' rep
ort
4
Fin
ancial
repo
rt
5
QB
E In
suran
ce Gro
up
A
nn
ual rep
ort 20
12B
usin
ess rev
iew
2
Go
vern
ance
3
High
lights
& o
verv
iew
1
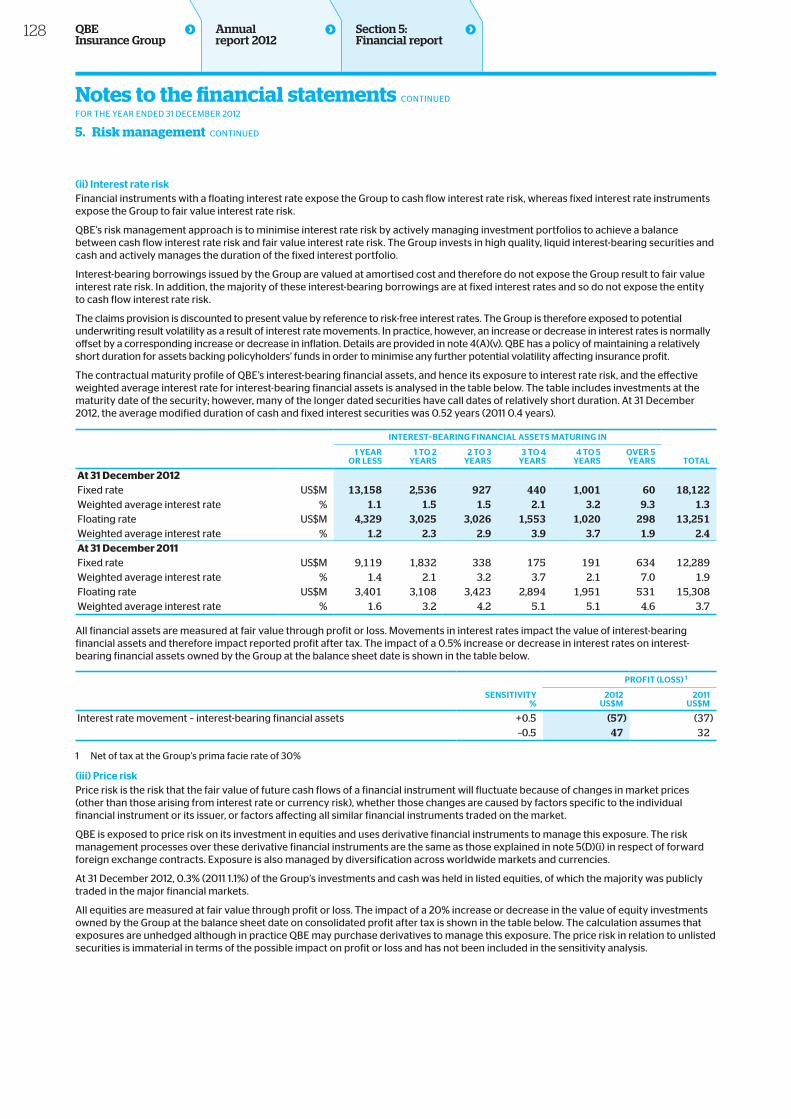
(ii) interest rate riskFinancial instruments with a floating interest rate expose the Group to cash flow interest rate risk, whereas fixed interest rate instruments expose the Group to fair value interest rate risk.
QBE’s risk management approach is to minimise interest rate risk by actively managing investment portfolios to achieve a balance between cash flow interest rate risk and fair value interest rate risk. The Group invests in high quality, liquid interest-bearing securities and cash and actively manages the duration of the fixed interest portfolio.
Interest-bearing borrowings issued by the Group are valued at amortised cost and therefore do not expose the Group result to fair value interest rate risk. In addition, the majority of these interest-bearing borrowings are at fixed interest rates and so do not expose the entity to cash flow interest rate risk.
The claims provision is discounted to present value by reference to risk-free interest rates. The Group is therefore exposed to potential underwriting result volatility as a result of interest rate movements. In practice, however, an increase or decrease in interest rates is normally offset by a corresponding increase or decrease in inflation. Details are provided in note 4(A)(v). QBE has a policy of maintaining a relatively short duration for assets backing policyholders’ funds in order to minimise any further potential volatility affecting insurance profit.
The contractual maturity profile of QBE’s interest-bearing financial assets, and hence its exposure to interest rate risk, and the effective weighted average interest rate for interest-bearing financial assets is analysed in the table below. The table includes investments at the maturity date of the security; however, many of the longer dated securities have call dates of relatively short duration. At 31 December 2012, the average modified duration of cash and fixed interest securities was 0.52 years (2011 0.4 years).
iNterest–beAriNG FiNANciAL Assets mAtUriNG iN
totAL1 yeAr
or Less1 to 2
yeArs2 to 3
yeArs3 to 4
yeArs4 to 5
yeArsover 5yeArs
At 31 December 2012 Fixed rate US$M 13,158 2,536 927 440 1,001 60 18,122Weighted average interest rate % 1.1 1.5 1.5 2.1 3.2 9.3 1.3Floating rate US$M 4,329 3,025 3,026 1,553 1,020 298 13,251Weighted average interest rate % 1.2 2.3 2.9 3.9 3.7 1.9 2.4At 31 December 2011Fixed rate US$M 9,119 1,832 338 175 191 634 12,289Weighted average interest rate % 1.4 2.1 3.2 3.7 2.1 7.0 1.9Floating rate US$M 3,401 3,108 3,423 2,894 1,951 531 15,308Weighted average interest rate % 1.6 3.2 4.2 5.1 5.1 4.6 3.7
All financial assets are measured at fair value through profit or loss. Movements in interest rates impact the value of interest-bearing financial assets and therefore impact reported profit after tax. The impact of a 0.5% increase or decrease in interest rates on interest-bearing financial assets owned by the Group at the balance sheet date is shown in the table below.
seNsitivity%
ProFit (Loss) 1
2012Us$m
2011Us$m
Interest rate movement – interest-bearing financial assets +0.5 (57) (37)–0.5 47 32
1 Net of tax at the Group’s prima facie rate of 30%
(iii) Price riskPrice risk is the risk that the fair value of future cash flows of a financial instrument will fluctuate because of changes in market prices (other than those arising from interest rate or currency risk), whether those changes are caused by factors specific to the individual financial instrument or its issuer, or factors affecting all similar financial instruments traded on the market.
QBE is exposed to price risk on its investment in equities and uses derivative financial instruments to manage this exposure. The risk management processes over these derivative financial instruments are the same as those explained in note 5(D)(i) in respect of forward foreign exchange contracts. Exposure is also managed by diversification across worldwide markets and currencies.
At 31 December 2012, 0.3% (2011 1.1%) of the Group’s investments and cash was held in listed equities, of which the majority was publicly traded in the major financial markets.
All equities are measured at fair value through profit or loss. The impact of a 20% increase or decrease in the value of equity investments owned by the Group at the balance sheet date on consolidated profit after tax is shown in the table below. The calculation assumes that exposures are unhedged although in practice QBE may purchase derivatives to manage this exposure. The price risk in relation to unlisted securities is immaterial in terms of the possible impact on profit or loss and has not been included in the sensitivity analysis.
Section 5: Financial report
Notes to the financial statements CONTINUED
FOR THE YEAR ENDED 31 DECEMBER 2012
5. Risk management CONTINUED
128 QBE Insurance Group
Annual report 2012
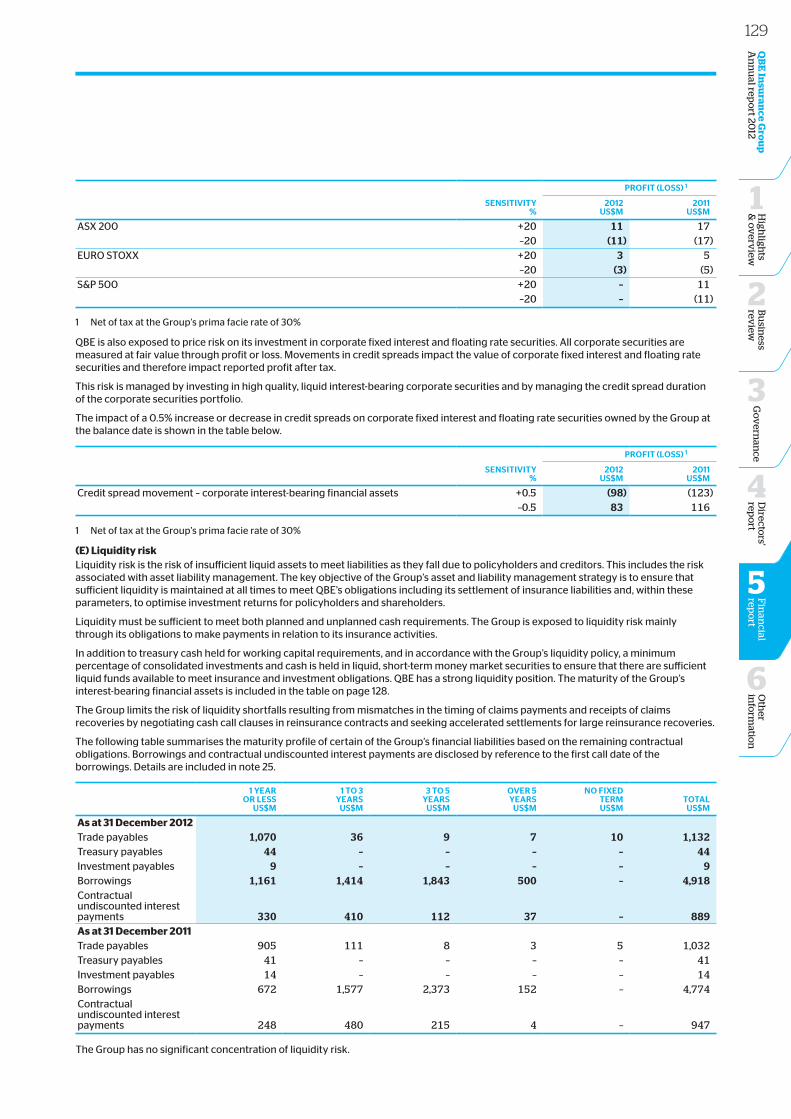
seNsitivity%
ProFit (Loss) 1
2012Us$m
2011Us$m
ASX 200 +20 11 17–20 (11) (17)
EURO STOXX +20 3 5–20 (3) (5)
S&P 500 +20 – 11 –20 – (11)
1 Net of tax at the Group’s prima facie rate of 30%
QBE is also exposed to price risk on its investment in corporate fixed interest and floating rate securities. All corporate securities are measured at fair value through profit or loss. Movements in credit spreads impact the value of corporate fixed interest and floating rate securities and therefore impact reported profit after tax.
This risk is managed by investing in high quality, liquid interest-bearing corporate securities and by managing the credit spread duration of the corporate securities portfolio.
The impact of a 0.5% increase or decrease in credit spreads on corporate fixed interest and floating rate securities owned by the Group at the balance date is shown in the table below.
seNsitivity%
ProFit (Loss) 1
2012Us$m
2011Us$m
Credit spread movement – corporate interest-bearing financial assets +0.5 (98) (123) –0.5 83 116
1 Net of tax at the Group’s prima facie rate of 30%
(E) Liquidity riskLiquidity risk is the risk of insufficient liquid assets to meet liabilities as they fall due to policyholders and creditors. This includes the risk associated with asset liability management. The key objective of the Group’s asset and liability management strategy is to ensure that sufficient liquidity is maintained at all times to meet QBE’s obligations including its settlement of insurance liabilities and, within these parameters, to optimise investment returns for policyholders and shareholders.
Liquidity must be sufficient to meet both planned and unplanned cash requirements. The Group is exposed to liquidity risk mainly through its obligations to make payments in relation to its insurance activities.
In addition to treasury cash held for working capital requirements, and in accordance with the Group’s liquidity policy, a minimum percentage of consolidated investments and cash is held in liquid, short-term money market securities to ensure that there are sufficient liquid funds available to meet insurance and investment obligations. QBE has a strong liquidity position. The maturity of the Group’s interest-bearing financial assets is included in the table on page 128.
The Group limits the risk of liquidity shortfalls resulting from mismatches in the timing of claims payments and receipts of claims recoveries by negotiating cash call clauses in reinsurance contracts and seeking accelerated settlements for large reinsurance recoveries.
The following table summarises the maturity profile of certain of the Group’s financial liabilities based on the remaining contractual obligations. Borrowings and contractual undiscounted interest payments are disclosed by reference to the first call date of the borrowings. Details are included in note 25.
1 yeAror Less
Us$m
1 to 3 yeArs
Us$m
3 to 5 yeArs
Us$m
over 5 yeArs
Us$m
No FixeD termUs$m
totALUs$m
As at 31 December 2012 Trade payables 1,070 36 9 7 10 1,132 Treasury payables 44 – – – – 44 Investment payables 9 – – – – 9 Borrowings 1,161 1,414 1,843 500 – 4,918 Contractual undiscounted interest payments 330 410 112 37 – 889As at 31 December 2011Trade payables 905 111 8 3 5 1,032Treasury payables 41 – – – – 41Investment payables 14 – – – – 14Borrowings 672 1,577 2,373 152 – 4,774Contractual undiscounted interest payments 248 480 215 4 – 947
The Group has no significant concentration of liquidity risk.
129O
ther
info
rmatio
n
6
Directo
rs' rep
ort
4
Fin
ancial
repo
rt
5
QB
E In
suran
ce Gro
up
A
nn
ual rep
ort 20
12B
usin
ess rev
iew
2
Go
vern
ance
3
High
lights
& o
verv
iew
1
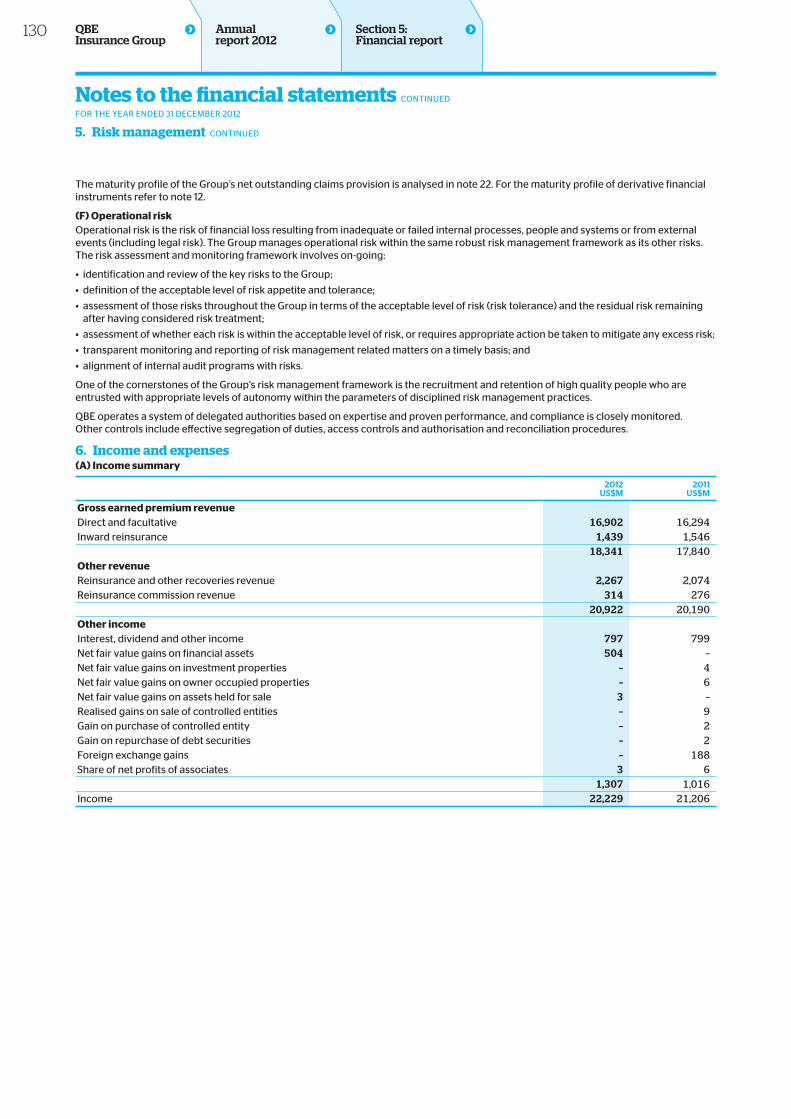
The maturity profile of the Group’s net outstanding claims provision is analysed in note 22. For the maturity profile of derivative financial instruments refer to note 12.
(F) Operational riskOperational risk is the risk of financial loss resulting from inadequate or failed internal processes, people and systems or from external events (including legal risk). The Group manages operational risk within the same robust risk management framework as its other risks. The risk assessment and monitoring framework involves on-going:
• identification and review of the key risks to the Group;
• definition of the acceptable level of risk appetite and tolerance;
• assessment of those risks throughout the Group in terms of the acceptable level of risk (risk tolerance) and the residual risk remaining after having considered risk treatment;
• assessment of whether each risk is within the acceptable level of risk, or requires appropriate action be taken to mitigate any excess risk;
• transparent monitoring and reporting of risk management related matters on a timely basis; and
• alignment of internal audit programs with risks.
One of the cornerstones of the Group’s risk management framework is the recruitment and retention of high quality people who are entrusted with appropriate levels of autonomy within the parameters of disciplined risk management practices.
QBE operates a system of delegated authorities based on expertise and proven performance, and compliance is closely monitored. Other controls include effective segregation of duties, access controls and authorisation and reconciliation procedures.
6. Income and expenses(A) Income summary
2012Us$m
2011Us$m
Gross earned premium revenue Direct and facultative 16,902 16,294Inward reinsurance 1,439 1,546
18,341 17,840Other revenue Reinsurance and other recoveries revenue 2,267 2,074Reinsurance commission revenue 314 276 20,922 20,190Other income Interest, dividend and other income 797 799Net fair value gains on financial assets 504 –Net fair value gains on investment properties – 4Net fair value gains on owner occupied properties – 6Net fair value gains on assets held for sale 3 –Realised gains on sale of controlled entities – 9Gain on purchase of controlled entity – 2Gain on repurchase of debt securities – 2Foreign exchange gains – 188Share of net profits of associates 3 6 1,307 1,016Income 22,229 21,206
Section 5: Financial report
Notes to the financial statements CONTINUED
FOR THE YEAR ENDED 31 DECEMBER 2012
5. Risk management CONTINUED
130 QBE Insurance Group
Annual report 2012
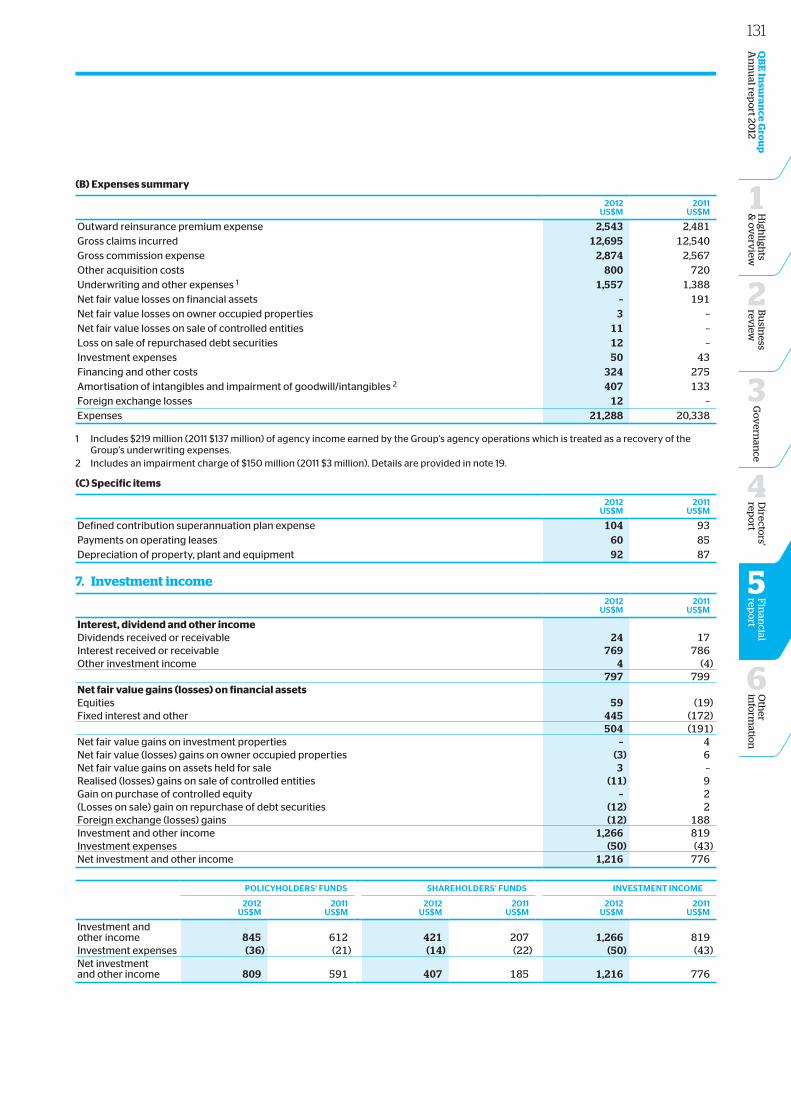
(B) Expenses summary
2012Us$m
2011Us$m
Outward reinsurance premium expense 2,543 2,481Gross claims incurred 12,695 12,540Gross commission expense 2,874 2,567Other acquisition costs 800 720Underwriting and other expenses 1 1,557 1,388Net fair value losses on financial assets – 191Net fair value losses on owner occupied properties 3 –Net fair value losses on sale of controlled entities 11 –Loss on sale of repurchased debt securities 12 –Investment expenses 50 43Financing and other costs 324 275Amortisation of intangibles and impairment of goodwill/intangibles 2 407 133Foreign exchange losses 12 –Expenses 21,288 20,338
1 Includes $219 million (2011 $137 million) of agency income earned by the Group’s agency operations which is treated as a recovery of the Group’s underwriting expenses.
2 Includes an impairment charge of $150 million (2011 $3 million). Details are provided in note 19.
(C) Specific items
2012Us$m
2011Us$m
Defined contribution superannuation plan expense 104 93Payments on operating leases 60 85Depreciation of property, plant and equipment 92 87
7. Investment income2012
Us$m2011
Us$m
Interest, dividend and other income Dividends received or receivable 24 17Interest received or receivable 769 786Other investment income 4 (4) 797 799Net fair value gains (losses) on financial assets Equities 59 (19)Fixed interest and other 445 (172) 504 (191)Net fair value gains on investment properties – 4Net fair value (losses) gains on owner occupied properties (3) 6Net fair value gains on assets held for sale 3 –Realised (losses) gains on sale of controlled entities (11) 9Gain on purchase of controlled equity – 2(Losses on sale) gain on repurchase of debt securities (12) 2Foreign exchange (losses) gains (12) 188Investment and other income 1,266 819Investment expenses (50) (43)Net investment and other income 1,216 776
PoLicyHoLDers’ FUNDs sHAreHoLDers’ FUNDs iNvestmeNt iNcome
2012Us$m
2011Us$m
2012Us$m
2011Us$m
2012Us$m
2011Us$m
Investment and other income 845 612 421 207 1,266 819Investment expenses (36) (21) (14) (22) (50) (43)Net investment and other income 809 591 407 185 1,216 776
131O
ther
info
rmatio
n
6
Directo
rs' rep
ort
4
Fin
ancial
repo
rt
5
QB
E In
suran
ce Gro
up
A
nn
ual rep
ort 20
12B
usin
ess rev
iew
2
Go
vern
ance
3
High
lights
& o
verv
iew
1
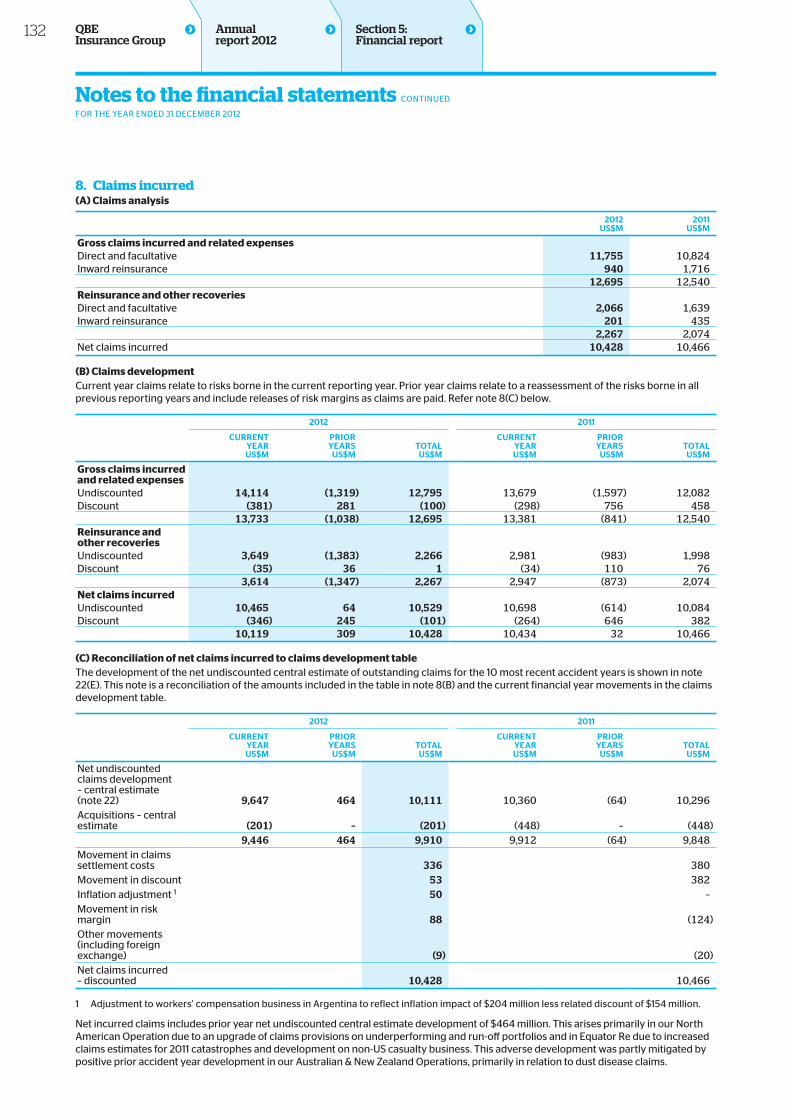
8. Claims incurred (A) Claims analysis
2012Us$m
2011Us$m
Gross claims incurred and related expenses Direct and facultative 11,755 10,824Inward reinsurance 940 1,716
12,695 12,540Reinsurance and other recoveries Direct and facultative 2,066 1,639Inward reinsurance 201 435
2,267 2,074Net claims incurred 10,428 10,466
(B) Claims developmentCurrent year claims relate to risks borne in the current reporting year. Prior year claims relate to a reassessment of the risks borne in all previous reporting years and include releases of risk margins as claims are paid. Refer note 8(C) below.
2012 2011
cUrreNtyeArUs$m
PrioryeArs
Us$m
totAL
Us$m
cUrreNt yeArUs$m
Prior yeArs
Us$mtotAL
Us$m
Gross claims incurred and related expensesUndiscounted 14,114 (1,319) 12,795 13,679 (1,597) 12,082Discount (381) 281 (100) (298) 756 458 13,733 (1,038) 12,695 13,381 (841) 12,540Reinsurance and other recoveriesUndiscounted 3,649 (1,383) 2,266 2,981 (983) 1,998Discount (35) 36 1 (34) 110 76 3,614 (1,347) 2,267 2,947 (873) 2,074Net claims incurredUndiscounted 10,465 64 10,529 10,698 (614) 10,084Discount (346) 245 (101) (264) 646 382 10,119 309 10,428 10,434 32 10,466
(C) Reconciliation of net claims incurred to claims development tableThe development of the net undiscounted central estimate of outstanding claims for the 10 most recent accident years is shown in note 22(E). This note is a reconciliation of the amounts included in the table in note 8(B) and the current financial year movements in the claims development table.
2012 2011
cUrreNtyeArUs$m
PrioryeArs
Us$mtotAL
Us$m
cUrreNtyeArUs$m
PrioryeArs
Us$mtotAL
Us$m
Net undiscounted claims development – central estimate (note 22) 9,647 464 10,111 10,360 (64) 10,296Acquisitions – central estimate (201) – (201) (448) – (448)
9,446 464 9,910 9,912 (64) 9,848Movement in claims settlement costs 336 380Movement in discount 53 382Inflation adjustment 1 50 –Movement in risk margin 88 (124)Other movements (including foreign exchange) (9) (20)Net claims incurred – discounted 10,428 10,466
1 Adjustment to workers’ compensation business in Argentina to reflect inflation impact of $204 million less related discount of $154 million.
Net incurred claims includes prior year net undiscounted central estimate development of $464 million. This arises primarily in our North American Operation due to an upgrade of claims provisions on underperforming and run-off portfolios and in Equator Re due to increased claims estimates for 2011 catastrophes and development on non-US casualty business. This adverse development was partly mitigated by positive prior accident year development in our Australian & New Zealand Operations, primarily in relation to dust disease claims.
Section 5: Financial report
Notes to the financial statements CONTINUED
FOR THE YEAR ENDED 31 DECEMBER 2012
132 QBE Insurance Group
Annual report 2012
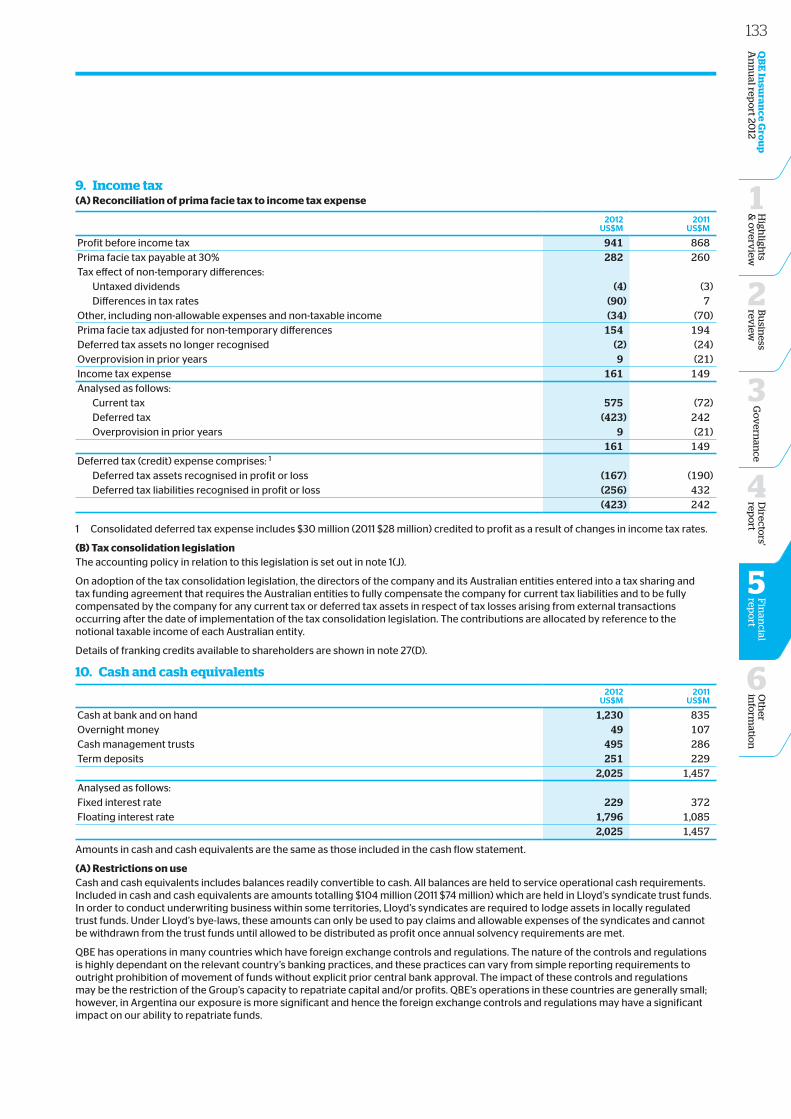
9. Income tax(A) Reconciliation of prima facie tax to income tax expense
2012Us$m
2011Us$m
Profit before income tax 941 868Prima facie tax payable at 30% 282 260Tax effect of non-temporary differences: Untaxed dividends (4) (3) Differences in tax rates (90) 7Other, including non-allowable expenses and non-taxable income (34) (70)Prima facie tax adjusted for non-temporary differences 154 194Deferred tax assets no longer recognised (2) (24)Overprovision in prior years 9 (21)Income tax expense 161 149Analysed as follows: Current tax 575 (72) Deferred tax (423) 242 Overprovision in prior years 9 (21) 161 149Deferred tax (credit) expense comprises: 1 Deferred tax assets recognised in profit or loss (167) (190) Deferred tax liabilities recognised in profit or loss (256) 432 (423) 242
1 Consolidated deferred tax expense includes $30 million (2011 $28 million) credited to profit as a result of changes in income tax rates.
(B) Tax consolidation legislationThe accounting policy in relation to this legislation is set out in note 1(J).
On adoption of the tax consolidation legislation, the directors of the company and its Australian entities entered into a tax sharing and tax funding agreement that requires the Australian entities to fully compensate the company for current tax liabilities and to be fully compensated by the company for any current tax or deferred tax assets in respect of tax losses arising from external transactions occurring after the date of implementation of the tax consolidation legislation. The contributions are allocated by reference to the notional taxable income of each Australian entity.
Details of franking credits available to shareholders are shown in note 27(D).
10. Cash and cash equivalents2012
Us$m2011
Us$m
Cash at bank and on hand 1,230 835Overnight money 49 107Cash management trusts 495 286Term deposits 251 229 2,025 1,457Analysed as follows: Fixed interest rate 229 372Floating interest rate 1,796 1,085 2,025 1,457
Amounts in cash and cash equivalents are the same as those included in the cash flow statement.
(A) Restrictions on useCash and cash equivalents includes balances readily convertible to cash. All balances are held to service operational cash requirements. Included in cash and cash equivalents are amounts totalling $104 million (2011 $74 million) which are held in Lloyd’s syndicate trust funds. In order to conduct underwriting business within some territories, Lloyd’s syndicates are required to lodge assets in locally regulated trust funds. Under Lloyd’s bye-laws, these amounts can only be used to pay claims and allowable expenses of the syndicates and cannot be withdrawn from the trust funds until allowed to be distributed as profit once annual solvency requirements are met.
QBE has operations in many countries which have foreign exchange controls and regulations. The nature of the controls and regulations is highly dependant on the relevant country’s banking practices, and these practices can vary from simple reporting requirements to outright prohibition of movement of funds without explicit prior central bank approval. The impact of these controls and regulations may be the restriction of the Group’s capacity to repatriate capital and/or profits. QBE’s operations in these countries are generally small; however, in Argentina our exposure is more significant and hence the foreign exchange controls and regulations may have a significant impact on our ability to repatriate funds.
133O
ther
info
rmatio
n
6
Directo
rs' rep
ort
4
Fin
ancial
repo
rt
5
QB
E In
suran
ce Gro
up
A
nn
ual rep
ort 20
12B
usin
ess rev
iew
2
Go
vern
ance
3
High
lights
& o
verv
iew
1
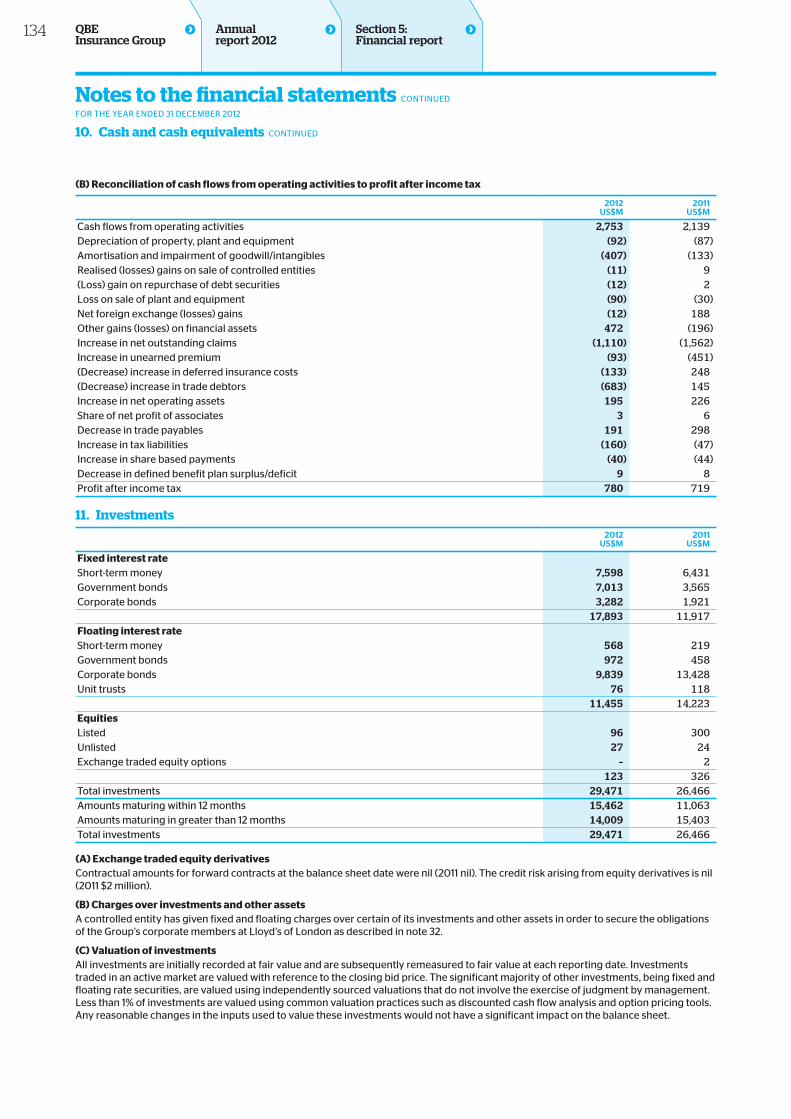
(B) Reconciliation of cash flows from operating activities to profit after income tax
2012Us$m
2011Us$m
Cash flows from operating activities 2,753 2,139Depreciation of property, plant and equipment (92) (87)Amortisation and impairment of goodwill/intangibles (407) (133)Realised (losses) gains on sale of controlled entities (11) 9(Loss) gain on repurchase of debt securities (12) 2Loss on sale of plant and equipment (90) (30)Net foreign exchange (losses) gains (12) 188Other gains (losses) on financial assets 472 (196)Increase in net outstanding claims (1,110) (1,562)Increase in unearned premium (93) (451)(Decrease) increase in deferred insurance costs (133) 248(Decrease) increase in trade debtors (683) 145Increase in net operating assets 195 226Share of net profit of associates 3 6Decrease in trade payables 191 298Increase in tax liabilities (160) (47)Increase in share based payments (40) (44)Decrease in defined benefit plan surplus/deficit 9 8Profit after income tax 780 719
11. Investments2012
Us$m2011
Us$m
Fixed interest rate Short-term money 7,598 6,431Government bonds 7,013 3,565Corporate bonds 3,282 1,921 17,893 11,917Floating interest rate Short-term money 568 219Government bonds 972 458Corporate bonds 9,839 13,428Unit trusts 76 118 11,455 14,223Equities Listed 96 300Unlisted 27 24Exchange traded equity options – 2 123 326Total investments 29,471 26,466Amounts maturing within 12 months 15,462 11,063Amounts maturing in greater than 12 months 14,009 15,403Total investments 29,471 26,466
(A) Exchange traded equity derivativesContractual amounts for forward contracts at the balance sheet date were nil (2011 nil). The credit risk arising from equity derivatives is nil (2011 $2 million).
(B) Charges over investments and other assetsA controlled entity has given fixed and floating charges over certain of its investments and other assets in order to secure the obligations of the Group’s corporate members at Lloyd’s of London as described in note 32.
(C) Valuation of investmentsAll investments are initially recorded at fair value and are subsequently remeasured to fair value at each reporting date. Investments traded in an active market are valued with reference to the closing bid price. The significant majority of other investments, being fixed and floating rate securities, are valued using independently sourced valuations that do not involve the exercise of judgment by management. Less than 1% of investments are valued using common valuation practices such as discounted cash flow analysis and option pricing tools. Any reasonable changes in the inputs used to value these investments would not have a significant impact on the balance sheet.
Section 5: Financial report
Notes to the financial statements CONTINUED
FOR THE YEAR ENDED 31 DECEMBER 2012
10. Cash and cash equivalents CONTINUED
134 QBE Insurance Group
Annual report 2012
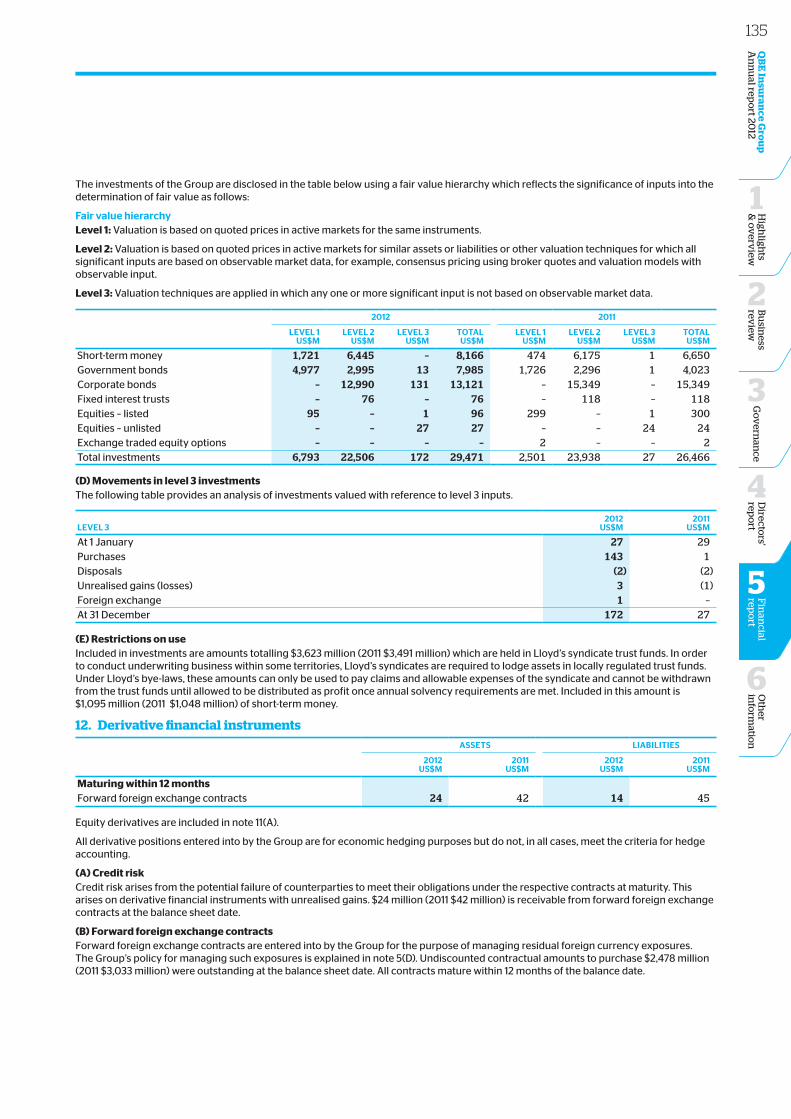
The investments of the Group are disclosed in the table below using a fair value hierarchy which reflects the significance of inputs into the determination of fair value as follows:
Fair value hierarchyLevel 1: Valuation is based on quoted prices in active markets for the same instruments.
Level 2: Valuation is based on quoted prices in active markets for similar assets or liabilities or other valuation techniques for which all significant inputs are based on observable market data, for example, consensus pricing using broker quotes and valuation models with observable input.
Level 3: Valuation techniques are applied in which any one or more significant input is not based on observable market data.
2012 2011
LeveL 1Us$m
LeveL 2Us$m
LeveL 3Us$m
totALUs$m
LeveL 1Us$m
LeveL 2Us$m
LeveL 3Us$m
totALUs$m
Short-term money 1,721 6,445 – 8,166 474 6,175 1 6,650Government bonds 4,977 2,995 13 7,985 1,726 2,296 1 4,023Corporate bonds – 12,990 131 13,121 – 15,349 – 15,349Fixed interest trusts – 76 – 76 – 118 – 118Equities – listed 95 – 1 96 299 – 1 300Equities – unlisted – – 27 27 – – 24 24Exchange traded equity options – – – – 2 – – 2Total investments 6,793 22,506 172 29,471 2,501 23,938 27 26,466
(D) Movements in level 3 investmentsThe following table provides an analysis of investments valued with reference to level 3 inputs.
LeveL 32012
Us$m2011
Us$m
At 1 January 27 29Purchases 143 1Disposals (2) (2)Unrealised gains (losses) 3 (1)Foreign exchange 1 –At 31 December 172 27
(E) Restrictions on useIncluded in investments are amounts totalling $3,623 million (2011 $3,491 million) which are held in Lloyd’s syndicate trust funds. In order to conduct underwriting business within some territories, Lloyd’s syndicates are required to lodge assets in locally regulated trust funds. Under Lloyd’s bye-laws, these amounts can only be used to pay claims and allowable expenses of the syndicate and cannot be withdrawn from the trust funds until allowed to be distributed as profit once annual solvency requirements are met. Included in this amount is $1,095 million (2011 $1,048 million) of short-term money.
12. Derivative financial instruments Assets LiAbiLities
2012Us$m
2011Us$m
2012Us$m
2011Us$m
Maturing within 12 months Forward foreign exchange contracts 24 42 14 45
Equity derivatives are included in note 11(A).
All derivative positions entered into by the Group are for economic hedging purposes but do not, in all cases, meet the criteria for hedge accounting.
(A) Credit riskCredit risk arises from the potential failure of counterparties to meet their obligations under the respective contracts at maturity. This arises on derivative financial instruments with unrealised gains. $24 million (2011 $42 million) is receivable from forward foreign exchange contracts at the balance sheet date.
(B) Forward foreign exchange contractsForward foreign exchange contracts are entered into by the Group for the purpose of managing residual foreign currency exposures. The Group’s policy for managing such exposures is explained in note 5(D). Undiscounted contractual amounts to purchase $2,478 million (2011 $3,033 million) were outstanding at the balance sheet date. All contracts mature within 12 months of the balance date.
135O
ther
info
rmatio
n
6
Directo
rs' rep
ort
4
Fin
ancial
repo
rt
5
QB
E In
suran
ce Gro
up
A
nn
ual rep
ort 20
12B
usin
ess rev
iew
2
Go
vern
ance
3
High
lights
& o
verv
iew
1
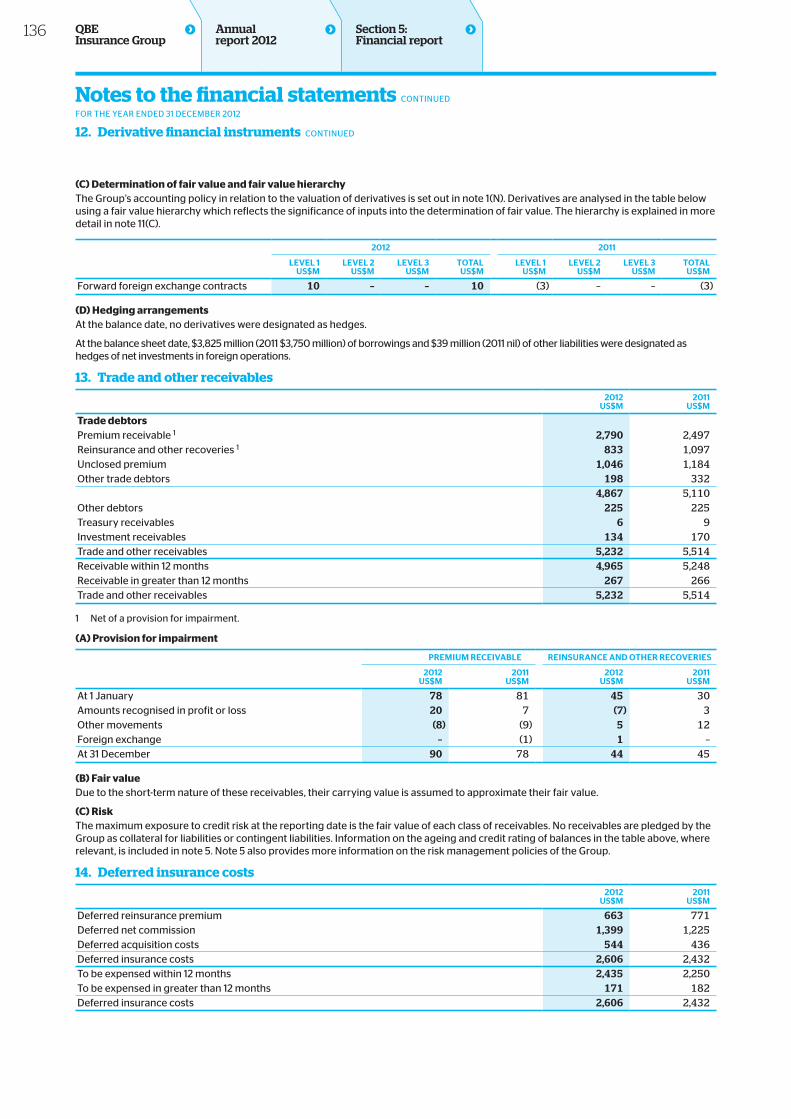
(C) Determination of fair value and fair value hierarchyThe Group’s accounting policy in relation to the valuation of derivatives is set out in note 1(N). Derivatives are analysed in the table below using a fair value hierarchy which reflects the significance of inputs into the determination of fair value. The hierarchy is explained in more detail in note 11(C).
2012 2011
LeveL 1Us$m
LeveL 2Us$m
LeveL 3Us$m
totALUs$m
LeveL 1Us$m
LeveL 2Us$m
LeveL 3Us$m
totALUs$m
Forward foreign exchange contracts 10 – – 10 (3) – – (3)
(D) Hedging arrangementsAt the balance date, no derivatives were designated as hedges.
At the balance sheet date, $3,825 million (2011 $3,750 million) of borrowings and $39 million (2011 nil) of other liabilities were designated as hedges of net investments in foreign operations.
13. Trade and other receivables2012
Us$m2011
Us$m
Trade debtors Premium receivable 1 2,790 2,497Reinsurance and other recoveries 1 833 1,097Unclosed premium 1,046 1,184Other trade debtors 198 332
4,867 5,110Other debtors 225 225Treasury receivables 6 9Investment receivables 134 170Trade and other receivables 5,232 5,514Receivable within 12 months 4,965 5,248Receivable in greater than 12 months 267 266Trade and other receivables 5,232 5,514
1 Net of a provision for impairment.
(A) Provision for impairment
PremiUm receivAbLe reiNsUrANce AND otHer recoveries
2012Us$m
2011Us$m
2012Us$m
2011Us$m
At 1 January 78 81 45 30Amounts recognised in profit or loss 20 7 (7) 3Other movements (8) (9) 5 12Foreign exchange – (1) 1 –At 31 December 90 78 44 45
(B) Fair valueDue to the short-term nature of these receivables, their carrying value is assumed to approximate their fair value.
(C) RiskThe maximum exposure to credit risk at the reporting date is the fair value of each class of receivables. No receivables are pledged by the Group as collateral for liabilities or contingent liabilities. Information on the ageing and credit rating of balances in the table above, where relevant, is included in note 5. Note 5 also provides more information on the risk management policies of the Group.
14. Deferred insurance costs2012
Us$m2011
Us$m
Deferred reinsurance premium 663 771Deferred net commission 1,399 1,225Deferred acquisition costs 544 436Deferred insurance costs 2,606 2,432To be expensed within 12 months 2,435 2,250To be expensed in greater than 12 months 171 182Deferred insurance costs 2,606 2,432
Section 5: Financial report
Notes to the financial statements CONTINUED
FOR THE YEAR ENDED 31 DECEMBER 2012
12. Derivative financial instruments CONTINUED
136 QBE Insurance Group
Annual report 2012
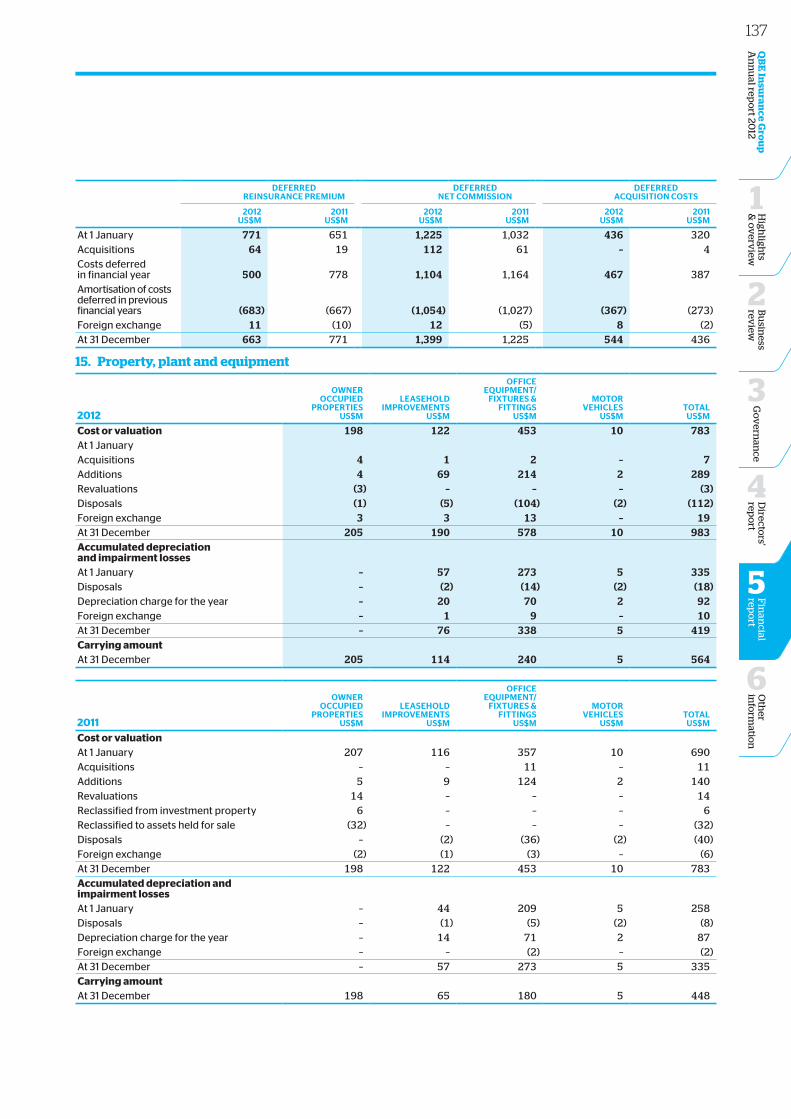
DeFerreDreiNsUrANce PremiUm
DeFerreDNet commissioN
DeFerreDAcqUisitioN costs
2012Us$m
2011Us$m
2012Us$m
2011Us$m
2012Us$m
2011Us$m
At 1 January 771 651 1,225 1,032 436 320Acquisitions 64 19 112 61 – 4Costs deferred in financial year 500 778 1,104 1,164 467 387Amortisation of costs deferred in previous financial years (683) (667) (1,054) (1,027) (367) (273)Foreign exchange 11 (10) 12 (5) 8 (2)At 31 December 663 771 1,399 1,225 544 436
15. Property, plant and equipment
2012
owNer occUPieD
ProPertiesUs$m
LeAseHoLDimProvemeNts
Us$m
oFFiceeqUiPmeNt/
FixtUres &FittiNGs
Us$m
motorveHicLes
Us$mtotAL
Us$m
Cost or valuation 198 122 453 10 783At 1 JanuaryAcquisitions 4 1 2 – 7Additions 4 69 214 2 289Revaluations (3) – – – (3)Disposals (1) (5) (104) (2) (112)Foreign exchange 3 3 13 – 19At 31 December 205 190 578 10 983Accumulated depreciation and impairment lossesAt 1 January – 57 273 5 335Disposals – (2) (14) (2) (18)Depreciation charge for the year – 20 70 2 92Foreign exchange – 1 9 – 10At 31 December – 76 338 5 419Carrying amountAt 31 December 205 114 240 5 564
2011
owNer occUPieD
ProPertiesUs$m
LeAseHoLDimProvemeNts
Us$m
oFFiceeqUiPmeNt/
FixtUres &FittiNGs
Us$m
motorveHicLes
Us$mtotAL
Us$m
Cost or valuationAt 1 January 207 116 357 10 690Acquisitions – – 11 – 11Additions 5 9 124 2 140Revaluations 14 – – – 14Reclassified from investment property 6 – – – 6Reclassified to assets held for sale (32) – – – (32)Disposals – (2) (36) (2) (40)Foreign exchange (2) (1) (3) – (6)At 31 December 198 122 453 10 783Accumulated depreciation and impairment lossesAt 1 January – 44 209 5 258Disposals – (1) (5) (2) (8)Depreciation charge for the year – 14 71 2 87Foreign exchange – – (2) – (2)At 31 December – 57 273 5 335Carrying amountAt 31 December 198 65 180 5 448
137O
ther
info
rmatio
n
6
Directo
rs' rep
ort
4
Fin
ancial
repo
rt
5
QB
E In
suran
ce Gro
up
A
nn
ual rep
ort 20
12B
usin
ess rev
iew
2
Go
vern
ance
3
High
lights
& o
verv
iew
1
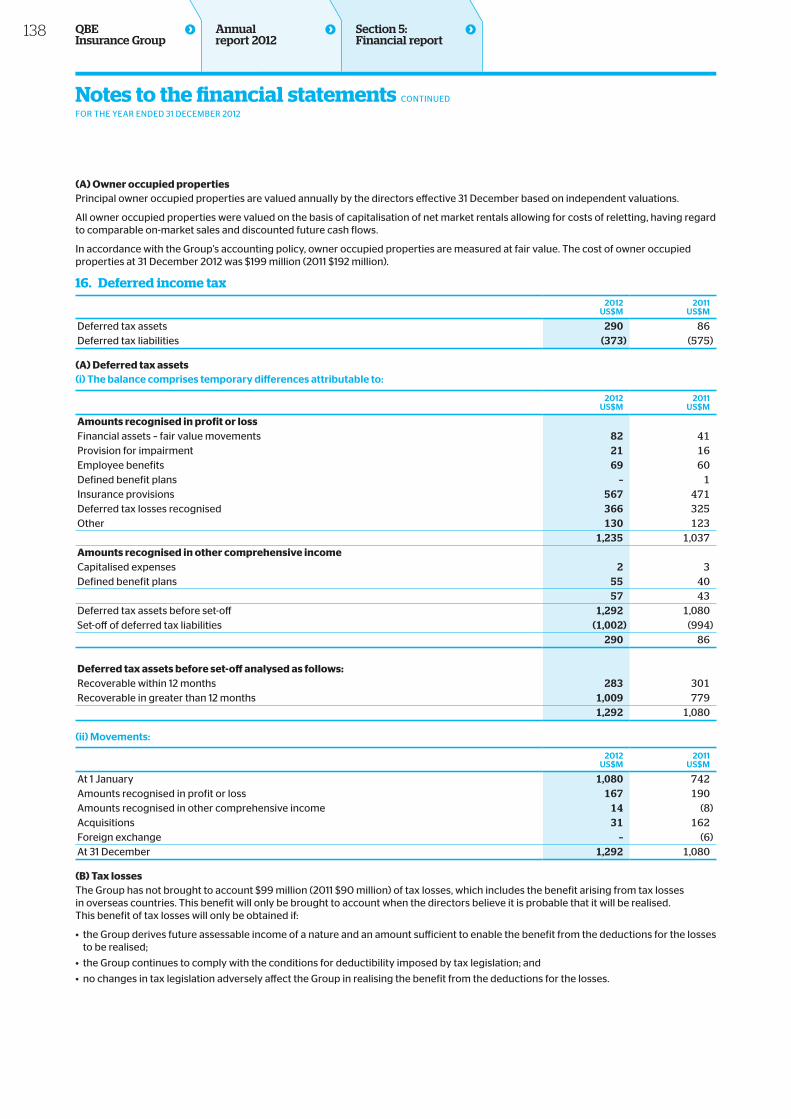
(A) Owner occupied propertiesPrincipal owner occupied properties are valued annually by the directors effective 31 December based on independent valuations.
All owner occupied properties were valued on the basis of capitalisation of net market rentals allowing for costs of reletting, having regard to comparable on-market sales and discounted future cash flows.
In accordance with the Group’s accounting policy, owner occupied properties are measured at fair value. The cost of owner occupied properties at 31 December 2012 was $199 million (2011 $192 million).
16. Deferred income tax2012
Us$m2011
Us$m
Deferred tax assets 290 86Deferred tax liabilities (373) (575)
(A) Deferred tax assets (i) the balance comprises temporary differences attributable to:
2012Us$m
2011Us$m
Amounts recognised in profit or loss Financial assets – fair value movements 82 41Provision for impairment 21 16Employee benefits 69 60Defined benefit plans – 1Insurance provisions 567 471Deferred tax losses recognised 366 325Other 130 123 1,235 1,037Amounts recognised in other comprehensive income Capitalised expenses 2 3Defined benefit plans 55 40 57 43Deferred tax assets before set-off 1,292 1,080Set-off of deferred tax liabilities (1,002) (994) 290 86
Deferred tax assets before set‑off analysed as follows: Recoverable within 12 months 283 301Recoverable in greater than 12 months 1,009 779 1,292 1,080
(ii) movements:
2012Us$m
2011Us$m
At 1 January 1,080 742Amounts recognised in profit or loss 167 190Amounts recognised in other comprehensive income 14 (8)Acquisitions 31 162Foreign exchange – (6)At 31 December 1,292 1,080
(B) Tax lossesThe Group has not brought to account $99 million (2011 $90 million) of tax losses, which includes the benefit arising from tax losses in overseas countries. This benefit will only be brought to account when the directors believe it is probable that it will be realised. This benefit of tax losses will only be obtained if:
• the Group derives future assessable income of a nature and an amount sufficient to enable the benefit from the deductions for the losses to be realised;
• the Group continues to comply with the conditions for deductibility imposed by tax legislation; and
• no changes in tax legislation adversely affect the Group in realising the benefit from the deductions for the losses.
Notes to the financial statements CONTINUED
FOR THE YEAR ENDED 31 DECEMBER 2012
Section 5: Financial report
138 QBE Insurance Group
Annual report 2012
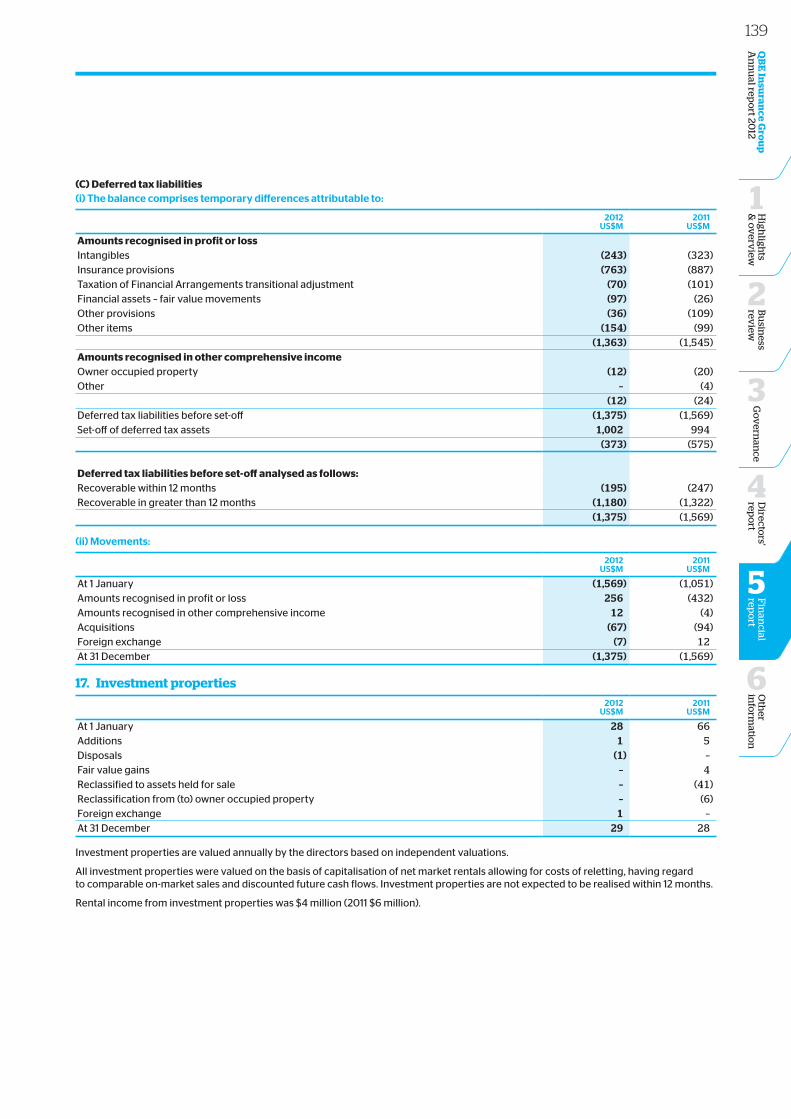
(C) Deferred tax liabilities (i) the balance comprises temporary differences attributable to:
2012Us$m
2011Us$m
Amounts recognised in profit or loss Intangibles (243) (323)Insurance provisions (763) (887)Taxation of Financial Arrangements transitional adjustment (70) (101)Financial assets – fair value movements (97) (26)Other provisions (36) (109)Other items (154) (99) (1,363) (1,545)Amounts recognised in other comprehensive income Owner occupied property (12) (20)Other – (4) (12) (24)Deferred tax liabilities before set-off (1,375) (1,569)Set-off of deferred tax assets 1,002 994 (373) (575)
Deferred tax liabilities before set‑off analysed as follows: Recoverable within 12 months (195) (247)Recoverable in greater than 12 months (1,180) (1,322) (1,375) (1,569)
(ii) movements:
2012Us$m
2011Us$m
At 1 January (1,569) (1,051)Amounts recognised in profit or loss 256 (432)Amounts recognised in other comprehensive income 12 (4)Acquisitions (67) (94)Foreign exchange (7) 12At 31 December (1,375) (1,569)
17. Investment properties2012
Us$m2011
Us$m
At 1 January 28 66Additions 1 5Disposals (1) –Fair value gains – 4Reclassified to assets held for sale – (41)Reclassification from (to) owner occupied property – (6)Foreign exchange 1 –At 31 December 29 28
Investment properties are valued annually by the directors based on independent valuations.
All investment properties were valued on the basis of capitalisation of net market rentals allowing for costs of reletting, having regard to comparable on-market sales and discounted future cash flows. Investment properties are not expected to be realised within 12 months.
Rental income from investment properties was $4 million (2011 $6 million).
139O
ther
info
rmatio
n
6
Directo
rs' rep
ort
4
Fin
ancial
repo
rt
5
QB
E In
suran
ce Gro
up
A
nn
ual rep
ort 20
12B
usin
ess rev
iew
2
Go
vern
ance
3
High
lights
& o
verv
iew
1
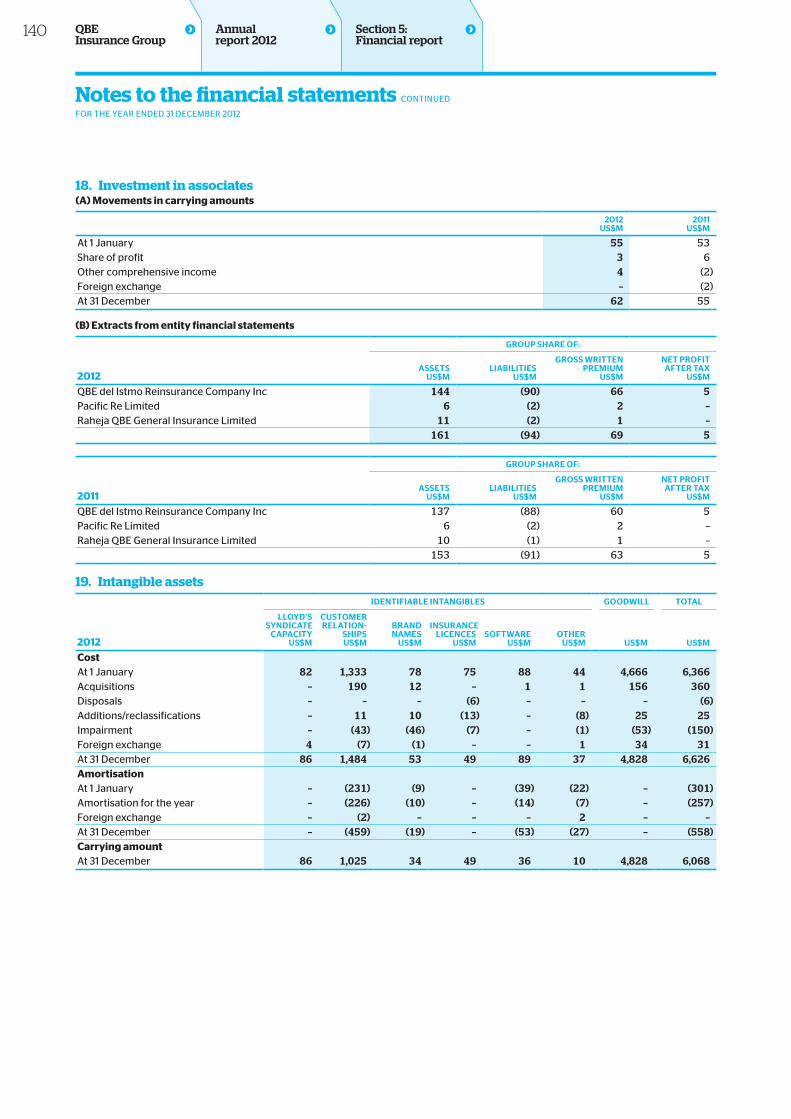
18. Investment in associates(A) Movements in carrying amounts
2012Us$m
2011Us$m
At 1 January 55 53Share of profit 3 6Other comprehensive income 4 (2)Foreign exchange – (2)At 31 December 62 55
(B) Extracts from entity financial statements
2012
GroUP sHAre oF:
AssetsUs$m
LiAbiLitiesUs$m
Gross writteNPremiUm
Us$m
Net ProFitAFter tAx
Us$m
QBE del Istmo Reinsurance Company Inc 144 (90) 66 5Pacific Re Limited 6 (2) 2 –Raheja QBE General Insurance Limited 11 (2) 1 – 161 (94) 69 5
2011
GroUP sHAre oF:
AssetsUs$m
LiAbiLitiesUs$m
Gross writteNPremiUm
Us$m
Net ProFitAFter tAx
Us$m
QBE del Istmo Reinsurance Company Inc 137 (88) 60 5Pacific Re Limited 6 (2) 2 –Raheja QBE General Insurance Limited 10 (1) 1 – 153 (91) 63 5
19. Intangible assets
2012
iDeNtiFiAbLe iNtANGibLes
GooDwiLL
totAL
LLoyD’ssyNDicAte
cAPAcityUs$m
cUstomerreLAtioN-
sHiPsUs$m
brANDNAmes
Us$m
iNsUrANceLiceNces
Us$msoFtwAre
Us$motHer
Us$m Us$m Us$m
Cost At 1 January 82 1,333 78 75 88 44 4,666 6,366Acquisitions – 190 12 – 1 1 156 360 Disposals – – – (6) – – – (6)Additions/reclassifications – 11 10 (13) – (8) 25 25Impairment – (43) (46) (7) – (1) (53) (150)Foreign exchange 4 (7) (1) – – 1 34 31At 31 December 86 1,484 53 49 89 37 4,828 6,626Amortisation At 1 January – (231) (9) – (39) (22) – (301)Amortisation for the year – (226) (10) – (14) (7) – (257)Foreign exchange – (2) – – – 2 – –At 31 December – (459) (19) – (53) (27) – (558)Carrying amount At 31 December 86 1,025 34 49 36 10 4,828 6,068
Notes to the financial statements CONTINUED
FOR THE YEAR ENDED 31 DECEMBER 2012
Section 5: Financial report
140 QBE Insurance Group
Annual report 2012
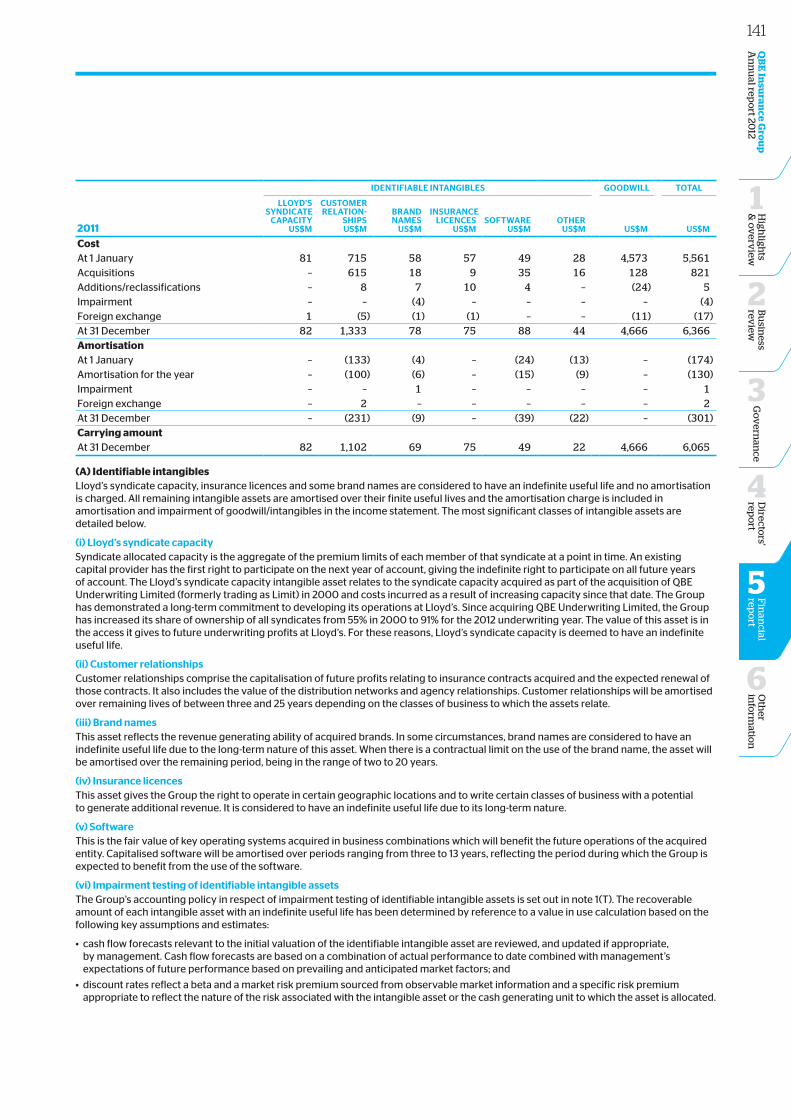
2011
iDeNtiFiAbLe iNtANGibLes GooDwiLL totAL
LLoyD’ssyNDicAte
cAPAcityUs$m
cUstomerreLAtioN-
sHiPsUs$m
brANDNAmes
Us$m
iNsUrANceLiceNces
Us$msoFtwAre
Us$motHer
Us$m Us$m Us$m
CostAt 1 January 81 715 58 57 49 28 4,573 5,561Acquisitions – 615 18 9 35 16 128 821Additions/reclassifications – 8 7 10 4 – (24) 5Impairment – – (4) – – – – (4)Foreign exchange 1 (5) (1) (1) – – (11) (17)At 31 December 82 1,333 78 75 88 44 4,666 6,366AmortisationAt 1 January – (133) (4) – (24) (13) – (174)Amortisation for the year – (100) (6) – (15) (9) – (130)Impairment – – 1 – – – – 1Foreign exchange – 2 – – – – – 2At 31 December – (231) (9) – (39) (22) – (301)Carrying amount At 31 December 82 1,102 69 75 49 22 4,666 6,065
(A) Identifiable intangiblesLloyd’s syndicate capacity, insurance licences and some brand names are considered to have an indefinite useful life and no amortisation is charged. All remaining intangible assets are amortised over their finite useful lives and the amortisation charge is included in amortisation and impairment of goodwill/intangibles in the income statement. The most significant classes of intangible assets are detailed below.
(i) Lloyd’s syndicate capacitySyndicate allocated capacity is the aggregate of the premium limits of each member of that syndicate at a point in time. An existing capital provider has the first right to participate on the next year of account, giving the indefinite right to participate on all future years of account. The Lloyd’s syndicate capacity intangible asset relates to the syndicate capacity acquired as part of the acquisition of QBE Underwriting Limited (formerly trading as Limit) in 2000 and costs incurred as a result of increasing capacity since that date. The Group has demonstrated a long-term commitment to developing its operations at Lloyd’s. Since acquiring QBE Underwriting Limited, the Group has increased its share of ownership of all syndicates from 55% in 2000 to 91% for the 2012 underwriting year. The value of this asset is in the access it gives to future underwriting profits at Lloyd’s. For these reasons, Lloyd’s syndicate capacity is deemed to have an indefinite useful life.
(ii) customer relationshipsCustomer relationships comprise the capitalisation of future profits relating to insurance contracts acquired and the expected renewal of those contracts. It also includes the value of the distribution networks and agency relationships. Customer relationships will be amortised over remaining lives of between three and 25 years depending on the classes of business to which the assets relate.
(iii) brand namesThis asset reflects the revenue generating ability of acquired brands. In some circumstances, brand names are considered to have an indefinite useful life due to the long-term nature of this asset. When there is a contractual limit on the use of the brand name, the asset will be amortised over the remaining period, being in the range of two to 20 years.
(iv) insurance licencesThis asset gives the Group the right to operate in certain geographic locations and to write certain classes of business with a potential to generate additional revenue. It is considered to have an indefinite useful life due to its long-term nature.
(v) softwareThis is the fair value of key operating systems acquired in business combinations which will benefit the future operations of the acquired entity. Capitalised software will be amortised over periods ranging from three to 13 years, reflecting the period during which the Group is expected to benefit from the use of the software.
(vi) impairment testing of identifiable intangible assetsThe Group’s accounting policy in respect of impairment testing of identifiable intangible assets is set out in note 1(T). The recoverable amount of each intangible asset with an indefinite useful life has been determined by reference to a value in use calculation based on the following key assumptions and estimates:
• cash flow forecasts relevant to the initial valuation of the identifiable intangible asset are reviewed, and updated if appropriate, by management. Cash flow forecasts are based on a combination of actual performance to date combined with management’s expectations of future performance based on prevailing and anticipated market factors; and
• discount rates reflect a beta and a market risk premium sourced from observable market information and a specific risk premium appropriate to reflect the nature of the risk associated with the intangible asset or the cash generating unit to which the asset is allocated.
141O
ther
info
rmatio
n
6
Directo
rs' rep
ort
4
Fin
ancial
repo
rt
5
QB
E In
suran
ce Gro
up
A
nn
ual rep
ort 20
12B
usin
ess rev
iew
2
Go
vern
ance
3
High
lights
& o
verv
iew
1
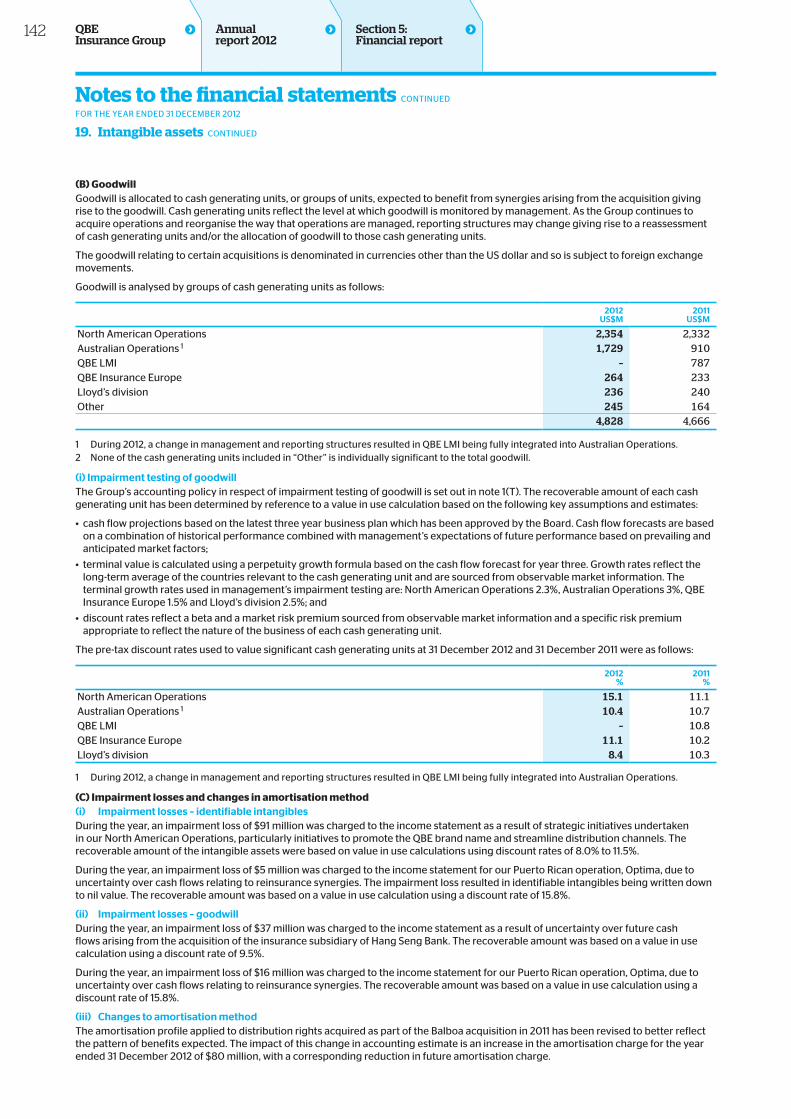
(B) GoodwillGoodwill is allocated to cash generating units, or groups of units, expected to benefit from synergies arising from the acquisition giving rise to the goodwill. Cash generating units reflect the level at which goodwill is monitored by management. As the Group continues to acquire operations and reorganise the way that operations are managed, reporting structures may change giving rise to a reassessment of cash generating units and/or the allocation of goodwill to those cash generating units.
The goodwill relating to certain acquisitions is denominated in currencies other than the US dollar and so is subject to foreign exchange movements.
Goodwill is analysed by groups of cash generating units as follows:
2012Us$m
2011Us$m
North American Operations 2,354 2,332Australian Operations 1 1,729 910QBE LMI – 787QBE Insurance Europe 264 233Lloyd’s division 236 240Other 245 164 4,828 4,666
1 During 2012, a change in management and reporting structures resulted in QBE LMI being fully integrated into Australian Operations. 2 None of the cash generating units included in “Other” is individually significant to the total goodwill.
(i) impairment testing of goodwillThe Group’s accounting policy in respect of impairment testing of goodwill is set out in note 1(T). The recoverable amount of each cash generating unit has been determined by reference to a value in use calculation based on the following key assumptions and estimates:
• cash flow projections based on the latest three year business plan which has been approved by the Board. Cash flow forecasts are based on a combination of historical performance combined with management’s expectations of future performance based on prevailing and anticipated market factors;
• terminal value is calculated using a perpetuity growth formula based on the cash flow forecast for year three. Growth rates reflect the long-term average of the countries relevant to the cash generating unit and are sourced from observable market information. The terminal growth rates used in management’s impairment testing are: North American Operations 2.3%, Australian Operations 3%, QBE Insurance Europe 1.5% and Lloyd’s division 2.5%; and
• discount rates reflect a beta and a market risk premium sourced from observable market information and a specific risk premium appropriate to reflect the nature of the business of each cash generating unit.
The pre-tax discount rates used to value significant cash generating units at 31 December 2012 and 31 December 2011 were as follows:
2012%
2011%
North American Operations 15.1 11.1Australian Operations 1 10.4 10.7QBE LMI – 10.8QBE Insurance Europe 11.1 10.2Lloyd’s division 8.4 10.3
1 During 2012, a change in management and reporting structures resulted in QBE LMI being fully integrated into Australian Operations.
(C) Impairment losses and changes in amortisation method(i) impairment losses – identifiable intangiblesDuring the year, an impairment loss of $91 million was charged to the income statement as a result of strategic initiatives undertaken in our North American Operations, particularly initiatives to promote the QBE brand name and streamline distribution channels. The recoverable amount of the intangible assets were based on value in use calculations using discount rates of 8.0% to 11.5%.
During the year, an impairment loss of $5 million was charged to the income statement for our Puerto Rican operation, Optima, due to uncertainty over cash flows relating to reinsurance synergies. The impairment loss resulted in identifiable intangibles being written down to nil value. The recoverable amount was based on a value in use calculation using a discount rate of 15.8%.
(ii) impairment losses – goodwillDuring the year, an impairment loss of $37 million was charged to the income statement as a result of uncertainty over future cash flows arising from the acquisition of the insurance subsidiary of Hang Seng Bank. The recoverable amount was based on a value in use calculation using a discount rate of 9.5%.
During the year, an impairment loss of $16 million was charged to the income statement for our Puerto Rican operation, Optima, due to uncertainty over cash flows relating to reinsurance synergies. The recoverable amount was based on a value in use calculation using a discount rate of 15.8%.
(iii) changes to amortisation methodThe amortisation profile applied to distribution rights acquired as part of the Balboa acquisition in 2011 has been revised to better reflect the pattern of benefits expected. The impact of this change in accounting estimate is an increase in the amortisation charge for the year ended 31 December 2012 of $80 million, with a corresponding reduction in future amortisation charge.
Section 5: Financial report
Notes to the financial statements CONTINUED
FOR THE YEAR ENDED 31 DECEMBER 2012
19. Intangible assets CONTINUED
142 QBE Insurance Group
Annual report 2012
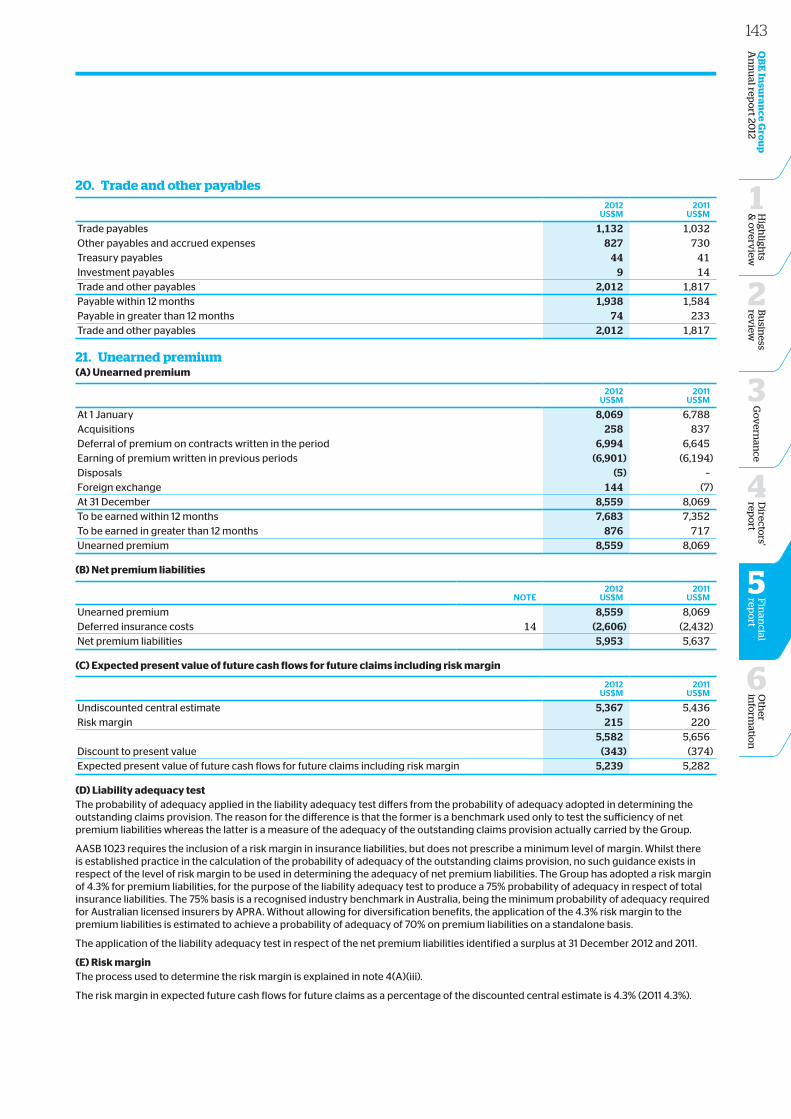
20. Trade and other payables2012
Us$m2011
Us$m
Trade payables 1,132 1,032Other payables and accrued expenses 827 730Treasury payables 44 41Investment payables 9 14Trade and other payables 2,012 1,817Payable within 12 months 1,938 1,584Payable in greater than 12 months 74 233Trade and other payables 2,012 1,817
21. Unearned premium(A) Unearned premium
2012Us$m
2011Us$m
At 1 January 8,069 6,788Acquisitions 258 837Deferral of premium on contracts written in the period 6,994 6,645Earning of premium written in previous periods (6,901) (6,194)Disposals (5) –Foreign exchange 144 (7)At 31 December 8,559 8,069To be earned within 12 months 7,683 7,352To be earned in greater than 12 months 876 717Unearned premium 8,559 8,069
(B) Net premium liabilities
Note2012
Us$m2011
Us$m
Unearned premium 8,559 8,069Deferred insurance costs 14 (2,606) (2,432)Net premium liabilities 5,953 5,637
(C) Expected present value of future cash flows for future claims including risk margin
2012Us$m
2011Us$m
Undiscounted central estimate 5,367 5,436Risk margin 215 220
5,582 5,656Discount to present value (343) (374)Expected present value of future cash flows for future claims including risk margin 5,239 5,282
(D) Liability adequacy testThe probability of adequacy applied in the liability adequacy test differs from the probability of adequacy adopted in determining the outstanding claims provision. The reason for the difference is that the former is a benchmark used only to test the sufficiency of net premium liabilities whereas the latter is a measure of the adequacy of the outstanding claims provision actually carried by the Group.
AASB 1023 requires the inclusion of a risk margin in insurance liabilities, but does not prescribe a minimum level of margin. Whilst there is established practice in the calculation of the probability of adequacy of the outstanding claims provision, no such guidance exists in respect of the level of risk margin to be used in determining the adequacy of net premium liabilities. The Group has adopted a risk margin of 4.3% for premium liabilities, for the purpose of the liability adequacy test to produce a 75% probability of adequacy in respect of total insurance liabilities. The 75% basis is a recognised industry benchmark in Australia, being the minimum probability of adequacy required for Australian licensed insurers by APRA. Without allowing for diversification benefits, the application of the 4.3% risk margin to the premium liabilities is estimated to achieve a probability of adequacy of 70% on premium liabilities on a standalone basis.
The application of the liability adequacy test in respect of the net premium liabilities identified a surplus at 31 December 2012 and 2011.
(E) Risk marginThe process used to determine the risk margin is explained in note 4(A)(iii).
The risk margin in expected future cash flows for future claims as a percentage of the discounted central estimate is 4.3% (2011 4.3%).
143O
ther
info
rmatio
n
6
Directo
rs' rep
ort
4
Fin
ancial
repo
rt
5
QB
E In
suran
ce Gro
up
A
nn
ual rep
ort 20
12B
usin
ess rev
iew
2
Go
vern
ance
3
High
lights
& o
verv
iew
1
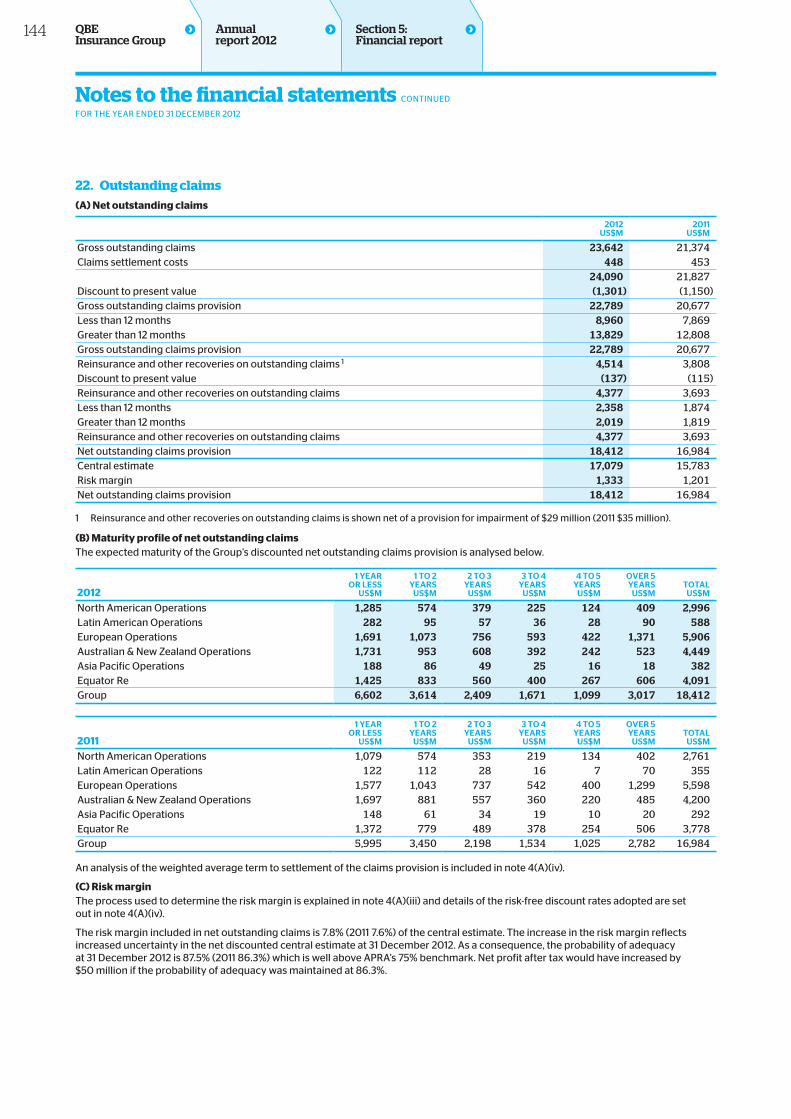
22. Outstanding claims(A) Net outstanding claims
2012Us$m
2011Us$m
Gross outstanding claims 23,642 21,374Claims settlement costs 448 453
24,090 21,827Discount to present value (1,301) (1,150)Gross outstanding claims provision 22,789 20,677Less than 12 months 8,960 7,869Greater than 12 months 13,829 12,808Gross outstanding claims provision 22,789 20,677Reinsurance and other recoveries on outstanding claims 1 4,514 3,808Discount to present value (137) (115)Reinsurance and other recoveries on outstanding claims 4,377 3,693Less than 12 months 2,358 1,874Greater than 12 months 2,019 1,819Reinsurance and other recoveries on outstanding claims 4,377 3,693Net outstanding claims provision 18,412 16,984Central estimate 17,079 15,783Risk margin 1,333 1,201Net outstanding claims provision 18,412 16,984
1 Reinsurance and other recoveries on outstanding claims is shown net of a provision for impairment of $29 million (2011 $35 million).
(B) Maturity profile of net outstanding claimsThe expected maturity of the Group’s discounted net outstanding claims provision is analysed below.
2012
1 yeAr or Less
Us$m
1 to 2 yeArs
Us$m
2 to 3 yeArs
Us$m
3 to 4 yeArs
Us$m
4 to 5 yeArs
Us$m
over 5 yeArs
Us$mtotAL
Us$m
North American Operations 1,285 574 379 225 124 409 2,996Latin American Operations 282 95 57 36 28 90 588European Operations 1,691 1,073 756 593 422 1,371 5,906Australian & New Zealand Operations 1,731 953 608 392 242 523 4,449Asia Pacific Operations 188 86 49 25 16 18 382Equator Re 1,425 833 560 400 267 606 4,091Group 6,602 3,614 2,409 1,671 1,099 3,017 18,412
2011
1 yeAr or Less
Us$m
1 to 2 yeArs
Us$m
2 to 3 yeArs
Us$m
3 to 4 yeArs
Us$m
4 to 5 yeArs
Us$m
over 5 yeArs
Us$m
totAL
Us$m
North American Operations 1,079 574 353 219 134 402 2,761 Latin American Operations 122 112 28 16 7 70 355 European Operations 1,577 1,043 737 542 400 1,299 5,598 Australian & New Zealand Operations 1,697 881 557 360 220 485 4,200Asia Pacific Operations 148 61 34 19 10 20 292Equator Re 1,372 779 489 378 254 506 3,778 Group 5,995 3,450 2,198 1,534 1,025 2,782 16,984
An analysis of the weighted average term to settlement of the claims provision is included in note 4(A)(iv).
(C) Risk marginThe process used to determine the risk margin is explained in note 4(A)(iii) and details of the risk-free discount rates adopted are set out in note 4(A)(iv).
The risk margin included in net outstanding claims is 7.8% (2011 7.6%) of the central estimate. The increase in the risk margin reflects increased uncertainty in the net discounted central estimate at 31 December 2012. As a consequence, the probability of adequacy at 31 December 2012 is 87.5% (2011 86.3%) which is well above APRA’s 75% benchmark. Net profit after tax would have increased by $50 million if the probability of adequacy was maintained at 86.3%.
Notes to the financial statements CONTINUED
FOR THE YEAR ENDED 31 DECEMBER 2012
Section 5: Financial report
144 QBE Insurance Group
Annual report 2012
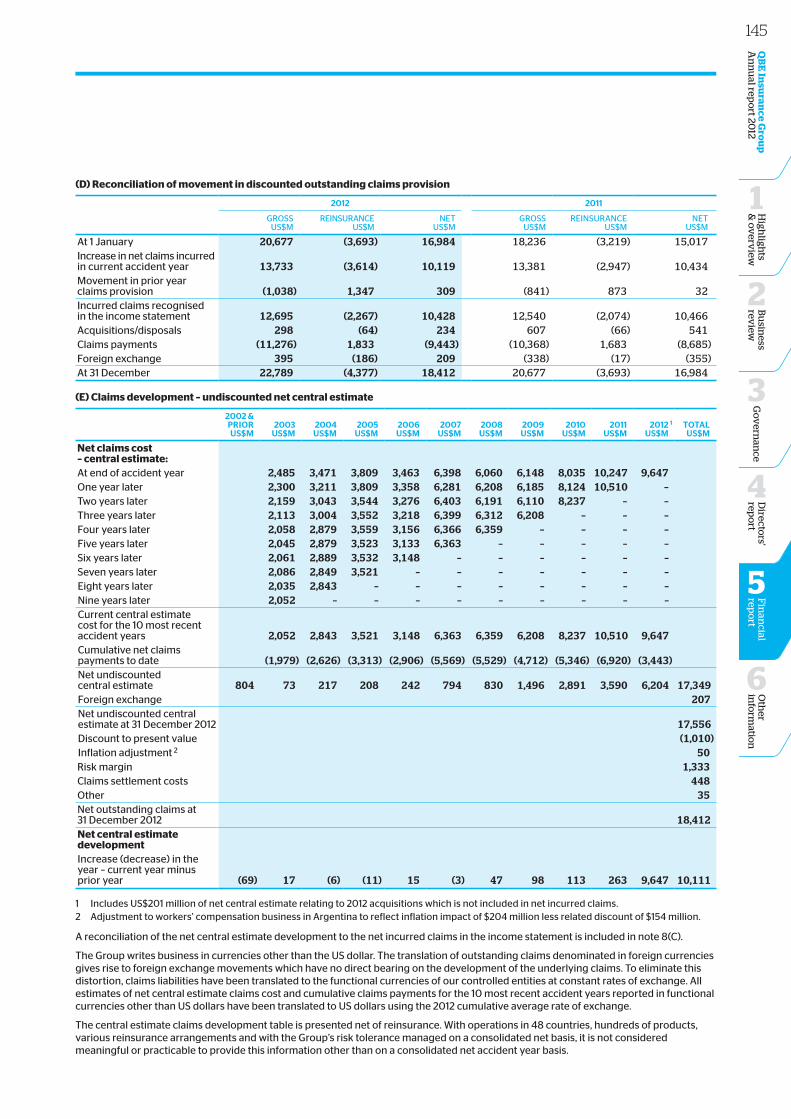
(D) Reconciliation of movement in discounted outstanding claims provision
2012 2011
GROSSUS$M
REINSURANCEUS$M
NETUS$M
GROSSUS$M
REINSURANCEUS$M
NETUS$M
At 1 January 20,677 (3,693) 16,984 18,236 (3,219) 15,017Increase in net claims incurred in current accident year 13,733 (3,614) 10,119 13,381 (2,947) 10,434Movement in prior year claims provision (1,038) 1,347 309 (841) 873 32Incurred claims recognised in the income statement 12,695 (2,267) 10,428 12,540 (2,074) 10,466Acquisitions/disposals 298 (64) 234 607 (66) 541Claims payments (11,276) 1,833 (9,443) (10,368) 1,683 (8,685)Foreign exchange 395 (186) 209 (338) (17) (355)At 31 December 22,789 (4,377) 18,412 20,677 (3,693) 16,984
(E) Claims development – undiscounted net central estimate
2002 &PriorUs$m
2003
Us$m
2004
Us$m
2005
Us$m
2006Us$m
2007
Us$m
2008
Us$m
2009
Us$m
2010
Us$m
2011
Us$m
2012 1
Us$m
totAL
Us$m
Net claims cost – central estimate: At end of accident year 2,485 3,471 3,809 3,463 6,398 6,060 6,148 8,035 10,247 9,647 One year later 2,300 3,211 3,809 3,358 6,281 6,208 6,185 8,124 10,510 – Two years later 2,159 3,043 3,544 3,276 6,403 6,191 6,110 8,237 – – Three years later 2,113 3,004 3,552 3,218 6,399 6,312 6,208 – – – Four years later 2,058 2,879 3,559 3,156 6,366 6,359 – – – – Five years later 2,045 2,879 3,523 3,133 6,363 – – – – – Six years later 2,061 2,889 3,532 3,148 – – – – – – Seven years later 2,086 2,849 3,521 – – – – – – – Eight years later 2,035 2,843 – – – – – – – – Nine years later 2,052 – – – – – – – – – Current central estimate cost for the 10 most recent accident years 2,052 2,843 3,521 3,148 6,363 6,359 6,208 8,237 10,510 9,647 Cumulative net claims payments to date (1,979) (2,626) (3,313) (2,906) (5,569) (5,529) (4,712) (5,346) (6,920) (3,443) Net undiscounted central estimate 804 73 217 208 242 794 830 1,496 2,891 3,590 6,204 17,349Foreign exchange 207 Net undiscounted central estimate at 31 December 2012 17,556 Discount to present value (1,010) Inflation adjustment 2 50Risk margin 1,333 Claims settlement costs 448 Other 35 Net outstanding claims at 31 December 2012 18,412 Net central estimate development Increase (decrease) in the year – current year minus prior year (69) 17 (6) (11) 15 (3) 47 98 113 263 9,647 10,111
1 Includes US$201 million of net central estimate relating to 2012 acquisitions which is not included in net incurred claims. 2 Adjustment to workers’ compensation business in Argentina to reflect inflation impact of $204 million less related discount of $154 million.
A reconciliation of the net central estimate development to the net incurred claims in the income statement is included in note 8(C).
The Group writes business in currencies other than the US dollar. The translation of outstanding claims denominated in foreign currencies gives rise to foreign exchange movements which have no direct bearing on the development of the underlying claims. To eliminate this distortion, claims liabilities have been translated to the functional currencies of our controlled entities at constant rates of exchange. All estimates of net central estimate claims cost and cumulative claims payments for the 10 most recent accident years reported in functional currencies other than US dollars have been translated to US dollars using the 2012 cumulative average rate of exchange.
The central estimate claims development table is presented net of reinsurance. With operations in 48 countries, hundreds of products, various reinsurance arrangements and with the Group’s risk tolerance managed on a consolidated net basis, it is not considered meaningful or practicable to provide this information other than on a consolidated net accident year basis.
145O
ther
info
rmatio
n
6
Directo
rs' rep
ort
4
Fin
ancial
repo
rt
5
QB
E In
suran
ce Gro
up
A
nn
ual rep
ort 20
12B
usin
ess rev
iew
2
Go
vern
ance
3
High
lights
& o
verv
iew
1
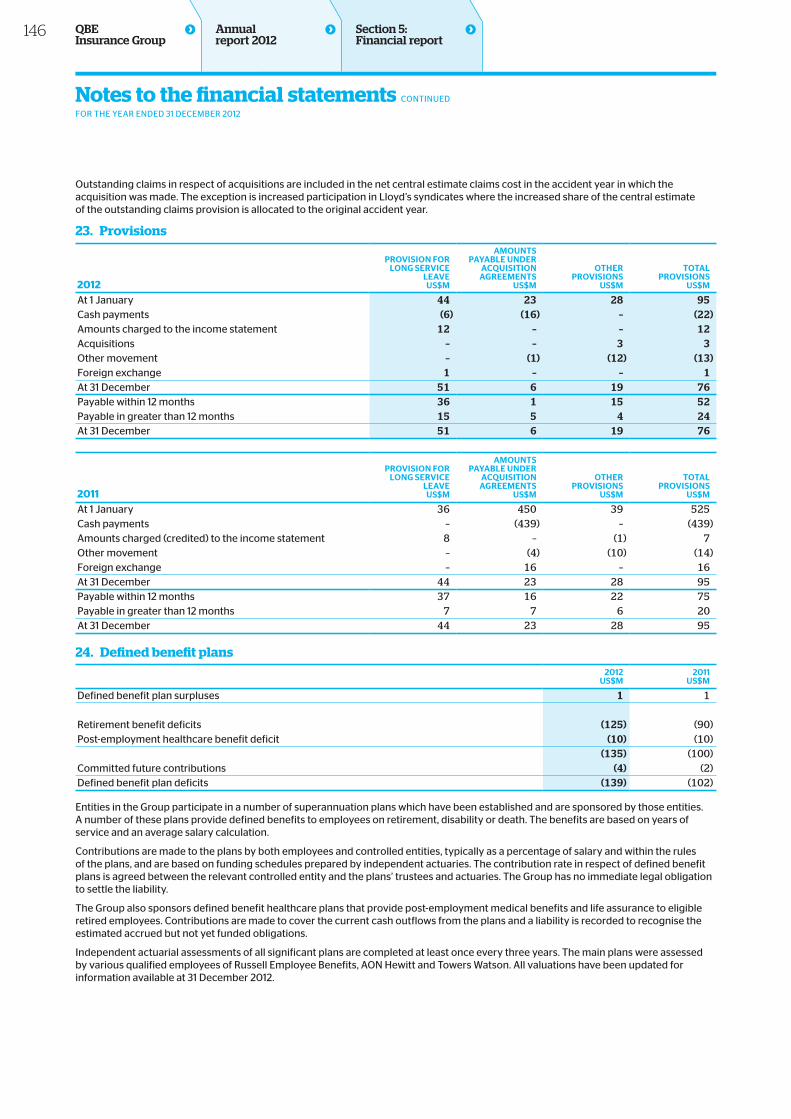
Outstanding claims in respect of acquisitions are included in the net central estimate claims cost in the accident year in which the acquisition was made. The exception is increased participation in Lloyd’s syndicates where the increased share of the central estimate of the outstanding claims provision is allocated to the original accident year.
23. Provisions
2012
ProvisioN ForLoNG service
LeAveUs$m
AmoUNtsPAyAbLe UNDer
AcqUisitioNAGreemeNts
Us$m
otHerProvisioNs
Us$m
totALProvisioNs
Us$m
At 1 January 44 23 28 95Cash payments (6) (16) – (22)Amounts charged to the income statement 12 – – 12Acquisitions – – 3 3Other movement – (1) (12) (13)Foreign exchange 1 – – 1At 31 December 51 6 19 76Payable within 12 months 36 1 15 52Payable in greater than 12 months 15 5 4 24At 31 December 51 6 19 76
2011
ProvisioN ForLoNG service
LeAveUs$m
AmoUNtsPAyAbLe UNDer
AcqUisitioNAGreemeNts
Us$m
otHerProvisioNs
Us$m
totALProvisioNs
Us$m
At 1 January 36 450 39 525Cash payments – (439) – (439)Amounts charged (credited) to the income statement 8 – (1) 7Other movement – (4) (10) (14)Foreign exchange – 16 – 16At 31 December 44 23 28 95Payable within 12 months 37 16 22 75Payable in greater than 12 months 7 7 6 20At 31 December 44 23 28 95
24. Defined benefit plans2012
Us$m2011
Us$m
Defined benefit plan surpluses 1 1
Retirement benefit deficits (125) (90)Post-employment healthcare benefit deficit (10) (10)
(135) (100)Committed future contributions (4) (2)Defined benefit plan deficits (139) (102)
Entities in the Group participate in a number of superannuation plans which have been established and are sponsored by those entities. A number of these plans provide defined benefits to employees on retirement, disability or death. The benefits are based on years of service and an average salary calculation.
Contributions are made to the plans by both employees and controlled entities, typically as a percentage of salary and within the rules of the plans, and are based on funding schedules prepared by independent actuaries. The contribution rate in respect of defined benefit plans is agreed between the relevant controlled entity and the plans’ trustees and actuaries. The Group has no immediate legal obligation to settle the liability.
The Group also sponsors defined benefit healthcare plans that provide post-employment medical benefits and life assurance to eligible retired employees. Contributions are made to cover the current cash outflows from the plans and a liability is recorded to recognise the estimated accrued but not yet funded obligations.
Independent actuarial assessments of all significant plans are completed at least once every three years. The main plans were assessed by various qualified employees of Russell Employee Benefits, AON Hewitt and Towers Watson. All valuations have been updated for information available at 31 December 2012.
Notes to the financial statements CONTINUED
FOR THE YEAR ENDED 31 DECEMBER 2012
Section 5: Financial report
146 QBE Insurance Group
Annual report 2012
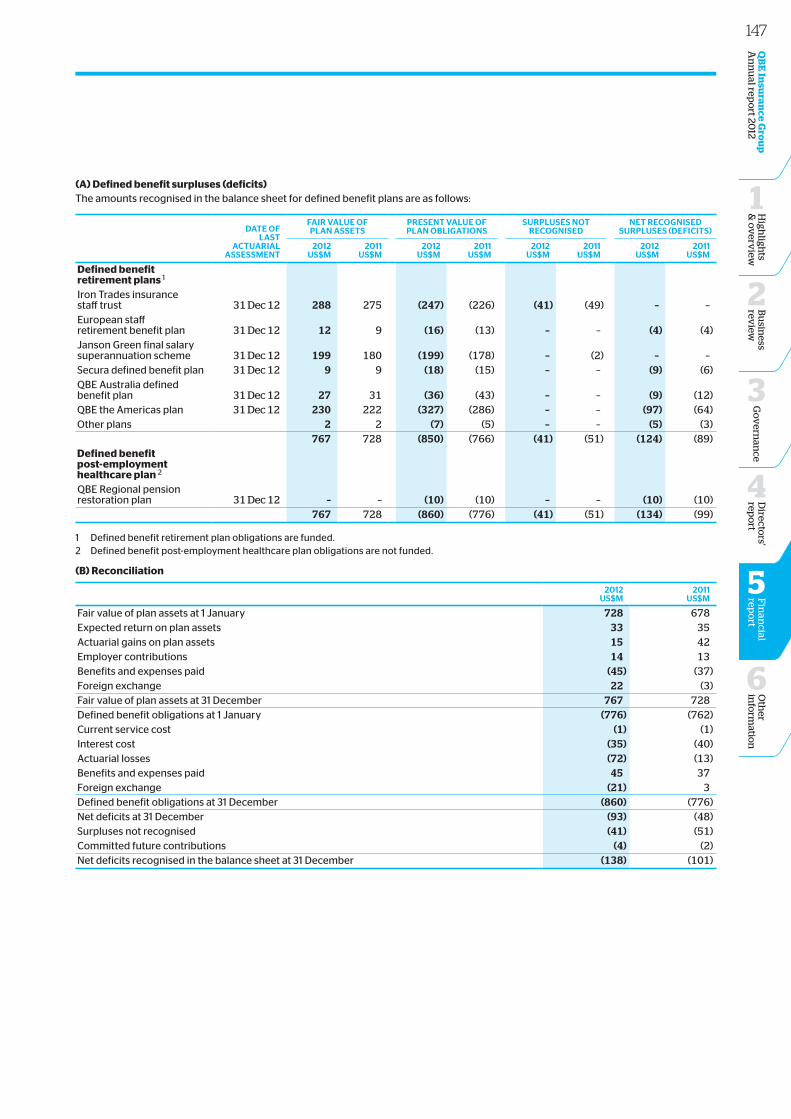
(A) Defined benefit surpluses (deficits)The amounts recognised in the balance sheet for defined benefit plans are as follows:
DAte oFLAst
ActUAriALAssessmeNt
FAir vALUe oFPLAN Assets
PreseNt vALUe oF PLAN obLiGAtioNs
sUrPLUses Not recoGNiseD
Net recoGNiseD sUrPLUses (DeFicits)
2012Us$m
2011Us$m
2012Us$m
2011Us$m
2012Us$m
2011Us$m
2012Us$m
2011Us$m
Defined benefit retirement plans 1 Iron Trades insurance staff trust 31 Dec 12 288 275 (247) (226) (41) (49) – –European staff retirement benefit plan 31 Dec 12 12 9 (16) (13) – – (4) (4)Janson Green final salary superannuation scheme 31 Dec 12 199 180 (199) (178) – (2) – –Secura defined benefit plan 31 Dec 12 9 9 (18) (15) – – (9) (6)QBE Australia defined benefit plan 31 Dec 12 27 31 (36) (43) – – (9) (12)QBE the Americas plan 31 Dec 12 230 222 (327) (286) – – (97) (64)Other plans 2 2 (7) (5) – – (5) (3)
767 728 (850) (766) (41) (51) (124) (89)Defined benefit post‑employment healthcare plan 2 QBE Regional pension restoration plan 31 Dec 12 – – (10) (10) – – (10) (10)
767 728 (860) (776) (41) (51) (134) (99)
1 Defined benefit retirement plan obligations are funded.2 Defined benefit post-employment healthcare plan obligations are not funded.
(B) Reconciliation
2012Us$m
2011Us$m
Fair value of plan assets at 1 January 728 678Expected return on plan assets 33 35Actuarial gains on plan assets 15 42Employer contributions 14 13Benefits and expenses paid (45) (37)Foreign exchange 22 (3)Fair value of plan assets at 31 December 767 728Defined benefit obligations at 1 January (776) (762)Current service cost (1) (1)Interest cost (35) (40)Actuarial losses (72) (13)Benefits and expenses paid 45 37Foreign exchange (21) 3Defined benefit obligations at 31 December (860) (776)Net deficits at 31 December (93) (48)Surpluses not recognised (41) (51)Committed future contributions (4) (2)Net deficits recognised in the balance sheet at 31 December (138) (101)
147O
ther
info
rmatio
n
6
Directo
rs' rep
ort
4
Fin
ancial
repo
rt
5
QB
E In
suran
ce Gro
up
A
nn
ual rep
ort 20
12B
usin
ess rev
iew
2
Go
vern
ance
3
High
lights
& o
verv
iew
1
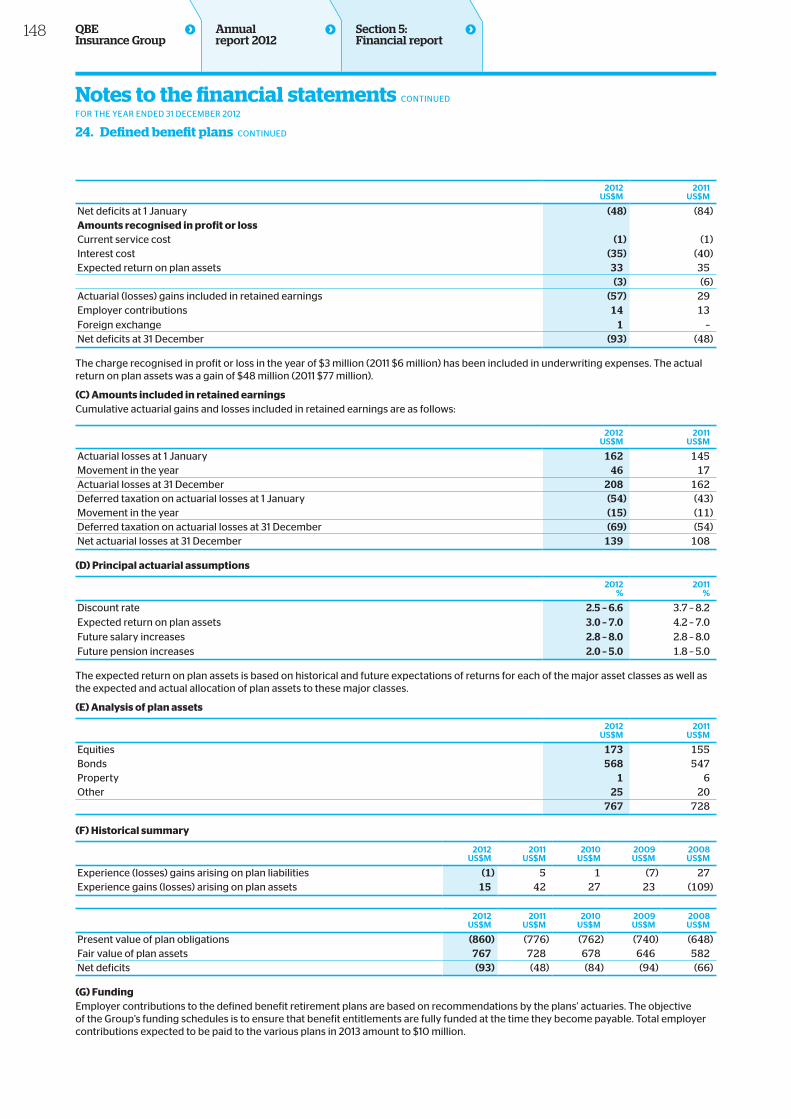
2012Us$m
2011Us$m
Net deficits at 1 January (48) (84)Amounts recognised in profit or loss Current service cost (1) (1)Interest cost (35) (40)Expected return on plan assets 33 35 (3) (6)Actuarial (losses) gains included in retained earnings (57) 29Employer contributions 14 13Foreign exchange 1 –Net deficits at 31 December (93) (48)
The charge recognised in profit or loss in the year of $3 million (2011 $6 million) has been included in underwriting expenses. The actual return on plan assets was a gain of $48 million (2011 $77 million).
(C) Amounts included in retained earningsCumulative actuarial gains and losses included in retained earnings are as follows:
2012Us$m
2011Us$m
Actuarial losses at 1 January 162 145Movement in the year 46 17Actuarial losses at 31 December 208 162Deferred taxation on actuarial losses at 1 January (54) (43)Movement in the year (15) (11)Deferred taxation on actuarial losses at 31 December (69) (54)Net actuarial losses at 31 December 139 108
(D) Principal actuarial assumptions
2012%
2011%
Discount rate 2.5 – 6.6 3.7 – 8.2Expected return on plan assets 3.0 – 7.0 4.2 – 7.0Future salary increases 2.8 – 8.0 2.8 – 8.0Future pension increases 2.0 – 5.0 1.8 – 5.0
The expected return on plan assets is based on historical and future expectations of returns for each of the major asset classes as well as the expected and actual allocation of plan assets to these major classes.
(E) Analysis of plan assets
2012Us$m
2011Us$m
Equities 173 155Bonds 568 547Property 1 6Other 25 20 767 728
(F) Historical summary
2012Us$m
2011Us$m
2010Us$m
2009Us$m
2008Us$m
Experience (losses) gains arising on plan liabilities (1) 5 1 (7) 27Experience gains (losses) arising on plan assets 15 42 27 23 (109)
2012Us$m
2011Us$m
2010Us$m
2009Us$m
2008Us$m
Present value of plan obligations (860) (776) (762) (740) (648)Fair value of plan assets 767 728 678 646 582Net deficits (93) (48) (84) (94) (66)
(G) FundingEmployer contributions to the defined benefit retirement plans are based on recommendations by the plans’ actuaries. The objective of the Group’s funding schedules is to ensure that benefit entitlements are fully funded at the time they become payable. Total employer contributions expected to be paid to the various plans in 2013 amount to $10 million.
Section 5: Financial report
Notes to the financial statements CONTINUED
FOR THE YEAR ENDED 31 DECEMBER 2012
24. Defined benefit plans CONTINUED
148 QBE Insurance Group
Annual report 2012
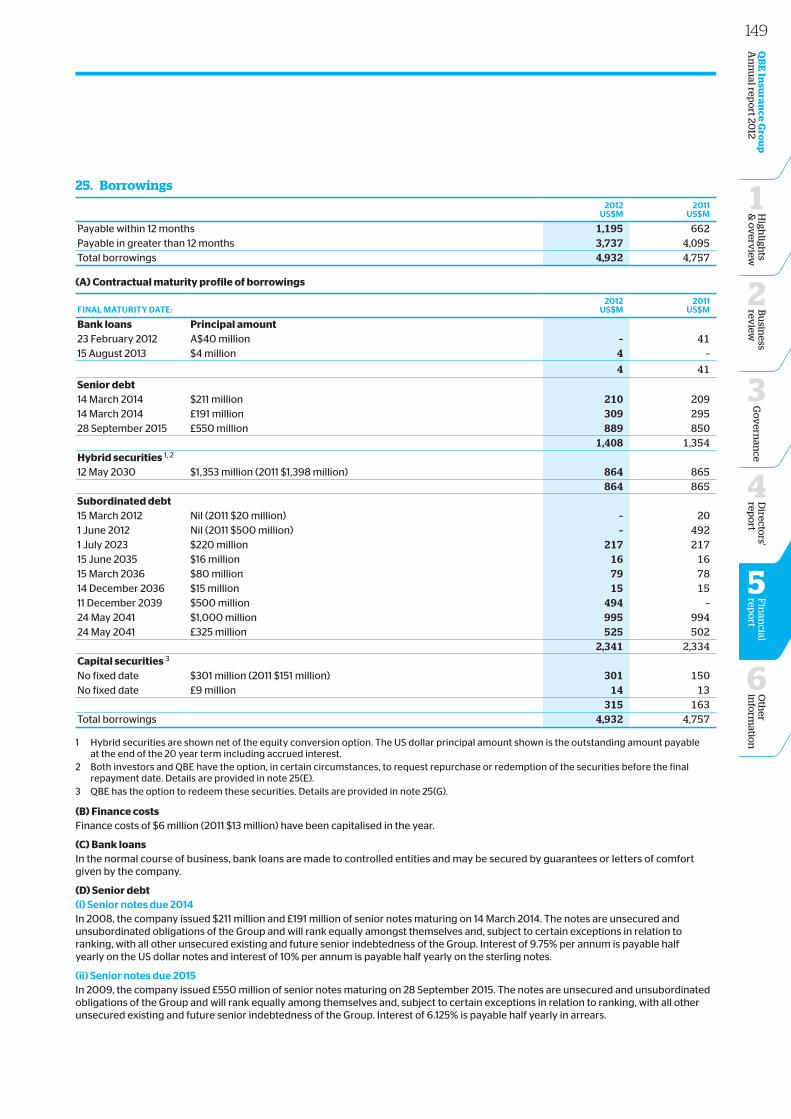
25. Borrowings2012
Us$m2011
Us$m
Payable within 12 months 1,195 662Payable in greater than 12 months 3,737 4,095Total borrowings 4,932 4,757
(A) Contractual maturity profile of borrowings
FiNAL mAtUrity DAte:2012
Us$m2011
Us$m
Bank loans Principal amount 23 February 2012 A$40 million – 4115 August 2013 $4 million 4 –
4 41
Senior debt 14 March 2014 $211 million 210 20914 March 2014 £191 million 309 29528 September 2015 £550 million 889 850 1,408 1,354Hybrid securities 1, 2 12 May 2030 $1,353 million (2011 $1,398 million) 864 865 864 865Subordinated debt 15 March 2012 Nil (2011 $20 million) – 201 June 2012 Nil (2011 $500 million) – 4921 July 2023 $220 million 217 21715 June 2035 $16 million 16 1615 March 2036 $80 million 79 7814 December 2036 $15 million 15 1511 December 2039 $500 million 494 –24 May 2041 $1,000 million 995 99424 May 2041 £325 million 525 502 2,341 2,334Capital securities 3 No fixed date $301 million (2011 $151 million) 301 150No fixed date £9 million 14 13 315 163Total borrowings 4,932 4,757
1 Hybrid securities are shown net of the equity conversion option. The US dollar principal amount shown is the outstanding amount payable at the end of the 20 year term including accrued interest.
2 Both investors and QBE have the option, in certain circumstances, to request repurchase or redemption of the securities before the final repayment date. Details are provided in note 25(E).
3 QBE has the option to redeem these securities. Details are provided in note 25(G).
(B) Finance costsFinance costs of $6 million (2011 $13 million) have been capitalised in the year.
(C) Bank loansIn the normal course of business, bank loans are made to controlled entities and may be secured by guarantees or letters of comfort given by the company.
(D) Senior debt(i) senior notes due 2014In 2008, the company issued $211 million and £191 million of senior notes maturing on 14 March 2014. The notes are unsecured and unsubordinated obligations of the Group and will rank equally amongst themselves and, subject to certain exceptions in relation to ranking, with all other unsecured existing and future senior indebtedness of the Group. Interest of 9.75% per annum is payable half yearly on the US dollar notes and interest of 10% per annum is payable half yearly on the sterling notes.
(ii) senior notes due 2015In 2009, the company issued £550 million of senior notes maturing on 28 September 2015. The notes are unsecured and unsubordinated obligations of the Group and will rank equally among themselves and, subject to certain exceptions in relation to ranking, with all other unsecured existing and future senior indebtedness of the Group. Interest of 6.125% is payable half yearly in arrears.
149O
ther
info
rmatio
n
6
Directo
rs' rep
ort
4
Fin
ancial
repo
rt
5
QB
E In
suran
ce Gro
up
A
nn
ual rep
ort 20
12B
usin
ess rev
iew
2
Go
vern
ance
3
High
lights
& o
verv
iew
1
(E) Hybrid securities(i) Hybrid securities due 2030In 2010, the Group raised $850 million through the issue of 20 year hybrid securities. Interest accumulates at 2.5% per annum (compounding semi-annually). In the event of conversion, the company will issue a fixed number of shares to the security holders. The conversion rate may be adjusted in certain circumstances to take into account dividends paid on the company’s ordinary shares. In the event of redemption, repurchase or maturity, the Group can elect to repay the principal and accreted interest in either cash or the equivalent value in shares of the company, or a combination of both. Investors can request repurchase at the end of three, five, seven, 10 or 15 years from the date of issue. The Group can redeem the securities at any time on or after three years from the date of issue. Investors have the option to convert the security if:
• the market value of the security is less than the US dollar equivalent of the market value of the underlying shares in the company for five consecutive trading days;
• the securities are called for redemption; or
• on certain corporate transactions occurring (e.g. change in control).
The liability component of the securities, being the obligation to make future payments of principal and interest to investors, is included in borrowings and the equity conversion option is included in equity.
In the event of conversion of all the securities, approximately 33.4 million shares will be issued. In the event of redemption, repurchase or maturity, approximately 80 million shares would be issued based on the accreted value and the share price at 31 December 2012.
The hybrid securities are guaranteed by the company and a controlled entity. The claims of investors under these guarantees in general will rank equally with all existing and future unsecured and unsubordinated indebtedness of the company and the controlled entity.
In 2012, $45 million of the hybrid securities were repurchased by the consolidated entity, at no gain or loss. These securities and the corresponding liability are eliminated in the Group’s balance sheet.
(F) Subordinated debt(i) subordinated debt due 2020On 1 June 2012, the consolidated entity redeemed the subordinated debt securities for cash.
(ii) subordinated debt due 2023In 2003, the Group raised $250 million through the issue of subordinated debt securities with a 20 year maturity, redeemable at the option of the company after 10 years. The securities entitle holders to receive a fixed interest rate of 5.647% per annum for the first 10 years, payable semi-annually on 1 January and 1 July.
During 2009, $30 million of subordinated debt securities due 2023 were repurchased by the Group, for cash, at a discount. These securities continue to be held by the Group. The asset and the corresponding liability are eliminated in the Group’s balance sheet.
(iii) subordinated debt due 2039On 11 December 2012, the Group raised $500 million through the issue of subordinated debt securities with a 27 year maturity. The securities entitle holders to receive interest at a floating rate of 3.25% over the six month US dollar LIBOR, payable semi-annually in arrears.
The securities are redeemable prior to the ultimate maturity date at the option of QBE on and from 11 December 2019 or earlier for a regulatory event or tax event, provided the securities will be replaced with equal or better capital, APRA is satisfied that QBE will be well above its minimum capital requirements and QBE has received APRA’s prior approval.
Investors may exchange the securities into a variable number of QBE ordinary shares from 11 June 2014 to 11 December 2017 and at any time prior to 11 December 2017 upon an acquisition event occurring or if there is an event of default, QBE delists or the volume weighted average price of QBE’s ordinary shares is less than or equal to 60% of the issue date volume weighted average price.
(iv) subordinated debt due 2041On 24 May 2011, the Group raised $1 billion and £325 million ($526 million) through the issue of subordinated debt securities with a 30 year maturity. The securities entitle holders to receive interest at a fixed rate of 7.25% and 7.5% per annum respectively until 24 May 2021, at which point the rate will reset to a 10 year mid market swap rate plus a spread of 4.05% and 4.0% respectively. The rate will reset again, on the same basis, on 24 May 2031.
The securities are redeemable prior to the ultimate maturity date at the option of QBE with the written approval of APRA, on 24 May 2021, 24 May 2031, 24 May 2041 or in the event of:
• certain tax and US investment company registration events, which allow a redemption at any time; or
• certain regulatory and rating agency equity credit events which allow redemption at any time after 24 May 2016.
(v) security arrangementsThe claims of bondholders pursuant to the subordinated debt will be subordinated in right of payment to the claims of all senior creditors, including policyholders, of the relevant controlled entity.
(G) Capital securitiesIn 2006, a controlled entity issued £300 million of capital securities. The securities have no fixed redemption date and may not be called for redemption or conversion by the investors. The issuer may redeem the securities on 18 July 2016 and certain specified dates thereafter. On 18 July 2016, the coupon on the securities will change from a fixed to a floating rate.
In 2007, a controlled entity issued $550 million of capital securities. The securities have no fixed redemption date and may not be called for redemption or conversion by the investors. The issuer may redeem the securities on 1 June 2017 and certain specified dates thereafter. On 1 June 2017, the coupon on the securities will change from a fixed to a floating rate.
Both issues of capital securities are subordinated. Distributions are deferrable and not cumulative. If a distribution or principal amount is not paid by the controlled entity, and the company does not pay the amount under the guarantee, then the capital securities are to be redeemed for QBE preference shares. For so long as the distributions or principal amounts are outstanding, no payments (including distributions or principal amounts) are to be made on the company’s shares or other instruments ranking junior to the securities. Payment of distributions or principal amounts on equal ranking securities may be paid proportionally.
Between 2008 and 2011, $399 million and £291 million of capital securities were repurchased by the Group for cash, at a discount. During 2012, $150 million were sold back into the market, giving rise to a loss of $12 million. The remaining securities continue to be held by the Group. The assets and the corresponding liabilities are eliminated in the Group’s balance sheet.
The performance of the obligations of the controlled entity under the capital securities is guaranteed by the company to the extent that the controlled entity has funds. The guarantee is an unsecured and subordinated obligation of the company. The guarantee ranks senior to the claims of the holders of ordinary shares of the company, equally with equally ranked securities and instruments of the company and junior to the claims of other creditors of the company.
Section 5: Financial report
Notes to the financial statements CONTINUED
FOR THE YEAR ENDED 31 DECEMBER 2012
25. Borrowings CONTINUED
150 QBE Insurance Group
Annual report 2012
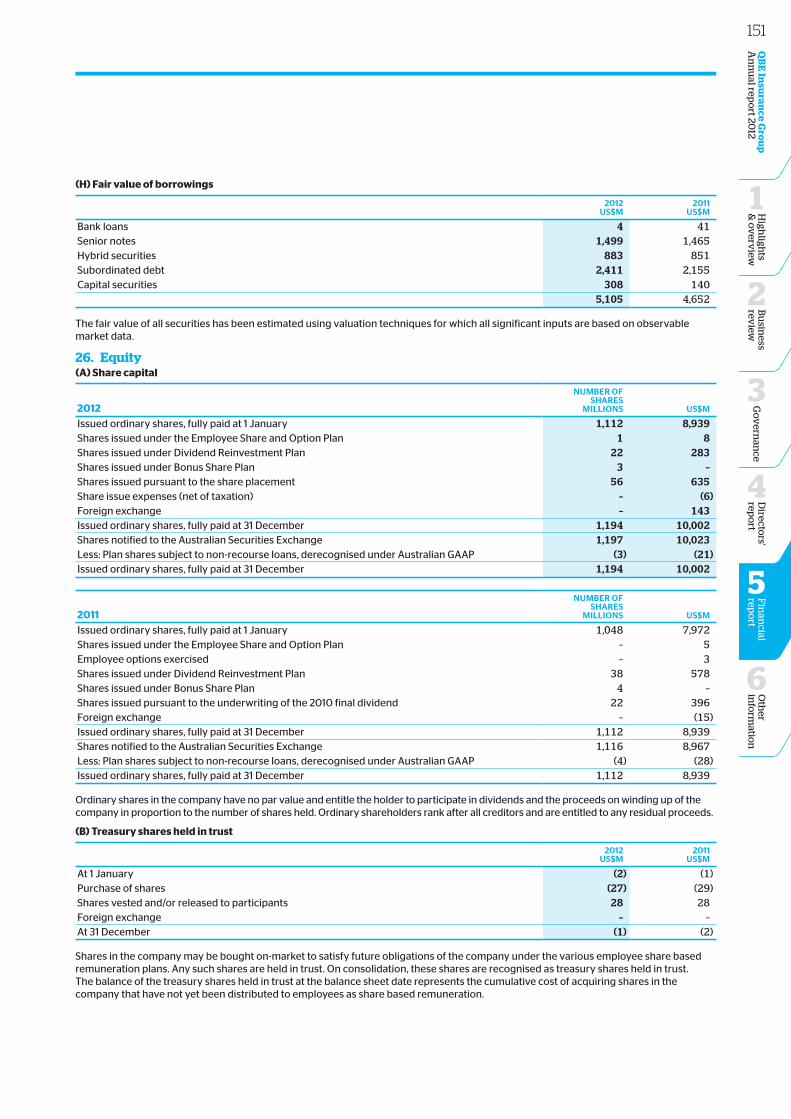
(H) Fair value of borrowings
2012Us$m
2011Us$m
Bank loans 4 41Senior notes 1,499 1,465Hybrid securities 883 851Subordinated debt 2,411 2,155Capital securities 308 140 5,105 4,652
The fair value of all securities has been estimated using valuation techniques for which all significant inputs are based on observable market data.
26. Equity(A) Share capital
2012
NUmber oFsHAres
miLLioNs Us$m
Issued ordinary shares, fully paid at 1 January 1,112 8,939Shares issued under the Employee Share and Option Plan 1 8Shares issued under Dividend Reinvestment Plan 22 283Shares issued under Bonus Share Plan 3 –Shares issued pursuant to the share placement 56 635Share issue expenses (net of taxation) – (6)Foreign exchange – 143Issued ordinary shares, fully paid at 31 December 1,194 10,002Shares notified to the Australian Securities Exchange 1,197 10,023Less: Plan shares subject to non-recourse loans, derecognised under Australian GAAP (3) (21)Issued ordinary shares, fully paid at 31 December 1,194 10,002
2011
NUmber oFsHAres
miLLioNs Us$m
Issued ordinary shares, fully paid at 1 January 1,048 7,972Shares issued under the Employee Share and Option Plan – 5Employee options exercised – 3Shares issued under Dividend Reinvestment Plan 38 578Shares issued under Bonus Share Plan 4 –Shares issued pursuant to the underwriting of the 2010 final dividend 22 396Foreign exchange – (15)Issued ordinary shares, fully paid at 31 December 1,112 8,939Shares notified to the Australian Securities Exchange 1,116 8,967Less: Plan shares subject to non-recourse loans, derecognised under Australian GAAP (4) (28)Issued ordinary shares, fully paid at 31 December 1,112 8,939
Ordinary shares in the company have no par value and entitle the holder to participate in dividends and the proceeds on winding up of the company in proportion to the number of shares held. Ordinary shareholders rank after all creditors and are entitled to any residual proceeds.
(B) Treasury shares held in trust
2012Us$m
2011Us$m
At 1 January (2) (1)Purchase of shares (27) (29)Shares vested and/or released to participants 28 28Foreign exchange – –At 31 December (1) (2)
Shares in the company may be bought on-market to satisfy future obligations of the company under the various employee share based remuneration plans. Any such shares are held in trust. On consolidation, these shares are recognised as treasury shares held in trust. The balance of the treasury shares held in trust at the balance sheet date represents the cumulative cost of acquiring shares in the company that have not yet been distributed to employees as share based remuneration.
151O
ther
info
rmatio
n
6
Directo
rs' rep
ort
4
Fin
ancial
repo
rt
5
QB
E In
suran
ce Gro
up
A
nn
ual rep
ort 20
12B
usin
ess rev
iew
2
Go
vern
ance
3
High
lights
& o
verv
iew
1
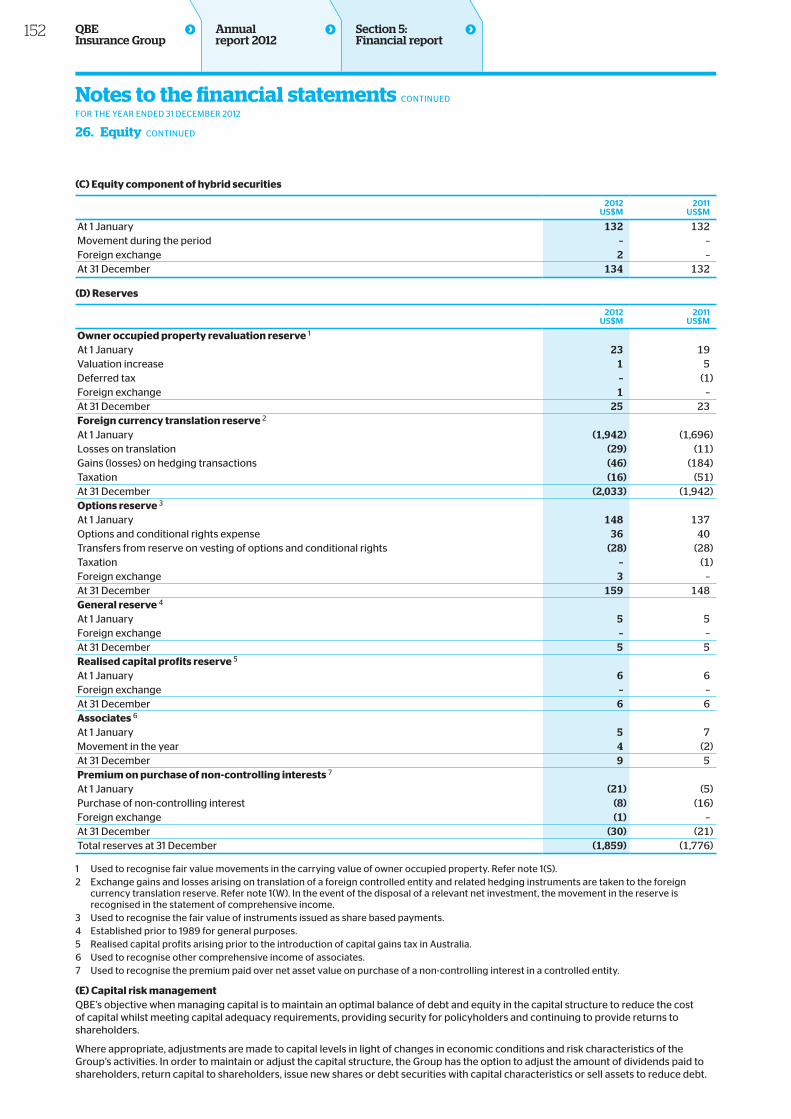
(C) Equity component of hybrid securities
2012Us$m
2011Us$m
At 1 January 132 132Movement during the period – –Foreign exchange 2 –At 31 December 134 132
(D) Reserves
2012Us$m
2011Us$m
Owner occupied property revaluation reserve 1 At 1 January 23 19Valuation increase 1 5Deferred tax – (1)Foreign exchange 1 –At 31 December 25 23Foreign currency translation reserve 2 At 1 January (1,942) (1,696)Losses on translation (29) (11)Gains (losses) on hedging transactions (46) (184)Taxation (16) (51)At 31 December (2,033) (1,942)Options reserve 3 At 1 January 148 137Options and conditional rights expense 36 40Transfers from reserve on vesting of options and conditional rights (28) (28)Taxation – (1)Foreign exchange 3 –At 31 December 159 148General reserve 4 At 1 January 5 5Foreign exchange – –At 31 December 5 5Realised capital profits reserve 5 At 1 January 6 6Foreign exchange – –At 31 December 6 6Associates 6 At 1 January 5 7Movement in the year 4 (2)At 31 December 9 5Premium on purchase of non‑controlling interests 7 At 1 January (21) (5)Purchase of non-controlling interest (8) (16)Foreign exchange (1) –At 31 December (30) (21)Total reserves at 31 December (1,859) (1,776)
1 Used to recognise fair value movements in the carrying value of owner occupied property. Refer note 1(S). 2 Exchange gains and losses arising on translation of a foreign controlled entity and related hedging instruments are taken to the foreign
currency translation reserve. Refer note 1(W). In the event of the disposal of a relevant net investment, the movement in the reserve is recognised in the statement of comprehensive income.
3 Used to recognise the fair value of instruments issued as share based payments.4 Established prior to 1989 for general purposes.5 Realised capital profits arising prior to the introduction of capital gains tax in Australia.6 Used to recognise other comprehensive income of associates.7 Used to recognise the premium paid over net asset value on purchase of a non-controlling interest in a controlled entity.
(E) Capital risk managementQBE’s objective when managing capital is to maintain an optimal balance of debt and equity in the capital structure to reduce the cost of capital whilst meeting capital adequacy requirements, providing security for policyholders and continuing to provide returns to shareholders.
Where appropriate, adjustments are made to capital levels in light of changes in economic conditions and risk characteristics of the Group’s activities. In order to maintain or adjust the capital structure, the Group has the option to adjust the amount of dividends paid to shareholders, return capital to shareholders, issue new shares or debt securities with capital characteristics or sell assets to reduce debt.
Section 5: Financial report
Notes to the financial statements CONTINUED
FOR THE YEAR ENDED 31 DECEMBER 2012
26. Equity CONTINUED
152 QBE Insurance Group
Annual report 2012
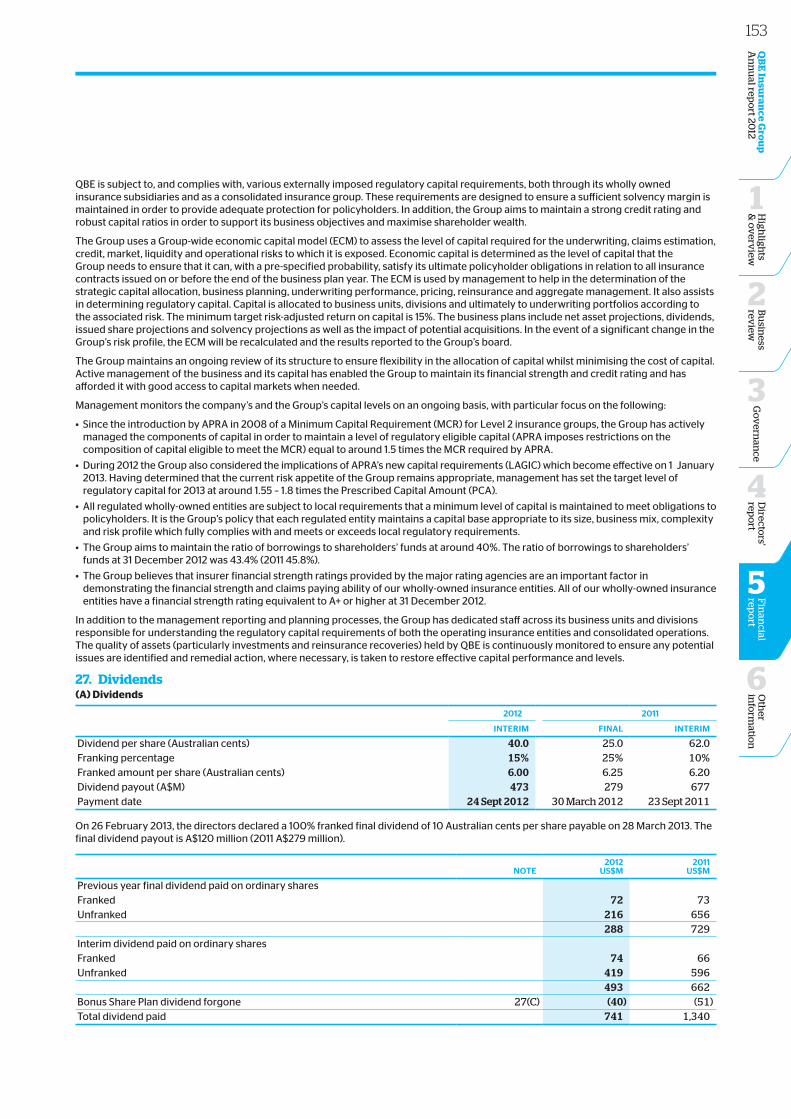
QBE is subject to, and complies with, various externally imposed regulatory capital requirements, both through its wholly owned insurance subsidiaries and as a consolidated insurance group. These requirements are designed to ensure a sufficient solvency margin is maintained in order to provide adequate protection for policyholders. In addition, the Group aims to maintain a strong credit rating and robust capital ratios in order to support its business objectives and maximise shareholder wealth.
The Group uses a Group-wide economic capital model (ECM) to assess the level of capital required for the underwriting, claims estimation, credit, market, liquidity and operational risks to which it is exposed. Economic capital is determined as the level of capital that the Group needs to ensure that it can, with a pre-specified probability, satisfy its ultimate policyholder obligations in relation to all insurance contracts issued on or before the end of the business plan year. The ECM is used by management to help in the determination of the strategic capital allocation, business planning, underwriting performance, pricing, reinsurance and aggregate management. It also assists in determining regulatory capital. Capital is allocated to business units, divisions and ultimately to underwriting portfolios according to the associated risk. The minimum target risk-adjusted return on capital is 15%. The business plans include net asset projections, dividends, issued share projections and solvency projections as well as the impact of potential acquisitions. In the event of a significant change in the Group’s risk profile, the ECM will be recalculated and the results reported to the Group’s board.
The Group maintains an ongoing review of its structure to ensure flexibility in the allocation of capital whilst minimising the cost of capital. Active management of the business and its capital has enabled the Group to maintain its financial strength and credit rating and has afforded it with good access to capital markets when needed.
Management monitors the company’s and the Group’s capital levels on an ongoing basis, with particular focus on the following:
• Since the introduction by APRA in 2008 of a Minimum Capital Requirement (MCR) for Level 2 insurance groups, the Group has actively managed the components of capital in order to maintain a level of regulatory eligible capital (APRA imposes restrictions on the composition of capital eligible to meet the MCR) equal to around 1.5 times the MCR required by APRA.
• During 2012 the Group also considered the implications of APRA’s new capital requirements (LAGIC) which become effective on 1 January 2013. Having determined that the current risk appetite of the Group remains appropriate, management has set the target level of regulatory capital for 2013 at around 1.55 – 1.8 times the Prescribed Capital Amount (PCA).
• All regulated wholly-owned entities are subject to local requirements that a minimum level of capital is maintained to meet obligations to policyholders. It is the Group’s policy that each regulated entity maintains a capital base appropriate to its size, business mix, complexity and risk profile which fully complies with and meets or exceeds local regulatory requirements.
• The Group aims to maintain the ratio of borrowings to shareholders’ funds at around 40%. The ratio of borrowings to shareholders’ funds at 31 December 2012 was 43.4% (2011 45.8%).
• The Group believes that insurer financial strength ratings provided by the major rating agencies are an important factor in demonstrating the financial strength and claims paying ability of our wholly-owned insurance entities. All of our wholly-owned insurance entities have a financial strength rating equivalent to A+ or higher at 31 December 2012.
In addition to the management reporting and planning processes, the Group has dedicated staff across its business units and divisions responsible for understanding the regulatory capital requirements of both the operating insurance entities and consolidated operations. The quality of assets (particularly investments and reinsurance recoveries) held by QBE is continuously monitored to ensure any potential issues are identified and remedial action, where necessary, is taken to restore effective capital performance and levels.
27. Dividends(A) Dividends
2012 2011
iNterim FiNAL iNterim
Dividend per share (Australian cents) 40.0 25.0 62.0Franking percentage 15% 25% 10%Franked amount per share (Australian cents) 6.00 6.25 6.20Dividend payout (A$M) 473 279 677Payment date 24 Sept 2012 30 March 2012 23 Sept 2011
On 26 February 2013, the directors declared a 100% franked final dividend of 10 Australian cents per share payable on 28 March 2013. The final dividend payout is A$120 million (2011 A$279 million).
Note2012
Us$m2011
Us$m
Previous year final dividend paid on ordinary shares Franked 72 73Unfranked 216 656
288 729Interim dividend paid on ordinary shares Franked 74 66Unfranked 419 596
493 662Bonus Share Plan dividend forgone 27(C) (40) (51)Total dividend paid 741 1,340
153O
ther
info
rmatio
n
6
Directo
rs' rep
ort
4
Fin
ancial
repo
rt
5
QB
E In
suran
ce Gro
up
A
nn
ual rep
ort 20
12B
usin
ess rev
iew
2
Go
vern
ance
3
High
lights
& o
verv
iew
1
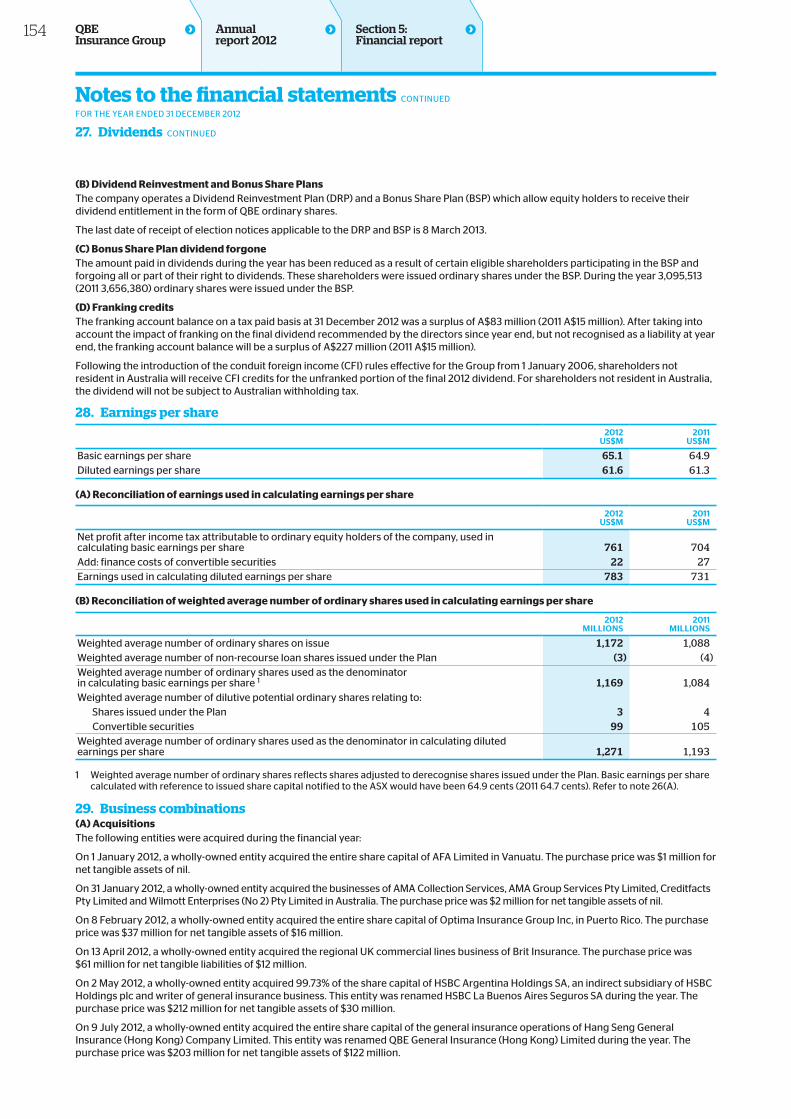
(B) Dividend Reinvestment and Bonus Share PlansThe company operates a Dividend Reinvestment Plan (DRP) and a Bonus Share Plan (BSP) which allow equity holders to receive their dividend entitlement in the form of QBE ordinary shares.
The last date of receipt of election notices applicable to the DRP and BSP is 8 March 2013.
(C) Bonus Share Plan dividend forgoneThe amount paid in dividends during the year has been reduced as a result of certain eligible shareholders participating in the BSP and forgoing all or part of their right to dividends. These shareholders were issued ordinary shares under the BSP. During the year 3,095,513 (2011 3,656,380) ordinary shares were issued under the BSP.
(D) Franking creditsThe franking account balance on a tax paid basis at 31 December 2012 was a surplus of A$83 million (2011 A$15 million). After taking into account the impact of franking on the final dividend recommended by the directors since year end, but not recognised as a liability at year end, the franking account balance will be a surplus of A$227 million (2011 A$15 million).
Following the introduction of the conduit foreign income (CFI) rules effective for the Group from 1 January 2006, shareholders not resident in Australia will receive CFI credits for the unfranked portion of the final 2012 dividend. For shareholders not resident in Australia, the dividend will not be subject to Australian withholding tax.
28. Earnings per share2012
Us$m2011
Us$m
Basic earnings per share 65.1 64.9Diluted earnings per share 61.6 61.3
(A) Reconciliation of earnings used in calculating earnings per share
2012Us$m
2011Us$m
Net profit after income tax attributable to ordinary equity holders of the company, used in calculating basic earnings per share 761 704Add: finance costs of convertible securities 22 27Earnings used in calculating diluted earnings per share 783 731
(B) Reconciliation of weighted average number of ordinary shares used in calculating earnings per share
2012miLLioNs
2011miLLioNs
Weighted average number of ordinary shares on issue 1,172 1,088Weighted average number of non-recourse loan shares issued under the Plan (3) (4)Weighted average number of ordinary shares used as the denominator in calculating basic earnings per share 1 1,169 1,084Weighted average number of dilutive potential ordinary shares relating to: Shares issued under the Plan 3 4 Convertible securities 99 105Weighted average number of ordinary shares used as the denominator in calculating dilutedearnings per share 1,271 1,193
1 Weighted average number of ordinary shares reflects shares adjusted to derecognise shares issued under the Plan. Basic earnings per share calculated with reference to issued share capital notified to the ASX would have been 64.9 cents (2011 64.7 cents). Refer to note 26(A).
29. Business combinations(A) AcquisitionsThe following entities were acquired during the financial year:
On 1 January 2012, a wholly-owned entity acquired the entire share capital of AFA Limited in Vanuatu. The purchase price was $1 million for net tangible assets of nil.
On 31 January 2012, a wholly-owned entity acquired the businesses of AMA Collection Services, AMA Group Services Pty Limited, Creditfacts Pty Limited and Wilmott Enterprises (No 2) Pty Limited in Australia. The purchase price was $2 million for net tangible assets of nil.
On 8 February 2012, a wholly-owned entity acquired the entire share capital of Optima Insurance Group Inc, in Puerto Rico. The purchase price was $37 million for net tangible assets of $16 million.
On 13 April 2012, a wholly-owned entity acquired the regional UK commercial lines business of Brit Insurance. The purchase price was $61 million for net tangible liabilities of $12 million.
On 2 May 2012, a wholly-owned entity acquired 99.73% of the share capital of HSBC Argentina Holdings SA, an indirect subsidiary of HSBC Holdings plc and writer of general insurance business. This entity was renamed HSBC La Buenos Aires Seguros SA during the year. The purchase price was $212 million for net tangible assets of $30 million.
On 9 July 2012, a wholly-owned entity acquired the entire share capital of the general insurance operations of Hang Seng General Insurance (Hong Kong) Company Limited. This entity was renamed QBE General Insurance (Hong Kong) Limited during the year. The purchase price was $203 million for net tangible assets of $122 million.
Section 5: Financial report
Notes to the financial statements CONTINUED
FOR THE YEAR ENDED 31 DECEMBER 2012
27. Dividends CONTINUED
154 QBE Insurance Group
Annual report 2012
The fair value of assets and liabilities arising from acquisitions in the years ended 31 December 2012 and 31 December 2011 were as follows:
2012 2011
HsbcArGeNtiNA
Us$m
HANGseNGUs$m
otHerUs$m
totAL
Us$mbALboA
Us$m
reNAissANcere
Us$motHer
Us$mtotAL
Us$m
Cash and cash equivalents 2 21 5 28 930 61 7 998Investments 236 162 33 431 – 209 107 316Trade and other receivables 122 17 19 158 8 461 5 474Reinsurance and other recoveries on outstanding claims 57 5 2 64 – 56 10 66Other assets – – 4 4 – – – –Deferred insurance costs 148 16 12 176 47 33 4 84Property, plant and equipment 2 – 5 7 8 2 1 11Deferred tax assets 31 – – 31 129 33 – 162Intangible assets 93 44 67 204 622 60 11 693Total assets 691 265 147 1,103 1,744 915 145 2,804Trade and other payables 57 19 26 102 147 226 7 380Current tax liabilities 9 1 – 10 – 8 – 8Unearned premium 201 33 24 258 651 124 62 837Outstanding claims 260 33 5 298 249 314 44 607Provisions 3 – – 3 – – – –Deferred tax liabilities 38 13 16 67 80 12 2 94Borrowings – – 5 5 – – – –Total liabilities 568 99 76 743 1,127 684 115 1,926Net assets acquired 123 166 71 360 617 231 30 878
Trade and other receivables in the table above are shown at fair value. The gross contractual amounts receivable are as follows:
2012 2011
HsbcArGeNtiNA
Us$m
HANGseNGUs$m
otHerUs$m
totALUs$m
bALboAUs$m
reNAissANcere
Us$motHer
Us$mtotAL
Us$m
Trade and other receivables 124 17 19 160 10 461 3 474
2012 2011
HsbcArGeNtiNA
Us$m
HANGseNGUs$m
otHerUs$m
totALUs$m
bALboAUs$m
reNAissANcere
Us$motHer
Us$mtotAL
Us$m
Purchase considerationCash 212 203 101 516 708 270 36 1,014Contingent and deferred consideration – – – – – (10) – (10)Total purchase consideration 212 203 101 516 708 260 36 1,004Fair value of net assets acquired 123 166 71 360 617 231 30 878Goodwill 1 89 37 30 156 91 29 6 126
1 “Other” in 2011 is net of a $2 million gain on purchase of a controlled entity.
The above information is presented at the exchange rates prevailing at the date of the acquisition.
In all instances, the goodwill is attributable to the future profitability of the acquisitions and the synergies expected to arise within the Group.
In the US, tax goodwill is deductible on a straight line basis and may arise on either an asset purchase or a stock purchase where an election has been made to treat the stock purchase as an asset purchase for tax. In addition, if there is pre-existing tax goodwill in an entity at the time of acquisition, this will be carried over. The tax value of goodwill may differ from the accounting value of goodwill, with these differences giving rise to deferred tax balances. In the UK, purchased goodwill may be deductible. In most other jurisdictions, goodwill is not deductible and does not give rise to any deferred tax balances.
The third party costs associated with acquisitions in the current year were $3 million.
155O
ther
info
rmatio
n
6
Directo
rs' rep
ort
4
Fin
ancial
repo
rt
5
QB
E In
suran
ce Gro
up
A
nn
ual rep
ort 20
12B
usin
ess rev
iew
2
Go
vern
ance
3
High
lights
& o
verv
iew
1
(i) contribution of acquisitions to the Group resultsIncluded in the consolidated results for the Group for the years ended 31 December 2012 and 31 December 2011 are contributions from acquisitions as follows:
2012 2011
HsbcArGeNtiNA
Us$m
HANGseNGUs$m
otHerUs$m
totALUs$m
bALboAUs$m
reNAissANcere
Us$motHer
Us$mtotAL
Us$m
Gross earned premium 331 31 97 459 1,269 674 99 2,042Net profit (loss) after income tax 3 (32) (16) (45) 226 67 (1) 292
(ii) Annualised results of acquisitionsIf the acquisitions had occurred on 1 January 2012, consolidated gross earned premium and consolidated net profit after income tax for the year ended 31 December 2012 would have been $18,564 million and $775 million respectively.
(B) Critical accounting estimates and judgmentsAccounting estimates and judgments are used to determine the fair values of assets and liabilities purchased in a business combination. Areas requiring a greater degree of judgment or estimation are as follows:
(i) insurance liabilitiesThe fair value of insurance liabilities at acquisition is determined using a market assessed risk margin appropriate to the risks inherent in the acquired portfolio.
(ii) intangible assetsIntangible assets are generally valued at acquisition date by external valuation experts. A number of accepted valuation models exist and these are applied to the valuation of individual intangible assets based on a judgment as to which valuation basis is most appropriate to the type of asset being valued.
30. Share based payments(A) Share schemesThe company, at its 1981 AGM, approved the issue of shares from time to time under an Employee Share and Option Plan (the Plan), up to 5% of the issued ordinary shares in the capital of the company. Any full-time or part-time employee of the Group or any equally-owned joint venture who is offered shares or options is eligible to participate in the Plan.
Under the Plan, ordinary shares of the company are normally offered at the weighted average market price during the five trading days on the ASX up to the date of the offer. Likewise, the exercise price for options offered under the Plan is usually the weighted average market price during the five trading days up to the date of the offer.
In accordance with the terms of the Plan, for awards made up to and including March 2009 interest-free loans were available to employees to subscribe for shares issued under the Plan. Prior to 20 June 2005, the terms of the loans were either personal recourse or non-recourse. With effect from 20 June 2005, only personal recourse loans were granted to employees to subscribe for shares under the Plan. The loans are repayable in certain circumstances such as termination of employment. The award of options and interest-free loans was discontinued for awards made after March 2009.
Currently equity is awarded on three bases within the Plan as detailed below.
(i) qbe deferred equity plansQBE Incentive SchemeThe QBE Incentive Scheme (QIS) is an at-risk reward structure that comprises cash and deferred equity awards. It came into effect from 1 January 2010 and is applicable to deferred equity awards made in March 2011 and thereafter.
executivesUnder the QIS, the directors can issue conditional rights to shares to executives who have already achieved predetermined performance targets. The maximum deferred equity award is based on an amount which is the lesser of 80% of the cash award earned or 100% of fixed remuneration at 31 December, in each case for the financial year immediately prior to the year in which the cash award is paid. The deferred equity award is used as the basis for calculating the number of conditional rights as follows:
• conditional rights to the value of 50% of the award will be converted to fully paid ordinary QBE shares after three years; and
• conditional rights to the value of 50% of the award will be converted to fully paid ordinary QBE shares after five years.
other key senior employeesOther key senior employees of the QBE Group are also eligible to participate in the QIS, with the maximum award restricted to the lesser of 66.67% of the cash award for that year or 100% of base (cash) salary as at 31 December for the financial year prior to the year in which the cash award was paid. The deferred equity award is used as the basis for calculating the number of conditional rights as follows:
• conditional rights to the value of 60% of the award amount will be converted to fully paid ordinary QBE shares after three years; and
• conditional rights to the value of 60% of the award amount will be converted to fully paid ordinary QBE shares after five years.
All QIS participantsFurther shares are issued to executives and other key senior employees under the Bonus Share Plan in relation to the conditional rights to reflect dividends paid on ordinary shares of the company in the period commencing from the date of the grant of the conditional rights.
The shares issued pursuant to the conditional rights are issued without payment being made by the recipient (i.e. at a nil exercise price).
The shares issued pursuant to the conditional rights will only vest if the individual has remained in the Group’s service throughout the vesting period. The Remuneration Committee has the discretion to pay cash in lieu of shares in certain circumstances such as death, disability, redundancy or retirement if the individual is not subject to disciplinary proceedings or notice to terminate employment on that date. The extent of vesting of the conditional rights may be reduced by any material deterioration of the relevant entity’s return on equity during the vesting period.
Deferred Compensation Plan – legacy scheme applicable to the 2009 financial yearThe terms of the Deferred Compensation Plan (DCP) for the period from 1 January 2009 applicable to awards in March 2010 are set out below.
executivesExecutives were invited to participate in the DCP, under which they received conditional rights to fully paid ordinary QBE shares. The maximum deferred equity award was based on an amount which
Section 5: Financial report
Notes to the financial statements CONTINUED
FOR THE YEAR ENDED 31 DECEMBER 2012
29. Business combinations CONTINUED
156 QBE Insurance Group
Annual report 2012
was the lesser of 80% of the short-term cash incentive (STI) award earned or 100% of fixed remuneration at 31 December, in each case in the financial year immediately prior to the year in which the cash award was paid. The maximum DCP award used the same formula as described above in relation to the QIS deferred equity award.
other key senior employeesOther key senior employees of the QBE Group were invited to participate in the DCP, under which they received conditional rights to fully paid ordinary QBE shares. The maximum DCP award was based on an amount which was the lesser of 66.67% of the STI award earned or 100% of base (cash) salary as at 31 December, in each case for the financial year immediately prior to the year in which the cash award is paid. The maximum DCP award was used as a basis for calculating the number of conditional rights using the same formula as described above in relation to the QIS deferred equity award.
All DcP participantsFurther shares were issued to executives and other key senior employees under the Board Share Plan in relation to the conditional rights to reflect dividends paid on ordinary shares of the company in the period commencing from the date of the grant of the conditional rights.
The shares issued pursuant to the conditional rights will only vest if the individual has remained in the Group’s service throughout the vesting period. The Remuneration Committee has the discretion to pay cash in lieu of shares in certain circumstances such as death, disability, redundancy or retirement if the individual is not subject to disciplinary proceedings or notice to terminate employment on that date. The extent of vesting of the conditional rights may be reduced by any material deterioration of the relevant entity’s return on equity during the vesting period.
Deferred Compensation Plan – legacy scheme applicable to 2008 and prior financial yearsFor DCP awards made in March 2009 and prior, the directors were able to issue conditional rights to shares and options to subscribe for shares to senior management who have already achieved predetermined performance criteria. The terms of the DCP varied to take into account the requirements and market conditions of the locations of senior management, but the general terms of the DCP conditional rights and options for both executives and other key senior employees were as follows:
• The conditional rights entitled relevant employees to receive shares on the third anniversary of the grant of the rights. Further shares were issued under the Bonus Share Plan in relation to the conditional rights to reflect dividends paid on ordinary shares of the company in the period commencing from the date of the grant of the conditional rights.
• The shares issued pursuant to the conditional rights were issued without payment being made by senior management (i.e. at a nil exercise price).
• The options were subject to the terms and conditions of the Plan. Options issued in 2004 and prior were normally exercisable after three years, whilst any options issued in 2005 and thereafter are generally exercisable after five years. They must be exercised within a 12 month period after vesting. Interest-free personal recourse loans were granted to persons who held options to fund the exercise of those options.
The shares issued pursuant to the conditional rights and the options will only vest if the individual has remained in the Group’s service throughout the vesting period. The Remuneration Committee has the discretion to pay cash in lieu of shares in certain circumstances such as death, disability, redundancy or retirement if the individual is not subject to disciplinary proceedings or notice on that date.
(ii) share incentive PlanGenerally, all full-time or part-time Group employees in Australia, Ireland, New Zealand, the UK and the US with a minimum of one year’s service are invited to participate in the Share Incentive Plan (the SIP). Under the SIP, which was introduced in 2005, the directors can provide shares up to A$1,000 to employees without payment being made by employees. The allocation of shares is based on the period of service. The shares are purchased on-market and held in trust for the employee for a minimum of three years or until cessation of employment, whichever is earlier.
(iii) Longer-term incentive plans Long-Term Incentive (LTI) plan The Long-Term Incentive (LTI) plan was introduced from 1 January 2010 and replaces the Group Executive Restricted Share Plan (GERSP). Only executives, including the Group Chief Executive Officer, are invited to participate. The LTI plan comprises an award of conditional rights to fully paid ordinary QBE shares without payment by the executive, subject to a five year tenure hurdle, with vesting contingent upon the achievement of two future performance hurdles as follows:
• 50% of the award allocation will be contingent on the Group’s average diluted earnings per share increasing by a compound average 7.5% per annum over the five year vesting period; and
• 50% of the award allocation will be contingent on the Group’s average return on equity and combined operating ratio being in the top 10% of the top 50 largest global insurers and reinsurers as measured by net earned premium for the five year vesting period.
Further shares will be issued under the Bonus Share Plan in relation to the conditional rights to reflect dividends paid on ordinary shares of the company in the period commencing from the date of the grant of the conditional rights.
The Remuneration Committee will continue to exercise discretion when determining the vesting of awards under the LTI. The committee has the discretion to allocate a pro-rata amount in cash in lieu of shares in certain circumstances such as death, disability, redundancy or retirement. The extent of vesting of the conditional rights may be reduced by any material deterioration of the Group’s return on equity during the vesting period.
Group Executive Restricted Share Plan – legacy scheme applicable to 2008 and 2009 financial yearsCertain key management personnel were eligible to participate in the GERSP which came into effect from 1 January 2008. Under the GERSP, eligible executives had the opportunity to receive additional equity in the form of conditional rights if the Group exceeded a return on equity target.
The conditional rights entitled relevant executives to receive fully paid ordinary QBE shares on the third anniversary of the grant of the conditional rights. Further shares are issued under the Bonus Share Plan in relation to the conditional rights to reflect dividends paid on ordinary shares of the company in the period commencing from the date of the grant of the conditional rights. The shares issued pursuant to the conditional rights were issued without payment being made by the executive (i.e. at a nil exercise price).
The shares issued pursuant to the conditional rights will only be issued if the individual has remained in the Group’s service throughout the vesting period (unless leaving due to death, genuine retirement, incapacity due to total and permanent disability or redundancy) and is not subject to disciplinary proceedings or notice to terminate employment on that date. The extent of vesting of the conditional rights may be reduced by any material deterioration of the Group’s return on equity during the vesting period.
157O
ther
info
rmatio
n
6
Directo
rs' rep
ort
4
Fin
ancial
repo
rt
5
QB
E In
suran
ce Gro
up
A
nn
ual rep
ort 20
12B
usin
ess rev
iew
2
Go
vern
ance
3
High
lights
& o
verv
iew
1
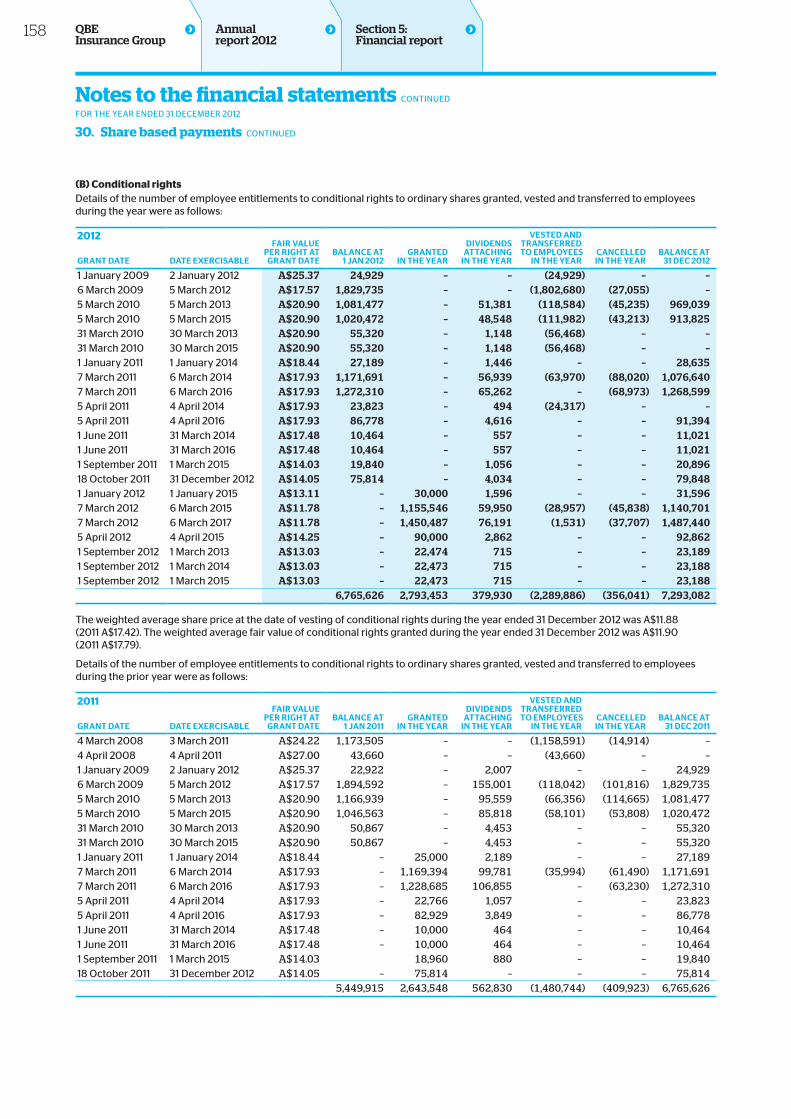
(B) Conditional rightsDetails of the number of employee entitlements to conditional rights to ordinary shares granted, vested and transferred to employees during the year were as follows:
2012
DAte exercisAbLe
FAir vALUePer riGHt At
GrANt DAtebALANce At
1 jAN 2012GrANteD
iN tHe yeAr
DiviDeNDs
AttAcHiNG iN tHe yeAr
vesteD ANDtrANsFerreDto emPLoyees
iN tHe yeArcANceLLeDiN tHe yeAr
bALANce At 31 Dec 2012GrANt DAte
1 January 2009 2 January 2012 A$25.37 24,929 – – (24,929) – –6 March 2009 5 March 2012 A$17.57 1,829,735 – – (1,802,680) (27,055) –5 March 2010 5 March 2013 A$20.90 1,081,477 – 51,381 (118,584) (45,235) 969,0395 March 2010 5 March 2015 A$20.90 1,020,472 – 48,548 (111,982) (43,213) 913,82531 March 2010 30 March 2013 A$20.90 55,320 – 1,148 (56,468) – –31 March 2010 30 March 2015 A$20.90 55,320 – 1,148 (56,468) – –1 January 2011 1 January 2014 A$18.44 27,189 – 1,446 – – 28,6357 March 2011 6 March 2014 A$17.93 1,171,691 – 56,939 (63,970) (88,020) 1,076,6407 March 2011 6 March 2016 A$17.93 1,272,310 – 65,262 – (68,973) 1,268,5995 April 2011 4 April 2014 A$17.93 23,823 – 494 (24,317) – –5 April 2011 4 April 2016 A$17.93 86,778 – 4,616 – – 91,3941 June 2011 31 March 2014 A$17.48 10,464 – 557 – – 11,0211 June 2011 31 March 2016 A$17.48 10,464 – 557 – – 11,0211 September 2011 1 March 2015 A$14.03 19,840 – 1,056 – – 20,89618 October 2011 31 December 2012 A$14.05 75,814 – 4,034 – – 79,8481 January 2012 1 January 2015 A$13.11 – 30,000 1,596 – – 31,5967 March 2012 6 March 2015 A$11.78 – 1,155,546 59,950 (28,957) (45,838) 1,140,7017 March 2012 6 March 2017 A$11.78 – 1,450,487 76,191 (1,531) (37,707) 1,487,4405 April 2012 4 April 2015 A$14.25 – 90,000 2,862 – – 92,8621 September 2012 1 March 2013 A$13.03 – 22,474 715 – – 23,1891 September 2012 1 March 2014 A$13.03 – 22,473 715 – – 23,1881 September 2012 1 March 2015 A$13.03 – 22,473 715 – – 23,188 6,765,626 2,793,453 379,930 (2,289,886) (356,041) 7,293,082
The weighted average share price at the date of vesting of conditional rights during the year ended 31 December 2012 was A$11.88 (2011 A$17.42). The weighted average fair value of conditional rights granted during the year ended 31 December 2012 was A$11.90 (2011 A$17.79).
Details of the number of employee entitlements to conditional rights to ordinary shares granted, vested and transferred to employees during the prior year were as follows:
2011
DAte exercisAbLe
FAir vALUePer riGHt At
GrANt DAtebALANce At
1 jAN 2011GrANteD
iN tHe yeAr
DiviDeNDs
AttAcHiNG iN tHe yeAr
vesteD ANDtrANsFerreDto emPLoyees
iN tHe yeArcANceLLeDiN tHe yeAr
bALANce At 31 Dec 2011GrANt DAte
4 March 2008 3 March 2011 A$24.22 1,173,505 – – (1,158,591) (14,914) –4 April 2008 4 April 2011 A$27.00 43,660 – – (43,660) – –1 January 2009 2 January 2012 A$25.37 22,922 – 2,007 – – 24,9296 March 2009 5 March 2012 A$17.57 1,894,592 – 155,001 (118,042) (101,816) 1,829,7355 March 2010 5 March 2013 A$20.90 1,166,939 – 95,559 (66,356) (114,665) 1,081,4775 March 2010 5 March 2015 A$20.90 1,046,563 – 85,818 (58,101) (53,808) 1,020,47231 March 2010 30 March 2013 A$20.90 50,867 – 4,453 – – 55,32031 March 2010 30 March 2015 A$20.90 50,867 – 4,453 – – 55,3201 January 2011 1 January 2014 A$18.44 – 25,000 2,189 – – 27,1897 March 2011 6 March 2014 A$17.93 – 1,169,394 99,781 (35,994) (61,490) 1,171,6917 March 2011 6 March 2016 A$17.93 – 1,228,685 106,855 – (63,230) 1,272,3105 April 2011 4 April 2014 A$17.93 – 22,766 1,057 – – 23,8235 April 2011 4 April 2016 A$17.93 – 82,929 3,849 – – 86,7781 June 2011 31 March 2014 A$17.48 – 10,000 464 – – 10,4641 June 2011 31 March 2016 A$17.48 – 10,000 464 – – 10,4641 September 2011 1 March 2015 A$14.03 18,960 880 – – 19,84018 October 2011 31 December 2012 A$14.05 – 75,814 – – – 75,814 5,449,915 2,643,548 562,830 (1,480,744) (409,923) 6,765,626
Section 5: Financial report
Notes to the financial statements CONTINUED
FOR THE YEAR ENDED 31 DECEMBER 2012
30. Share based payments CONTINUED
158 QBE Insurance Group
Annual report 2012
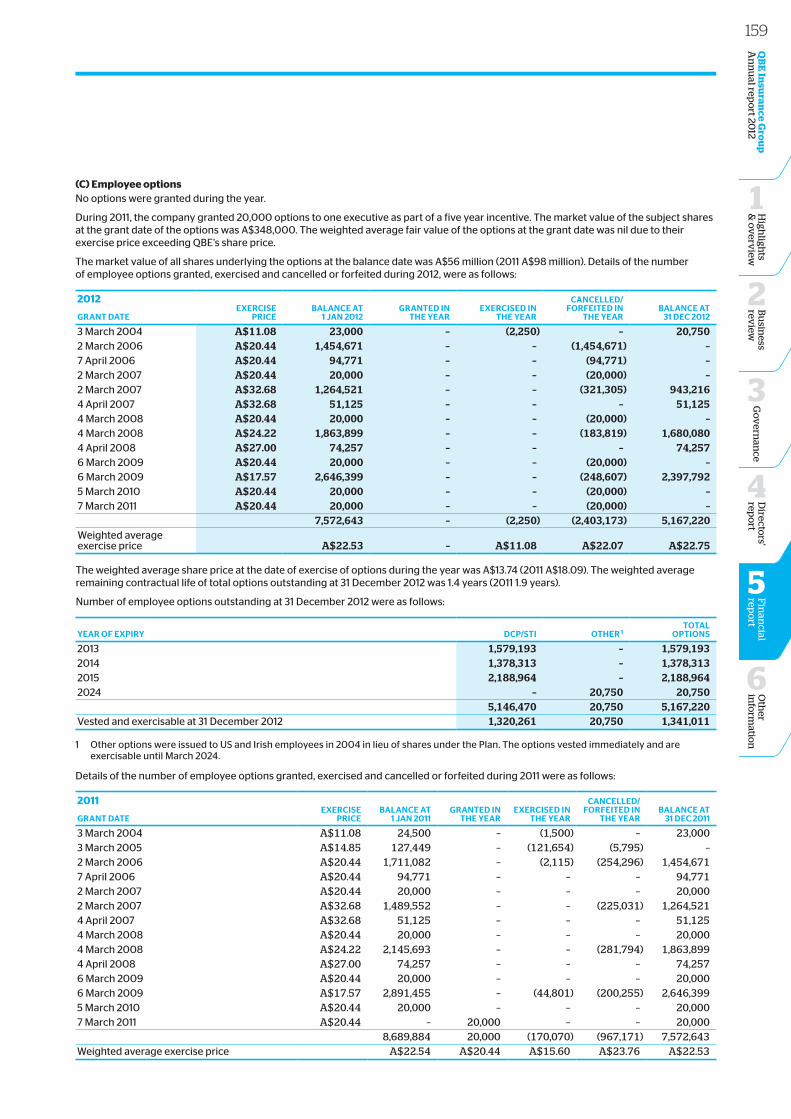
(C) Employee optionsNo options were granted during the year.
During 2011, the company granted 20,000 options to one executive as part of a five year incentive. The market value of the subject shares at the grant date of the options was A$348,000. The weighted average fair value of the options at the grant date was nil due to their exercise price exceeding QBE’s share price.
The market value of all shares underlying the options at the balance date was A$56 million (2011 A$98 million). Details of the number of employee options granted, exercised and cancelled or forfeited during 2012, were as follows:
2012
GrANt DAteexercise
PricebALANce At
1 jAN 2012GrANteD iN
tHe yeArexerciseD iN
tHe yeAr
cANceLLeD/ForFeiteD iN
tHe yeArbALANce At
31 Dec 2012
3 March 2004 A$11.08 23,000 – (2,250) – 20,7502 March 2006 A$20.44 1,454,671 – – (1,454,671) –7 April 2006 A$20.44 94,771 – – (94,771) –2 March 2007 A$20.44 20,000 – – (20,000) –2 March 2007 A$32.68 1,264,521 – – (321,305) 943,2164 April 2007 A$32.68 51,125 – – – 51,1254 March 2008 A$20.44 20,000 – – (20,000) –4 March 2008 A$24.22 1,863,899 – – (183,819) 1,680,0804 April 2008 A$27.00 74,257 – – – 74,2576 March 2009 A$20.44 20,000 – – (20,000) –6 March 2009 A$17.57 2,646,399 – – (248,607) 2,397,7925 March 2010 A$20.44 20,000 – – (20,000) –7 March 2011 A$20.44 20,000 – – (20,000) – 7,572,643 – (2,250) (2,403,173) 5,167,220Weighted average exercise price A$22.53 – A$11.08 A$22.07 A$22.75
The weighted average share price at the date of exercise of options during the year was A$13.74 (2011 A$18.09). The weighted average remaining contractual life of total options outstanding at 31 December 2012 was 1.4 years (2011 1.9 years).
Number of employee options outstanding at 31 December 2012 were as follows:
yeAr oF exPiry DcP/sti otHer 1totAL
oPtioNs
2013 1,579,193 – 1,579,1932014 1,378,313 – 1,378,3132015 2,188,964 – 2,188,9642024 – 20,750 20,750 5,146,470 20,750 5,167,220Vested and exercisable at 31 December 2012 1,320,261 20,750 1,341,011
1 Other options were issued to US and Irish employees in 2004 in lieu of shares under the Plan. The options vested immediately and are exercisable until March 2024.
Details of the number of employee options granted, exercised and cancelled or forfeited during 2011 were as follows:
2011 GrANt DAte
exercise Price
bALANce At1 jAN 2011
GrANteD iNtHe yeAr
exerciseD iNtHe yeAr
cANceLLeD/ForFeiteD iN
tHe yeArbALANce At
31 Dec 2011
3 March 2004 A$11.08 24,500 – (1,500) – 23,0003 March 2005 A$14.85 127,449 – (121,654) (5,795) –2 March 2006 A$20.44 1,711,082 – (2,115) (254,296) 1,454,6717 April 2006 A$20.44 94,771 – – – 94,7712 March 2007 A$20.44 20,000 – – – 20,0002 March 2007 A$32.68 1,489,552 – – (225,031) 1,264,5214 April 2007 A$32.68 51,125 – – – 51,1254 March 2008 A$20.44 20,000 – – – 20,0004 March 2008 A$24.22 2,145,693 – – (281,794) 1,863,8994 April 2008 A$27.00 74,257 – – – 74,2576 March 2009 A$20.44 20,000 – – – 20,0006 March 2009 A$17.57 2,891,455 – (44,801) (200,255) 2,646,3995 March 2010 A$20.44 20,000 – – – 20,0007 March 2011 A$20.44 – 20,000 – – 20,000 8,689,884 20,000 (170,070) (967,171) 7,572,643Weighted average exercise price A$22.54 A$20.44 A$15.60 A$23.76 A$22.53
159O
ther
info
rmatio
n
6
Directo
rs' rep
ort
4
Fin
ancial
repo
rt
5
QB
E In
suran
ce Gro
up
A
nn
ual rep
ort 20
12B
usin
ess rev
iew
2
Go
vern
ance
3
High
lights
& o
verv
iew
1
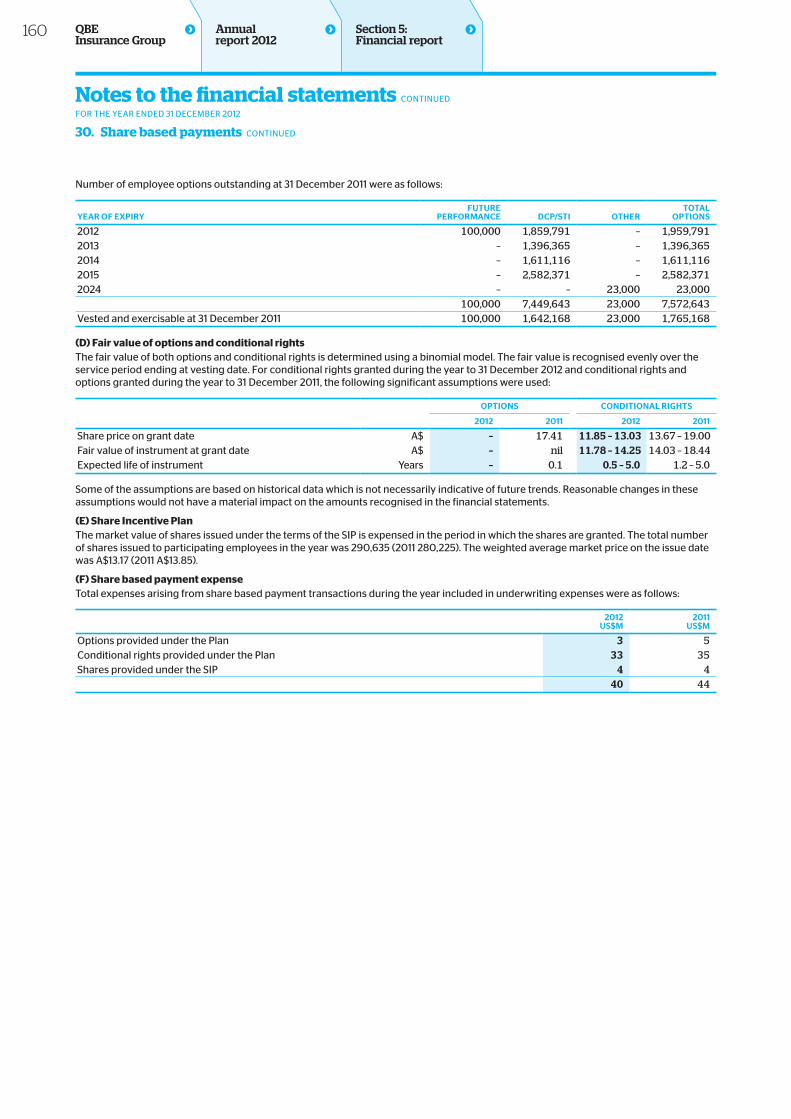
Number of employee options outstanding at 31 December 2011 were as follows:
yeAr oF exPiryFUtUre
PerFormANce DcP/sti otHertotAL
oPtioNs
2012 100,000 1,859,791 – 1,959,7912013 – 1,396,365 – 1,396,3652014 – 1,611,116 – 1,611,1162015 – 2,582,371 – 2,582,3712024 – – 23,000 23,000
100,000 7,449,643 23,000 7,572,643Vested and exercisable at 31 December 2011 100,000 1,642,168 23,000 1,765,168
(D) Fair value of options and conditional rightsThe fair value of both options and conditional rights is determined using a binomial model. The fair value is recognised evenly over the service period ending at vesting date. For conditional rights granted during the year to 31 December 2012 and conditional rights and options granted during the year to 31 December 2011, the following significant assumptions were used:
oPtioNs coNDitioNAL riGHts
2012 2011 2012 2011
Share price on grant date A$ – 17.41 11.85 – 13.03 13.67 – 19.00Fair value of instrument at grant date A$ – nil 11.78 – 14.25 14.03 – 18.44Expected life of instrument Years – 0.1 0.5 – 5.0 1.2 – 5.0
Some of the assumptions are based on historical data which is not necessarily indicative of future trends. Reasonable changes in these assumptions would not have a material impact on the amounts recognised in the financial statements.
(E) Share Incentive PlanThe market value of shares issued under the terms of the SIP is expensed in the period in which the shares are granted. The total number of shares issued to participating employees in the year was 290,635 (2011 280,225). The weighted average market price on the issue date was A$13.17 (2011 A$13.85).
(F) Share based payment expenseTotal expenses arising from share based payment transactions during the year included in underwriting expenses were as follows:
2012Us$m
2011Us$m
Options provided under the Plan 3 5Conditional rights provided under the Plan 33 35Shares provided under the SIP 4 4 40 44
Section 5: Financial report
Notes to the financial statements CONTINUED
FOR THE YEAR ENDED 31 DECEMBER 2012
30. Share based payments CONTINUED
160 QBE Insurance Group
Annual report 2012
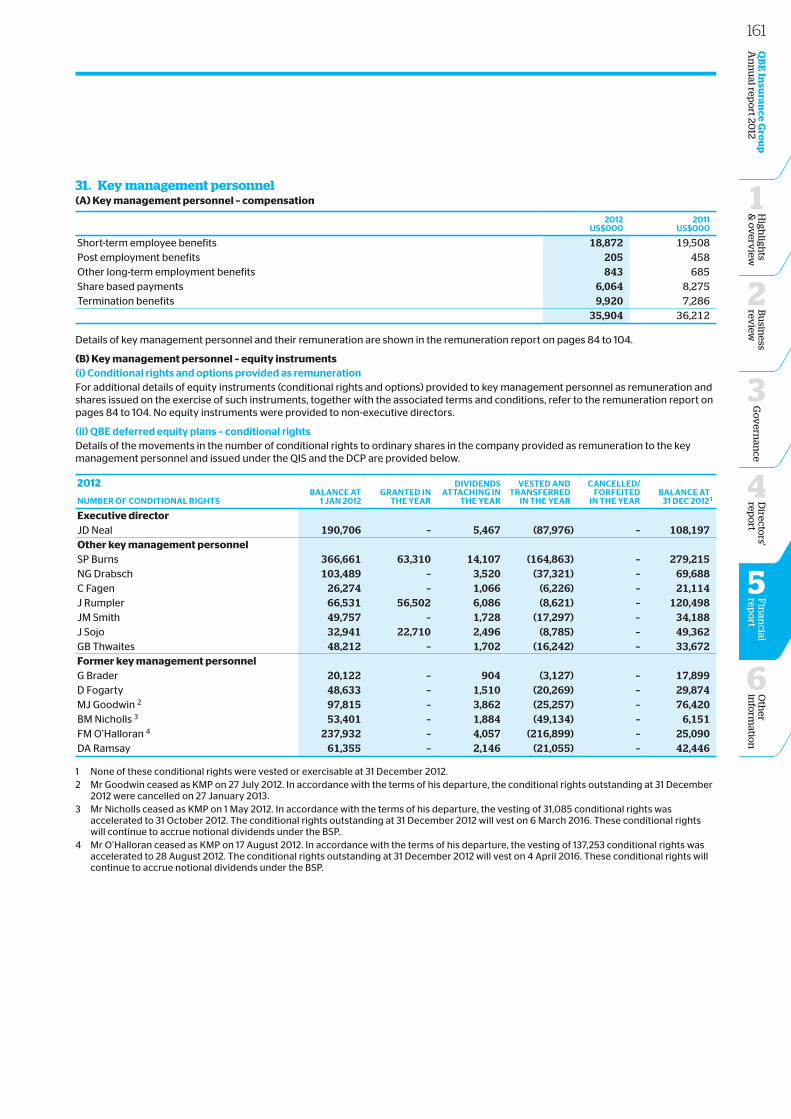
31. Key management personnel(A) Key management personnel – compensation
2012Us$000
2011Us$000
Short-term employee benefits 18,872 19,508Post employment benefits 205 458Other long-term employment benefits 843 685Share based payments 6,064 8,275Termination benefits 9,920 7,286 35,904 36,212
Details of key management personnel and their remuneration are shown in the remuneration report on pages 84 to 104.
(B) Key management personnel – equity instruments(i) conditional rights and options provided as remunerationFor additional details of equity instruments (conditional rights and options) provided to key management personnel as remuneration and shares issued on the exercise of such instruments, together with the associated terms and conditions, refer to the remuneration report on pages 84 to 104. No equity instruments were provided to non-executive directors.
(ii) qbe deferred equity plans – conditional rightsDetails of the movements in the number of conditional rights to ordinary shares in the company provided as remuneration to the key management personnel and issued under the QIS and the DCP are provided below.
2012
NUmber oF coNDitioNAL riGHtsbALANce At
1 jAN 2012GrANteD iN
tHe yeAr
DiviDeNDsAttAcHiNG iN
tHe yeAr
vesteD ANDtrANsFerreD
iN tHe yeAr
cANceLLeD/ForFeiteD
iN tHe yeArbALANce At
31 Dec 2012 1
Executive director JD Neal 190,706 – 5,467 (87,976) – 108,197Other key management personnelSP Burns 366,661 63,310 14,107 (164,863) – 279,215NG Drabsch 103,489 – 3,520 (37,321) – 69,688C Fagen 26,274 – 1,066 (6,226) – 21,114J Rumpler 66,531 56,502 6,086 (8,621) – 120,498JM Smith 49,757 – 1,728 (17,297) – 34,188J Sojo 32,941 22,710 2,496 (8,785) – 49,362GB Thwaites 48,212 – 1,702 (16,242) – 33,672Former key management personnelG Brader 20,122 – 904 (3,127) – 17,899D Fogarty 48,633 – 1,510 (20,269) – 29,874MJ Goodwin 2 97,815 – 3,862 (25,257) – 76,420BM Nicholls 3 53,401 – 1,884 (49,134) – 6,151 FM O’Halloran 4 237,932 – 4,057 (216,899) – 25,090DA Ramsay 61,355 – 2,146 (21,055) – 42,446
1 None of these conditional rights were vested or exercisable at 31 December 2012.2 Mr Goodwin ceased as KMP on 27 July 2012. In accordance with the terms of his departure, the conditional rights outstanding at 31 December
2012 were cancelled on 27 January 2013.3 Mr Nicholls ceased as KMP on 1 May 2012. In accordance with the terms of his departure, the vesting of 31,085 conditional rights was
accelerated to 31 October 2012. The conditional rights outstanding at 31 December 2012 will vest on 6 March 2016. These conditional rights will continue to accrue notional dividends under the BSP.
4 Mr O’Halloran ceased as KMP on 17 August 2012. In accordance with the terms of his departure, the vesting of 137,253 conditional rights was accelerated to 28 August 2012. The conditional rights outstanding at 31 December 2012 will vest on 4 April 2016. These conditional rights will continue to accrue notional dividends under the BSP.
161O
ther
info
rmatio
n
6
Directo
rs' rep
ort
4
Fin
ancial
repo
rt
5
QB
E In
suran
ce Gro
up
A
nn
ual rep
ort 20
12B
usin
ess rev
iew
2
Go
vern
ance
3
High
lights
& o
verv
iew
1
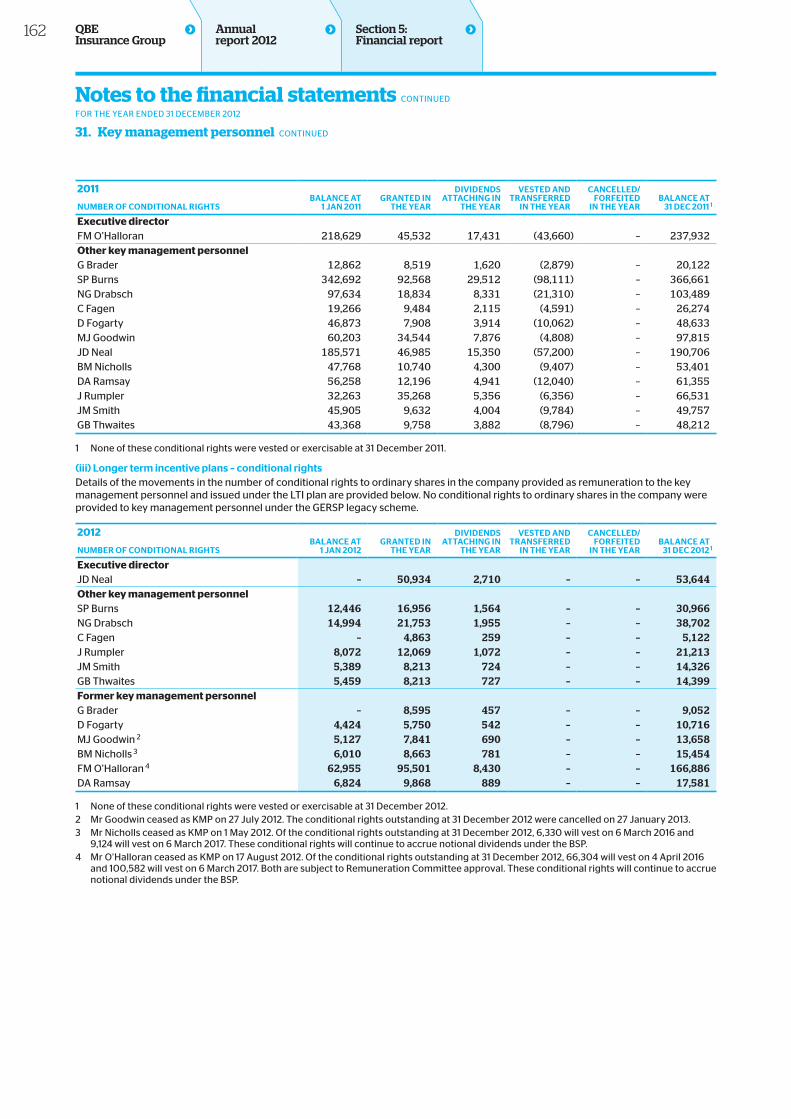
2011
NUmber oF coNDitioNAL riGHtsbALANce At
1 jAN 2011GrANteD iN
tHe yeAr
DiviDeNDsAttAcHiNG iN
tHe yeAr
vesteD ANDtrANsFerreD
iN tHe yeAr
cANceLLeD/ForFeiteD
iN tHe yeArbALANce At
31 Dec 2011 1
Executive director FM O’Halloran 218,629 45,532 17,431 (43,660) – 237,932Other key management personnel G Brader 12,862 8,519 1,620 (2,879) – 20,122SP Burns 342,692 92,568 29,512 (98,111) – 366,661NG Drabsch 97,634 18,834 8,331 (21,310) – 103,489C Fagen 19,266 9,484 2,115 (4,591) – 26,274D Fogarty 46,873 7,908 3,914 (10,062) – 48,633MJ Goodwin 60,203 34,544 7,876 (4,808) – 97,815JD Neal 185,571 46,985 15,350 (57,200) – 190,706BM Nicholls 47,768 10,740 4,300 (9,407) – 53,401DA Ramsay 56,258 12,196 4,941 (12,040) – 61,355J Rumpler 32,263 35,268 5,356 (6,356) – 66,531JM Smith 45,905 9,632 4,004 (9,784) – 49,757GB Thwaites 43,368 9,758 3,882 (8,796) – 48,212
1 None of these conditional rights were vested or exercisable at 31 December 2011.
(iii) Longer term incentive plans – conditional rightsDetails of the movements in the number of conditional rights to ordinary shares in the company provided as remuneration to the key management personnel and issued under the LTI plan are provided below. No conditional rights to ordinary shares in the company were provided to key management personnel under the GERSP legacy scheme.
2012
NUmber oF coNDitioNAL riGHtsbALANce At
1 jAN 2012GrANteD iN
tHe yeAr
DiviDeNDsAttAcHiNG iN
tHe yeAr
vesteD ANDtrANsFerreD
iN tHe yeAr
cANceLLeD/ForFeiteD
iN tHe yeArbALANce At
31 Dec 2012 1
Executive director JD Neal – 50,934 2,710 – – 53,644Other key management personnelSP Burns 12,446 16,956 1,564 – – 30,966NG Drabsch 14,994 21,753 1,955 – – 38,702C Fagen – 4,863 259 – – 5,122J Rumpler 8,072 12,069 1,072 – – 21,213JM Smith 5,389 8,213 724 – – 14,326GB Thwaites 5,459 8,213 727 – – 14,399Former key management personnelG Brader – 8,595 457 – – 9,052D Fogarty 4,424 5,750 542 – – 10,716MJ Goodwin 2 5,127 7,841 690 – – 13,658BM Nicholls 3 6,010 8,663 781 – – 15,454FM O’Halloran 4 62,955 95,501 8,430 – – 166,886DA Ramsay 6,824 9,868 889 – – 17,581
1 None of these conditional rights were vested or exercisable at 31 December 2012.2 Mr Goodwin ceased as KMP on 27 July 2012. The conditional rights outstanding at 31 December 2012 were cancelled on 27 January 2013.3 Mr Nicholls ceased as KMP on 1 May 2012. Of the conditional rights outstanding at 31 December 2012, 6,330 will vest on 6 March 2016 and
9,124 will vest on 6 March 2017. These conditional rights will continue to accrue notional dividends under the BSP.4 Mr O’Halloran ceased as KMP on 17 August 2012. Of the conditional rights outstanding at 31 December 2012, 66,304 will vest on 4 April 2016
and 100,582 will vest on 6 March 2017. Both are subject to Remuneration Committee approval. These conditional rights will continue to accrue notional dividends under the BSP.
Section 5: Financial report
Notes to the financial statements CONTINUED
FOR THE YEAR ENDED 31 DECEMBER 2012
31. Key management personnel CONTINUED
162 QBE Insurance Group
Annual report 2012
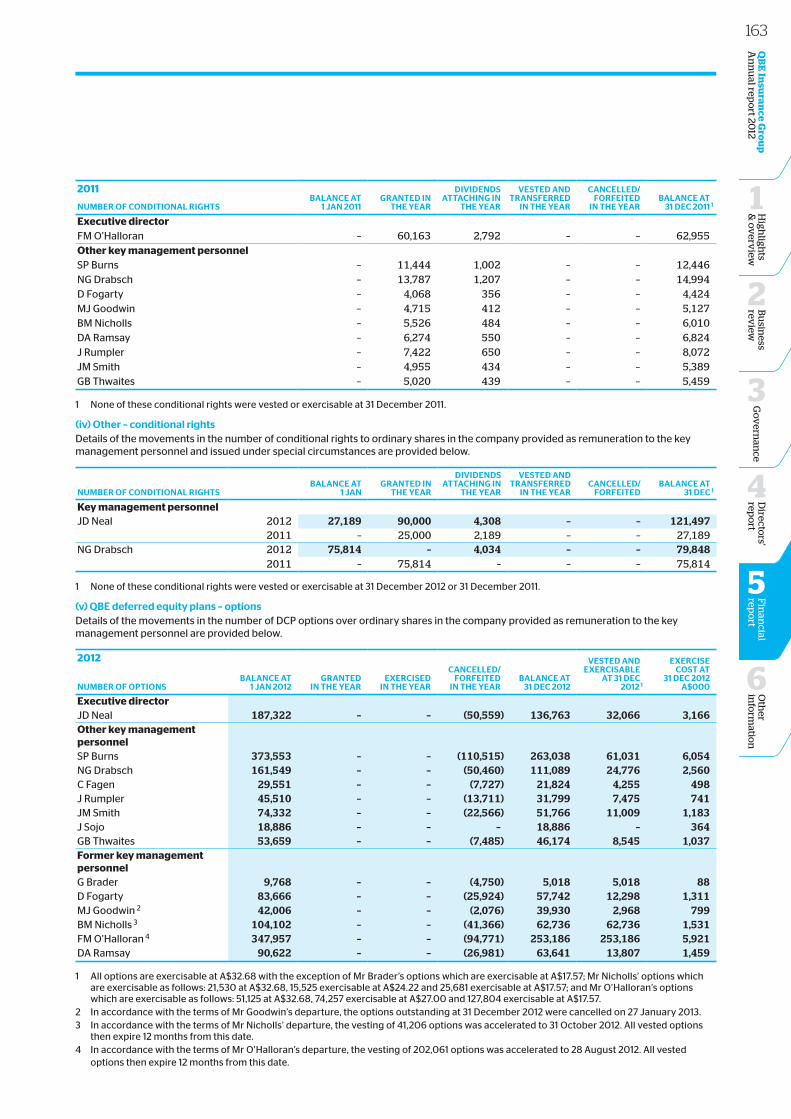
2011
NUmber oF coNDitioNAL riGHtsbALANce At
1 jAN 2011GrANteD iN
tHe yeAr
DiviDeNDsAttAcHiNG iN
tHe yeAr
vesteD ANDtrANsFerreD
iN tHe yeAr
cANceLLeD/ForFeiteD
iN tHe yeArbALANce At
31 Dec 2011 1
Executive director FM O’Halloran – 60,163 2,792 – – 62,955Other key management personnel SP Burns – 11,444 1,002 – – 12,446NG Drabsch – 13,787 1,207 – – 14,994D Fogarty – 4,068 356 – – 4,424MJ Goodwin – 4,715 412 – – 5,127BM Nicholls – 5,526 484 – – 6,010DA Ramsay – 6,274 550 – – 6,824J Rumpler – 7,422 650 – – 8,072JM Smith – 4,955 434 – – 5,389GB Thwaites – 5,020 439 – – 5,459
1 None of these conditional rights were vested or exercisable at 31 December 2011.
(iv) other – conditional rightsDetails of the movements in the number of conditional rights to ordinary shares in the company provided as remuneration to the key management personnel and issued under special circumstances are provided below.
NUmber oF coNDitioNAL riGHtsbALANce At
1 jANGrANteD iN
tHe yeAr
DiviDeNDsAttAcHiNG iN
tHe yeAr
vesteD ANDtrANsFerreD
iN tHe yeArcANceLLeD/
ForFeiteDbALANce At
31 Dec 1
Key management personnelJD Neal 2012 27,189 90,000 4,308 – – 121,497 2011 – 25,000 2,189 – – 27,189NG Drabsch 2012 75,814 – 4,034 – – 79,848 2011 – 75,814 – – – 75,814
1 None of these conditional rights were vested or exercisable at 31 December 2012 or 31 December 2011.
(v) qbe deferred equity plans – optionsDetails of the movements in the number of DCP options over ordinary shares in the company provided as remuneration to the key management personnel are provided below.
2012
bALANce At1 jAN 2012
GrANteDiN tHe yeAr
exerciseD iN tHe yeAr
cANceLLeD/ForFeiteD
iN tHe yeArbALANce At
31 Dec 2012
vesteD ANDexercisAbLe
At 31 Dec2012 1
exercisecost At
31 Dec 2012A$000NUmber oF oPtioNs
Executive director JD Neal 187,322 – – (50,559) 136,763 32,066 3,166Other key management personnelSP Burns 373,553 – – (110,515) 263,038 61,031 6,054NG Drabsch 161,549 – – (50,460) 111,089 24,776 2,560C Fagen 29,551 – – (7,727) 21,824 4,255 498J Rumpler 45,510 – – (13,711) 31,799 7,475 741JM Smith 74,332 – – (22,566) 51,766 11,009 1,183J Sojo 18,886 – – – 18,886 – 364GB Thwaites 53,659 – – (7,485) 46,174 8,545 1,037Former key management personnelG Brader 9,768 – – (4,750) 5,018 5,018 88D Fogarty 83,666 – – (25,924) 57,742 12,298 1,311MJ Goodwin 2 42,006 – – (2,076) 39,930 2,968 799BM Nicholls 3 104,102 – – (41,366) 62,736 62,736 1,531FM O’Halloran 4 347,957 – – (94,771) 253,186 253,186 5,921DA Ramsay 90,622 – – (26,981) 63,641 13,807 1,459
1 All options are exercisable at A$32.68 with the exception of Mr Brader’s options which are exercisable at A$17.57; Mr Nicholls’ options which are exercisable as follows: 21,530 at A$32.68, 15,525 exercisable at A$24.22 and 25,681 exercisable at A$17.57; and Mr O’Halloran’s options which are exercisable as follows: 51,125 at A$32.68, 74,257 exercisable at A$27.00 and 127,804 exercisable at A$17.57.
2 In accordance with the terms of Mr Goodwin’s departure, the options outstanding at 31 December 2012 were cancelled on 27 January 2013. 3 In accordance with the terms of Mr Nicholls’ departure, the vesting of 41,206 options was accelerated to 31 October 2012. All vested options
then expire 12 months from this date.4 In accordance with the terms of Mr O’Halloran’s departure, the vesting of 202,061 options was accelerated to 28 August 2012. All vested
options then expire 12 months from this date.
163O
ther
info
rmatio
n
6
Directo
rs' rep
ort
4
Fin
ancial
repo
rt
5
QB
E In
suran
ce Gro
up
A
nn
ual rep
ort 20
12B
usin
ess rev
iew
2
Go
vern
ance
3
High
lights
& o
verv
iew
1
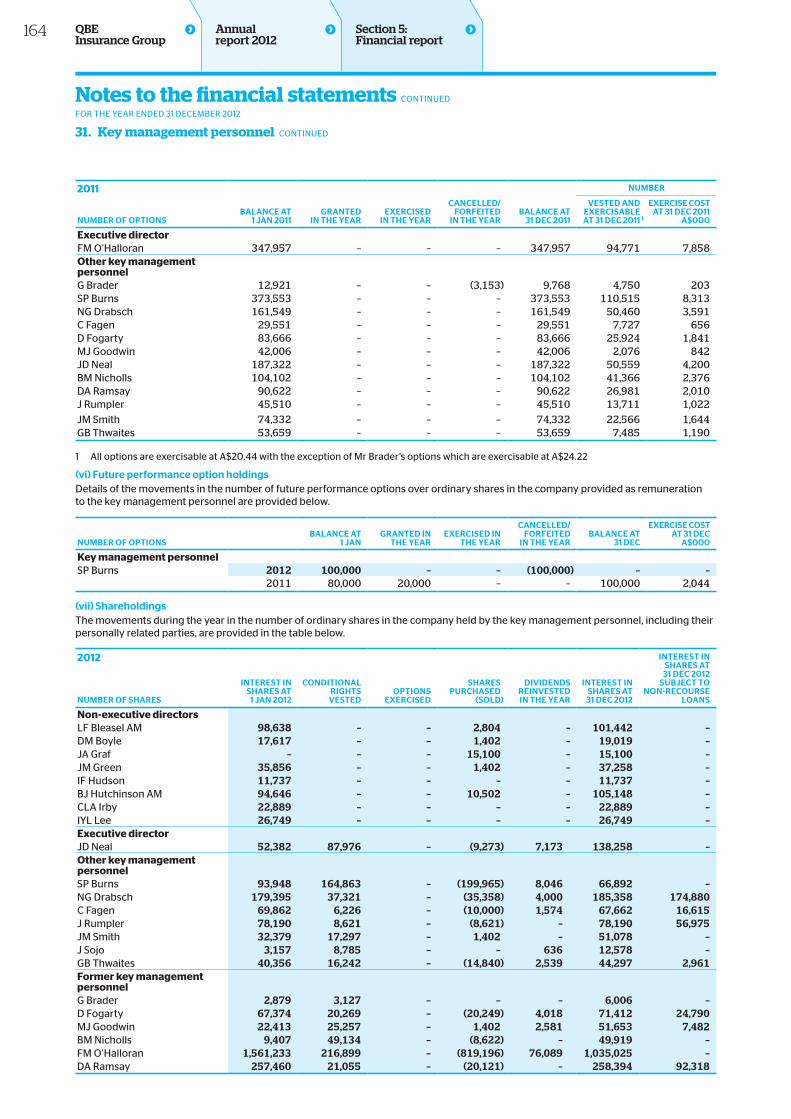
2011
bALANce At1 jAN 2011
GrANteD
iN tHe yeAr
exerciseD
iN tHe yeAr
cANceLLeD/ForFeiteD
iN tHe yeAr
bALANce At
31 Dec 2011
NUmber
vesteD ANDexercisAbLe
At 31 Dec 2011 1
exercise costAt 31 Dec 2011
A$000NUmber oF oPtioNs
Executive director FM O’Halloran 347,957 – – – 347,957 94,771 7,858Other key management personnel G Brader 12,921 – – (3,153) 9,768 4,750 203SP Burns 373,553 – – – 373,553 110,515 8,313NG Drabsch 161,549 – – – 161,549 50,460 3,591C Fagen 29,551 – – – 29,551 7,727 656D Fogarty 83,666 – – – 83,666 25,924 1,841MJ Goodwin 42,006 – – – 42,006 2,076 842JD Neal 187,322 – – – 187,322 50,559 4,200BM Nicholls 104,102 – – – 104,102 41,366 2,376DA Ramsay 90,622 – – – 90,622 26,981 2,010J Rumpler 45,510 – – – 45,510 13,711 1,022
JM Smith 74,332 – – – 74,332 22,566 1,644GB Thwaites 53,659 – – – 53,659 7,485 1,190
1 All options are exercisable at A$20.44 with the exception of Mr Brader’s options which are exercisable at A$24.22
(vi) Future performance option holdings Details of the movements in the number of future performance options over ordinary shares in the company provided as remuneration to the key management personnel are provided below.
NUmber oF oPtioNsbALANce At
1 jANGrANteD iN
tHe yeArexerciseD iN
tHe yeAr
cANceLLeD/ForFeiteD
iN tHe yeArbALANce At
31 Dec
exercise costAt 31 Dec
A$000
Key management personnelSP Burns 2012 100,000 – – (100,000) – – 2011 80,000 20,000 – – 100,000 2,044
(vii) shareholdingsThe movements during the year in the number of ordinary shares in the company held by the key management personnel, including their personally related parties, are provided in the table below.
2012
iNterest iNsHAres At
1 jAN 2012
coNDitioNALriGHtsvesteD
oPtioNsexerciseD
sHAresPUrcHAseD
(soLD)
DiviDeNDsreiNvesteDiN tHe yeAr
iNterest iNsHAres At31 Dec 2012
iNterest iNsHAres At31 Dec 2012
sUbject toNoN-recoUrse
LoANsNUmber oF sHAres
Non‑executive directors LF Bleasel AM 98,638 – – 2,804 – 101,442 –DM Boyle 17,617 – – 1,402 – 19,019 –JA Graf – – – 15,100 – 15,100 –JM Green 35,856 – – 1,402 – 37,258 –IF Hudson 11,737 – – – – 11,737 –BJ Hutchinson AM 94,646 – – 10,502 – 105,148 –CLA Irby 22,889 – – – – 22,889 –IYL Lee 26,749 – – – – 26,749 –Executive directorJD Neal 52,382 87,976 – (9,273) 7,173 138,258 –Other key management personnelSP Burns 93,948 164,863 – (199,965) 8,046 66,892 –NG Drabsch 179,395 37,321 – (35,358) 4,000 185,358 174,880C Fagen 69,862 6,226 – (10,000) 1,574 67,662 16,615J Rumpler 78,190 8,621 – (8,621) – 78,190 56,975JM Smith 32,379 17,297 – 1,402 – 51,078 –J Sojo 3,157 8,785 – – 636 12,578 –GB Thwaites 40,356 16,242 – (14,840) 2,539 44,297 2,961Former key management personnelG Brader 2,879 3,127 – – – 6,006 –D Fogarty 67,374 20,269 – (20,249) 4,018 71,412 24,790MJ Goodwin 22,413 25,257 – 1,402 2,581 51,653 7,482BM Nicholls 9,407 49,134 – (8,622) – 49,919 –FM O’Halloran 1,561,233 216,899 – (819,196) 76,089 1,035,025 –DA Ramsay 257,460 21,055 – (20,121) – 258,394 92,318
Section 5: Financial report
Notes to the financial statements CONTINUED
FOR THE YEAR ENDED 31 DECEMBER 2012
31. Key management personnel CONTINUED
164 QBE Insurance Group
Annual report 2012
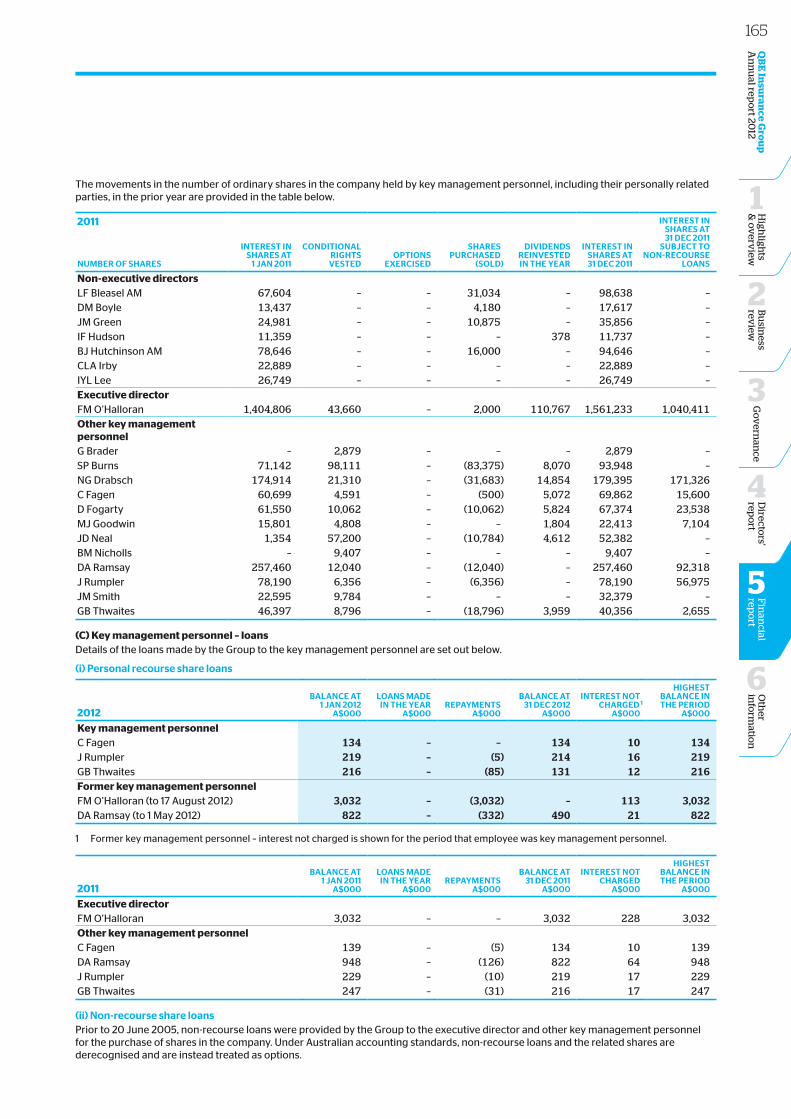
The movements in the number of ordinary shares in the company held by key management personnel, including their personally related parties, in the prior year are provided in the table below.
2011
iNterest iNsHAres At
1 jAN 2011
coNDitioNALriGHtsvesteD
oPtioNsexerciseD
sHAresPUrcHAseD
(soLD)
DiviDeNDsreiNvesteDiN tHe yeAr
iNterest iNsHAres At31 Dec 2011
iNterest iNsHAres At31 Dec 2011
sUbject toNoN-recoUrse
LoANsNUmber oF sHAres
Non‑executive directorsLF Bleasel AM 67,604 – – 31,034 – 98,638 –DM Boyle 13,437 – – 4,180 – 17,617 –JM Green 24,981 – – 10,875 – 35,856 –IF Hudson 11,359 – – – 378 11,737 –BJ Hutchinson AM 78,646 – – 16,000 – 94,646 –CLA Irby 22,889 – – – – 22,889 –IYL Lee 26,749 – – – – 26,749 –Executive directorFM O’Halloran 1,404,806 43,660 – 2,000 110,767 1,561,233 1,040,411Other key management personnelG Brader – 2,879 – – – 2,879 –SP Burns 71,142 98,111 – (83,375) 8,070 93,948 –NG Drabsch 174,914 21,310 – (31,683) 14,854 179,395 171,326C Fagen 60,699 4,591 – (500) 5,072 69,862 15,600D Fogarty 61,550 10,062 – (10,062) 5,824 67,374 23,538MJ Goodwin 15,801 4,808 – – 1,804 22,413 7,104JD Neal 1,354 57,200 – (10,784) 4,612 52,382 –BM Nicholls – 9,407 – – – 9,407 –DA Ramsay 257,460 12,040 – (12,040) – 257,460 92,318J Rumpler 78,190 6,356 – (6,356) – 78,190 56,975JM Smith 22,595 9,784 – – – 32,379 –GB Thwaites 46,397 8,796 – (18,796) 3,959 40,356 2,655
(C) Key management personnel – loansDetails of the loans made by the Group to the key management personnel are set out below.
(i) Personal recourse share loans
2012
bALANce At1 jAN 2012
A$000
LoANs mADeiN tHe yeAr
A$000rePAymeNts
A$000
bALANce At 31 Dec 2012
A$000
iNterest NotcHArGeD 1
A$000
HiGHestbALANce iNtHe PerioD
A$000
Key management personnelC Fagen 134 – – 134 10 134J Rumpler 219 – (5) 214 16 219GB Thwaites 216 – (85) 131 12 216Former key management personnelFM O’Halloran (to 17 August 2012) 3,032 – (3,032) – 113 3,032DA Ramsay (to 1 May 2012) 822 – (332) 490 21 822
1 Former key management personnel – interest not charged is shown for the period that employee was key management personnel.
2011
bALANce At1 jAN 2011
A$000
LoANs mADeiN tHe yeAr
A$000rePAymeNts
A$000
bALANce At 31 Dec 2011
A$000
iNterest NotcHArGeD
A$000
HiGHestbALANce iNtHe PerioD
A$000
Executive director FM O’Halloran 3,032 – – 3,032 228 3,032Other key management personnel C Fagen 139 – (5) 134 10 139DA Ramsay 948 – (126) 822 64 948J Rumpler 229 – (10) 219 17 229GB Thwaites 247 – (31) 216 17 247
(ii) Non-recourse share loansPrior to 20 June 2005, non-recourse loans were provided by the Group to the executive director and other key management personnel for the purchase of shares in the company. Under Australian accounting standards, non-recourse loans and the related shares are derecognised and are instead treated as options.
165O
ther
info
rmatio
n
6
Directo
rs' rep
ort
4
Fin
ancial
repo
rt
5
QB
E In
suran
ce Gro
up
A
nn
ual rep
ort 20
12B
usin
ess rev
iew
2
Go
vern
ance
3
High
lights
& o
verv
iew
1
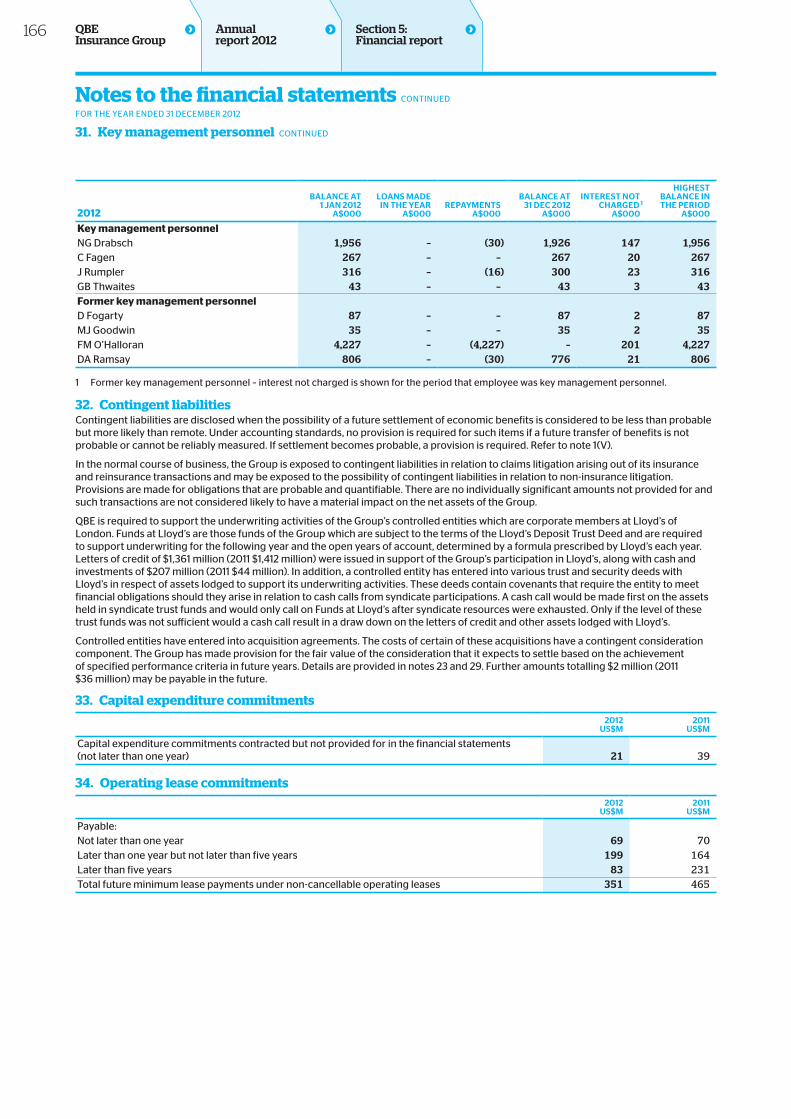
2012
bALANce At1 jAN 2012
A$000
LoANs mADeiN tHe yeAr
A$000rePAymeNts
A$000
bALANce At31 Dec 2012
A$000
iNterest NotcHArGeD 1
A$000
HiGHestbALANce iNtHe PerioD
A$000
Key management personnelNG Drabsch 1,956 – (30) 1,926 147 1,956C Fagen 267 – – 267 20 267J Rumpler 316 – (16) 300 23 316GB Thwaites 43 – – 43 3 43Former key management personnelD Fogarty 87 – – 87 2 87MJ Goodwin 35 – – 35 2 35FM O’Halloran 4,227 – (4,227) – 201 4,227DA Ramsay 806 – (30) 776 21 806
1 Former key management personnel – interest not charged is shown for the period that employee was key management personnel.
32. Contingent liabilitiesContingent liabilities are disclosed when the possibility of a future settlement of economic benefits is considered to be less than probable but more likely than remote. Under accounting standards, no provision is required for such items if a future transfer of benefits is not probable or cannot be reliably measured. If settlement becomes probable, a provision is required. Refer to note 1(V).
In the normal course of business, the Group is exposed to contingent liabilities in relation to claims litigation arising out of its insurance and reinsurance transactions and may be exposed to the possibility of contingent liabilities in relation to non-insurance litigation. Provisions are made for obligations that are probable and quantifiable. There are no individually significant amounts not provided for and such transactions are not considered likely to have a material impact on the net assets of the Group.
QBE is required to support the underwriting activities of the Group’s controlled entities which are corporate members at Lloyd’s of London. Funds at Lloyd’s are those funds of the Group which are subject to the terms of the Lloyd’s Deposit Trust Deed and are required to support underwriting for the following year and the open years of account, determined by a formula prescribed by Lloyd’s each year. Letters of credit of $1,361 million (2011 $1,412 million) were issued in support of the Group’s participation in Lloyd’s, along with cash and investments of $207 million (2011 $44 million). In addition, a controlled entity has entered into various trust and security deeds with Lloyd’s in respect of assets lodged to support its underwriting activities. These deeds contain covenants that require the entity to meet financial obligations should they arise in relation to cash calls from syndicate participations. A cash call would be made first on the assets held in syndicate trust funds and would only call on Funds at Lloyd’s after syndicate resources were exhausted. Only if the level of these trust funds was not sufficient would a cash call result in a draw down on the letters of credit and other assets lodged with Lloyd’s.
Controlled entities have entered into acquisition agreements. The costs of certain of these acquisitions have a contingent consideration component. The Group has made provision for the fair value of the consideration that it expects to settle based on the achievement of specified performance criteria in future years. Details are provided in notes 23 and 29. Further amounts totalling $2 million (2011 $36 million) may be payable in the future.
33. Capital expenditure commitments2012
Us$m2011
Us$m
Capital expenditure commitments contracted but not provided for in the financial statements (not later than one year) 21 39
34. Operating lease commitments2012
Us$m2011
Us$m
Payable: Not later than one year 69 70Later than one year but not later than five years 199 164Later than five years 83 231Total future minimum lease payments under non-cancellable operating leases 351 465
Section 5: Financial report
Notes to the financial statements CONTINUED
FOR THE YEAR ENDED 31 DECEMBER 2012
31. Key management personnel CONTINUED
166 QBE Insurance Group
Annual report 2012
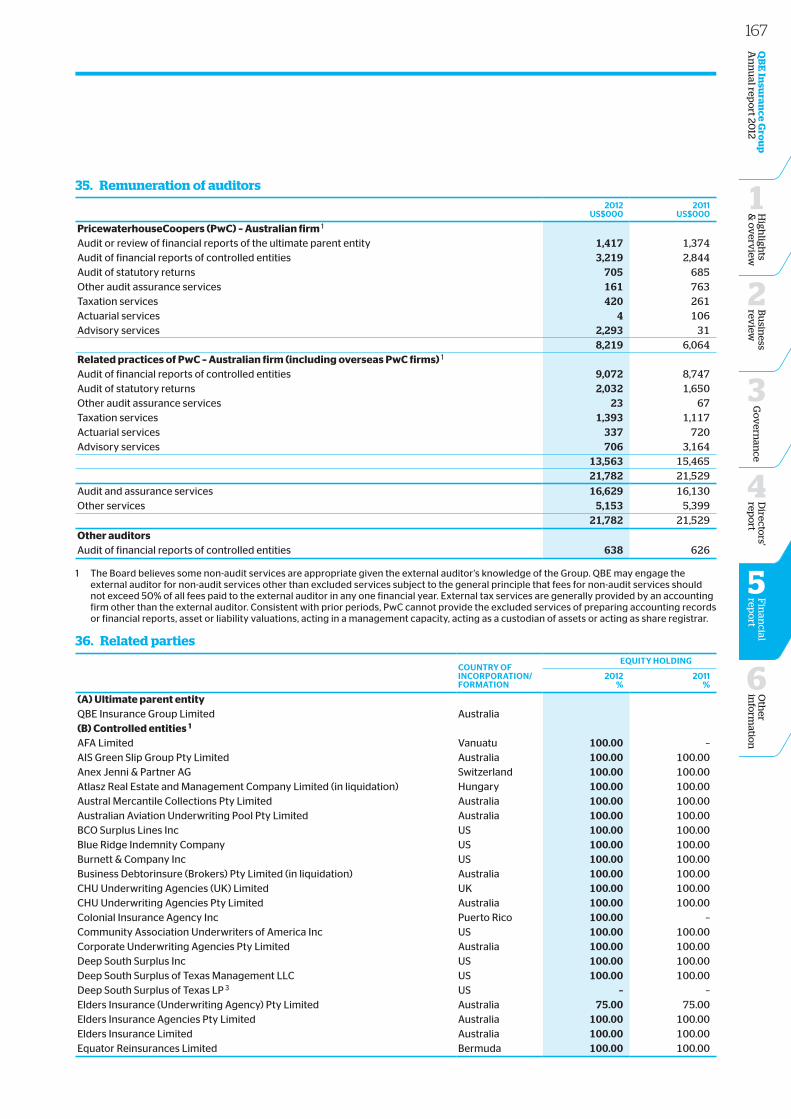
35. Remuneration of auditors2012
Us$0002011
Us$000
PricewaterhouseCoopers (PwC) – Australian firm 1 Audit or review of financial reports of the ultimate parent entity 1,417 1,374Audit of financial reports of controlled entities 3,219 2,844Audit of statutory returns 705 685Other audit assurance services 161 763Taxation services 420 261Actuarial services 4 106Advisory services 2,293 31
8,219 6,064Related practices of PwC – Australian firm (including overseas PwC firms) 1 Audit of financial reports of controlled entities 9,072 8,747Audit of statutory returns 2,032 1,650Other audit assurance services 23 67Taxation services 1,393 1,117Actuarial services 337 720Advisory services 706 3,164
13,563 15,46521,782 21,529
Audit and assurance services 16,629 16,130Other services 5,153 5,399
21,782 21,529
Other auditors Audit of financial reports of controlled entities 638 626
1 The Board believes some non-audit services are appropriate given the external auditor’s knowledge of the Group. QBE may engage the external auditor for non-audit services other than excluded services subject to the general principle that fees for non-audit services should not exceed 50% of all fees paid to the external auditor in any one financial year. External tax services are generally provided by an accounting firm other than the external auditor. Consistent with prior periods, PwC cannot provide the excluded services of preparing accounting records or financial reports, asset or liability valuations, acting in a management capacity, acting as a custodian of assets or acting as share registrar.
36. Related parties
coUNtry oFiNcorPorAtioN/FormAtioN
eqUity HoLDiNG
2012%
2011%
(A) Ultimate parent entity QBE Insurance Group Limited Australia (B) Controlled entities 1 AFA Limited Vanuatu 100.00 –AIS Green Slip Group Pty Limited Australia 100.00 100.00Anex Jenni & Partner AG Switzerland 100.00 100.00Atlasz Real Estate and Management Company Limited (in liquidation) Hungary 100.00 100.00Austral Mercantile Collections Pty Limited Australia 100.00 100.00Australian Aviation Underwriting Pool Pty Limited Australia 100.00 100.00BCO Surplus Lines Inc US 100.00 100.00Blue Ridge Indemnity Company US 100.00 100.00Burnett & Company Inc US 100.00 100.00Business Debtorinsure (Brokers) Pty Limited (in liquidation) Australia 100.00 100.00CHU Underwriting Agencies (UK) Limited UK 100.00 100.00CHU Underwriting Agencies Pty Limited Australia 100.00 100.00Colonial Insurance Agency Inc Puerto Rico 100.00 –Community Association Underwriters of America Inc US 100.00 100.00Corporate Underwriting Agencies Pty Limited Australia 100.00 100.00Deep South Surplus Inc US 100.00 100.00Deep South Surplus of Texas Management LLC US 100.00 100.00Deep South Surplus of Texas LP 3 US – –Elders Insurance (Underwriting Agency) Pty Limited Australia 75.00 75.00Elders Insurance Agencies Pty Limited Australia 100.00 100.00Elders Insurance Limited Australia 100.00 100.00Equator Reinsurances Limited Bermuda 100.00 100.00
167O
ther
info
rmatio
n
6
Directo
rs' rep
ort
4
Fin
ancial
repo
rt
5
QB
E In
suran
ce Gro
up
A
nn
ual rep
ort 20
12B
usin
ess rev
iew
2
Go
vern
ance
3
High
lights
& o
verv
iew
1
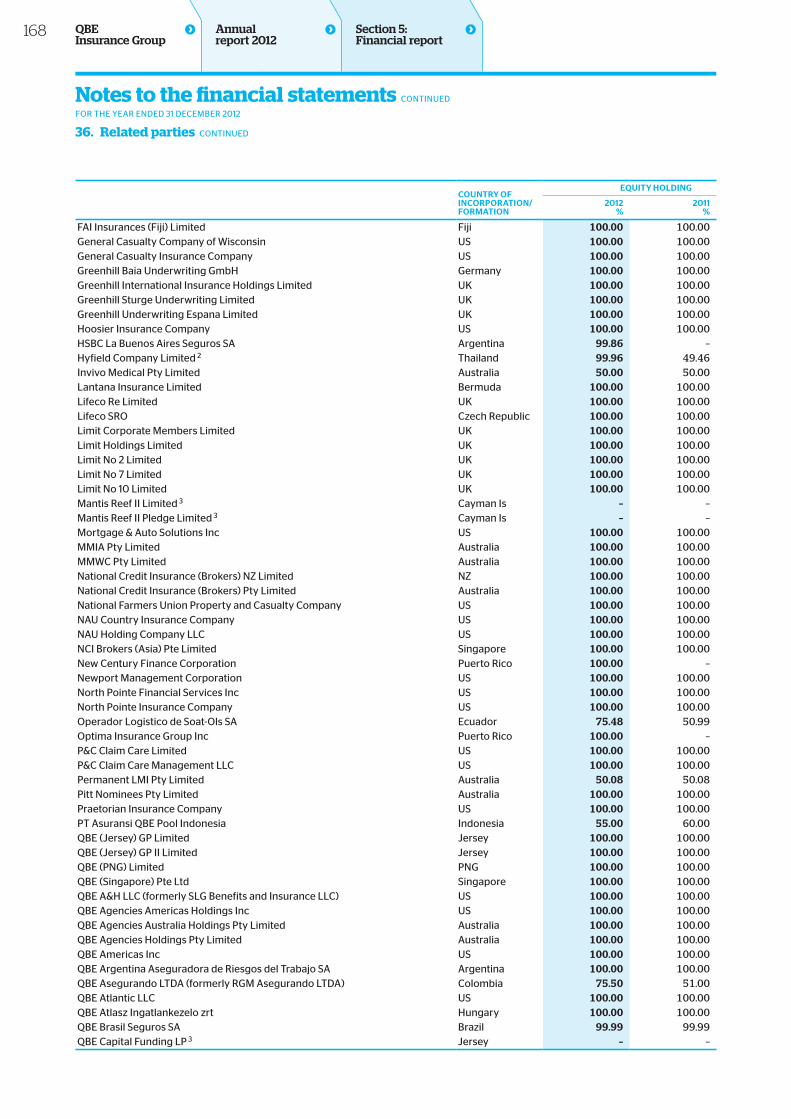
coUNtry oFiNcorPorAtioN/FormAtioN
eqUity HoLDiNG
2012%
2011%
FAI Insurances (Fiji) Limited Fiji 100.00 100.00General Casualty Company of Wisconsin US 100.00 100.00General Casualty Insurance Company US 100.00 100.00Greenhill Baia Underwriting GmbH Germany 100.00 100.00Greenhill International Insurance Holdings Limited UK 100.00 100.00Greenhill Sturge Underwriting Limited UK 100.00 100.00Greenhill Underwriting Espana Limited UK 100.00 100.00Hoosier Insurance Company US 100.00 100.00HSBC La Buenos Aires Seguros SA Argentina 99.86 –Hyfield Company Limited 2 Thailand 99.96 49.46Invivo Medical Pty Limited Australia 50.00 50.00Lantana Insurance Limited Bermuda 100.00 100.00Lifeco Re Limited UK 100.00 100.00Lifeco SRO Czech Republic 100.00 100.00Limit Corporate Members Limited UK 100.00 100.00Limit Holdings Limited UK 100.00 100.00Limit No 2 Limited UK 100.00 100.00Limit No 7 Limited UK 100.00 100.00Limit No 10 Limited UK 100.00 100.00Mantis Reef II Limited 3 Cayman Is – –Mantis Reef II Pledge Limited 3 Cayman Is – –Mortgage & Auto Solutions Inc US 100.00 100.00MMIA Pty Limited Australia 100.00 100.00MMWC Pty Limited Australia 100.00 100.00National Credit Insurance (Brokers) NZ Limited NZ 100.00 100.00National Credit Insurance (Brokers) Pty Limited Australia 100.00 100.00National Farmers Union Property and Casualty Company US 100.00 100.00NAU Country Insurance Company US 100.00 100.00NAU Holding Company LLC US 100.00 100.00NCI Brokers (Asia) Pte Limited Singapore 100.00 100.00New Century Finance Corporation Puerto Rico 100.00 –Newport Management Corporation US 100.00 100.00North Pointe Financial Services Inc US 100.00 100.00North Pointe Insurance Company US 100.00 100.00Operador Logistico de Soat-Ols SA Ecuador 75.48 50.99Optima Insurance Group Inc Puerto Rico 100.00 –P&C Claim Care Limited US 100.00 100.00P&C Claim Care Management LLC US 100.00 100.00Permanent LMI Pty Limited Australia 50.08 50.08Pitt Nominees Pty Limited Australia 100.00 100.00Praetorian Insurance Company US 100.00 100.00PT Asuransi QBE Pool Indonesia Indonesia 55.00 60.00QBE (Jersey) GP Limited Jersey 100.00 100.00QBE (Jersey) GP II Limited Jersey 100.00 100.00QBE (PNG) Limited PNG 100.00 100.00QBE (Singapore) Pte Ltd Singapore 100.00 100.00QBE A&H LLC (formerly SLG Benefits and Insurance LLC) US 100.00 100.00QBE Agencies Americas Holdings Inc US 100.00 100.00QBE Agencies Australia Holdings Pty Limited Australia 100.00 100.00QBE Agencies Holdings Pty Limited Australia 100.00 100.00QBE Americas Inc US 100.00 100.00QBE Argentina Aseguradora de Riesgos del Trabajo SA Argentina 100.00 100.00QBE Asegurando LTDA (formerly RGM Asegurando LTDA) Colombia 75.50 51.00QBE Atlantic LLC US 100.00 100.00QBE Atlasz Ingatlankezelo zrt Hungary 100.00 100.00QBE Brasil Seguros SA Brazil 99.99 99.99QBE Capital Funding LP 3 Jersey – –
Section 5: Financial report
Notes to the financial statements CONTINUED
FOR THE YEAR ENDED 31 DECEMBER 2012
36. Related parties CONTINUED
168 QBE Insurance Group
Annual report 2012
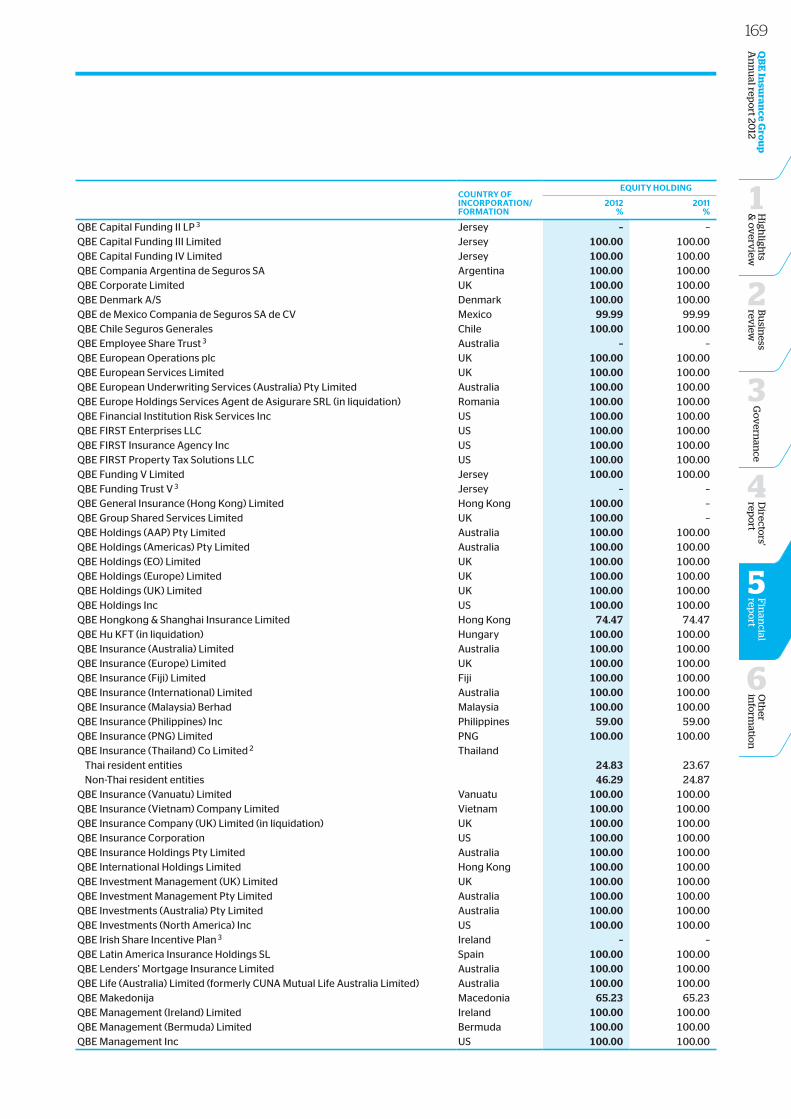
coUNtry oFiNcorPorAtioN/FormAtioN
eqUity HoLDiNG
2012%
2011%
QBE Capital Funding II LP 3 Jersey – –QBE Capital Funding III Limited Jersey 100.00 100.00QBE Capital Funding IV Limited Jersey 100.00 100.00QBE Compania Argentina de Seguros SA Argentina 100.00 100.00QBE Corporate Limited UK 100.00 100.00QBE Denmark A/S Denmark 100.00 100.00QBE de Mexico Compania de Seguros SA de CV Mexico 99.99 99.99QBE Chile Seguros Generales Chile 100.00 100.00QBE Employee Share Trust 3 Australia – –QBE European Operations plc UK 100.00 100.00QBE European Services Limited UK 100.00 100.00QBE European Underwriting Services (Australia) Pty Limited Australia 100.00 100.00QBE Europe Holdings Services Agent de Asigurare SRL (in liquidation) Romania 100.00 100.00QBE Financial Institution Risk Services Inc US 100.00 100.00QBE FIRST Enterprises LLC US 100.00 100.00QBE FIRST Insurance Agency Inc US 100.00 100.00QBE FIRST Property Tax Solutions LLC US 100.00 100.00QBE Funding V Limited Jersey 100.00 100.00QBE Funding Trust V 3 Jersey – –QBE General Insurance (Hong Kong) Limited Hong Kong 100.00 –QBE Group Shared Services Limited UK 100.00 –QBE Holdings (AAP) Pty Limited Australia 100.00 100.00QBE Holdings (Americas) Pty Limited Australia 100.00 100.00QBE Holdings (EO) Limited UK 100.00 100.00QBE Holdings (Europe) Limited UK 100.00 100.00QBE Holdings (UK) Limited UK 100.00 100.00QBE Holdings Inc US 100.00 100.00QBE Hongkong & Shanghai Insurance Limited Hong Kong 74.47 74.47QBE Hu KFT (in liquidation) Hungary 100.00 100.00QBE Insurance (Australia) Limited Australia 100.00 100.00QBE Insurance (Europe) Limited UK 100.00 100.00QBE Insurance (Fiji) Limited Fiji 100.00 100.00QBE Insurance (International) Limited Australia 100.00 100.00QBE Insurance (Malaysia) Berhad Malaysia 100.00 100.00QBE Insurance (Philippines) Inc Philippines 59.00 59.00QBE Insurance (PNG) Limited PNG 100.00 100.00QBE Insurance (Thailand) Co Limited 2 Thailand
Thai resident entities 24.83 23.67Non-Thai resident entities 46.29 24.87
QBE Insurance (Vanuatu) Limited Vanuatu 100.00 100.00QBE Insurance (Vietnam) Company Limited Vietnam 100.00 100.00QBE Insurance Company (UK) Limited (in liquidation) UK 100.00 100.00QBE Insurance Corporation US 100.00 100.00QBE Insurance Holdings Pty Limited Australia 100.00 100.00QBE International Holdings Limited Hong Kong 100.00 100.00QBE Investment Management (UK) Limited UK 100.00 100.00QBE Investment Management Pty Limited Australia 100.00 100.00QBE Investments (Australia) Pty Limited Australia 100.00 100.00QBE Investments (North America) Inc US 100.00 100.00QBE Irish Share Incentive Plan 3 Ireland – –QBE Latin America Insurance Holdings SL Spain 100.00 100.00QBE Lenders’ Mortgage Insurance Limited Australia 100.00 100.00QBE Life (Australia) Limited (formerly CUNA Mutual Life Australia Limited) Australia 100.00 100.00QBE Makedonija Macedonia 65.23 65.23QBE Management (Ireland) Limited Ireland 100.00 100.00QBE Management (Bermuda) Limited Bermuda 100.00 100.00QBE Management Inc US 100.00 100.00
169O
ther
info
rmatio
n
6
Directo
rs' rep
ort
4
Fin
ancial
repo
rt
5
QB
E In
suran
ce Gro
up
A
nn
ual rep
ort 20
12B
usin
ess rev
iew
2
Go
vern
ance
3
High
lights
& o
verv
iew
1
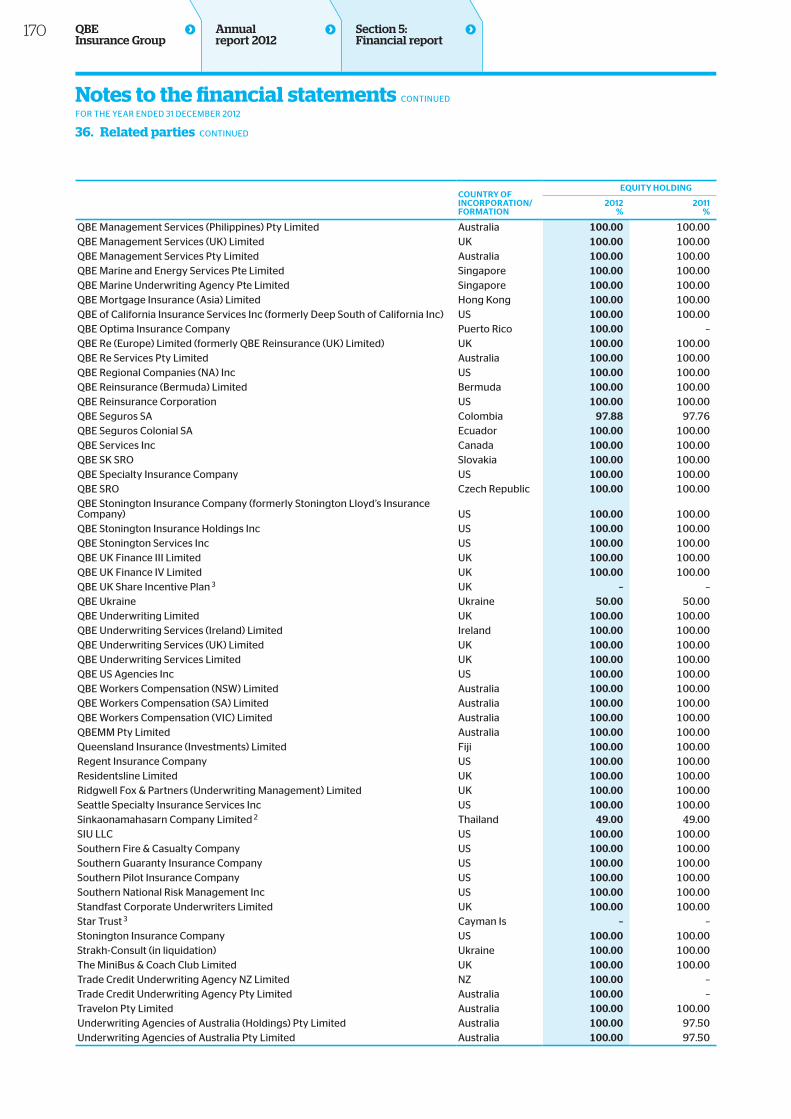
coUNtry oFiNcorPorAtioN/FormAtioN
eqUity HoLDiNG
2012%
2011%
QBE Management Services (Philippines) Pty Limited Australia 100.00 100.00QBE Management Services (UK) Limited UK 100.00 100.00QBE Management Services Pty Limited Australia 100.00 100.00QBE Marine and Energy Services Pte Limited Singapore 100.00 100.00QBE Marine Underwriting Agency Pte Limited Singapore 100.00 100.00QBE Mortgage Insurance (Asia) Limited Hong Kong 100.00 100.00QBE of California Insurance Services Inc (formerly Deep South of California Inc) US 100.00 100.00QBE Optima Insurance Company Puerto Rico 100.00 –QBE Re (Europe) Limited (formerly QBE Reinsurance (UK) Limited) UK 100.00 100.00QBE Re Services Pty Limited Australia 100.00 100.00QBE Regional Companies (NA) Inc US 100.00 100.00QBE Reinsurance (Bermuda) Limited Bermuda 100.00 100.00QBE Reinsurance Corporation US 100.00 100.00QBE Seguros SA Colombia 97.88 97.76QBE Seguros Colonial SA Ecuador 100.00 100.00QBE Services Inc Canada 100.00 100.00QBE SK SRO Slovakia 100.00 100.00QBE Specialty Insurance Company US 100.00 100.00QBE SRO Czech Republic 100.00 100.00QBE Stonington Insurance Company (formerly Stonington Lloyd’s Insurance Company) US 100.00 100.00QBE Stonington Insurance Holdings Inc US 100.00 100.00QBE Stonington Services Inc US 100.00 100.00QBE UK Finance III Limited UK 100.00 100.00QBE UK Finance IV Limited UK 100.00 100.00QBE UK Share Incentive Plan 3 UK – –QBE Ukraine Ukraine 50.00 50.00QBE Underwriting Limited UK 100.00 100.00QBE Underwriting Services (Ireland) Limited Ireland 100.00 100.00QBE Underwriting Services (UK) Limited UK 100.00 100.00QBE Underwriting Services Limited UK 100.00 100.00QBE US Agencies Inc US 100.00 100.00QBE Workers Compensation (NSW) Limited Australia 100.00 100.00QBE Workers Compensation (SA) Limited Australia 100.00 100.00QBE Workers Compensation (VIC) Limited Australia 100.00 100.00QBEMM Pty Limited Australia 100.00 100.00Queensland Insurance (Investments) Limited Fiji 100.00 100.00Regent Insurance Company US 100.00 100.00Residentsline Limited UK 100.00 100.00Ridgwell Fox & Partners (Underwriting Management) Limited UK 100.00 100.00Seattle Specialty Insurance Services Inc US 100.00 100.00Sinkaonamahasarn Company Limited 2 Thailand 49.00 49.00SIU LLC US 100.00 100.00Southern Fire & Casualty Company US 100.00 100.00Southern Guaranty Insurance Company US 100.00 100.00Southern Pilot Insurance Company US 100.00 100.00Southern National Risk Management Inc US 100.00 100.00Standfast Corporate Underwriters Limited UK 100.00 100.00Star Trust 3 Cayman Is – –Stonington Insurance Company US 100.00 100.00Strakh-Consult (in liquidation) Ukraine 100.00 100.00The MiniBus & Coach Club Limited UK 100.00 100.00Trade Credit Underwriting Agency NZ Limited NZ 100.00 –Trade Credit Underwriting Agency Pty Limited Australia 100.00 –Travelon Pty Limited Australia 100.00 100.00Underwriting Agencies of Australia (Holdings) Pty Limited Australia 100.00 97.50Underwriting Agencies of Australia Pty Limited Australia 100.00 97.50
Section 5: Financial report
Notes to the financial statements CONTINUED
FOR THE YEAR ENDED 31 DECEMBER 2012
36. Related parties CONTINUED
170 QBE Insurance Group
Annual report 2012
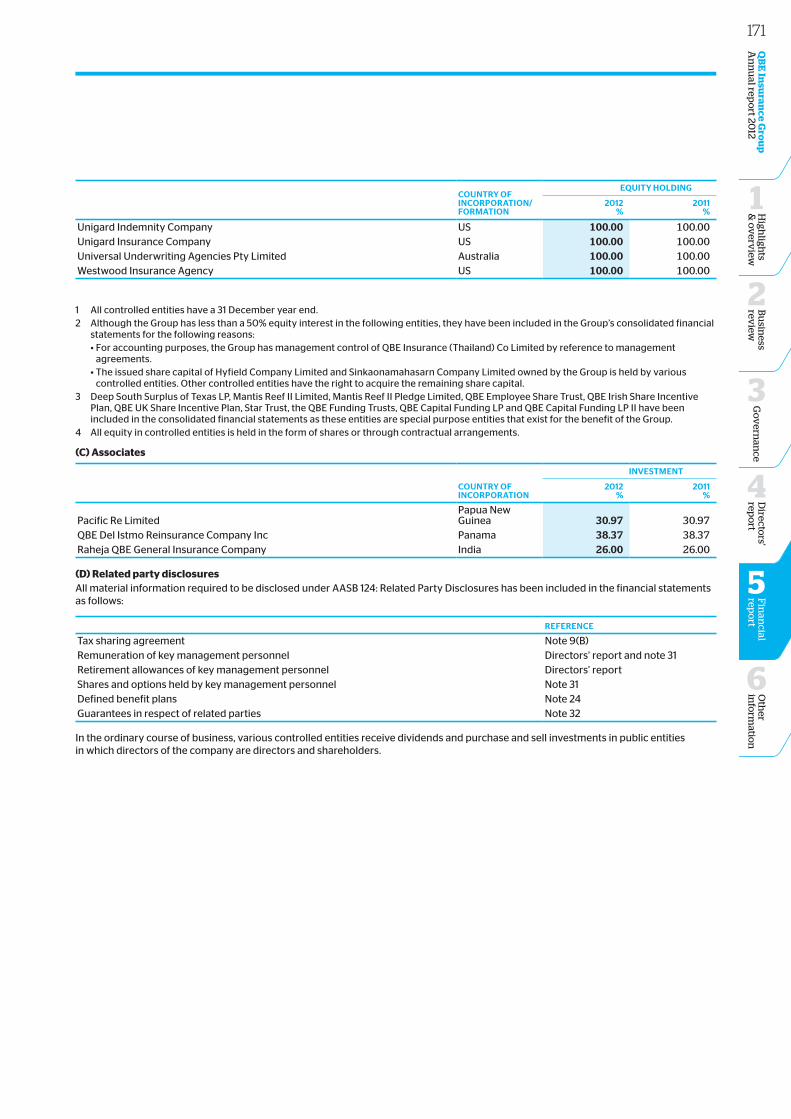
coUNtry oFiNcorPorAtioN/FormAtioN
eqUity HoLDiNG
2012%
2011%
Unigard Indemnity Company US 100.00 100.00Unigard Insurance Company US 100.00 100.00Universal Underwriting Agencies Pty Limited Australia 100.00 100.00Westwood Insurance Agency US 100.00 100.00
1 All controlled entities have a 31 December year end. 2 Although the Group has less than a 50% equity interest in the following entities, they have been included in the Group’s consolidated financial
statements for the following reasons: •Foraccountingpurposes,theGrouphasmanagementcontrolofQBEInsurance(Thailand)CoLimitedbyreferencetomanagement
agreements. •TheissuedsharecapitalofHyfieldCompanyLimitedandSinkaonamahasarnCompanyLimitedownedbytheGroupisheldbyvarious
controlled entities. Other controlled entities have the right to acquire the remaining share capital.3 Deep South Surplus of Texas LP, Mantis Reef II Limited, Mantis Reef II Pledge Limited, QBE Employee Share Trust, QBE Irish Share Incentive
Plan, QBE UK Share Incentive Plan, Star Trust, the QBE Funding Trusts, QBE Capital Funding LP and QBE Capital Funding LP II have been included in the consolidated financial statements as these entities are special purpose entities that exist for the benefit of the Group.
4 All equity in controlled entities is held in the form of shares or through contractual arrangements.
(C) Associates
coUNtry oFiNcorPorAtioN
iNvestmeNt
2012%
2011%
Pacific Re LimitedPapua New Guinea 30.97 30.97
QBE Del Istmo Reinsurance Company Inc Panama 38.37 38.37Raheja QBE General Insurance Company India 26.00 26.00
(D) Related party disclosuresAll material information required to be disclosed under AASB 124: Related Party Disclosures has been included in the financial statements as follows:
reFereNce
Tax sharing agreement Note 9(B)Remuneration of key management personnel Directors’ report and note 31Retirement allowances of key management personnel Directors’ reportShares and options held by key management personnel Note 31Defined benefit plans Note 24Guarantees in respect of related parties Note 32
In the ordinary course of business, various controlled entities receive dividends and purchase and sell investments in public entities in which directors of the company are directors and shareholders.
171O
ther
info
rmatio
n
6
Directo
rs' rep
ort
4
Fin
ancial
repo
rt
5
QB
E In
suran
ce Gro
up
A
nn
ual rep
ort 20
12B
usin
ess rev
iew
2
Go
vern
ance
3
High
lights
& o
verv
iew
1
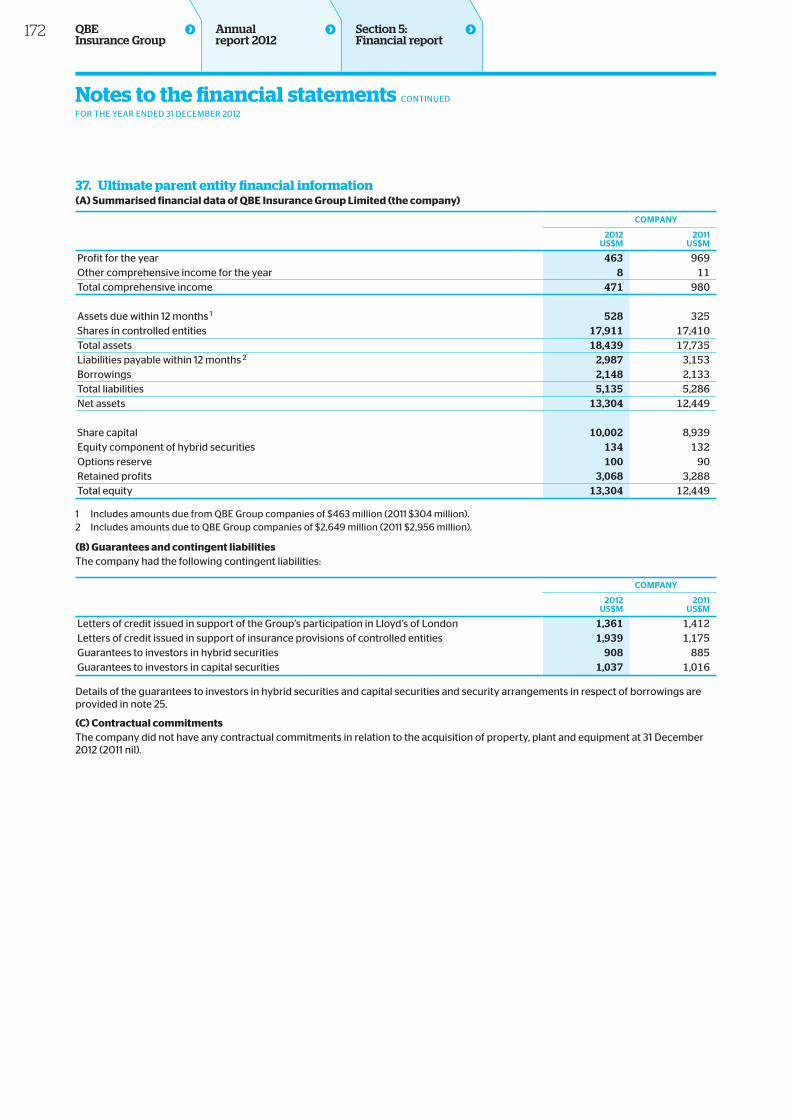
37. Ultimate parent entity financial information(A) Summarised financial data of QBE Insurance Group Limited (the company)
comPANy
2012Us$m
2011Us$m
Profit for the year 463 969Other comprehensive income for the year 8 11Total comprehensive income 471 980
Assets due within 12 months 1 528 325Shares in controlled entities 17,911 17,410Total assets 18,439 17,735Liabilities payable within 12 months 2 2,987 3,153Borrowings 2,148 2,133Total liabilities 5,135 5,286Net assets 13,304 12,449
Share capital 10,002 8,939Equity component of hybrid securities 134 132Options reserve 100 90Retained profits 3,068 3,288Total equity 13,304 12,449
1 Includes amounts due from QBE Group companies of $463 million (2011 $304 million).2 Includes amounts due to QBE Group companies of $2,649 million (2011 $2,956 million).
(B) Guarantees and contingent liabilitiesThe company had the following contingent liabilities:
comPANy
2012Us$m
2011Us$m
Letters of credit issued in support of the Group’s participation in Lloyd’s of London 1,361 1,412Letters of credit issued in support of insurance provisions of controlled entities 1,939 1,175Guarantees to investors in hybrid securities 908 885Guarantees to investors in capital securities 1,037 1,016
Details of the guarantees to investors in hybrid securities and capital securities and security arrangements in respect of borrowings are provided in note 25.
(C) Contractual commitmentsThe company did not have any contractual commitments in relation to the acquisition of property, plant and equipment at 31 December 2012 (2011 nil).
Notes to the financial statements CONTINUED
FOR THE YEAR ENDED 31 DECEMBER 2012
Section 5: Financial report
172 QBE Insurance Group
Annual report 2012
In the directors’ opinion:
(a) the financial statements and notes set out on pages 108 to 172 are in accordance with the Corporations Act 2001, including:
(i) complying with accounting standards, the Corporations Regulations 2001 and other mandatory professional reporting requirements; and
(ii) giving a true and fair view of the Group’s financial position as at 31 December 2012 and of its performance for the financial year ended on that date; and
(b) there are reasonable grounds to believe that the company will be able to pay its debts as and when they become due and payable.
Note 1(A) confirms that the financial statements also comply with International Financial Reporting Standards as issued by the International Accounting Standards Board.
The directors have been given the declarations by the Group Chief Executive Officer and Group Chief Financial Officer required by section 295A of the Corporations Act 2001.
Signed in SYDNEY this 26th day of February 2013 in accordance with a resolution of the directors.
BJ Hutchinson AM Director
JD Neal Director
Directors’ declaration
173O
ther
info
rmatio
n
6
Directo
rs' rep
ort
4
Fin
ancial
repo
rt
5
QB
E In
suran
ce Gro
up
A
nn
ual rep
ort 20
12B
usin
ess rev
iew
2
Go
vern
ance
3
High
lights
& o
verv
iew
1

Section 6: Other information
Independent auditor’s reportto the members of Qbe insurance group limited
liability limited by a scheme approved under professional standards legislation
Report on the financial report We have audited the accompanying financial report of Qbe insurance group limited (the company), which comprises the balance sheet as at 31 december 2012, and the income statement, the statement of comprehensive income, statement of changes in equity and statement of cash flows for the year ended on that date, a summary of significant accounting policies, other explanatory notes and the directors’ declaration for the Qbe insurance group (the consolidated entity). the consolidated entity comprises the company and the entities it controlled at the year’s end or from time to time during the financial year.
Directors’ responsibility for the financial reportthe directors of the company are responsible for the preparation of the financial report that gives a true and fair view in accordance with australian accounting standards and the Corporations Act 2001 and for such internal control as the directors determine is necessary to enable the preparation of the financial report that is free from material misstatement, whether due to fraud or error. in note 1, the directors also state, in accordance with accounting standard aasb 101 presentation of financial statements, that the financial statements comply with international financial reporting standards.
Auditor’s responsibility our responsibility is to express an opinion on the financial report based on our audit. We conducted our audit in accordance with australian auditing standards. these auditing standards require that we comply with relevant ethical requirements relating to audit engagements and plan and perform the audit to obtain reasonable assurance whether the financial report is free from material misstatement.
an audit involves performing procedures to obtain audit evidence about the amounts and disclosures in the financial report. the procedures selected depend on the auditor’s judgment, including the assessment of the risks of material misstatement of the financial report, whether due to fraud or error. in making those risk assessments, the auditor considers internal control relevant to the entity’s preparation and fair presentation of the financial report in order to design audit procedures that are appropriate in the circumstances, but not for the purpose of expressing an opinion on the effectiveness of the entity’s internal control. an audit also includes evaluating the appropriateness of accounting policies used and the reasonableness of accounting estimates made by the directors, as well as evaluating the overall presentation of the financial report.
our procedures include reading the other information in the annual report to determine whether it contains any material inconsistencies with the financial report.
We believe that the audit evidence we have obtained is sufficient and appropriate to provide a basis for our audit opinion.
Independencein conducting our audit, we have complied with the independence requirements of the Corporations Act 2001.
Auditor’s opinion in our opinion:
(a) the financial report of Qbe insurance group limited is in accordance with the Corporations Act 2001, including:
(i) giving a true and fair view of the consolidated entity’s financial position as at 31 december 2012 and of its performance for the year ended on that date; and
(ii) complying with australian accounting standards (including the australian accounting interpretations) and the corporations regulations 2001; and
(b) the financial report and notes also comply with international financial reporting standards as disclosed in note 1.
Report on the Remuneration ReportWe have audited the remuneration report included in pages 84 to 104 of the directors’ report for the year ended 31 december 2012. the directors of the company are responsible for the preparation and presentation of the remuneration report in accordance with section 300a of the Corporations Act 2001. our responsibility is to express an opinion on the remuneration report, based on our audit conducted in accordance with australian auditing standards.
Auditor’s opinion in our opinion, the remuneration report of Qbe insurance group limited for the year ended 31 december 2012, complies with section 300a of the Corporations Act 2001.
Matters relating to the electronic presentation of the audited financial reportthis auditor’s report relates to the financial report and remuneration report of Qbe insurance group limited (the company) for the year ended 31 december 2012 included on the Qbe insurance group limited web site. the company’s directors are responsible for the integrity of the Qbe insurance group limited web site. We have not been engaged to report on the integrity of this web site. the auditor’s report refers only to the financial report and remuneration report named above. it does not provide an opinion on any other information which may have been hyperlinked to/from the financial report or the remuneration report. if users of this report are concerned with the inherent risks arising from electronic data communications they are advised to refer to the hard copy of the audited financial report and remuneration report to confirm the information included in the audited financial report and remuneration report presented on this web site.
pricewaterhousecoopers
Kg smith Partner
sydney 26 february 2013
174 QBE Insurance Group
Annual report 2012
QBE is incorporated in Australia, is listed on the Australian Securities Exchange (ASX) and trades under the code “QBE”.
Annual General Meeting (AGM)Time: 10am Wednesday, 27 March 2013 Wesley Conference Centre, 220 Pitt Street, Sydney NSW 2000, Australia
Online proxy voting is available through the Link investor service centre website.
Voting rights of ordinary sharesThe constitution provides for votes to be cast:
• on a show of hands, one vote for each shareholder; and
• on a poll, one vote for each fully paid ordinary share.
Shareholder information and enquiriesMost enquiries and correspondence regarding shareholdings can be directed to QBE’s share registrar:
Link Market Services Limited (Link) Locked Bag A14 Sydney South NSW 1235 Australia
Level 12, 680 George Street Sydney NSW 2000 Australia
Telephone: 1800 680 188 (within Australia) Telephone: +61 1800 680 188 (outside Australia) Facsimile: +61 2 9287 0303
Website: www.linkmarketservices.com.au (Link investor service centre website) Email: [email protected]
For security purposes, please quote your Securityholder Reference Number (SRN) or Holder Identification Number (HIN).
If you are broker (CHESS) sponsored, queries relating to incorrect registrations and changes to name and/or address can only be processed by your stockbroker. Link cannot assist you with these changes.
Relevant interests registerOrient Capital Pty Limited of Level 12, 680 George Street, Sydney NSW 2000, Australia, maintains QBE’s register of information about relevant interests. The register contains any responses from custodians on and after 1 January 2005 to searches relating to the beneficial ownership of QBE’s shares. Shareholders and other parties can telephone Orient Capital on +61 2 8280 6000 or facsimile on +61 2 8280 6001 if they wish to inspect this register.
Shareholding details onlineView your shareholdings and update your details online either through investor login or the portfolio login at the Link investor service centre website. By registering your portfolio, you can consolidate multiple shareholdings in various companies managed by Link Market Services under one login. Updating holding details is simplified under the portfolio login.
You may receive dividend statements, notices of meetings, annual reports and major company announcements electronically by registering your email address at the Link investor service centre website. For more information, please go to Link’s website: www.linkmarketservices.com.au.
Annual report mailing listAmendments to the Corporations Act 2001 have removed the obligation for companies to mail an annual report to shareholders. To improve efficiency, save costs and reduce our impact on the environment by minimising unnecessary use of paper and printing resources, the annual report is published on our website at www.qbe.com.
If you wish to receive a hard copy of the annual report, please notify Link in writing or select the annual report option under “communications” on the Link investor service centre website.
The half yearly results summary to 30 June 2013 will be mailed with the interim dividend. The next annual report for the year ending 31 December 2013 will be distributed in March 2014. QBE does not produce a concise financial report.
Tax File Number (TFN), Australian Business Number (ABN) or exemption – Australian residentsYou can confirm whether you have lodged your TFN, ABN or exemption by visiting the Link investor service centre website. If you choose not to lodge these details, QBE is obliged to deduct tax at the highest marginal rate (plus the Medicare levy) from the unfranked portion of dividends paid. Australian shareholders living abroad should advise Link of their resident status. TFN forms are available from Link or can be downloaded from either the QBE or Link websites.
DividendsQBE encourages shareholders to have cash dividends credited directly to a bank, building society or credit union account in either Australia or New Zealand to eliminate delays in funds clearance and to significantly reduce the risk of loss or theft. A dividend advice confirming the deposit details is either mailed to you or is available online on the payment date.
Eligible shareholders can participate in QBE’s Dividend Reinvestment Plan (DRP) and Bonus Share Plan (BSP) when the plans are active. The DRP enables you to subscribe for additional shares. The BSP is a bonus share plan whereby the dividend entitlement is forgone for bonus shares in lieu of the dividend. In order to participate in either the DRP or BSP, you must have a minimum shareholding of 100 shares.
Participants may change their election to participate in the DRP and BSP at any time. DRP/BSP election cut-off dates and application forms are available from QBE’s website.
Conduit foreign income (CFI)Shareholders not resident in Australia will receive CFI credits in respect of the whole unfranked portion of QBE dividends. These credits exempt non-resident shareholders from Australian withholding tax.
Unpresented cheques/unclaimed moneyUnder the Unclaimed Moneys Act, unclaimed dividends must be given to the New South Wales state treasury. It is very important that shareholders bank outstanding dividend cheques promptly and advise Link immediately of changes of address or bank account details.
QB
E In
suran
ce Gro
up
A
nn
ual rep
ort 20
12B
usin
ess rev
iew
2
Go
vern
ance
3
High
lights
& o
verv
iew
1
Shareholder information
175D
irectors'
repo
rt
4
QB
E In
suran
ce Gro
up
A
nn
ual rep
ort 20
12B
usin
ess rev
iew
2
Go
vern
ance
3
High
lights
& o
verv
iew
1
Fin
ancial
repo
rt
5
Oth
er in
form
ation
6
American Depository Receipts (ADRs)BNY Mellon sponsors QBE’s level 1 American Depository Receipts Program (ADR) in the United States of America. QBE’s ADRs are traded on the over-the-counter (OTC) securities market in the US under the symbol QBIEY and CUSIP: 74728G605. One ADR represents one ordinary share in QBE. US OTC market information is available at: www.otcmarkets.com/stock/QBIEY/quote.
QBE’s ADR information with BNY Mellon can also be viewed at: http://www.adrbnymellon.com/dr_profile.jsp?cusip=74728G605#
ADR holders seeking information on their shareholding should contact:
BNY Mellon Shareowner Services P.O. Box 358516 Pittsburgh, PA 15252-8516
International callers telephone: +1-201-680-6825 Email: [email protected]
Toll free telephone number for callers within USA: 1-888-BNY-ADRS (1-888-269-2377)
Privacy legislationChapter 2C of the Corporations Act 2001 requires information about you as a security holder (including your name, address and details of the securities you hold) to be included in QBE’s share register. These details must continue to be included in the public register even if you cease to be a security holder. A copy of the privacy policy is available on Link’s website.
Registered officeQBE Insurance Group Limited Level 2, 82 Pitt Street Sydney NSW 2000 Australia
Telephone: +61 2 9375 4444 Facsimile: +61 2 9235 3166 Website: www.qbe.com
QBE websiteQBE’s website provides investors with information about QBE including annual reports, half yearly reports and announcements to the ASX. The website also offers regular QBE share price updates, a calendar of events, a history of QBE’s dividends, access to standard forms (change of address, direct credit advice and more) and online access to your shareholding details via the share registry.
Shareholder information CONTINUED
Section 6: Other information
176 QBE Insurance Group
Annual report 2012
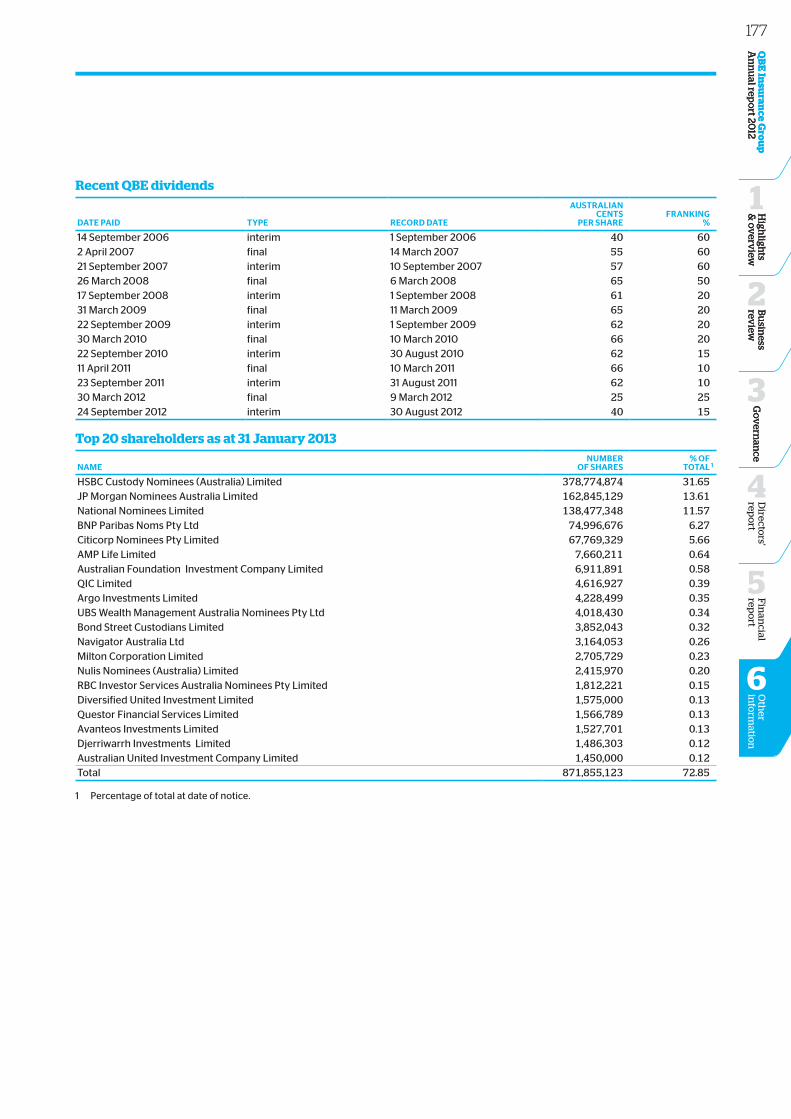
Recent QBE dividends
DAte PAiD tyPe recorD DAte
AUstrALiANceNts
Per sHAreFrANkiNG
%
14 September 2006 interim 1 September 2006 40 602 April 2007 final 14 March 2007 55 6021 September 2007 interim 10 September 2007 57 6026 March 2008 final 6 March 2008 65 5017 September 2008 interim 1 September 2008 61 2031 March 2009 final 11 March 2009 65 2022 September 2009 interim 1 September 2009 62 2030 March 2010 final 10 March 2010 66 2022 September 2010 interim 30 August 2010 62 1511 April 2011 final 10 March 2011 66 1023 September 2011 interim 31 August 2011 62 1030 March 2012 final 9 March 2012 25 2524 September 2012 interim 30 August 2012 40 15
Top 20 shareholders as at 31 January 2013
NAmeNUmber
oF sHAres% oF
totAL 1
HSBC Custody Nominees (Australia) Limited 378,774,874 31.65JP Morgan Nominees Australia Limited 162,845,129 13.61National Nominees Limited 138,477,348 11.57BNP Paribas Noms Pty Ltd 74,996,676 6.27Citicorp Nominees Pty Limited 67,769,329 5.66AMP Life Limited 7,660,211 0.64Australian Foundation Investment Company Limited 6,911,891 0.58QIC Limited 4,616,927 0.39Argo Investments Limited 4,228,499 0.35UBS Wealth Management Australia Nominees Pty Ltd 4,018,430 0.34Bond Street Custodians Limited 3,852,043 0.32Navigator Australia Ltd 3,164,053 0.26Milton Corporation Limited 2,705,729 0.23Nulis Nominees (Australia) Limited 2,415,970 0.20RBC Investor Services Australia Nominees Pty Limited 1,812,221 0.15Diversified United Investment Limited 1,575,000 0.13Questor Financial Services Limited 1,566,789 0.13Avanteos Investments Limited 1,527,701 0.13Djerriwarrh Investments Limited 1,486,303 0.12Australian United Investment Company Limited 1,450,000 0.12Total 871,855,123 72.85
1 Percentage of total at date of notice.
QB
E In
suran
ce Gro
up
A
nn
ual rep
ort 20
12B
usin
ess rev
iew
2
Go
vern
ance
3
High
lights
& o
verv
iew
1
177D
irectors'
repo
rt
4
QB
E In
suran
ce Gro
up
A
nn
ual rep
ort 20
12B
usin
ess rev
iew
2
Go
vern
ance
3
High
lights
& o
verv
iew
1
Fin
ancial
repo
rt
5
Oth
er in
form
ation
6
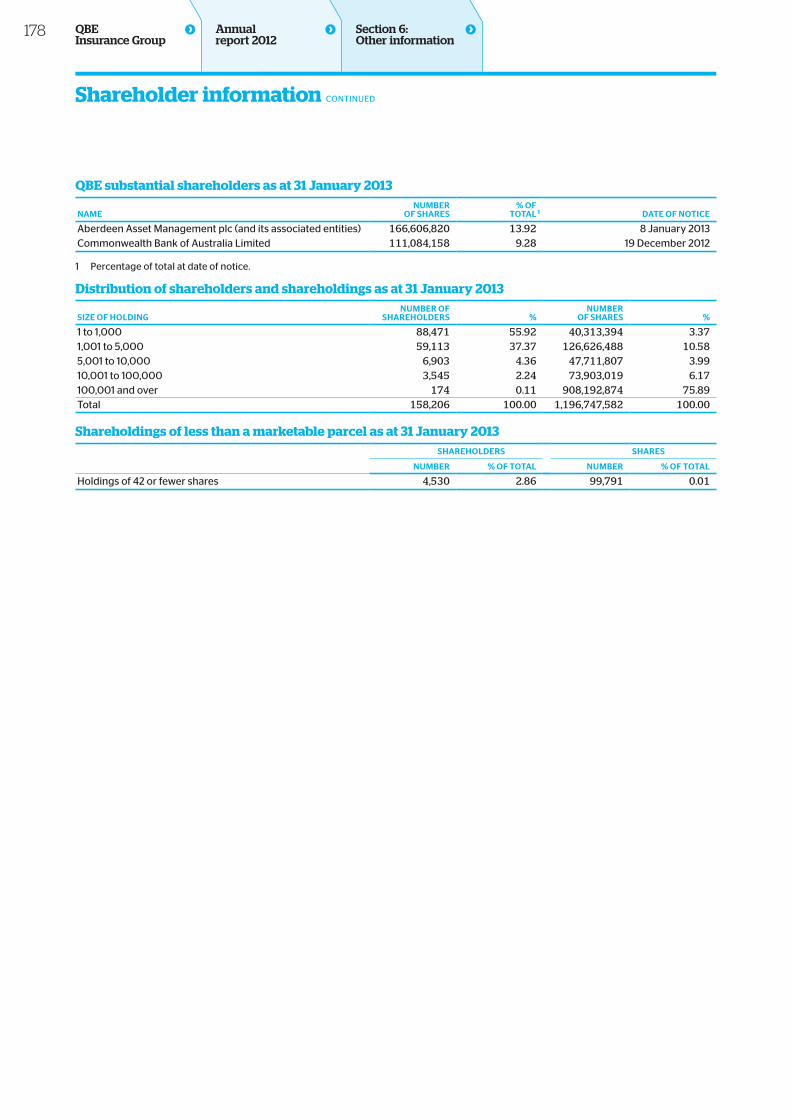
QBE substantial shareholders as at 31 January 2013
NAmeNUmber
oF sHAres% oF
totAL 1 DAte oF Notice
Aberdeen Asset Management plc (and its associated entities) 166,606,820 13.92 8 January 2013Commonwealth Bank of Australia Limited 111,084,158 9.28 19 December 2012
1 Percentage of total at date of notice.
Distribution of shareholders and shareholdings as at 31 January 2013
siZe oF HoLDiNGNUmber oF
sHAreHoLDers %NUmber
oF sHAres %
1 to 1,000 88,471 55.92 40,313,394 3.371,001 to 5,000 59,113 37.37 126,626,488 10.585,001 to 10,000 6,903 4.36 47,711,807 3.9910,001 to 100,000 3,545 2.24 73,903,019 6.17100,001 and over 174 0.11 908,192,874 75.89Total 158,206 100.00 1,196,747,582 100.00
Shareholdings of less than a marketable parcel as at 31 January 2013sHAreHoLDers sHAres
NUmber % oF totAL NUmber % oF totAL
Holdings of 42 or fewer shares 4,530 2.86 99,791 0.01
Shareholder information CONTINUED
Section 6: Other information
178 QBE Insurance Group
Annual report 2012
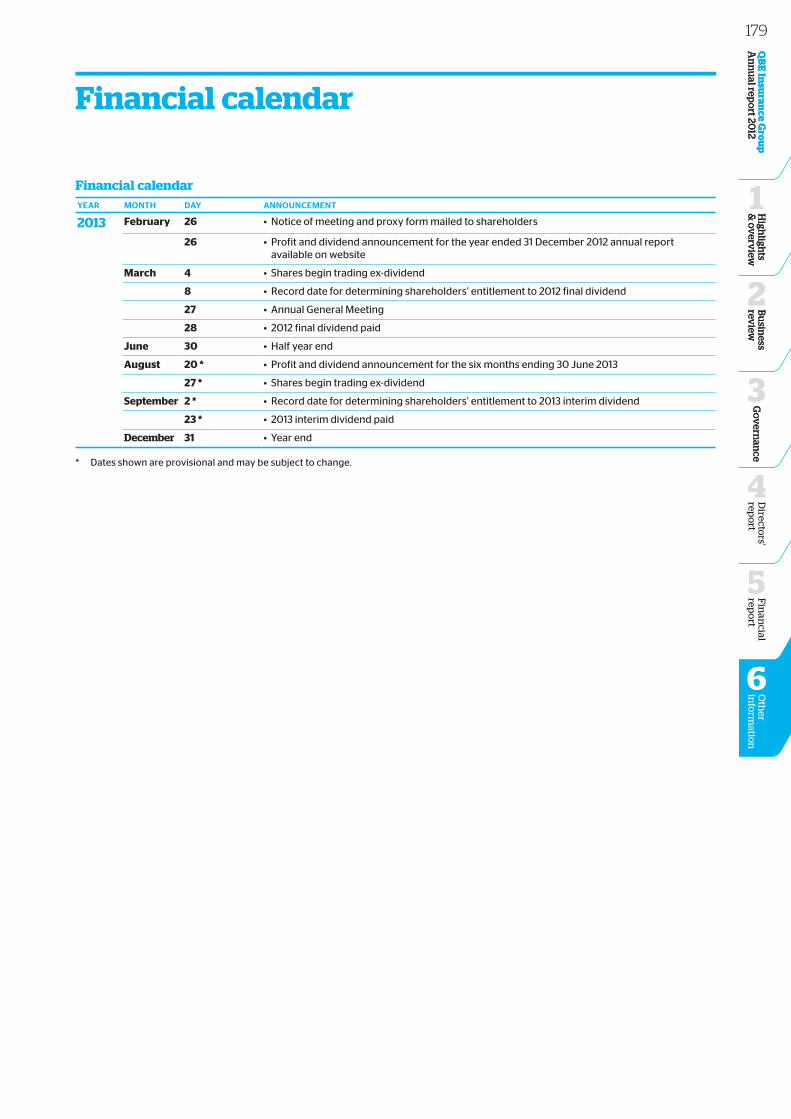
Financial calendaryeAr moNtH DAy ANNoUNcemeNt
2013 February 26 • Notice of meeting and proxy form mailed to shareholders
26 • Profit and dividend announcement for the year ended 31 December 2012 annual report available on website
March 4 • Shares begin trading ex-dividend
8 • Record date for determining shareholders’ entitlement to 2012 final dividend
27 • Annual General Meeting
28 • 2012 final dividend paid
June 30 • Half year end
August 20 * • Profit and dividend announcement for the six months ending 30 June 2013
27 * • Shares begin trading ex-dividend
September 2 * • Record date for determining shareholders’ entitlement to 2013 interim dividend
23 * • 2013 interim dividend paid
December 31 • Year end
* Dates shown are provisional and may be subject to change.
QB
E In
suran
ce Gro
up
A
nn
ual rep
ort 20
12B
usin
ess rev
iew
2
Go
vern
ance
3
High
lights
& o
verv
iew
1
Financial calendar
179D
irectors'
repo
rt
4
QB
E In
suran
ce Gro
up
A
nn
ual rep
ort 20
12B
usin
ess rev
iew
2
Go
vern
ance
3
High
lights
& o
verv
iew
1
Fin
ancial
repo
rt
5
Oth
er in
form
ation
6
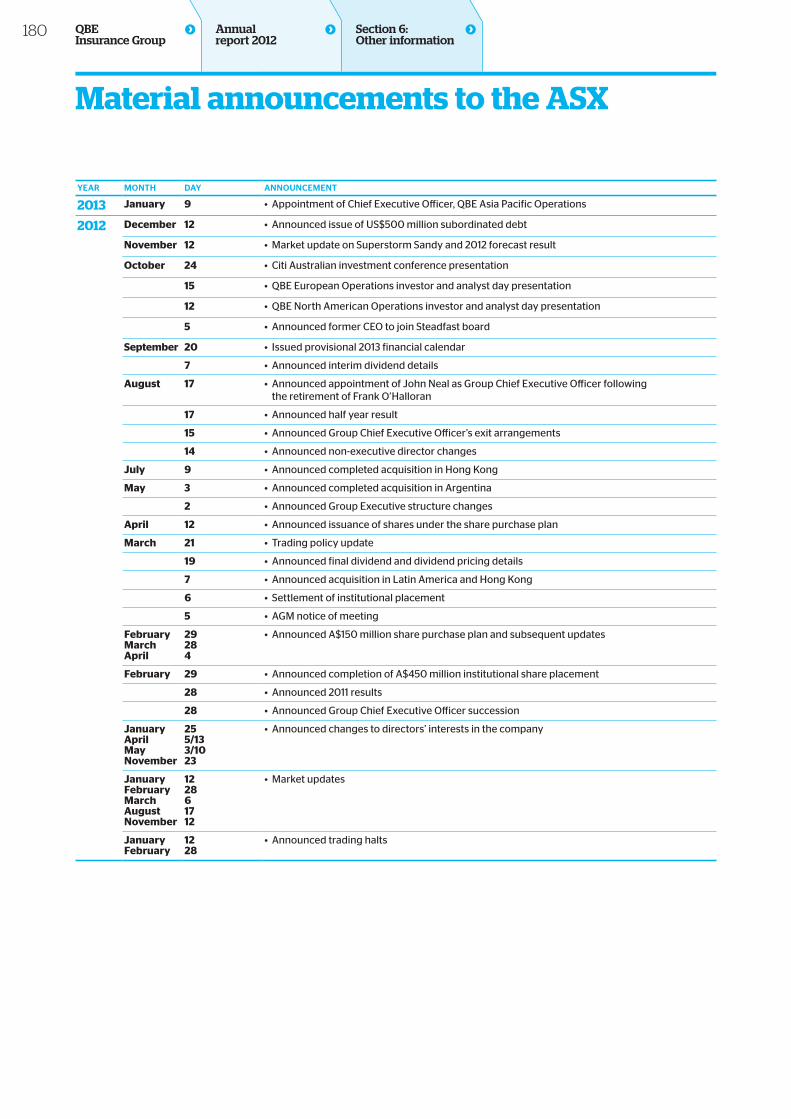
yeAr moNtH DAy ANNoUNcemeNt
2013 January 9 • Appointment of Chief Executive Officer, QBE Asia Pacific Operations
2012 December 12 • Announced issue of US$500 million subordinated debt
November 12 • Market update on Superstorm Sandy and 2012 forecast result
October 24 • Citi Australian investment conference presentation
15 • QBE European Operations investor and analyst day presentation
12 • QBE North American Operations investor and analyst day presentation
5 • Announced former CEO to join Steadfast board
September 20 • Issued provisional 2013 financial calendar
7 • Announced interim dividend details
August 17 • Announced appointment of John Neal as Group Chief Executive Officer following the retirement of Frank O’Halloran
17 • Announced half year result
15 • Announced Group Chief Executive Officer’s exit arrangements
14 • Announced non-executive director changes
July 9 • Announced completed acquisition in Hong Kong
May 3 • Announced completed acquisition in Argentina
2 • Announced Group Executive structure changes
April 12 • Announced issuance of shares under the share purchase plan
March 21 • Trading policy update
19 • Announced final dividend and dividend pricing details
7 • Announced acquisition in Latin America and Hong Kong
6 • Settlement of institutional placement
5 • AGM notice of meeting
February March April
29 28 4
• Announced A$150 million share purchase plan and subsequent updates
February 29 • Announced completion of A$450 million institutional share placement
28 • Announced 2011 results
28 • Announced Group Chief Executive Officer succession
January April May November
25 5/13 3/10 23
• Announced changes to directors’ interests in the company
January February March August November
12 28 6 17 12
• Market updates
January February
12 28
• Announced trading halts
Section 6: Other information
Material announcements to the ASX
180 QBE Insurance Group
Annual report 2012
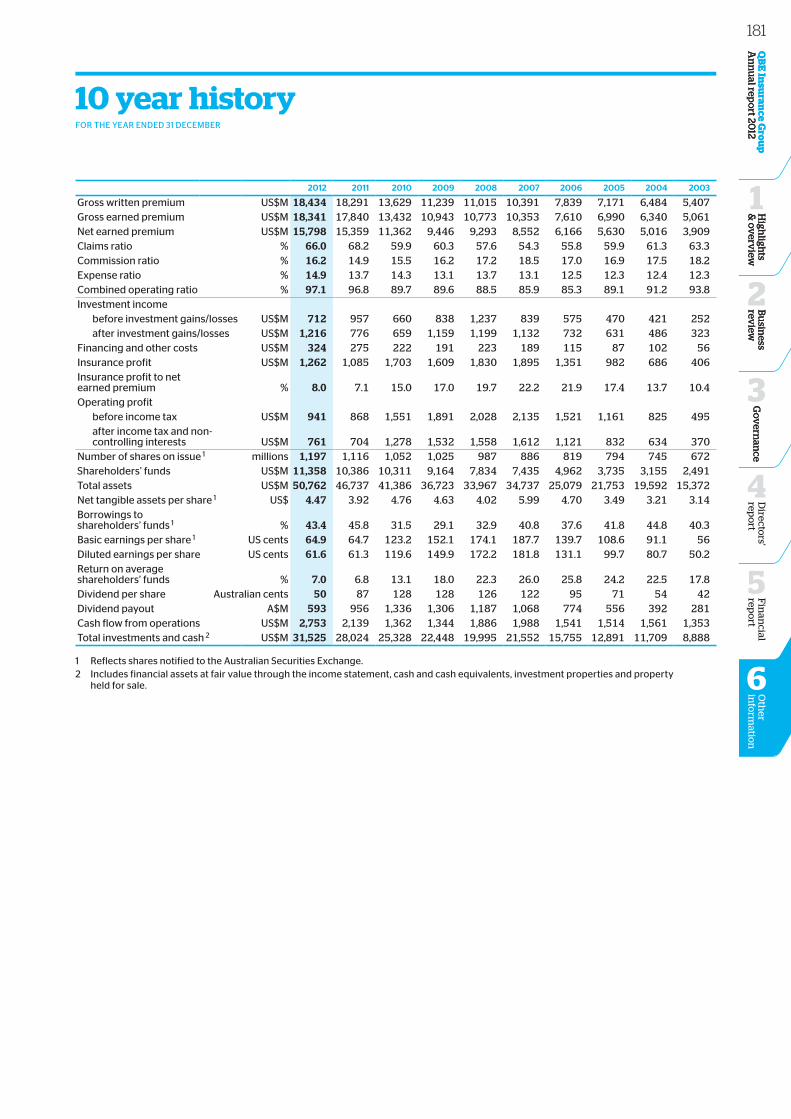
2012 2011 2010 2009 2008 2007 2006 2005 2004 2003
Gross written premium US$M 18,434 18,291 13,629 11,239 11,015 10,391 7,839 7,171 6,484 5,407Gross earned premium US$M 18,341 17,840 13,432 10,943 10,773 10,353 7,610 6,990 6,340 5,061Net earned premium US$M 15,798 15,359 11,362 9,446 9,293 8,552 6,166 5,630 5,016 3,909Claims ratio % 66.0 68.2 59.9 60.3 57.6 54.3 55.8 59.9 61.3 63.3Commission ratio % 16.2 14.9 15.5 16.2 17.2 18.5 17.0 16.9 17.5 18.2Expense ratio % 14.9 13.7 14.3 13.1 13.7 13.1 12.5 12.3 12.4 12.3Combined operating ratio % 97.1 96.8 89.7 89.6 88.5 85.9 85.3 89.1 91.2 93.8Investment income before investment gains/losses US$M 712 957 660 838 1,237 839 575 470 421 252 after investment gains/losses US$M 1,216 776 659 1,159 1,199 1,132 732 631 486 323Financing and other costs US$M 324 275 222 191 223 189 115 87 102 56Insurance profit US$M 1,262 1,085 1,703 1,609 1,830 1,895 1,351 982 686 406Insurance profit to net earned premium % 8.0 7.1 15.0 17.0 19.7 22.2 21.9 17.4 13.7 10.4Operating profit before income tax US$M 941 868 1,551 1,891 2,028 2,135 1,521 1,161 825 495 after income tax and non-
controlling interests US$M 761 704 1,278 1,532 1,558 1,612 1,121 832 634 370Number of shares on issue 1 millions 1,197 1,116 1,052 1,025 987 886 819 794 745 672Shareholders’ funds US$M 11,358 10,386 10,311 9,164 7,834 7,435 4,962 3,735 3,155 2,491Total assets US$M 50,762 46,737 41,386 36,723 33,967 34,737 25,079 21,753 19,592 15,372Net tangible assets per share 1 US$ 4.47 3.92 4.76 4.63 4.02 5.99 4.70 3.49 3.21 3.14Borrowings to shareholders’ funds 1 % 43.4 45.8 31.5 29.1 32.9 40.8 37.6 41.8 44.8 40.3Basic earnings per share 1 US cents 64.9 64.7 123.2 152.1 174.1 187.7 139.7 108.6 91.1 56Diluted earnings per share US cents 61.6 61.3 119.6 149.9 172.2 181.8 131.1 99.7 80.7 50.2Return on average shareholders’ funds % 7.0 6.8 13.1 18.0 22.3 26.0 25.8 24.2 22.5 17.8Dividend per share Australian cents 50 87 128 128 126 122 95 71 54 42Dividend payout A$M 593 956 1,336 1,306 1,187 1,068 774 556 392 281Cash flow from operations US$M 2,753 2,139 1,362 1,344 1,886 1,988 1,541 1,514 1,561 1,353Total investments and cash 2 US$M 31,525 28,024 25,328 22,448 19,995 21,552 15,755 12,891 11,709 8,888
1 Reflects shares notified to the Australian Securities Exchange. 2 Includes financial assets at fair value through the income statement, cash and cash equivalents, investment properties and property
held for sale.
QB
E In
suran
ce Gro
up
A
nn
ual rep
ort 20
12B
usin
ess rev
iew
2
Go
vern
ance
3
High
lights
& o
verv
iew
1
10 year historyFOR THE YEAR ENDED 31 DECEMBER
181D
irectors'
repo
rt
4
QB
E In
suran
ce Gro
up
A
nn
ual rep
ort 20
12B
usin
ess rev
iew
2
Go
vern
ance
3
High
lights
& o
verv
iew
1
Fin
ancial
repo
rt
5
Oth
er in
form
ation
6
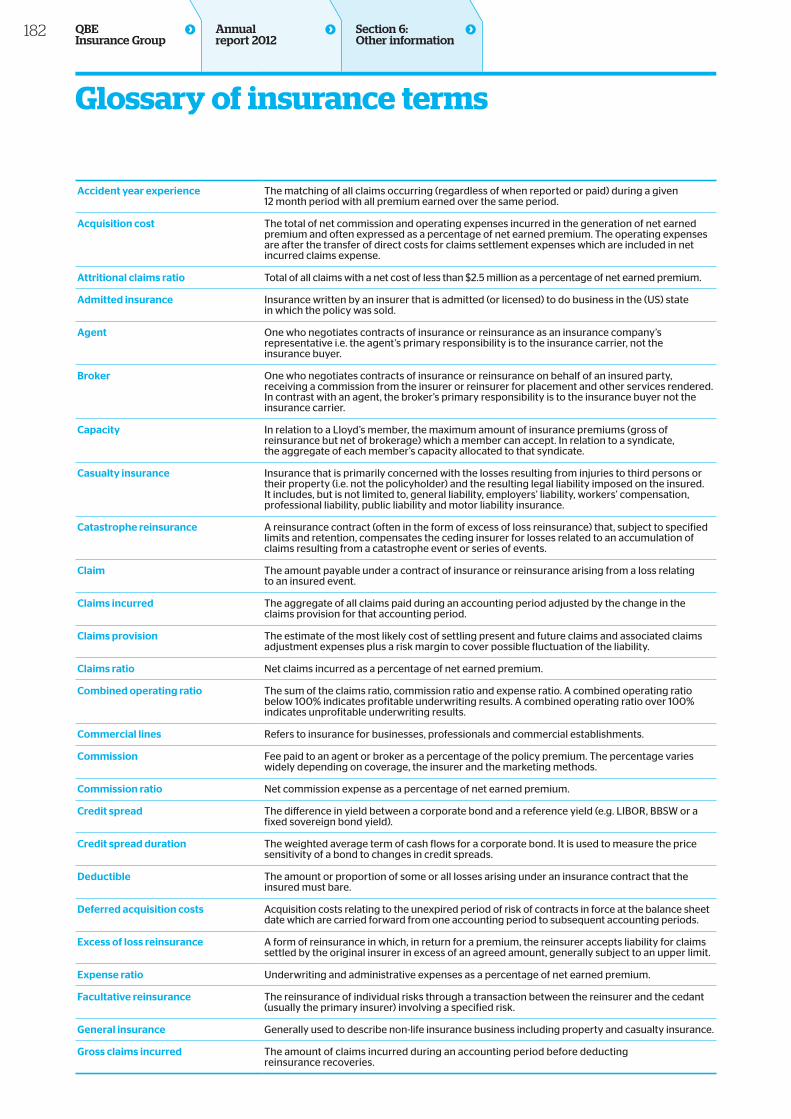
Accident year experience The matching of all claims occurring (regardless of when reported or paid) during a given 12 month period with all premium earned over the same period.
Acquisition cost The total of net commission and operating expenses incurred in the generation of net earned premium and often expressed as a percentage of net earned premium. The operating expenses are after the transfer of direct costs for claims settlement expenses which are included in net incurred claims expense.
Attritional claims ratio Total of all claims with a net cost of less than $2.5 million as a percentage of net earned premium.
Admitted insurance Insurance written by an insurer that is admitted (or licensed) to do business in the (US) state in which the policy was sold.
Agent One who negotiates contracts of insurance or reinsurance as an insurance company’s representative i.e. the agent’s primary responsibility is to the insurance carrier, not the insurance buyer.
broker One who negotiates contracts of insurance or reinsurance on behalf of an insured party, receiving a commission from the insurer or reinsurer for placement and other services rendered. In contrast with an agent, the broker’s primary responsibility is to the insurance buyer not the insurance carrier.
capacity In relation to a Lloyd’s member, the maximum amount of insurance premiums (gross of reinsurance but net of brokerage) which a member can accept. In relation to a syndicate, the aggregate of each member’s capacity allocated to that syndicate.
casualty insurance Insurance that is primarily concerned with the losses resulting from injuries to third persons or their property (i.e. not the policyholder) and the resulting legal liability imposed on the insured. It includes, but is not limited to, general liability, employers’ liability, workers’ compensation, professional liability, public liability and motor liability insurance.
catastrophe reinsurance A reinsurance contract (often in the form of excess of loss reinsurance) that, subject to specified limits and retention, compensates the ceding insurer for losses related to an accumulation of claims resulting from a catastrophe event or series of events.
claim The amount payable under a contract of insurance or reinsurance arising from a loss relating to an insured event.
claims incurred The aggregate of all claims paid during an accounting period adjusted by the change in the claims provision for that accounting period.
claims provision The estimate of the most likely cost of settling present and future claims and associated claims adjustment expenses plus a risk margin to cover possible fluctuation of the liability.
claims ratio Net claims incurred as a percentage of net earned premium.
combined operating ratio The sum of the claims ratio, commission ratio and expense ratio. A combined operating ratio below 100% indicates profitable underwriting results. A combined operating ratio over 100% indicates unprofitable underwriting results.
commercial lines Refers to insurance for businesses, professionals and commercial establishments.
commission Fee paid to an agent or broker as a percentage of the policy premium. The percentage varies widely depending on coverage, the insurer and the marketing methods.
commission ratio Net commission expense as a percentage of net earned premium.
credit spread The difference in yield between a corporate bond and a reference yield (e.g. LIBOR, BBSW or a fixed sovereign bond yield).
credit spread duration The weighted average term of cash flows for a corporate bond. It is used to measure the price sensitivity of a bond to changes in credit spreads.
Deductible The amount or proportion of some or all losses arising under an insurance contract that the insured must bare.
Deferred acquisition costs Acquisition costs relating to the unexpired period of risk of contracts in force at the balance sheet date which are carried forward from one accounting period to subsequent accounting periods.
excess of loss reinsurance A form of reinsurance in which, in return for a premium, the reinsurer accepts liability for claims settled by the original insurer in excess of an agreed amount, generally subject to an upper limit.
expense ratio Underwriting and administrative expenses as a percentage of net earned premium.
Facultative reinsurance The reinsurance of individual risks through a transaction between the reinsurer and the cedant (usually the primary insurer) involving a specified risk.
General insurance Generally used to describe non-life insurance business including property and casualty insurance.
Gross claims incurred The amount of claims incurred during an accounting period before deducting reinsurance recoveries.
Section 6: Other information
Glossary of insurance terms
182 QBE Insurance Group
Annual report 2012
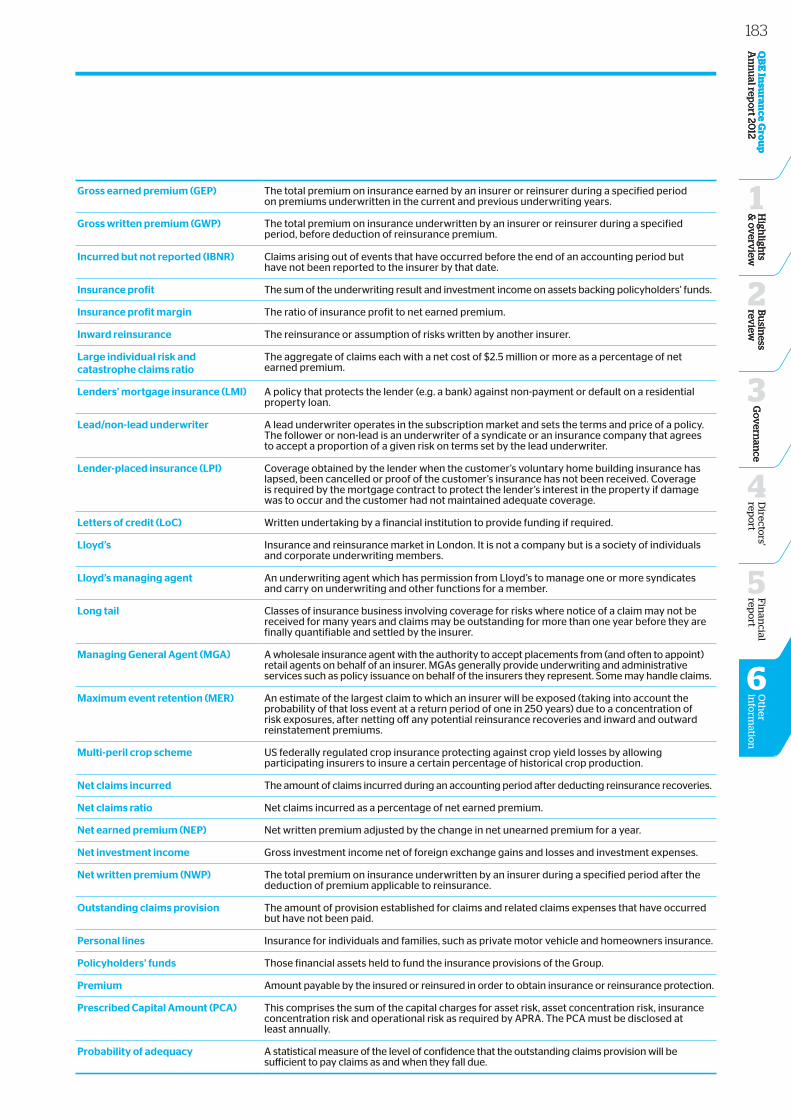
Gross earned premium (GeP) The total premium on insurance earned by an insurer or reinsurer during a specified period on premiums underwritten in the current and previous underwriting years.
Gross written premium (GwP) The total premium on insurance underwritten by an insurer or reinsurer during a specified period, before deduction of reinsurance premium.
incurred but not reported (ibNr) Claims arising out of events that have occurred before the end of an accounting period but have not been reported to the insurer by that date.
insurance profit The sum of the underwriting result and investment income on assets backing policyholders’ funds.
insurance profit margin The ratio of insurance profit to net earned premium.
inward reinsurance The reinsurance or assumption of risks written by another insurer.
Large individual risk and catastrophe claims ratio
The aggregate of claims each with a net cost of $2.5 million or more as a percentage of net earned premium.
Lenders’ mortgage insurance (Lmi) A policy that protects the lender (e.g. a bank) against non-payment or default on a residential property loan.
Lead/non-lead underwriter A lead underwriter operates in the subscription market and sets the terms and price of a policy. The follower or non-lead is an underwriter of a syndicate or an insurance company that agrees to accept a proportion of a given risk on terms set by the lead underwriter.
Lender-placed insurance (LPi) Coverage obtained by the lender when the customer’s voluntary home building insurance has lapsed, been cancelled or proof of the customer’s insurance has not been received. Coverage is required by the mortgage contract to protect the lender’s interest in the property if damage was to occur and the customer had not maintained adequate coverage.
Letters of credit (Loc) Written undertaking by a financial institution to provide funding if required.
Lloyd’s Insurance and reinsurance market in London. It is not a company but is a society of individuals and corporate underwriting members.
Lloyd’s managing agent An underwriting agent which has permission from Lloyd’s to manage one or more syndicates and carry on underwriting and other functions for a member.
Long tail Classes of insurance business involving coverage for risks where notice of a claim may not be received for many years and claims may be outstanding for more than one year before they are finally quantifiable and settled by the insurer.
managing General Agent (mGA) A wholesale insurance agent with the authority to accept placements from (and often to appoint) retail agents on behalf of an insurer. MGAs generally provide underwriting and administrative services such as policy issuance on behalf of the insurers they represent. Some may handle claims.
maximum event retention (mer) An estimate of the largest claim to which an insurer will be exposed (taking into account the probability of that loss event at a return period of one in 250 years) due to a concentration of risk exposures, after netting off any potential reinsurance recoveries and inward and outward reinstatement premiums.
multi-peril crop scheme US federally regulated crop insurance protecting against crop yield losses by allowing participating insurers to insure a certain percentage of historical crop production.
Net claims incurred The amount of claims incurred during an accounting period after deducting reinsurance recoveries.
Net claims ratio Net claims incurred as a percentage of net earned premium.
Net earned premium (NeP) Net written premium adjusted by the change in net unearned premium for a year.
Net investment income Gross investment income net of foreign exchange gains and losses and investment expenses.
Net written premium (NwP) The total premium on insurance underwritten by an insurer during a specified period after the deduction of premium applicable to reinsurance.
outstanding claims provision The amount of provision established for claims and related claims expenses that have occurred but have not been paid.
Personal lines Insurance for individuals and families, such as private motor vehicle and homeowners insurance.
Policyholders’ funds Those financial assets held to fund the insurance provisions of the Group.
Premium Amount payable by the insured or reinsured in order to obtain insurance or reinsurance protection.
Prescribed capital Amount (PcA) This comprises the sum of the capital charges for asset risk, asset concentration risk, insurance concentration risk and operational risk as required by APRA. The PCA must be disclosed at least annually.
Probability of adequacy A statistical measure of the level of confidence that the outstanding claims provision will be sufficient to pay claims as and when they fall due.
QB
E In
suran
ce Gro
up
A
nn
ual rep
ort 20
12B
usin
ess rev
iew
2
Go
vern
ance
3
High
lights
& o
verv
iew
1
183D
irectors'
repo
rt
4
QB
E In
suran
ce Gro
up
A
nn
ual rep
ort 20
12B
usin
ess rev
iew
2
Go
vern
ance
3
High
lights
& o
verv
iew
1
Fin
ancial
repo
rt
5
Oth
er in
form
ation
6
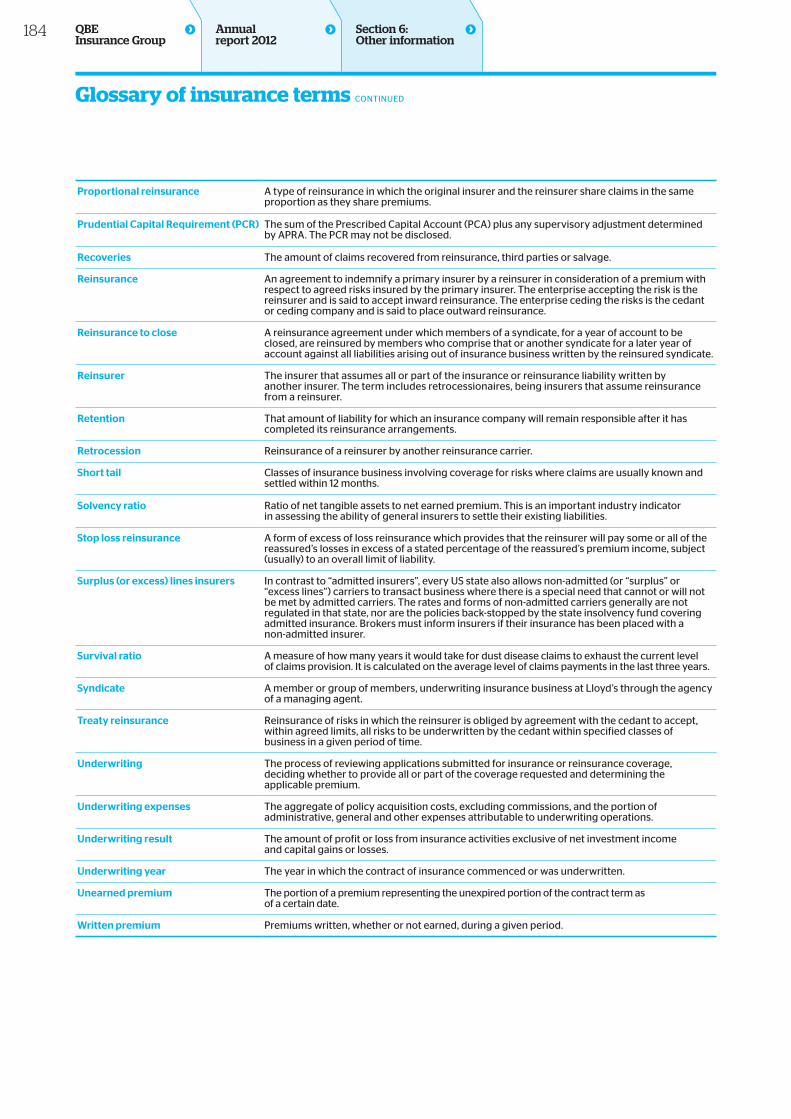
Proportional reinsurance A type of reinsurance in which the original insurer and the reinsurer share claims in the same proportion as they share premiums.
Prudential capital requirement (Pcr) The sum of the Prescribed Capital Account (PCA) plus any supervisory adjustment determined by APRA. The PCR may not be disclosed.
recoveries The amount of claims recovered from reinsurance, third parties or salvage.
reinsurance An agreement to indemnify a primary insurer by a reinsurer in consideration of a premium with respect to agreed risks insured by the primary insurer. The enterprise accepting the risk is the reinsurer and is said to accept inward reinsurance. The enterprise ceding the risks is the cedant or ceding company and is said to place outward reinsurance.
reinsurance to close A reinsurance agreement under which members of a syndicate, for a year of account to be closed, are reinsured by members who comprise that or another syndicate for a later year of account against all liabilities arising out of insurance business written by the reinsured syndicate.
reinsurer The insurer that assumes all or part of the insurance or reinsurance liability written by another insurer. The term includes retrocessionaires, being insurers that assume reinsurance from a reinsurer.
retention That amount of liability for which an insurance company will remain responsible after it has completed its reinsurance arrangements.
retrocession Reinsurance of a reinsurer by another reinsurance carrier.
short tail Classes of insurance business involving coverage for risks where claims are usually known and settled within 12 months.
solvency ratio Ratio of net tangible assets to net earned premium. This is an important industry indicator in assessing the ability of general insurers to settle their existing liabilities.
stop loss reinsurance A form of excess of loss reinsurance which provides that the reinsurer will pay some or all of the reassured’s losses in excess of a stated percentage of the reassured’s premium income, subject (usually) to an overall limit of liability.
surplus (or excess) lines insurers In contrast to “admitted insurers”, every US state also allows non-admitted (or “surplus” or “excess lines”) carriers to transact business where there is a special need that cannot or will not be met by admitted carriers. The rates and forms of non-admitted carriers generally are not regulated in that state, nor are the policies back-stopped by the state insolvency fund covering admitted insurance. Brokers must inform insurers if their insurance has been placed with a non-admitted insurer.
survival ratio A measure of how many years it would take for dust disease claims to exhaust the current level of claims provision. It is calculated on the average level of claims payments in the last three years.
syndicate A member or group of members, underwriting insurance business at Lloyd’s through the agency of a managing agent.
treaty reinsurance Reinsurance of risks in which the reinsurer is obliged by agreement with the cedant to accept, within agreed limits, all risks to be underwritten by the cedant within specified classes of business in a given period of time.
Underwriting The process of reviewing applications submitted for insurance or reinsurance coverage, deciding whether to provide all or part of the coverage requested and determining the applicable premium.
Underwriting expenses The aggregate of policy acquisition costs, excluding commissions, and the portion of administrative, general and other expenses attributable to underwriting operations.
Underwriting result The amount of profit or loss from insurance activities exclusive of net investment income and capital gains or losses.
Underwriting year The year in which the contract of insurance commenced or was underwritten.
Unearned premium The portion of a premium representing the unexpired portion of the contract term as of a certain date.
written premium Premiums written, whether or not earned, during a given period.
Section 6: Other information
Glossary of insurance terms CONTINUED
184 QBE Insurance Group
Annual report 2012

CreativestrategyanddesignbyShift • ProductionbyArmstrongQ

QBE Insurance Group Limited82 Pitt Street, Sydney NSW 2000 Australia
telephone +61 2 9375 4444 www.qbe.com
![QBE at a glance UK · QBE Insurance Group Limited A– [negative] A– [negative] bbb [negative] QBE Insurance (Europe) Limited A– [negative] a [negative] QBE Re (Europe) Limited](https://img.pdfslide.net/doc/110x75/5fa8e28b58047158406a3b4f/qbe-at-a-glance-uk-qbe-insurance-group-limited-aa-negative-aa-negative-bbb.jpg)