Embed Size (px)
Citation preview
ANALYSIS BASED ON NEW YORK FED CONSUMER CREDIT PANEL/EQUIFAX DATA
CENTER FOR MICROECONOMIC DATAW W W . N E W Y O R K F E D . O R G / M I C R O E C O N O M I C S
Q U A R T E R L Y R E P O R T O N
HOUSEHOLD DEBT AND CREDIT
2 0 1 8 : Q 2 ( R E L E A S E D A U G U S T 2 0 1 8 )
FEDERAL RESERVE BANK of NEW YORKR E S E A R C H A N D S TAT I S T I C S G R O U P
Household Debt and Credit Developments in 2018Q21
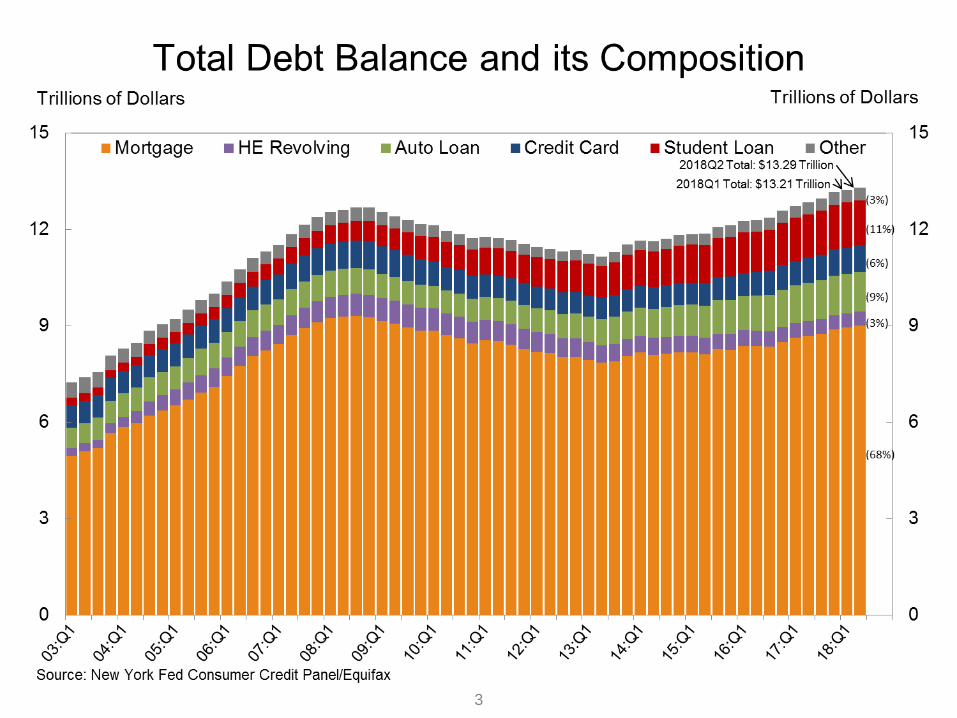
Aggregate household debt balances increased in the second quarter of 2018 for the 16th
consecutive quarter, and are now
$618 billion higher than the previous (2008Q3) peak of $12.68 trillion. As of June 30, 2018, total household indebtedness was $13.29
trillion, an $82 billion (0.6%) increase from the first quarter of 2018. Overall household debt is now 19.2% above the 2013Q2 trough.
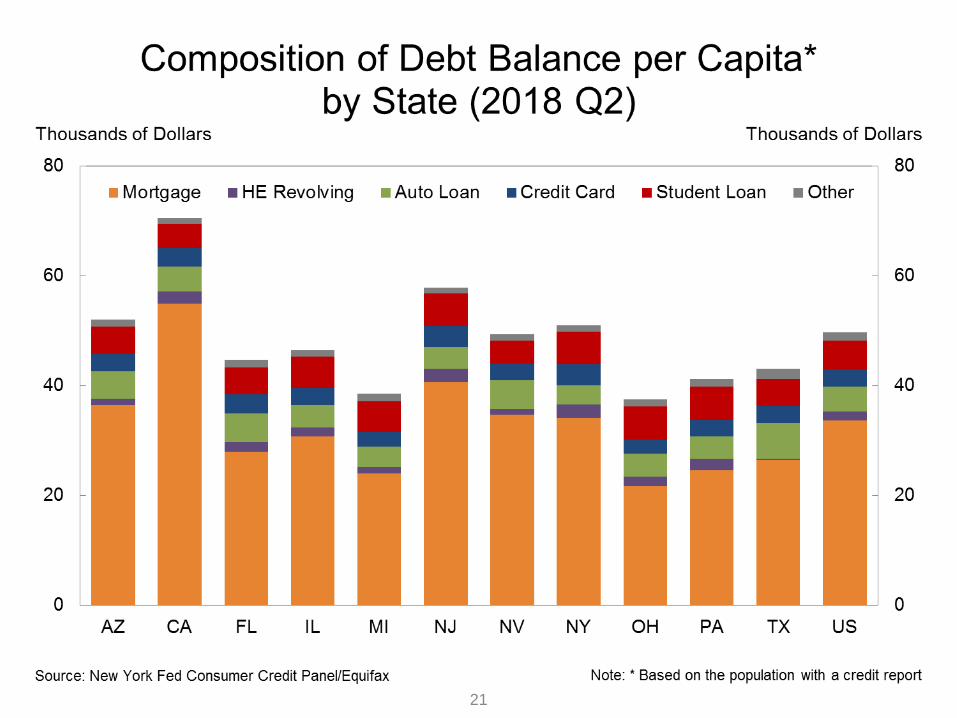
Mortgage balances, the largest component of household debt, increased slightly during the second quarter. Mortgage balances
shown on consumer credit reports on June 30 stood at $9.0 trillion, an increase of $60 billion from the first quarter of 2018. Balances
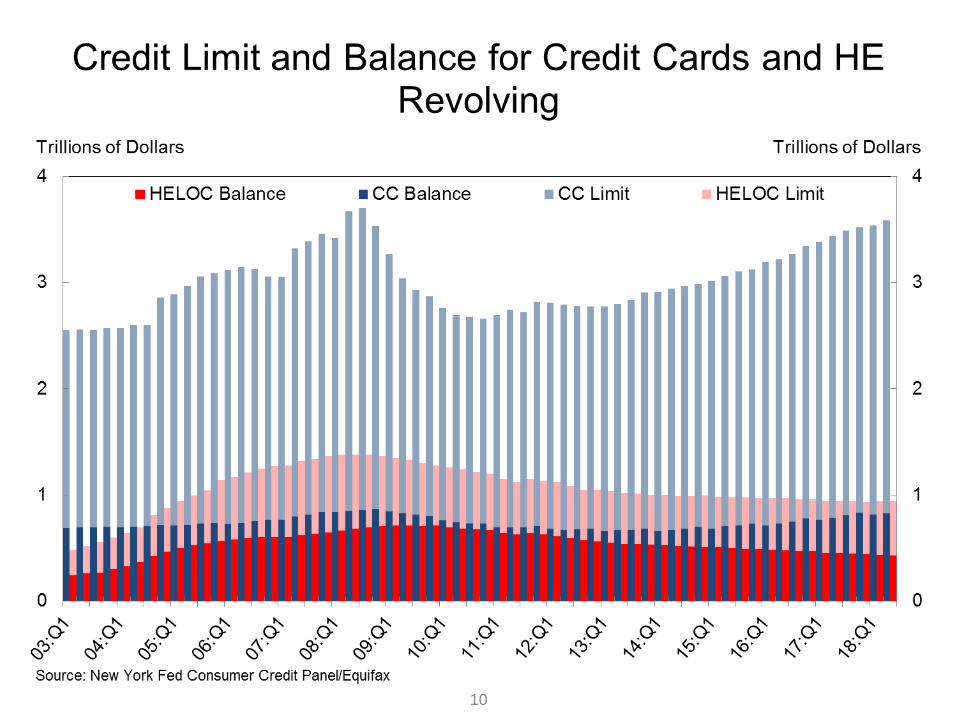
on home equity lines of credit (HELOC), on a declining trend since 2009, saw a $4 billion drop in the second quarter and are now at
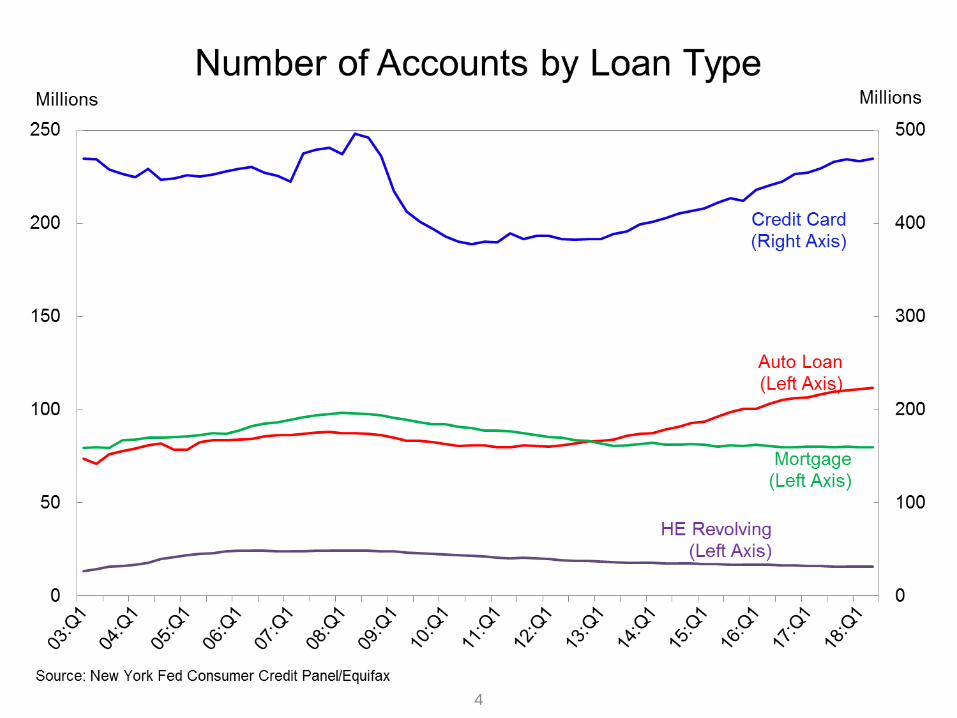
$432 billion. Non-housing balances saw a $26 billion increase in the second quarter, with auto loans and credit cards increasing by $9
billion and $14 billion respectively.
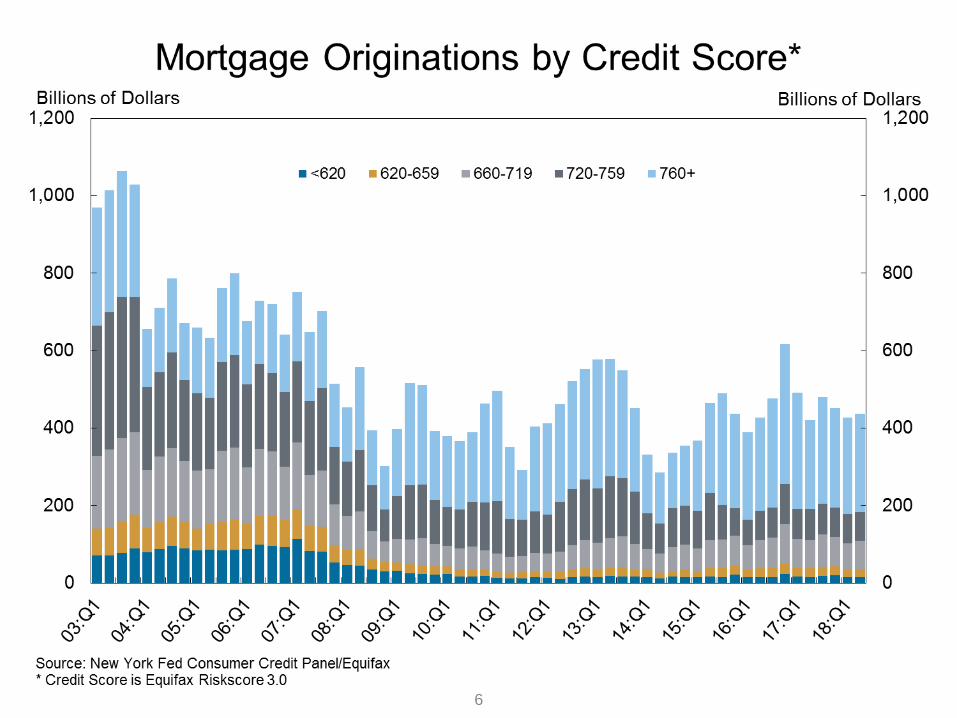
New extensions of credit for mortgage and auto loans increased in the second quarter. Mortgage originations, which we
measure as appearances of new mortgage balances on consumer credit reports and include refinanced mortgages, were at $437 billion,
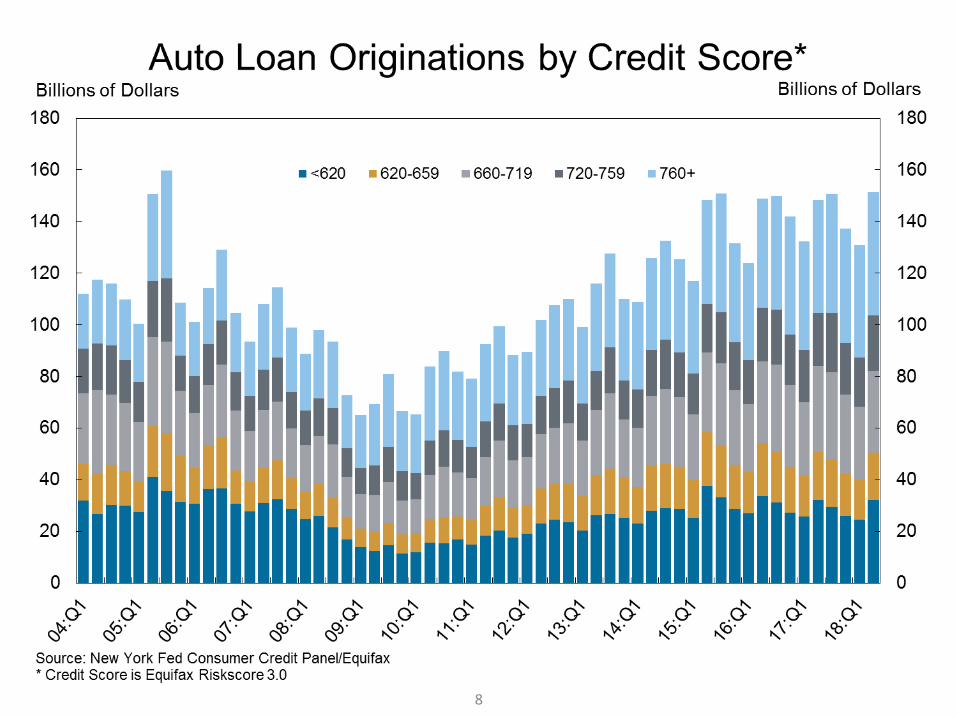
a small increase from 2018Q1. Mortgage originations have been relatively stable in the past six quarters. There were $151 billion in
auto loan originations in the second quarter of 2018, the highest quarterly amount seen since the high level reached in 2005,
continuing the nine year upward trend. The aggregate credit card limit rose for the 22nd
consecutive quarter, with a 1.4% increase.
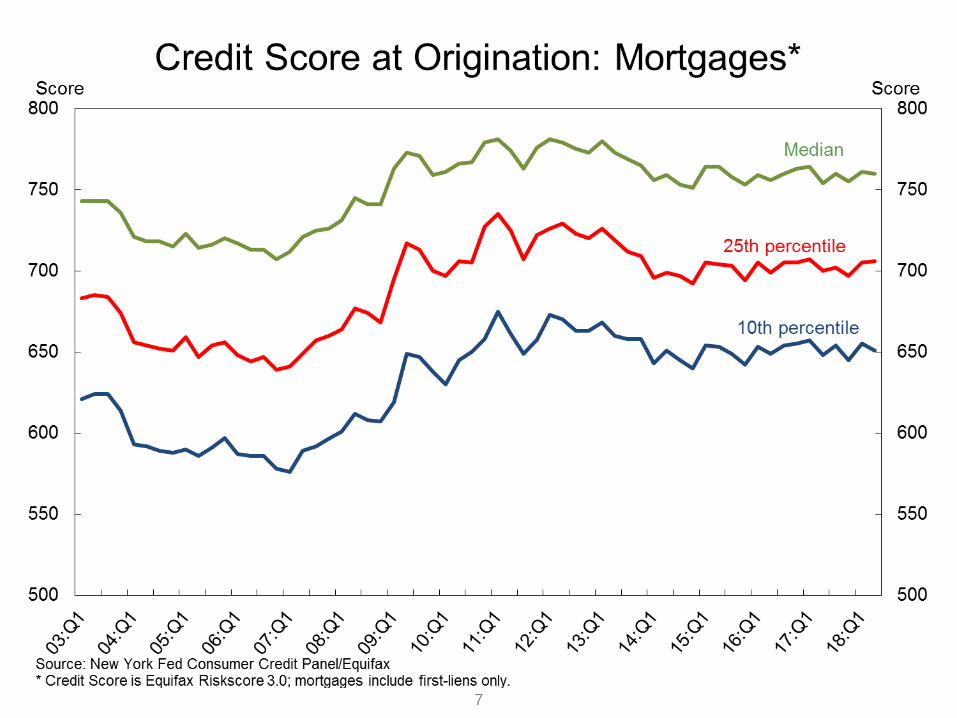
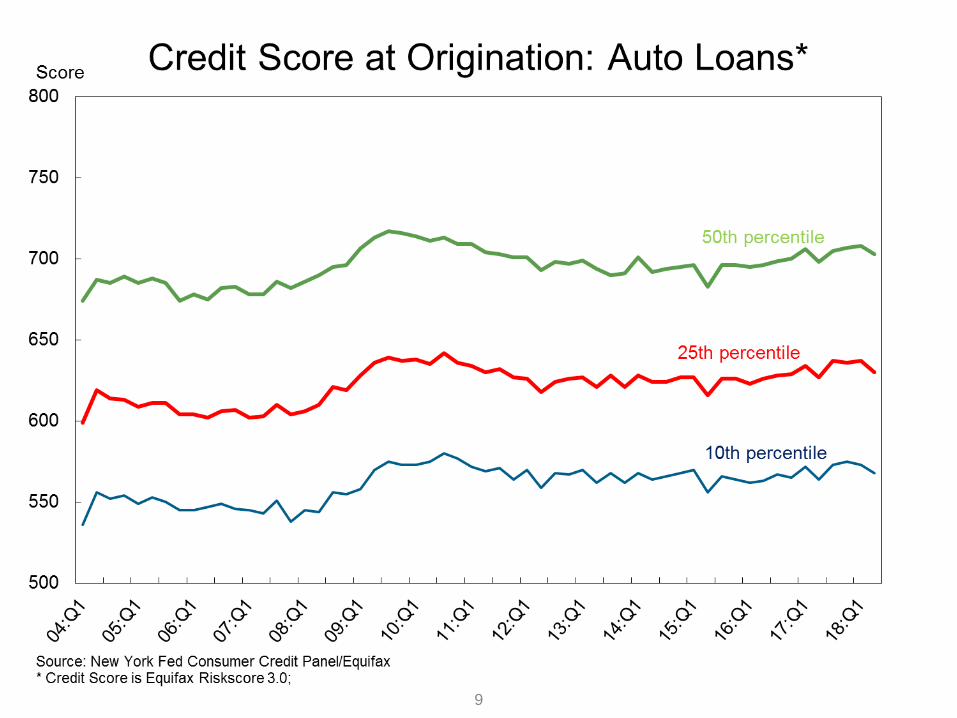
The median credit score of newly originating borrowers was roughly unchanged for mortgages. For auto loan originators, the
median score declined by 5 points, as individuals with subprime scores maintained a substantial share of newly originated auto loans.
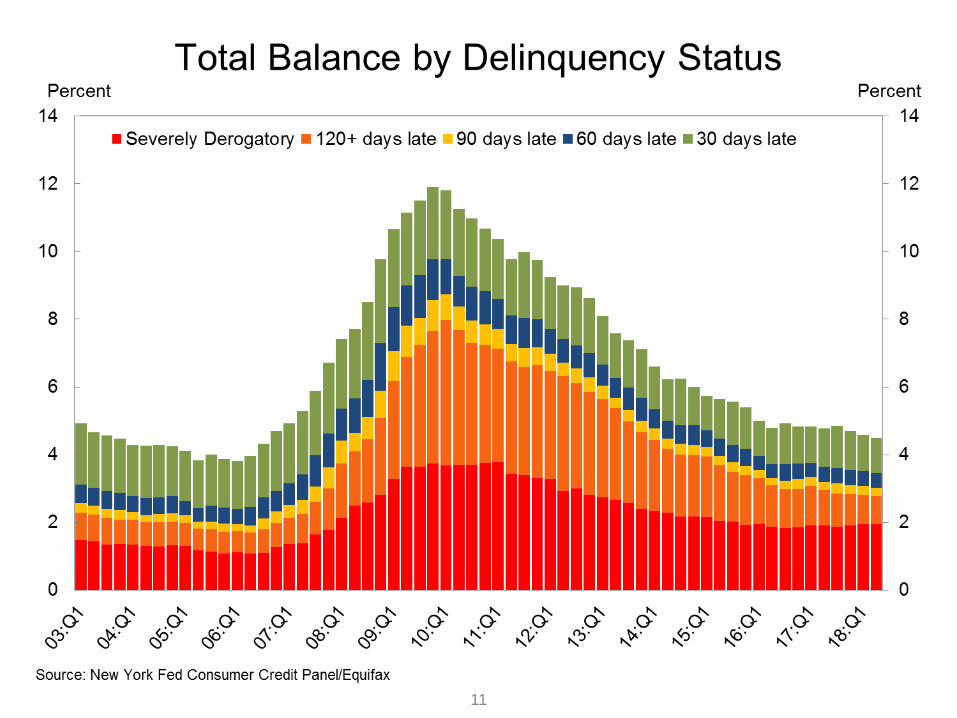
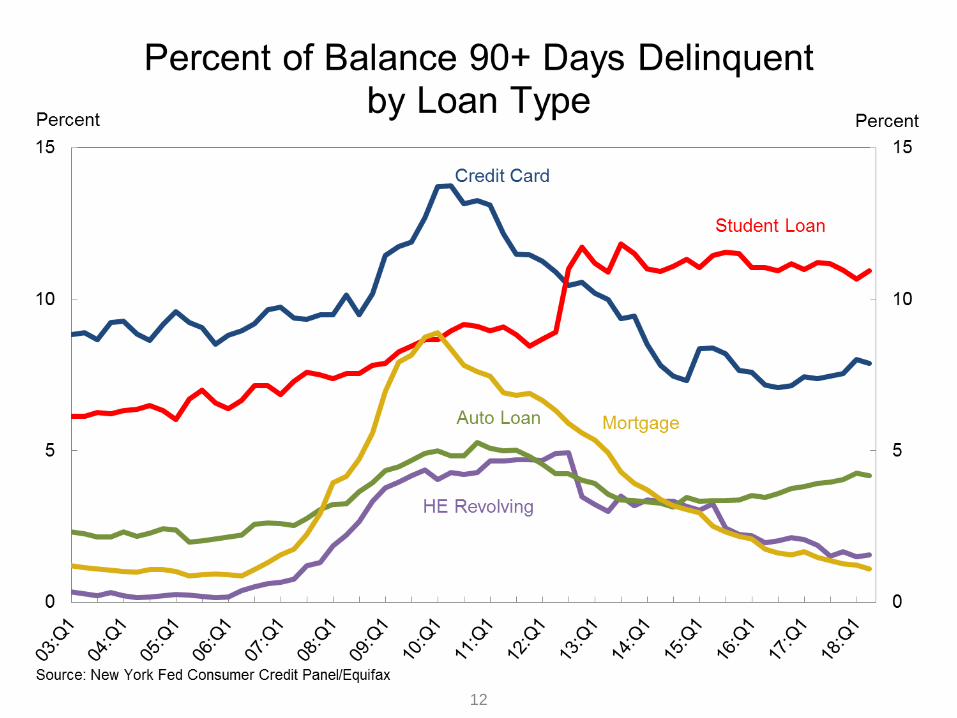
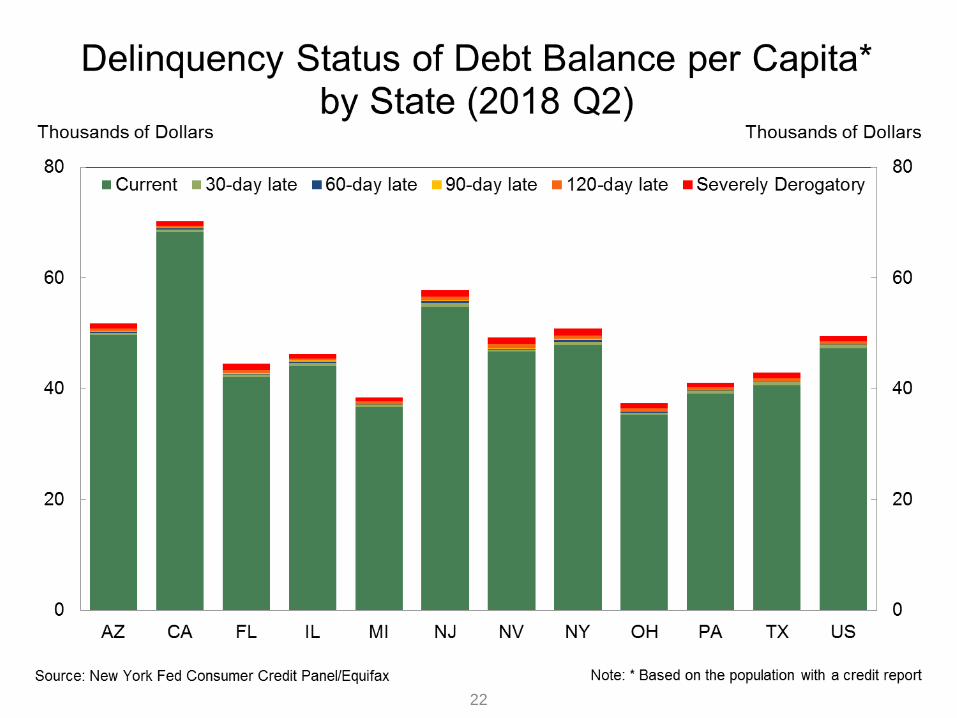
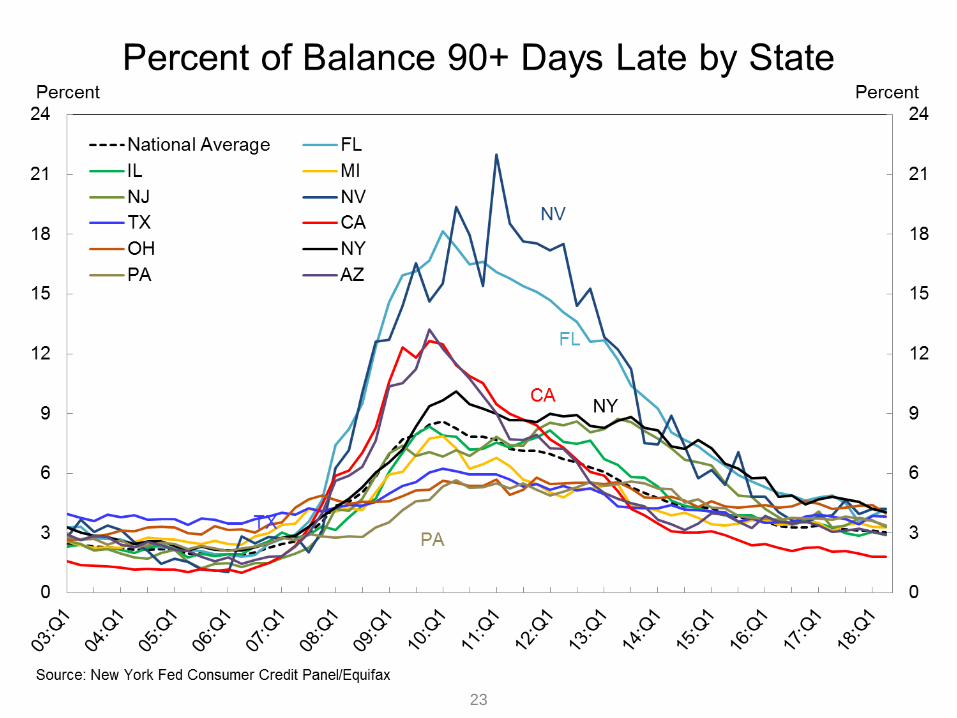
Aggregate delinquency rates improved in the second quarter of 2018. As of June 30, 4.5% of outstanding debt was in some
stage of delinquency, a very small improvement from the last quarter. Of the $598 billion of debt that is delinquent, $403 billion is
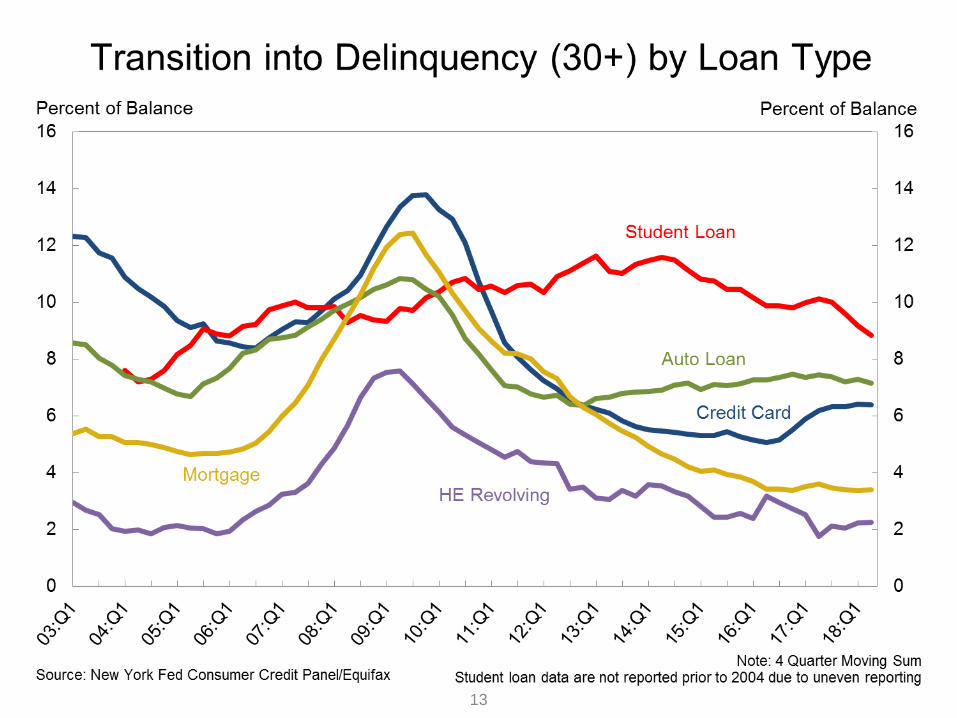
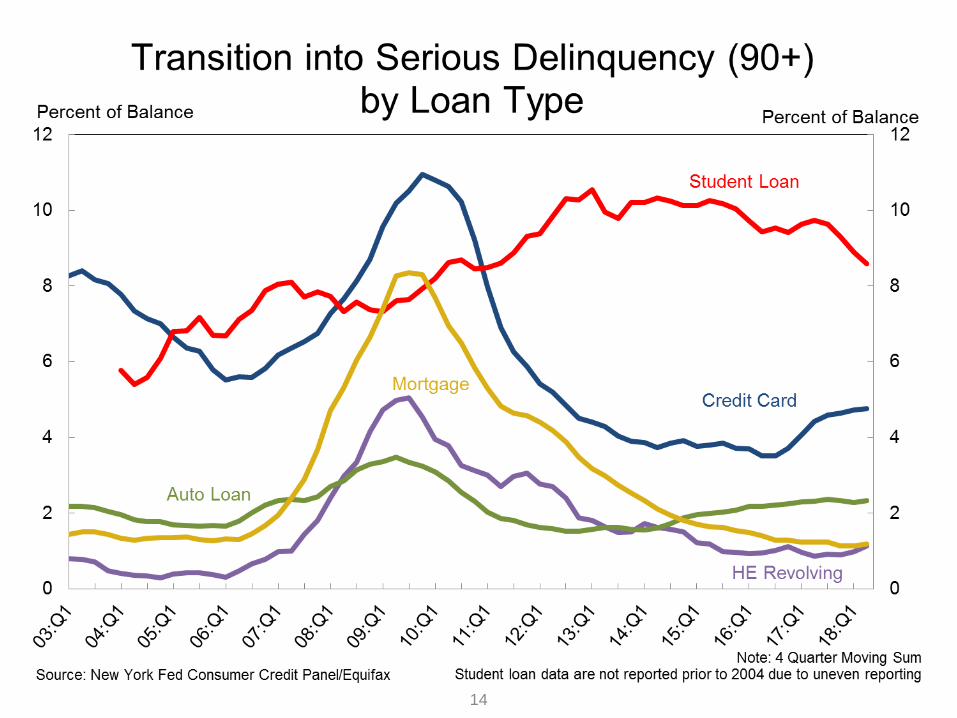
seriously delinquent (at least 90 days late or “severely derogatory”). The flow into 90+ day delinquency for credit card balances has
been rising for the last year and remained elevated during the second quarter, while the flow into 90+ day delinquency for auto loan
balances has been slowly trending upward since 2012.
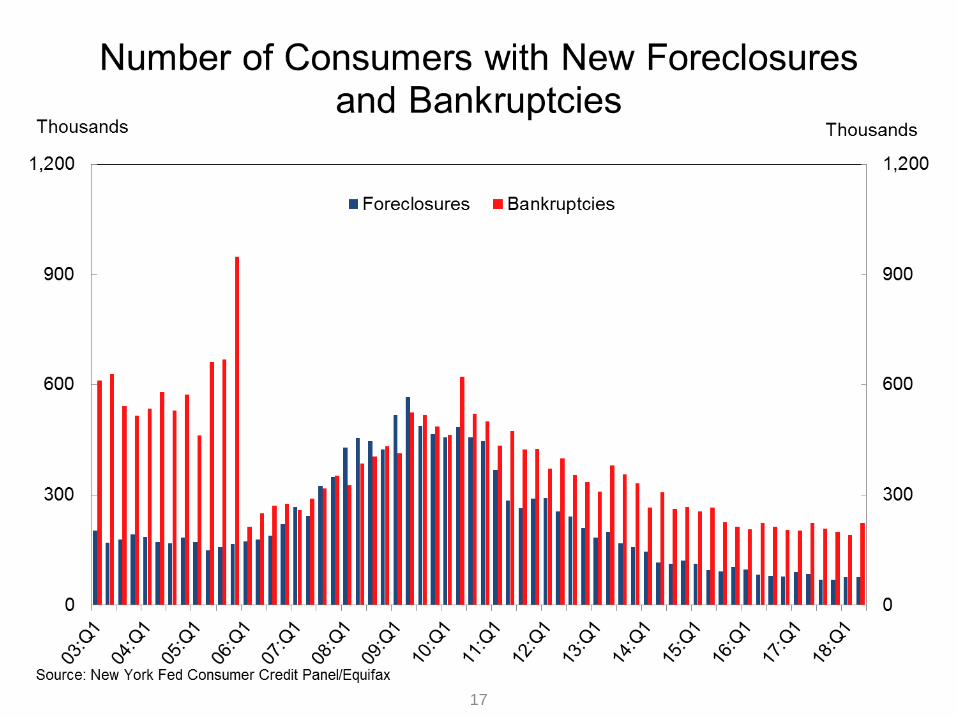
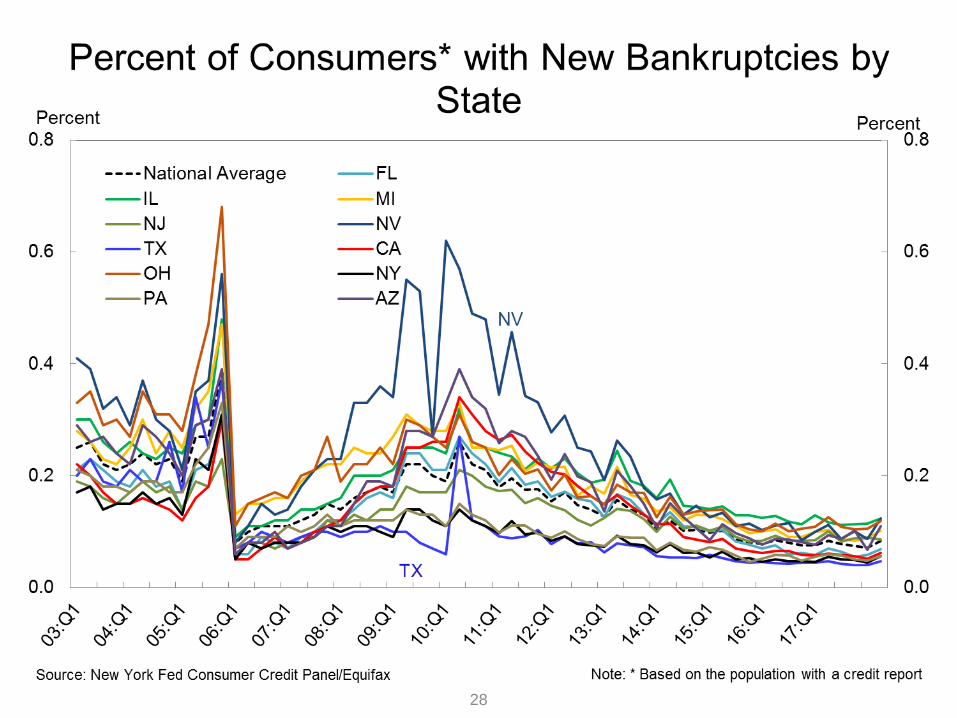
About 225,000 consumers had a bankruptcy notation added to their credit reports in 2018Q2, about the same number
observed in the same quarter of last year. New bankruptcy notations have been at historically low levels since 2016.
Housing Debt
There was $437 billion in newly originated mortgage debt in 2018Q2.
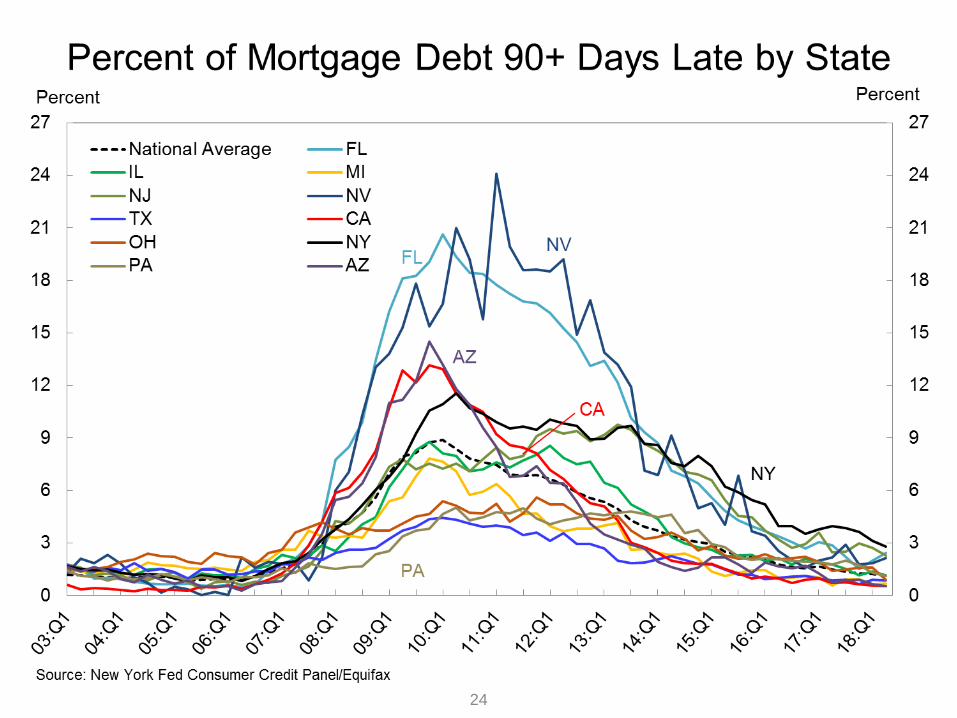
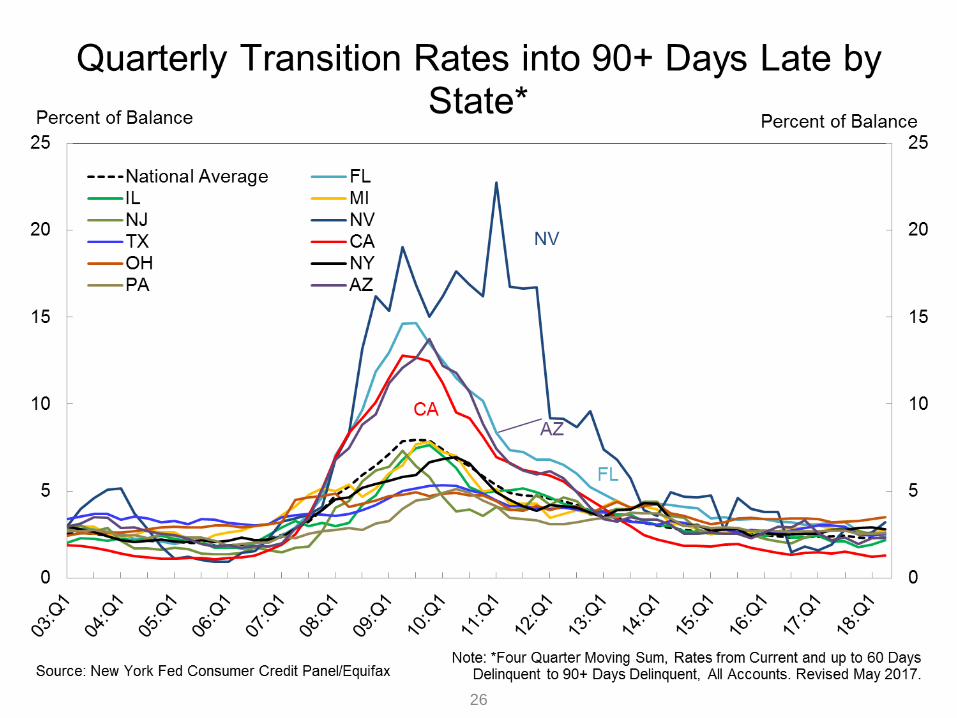
Mortgage delinquencies continued to improve, with 1.1% of mortgage balances 90 or more days delinquent in 2018Q2.
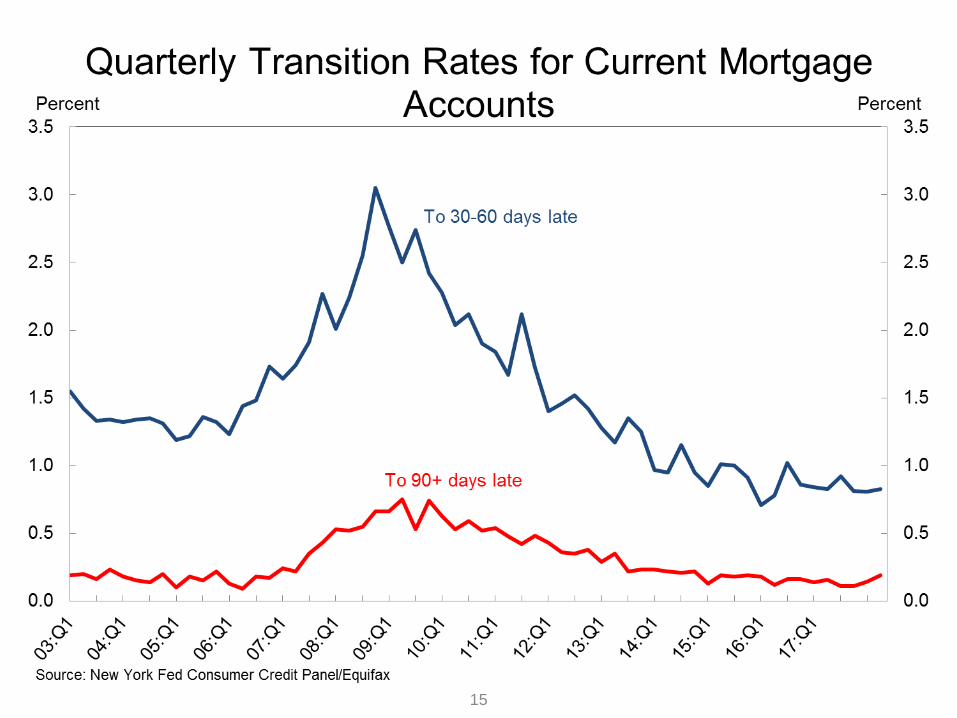
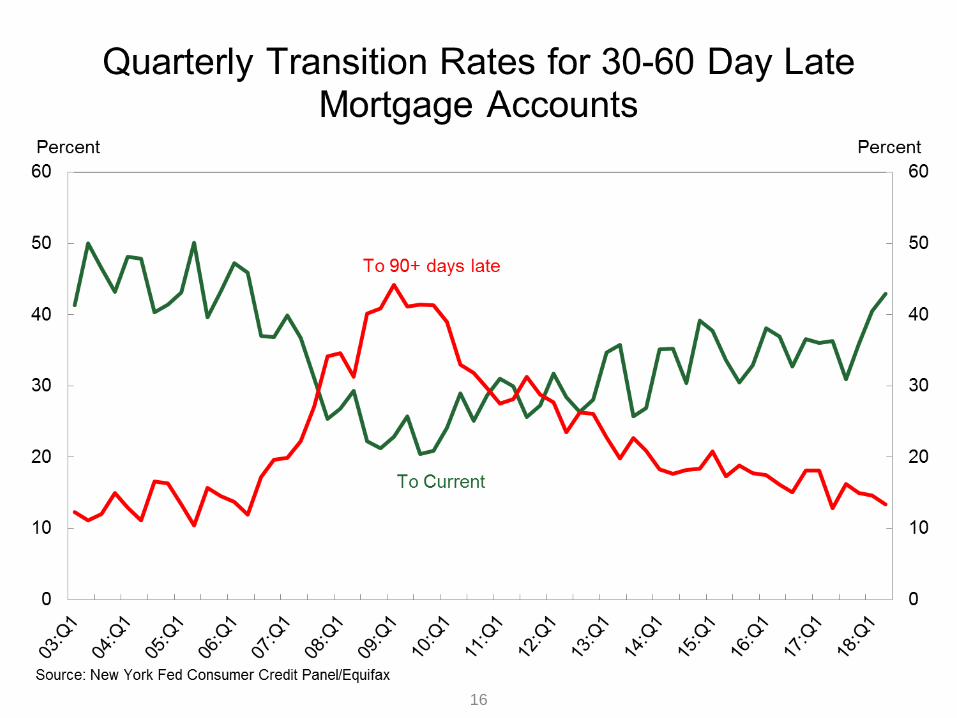
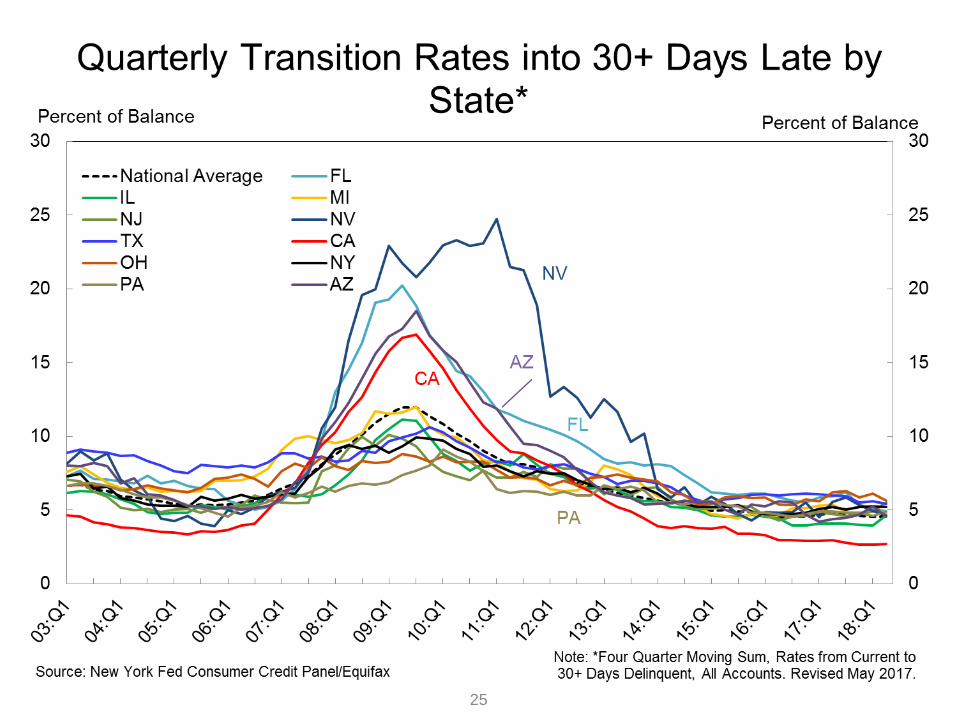
Delinquency transition rates for current mortgage balances were stable, with about 1.0% of current balances transitioning to
delinquency. There was some improvement of transitions from early delinquency, as 13.4 of mortgages in early delinquency (30-
60 days late) transitioned to 90+ days delinquent, an improvement on the previous quarter’s 14.7% transition rate. The share of
mortgages in early delinquency that “cured” improved to 42.9%, from 40.5% in the 1st quarter and from 35.9% in the 4
th quarter
of 2017.
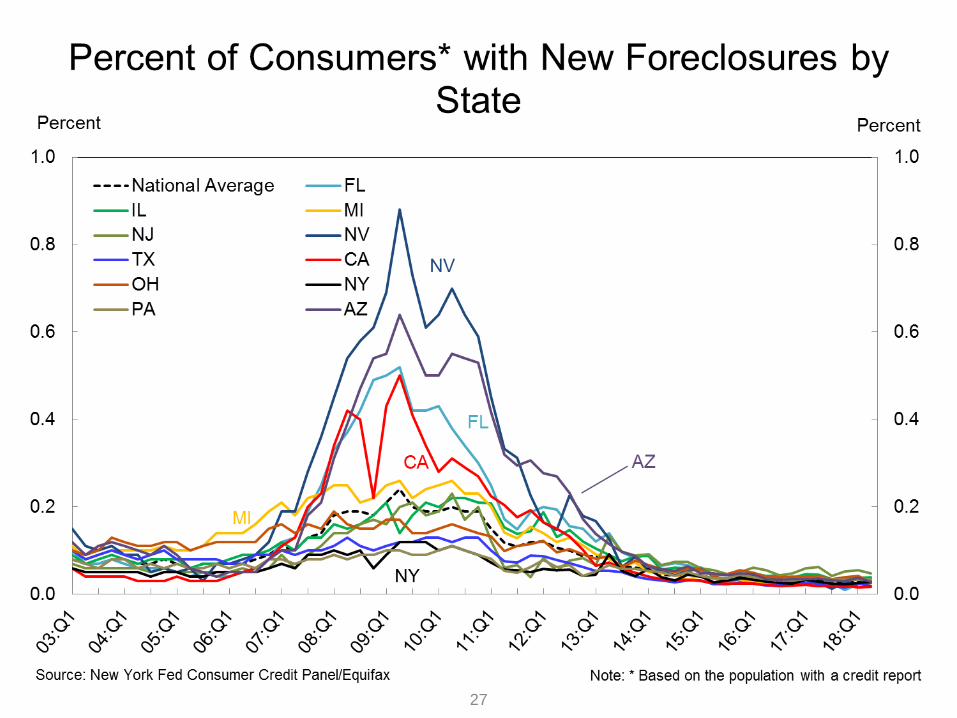
About 76,000 individuals had a new foreclosure notation added to their credit reports between April 1 and June 30, unchanged
from the previous quarter. Foreclosures remain very low by historical standards.
Student Loans
Outstanding student loan debt fell by $2 billion in the second quarter, and stood at $1.41 trillion as of June 30, 2018.
10.9% of aggregate student debt was 90+ days delinquent or in default in 2018Q2, a small increase from the prior quarter, but 2.5%
lower than in 2017Q2.2 Transition rates into delinquency have fallen noticeably for student debt over the past year.
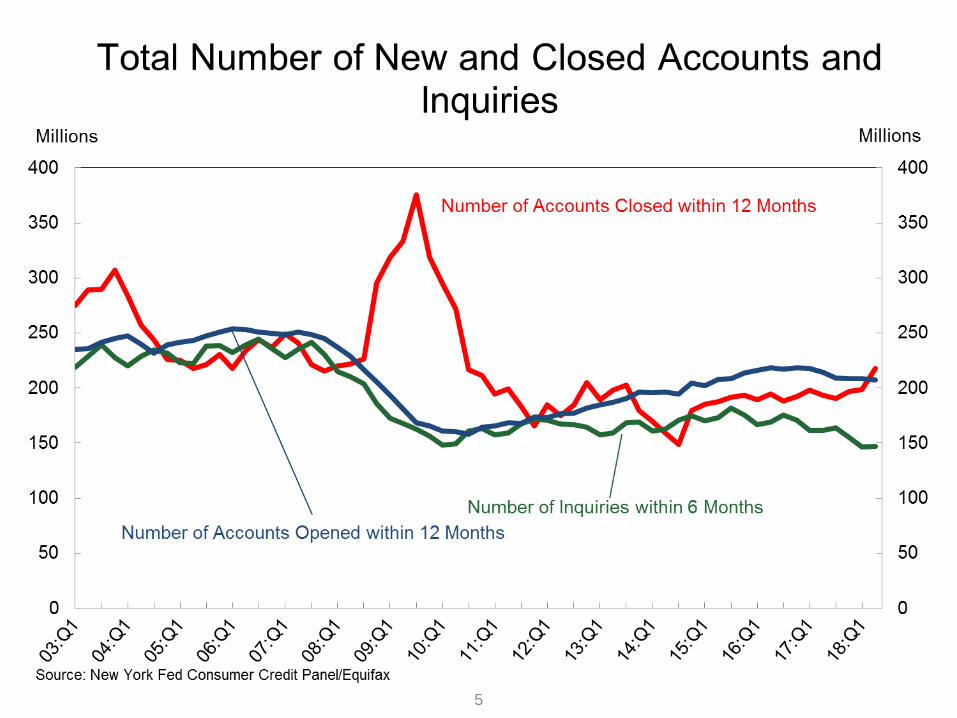
Account Closings, Credit Inquiries and Collection Accounts
There was a noticeable uptick in account closings over the past year to 218 million, a 9.7% increase from its 2018Q1 level.
The number of credit inquiries within the past six months – an indicator of consumer credit demand –was roughly flat, and
remains among the lowest seen in the 19 year history of the data.
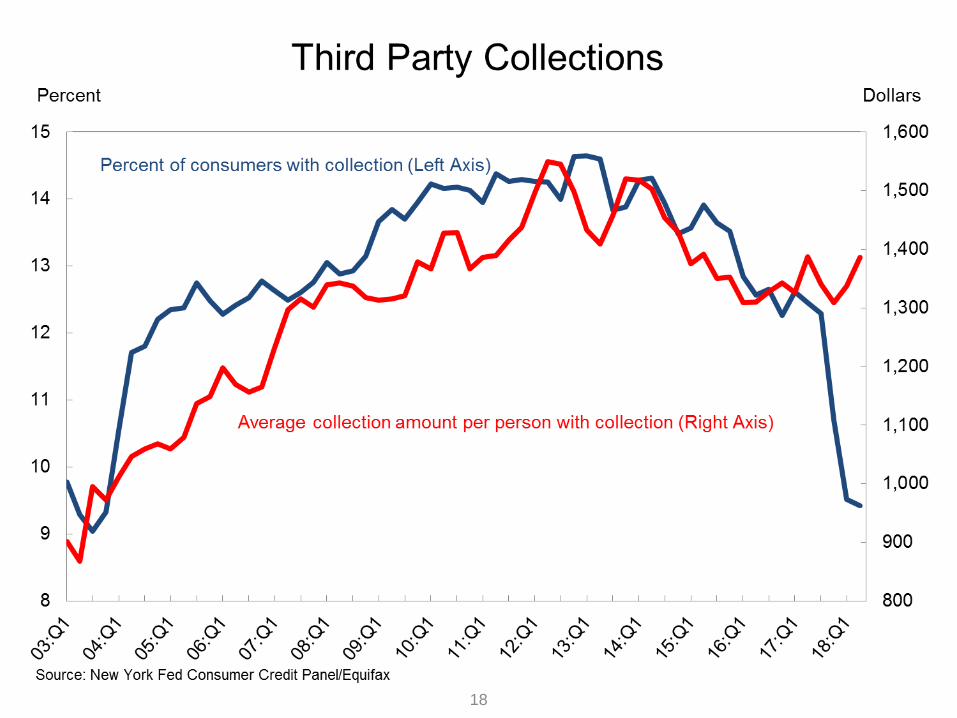
The percent of consumers with an account in collections declined significantly between the 4th
quarter of 2017 and 2nd
quarter of
2018, due to changes in reporting requirements of collections agencies.
1 This report is based on the New York Fed Consumer Credit Panel, which is constructed from a nationally representative random sample drawn from Equifax credit
report data. For details on the data set and the measures reported here, see the data dictionary available at the end of this report. Please contact Joelle Scally with questions at [email protected]
As explained in a 2012 report, delinquency rates for student loans are likely to understate effective delinquency rates because about half of these loans are currently in
deferment, in grace periods or in forbearance and therefore temporarily not in the repayment cycle. This implies that among loans in the repayment cycle delinquency rates are roughly twice as high.

Page Left Blank Intentionally 1

NATIONAL CHARTS
2
3
4
5
6
7
8
9
10
11
12
13
14
15
16
17
18

CHARTS FOR SELECT STATES
19
20
21
22
23
24
25
26
27
28
Data Dictionary
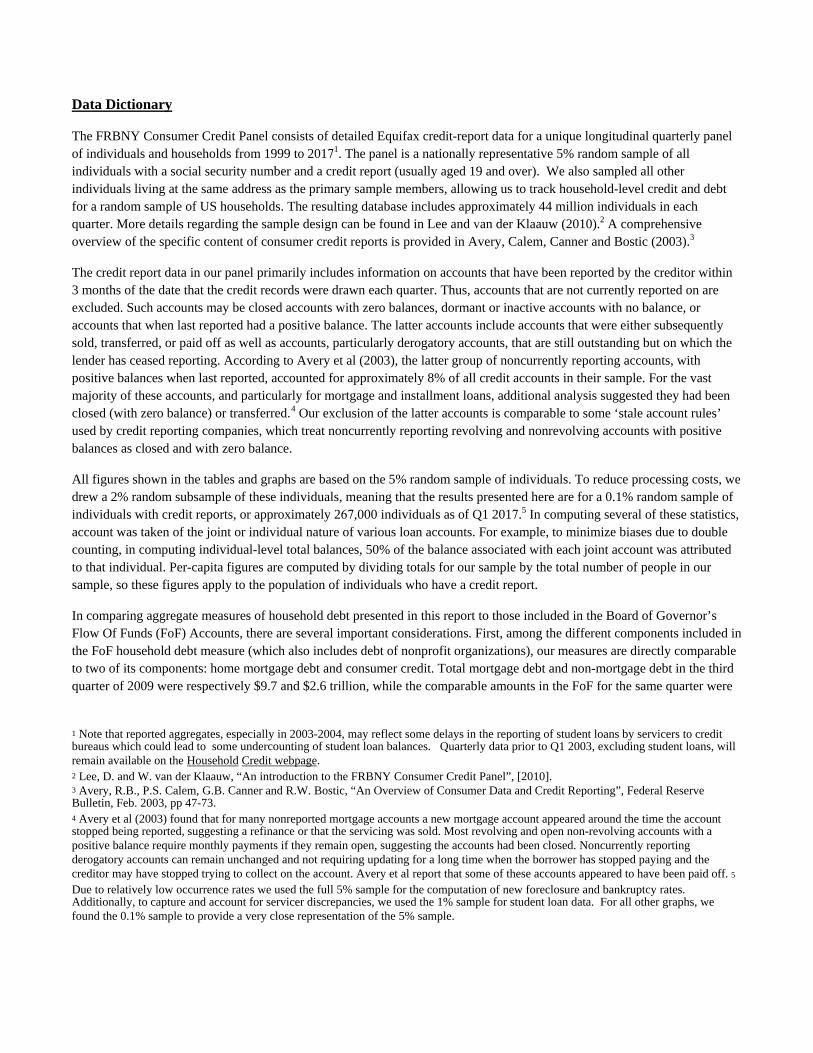
The FRBNY Consumer Credit Panel consists of detailed Equifax credit-report data for a unique longitudinal quarterly panel of individuals and households from 1999 to 20171. The panel is a nationally representative 5% random sample of all individuals with a social security number and a credit report (usually aged 19 and over). We also sampled all other individuals living at the same address as the primary sample members, allowing us to track household-level credit and debt for a random sample of US households. The resulting database includes approximately 44 million individuals in each quarter. More details regarding the sample design can be found in Lee and van der Klaauw (2010).2 A comprehensive overview of the specific content of consumer credit reports is provided in Avery, Calem, Canner and Bostic (2003).3
The credit report data in our panel primarily includes information on accounts that have been reported by the creditor within 3 months of the date that the credit records were drawn each quarter. Thus, accounts that are not currently reported on are excluded. Such accounts may be closed accounts with zero balances, dormant or inactive accounts with no balance, or accounts that when last reported had a positive balance. The latter accounts include accounts that were either subsequently sold, transferred, or paid off as well as accounts, particularly derogatory accounts, that are still outstanding but on which the lender has ceased reporting. According to Avery et al (2003), the latter group of noncurrently reporting accounts, with positive balances when last reported, accounted for approximately 8% of all credit accounts in their sample. For the vast majority of these accounts, and particularly for mortgage and installment loans, additional analysis suggested they had been closed (with zero balance) or transferred.4 Our exclusion of the latter accounts is comparable to some ‘stale account rules’ used by credit reporting companies, which treat noncurrently reporting revolving and nonrevolving accounts with positive balances as closed and with zero balance.
All figures shown in the tables and graphs are based on the 5% random sample of individuals. To reduce processing costs, we drew a 2% random subsample of these individuals, meaning that the results presented here are for a 0.1% random sample of individuals with credit reports, or approximately 267,000 individuals as of Q1 2017.5 In computing several of these statistics, account was taken of the joint or individual nature of various loan accounts. For example, to minimize biases due to double counting, in computing individual-level total balances, 50% of the balance associated with each joint account was attributed to that individual. Per-capita figures are computed by dividing totals for our sample by the total number of people in our sample, so these figures apply to the population of individuals who have a credit report.
In comparing aggregate measures of household debt presented in this report to those included in the Board of Governor’s Flow Of Funds (FoF) Accounts, there are several important considerations. First, among the different components included in the FoF household debt measure (which also includes debt of nonprofit organizations), our measures are directly comparable to two of its components: home mortgage debt and consumer credit. Total mortgage debt and non-mortgage debt in the third quarter of 2009 were respectively $9.7 and $2.6 trillion, while the comparable amounts in the FoF for the same quarter were
1 Note that reported aggregates, especially in 2003-2004, may reflect some delays in the reporting of student loans by servicers to credit bureaus which could lead to some undercounting of student loan balances. Quarterly data prior to Q1 2003, excluding student loans, will remain available on the Household Credit webpage. 2 Lee, D. and W. van der Klaauw, “An introduction to the FRBNY Consumer Credit Panel”, [2010]. 3 Avery, R.B., P.S. Calem, G.B. Canner and R.W. Bostic, “An Overview of Consumer Data and Credit Reporting”, Federal Reserve Bulletin, Feb. 2003, pp 47-73. 4 Avery et al (2003) found that for many nonreported mortgage accounts a new mortgage account appeared around the time the account stopped being reported, suggesting a refinance or that the servicing was sold. Most revolving and open non-revolving accounts with a positive balance require monthly payments if they remain open, suggesting the accounts had been closed. Noncurrently reporting derogatory accounts can remain unchanged and not requiring updating for a long time when the borrower has stopped paying and the creditor may have stopped trying to collect on the account. Avery et al report that some of these accounts appeared to have been paid off. 5 Due to relatively low occurrence rates we used the full 5% sample for the computation of new foreclosure and bankruptcy rates. Additionally, to capture and account for servicer discrepancies, we used the 1% sample for student loan data. For all other graphs, we found the 0.1% sample to provide a very close representation of the 5% sample.
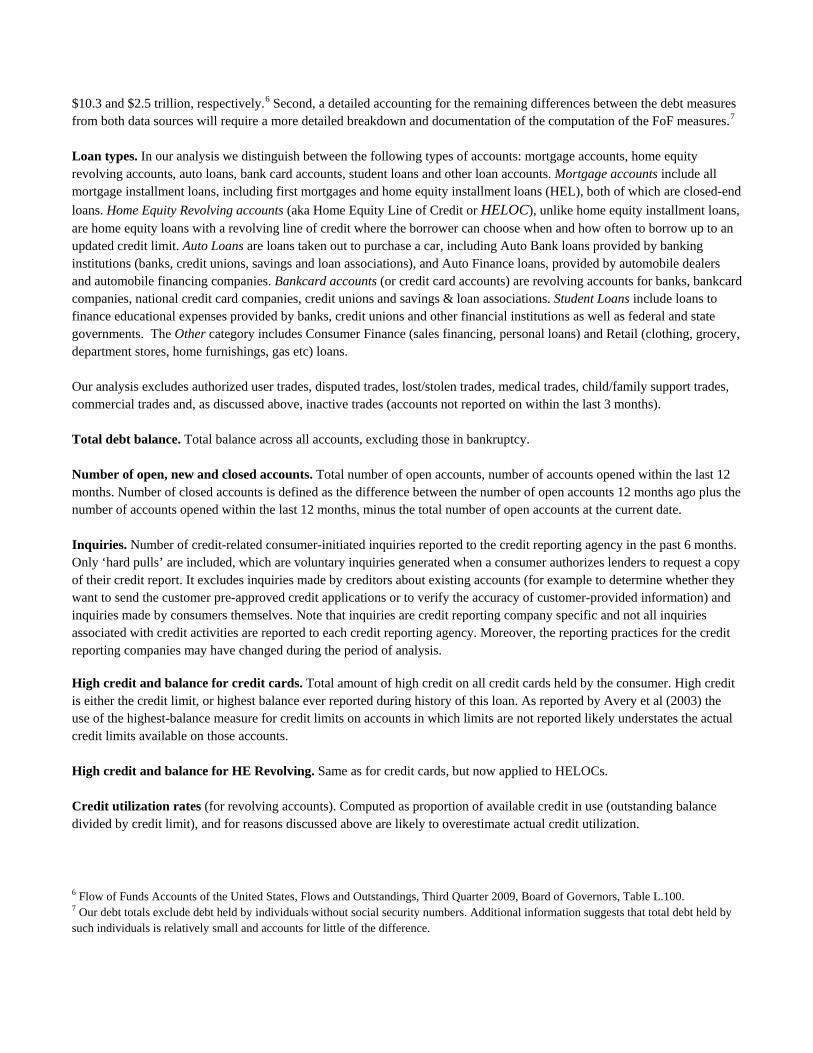
$10.3 and $2.5 trillion, respectively.6 Second, a detailed accounting for the remaining differences between the debt measures from both data sources will require a more detailed breakdown and documentation of the computation of the FoF measures.7
Loan types. In our analysis we distinguish between the following types of accounts: mortgage accounts, home equity revolving accounts, auto loans, bank card accounts, student loans and other loan accounts. Mortgage accounts include all mortgage installment loans, including first mortgages and home equity installment loans (HEL), both of which are closed-end
loans. Home Equity Revolving accounts (aka Home Equity Line of Credit or HELOC), unlike home equity installment loans, are home equity loans with a revolving line of credit where the borrower can choose when and how often to borrow up to an updated credit limit. Auto Loans are loans taken out to purchase a car, including Auto Bank loans provided by banking institutions (banks, credit unions, savings and loan associations), and Auto Finance loans, provided by automobile dealers and automobile financing companies. Bankcard accounts (or credit card accounts) are revolving accounts for banks, bankcard companies, national credit card companies, credit unions and savings & loan associations. Student Loans include loans to finance educational expenses provided by banks, credit unions and other financial institutions as well as federal and state governments. The Other category includes Consumer Finance (sales financing, personal loans) and Retail (clothing, grocery, department stores, home furnishings, gas etc) loans.
Our analysis excludes authorized user trades, disputed trades, lost/stolen trades, medical trades, child/family support trades, commercial trades and, as discussed above, inactive trades (accounts not reported on within the last 3 months).
Total debt balance. Total balance across all accounts, excluding those in bankruptcy.
Number of open, new and closed accounts. Total number of open accounts, number of accounts opened within the last 12 months. Number of closed accounts is defined as the difference between the number of open accounts 12 months ago plus the number of accounts opened within the last 12 months, minus the total number of open accounts at the current date.
Inquiries. Number of credit-related consumer-initiated inquiries reported to the credit reporting agency in the past 6 months. Only ‘hard pulls’ are included, which are voluntary inquiries generated when a consumer authorizes lenders to request a copy of their credit report. It excludes inquiries made by creditors about existing accounts (for example to determine whether they want to send the customer pre-approved credit applications or to verify the accuracy of customer-provided information) and inquiries made by consumers themselves. Note that inquiries are credit reporting company specific and not all inquiries associated with credit activities are reported to each credit reporting agency. Moreover, the reporting practices for the credit reporting companies may have changed during the period of analysis.
High credit and balance for credit cards. Total amount of high credit on all credit cards held by the consumer. High credit is either the credit limit, or highest balance ever reported during history of this loan. As reported by Avery et al (2003) the use of the highest-balance measure for credit limits on accounts in which limits are not reported likely understates the actual credit limits available on those accounts.
High credit and balance for HE Revolving. Same as for credit cards, but now applied to HELOCs.
Credit utilization rates (for revolving accounts). Computed as proportion of available credit in use (outstanding balance divided by credit limit), and for reasons discussed above are likely to overestimate actual credit utilization.
6 Flow of Funds Accounts of the United States, Flows and Outstandings, Third Quarter 2009, Board of Governors, Table L.100. 7 Our debt totals exclude debt held by individuals without social security numbers. Additional information suggests that total debt held by such individuals is relatively small and accounts for little of the difference.
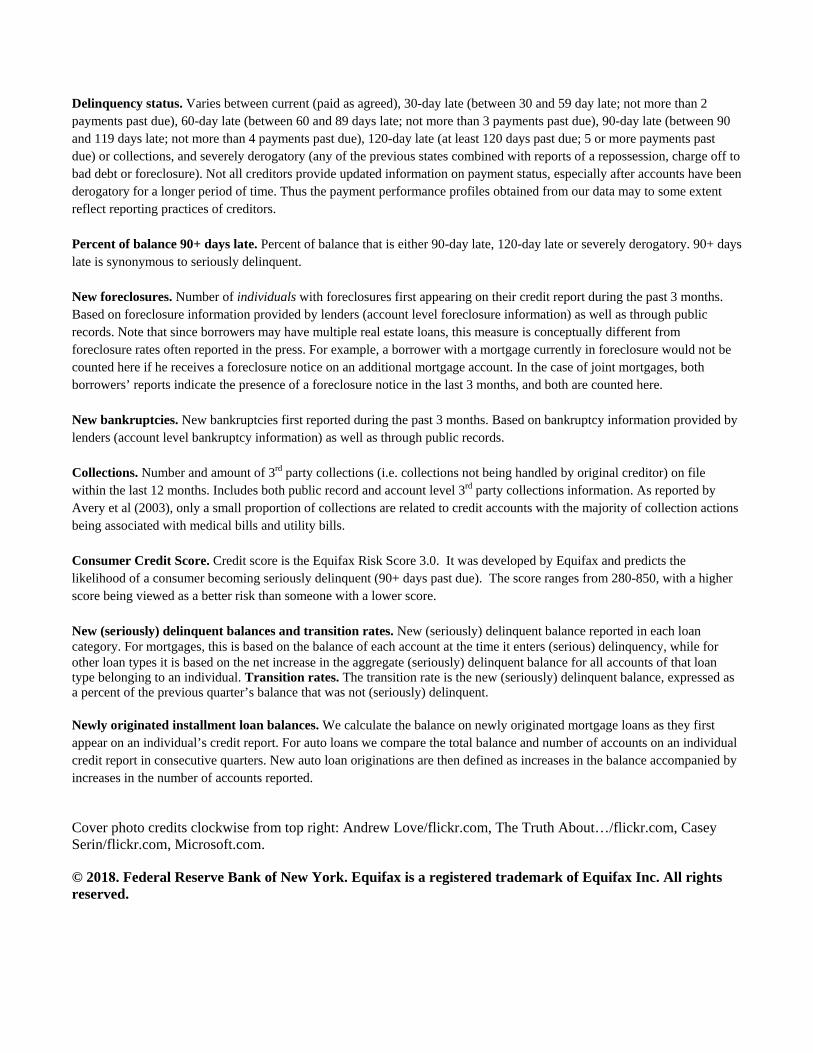
Delinquency status. Varies between current (paid as agreed), 30-day late (between 30 and 59 day late; not more than 2 payments past due), 60-day late (between 60 and 89 days late; not more than 3 payments past due), 90-day late (between 90 and 119 days late; not more than 4 payments past due), 120-day late (at least 120 days past due; 5 or more payments past due) or collections, and severely derogatory (any of the previous states combined with reports of a repossession, charge off to bad debt or foreclosure). Not all creditors provide updated information on payment status, especially after accounts have been derogatory for a longer period of time. Thus the payment performance profiles obtained from our data may to some extent reflect reporting practices of creditors.
Percent of balance 90+ days late. Percent of balance that is either 90-day late, 120-day late or severely derogatory. 90+ days late is synonymous to seriously delinquent.
New foreclosures. Number of individuals with foreclosures first appearing on their credit report during the past 3 months. Based on foreclosure information provided by lenders (account level foreclosure information) as well as through public records. Note that since borrowers may have multiple real estate loans, this measure is conceptually different from foreclosure rates often reported in the press. For example, a borrower with a mortgage currently in foreclosure would not be counted here if he receives a foreclosure notice on an additional mortgage account. In the case of joint mortgages, both borrowers’ reports indicate the presence of a foreclosure notice in the last 3 months, and both are counted here.
New bankruptcies. New bankruptcies first reported during the past 3 months. Based on bankruptcy information provided by lenders (account level bankruptcy information) as well as through public records.
Collections. Number and amount of 3rd party collections (i.e. collections not being handled by original creditor) on file within the last 12 months. Includes both public record and account level 3rd party collections information. As reported by Avery et al (2003), only a small proportion of collections are related to credit accounts with the majority of collection actions being associated with medical bills and utility bills.
Consumer Credit Score. Credit score is the Equifax Risk Score 3.0. It was developed by Equifax and predicts the likelihood of a consumer becoming seriously delinquent (90+ days past due). The score ranges from 280-850, with a higher score being viewed as a better risk than someone with a lower score.
New (seriously) delinquent balances and transition rates. New (seriously) delinquent balance reported in each loan category. For mortgages, this is based on the balance of each account at the time it enters (serious) delinquency, while for other loan types it is based on the net increase in the aggregate (seriously) delinquent balance for all accounts of that loan type belonging to an individual. Transition rates. The transition rate is the new (seriously) delinquent balance, expressed as a percent of the previous quarter’s balance that was not (seriously) delinquent.
Newly originated installment loan balances. We calculate the balance on newly originated mortgage loans as they first appear on an individual’s credit report. For auto loans we compare the total balance and number of accounts on an individual credit report in consecutive quarters. New auto loan originations are then defined as increases in the balance accompanied by increases in the number of accounts reported.
Cover photo credits clockwise from top right: Andrew Love/flickr.com, The Truth About…/flickr.com, Casey Serin/flickr.com, Microsoft.com.
© 2018. Federal Reserve Bank of New York. Equifax is a registered trademark of Equifax Inc. All rights reserved.