Embed Size (px)
Citation preview
QUALITIES OF DEMOCRACY IN LATIN AMERICA
Economic Policies and Governmental Performance

OPTIONAL PAPER• 10+- pages in length• Due in class on Wednesday, May 25• Topic: Anything related to course (but get
clearance from TA)• Approach: An analytical “think piece,” not an
exhaustive research paper• Define a problem, frame a question, explain
evidence and sources, and answer the question you pose at the outset
READING
• Smith, Democracy, ch. 8
• Modern Latin America, chs. 9, 11, 12
OUTLINE
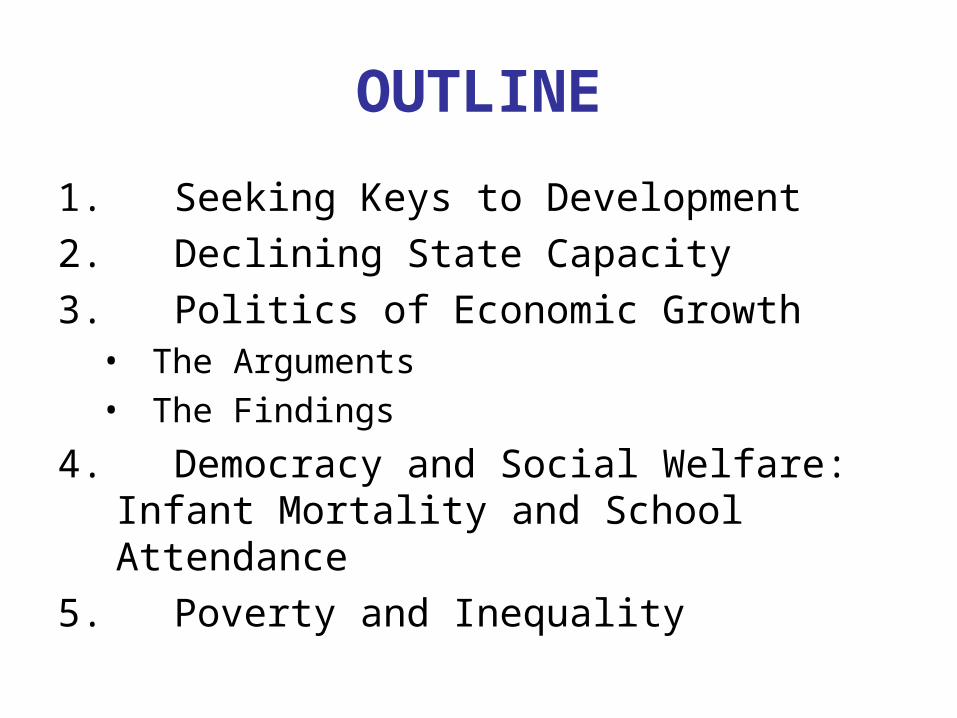
1. Seeking Keys to Development
2. Declining State Capacity
3. Politics of Economic Growth• The Arguments• The Findings
4. Democracy and Social Welfare: Infant Mortality and School Attendance
5. Poverty and Inequality
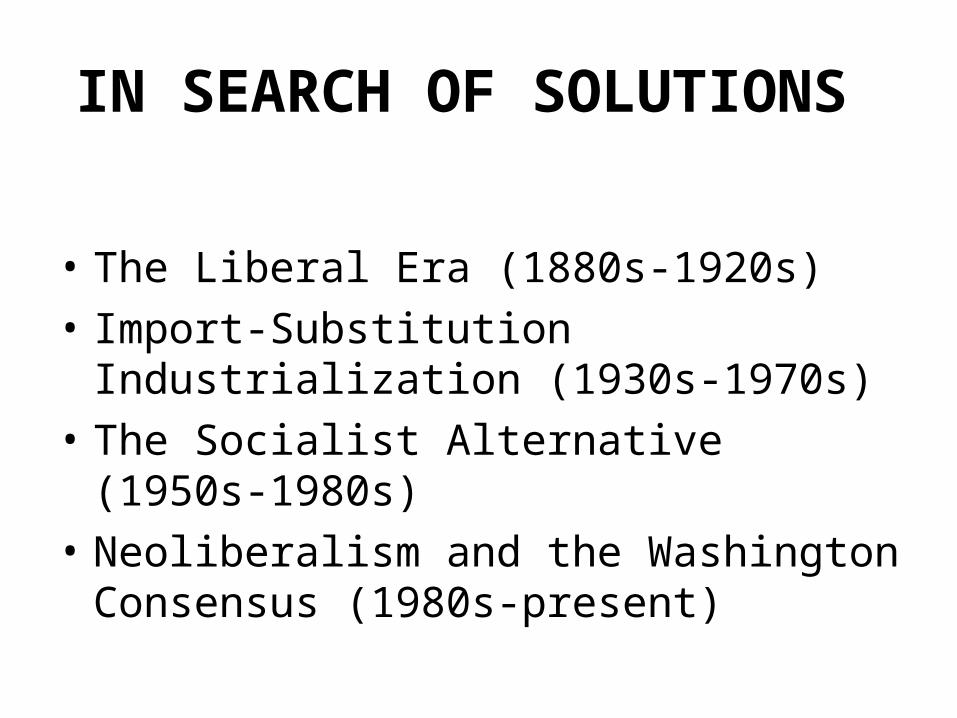
IN SEARCH OF SOLUTIONS
• The Liberal Era (1880s-1920s)
• Import-Substitution Industrialization (1930s-1970s)
• The Socialist Alternative (1950s-1980s)
• Neoliberalism and the Washington Consensus (1980s-present)
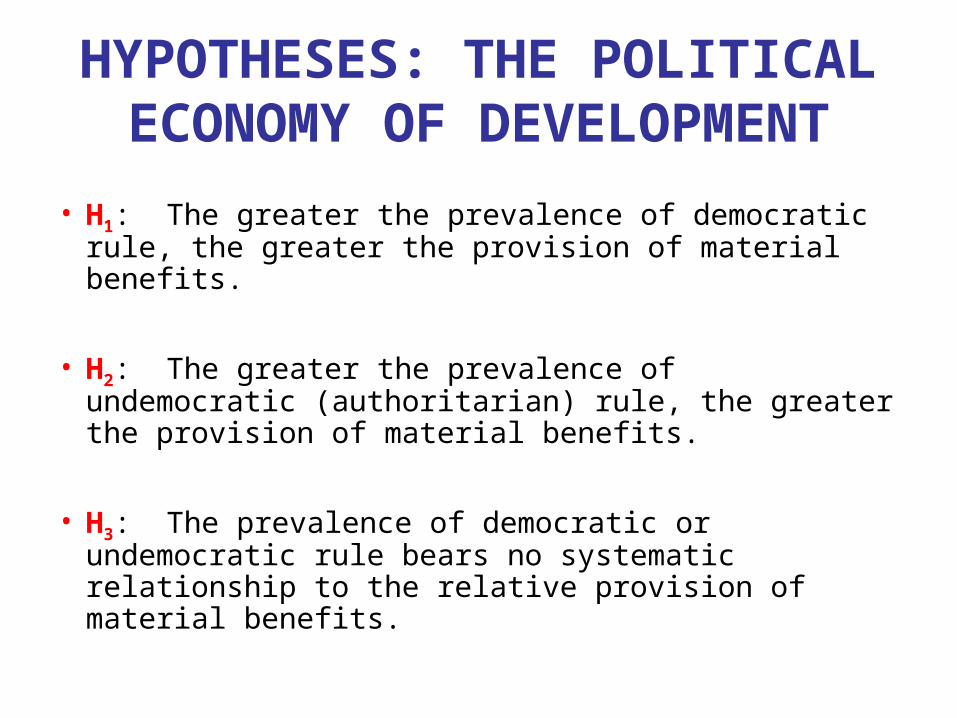
HYPOTHESES: THE POLITICAL ECONOMY OF DEVELOPMENT
• H1: The greater the prevalence of democratic rule, the greater the provision of material benefits.
• H2: The greater the prevalence of undemocratic (authoritarian) rule, the greater the provision of material benefits.
• H3: The prevalence of democratic or undemocratic rule bears no systematic relationship to the relative provision of material benefits.
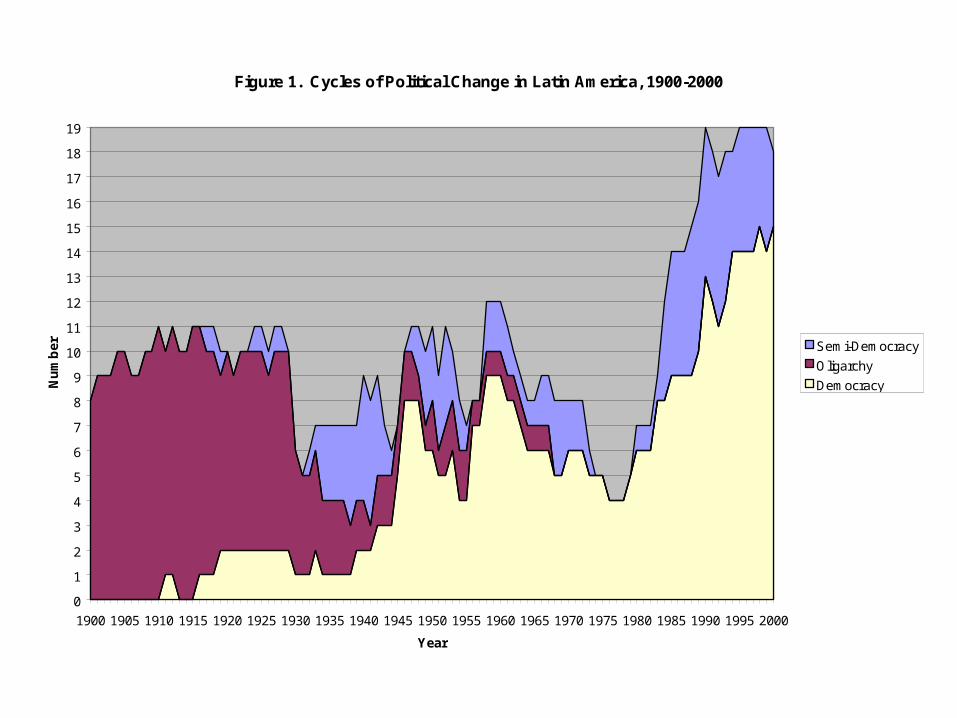
Figure 1. Cycles of Political Change in Latin America, 1900-2000
0
1
2
3
4
5
6
7
8
9
10
11
12
13
14
15
16
17
18
19
1900 1905 1910 1915 1920 1925 1930 1935 1940 1945 1950 1955 1960 1965 1970 1975 1980 1985 1990 1995 2000
Year
Nu
mb
er Semi-Democracy
Oligarchy
Democracy
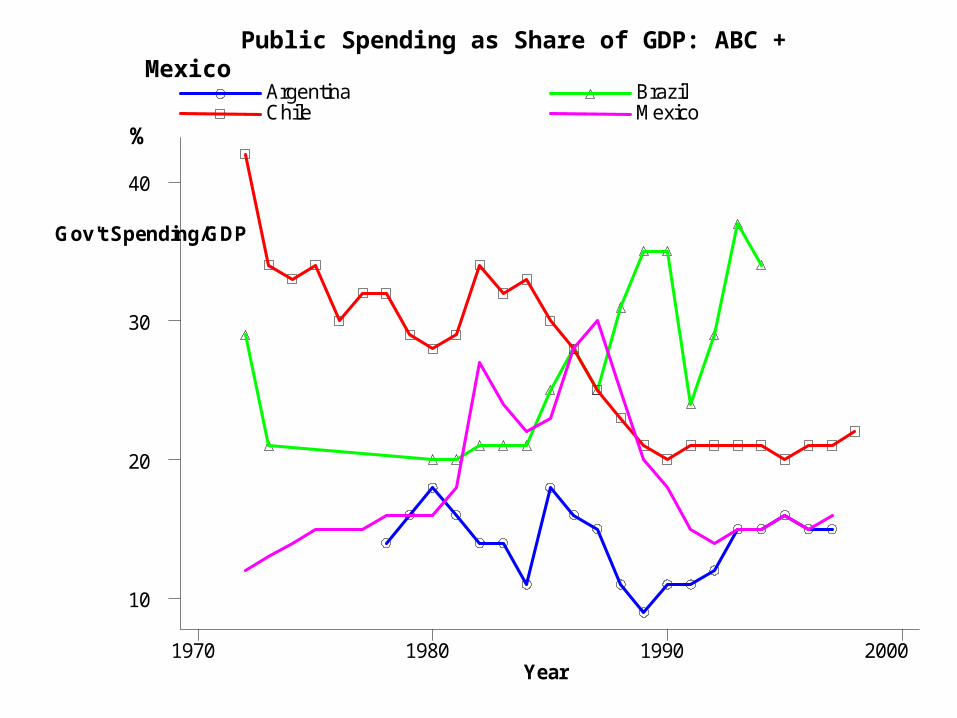
Gov't Spending/GDP
Year
Argentina Brazil Chile Mexico
1970 1980 1990 2000
10
20
30
40
%
Public Spending as Share of GDP: ABC + Mexico
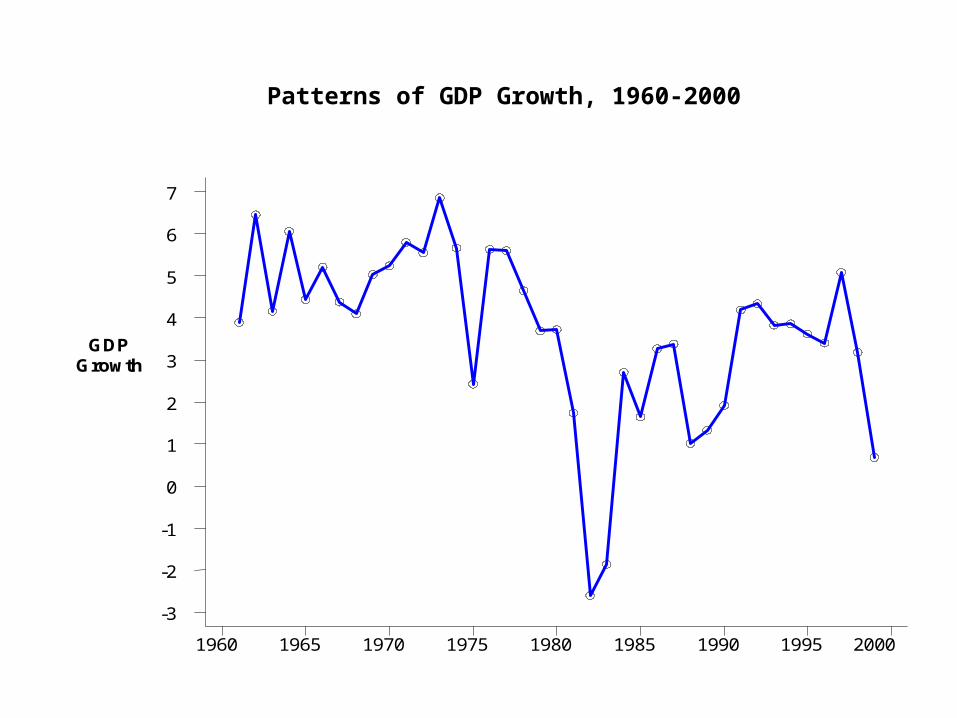
GDP Growth
1960 1965 1970 1975 1980 1985 1990 1995 2000
-3
-2
-1
0
1
2
3
4
5
6
7
Patterns of GDP Growth, 1960-2000
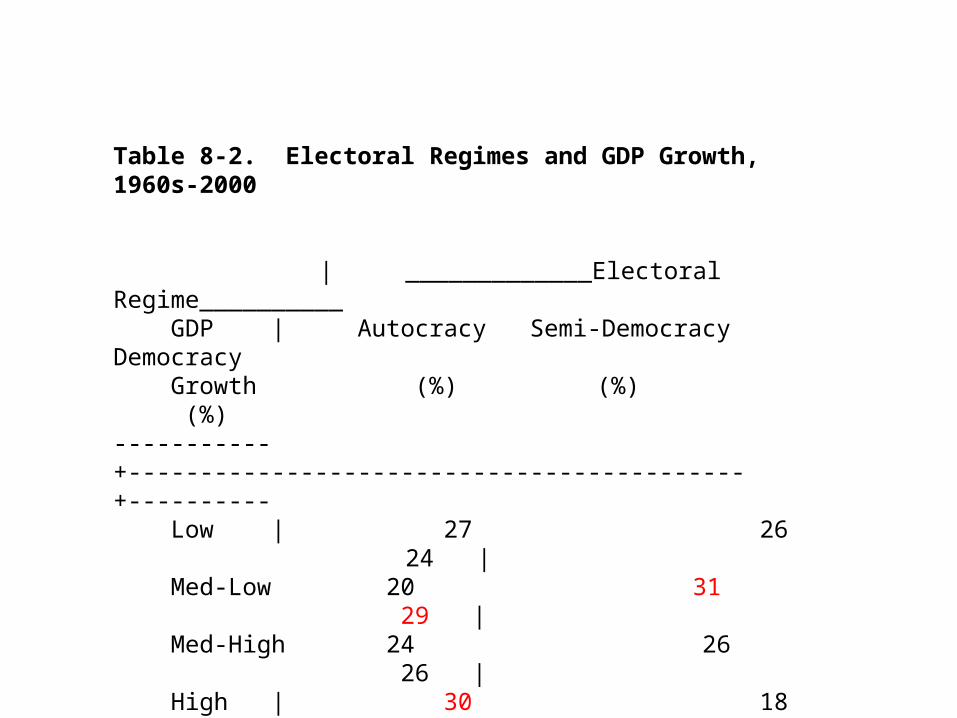
Table 8-2. Electoral Regimes and GDP Growth, 1960s-2000
| _____________Electoral Regime__________ GDP | Autocracy Semi-Democracy Democracy Growth (%) (%) (%)-----------+-------------------------------------------+---------- Low | 27 26 24 | Med-Low 20 31 29 | Med-High 24 26 26 | High | 30 18 22 | -----------+-------------------------------------------+----------
101 101 101 N | 306 109 319 | 734
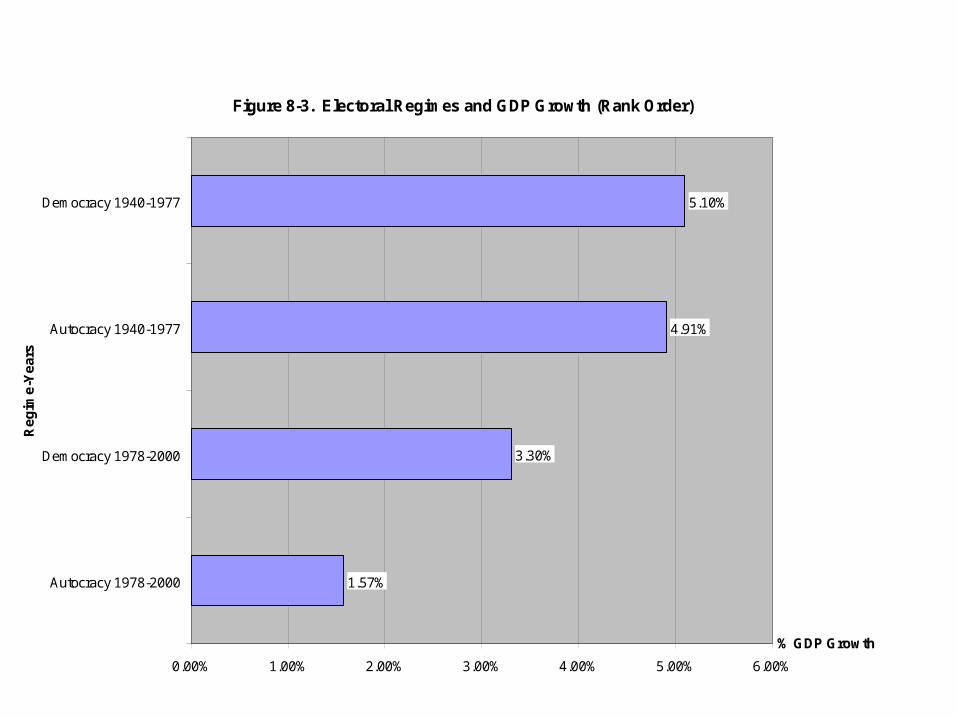
Figure 8-3. Electoral Regimes and GDP Growth (Rank Order)
1.57%
3.30%
4.91%
5.10%
0.00% 1.00% 2.00% 3.00% 4.00% 5.00% 6.00%
Autocracy 1978-2000
Democracy 1978-2000
Autocracy 1940-1977
Democracy 1940-1977
Re
gim
e-Y
ear
s
% GDP Growth
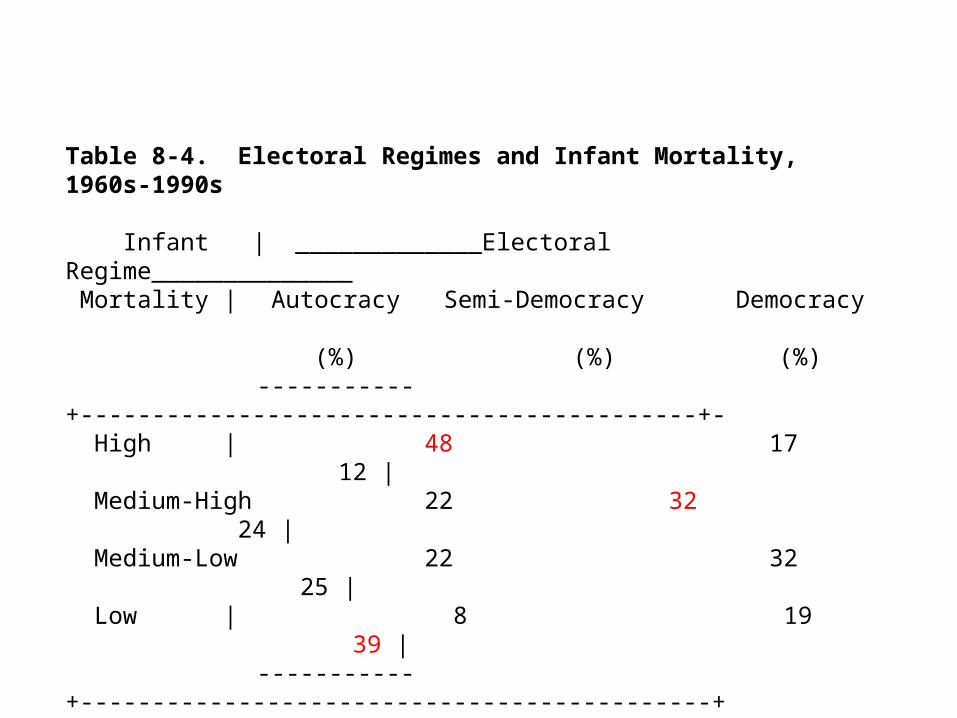
Table 8-4. Electoral Regimes and Infant Mortality, 1960s-1990s
Infant | _____________Electoral Regime______________ Mortality | Autocracy Semi-Democracy Democracy
(%) (%) (%)-----------+-------------------------------------------+-
High | 48 17 12 | Medium-High 22 32 24 | Medium-Low 22 32 25 | Low | 8 19 39 |
-----------+--------------------------------------------+ Total | 100 100 100 |
N 128 53 186
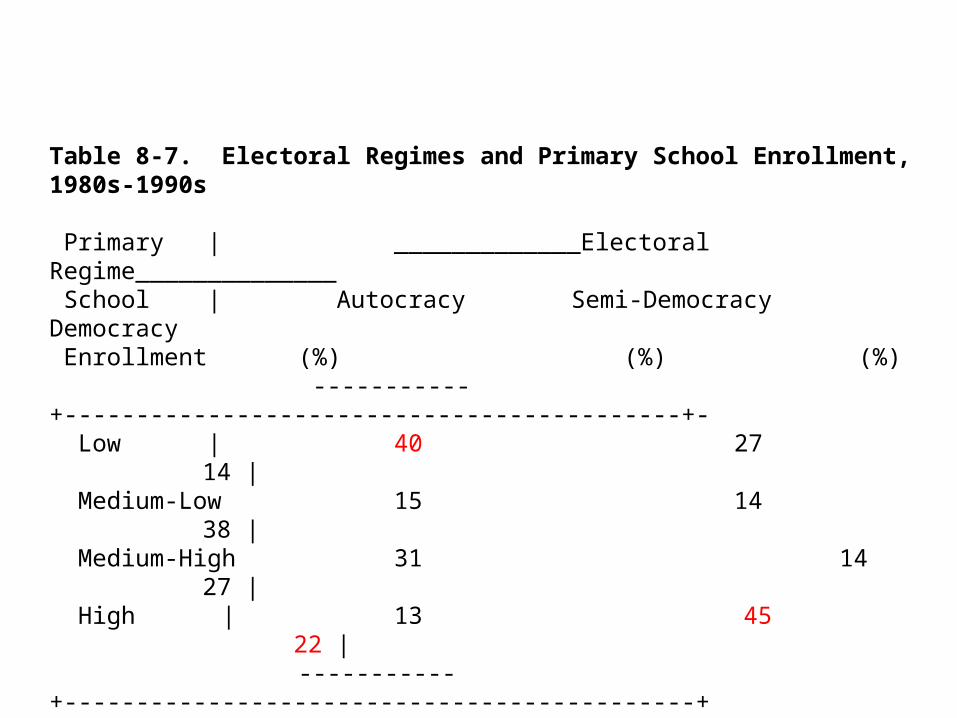
Table 8-7. Electoral Regimes and Primary School Enrollment, 1980s-1990s
Primary | _____________Electoral Regime______________ School | Autocracy Semi-Democracy Democracy Enrollment (%) (%) (%)
-----------+-------------------------------------------+- Low | 40 27 14 | Medium-Low 15 14 38 | Medium-High 31 14 27 | High | 13 45 22 |
-----------+--------------------------------------------+ Total | 99 100 101 |
N 67 44 101
Note: Columns may not add up to 100 because of rounding.
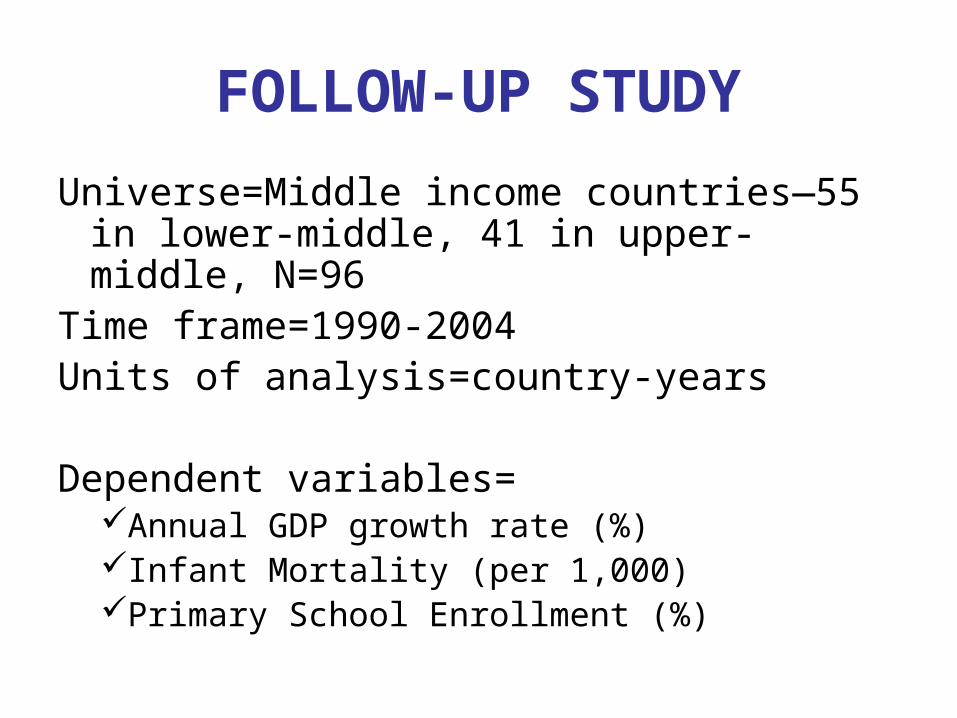
FOLLOW-UP STUDY
Universe=Middle income countries—55 in lower-middle, 41 in upper-middle, N=96
Time frame=1990-2004Units of analysis=country-years
Dependent variables=Annual GDP growth rate (%)Infant Mortality (per 1,000)Primary School Enrollment (%)
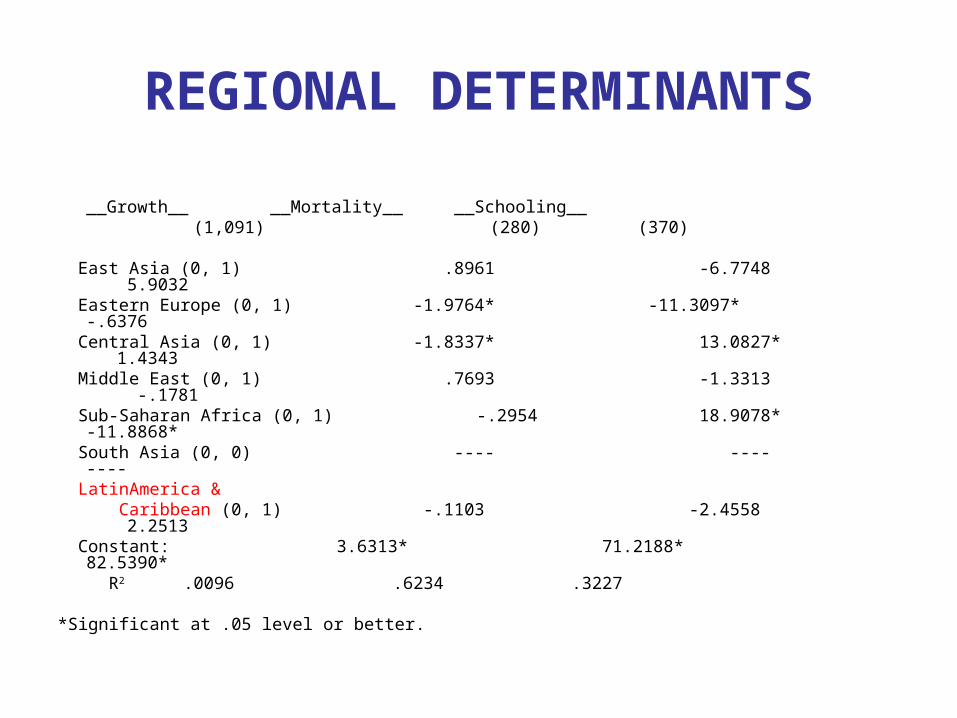
REGIONAL DETERMINANTS
__Growth__ __Mortality__ __Schooling__ (1,091) (280) (370)
East Asia (0, 1) .8961 -6.7748 5.9032 Eastern Europe (0, 1) -1.9764* -11.3097* -.6376 Central Asia (0, 1) -1.8337* 13.0827* 1.4343 Middle East (0, 1) .7693 -1.3313 -.1781 Sub-Saharan Africa (0, 1) -.2954 18.9078* -11.8868* South Asia (0, 0) ---- ---- ---- LatinAmerica & Caribbean (0, 1) -.1103 -2.4558 2.2513 Constant: 3.6313* 71.2188* 82.5390*
R2 .0096 .6234 .3227
*Significant at .05 level or better.
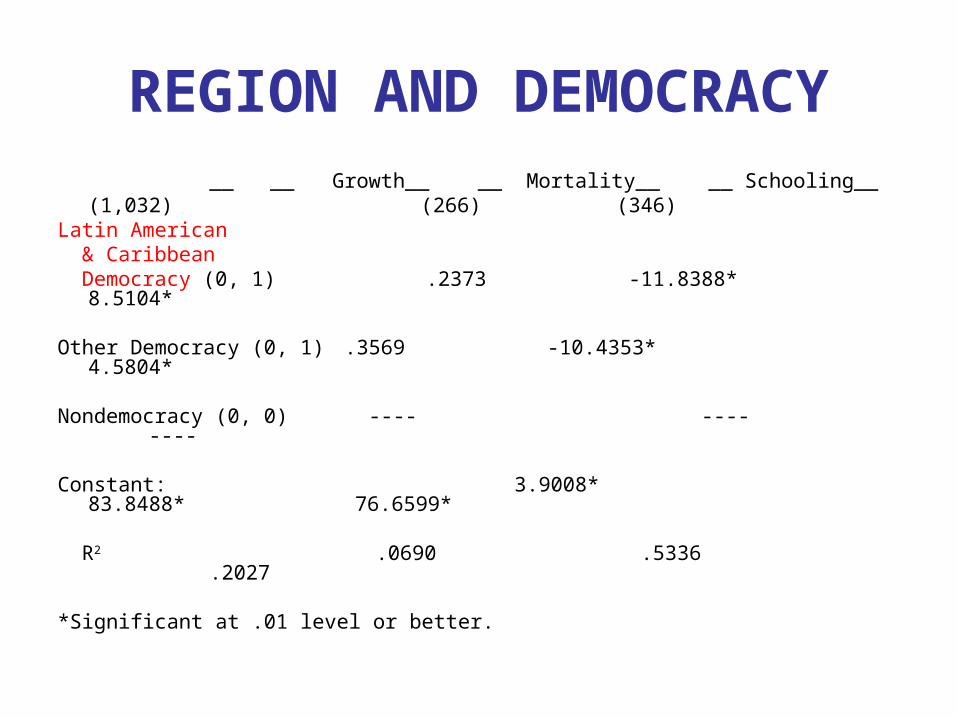
REGION AND DEMOCRACY __ __ Growth__ __ Mortality__ __ Schooling__
(1,032) (266) (346)Latin American & Caribbean Democracy (0, 1) .2373 -11.8388* 8.5104* Other Democracy (0, 1) .3569 -10.4353* 4.5804* Nondemocracy (0, 0) ---- ---- ----
Constant: 3.9008* 83.8488* 76.6599* R2 .0690 .5336 .2027
*Significant at .01 level or better.
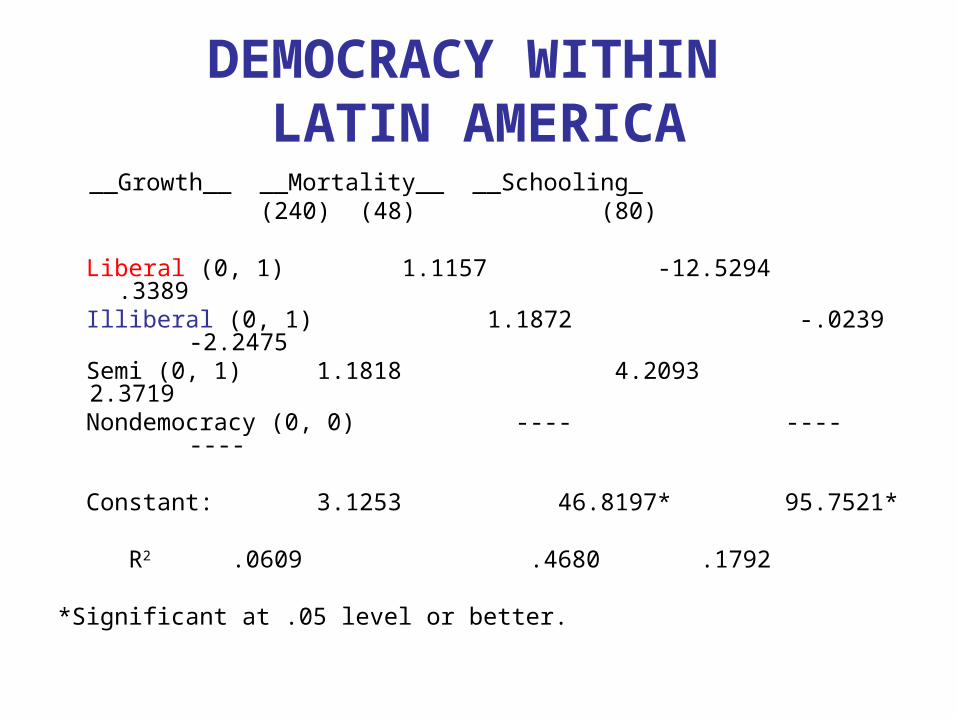
DEMOCRACY WITHIN LATIN AMERICA
__Growth__ __Mortality__ __Schooling_ (240) (48) (80)
Liberal (0, 1) 1.1157 -12.5294 .3389 Illiberal (0, 1) 1.1872 -.0239 -2.2475 Semi (0, 1) 1.1818 4.2093 2.3719 Nondemocracy (0, 0) ---- ---- ----
Constant: 3.1253 46.8197* 95.7521* R2 .0609 .4680 .1792
*Significant at .05 level or better.
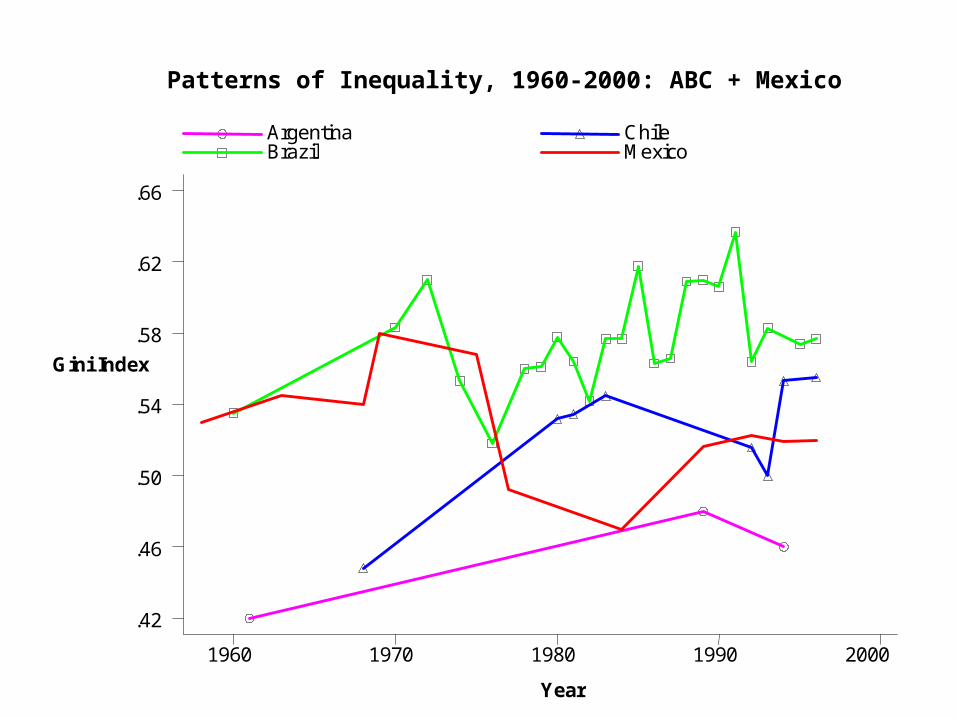
Gini Index
Year
Argentina Chile Brazil Mexico
1960 1970 1980 1990 2000
.42
.46
.50
.54
.58
.62
.66
Patterns of Inequality, 1960-2000: ABC + Mexico
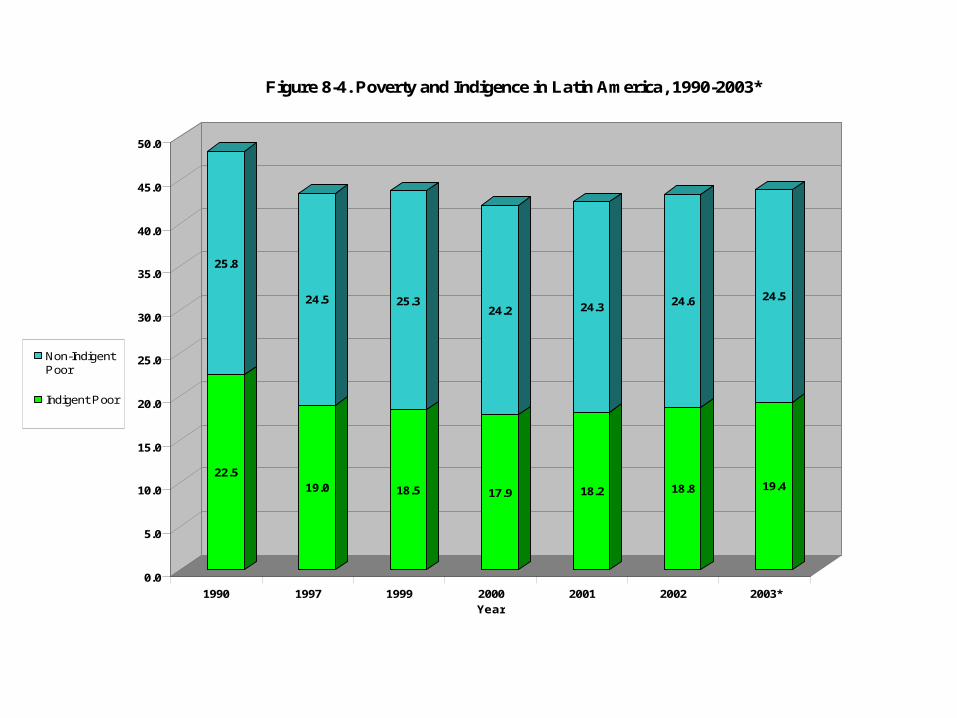
22.5
25.8
19.0
24.5
18.5
25.3
17.9
24.2
18.2
24.3
18.8
24.6
19.4
24.5
0.0
5.0
10.0
15.0
20.0
25.0
30.0
35.0
40.0
45.0
50.0
1990 1997 1999 2000 2001 2002 2003*Year
Figure 8-4. Poverty and Indigence in Latin America, 1990-2003*
Non-IndigentPoor
Indigent Poor
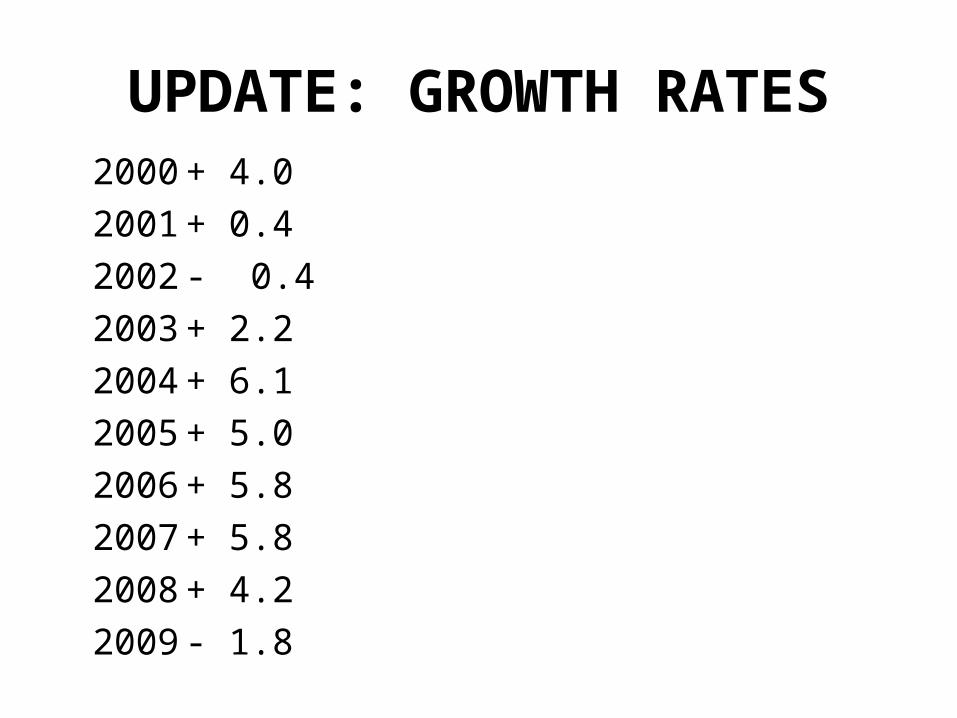
UPDATE: GROWTH RATES2000 + 4.0
2001 + 0.4
2002 - 0.4
2003 + 2.2
2004 + 6.1
2005 + 5.0
2006 + 5.8
2007 + 5.8
2008 + 4.2
2009 - 1.8
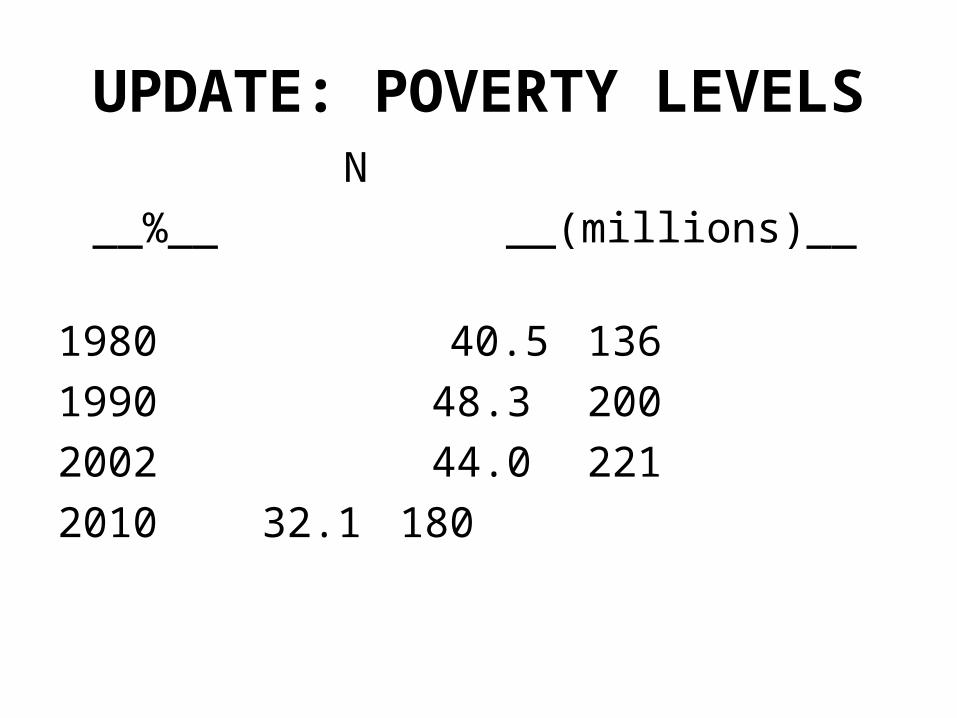
UPDATE: POVERTY LEVELS N
__%__ __(millions)__
1980 40.5 136
1990 48.3 200
2002 44.0 221
2010 32.1 180
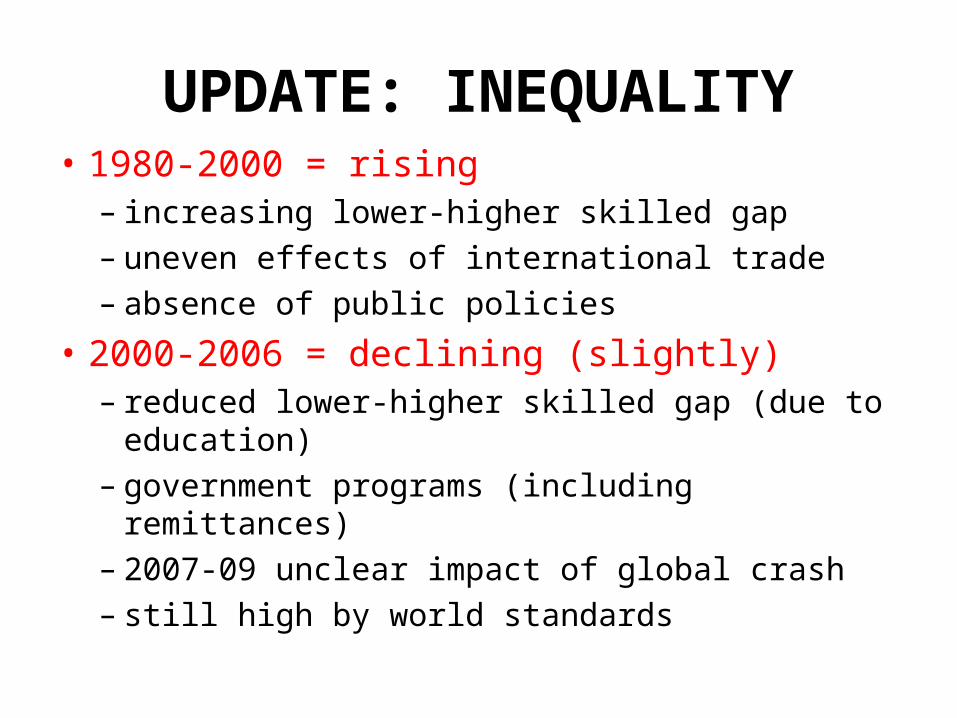
UPDATE: INEQUALITY• 1980-2000 = rising
– increasing lower-higher skilled gap– uneven effects of international trade– absence of public policies
• 2000-2006 = declining (slightly)– reduced lower-higher skilled gap (due to
education)– government programs (including remittances)– 2007-09 unclear impact of global crash– still high by world standards
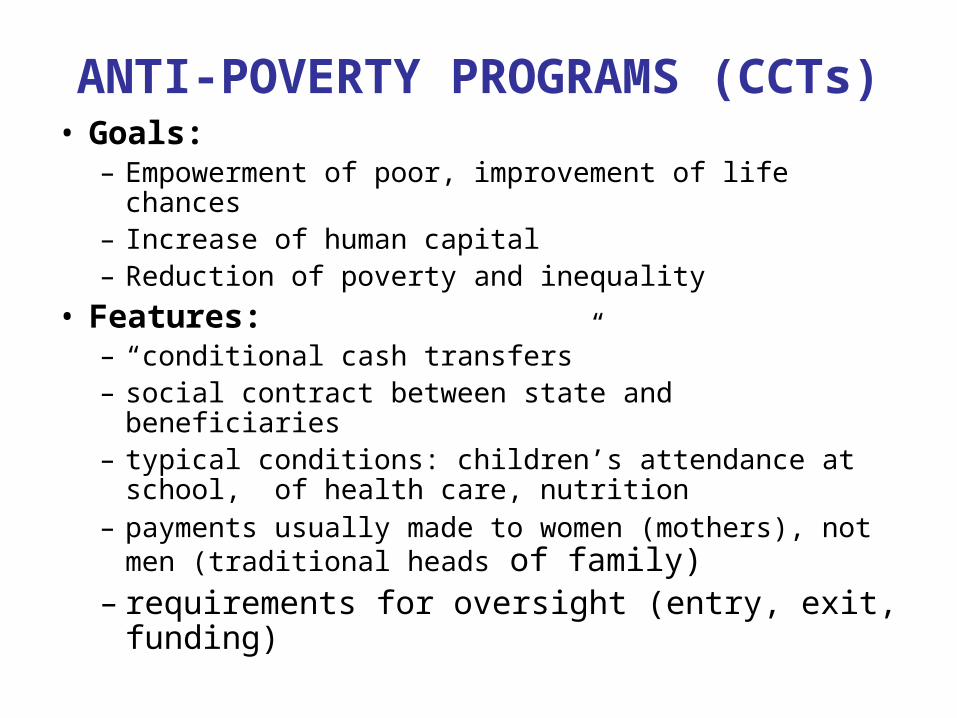
ANTI-POVERTY PROGRAMS (CCTs)• Goals:
– Empowerment of poor, improvement of life chances– Increase of human capital– Reduction of poverty and inequality
• Features:– “conditional cash transfers”– social contract between state and beneficiaries– typical conditions: children’s attendance at school, of
health care, nutrition– payments usually made to women (mothers), not men
(traditional heads of family)– requirements for oversight (entry, exit, funding)
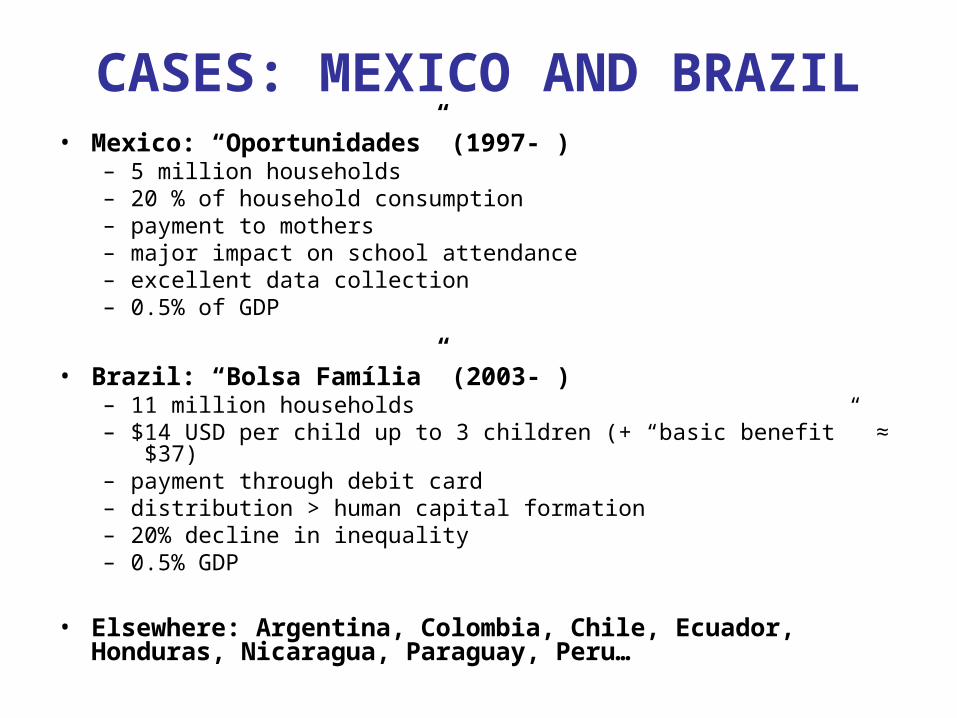
CASES: MEXICO AND BRAZIL• Mexico: “Oportunidades” (1997- )
– 5 million households– 20 % of household consumption– payment to mothers– major impact on school attendance– excellent data collection– 0.5% of GDP
• Brazil: “Bolsa Família” (2003- )– 11 million households– $14 USD per child up to 3 children (+ “basic benefit” ≈ $37)– payment through debit card– distribution > human capital formation – 20% decline in inequality– 0.5% GDP
• Elsewhere: Argentina, Colombia, Chile, Ecuador, Honduras, Nicaragua, Paraguay, Peru…
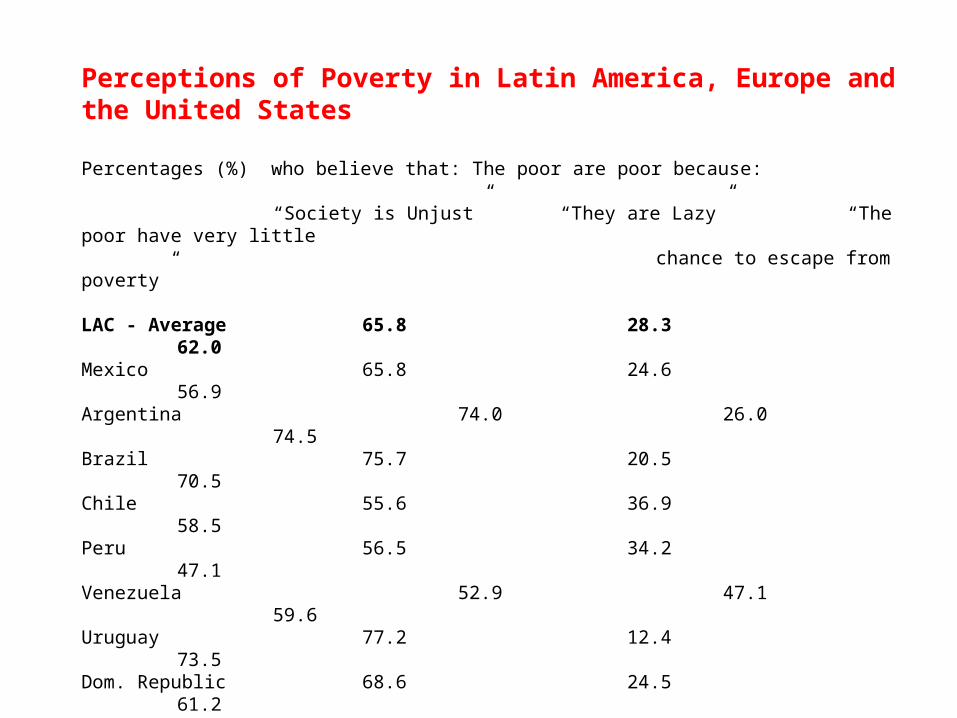
Perceptions of Poverty in Latin America, Europe and the United States
Percentages (%) who believe that: The poor are poor because:
“Society is Unjust” “They are Lazy” “The poor have very littlechance to escape from poverty”
LAC - Average 65.8 28.3 62.0Mexico 65.8 24.6 56.9Argentina 74.0 26.0 74.5Brazil 75.7 20.5 70.5Chile 55.6 36.9 58.5Peru 56.5 34.2 47.1Venezuela 52.9 47.1 59.6Uruguay 77.2 12.4 73.5Dom. Republic 68.6 24.5 61.2Colombia n.a. n.a. 55.8
ContinentalEurope 63.3 17.1 60.2
United States 38.8 61.2 29.5