Embed Size (px)
Citation preview
Adapted from A4Q Workbook 2013/MOS/HampshireHospitalsNHSFoundationTrustSeptember2016v1 Page 1
Quality Improvement
Training Workbook
Adapted from A4Q Workbook 2013/MOS/HampshireHospitalsNHSFoundationTrustSeptember2016v1 2
HHFT Quality Improvement Training Workbook
Contents Page number
Introduction
How to go about Quality Improvement 3
Stage 1 – Start Out
Appreciative enquiry 7
Opportunity/Problem statement 8
Stage 2 – Define and scope
Process mapping 9
Cause and effect diagram (Fishbone) 10
Stakeholder analysis 14
SMART objectives 15
Stage 3 – Measure and understand
7 steps 17
Process, outcome and Balancing measures 18
What measures to use 19
Presenting the data 20
Stage 4 – Plan and design
Driver diagrams 23
Stage 5 – Test and review
Plan, Do, Study, Act (PDSA) cycles 25
Stage 6 – Sustain and share
The sustainability model 26
Further information and contacts
References 28
Appendix 1
A Quality Improvement story: “Communicating with relatives”
29
Adapted from A4Q Workbook 2013/MOS/HampshireHospitalsNHSFoundationTrustSeptember2016v1 3
Aims of the training Introduce fundamental concepts for quality improvement
Practice identifying and analysing areas for improvement
Introduce quality improvement tools for your practical use
Learning Outcomes
By the end of the training you will:
Have an understanding of the core principles of quality improvement
Be familiarised with some service improvement tools
Be able to apply a structured approach to carrying out quality improvement
Recognise the importance of involving patients, as well as staff, in the improvement process, putting patients at the center of what you do
What is Quality? Care that is clinically effective – not just in the eyes of clinicians but in the eyes of patients
themselves
Care that is safe
Care that provides as positive an experience for patients as possible
NHS England https://www.england.nhs.uk/about/our-vision-and-purpose/imp-our-mission/high-quality-care/
The dimensions of quality
The US Institute of Medicine (2000) identified six dimensions of healthcare quality, which state that healthcare must be:
Safe Avoiding harm to patients from care that is intended to help them
Effective Providing services based on evidence and which produce a clear benefit
Person-centred Establishing a partnership between patients and practitioners to ensure care respects patients’ needs and preferences
Timely Reducing waits and delays that can sometimes be harmful
Efficient Avoiding waste and achieving increased productivity
Equitable Providing care that does not vary in quality because of a person’s characteristics
When considering these dimensions, the common denominator (or driver) is the patient and his / her experience. This is a core principle underpinning HHFT’s approach to improving the quality of our services.
Adapted from A4Q Workbook 2013/MOS/HampshireHospitalsNHSFoundationTrustSeptember2016v1 4
Patient stories
When healthcare services think about redesigning services to achieve improvements, there are usually plenty of things about systems and processes that need addressing. When it comes to finding out patients’ views, there can be a tendency to rely on patient surveys and complaints. However, in order to improve services so that they are configured and co-ordinated around the needs and preferences of patients, a lot can be learned by listening to ‘patient stories’. Gathering patient stories is not complex. It involves interviewing patients directly to gather their perspective, based on their experience of being on the receiving end of care. Throughout this workbook when you are working through a process that is aimed at improving quality, let the patient story be your guide and cornerstone, and a reminder of why you want to make a difference.
Clinical Audit
Clinical audit is a way to find out if healthcare is being provided in line with standards. Clinical Audit lets care providers and patients know where their service is doing well and where there could be improvements. The aim is to allow quality improvement to take place where it will be most helpful and where it will improve outcomes for patients. Clinical audits can look at care nationwide (national clinical audits) and clinical audits can also be performed locally in Trusts, hospitals or GP practices; anywhere healthcare is provided. NHS England
Clinical Audit was introduced to the NHS in 1993. It is defined as: “A quality improvement process that seeks to improve patient care and outcomes through systematic review of care against explicit criteria and the implementation of change”
Principles for Best Practice in Clinical Audit (NICE/CHI 2002) www.nice.org.uk/pdg/BestPracticeClinicalAudit.pdf
The overall aim of clinical audit is to improve patient outcomes by improving professional practice and the general quality of services delivered. This is achieved through a continuous process where healthcare professionals review patient care against agreed standards and make changes, where necessary, to meet those standards. The audit is then repeated to see if the changes have been made and the quality of patient care improved
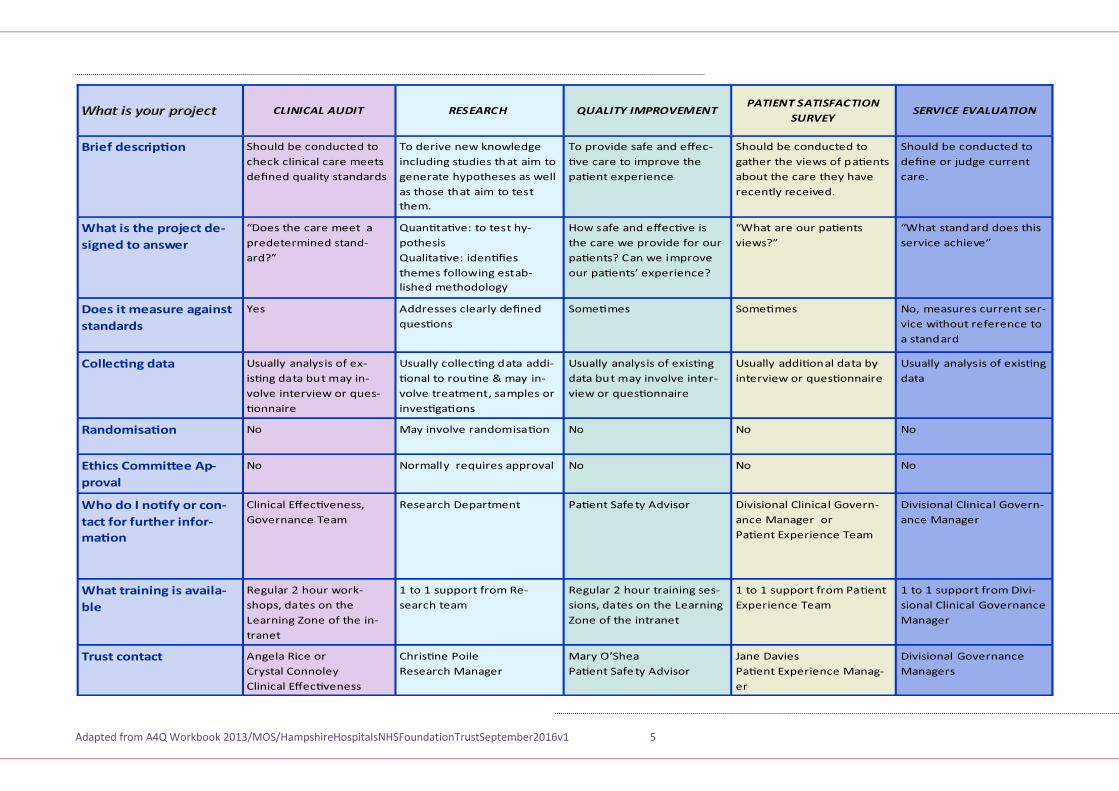
Healthcare Commission 2004 The table on page 5 is from a leaflet produced by the Clinical Effectiveness Manager in HHFT (Angie Rice) and shows the different types of quality improvement projects with an explanation of each type. The table also gives information about who to contact with each type and the training available in HHFT. Have a look at each type – what type of project are you doing?
Adapted from A4Q Workbook 2013/MOS/HampshireHospitalsNHSFoundationTrustSeptember2016v1 5
hould be conducted to
check clinical care meets
de ned quality standards
To derive new knowledge
including studies that aim to
generate hypotheses as well
as those that aim to test
them.
To provide safe and e ec
ve care to improve the
pa ent experience
hould be conducted to
gather the views of pa ents
about the care they have
recently received.
es Addresses clearly de ned
ques ons
ome mes ome mes
sually analysis of ex
is ng data but may in
volve interview or ques
onnaire
sually collec ng data addi
onal to rou ne may in
volve treatment, samples or
inves ga ons
sually analysis of exis ng
data but may involve inter
view or ques onnaire
sually addi onal data by
interview or ques onnaire
o ay involve randomisa on o o
o ormally requires approval o o
Clinical ec veness,
overnance Team
esearch epartment Pa ent afe ty Advisor ivisional Clinical overn
ance anager or
Pa ent xperience Team
Angela ice or
Crystal Connoley
Clinical ec veness
Chris ne Poile
esearch anager
ary ’ hea
Pa ent afe ty Advisor
ane avies
Pa ent xperience anag
er
“ oes the care meet a
predetermined stand
ard ”
uan ta ve to test hy
pothesis
ualita ve iden es
themes following estab
lished methodology
How safe and e ec ve is
the care we provide for our
pa ents Can we improve
our pa ents’ experience
“ hat are our pa ents
views ”
hould be conducted to
de ne or udge current
care.
“ hat standard does this
service achieve”
o, measures current ser
vice without reference to
a standard
sually analysis of exis ng
data
o
o
ivisional Clinical overn
ance anager
ivisional overnance
anagers
egular hour work
shops, dates on the
earning one of the in
tranet
to support from e
search team
egular hour training ses
sions, dates on the earning
one of the intranet
to support from Pa ent
xperience Team
to support from ivi
sional Clinical overnance
anager
Adapted from A4Q Workbook 2013/MOS/HampshireHospitalsNHSFoundationTrustSeptember2016v1 6
How to go about Quality Improvement
The approach to improving quality requires structure and a process. This does not mean that every quality improvement initiative needs to be addressed in the same level of depth and detail. There are many quality improvement initiatives that only require awareness of a problem, enthusiasm to address the problem and permission to achieve the improvement.
There have been quality improvement initiatives in HHFT, such as ‘Thistle’ and Productive ard, and initiatives to improve quality for our patients are actively encouraged. However, taking a systematic approach will help us to ensure a consistent organisation-wide approach.
So why and when is a more systematic approach needed?
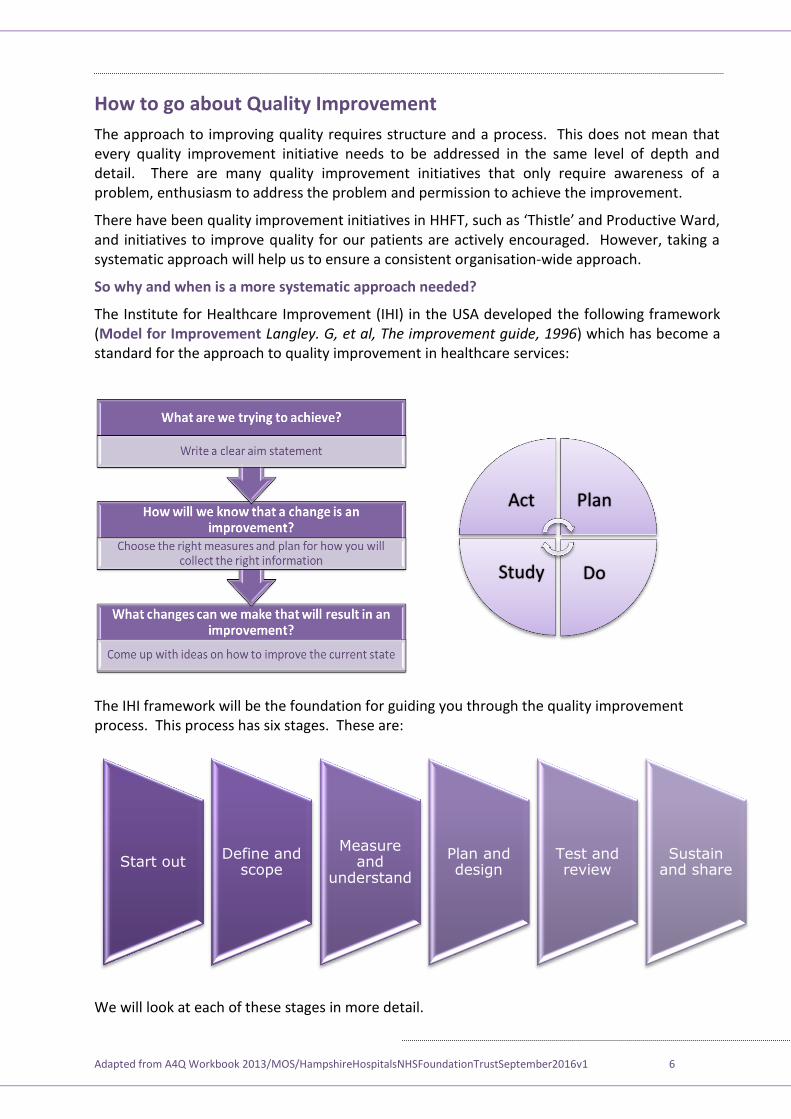
The Institute for Healthcare Improvement (IHI) in the USA developed the following framework (Model for Improvement Langley. G, et al, The improvement guide, 1996) which has become a standard for the approach to quality improvement in healthcare services:
The IHI framework will be the foundation for guiding you through the quality improvement process. This process has six stages. These are:
We will look at each of these stages in more detail.
Act Plan
Do Study
Start out Define and
scope
Measure and
understand
Plan and design
Test and review
Sustain and share
Adapted from A4Q Workbook 2013/MOS/HampshireHospitalsNHSFoundationTrustSeptember2016v1 7
Stage 1 – Start Out
The aim of this stage is to develop and agree a rationale for your improvement work and secure support from the appropriate sponsor.
How do you do this?
So how do you generate ideas and where do they come from?
Here are some easy ways to generate ideas for quality improvement (and you may think of others):
Stick a piece of flip-chart paper on a wall in a room that is accessible to staff in your area and ask them over a given timeframe (e.g. one week) to write on the paper some simple statements about what could be improved
Ask patients and carers/relatives ‘ hat could we do better ’
Put a suggestions box somewhere and provide paper for staff and patients to make suggestions. The suggestions box should be temporary and everyone should know when it will be removed
Get a list of incidents and/or complaints that have occurred in your area/department over the past year and get a small group of staff together to look for the most common themes from the investigations.
Here’s another approach; it’s called Appreciative Inquiry. It gives you a structure based on answering a set of simple questions. Consider the table below as your ‘Adv n T g k C d’. Carry this around with you for a few days and add thoughts as they occur to you.
1. What is particularly good about what we do?
2. What quality concerns do you have about the service?
3. What do you think could be improved?
4. What have you tried in the past? Did it work? If not, why not?
5. How do you think it could be improved now?
Adapted from A4Q Workbook 2013/MOS/HampshireHospitalsNHSFoundationTrustSeptember2016v1 8
Comments and observations
Agree a rationale for your improvement work
You should now be able to define an Opportunity / Problem Statement
What is wrong?
How extensive is the problem?
Where does the problem occur?
When does the problem occur?
Using an example, provide a one-sentence answer for each question
As you begin thinking about how to start your project, you need to consider the structure or framework, to guide you on the journey. Quality improvement initiatives are most commonly managed as a project. It is important, however, to recognise that every project is different and that you will do different things in different projects.
Remember: The final core principle above indicates that carrying out your quality improvement may not require the level of detail suggested in the IHI’s odel for Improevement. Nevertheless, there are a core set of important requirements for you to ask youself when thinking about turning an idea into a quality improvement task.
HHFT has core principles underpinning our approach to quality improvement that are endorsed at Board level:
There is a commitment to developing a culture of continuous improvement, building on what we do well
ALL front line staff are key to delivering improvements All staff should undertake at least one improvement project in the year Staff will be supported to apply an approach that will be right for the scope and
scale of the quality improvement task
Adapted from A4Q Workbook 2013/MOS/HampshireHospitalsNHSFoundationTrustSeptember2016v1 9
Stage 2 – Define and Scope
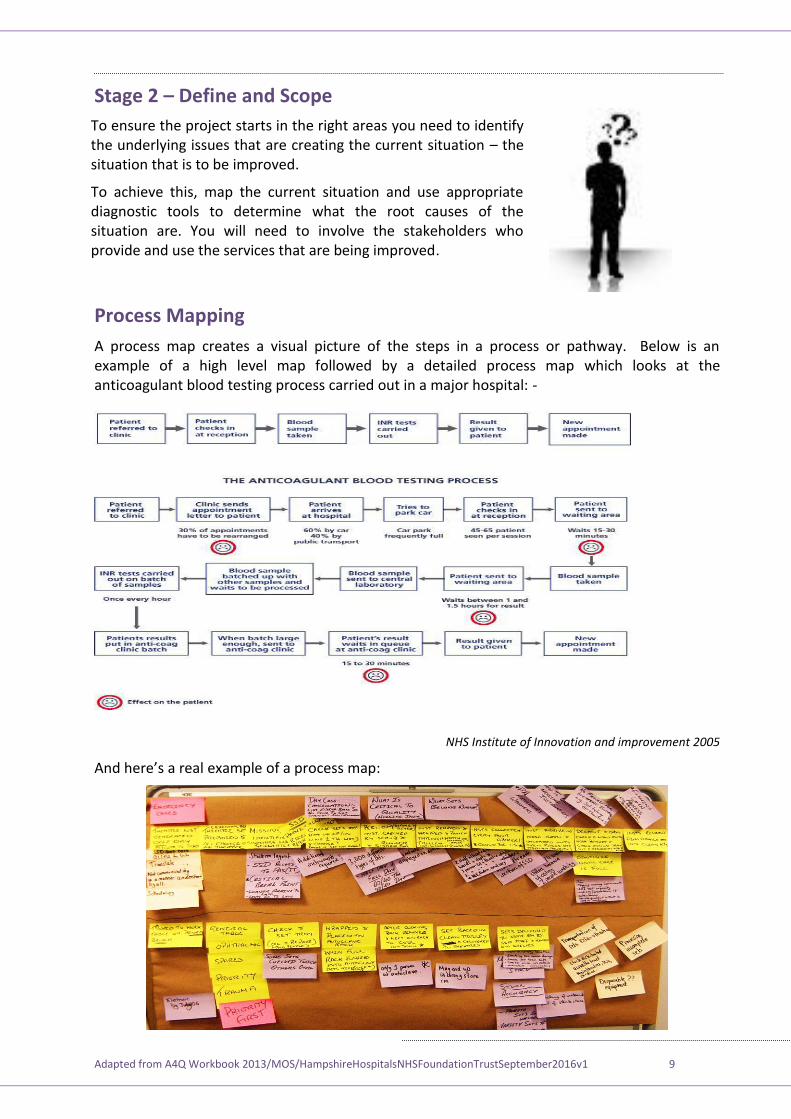
Process Mapping
A process map creates a visual picture of the steps in a process or pathway. Below is an example of a high level map followed by a detailed process map which looks at the anticoagulant blood testing process carried out in a major hospital: -
NHS Institute of Innovation and improvement 2005
And here’s a real example of a process map
To ensure the project starts in the right areas you need to identify the underlying issues that are creating the current situation – the situation that is to be improved.
To achieve this, map the current situation and use appropriate diagnostic tools to determine what the root causes of the situation are. You will need to involve the stakeholders who provide and use the services that are being improved.
Adapted from A4Q Workbook 2013/MOS/HampshireHospitalsNHSFoundationTrustSeptember2016v1 10
The benefit of seeing a real example is that it shows you the equipment that is used and reflects how this is a practical exercise. The reason for using post-it notes is that you may learn information that needs to be placed into a part of the process map you have already discussed – it means you can easily move them around. The different coloured post-its can be used to identify things going on around the process, such as involvement of other professionals / departments or blockages (called ‘bottlenecks’). Here’s an example of a process map showing the steps in the pathway and also the problems and solutions. But remember, you are not looking for solutions at this stage of the quality improvement process you are still getting a full understanding on how things work now (the current state)
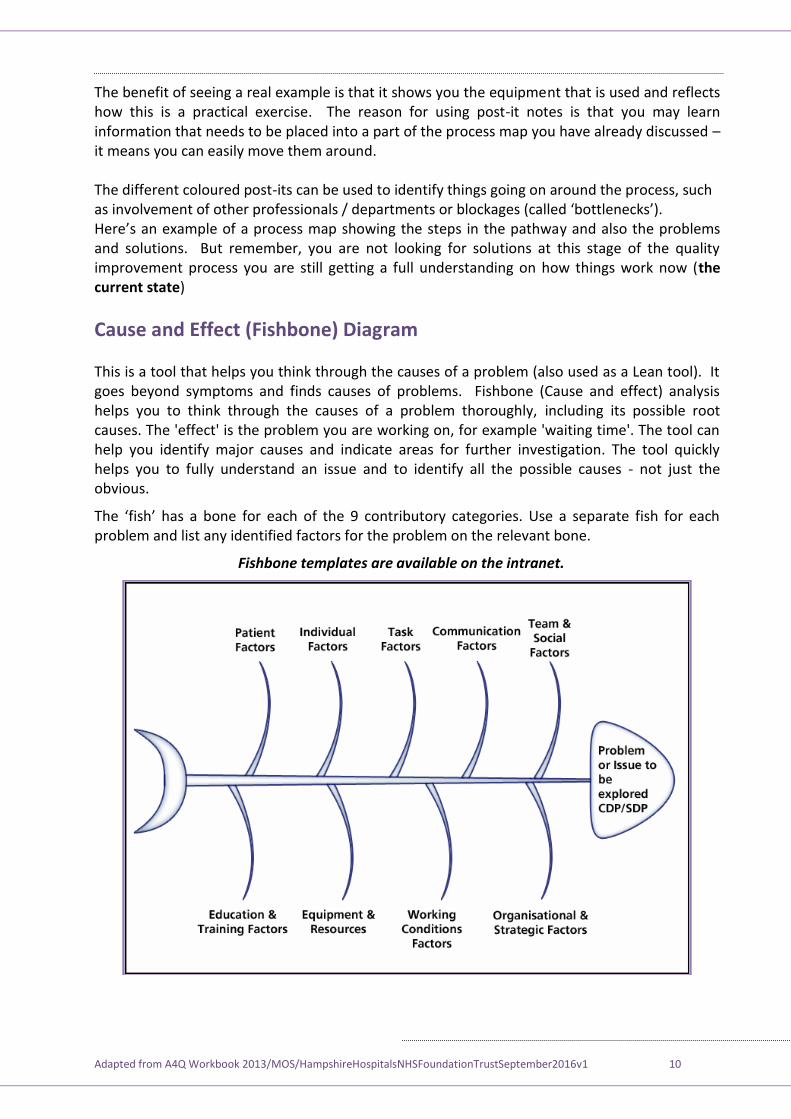
Cause and Effect (Fishbone) Diagram This is a tool that helps you think through the causes of a problem (also used as a Lean tool). It goes beyond symptoms and finds causes of problems. Fishbone (Cause and effect) analysis helps you to think through the causes of a problem thoroughly, including its possible root causes. The 'effect' is the problem you are working on, for example 'waiting time'. The tool can help you identify major causes and indicate areas for further investigation. The tool quickly helps you to fully understand an issue and to identify all the possible causes - not just the obvious.
The ‘fish’ has a bone for each of the 9 contributory categories. se a separate fish for each problem and list any identified factors for the problem on the relevant bone.
Fishbone templates are available on the intranet.
Adapted from A4Q Workbook 2013/MOS/HampshireHospitalsNHSFoundationTrustSeptember2016v1 11
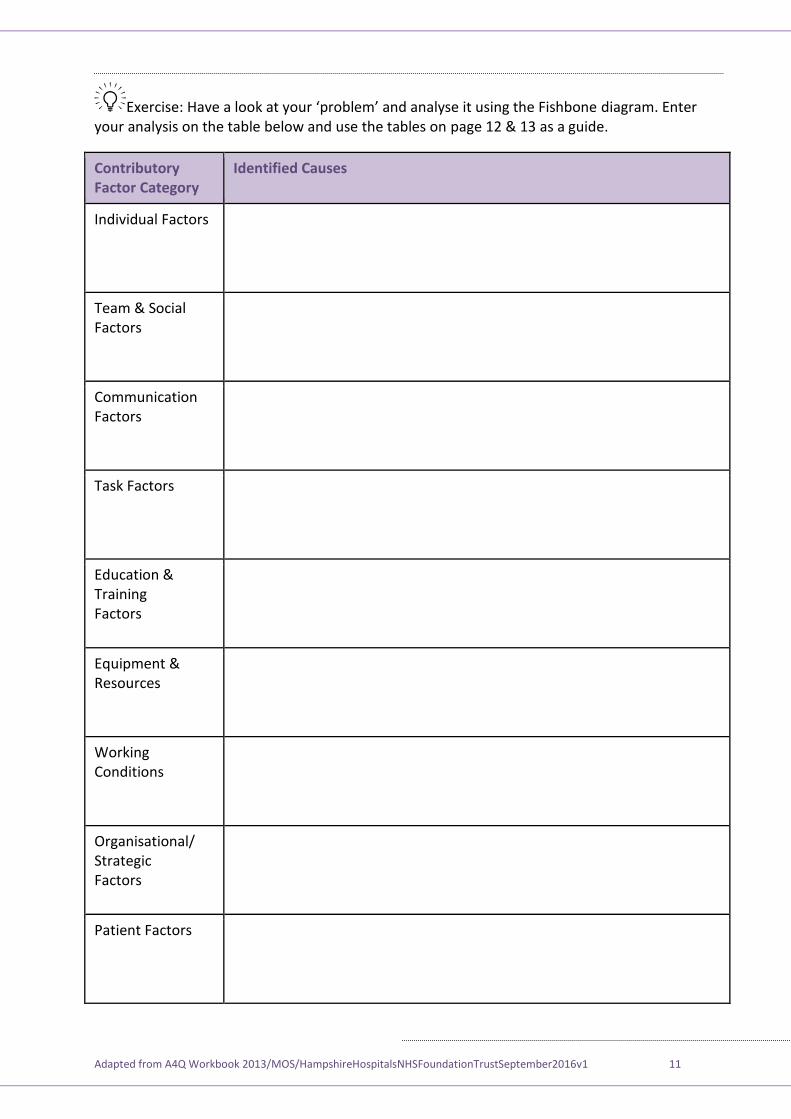
xercise Have a look at your ‘problem’ and analyse it using the Fishbone diagram. Enter your analysis on the table below and use the tables on page 12 & 13 as a guide.
Contributory Factor Category
Identified Causes
Individual Factors
Team & Social Factors
Communication Factors
Task Factors
Education & Training Factors
Equipment & Resources
Working Conditions
Organisational/ Strategic Factors
Patient Factors
Adapted from A4Q Workbook 2013/MOS/HampshireHospitalsNHSFoundationTrustSeptember2016v1 12
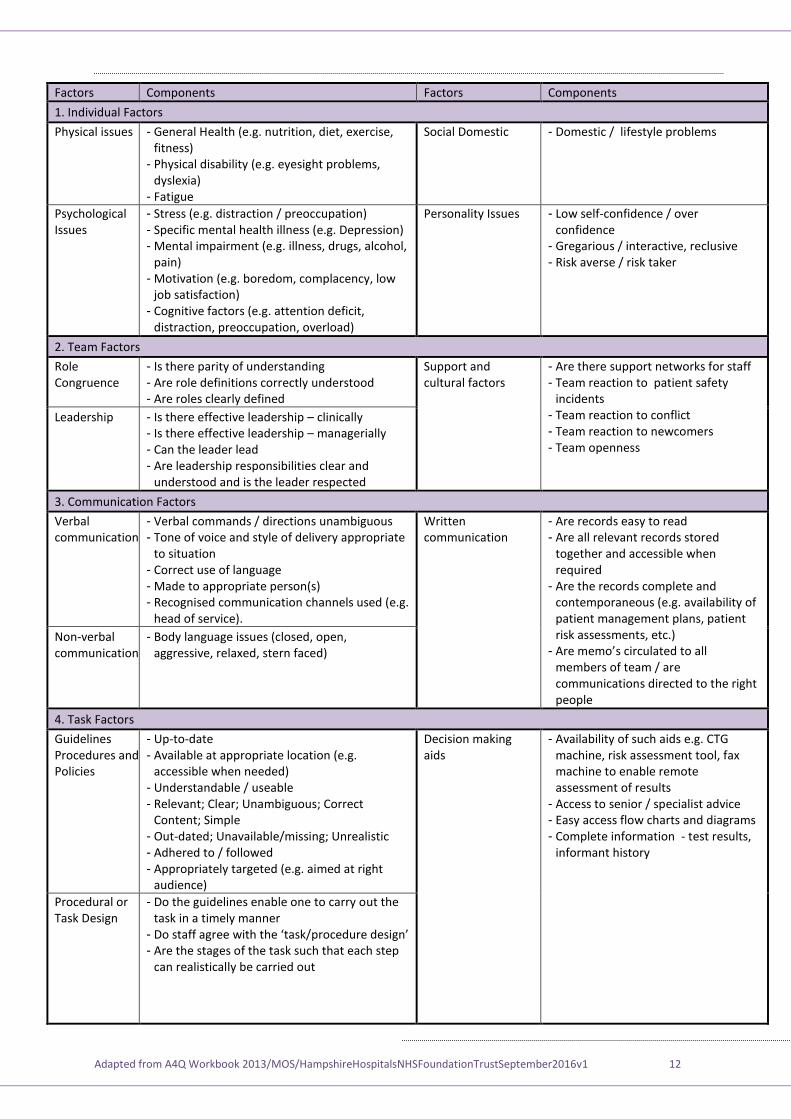
Factors Components Factors Components
1. Individual Factors
Physical issues - General Health (e.g. nutrition, diet, exercise, fitness)
- Physical disability (e.g. eyesight problems, dyslexia)
- Fatigue
Social Domestic - Domestic / lifestyle problems
Psychological Issues
- Stress (e.g. distraction / preoccupation) - Specific mental health illness (e.g. Depression) - Mental impairment (e.g. illness, drugs, alcohol,
pain) - Motivation (e.g. boredom, complacency, low
job satisfaction) - Cognitive factors (e.g. attention deficit,
distraction, preoccupation, overload)
Personality Issues - Low self-confidence / over confidence
- Gregarious / interactive, reclusive - Risk averse / risk taker
2. Team Factors
Role Congruence
- Is there parity of understanding - Are role definitions correctly understood - Are roles clearly defined
Support and cultural factors
- Are there support networks for staff - Team reaction to patient safety
incidents - Team reaction to conflict - Team reaction to newcomers - Team openness
Leadership - Is there effective leadership – clinically - Is there effective leadership – managerially - Can the leader lead - Are leadership responsibilities clear and
understood and is the leader respected
3. Communication Factors
Verbal communication
- Verbal commands / directions unambiguous - Tone of voice and style of delivery appropriate
to situation - Correct use of language - Made to appropriate person(s) - Recognised communication channels used (e.g.
head of service).
Written communication
- Are records easy to read - Are all relevant records stored
together and accessible when required
- Are the records complete and contemporaneous (e.g. availability of patient management plans, patient risk assessments, etc.)
- Are memo’s circulated to all members of team / are communications directed to the right people
Non-verbal communication
- Body language issues (closed, open, aggressive, relaxed, stern faced)
4. Task Factors
Guidelines Procedures and Policies
- Up-to-date - Available at appropriate location (e.g.
accessible when needed) - Understandable / useable - Relevant; Clear; Unambiguous; Correct
Content; Simple - Out-dated; Unavailable/missing; Unrealistic - Adhered to / followed - Appropriately targeted (e.g. aimed at right
audience)
Decision making aids
- Availability of such aids e.g. CTG machine, risk assessment tool, fax machine to enable remote assessment of results
- Access to senior / specialist advice - Easy access flow charts and diagrams - Complete information - test results,
informant history
Procedural or Task Design
- Do the guidelines enable one to carry out the task in a timely manner
- o staff agree with the ‘task/procedure design’ - Are the stages of the task such that each step
can realistically be carried out
Adapted from A4Q Workbook 2013/MOS/HampshireHospitalsNHSFoundationTrustSeptember2016v1 13
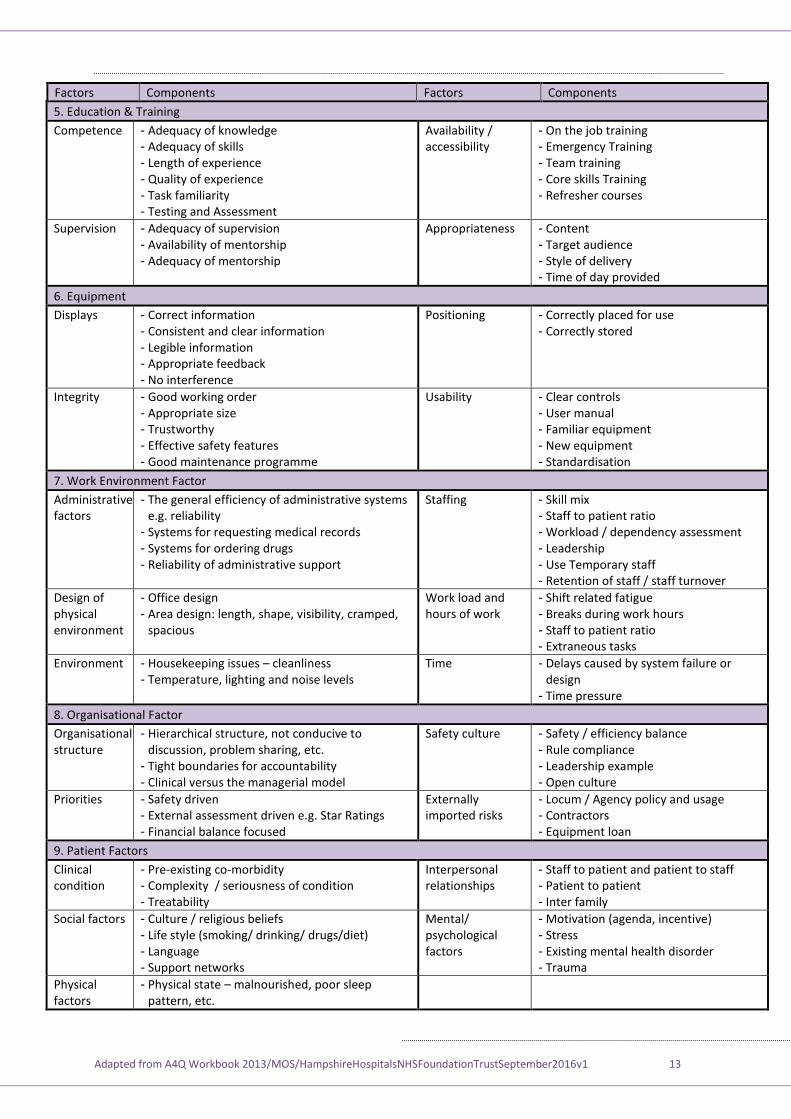
Factors Components Factors Components
5. Education & Training
Competence - Adequacy of knowledge - Adequacy of skills - Length of experience - Quality of experience - Task familiarity - Testing and Assessment
Availability / accessibility
- On the job training - Emergency Training - Team training - Core skills Training - Refresher courses
Supervision - Adequacy of supervision - Availability of mentorship - Adequacy of mentorship
Appropriateness - Content - Target audience - Style of delivery - Time of day provided
6. Equipment
Displays - Correct information - Consistent and clear information - Legible information - Appropriate feedback - No interference
Positioning - Correctly placed for use - Correctly stored
Integrity - Good working order - Appropriate size - Trustworthy - Effective safety features - Good maintenance programme
Usability - Clear controls - User manual - Familiar equipment - New equipment - Standardisation
7. Work Environment Factor
Administrative factors
- The general efficiency of administrative systems e.g. reliability
- Systems for requesting medical records - Systems for ordering drugs - Reliability of administrative support
Staffing - Skill mix - Staff to patient ratio - Workload / dependency assessment - Leadership - Use Temporary staff - Retention of staff / staff turnover
Design of physical environment
- Office design - Area design: length, shape, visibility, cramped,
spacious
Work load and hours of work
- Shift related fatigue - Breaks during work hours - Staff to patient ratio - Extraneous tasks
Environment - Housekeeping issues – cleanliness - Temperature, lighting and noise levels
Time - Delays caused by system failure or design
- Time pressure
8. Organisational Factor
Organisational structure
- Hierarchical structure, not conducive to discussion, problem sharing, etc.
- Tight boundaries for accountability - Clinical versus the managerial model
Safety culture - Safety / efficiency balance - Rule compliance - Leadership example - Open culture
Priorities - Safety driven - External assessment driven e.g. Star Ratings - Financial balance focused
Externally imported risks
- Locum / Agency policy and usage - Contractors - Equipment loan
9. Patient Factors
Clinical condition
- Pre-existing co-morbidity - Complexity / seriousness of condition - Treatability
Interpersonal relationships
- Staff to patient and patient to staff - Patient to patient - Inter family
Social factors - Culture / religious beliefs - Life style (smoking/ drinking/ drugs/diet) - Language - Support networks
Mental/ psychological factors
- Motivation (agenda, incentive) - Stress - Existing mental health disorder - Trauma
Physical factors
- Physical state – malnourished, poor sleep pattern, etc.
Adapted from A4Q Workbook 2013/MOS/HampshireHospitalsNHSFoundationTrustSeptember2016v1 14
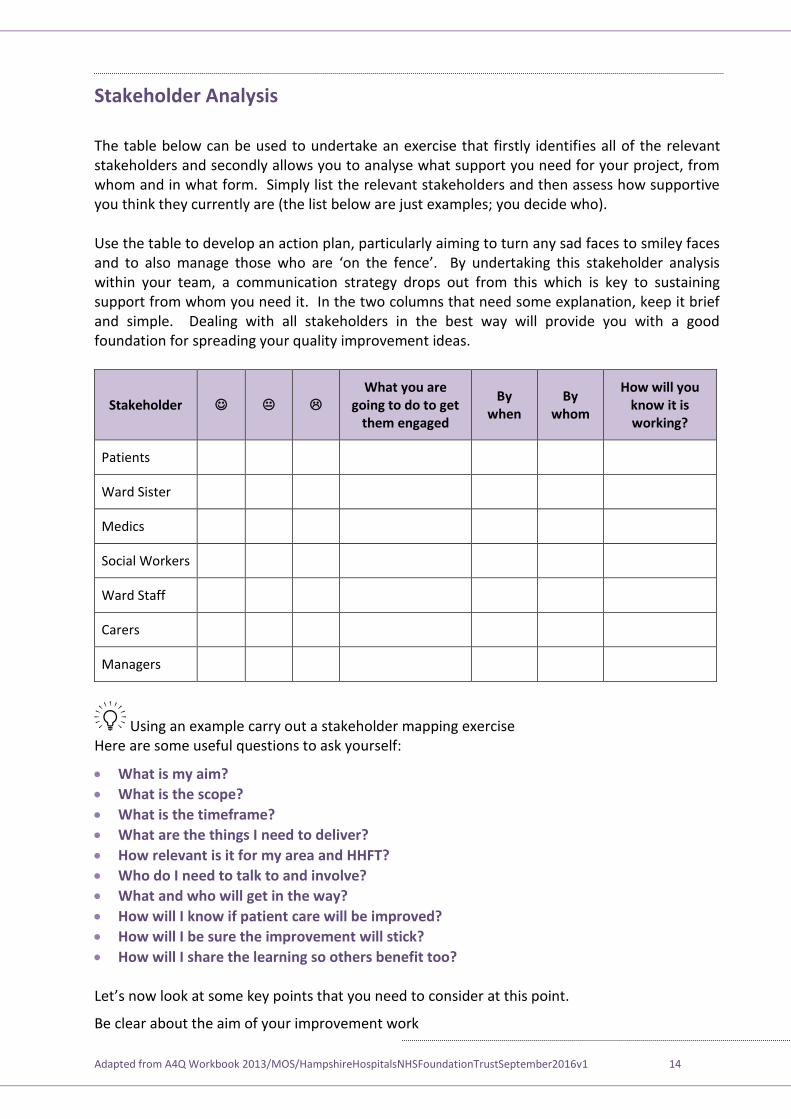
Stakeholder Analysis
The table below can be used to undertake an exercise that firstly identifies all of the relevant stakeholders and secondly allows you to analyse what support you need for your project, from whom and in what form. Simply list the relevant stakeholders and then assess how supportive you think they currently are (the list below are just examples; you decide who). Use the table to develop an action plan, particularly aiming to turn any sad faces to smiley faces and to also manage those who are ‘on the fence’. By undertaking this stakeholder analysis within your team, a communication strategy drops out from this which is key to sustaining support from whom you need it. In the two columns that need some explanation, keep it brief and simple. Dealing with all stakeholders in the best way will provide you with a good foundation for spreading your quality improvement ideas.
Stakeholder What you are
going to do to get them engaged
By when
By whom
How will you know it is working?
Patients
Ward Sister
Medics
Social Workers
Ward Staff
Carers
Managers
Using an example carry out a stakeholder mapping exercise Here are some useful questions to ask yourself:
What is my aim?
What is the scope?
What is the timeframe?
What are the things I need to deliver?
How relevant is it for my area and HHFT?
Who do I need to talk to and involve?
What and who will get in the way?
How will I know if patient care will be improved?
How will I be sure the improvement will stick?
How will I share the learning so others benefit too? et’s now look at some key points that you need to consider at this point.
Be clear about the aim of your improvement work
Adapted from A4Q Workbook 2013/MOS/HampshireHospitalsNHSFoundationTrustSeptember2016v1 15
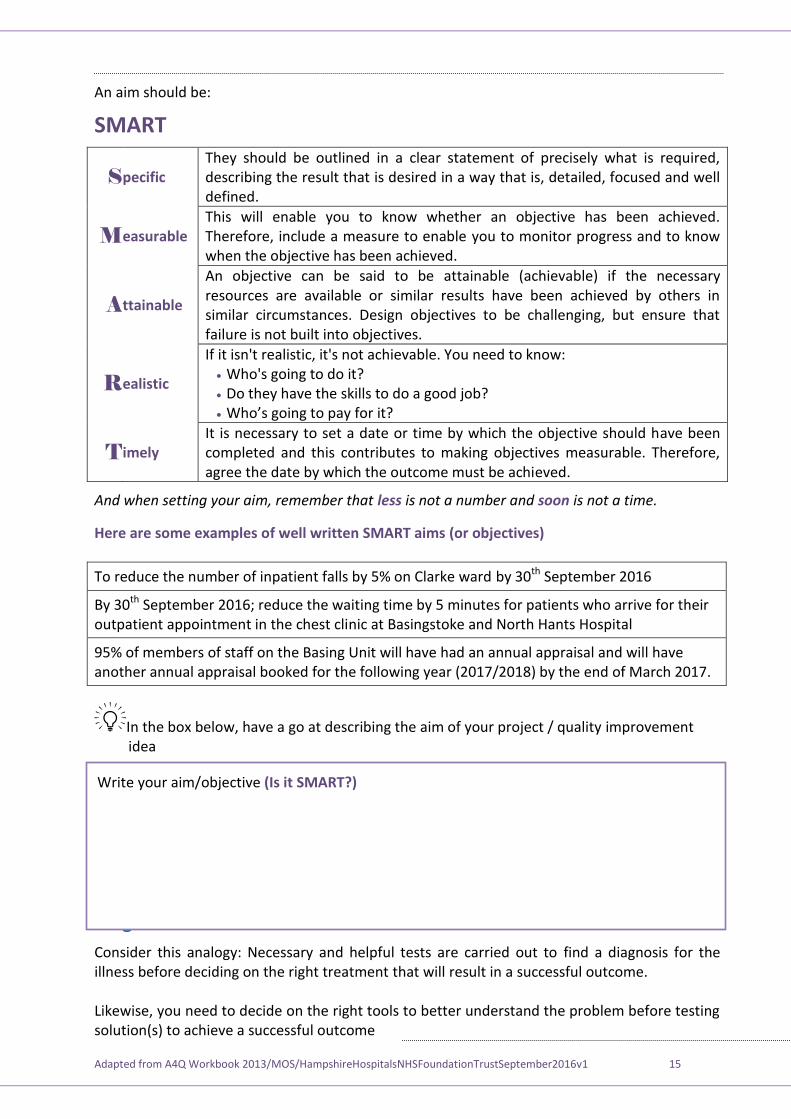
An aim should be:
SMART
S pecific They should be outlined in a clear statement of precisely what is required, describing the result that is desired in a way that is, detailed, focused and well defined.
M easurable This will enable you to know whether an objective has been achieved. Therefore, include a measure to enable you to monitor progress and to know when the objective has been achieved.
A ttainable
An objective can be said to be attainable (achievable) if the necessary resources are available or similar results have been achieved by others in similar circumstances. Design objectives to be challenging, but ensure that failure is not built into objectives.
R ealistic
If it isn't realistic, it's not achievable. You need to know: Who's going to do it? Do they have the skills to do a good job? ho’s going to pay for it
T imely It is necessary to set a date or time by which the objective should have been completed and this contributes to making objectives measurable. Therefore, agree the date by which the outcome must be achieved.
And when setting your aim, remember that less is not a number and soon is not a time.
Here are some examples of well written SMART aims (or objectives)
To reduce the number of inpatient falls by 5% on Clarke ward by 30th September 2016
By 30th September 2016; reduce the waiting time by 5 minutes for patients who arrive for their outpatient appointment in the chest clinic at Basingstoke and North Hants Hospital
95% of members of staff on the Basing Unit will have had an annual appraisal and will have another annual appraisal booked for the following year (2017/2018) by the end of March 2017.
In the box below, have a go at describing the aim of your project / quality improvement idea
Stage Three – Measure and Understand
Consider this analogy: Necessary and helpful tests are carried out to find a diagnosis for the illness before deciding on the right treatment that will result in a successful outcome. Likewise, you need to decide on the right tools to better understand the problem before testing solution(s) to achieve a successful outcome
Write your aim/objective (Is it SMART?)
Adapted from A4Q Workbook 2013/MOS/HampshireHospitalsNHSFoundationTrustSeptember2016v1 16
emember The IHI’s odel for Improvement poses the question “ ow will we know if a change is an improvement?” This question is indicating that measurement is central to the improvement process. So, you need to ensure that the improvement idea/project starts with seeking a better understanding of the problem. This means that you need to measure it by gathering relevant data and information that will provide you with your baseline measures.
Adapted from A4Q Workbook 2013/MOS/HampshireHospitalsNHSFoundationTrustSeptember2016v1 17
Stage 3 – Measure and Understand
A very important point is being clear about what you are going to measure. Remember the IHI’s Model for Improvement? It asks the question:
“ ow will you know if a change is an improvement?”
Measurement is crucial. You have been gathering data about how things are now (the current state) - this is your baseline data. You will need to carry out further measurement when you have tested the changes you want to implement and this will allow you to measure the impact of the change - before and after implementation. So before you get going make sure you have all the baseline data you need to be able to measure the impact.
Data and information are very important to show what difference that your changes have made. Some people find data and information unappealing while some people love it. Try and make sure your quality improvement project involves someone who enjoys working with data and information.
What is measuring?
Measurement can tell us how well our current process is performing and it can also tell us whether the changes we have made have resulted in an improvement. Measurement can tell us if we have reached our aim and if the change has been sustained over time.
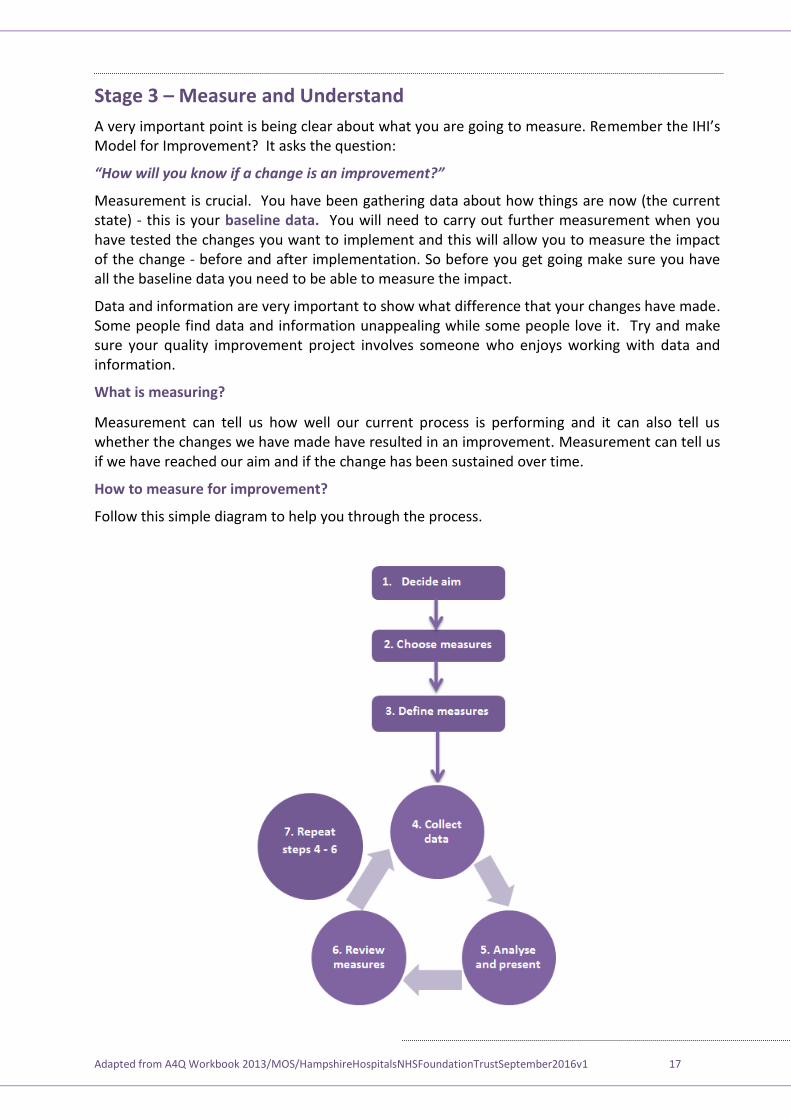
How to measure for improvement?
Follow this simple diagram to help you through the process.
Adapted from A4Q Workbook 2013/MOS/HampshireHospitalsNHSFoundationTrustSeptember2016v1 18
There are 7 Steps to take:
Step 1 – Decide your aim
Step 2 – Choose your measures
Step 3 – Confirm how to collect your data
Step 4 – Collect your baseline data
Step 5 – Analyse and present your data
Step 6 – Meet to decide what it is telling you
Step 7 – Repeat steps 4 to 6
Here are some top tips:
Measure the minimum – only collect what you need, keep things as simple as possible.
Aim to make measurement part of the daily routine.
Where possible use forms or charts that are already used or add to one already in place. This helps to minimise the burden on staff.
Measurement for improvement
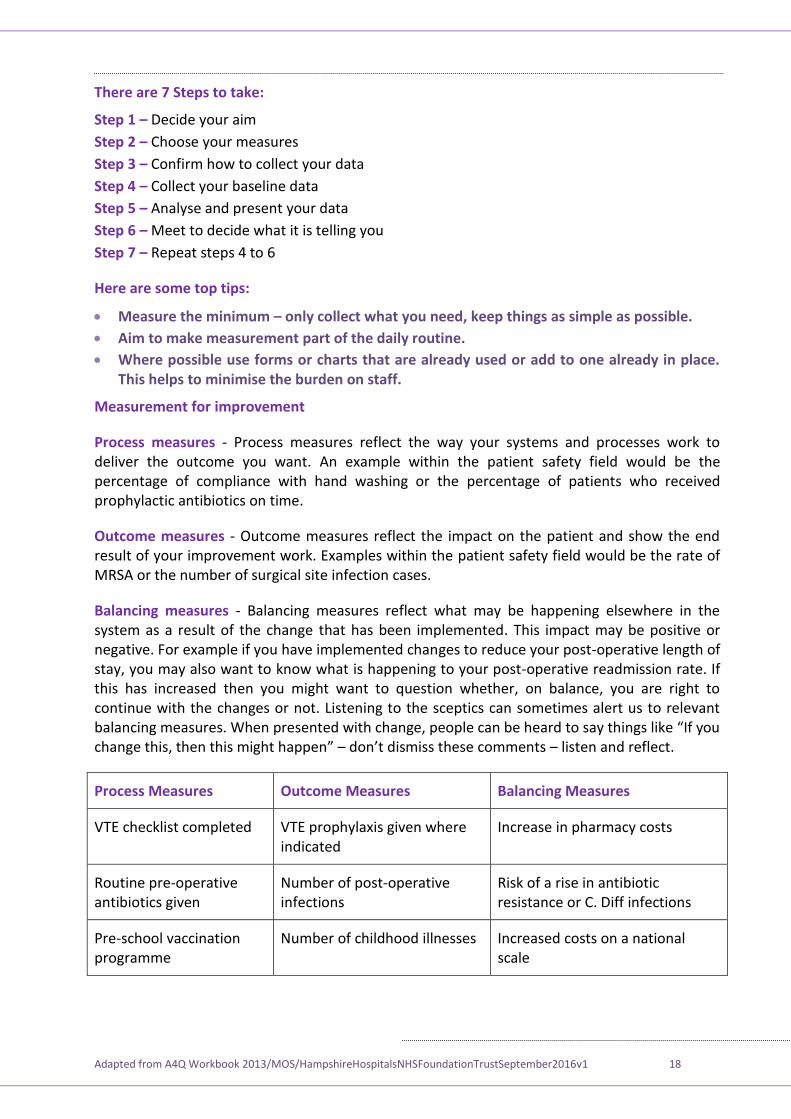
Process measures - Process measures reflect the way your systems and processes work to deliver the outcome you want. An example within the patient safety field would be the percentage of compliance with hand washing or the percentage of patients who received prophylactic antibiotics on time.
Outcome measures - Outcome measures reflect the impact on the patient and show the end result of your improvement work. Examples within the patient safety field would be the rate of MRSA or the number of surgical site infection cases.
Balancing measures - Balancing measures reflect what may be happening elsewhere in the system as a result of the change that has been implemented. This impact may be positive or negative. For example if you have implemented changes to reduce your post-operative length of stay, you may also want to know what is happening to your post-operative readmission rate. If this has increased then you might want to question whether, on balance, you are right to continue with the changes or not. Listening to the sceptics can sometimes alert us to relevant balancing measures. hen presented with change, people can be heard to say things like “If you change this, then this might happen” – don’t dismiss these comments – listen and reflect.
Process Measures Outcome Measures Balancing Measures
VTE checklist completed VTE prophylaxis given where indicated
Increase in pharmacy costs
Routine pre-operative antibiotics given
Number of post-operative infections
Risk of a rise in antibiotic resistance or C. Diff infections
Pre-school vaccination programme
Number of childhood illnesses Increased costs on a national scale
Adapted from A4Q Workbook 2013/MOS/HampshireHospitalsNHSFoundationTrustSeptember2016v1 19
What to Measure
This goes back to your change ideas (for instance, reducing inpatient falls). Then you need to have a specific aim (or objective) for example: reducing the number of inpatient falls by 5% in 6 months.
What measures to use? o you need to measure but you don’t know what you need Here are areas to consider measuring along with some methods / tools:
What How / relevant tools / application
Patient / carer perspectives and experience
Patient Stories – get insight into the ‘real world’ of receiving care. Find the ‘common’ experience rather than the exceptions. Helps keep changes focused on improving patient experience
PALS information
Complaints and compliments
Patient interviews
Staff perceptions Local / focused survey – simple questioning focused on gaining clarity of staff views and opinions
Brainstorming – generates lots of ideas underpinned by working together as a team. Allows grouping of ideas and prioritisation
Incidents/accidents – analysing data helps objective approach and provides a baseline from which to measure improvement after testing change(s)
Other stakeholders
Stakeholder Mapping – identifies all those involved in and affected by the issue to be addressed. Basis for establishing a communications plan
PALS information
CQC reports
Systems / processes
Process Mapping – Diagnostic tool to understand the steps in a process
Cause and Effect (Fishbone Diagram) – Diagnostic tool to think through causes not just symptoms
Root Cause Analysis (5 Whys) – iagnostic tool repeatedly asking ‘why’ to get to the root cause of the problem
What is currently recorded? Is the data already being collected by somebody else or can you add your requirement to an existing audit form? Or - is there something suitable already in use/existence that means you won’t need to start from scratch?
Choose what you want to measure - Choose exactly what you want to measure e.g. the number of inpatient falls through a year OR the number of inpatient falls resulting in harm to the patient over a year.
You will want to have some data before you put the improvement idea in place so you can see where you are starting from and monitor how the data changes over the time of the project – measurement for improvement.
Adapted from A4Q Workbook 2013/MOS/HampshireHospitalsNHSFoundationTrustSeptember2016v1 20
How should the data be expressed?
Count – this is counting a target population, for example the number of patients on a ward. This is hard to compare over time especially if the numbers change.
Ratios or rates – when you want to relate the measure (e.g. inpatient falls) to another factor, for example bed days (i.e. the Number of inpatient falls per 1000 bed days). This can be calculated as follows: number of Falls/Number of Bed Days multiplied by 1000
Percentages – when you want to make the focus more specific (e.g. If you are looking at the number of inpatient falls) measure this as a rate; but if you want to focus on patient harm, then you could select the percentage (%) of patients that were harmed by their fall in hospital.
Presenting the data
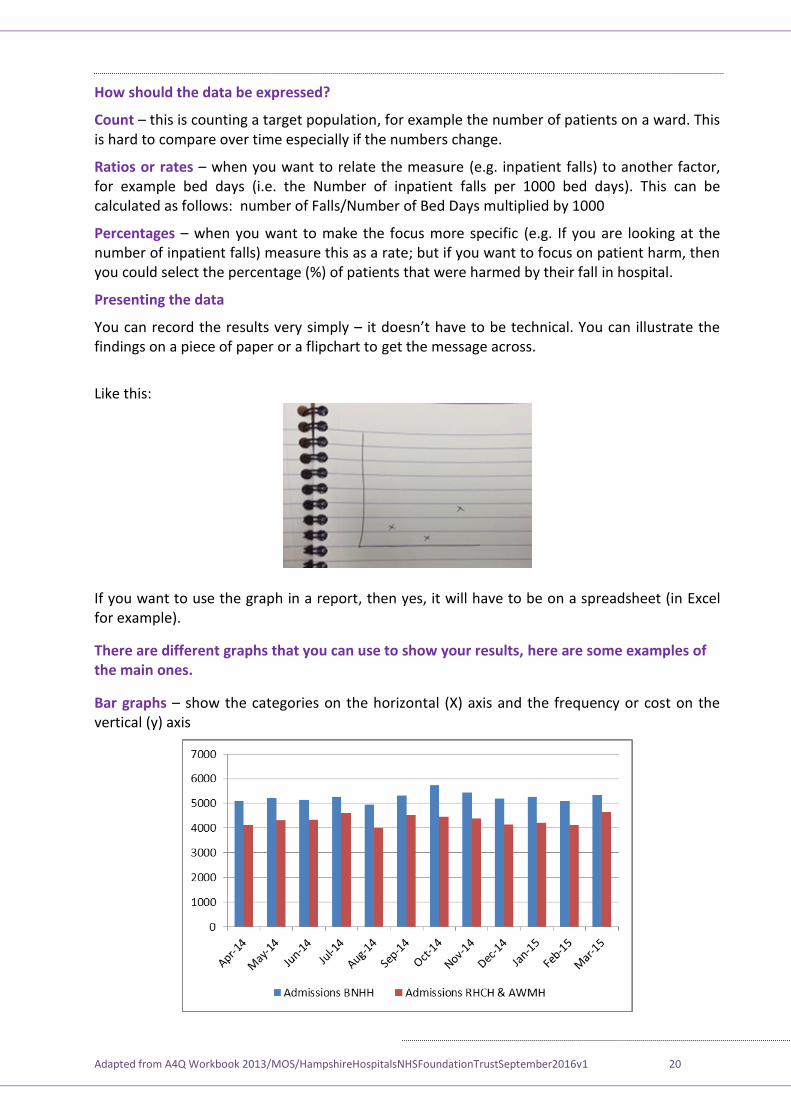
You can record the results very simply – it doesn’t have to be technical. ou can illustrate the findings on a piece of paper or a flipchart to get the message across.
Like this:
If you want to use the graph in a report, then yes, it will have to be on a spreadsheet (in Excel for example).
There are different graphs that you can use to show your results, here are some examples of the main ones.
Bar graphs – show the categories on the horizontal (X) axis and the frequency or cost on the vertical (y) axis
Adapted from A4Q Workbook 2013/MOS/HampshireHospitalsNHSFoundationTrustSeptember2016v1 21
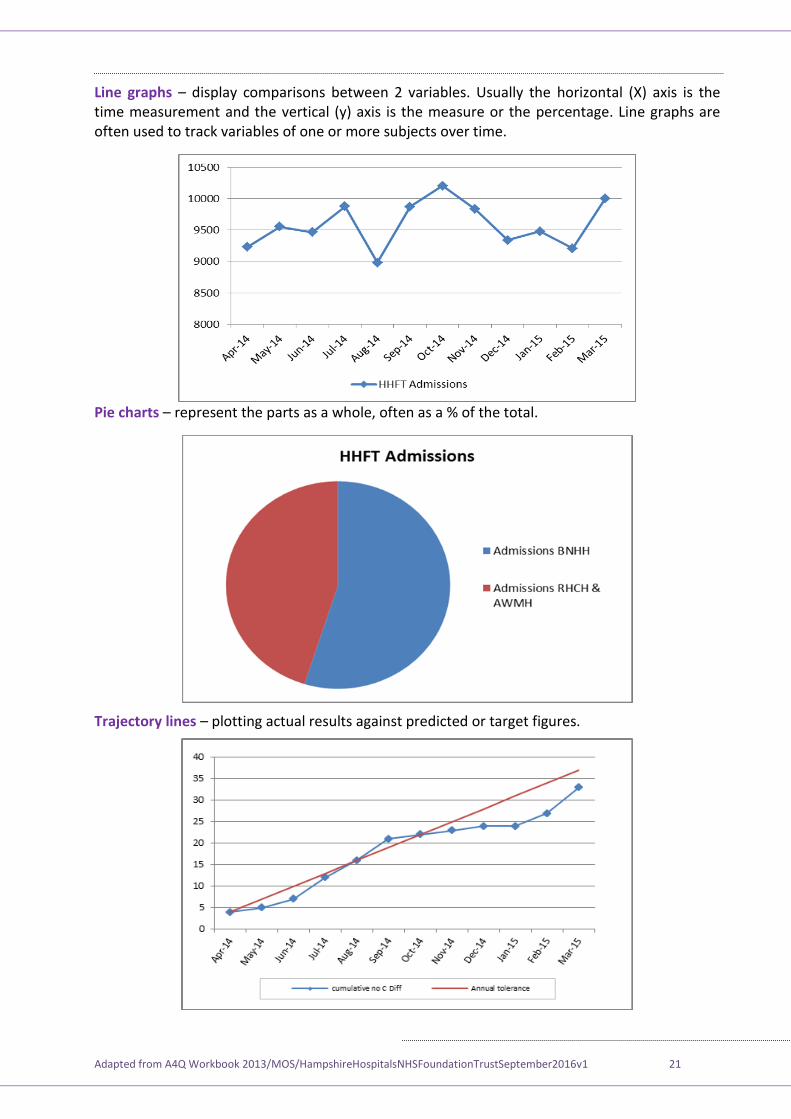
Line graphs – display comparisons between 2 variables. Usually the horizontal (X) axis is the time measurement and the vertical (y) axis is the measure or the percentage. Line graphs are often used to track variables of one or more subjects over time.
Pie charts – represent the parts as a whole, often as a % of the total.
Trajectory lines – plotting actual results against predicted or target figures.
Adapted from A4Q Workbook 2013/MOS/HampshireHospitalsNHSFoundationTrustSeptember2016v1 22
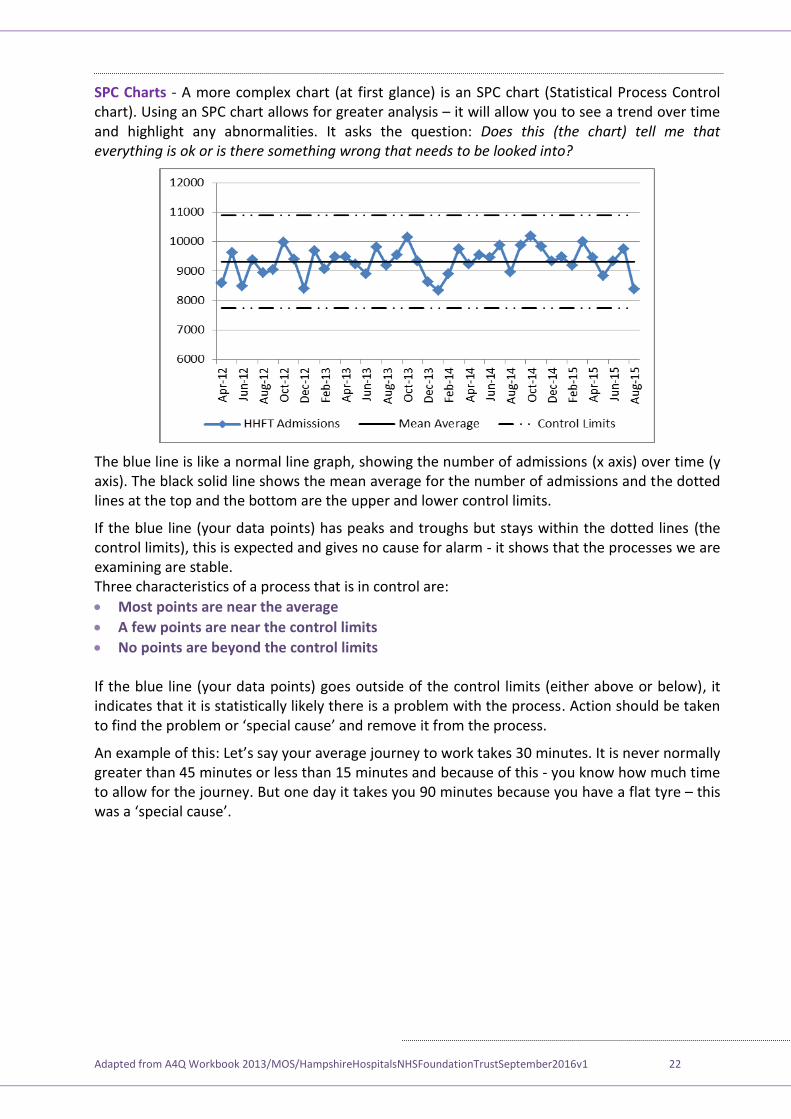
SPC Charts - A more complex chart (at first glance) is an SPC chart (Statistical Process Control chart). Using an SPC chart allows for greater analysis – it will allow you to see a trend over time and highlight any abnormalities. It asks the question: Does this (the chart) tell me that everything is ok or is there something wrong that needs to be looked into?
The blue line is like a normal line graph, showing the number of admissions (x axis) over time (y axis). The black solid line shows the mean average for the number of admissions and the dotted lines at the top and the bottom are the upper and lower control limits.
If the blue line (your data points) has peaks and troughs but stays within the dotted lines (the control limits), this is expected and gives no cause for alarm - it shows that the processes we are examining are stable. Three characteristics of a process that is in control are:
Most points are near the average
A few points are near the control limits
No points are beyond the control limits If the blue line (your data points) goes outside of the control limits (either above or below), it indicates that it is statistically likely there is a problem with the process. Action should be taken to find the problem or ‘special cause’ and remove it from the process.
An example of this: et’s say your average journey to work takes 30 minutes. It is never normally greater than 45 minutes or less than 15 minutes and because of this - you know how much time to allow for the journey. But one day it takes you 90 minutes because you have a flat tyre – this was a ‘special cause’.
Adapted from A4Q Workbook 2013/MOS/HampshireHospitalsNHSFoundationTrustSeptember2016v1 23
Stage 4 – Plan and Design This is the stage where you will plan and design the steps to take so that you can achieve the aims of your improvement idea.
Driver diagrams You will have gathered relevant information by now to have a very clear understanding of the problem. It may feel like a challenge to know what to do with all the information!
You need to form a plan, whether the task is simple or complex. A driver diagram is an effective tool that helps you to clarify and explain your improvement goals using a logical set of goals (drivers) and a description of the plans and tasks to be completed. It describes a complete quality improvement programme in one diagram and also provides a measurement framework for monitoring the progress of your project.
Primary Drivers: A set of factors or improvement areas that we believe must be addressed to achieve the desired outcome. They should be written as straightforward statements rather than as numeric targets.
Secondary Drivers: Specific areas where we plan changes or interventions. Each secondary driver will contribute to at least one primary driver. They should be process changes that we have reason to think will impact the outcome (should have an evidence base). They should be necessary and (collectively) sufficient to achieve the aim.
Ideas for consideration as drivers can be generated in a number of different ways - see Stage 1 (page 7).
A Driver Diagram helps us complete the framework contained in the Model for Improvement tool (page 6). It allows us to link the first question - What are we trying to accomplish? and the third question What change(s) can we make that will result in improvement?
By making the Aim and the changes we will test and implement explicit, it also allows us to determine what measures we will need to track to answer the Model for Improvement's second question - 'How will we know that a change is an improvement?'.
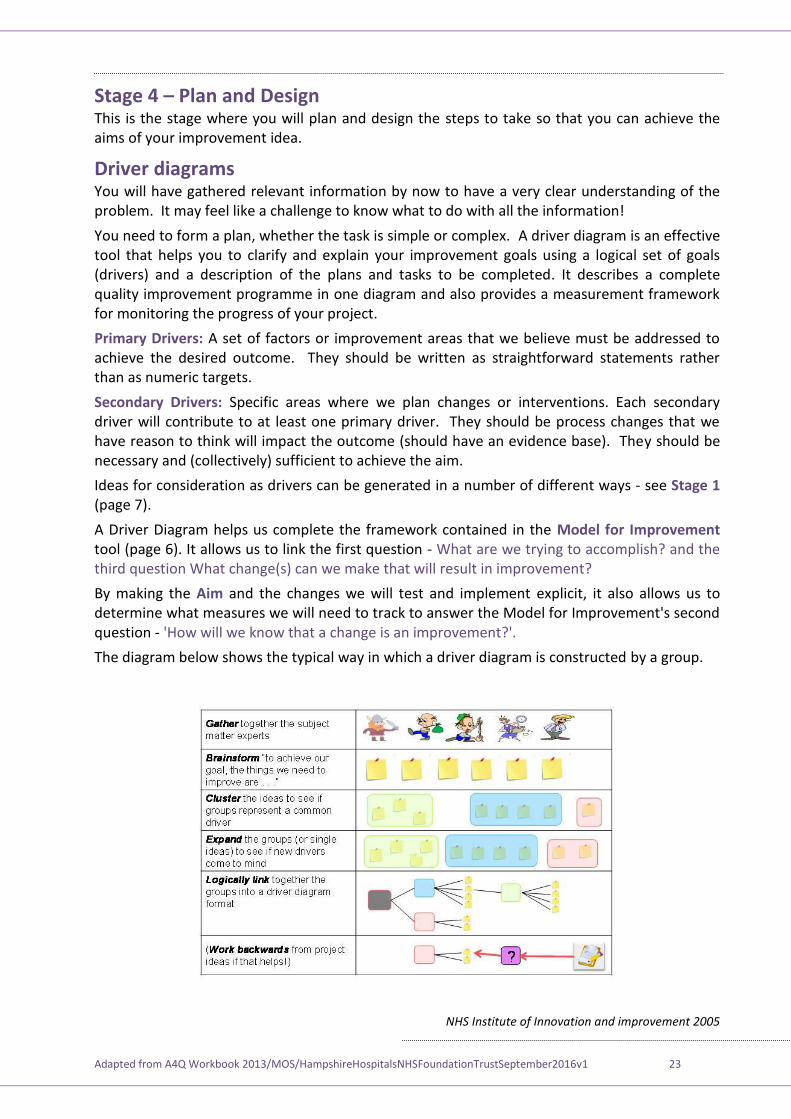
The diagram below shows the typical way in which a driver diagram is constructed by a group.
NHS Institute of Innovation and improvement 2005
Adapted from A4Q Workbook 2013/MOS/HampshireHospitalsNHSFoundationTrustSeptember2016v1 24
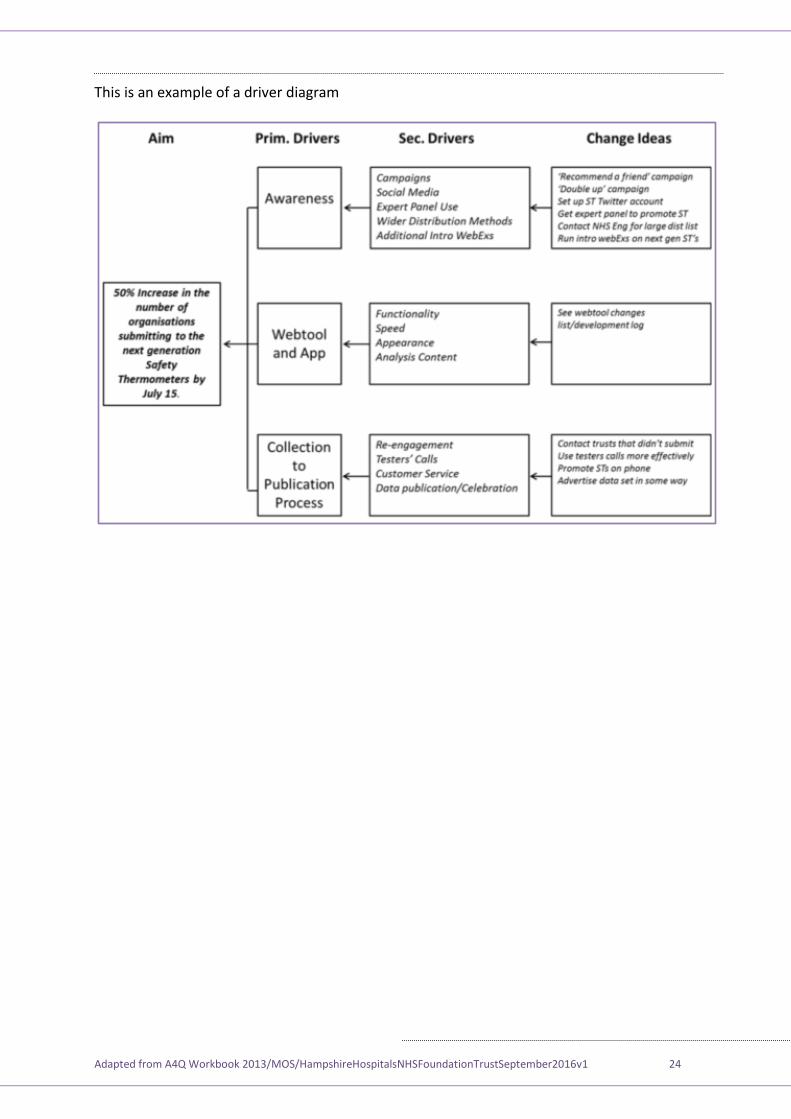
This is an example of a driver diagram
Adapted from A4Q Workbook 2013/MOS/HampshireHospitalsNHSFoundationTrustSeptember2016v1 25
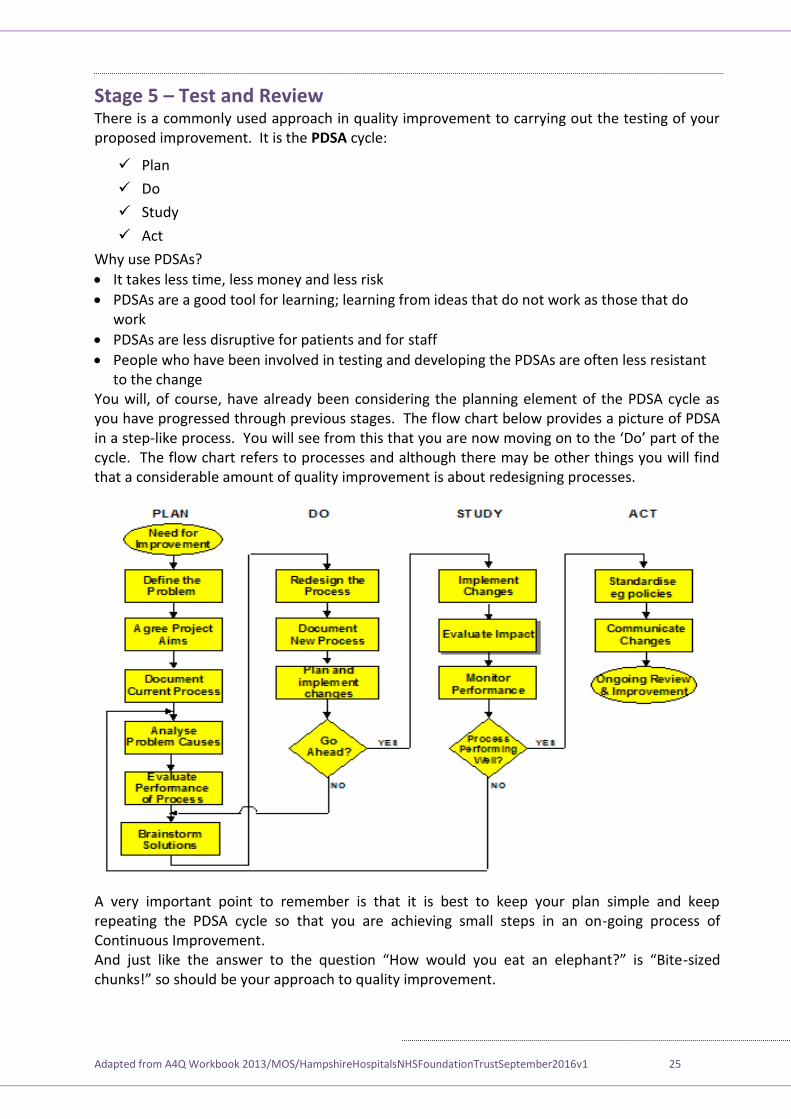
Stage 5 – Test and Review There is a commonly used approach in quality improvement to carrying out the testing of your proposed improvement. It is the PDSA cycle:
Plan
Do
Study
Act
Why use PDSAs?
It takes less time, less money and less risk
PDSAs are a good tool for learning; learning from ideas that do not work as those that do work
PDSAs are less disruptive for patients and for staff
People who have been involved in testing and developing the PDSAs are often less resistant to the change
You will, of course, have already been considering the planning element of the PDSA cycle as you have progressed through previous stages. The flow chart below provides a picture of PDSA in a step-like process. ou will see from this that you are now moving on to the ‘ o’ part of the cycle. The flow chart refers to processes and although there may be other things you will find that a considerable amount of quality improvement is about redesigning processes.
A very important point to remember is that it is best to keep your plan simple and keep repeating the PDSA cycle so that you are achieving small steps in an on-going process of Continuous Improvement. And ust like the answer to the question “How would you eat an elephant ” is “Bite-sized chunks!” so should be your approach to quality improvement.
Adapted from A4Q Workbook 2013/MOS/HampshireHospitalsNHSFoundationTrustSeptember2016v1 26
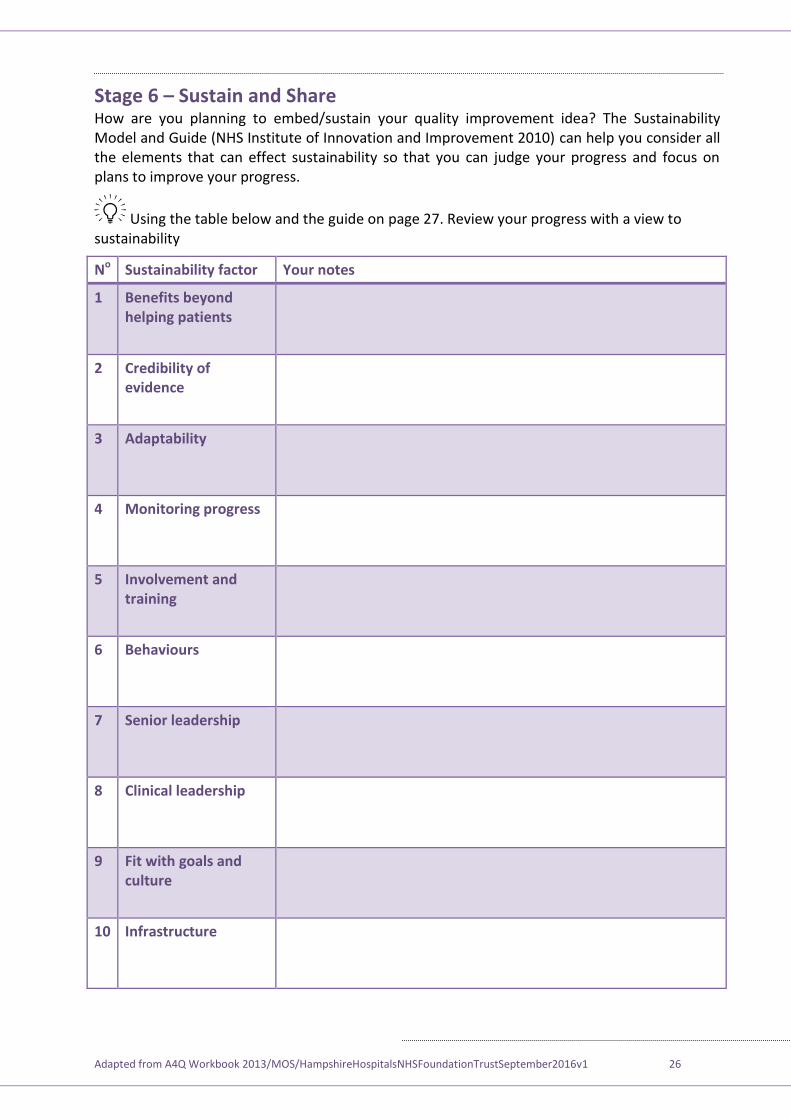
Stage 6 – Sustain and Share How are you planning to embed/sustain your quality improvement idea? The Sustainability Model and Guide (NHS Institute of Innovation and Improvement 2010) can help you consider all the elements that can effect sustainability so that you can judge your progress and focus on plans to improve your progress.
Using the table below and the guide on page 27. Review your progress with a view to sustainability
No Sustainability factor Your notes
1 Benefits beyond helping patients
2 Credibility of evidence
3 Adaptability
4 Monitoring progress
5 Involvement and training
6 Behaviours
7 Senior leadership
8 Clinical leadership
9 Fit with goals and culture
10 Infrastructure
Adapted from A4Q Workbook 2013/MOS/HampshireHospitalsNHSFoundationTrustSeptember2016v1 27
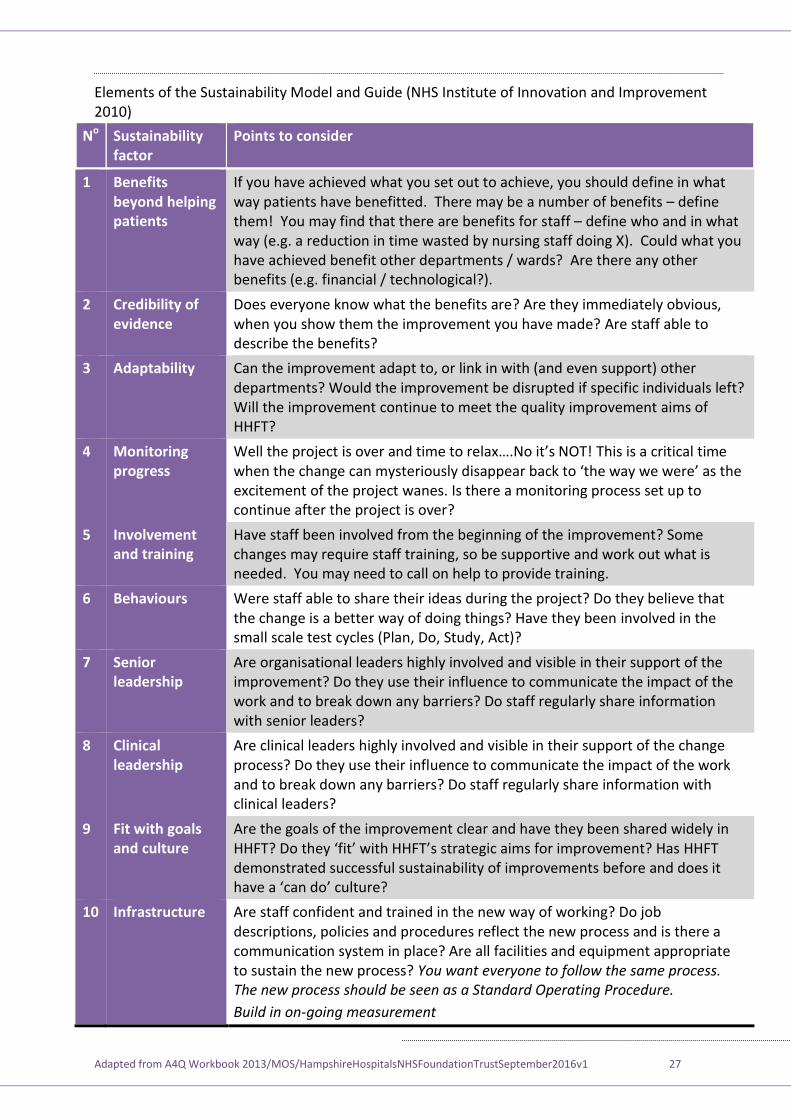
Elements of the Sustainability Model and Guide (NHS Institute of Innovation and Improvement 2010)
No Sustainability factor
Points to consider
1 Benefits beyond helping patients
If you have achieved what you set out to achieve, you should define in what way patients have benefitted. There may be a number of benefits – define them! You may find that there are benefits for staff – define who and in what way (e.g. a reduction in time wasted by nursing staff doing X). Could what you have achieved benefit other departments / wards? Are there any other benefits (e.g. financial / technological?).
2 Credibility of evidence
Does everyone know what the benefits are? Are they immediately obvious, when you show them the improvement you have made? Are staff able to describe the benefits?
3 Adaptability Can the improvement adapt to, or link in with (and even support) other departments? Would the improvement be disrupted if specific individuals left? Will the improvement continue to meet the quality improvement aims of HHFT?
4 Monitoring progress
ell the pro ect is over and time to relax…. o it’s T! This is a critical time when the change can mysteriously disappear back to ‘the way we were’ as the excitement of the project wanes. Is there a monitoring process set up to continue after the project is over?
5 Involvement and training
Have staff been involved from the beginning of the improvement? Some changes may require staff training, so be supportive and work out what is needed. You may need to call on help to provide training.
6 Behaviours Were staff able to share their ideas during the project? Do they believe that the change is a better way of doing things? Have they been involved in the small scale test cycles (Plan, Do, Study, Act)?
7 Senior leadership
Are organisational leaders highly involved and visible in their support of the improvement? Do they use their influence to communicate the impact of the work and to break down any barriers? Do staff regularly share information with senior leaders?
8 Clinical leadership
Are clinical leaders highly involved and visible in their support of the change process? Do they use their influence to communicate the impact of the work and to break down any barriers? Do staff regularly share information with clinical leaders?
9 Fit with goals and culture
Are the goals of the improvement clear and have they been shared widely in HHFT? o they ‘fit’ with HHFT’s strategic aims for improvement? Has HHFT demonstrated successful sustainability of improvements before and does it have a ‘can do’ culture
10 Infrastructure Are staff confident and trained in the new way of working? Do job descriptions, policies and procedures reflect the new process and is there a communication system in place? Are all facilities and equipment appropriate to sustain the new process? You want everyone to follow the same process. The new process should be seen as a Standard Operating Procedure.
Build in on-going measurement
Adapted from A4Q Workbook 2013/MOS/HampshireHospitalsNHSFoundationTrustSeptember2016v1 28
Further information and contacts
For quality improvement advice/support:
ary ’ hea, Patient afety Advisor, mary.o’[email protected]
Clare Parish, Quality and Risk Co-ordinator, [email protected]
For Clinical Audit enquiries/support:
Angie Rice, Clinical Effectiveness Manager, [email protected] Crystal Connoley, Clinical Effectiveness Facilitator, [email protected] Or [email protected]
HHFT Governance team
You can visit the HHFT Governance team intranet page here.
References
Principles for Best Practice in Clinical Audit (NICE/CHI 2002) Clinical Audit
NHS Institute of Innovation and improvement LINK
Measurement for improvement
Process mapping
7 steps to measurement process
The Sustainability Model and guide
Langley. G, et al, (2009) The Improvement Guide: A Practical Approach to Enhancing Organizational Performance (2nd Edition). Jossey Bass, San Francisco
Adapted from A4Q Workbook 2013/MOS/HampshireHospitalsNHSFoundationTrustSeptember2016v1 29
Quality Improvement Training
Workbook
A Quality Improvement story
“ ommunicating with relatives”
Adapted from A4Q Workbook 2013/MOS/HampshireHospitalsNHSFoundationTrustSeptember2016v1 30
Scenario
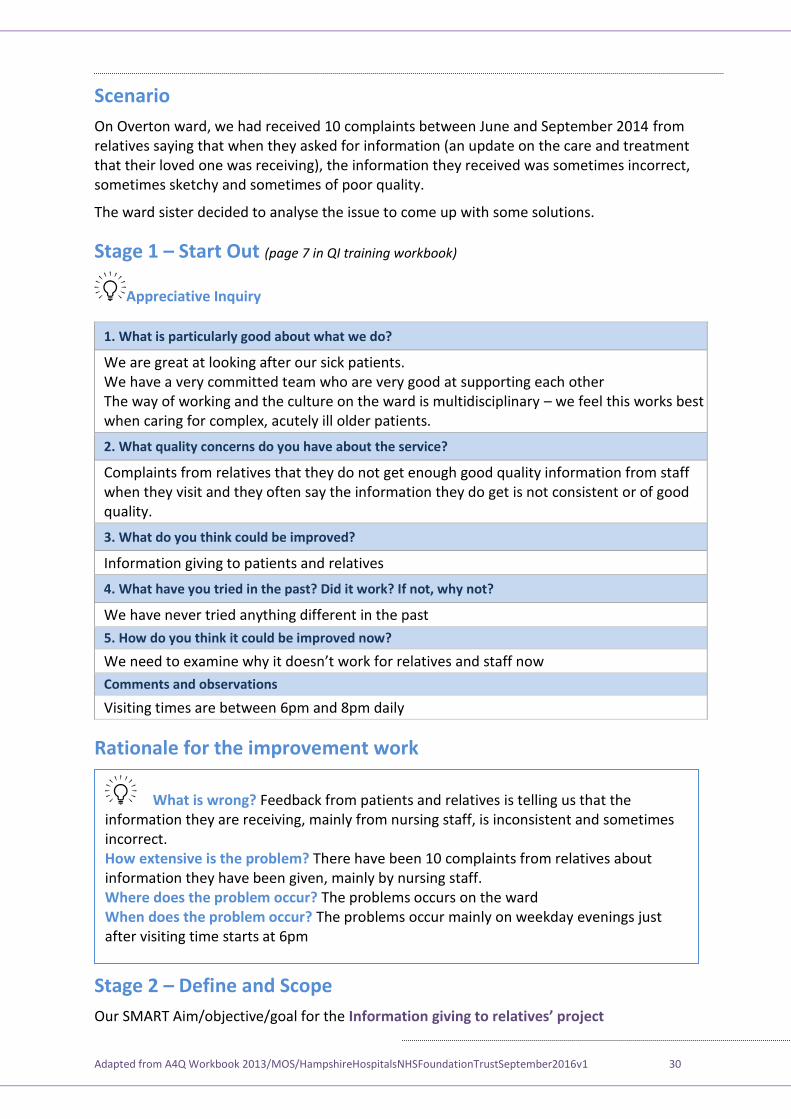
On Overton ward, we had received 10 complaints between June and September 2014 from relatives saying that when they asked for information (an update on the care and treatment that their loved one was receiving), the information they received was sometimes incorrect, sometimes sketchy and sometimes of poor quality.
The ward sister decided to analyse the issue to come up with some solutions.
(page 7 in QI training workbook) Stage 1 – Start Out
Appreciative Inquiry
1. What is particularly good about what we do?
We are great at looking after our sick patients. We have a very committed team who are very good at supporting each other The way of working and the culture on the ward is multidisciplinary – we feel this works best when caring for complex, acutely ill older patients.
2. What quality concerns do you have about the service?
Complaints from relatives that they do not get enough good quality information from staff when they visit and they often say the information they do get is not consistent or of good quality.
3. What do you think could be improved?
Information giving to patients and relatives
4. What have you tried in the past? Did it work? If not, why not?
We have never tried anything different in the past
5. How do you think it could be improved now?
We need to examine why it doesn’t work for relatives and staff now
Comments and observations
Visiting times are between 6pm and 8pm daily
Rationale for the improvement work
Stage 2 – Define and Scope
Our SMART Aim/objective/goal for the I ’
Feedback from patients and relatives is telling us that the What is wrong? information they are receiving, mainly from nursing staff, is inconsistent and sometimes incorrect.
There have been 10 complaints from relatives about How extensive is the problem? information they have been given, mainly by nursing staff.
The problems occurs on the ward Where does the problem occur? The problems occur mainly on weekday evenings just When does the problem occur?
after visiting time starts at 6pm
Adapted from A4Q Workbook 2013/MOS/HampshireHospitalsNHSFoundationTrustSeptember2016v1 31
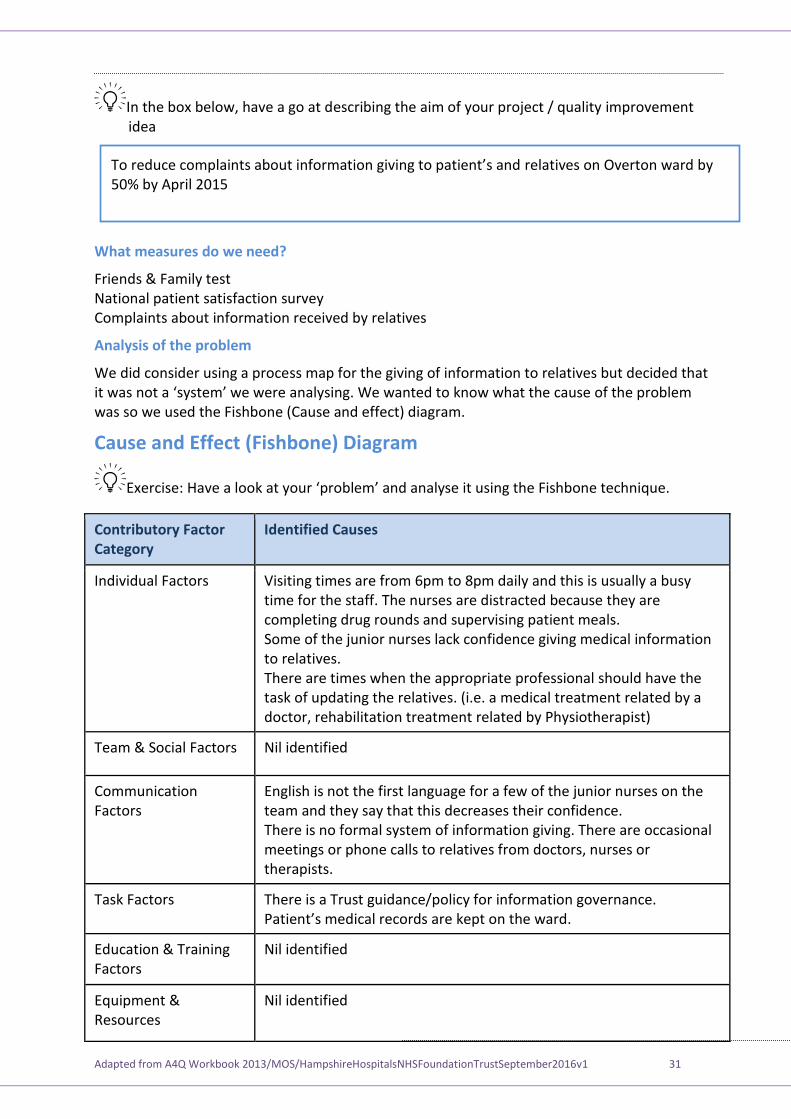
In the box below, have a go at describing the aim of your project / quality improvement idea
What measures do we need?
Friends & Family test National patient satisfaction survey Complaints about information received by relatives
Analysis of the problem
We did consider using a process map for the giving of information to relatives but decided that it was not a ‘system’ we were analysing. e wanted to know what the cause of the problem was so we used the Fishbone (Cause and effect) diagram.
Cause and Effect (Fishbone) Diagram
Exercise Have a look at your ‘problem’ and analyse it using the Fishbone technique.
Contributory Factor Category
Identified Causes
Individual Factors Visiting times are from 6pm to 8pm daily and this is usually a busy time for the staff. The nurses are distracted because they are completing drug rounds and supervising patient meals. Some of the junior nurses lack confidence giving medical information to relatives. There are times when the appropriate professional should have the task of updating the relatives. (i.e. a medical treatment related by a doctor, rehabilitation treatment related by Physiotherapist)
Team & Social Factors Nil identified
Communication Factors
English is not the first language for a few of the junior nurses on the team and they say that this decreases their confidence. There is no formal system of information giving. There are occasional meetings or phone calls to relatives from doctors, nurses or therapists.
Task Factors There is a Trust guidance/policy for information governance. Patient’s medical records are kept on the ward.
Education & Training Factors
Nil identified
Equipment & Resources
Nil identified
To reduce complaints about information giving to patient’s and relatives on Overton ward by 50% by April 2015
Adapted from A4Q Workbook 2013/MOS/HampshireHospitalsNHSFoundationTrustSeptember2016v1 32
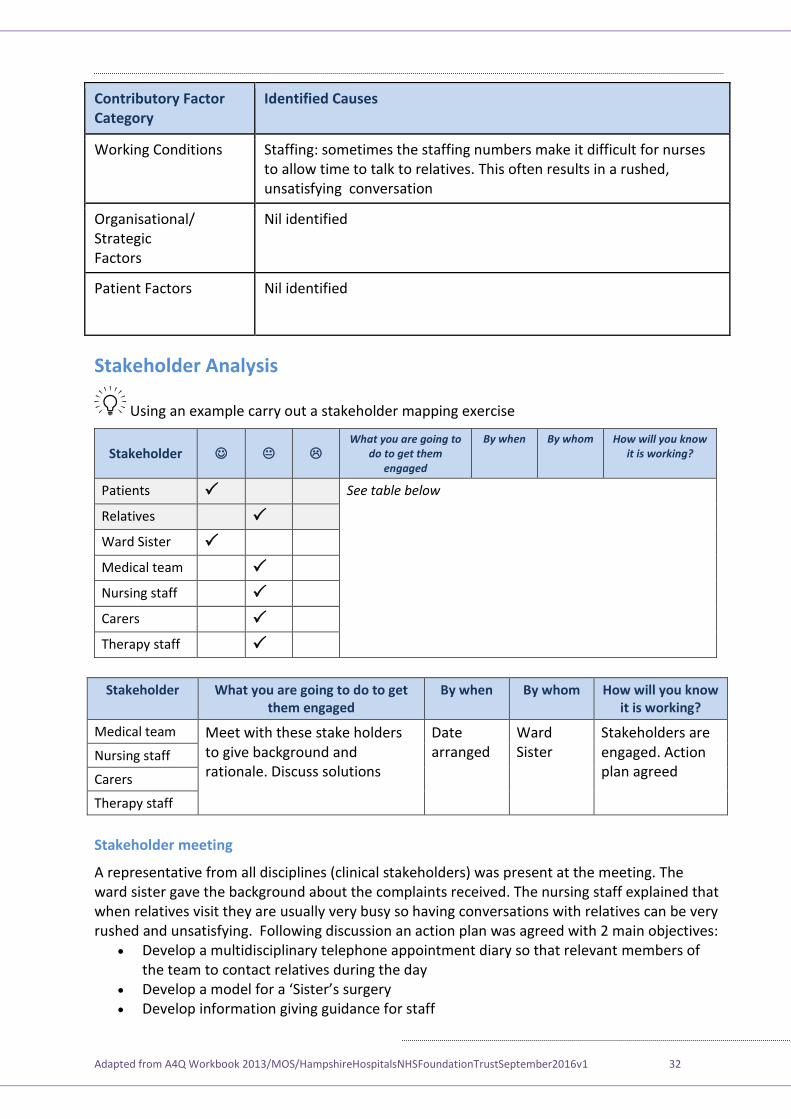
Contributory Factor Category
Identified Causes
Working Conditions Staffing: sometimes the staffing numbers make it difficult for nurses to allow time to talk to relatives. This often results in a rushed, unsatisfying conversation
Organisational/ Strategic Factors
Nil identified
Patient Factors Nil identified
Stakeholder Analysis
Using an example carry out a stakeholder mapping exercise
Stakeholder What you are going to
do to get them engaged
By when By whom How will you know it is working?
Patients See table below
Relatives
Ward Sister
Medical team
Nursing staff
Carers
Therapy staff
Stakeholder What you are going to do to get them engaged
By when By whom How will you know it is working?
Medical team Meet with these stake holders to give background and rationale. Discuss solutions
Date arranged
Ward Sister
Stakeholders are engaged. Action plan agreed
Nursing staff
Carers
Therapy staff
Stakeholder meeting
A representative from all disciplines (clinical stakeholders) was present at the meeting. The ward sister gave the background about the complaints received. The nursing staff explained that when relatives visit they are usually very busy so having conversations with relatives can be very rushed and unsatisfying. Following discussion an action plan was agreed with 2 main objectives:
Develop a multidisciplinary telephone appointment diary so that relevant members of the team to contact relatives during the day
evelop a model for a ‘ ister’s surgery Develop information giving guidance for staff
Adapted from A4Q Workbook 2013/MOS/HampshireHospitalsNHSFoundationTrustSeptember2016v1 33
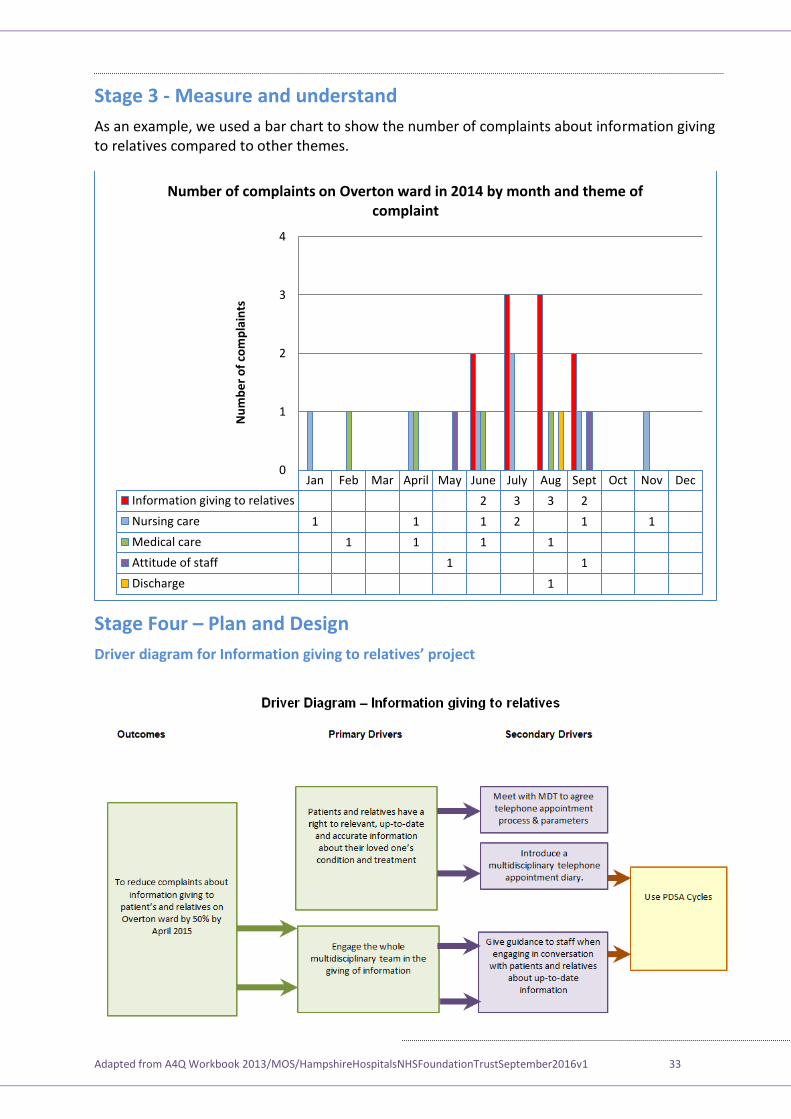
Stage 3 - Measure and understand
As an example, we used a bar chart to show the number of complaints about information giving to relatives compared to other themes.
Stage Four – Plan and Design
’
Jan Feb Mar April May June July Aug Sept Oct Nov Dec
Information giving to relatives 2 3 3 2
Nursing care 1 1 1 2 1 1
Medical care 1 1 1 1
Attitude of staff 1 1
Discharge 1
0
1
2
3
4N
um
be
r o
f co
mp
lain
ts
Number of complaints on Overton ward in 2014 by month and theme of complaint
Adapted from A4Q Workbook 2013/MOS/HampshireHospitalsNHSFoundationTrustSeptember2016v1 34
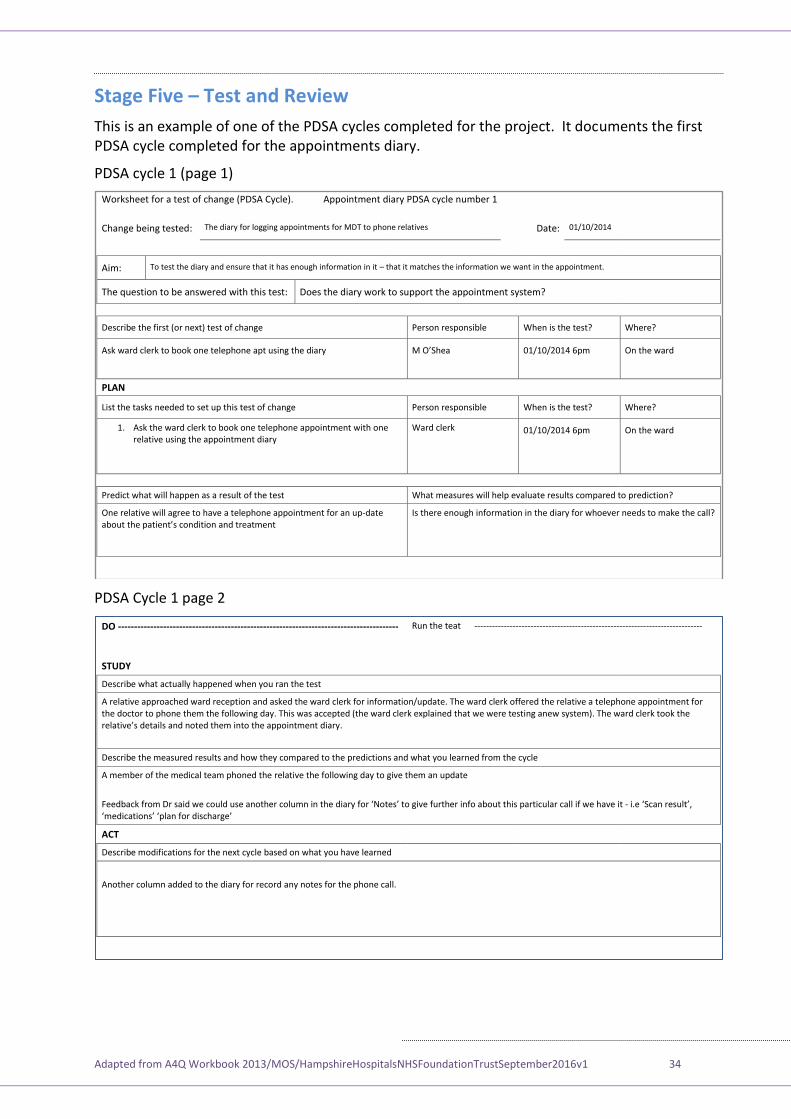
Stage Five – Test and Review
This is an example of one of the PDSA cycles completed for the project. It documents the first PDSA cycle completed for the appointments diary.
PDSA cycle 1 (page 1)
PDSA Cycle 1 page 2
Worksheet for a test of change (PDSA Cycle). Appointment diary PDSA cycle number 1
Change being tested: The diary for logging appointments for MDT to phone relatives Date: 01/10/2014
Aim: To test the diary and ensure that it has enough information in it – that it matches the information we want in the appointment.
The question to be answered with this test: Does the diary work to support the appointment system?
Describe the first (or next) test of change Person responsible When is the test? Where?
Ask ward clerk to book one telephone apt using the diary
’ hea 01/10/2014 6pm On the ward
PLAN
List the tasks needed to set up this test of change Person responsible When is the test? Where?
1. Ask the ward clerk to book one telephone appointment with one relative using the appointment diary
Ward clerk 01/10/2014 6pm On the ward
Predict what will happen as a result of the test What measures will help evaluate results compared to prediction?
One relative will agree to have a telephone appointment for an up-date about the patient’s condition and treatment
Is there enough information in the diary for whoever needs to make the call?
DO --------------------------------------------------------------------------------------- Run the teat -----------------------------------------------------------------------------
STUDY
Describe what actually happened when you ran the test
A relative approached ward reception and asked the ward clerk for information/update. The ward clerk offered the relative a telephone appointment for the doctor to phone them the following day. This was accepted (the ward clerk explained that we were testing anew system). The ward clerk took the relative’s details and noted them into the appointment diary.
Describe the measured results and how they compared to the predictions and what you learned from the cycle
A member of the medical team phoned the relative the following day to give them an update
Feedback from Dr said we could use another column in the diary for ‘Notes’ to give further info about this particular call if we have it - i.e ‘Scan result’, ‘medications’ ‘plan for discharge’
ACT
Describe modifications for the next cycle based on what you have learned
Another column added to the diary for record any notes for the phone call.
Adapted from A4Q Workbook 2013/MOS/HampshireHospitalsNHSFoundationTrustSeptember2016v1 35
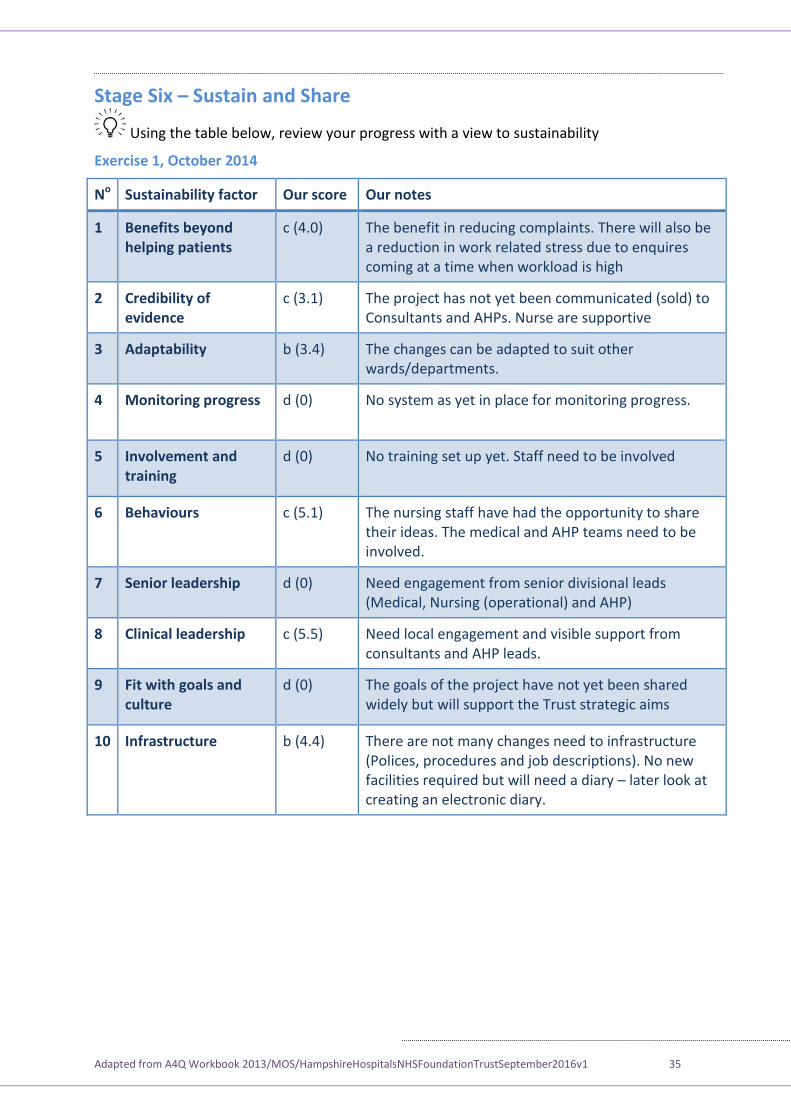
Stage Six – Sustain and Share
Using the table below, review your progress with a view to sustainability
Exercise 1, October 2014
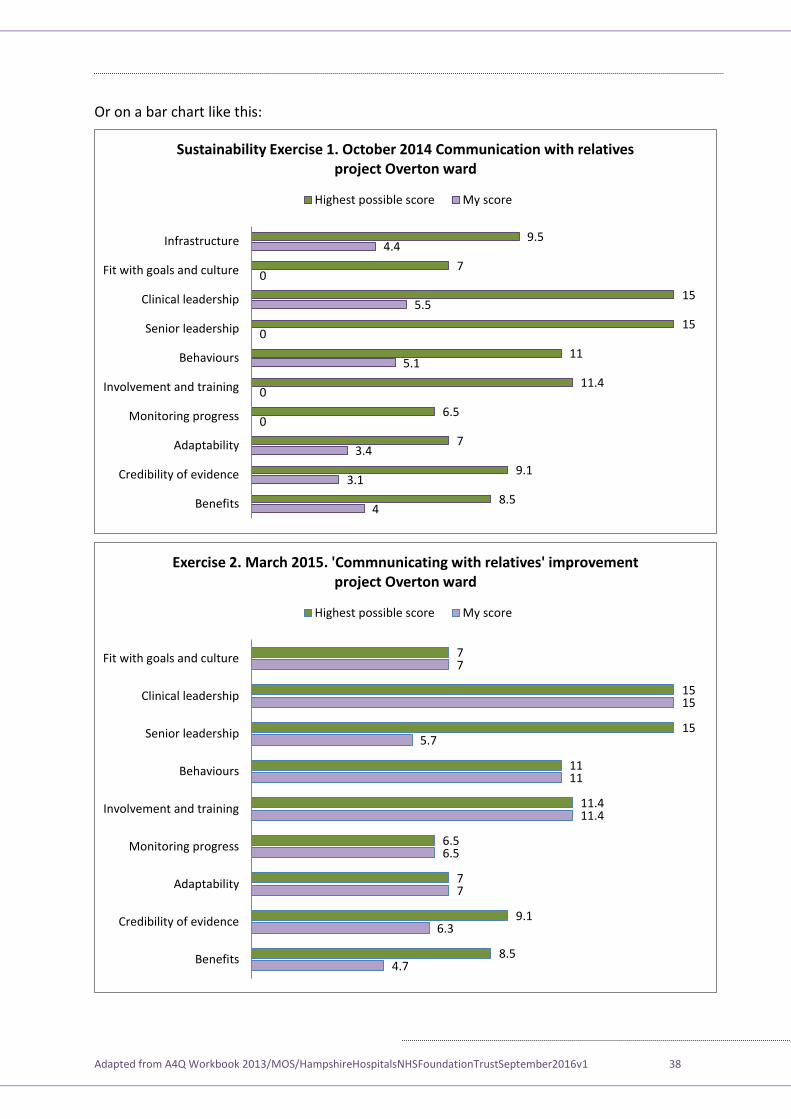
No Sustainability factor Our score Our notes
1 Benefits beyond helping patients
c (4.0) The benefit in reducing complaints. There will also be a reduction in work related stress due to enquires coming at a time when workload is high
2 Credibility of evidence
c (3.1) The project has not yet been communicated (sold) to Consultants and AHPs. Nurse are supportive
3 Adaptability b (3.4) The changes can be adapted to suit other wards/departments.
4 Monitoring progress d (0) No system as yet in place for monitoring progress.
5 Involvement and training
d (0) No training set up yet. Staff need to be involved
6 Behaviours c (5.1) The nursing staff have had the opportunity to share their ideas. The medical and AHP teams need to be involved.
7 Senior leadership d (0) Need engagement from senior divisional leads (Medical, Nursing (operational) and AHP)
8 Clinical leadership c (5.5) Need local engagement and visible support from consultants and AHP leads.
9 Fit with goals and culture
d (0)
The goals of the project have not yet been shared widely but will support the Trust strategic aims
10 Infrastructure b (4.4) There are not many changes need to infrastructure (Polices, procedures and job descriptions). No new facilities required but will need a diary – later look at creating an electronic diary.
Adapted from A4Q Workbook 2013/MOS/HampshireHospitalsNHSFoundationTrustSeptember2016v1 36
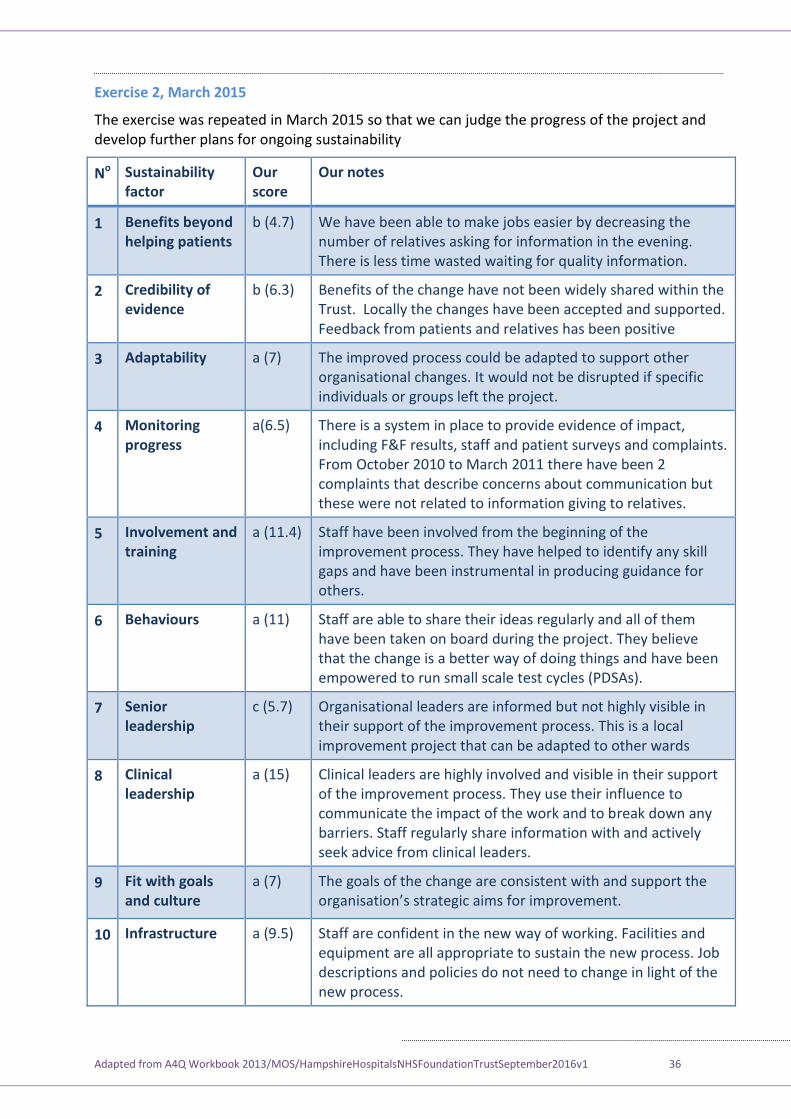
Exercise 2, March 2015
The exercise was repeated in March 2015 so that we can judge the progress of the project and develop further plans for ongoing sustainability
No Sustainability factor
Our score
Our notes
1 Benefits beyond helping patients
b (4.7) We have been able to make jobs easier by decreasing the number of relatives asking for information in the evening. There is less time wasted waiting for quality information.
2 Credibility of evidence
b (6.3) Benefits of the change have not been widely shared within the Trust. Locally the changes have been accepted and supported. Feedback from patients and relatives has been positive
3 Adaptability a (7) The improved process could be adapted to support other organisational changes. It would not be disrupted if specific individuals or groups left the project.
4 Monitoring progress
a(6.5) There is a system in place to provide evidence of impact, including F&F results, staff and patient surveys and complaints. From October 2010 to March 2011 there have been 2 complaints that describe concerns about communication but these were not related to information giving to relatives.
5 Involvement and training
a (11.4) Staff have been involved from the beginning of the improvement process. They have helped to identify any skill gaps and have been instrumental in producing guidance for others.
6 Behaviours a (11) Staff are able to share their ideas regularly and all of them have been taken on board during the project. They believe that the change is a better way of doing things and have been empowered to run small scale test cycles (PDSAs).
7 Senior leadership
c (5.7) Organisational leaders are informed but not highly visible in their support of the improvement process. This is a local improvement project that can be adapted to other wards
8 Clinical leadership
a (15) Clinical leaders are highly involved and visible in their support of the improvement process. They use their influence to communicate the impact of the work and to break down any barriers. Staff regularly share information with and actively seek advice from clinical leaders.
9 Fit with goals and culture
a (7)
The goals of the change are consistent with and support the organisation’s strategic aims for improvement.
10 Infrastructure a (9.5) Staff are confident in the new way of working. Facilities and equipment are all appropriate to sustain the new process. Job descriptions and policies do not need to change in light of the new process.
Adapted from A4Q Workbook 2013/MOS/HampshireHospitalsNHSFoundationTrustSeptember2016v1 37
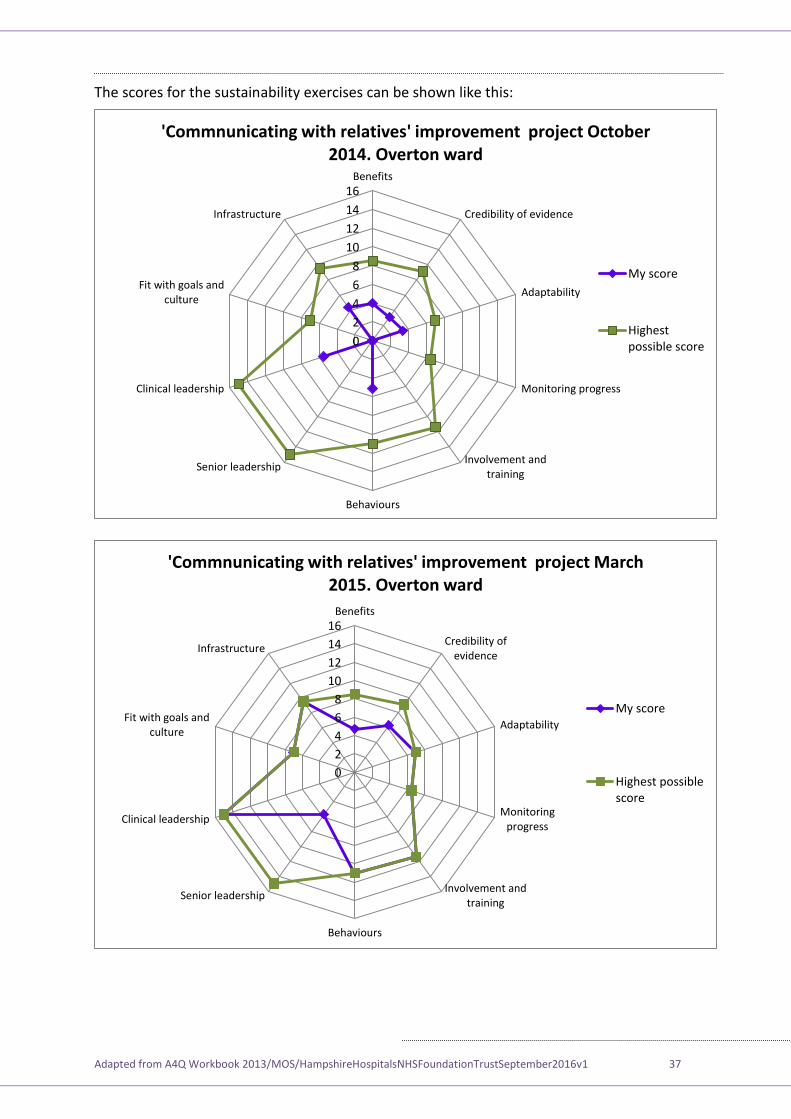
The scores for the sustainability exercises can be shown like this:
0
2
4
6
8
10
12
14
16Benefits
Credibility of evidence
Adaptability
Monitoring progress
Involvement andtraining
Behaviours
Senior leadership
Clinical leadership
Fit with goals andculture
Infrastructure
'Commnunicating with relatives' improvement project October 2014. Overton ward
My score
Highestpossible score
0
2
4
6
8
10
12
14
16Benefits
Credibility ofevidence
Adaptability
Monitoringprogress
Involvement andtraining
Behaviours
Senior leadership
Clinical leadership
Fit with goals andculture
Infrastructure
'Commnunicating with relatives' improvement project March 2015. Overton ward
My score
Highest possiblescore
Adapted from A4Q Workbook 2013/MOS/HampshireHospitalsNHSFoundationTrustSeptember2016v1 38
Or on a bar chart like this:
4
3.1
3.4
0
0
5.1
0
5.5
0
4.4
8.5
9.1
7
6.5
11.4
11
15
15
7
9.5
Benefits
Credibility of evidence
Adaptability
Monitoring progress
Involvement and training
Behaviours
Senior leadership
Clinical leadership
Fit with goals and culture
Infrastructure
Sustainability Exercise 1. October 2014 Communication with relatives project Overton ward
Highest possible score My score
4.7
6.3
7
6.5
11.4
11
5.7
15
7
8.5
9.1
7
6.5
11.4
11
15
15
7
Benefits
Credibility of evidence
Adaptability
Monitoring progress
Involvement and training
Behaviours
Senior leadership
Clinical leadership
Fit with goals and culture
Exercise 2. March 2015. 'Commnunicating with relatives' improvement project Overton ward
Highest possible score My score