Embed Size (px)
Citation preview
1 APRIL 2001 1499T R E N B E R T H E T A L .
q 2001 American Meteorological Society
Quality of Reanalyses in the Tropics
KEVIN E. TRENBERTH, DAVID P. STEPANIAK, AND JAMES W. HURRELL
National Center for Atmospheric Research,* Boulder, Colorado
MICHAEL FIORINO
Lawrence Livermore National Laboratory, University of California, Livermore, California
(Manuscript received 4 February 2000, in final form 12 May 2000)
ABSTRACT
Broad vertical layer-averaged temperatures from the microwave sounder unit (MSU) are used as a quasi-independent validation of temperature fields from the U.S. National Centers for Environmental Prediction–National Center for Atmospheric Research (NCEP–NCAR) and the European Centre for Medium-Range WeatherForecasts (ECMWF) reanalyses. While the MSU and NCEP–NCAR temperatures show fairly good agreementoverall, large discrepancies with ECMWF temperatures indicate that changes in the satellite observing systemmay have adversely affected the ECMWF reanalyses, especially in the Tropics. Two spurious discontinuitiesare present in tropical temperatures with jumps to warmer values throughout the Tropics below 500 mb in late1986 and early 1989, and further spurious interannual variability is also present. These features are also reflectedin the specific humidity fields. The temperature discrepancies have a complex vertical structure with height thatis not fully understood, although it seems that the problems partly arise from positive reinforcement of biasesin satellite radiances with those of the assimilating model first guess. Changes in the observing system providea limit to the usefulness of the reanalyses in some climate studies.
1. Introduction
Global analyses produced by the operational centers,National Centers for Environmental Prediction (NCEP)and the European Center for Medium-Range Forecasts(ECMWF), for weather forecasting purposes containmany discontinuous changes in the analyses arisingfrom improvements in the system used to produce them(Trenberth and Olson 1988). Unfortunately, these intro-duce artificial changes in the apparent climate record asseen through the analyses. ‘‘Reanalysis’’ of the histor-ical data by several centers using a state-of-the-art sys-tem that is held constant for the entire record is designedto address these discontinuities. The only sources ofspurious change then are the changes in the observingsystem, including those arising from the distribution,types and quality of observing platforms such as radio-sondes and satellites (e.g., Uppala 1997). Here the focusis on the reanalyses from NCEP–NCAR (Kalnay et al.
* The National Center for Atmospheric Research is sponsored bythe National Science Foundation.
Corresponding author address: Kevin E. Trenberth, NCAR, P.O.Box 3000, Boulder, CO 80307-3000.E-mail: [email protected]
1996) and from ECMWF (Gibson et al. 1997). In par-ticular, we show how some of the changes in the ob-serving system appear to have adversely affected theECMWF reanalyses of the temperature and moisturefields in the Tropics. Those influences are seen in otherfields as well, thereby potentially limiting the usefulnessof the reanalyses in addressing climate variability.
Comprehensive evaluation of the moisture budgetfrom NCEP–NCAR reanalysis was given by Trenberthand Guillemot (1998) who concluded that there is anegative bias in tropical precipitation, which is probablyan indication that the divergent circulation is too weak.A comparison of the reanalyses moisture budgets byStendel and Arpe (1997) concluded that the ECMWFprecipitation fields were superior in the extratropics tothose of other reanalyses when compared with GlobalPrecipitation Climatology Project (GPCP) observationaldata. Annamalai et al. (1999) found the ECMWF re-analyses to be better in describing the summer Asianmonsoon. Engelen et al. (1998) confirmed the superiorECMWF reanalysis of water vapor fields in the lowerand upper troposphere. A further evaluation by Newmanet al. (2000) of the NCEP, National Aeronautics andSpace Administration (NASA), and ECMWF reanaly-ses, which focused especially on the warm pool area ofthe Pacific from the standpoint of outgoing longwaveradiation, precipitation and 200-mb divergence, found
1500 VOLUME 14J O U R N A L O F C L I M A T E
substantial problems with all reanalyses, althoughECMWF reanalyses gave the best estimates of the 200-mb divergence.
Therefore several evaluations have indicated superiorperformance by ECMWF on some facets of the re-analyses. However, as we show here, the ECMWF re-analyses also have some problems that are quite severefor some climate studies. Continuity problems are pre-sent in the ECMWF reanalyses that can be traced to thebias correction of satellite radiances in the temperatureand moisture retrieval process. These very likely con-tribute to the substantial problems regionally in the hy-drological cycle, especially over Africa (Stendel andArpe 1997). Over South America the problems dis-cussed here become confused with those in westernAmazonia associated with how the semidiurnal tide in-teracted with the soil moisture relaxation and assimi-lation method for humidity (Kallberg 1997). This wasdiscovered while analyzing 1986, and so a fix of re-moving surface synop surface pressure observationsfrom the analysis was included from January 1987 on-ward. The tropical temperature time series of the NCEP–NCAR reanalyses appear to be relatively more consis-tent beginning in 1979. However, they too are adverselyinfluenced by observing system changes (Basist andChelliah 1997).
Often, it is difficult to decide which of two analysesare correct as there is no independent truth. In the caseof temperatures, there is a somewhat independent prod-uct based on satellite data from the microwave sounderunit (MSU) of Christy et al. (1998; 2000). A preliminarycomparison of broad layer temperatures from MSU datawith the reanalyses was given by Hurrell and Trenberth(1998); see also Santer et al. (1999). This report is anupdate to make use of a later improved version of theMSU data (Christy et al. 2000) and to focus on theimplications for the ECMWF reanalyses, in particular.
Section 2 discusses the reanalysis data, the MSU dataand the background that led to this report. Section 3presents the main results, and conclusions are given insection 4.
2. Data and the issues
a. Reanalyses
The period examined is that of the common reanalysisdata from 1979 to 1993. The global analyses are pro-duced on model (sigma or hybrid) surfaces. We use thepostprocessed values on standard pressure levels pro-duced from 6-h data averaged into monthly means.
The NCEP system is based on a numerical weatherprediction model with T62 spectral resolution and 28sigma levels in the vertical. Fields are not initialized.Trenberth and Guillemot (1998) provided a comprehen-sive evaluation of the NCEP–NCAR reanalyses focusedon the hydrological cycle. For convenience we refer tothese as the NCEP reanalyses.
The ECMWF reanalyses, known as ERA-15, are atT106 resolution and 31 levels in the vertical with ahybrid coordinate that transitions to a pressure coordi-nate above about 100 mb. Of note is that a diabatic,nonlinear normal mode initialization was applied. Eval-uations of performance of the system are given by Up-pala (1997) and Kallberg (1997), and by Stendel andArpe (1997) for the hydrological cycle for both re-analyses.
Of particular relevance here is a prominent differencein the two reanalyses in the way satellite data wereassimilated. NCEP used temperature profiles retrievedby National Environmental Satellite, Data and Infor-mation Service (NESDIS). In ERA-15, the TOVS cloudcleared radiances were assimilated indirectly through aone-dimensional variational (1DVAR) scheme that cal-culates a temperature (thickness) and moisture (precip-itable water) profile based on the first guess (6-h fore-cast) from the assimilating model (Eyre et al. 1993). Aspart of this process, the first-guess information is trans-lated to top-of-atmosphere radiances by a radiativetransfer model for comparison with the observed radi-ances. Hence, the 1DVAR scheme calculates a correc-tion to the retrieval taken from first guess. Thus, the1DVAR retrieval, which is identical in structure to theNESDIS retrieval and was treated as an independentobservation in the ERA-15 OI analysis, is stronglylinked to the assimilating model. Bias in the model canonly be removed in the correction step, and experiencehas shown (Fiorino 1999) that the reanalyzed temper-ature responds rapidly (;10 days) to changes in thebias-corrected radiances as seen in the ‘‘radgrams’’ (notshown), which are used to monitor observations, first-guess and analysis performance.
b. MSU and radiance data
The MSU measures a brightness temperature of thevertically averaged atmospheric thermal emission bymolecular oxygen at different spectral intervals (chan-nels). The weighting functions encompass very broadlayers of the atmosphere (see Hurrell and Trenberth1998); for instance MSU Channel 2 (53.74 GHz) ex-tends from the surface into the lower stratosphere.Therefore, Spencer and Christy (1992) proposed a re-trieval technique in which the off-nadir Channel 2 data,which have a somewhat different vertical weightingfunction, are used to remove the stratospheric influenceand thus provide an adjusted, narrower vertical weight-ing function (MSU-2LT), which peaks lower in the tro-posphere but is more sensitive to surface effects. TheSpencer–Christy MSU product is constructed to givereliable monthly mean but not synoptic or even dailytemperatures. A difficulty in creating a continuous, con-sistent climate record from satellite observations aloneis that satellites and instruments have a finite lifetimeof a few years and have to be replaced, and their orbitsdiffer and are not stable. A key point with regard to the
1 APRIL 2001 1501T R E N B E R T H E T A L .
current comparison is that bias corrections resultingfrom offsets in different MSU instruments on differentsatellites are removed in quite different ways in theSpencer–Christy product than for NESDIS or ECMWF.While the latter in principle use collocated radiosondes,the continuity of the MSU record is based on intersa-tellite comparisons.
For the Spencer–Christy product, nine satellites com-prise the current operational MSU record, and the meth-ods of merging the data from these different satellitesare complex (Christy et al. 1998). Essentially, after re-moving an annual cycle, biases of measurements fromone satellite relative to another are determined as theaverage difference between temperatures of the MSUsat each latitude during overlap periods, and these biasesare removed. A disadvantage of this approach is thatany systematic influence on both satellites, such as or-bital decay, becomes built into the record. Earlier com-parisons of MSU with reanalyzed temperatures (Hurrelland Trenberth 1998) used MSU data version ‘‘b,’’ whichhas been updated and improved in several ways to giveversions ‘‘c’’ (Christy et al. 1998) and ‘‘d’’ (Christy etal. 2000). In particular, version d has been modified totake into account changes in viewing geometry due todecay in the satellite orbits (Wentz and Schabel 1998),which contributed to a spurious cooling in previousMSU-2LT data of roughly 0.18C decade21 but with littleimpact on MSU-2. In addition, Christy et al. (2000)describe two other sources of error adjusted in versiond: variations in the instrument body temperature on eachof the satellites (a consequence of orbit drift), and er-roneous calibration coefficients for the NOAA-12 sat-ellite.
In interpreting the comparisons, it should be notedthat the reanalyses are not independent of the MSUbrightness temperatures. While the radiance data are notincorporated into the analysis system at NCEP, as theyare indirectly at ECMWF, the NESDIS temperature sat-ellite retrievals do include MSU data in clear, partlycloudy, and cloudy retrievals. In cloudy regions the re-trievals depend entirely on MSU data. However, inERA-15 there is no dependence on cloudy or partlycloudy data in the Tropics from 308S to 308N, and thenthey are used only below 100 mb. As a result, there isprobably a greater influence of MSU data on the NES-DIS retrievals and thus the NCEP reanalyses than thereis for ERA-15, because the latter come under a largerinfluence of High-resolution Infrared Radiation Sounder(HIRS) soundings.
Procedures to obtain NESDIS retrievals were changedin September 1988 from a statistical to a physical meth-od by making use of a search through a library of at-mospheric radiosonde temperature profiles and associ-ated radiances. The entries with closest observed radi-ances are averaged to form the initial profiles of tem-peratures for the inversion process. The finaltemperature and humidity profile is obtained by mini-mizing variance. Andersson et al. (1991) and Kelly et
al. (1991) identified large errors and biases in the op-erational NESDIS retrievals used at NCEP. The retrievalalgorithms are very sensitive to the initial atmosphericstate used in the schemes and often force the retrievedprofiles to contain inaccurate a priori information. More-over, NCEP temperatures appear to have been adverselyaffected by a major change in the cloudy algorithms inthe NESDIS retrievals over oceans in April 1992 (Basistand Chelliah 1997).
To avoid problems with the NESDIS retrievals, ERA-15 used the model first guess and a radiative model toobtain profiles from the cloud-cleared radiances. Al-though generally very successful and believed to beresponsible for the superior water vapor fields (Engelenet al. 1998), this turns out to be the likely source of thesubstantial problems in the ERA-15 reanalyses. The1DVAR bias correction is based on a linear regressionof the MSU data against biases near radiosonde stations.Biases are present for many reasons: some related tothe instrument and its calibration, some to changes fromsatellite to satellite and with orbital drift, and some fromthe radiative transfer model and the assimilating model.
Since the bias correction is a function of the MSUchannels, a change in any channel will influence theretrieval at all levels. For instance, an uncompensatedcold bias in one channel, such as MSU-3 (which has apeak weighting function about 200 mb) would implycold temperatures in the upper troposphere, which isalso sensed in part by MSU-2 (which peaks near 500mb). Thus, to reproduce the correct MSU-2 radiance,warmer temperatures would be inferred for the lowertroposphere. Similarly MSU-3 overlaps with MSU-4whose peak weighting function is about 70 mb. Thismakes the tracing of sources of problems rather difficult.
To retrieve an equivalent channel 2 or 2LT brightnesstemperature from the reanalyses, simple vertical weight-ing functions equal to the MSU weighting functionswere applied to the reanalysis multilevel temperatures,as given in Hurrell and Trenberth (1998). Santer et al.(1999) showed that equivalent MSU anomalies gener-ated using both global mean weighting functions and aradiative transfer code gave very similar results.
c. Previous results
Hurrell and Trenberth (1998) show that averaged over208N–208S the NCEP-2LT anomalies are highly cor-related with the MSU-2LT (version b) measurementsover the 17 yr, 1979–96 (r 5 0.95), but with somesystematic biases. The agreement was better overall withMSU-2 data, but a large stepwise relative differenceappeared after mid-1991, with the NCEP analyses muchcolder than the satellite data, as also found by Basistand Chelliah (1997). A contributing factor is the changein NESDIS retrievals mentioned earlier. The ECMWFdata from 1979 to 1993 exhibited poor agreement withboth the NCEP and MSU anomalies. The correlationcoefficient between monthly ECMWF and MSU-2LT
1502 VOLUME 14J O U R N A L O F C L I M A T E
(NCEP-2LT) anomalies was 0.71 (0.74) over the 15 yr.The largest differences relative to MSU-2LT and MSU-2temperatures occur after 1987 when the ECMWF datawere much warmer.
Fiorino (1999) first identified the nature of some ofthe apparent problems with the ERA-15 reanalyses. Healso noted an apparent low-level warming around late1986 in the Tropics that was not as evident over landor near island radiosonde observations, suggesting aproblem with the satellite data. On tracing the ERA-15logs and a detailed analysis of the fit of the model firstguess to the MSU radiances, Fiorino (1999) found thatthe warming resulted from a combination of factors: (i)erroneous bias-corrected satellite data were assimilated,altering the analysis and the subsequent first guess; (ii)the 1DVAR retrievals are made relative to the departuresfrom the first guess; and therefore, (iii) a bias could beperpetuated unless compensated through a link to un-biased observations. This is apparently exactly whathappened when there was only one satellite present dur-ing 1986–87 and a jump occurred in NOAA-9 MSU-3values in early November 1986.
Other hints of the problems are found in Uppala(1997), in particular in his Fig. 48, which showed theheight-time sections of tropical (208N–208S) time evo-lution of temperature bias as given by (i) the first-guessminus radiosonde and (ii) analysis minus radiosonde.Although a change is evident in late 1986, a biggerchange is evident in early 1989 after which time theanalysis and first guess were warmer by several tenthsC for the area mean in the analyses and as much as 18Cfor the first guess for the region below 500 mb. From300 to 500 mb the same region was colder than theradiosondes. Apparently the few tropical radiosondeswere not able to bring the bias under control and obtainreliable results.
3. The tropical reanalysis temperatures
a. Time series
Several diagnostic analyses were attempted to deter-mine the nature of the problems in the reanalyses andhow they were manifested. Singular value decomposi-tion of the temperature variability in the two reanalysesand the MSU data helped to isolate the problems andsuggested a focus on the Tropics. However, the problemsare most readily revealed by fairly simple analyses.
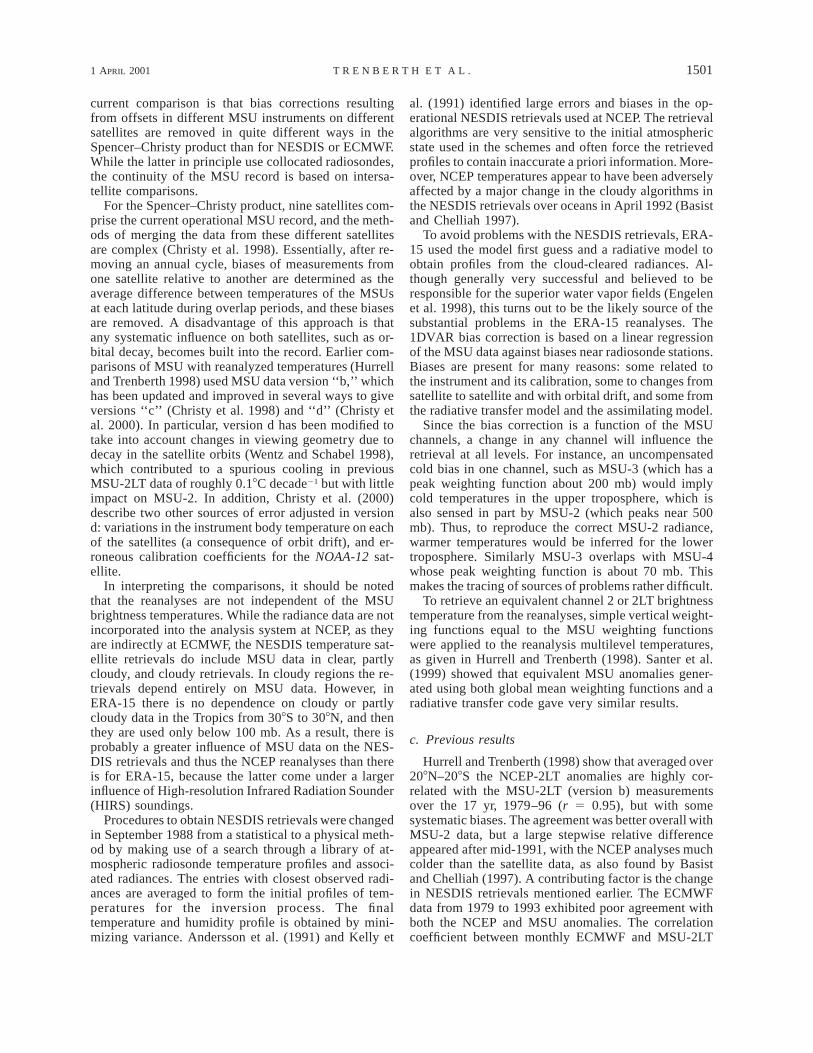
Figure 1 shows the standard deviations of the monthlyanomalies over the 15 yr, 1979–93 for the 2LT tem-peratures. These reveal considerably higher variance inthe ERA-15 reanalyses over the radiosonde sparse trop-ical Pacific east of 1508W than either MSU or NCEPtemperatures, which are relatively similar. In fact, theERA-15 variance tends to be higher throughout theTropics.
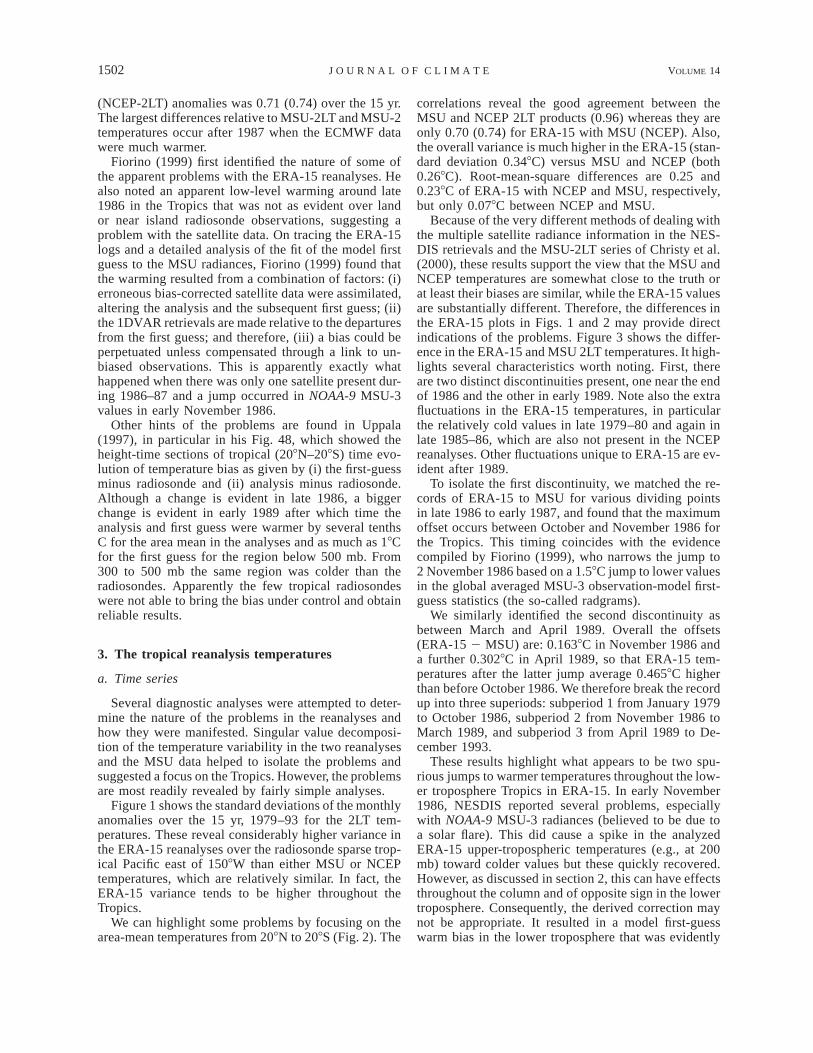
We can highlight some problems by focusing on thearea-mean temperatures from 208N to 208S (Fig. 2). The
correlations reveal the good agreement between theMSU and NCEP 2LT products (0.96) whereas they areonly 0.70 (0.74) for ERA-15 with MSU (NCEP). Also,the overall variance is much higher in the ERA-15 (stan-dard deviation 0.348C) versus MSU and NCEP (both0.268C). Root-mean-square differences are 0.25 and0.238C of ERA-15 with NCEP and MSU, respectively,but only 0.078C between NCEP and MSU.
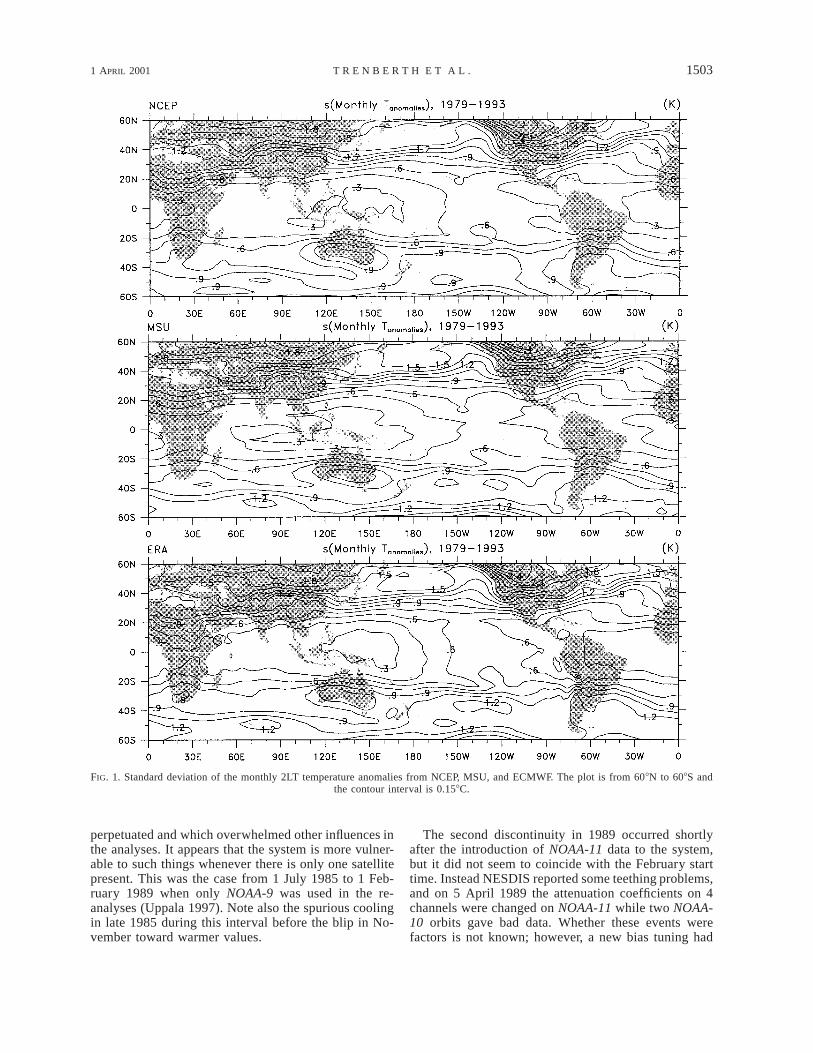
Because of the very different methods of dealing withthe multiple satellite radiance information in the NES-DIS retrievals and the MSU-2LT series of Christy et al.(2000), these results support the view that the MSU andNCEP temperatures are somewhat close to the truth orat least their biases are similar, while the ERA-15 valuesare substantially different. Therefore, the differences inthe ERA-15 plots in Figs. 1 and 2 may provide directindications of the problems. Figure 3 shows the differ-ence in the ERA-15 and MSU 2LT temperatures. It high-lights several characteristics worth noting. First, thereare two distinct discontinuities present, one near the endof 1986 and the other in early 1989. Note also the extrafluctuations in the ERA-15 temperatures, in particularthe relatively cold values in late 1979–80 and again inlate 1985–86, which are also not present in the NCEPreanalyses. Other fluctuations unique to ERA-15 are ev-ident after 1989.
To isolate the first discontinuity, we matched the re-cords of ERA-15 to MSU for various dividing pointsin late 1986 to early 1987, and found that the maximumoffset occurs between October and November 1986 forthe Tropics. This timing coincides with the evidencecompiled by Fiorino (1999), who narrows the jump to2 November 1986 based on a 1.58C jump to lower valuesin the global averaged MSU-3 observation-model first-guess statistics (the so-called radgrams).
We similarly identified the second discontinuity asbetween March and April 1989. Overall the offsets(ERA-15 2 MSU) are: 0.1638C in November 1986 anda further 0.3028C in April 1989, so that ERA-15 tem-peratures after the latter jump average 0.4658C higherthan before October 1986. We therefore break the recordup into three superiods: subperiod 1 from January 1979to October 1986, subperiod 2 from November 1986 toMarch 1989, and subperiod 3 from April 1989 to De-cember 1993.
These results highlight what appears to be two spu-rious jumps to warmer temperatures throughout the low-er troposphere Tropics in ERA-15. In early November1986, NESDIS reported several problems, especiallywith NOAA-9 MSU-3 radiances (believed to be due toa solar flare). This did cause a spike in the analyzedERA-15 upper-tropospheric temperatures (e.g., at 200mb) toward colder values but these quickly recovered.However, as discussed in section 2, this can have effectsthroughout the column and of opposite sign in the lowertroposphere. Consequently, the derived correction maynot be appropriate. It resulted in a model first-guesswarm bias in the lower troposphere that was evidently
1 APRIL 2001 1503T R E N B E R T H E T A L .
FIG. 1. Standard deviation of the monthly 2LT temperature anomalies from NCEP, MSU, and ECMWF. The plot is from 608N to 608S andthe contour interval is 0.158C.
perpetuated and which overwhelmed other influences inthe analyses. It appears that the system is more vulner-able to such things whenever there is only one satellitepresent. This was the case from 1 July 1985 to 1 Feb-ruary 1989 when only NOAA-9 was used in the re-analyses (Uppala 1997). Note also the spurious coolingin late 1985 during this interval before the blip in No-vember toward warmer values.
The second discontinuity in 1989 occurred shortlyafter the introduction of NOAA-11 data to the system,but it did not seem to coincide with the February starttime. Instead NESDIS reported some teething problems,and on 5 April 1989 the attenuation coefficients on 4channels were changed on NOAA-11 while two NOAA-10 orbits gave bad data. Whether these events werefactors is not known; however, a new bias tuning had
1504 VOLUME 14J O U R N A L O F C L I M A T E
FIG. 2. Time series of the monthly mean tropical (208N to 208S) 2LT temperatures from NCEP,MSU, and ERA-15. The standard deviation of each is given in the insets. A low-pass smoothingspline has been fitted to the data to show the decadal variations.
FIG. 3. Difference in time series of the monthly mean tropical (208N to 208S) 2LT temperaturesfrom MSU and ERA-15, as ERA–MSU. A straight line fit has been added to the series to showthe two discontinuities.
to be implemented in ERA-15 to deal with the newsatellite. Moreover, this was a time when the number ofradiosondes from 508W to 1608W, 208N to 208S droppedsomewhat (Uppala 1997, his Fig. 10). Consequently theopportunity was present for further problems to be per-petuated in regions where inadequate radiosonde dataexisted.
b. Regional analysis
To further explore how universal the problems were,we separately analyzed each of the four 908 sectors ofthe Tropics. The same discontinuities were present inall sectors, and the extraneous variability was also com-mon to each sector showing that this was not a localproblem. However, by far the largest variance of thetemperature from the four sectors (44% of the zonalmean) comes from 1808to 908W and is mostly associated
with the El Nino–Southern Oscillation phenomenonwhile the smallest variance (14%) is from the PacificWarm Pool region from 908E to 1808.
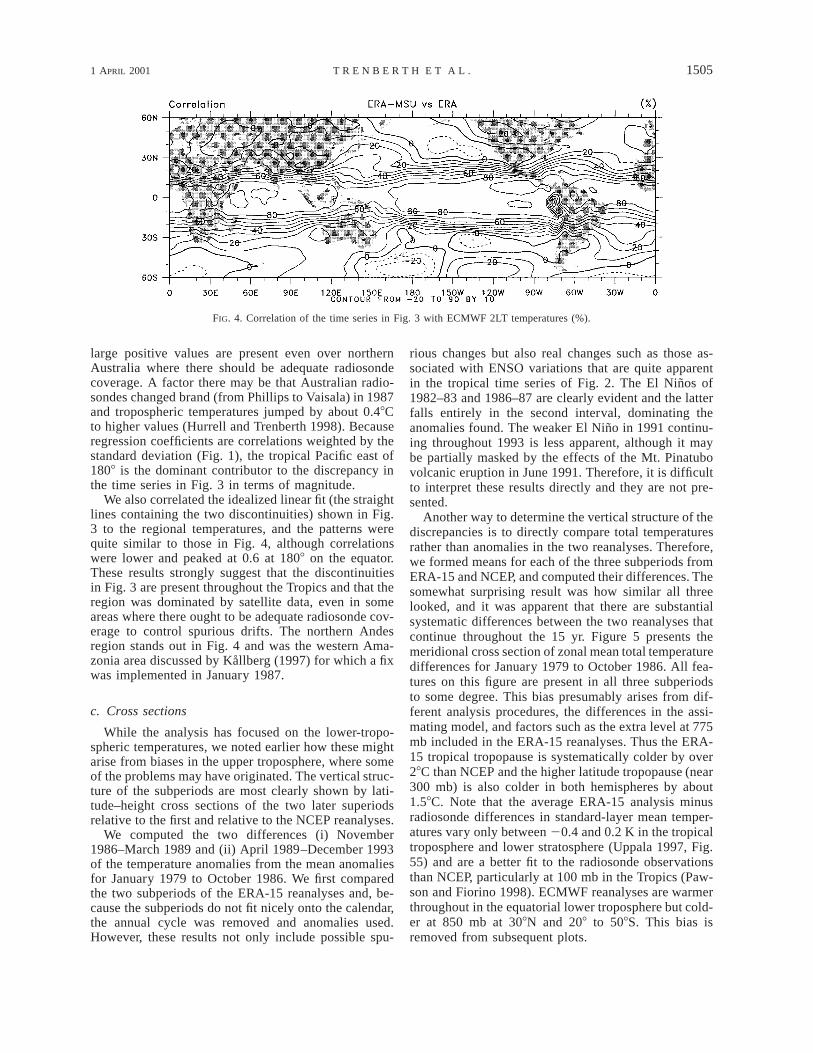
To explore regionally where these discontinuitieswere manifested most, we regressed the difference inFig. 3 with the values at each grid point for the ECMWF2LT values. The correlation is shown in Fig. 4. If twouncorrelated series with the same variance are differ-enced and the result is correlated with the original series,then the expected correlation would be 0.72. However,as the two series are positively correlated, the expectedcorrelation with the differenced series should approachzero. Given that the difference time series in Fig. 3 hasan ECMWF component, positive correlations are ex-pected, but Fig. 4 reveals that very high correlations(often exceeding 0.8) are present throughout the Tropics.Over Mexico, values are negative, as might be expectedwhere there are adequate radiosonde data. However,
1 APRIL 2001 1505T R E N B E R T H E T A L .
FIG. 4. Correlation of the time series in Fig. 3 with ECMWF 2LT temperatures (%).
large positive values are present even over northernAustralia where there should be adequate radiosondecoverage. A factor there may be that Australian radio-sondes changed brand (from Phillips to Vaisala) in 1987and tropospheric temperatures jumped by about 0.48Cto higher values (Hurrell and Trenberth 1998). Becauseregression coefficients are correlations weighted by thestandard deviation (Fig. 1), the tropical Pacific east of1808 is the dominant contributor to the discrepancy inthe time series in Fig. 3 in terms of magnitude.
We also correlated the idealized linear fit (the straightlines containing the two discontinuities) shown in Fig.3 to the regional temperatures, and the patterns werequite similar to those in Fig. 4, although correlationswere lower and peaked at 0.6 at 1808 on the equator.These results strongly suggest that the discontinuitiesin Fig. 3 are present throughout the Tropics and that theregion was dominated by satellite data, even in someareas where there ought to be adequate radiosonde cov-erage to control spurious drifts. The northern Andesregion stands out in Fig. 4 and was the western Ama-zonia area discussed by Kallberg (1997) for which a fixwas implemented in January 1987.
c. Cross sections
While the analysis has focused on the lower-tropo-spheric temperatures, we noted earlier how these mightarise from biases in the upper troposphere, where someof the problems may have originated. The vertical struc-ture of the subperiods are most clearly shown by lati-tude–height cross sections of the two later superiodsrelative to the first and relative to the NCEP reanalyses.
We computed the two differences (i) November1986–March 1989 and (ii) April 1989–December 1993of the temperature anomalies from the mean anomaliesfor January 1979 to October 1986. We first comparedthe two subperiods of the ERA-15 reanalyses and, be-cause the subperiods do not fit nicely onto the calendar,the annual cycle was removed and anomalies used.However, these results not only include possible spu-
rious changes but also real changes such as those as-sociated with ENSO variations that are quite apparentin the tropical time series of Fig. 2. The El Ninos of1982–83 and 1986–87 are clearly evident and the latterfalls entirely in the second interval, dominating theanomalies found. The weaker El Nino in 1991 continu-ing throughout 1993 is less apparent, although it maybe partially masked by the effects of the Mt. Pinatubovolcanic eruption in June 1991. Therefore, it is difficultto interpret these results directly and they are not pre-sented.
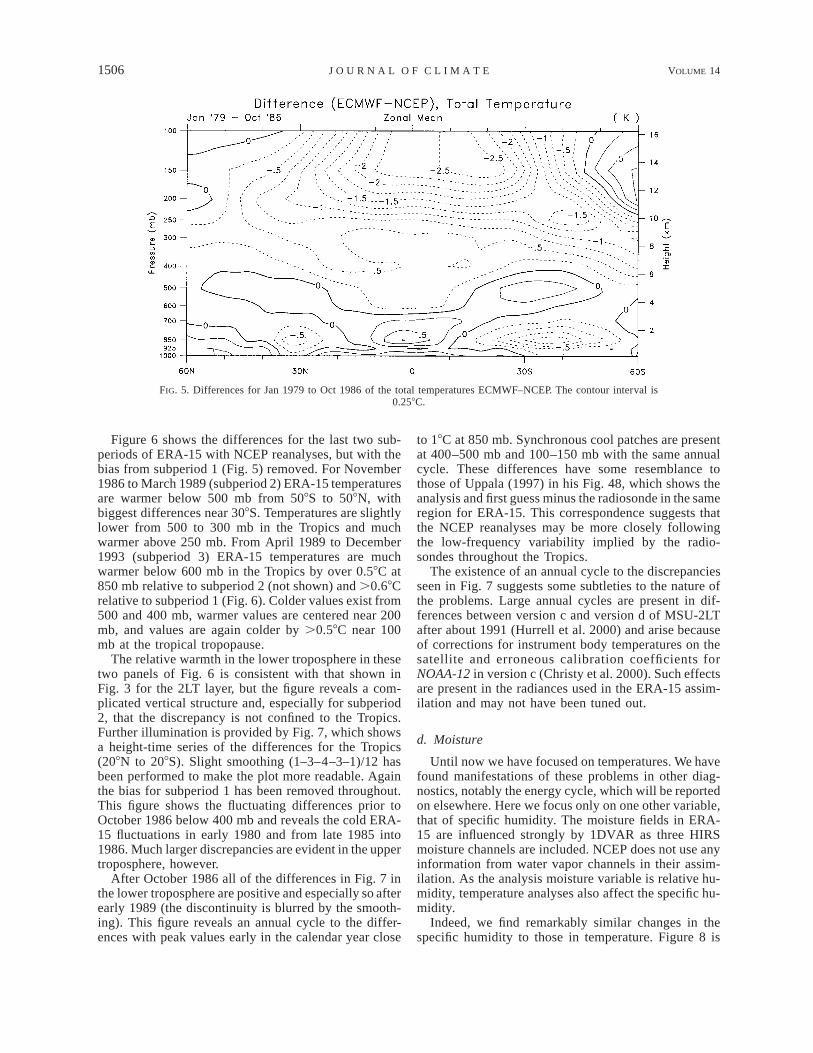
Another way to determine the vertical structure of thediscrepancies is to directly compare total temperaturesrather than anomalies in the two reanalyses. Therefore,we formed means for each of the three subperiods fromERA-15 and NCEP, and computed their differences. Thesomewhat surprising result was how similar all threelooked, and it was apparent that there are substantialsystematic differences between the two reanalyses thatcontinue throughout the 15 yr. Figure 5 presents themeridional cross section of zonal mean total temperaturedifferences for January 1979 to October 1986. All fea-tures on this figure are present in all three subperiodsto some degree. This bias presumably arises from dif-ferent analysis procedures, the differences in the assi-mating model, and factors such as the extra level at 775mb included in the ERA-15 reanalyses. Thus the ERA-15 tropical tropopause is systematically colder by over28C than NCEP and the higher latitude tropopause (near300 mb) is also colder in both hemispheres by about1.58C. Note that the average ERA-15 analysis minusradiosonde differences in standard-layer mean temper-atures vary only between 20.4 and 0.2 K in the tropicaltroposphere and lower stratosphere (Uppala 1997, Fig.55) and are a better fit to the radiosonde observationsthan NCEP, particularly at 100 mb in the Tropics (Paw-son and Fiorino 1998). ECMWF reanalyses are warmerthroughout in the equatorial lower troposphere but cold-er at 850 mb at 308N and 208 to 508S. This bias isremoved from subsequent plots.
1506 VOLUME 14J O U R N A L O F C L I M A T E
FIG. 5. Differences for Jan 1979 to Oct 1986 of the total temperatures ECMWF–NCEP. The contour interval is0.258C.
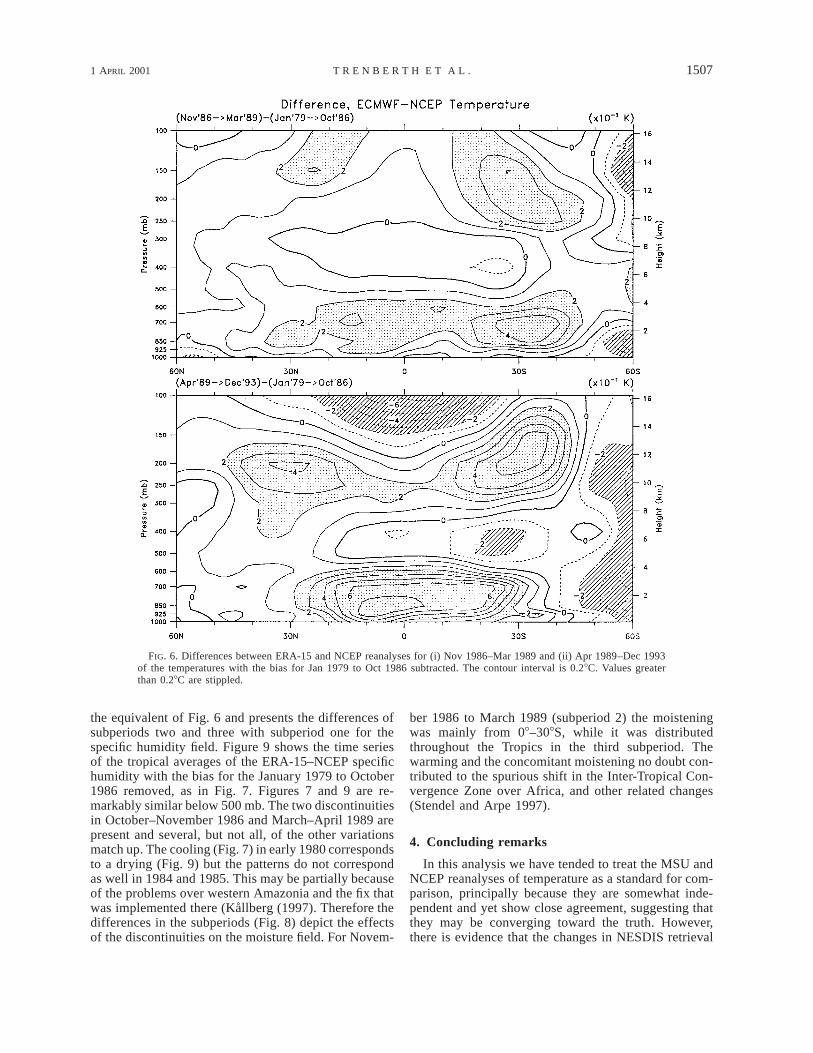
Figure 6 shows the differences for the last two sub-periods of ERA-15 with NCEP reanalyses, but with thebias from subperiod 1 (Fig. 5) removed. For November1986 to March 1989 (subperiod 2) ERA-15 temperaturesare warmer below 500 mb from 508S to 508N, withbiggest differences near 308S. Temperatures are slightlylower from 500 to 300 mb in the Tropics and muchwarmer above 250 mb. From April 1989 to December1993 (subperiod 3) ERA-15 temperatures are muchwarmer below 600 mb in the Tropics by over 0.58C at850 mb relative to subperiod 2 (not shown) and .0.68Crelative to subperiod 1 (Fig. 6). Colder values exist from500 and 400 mb, warmer values are centered near 200mb, and values are again colder by .0.58C near 100mb at the tropical tropopause.
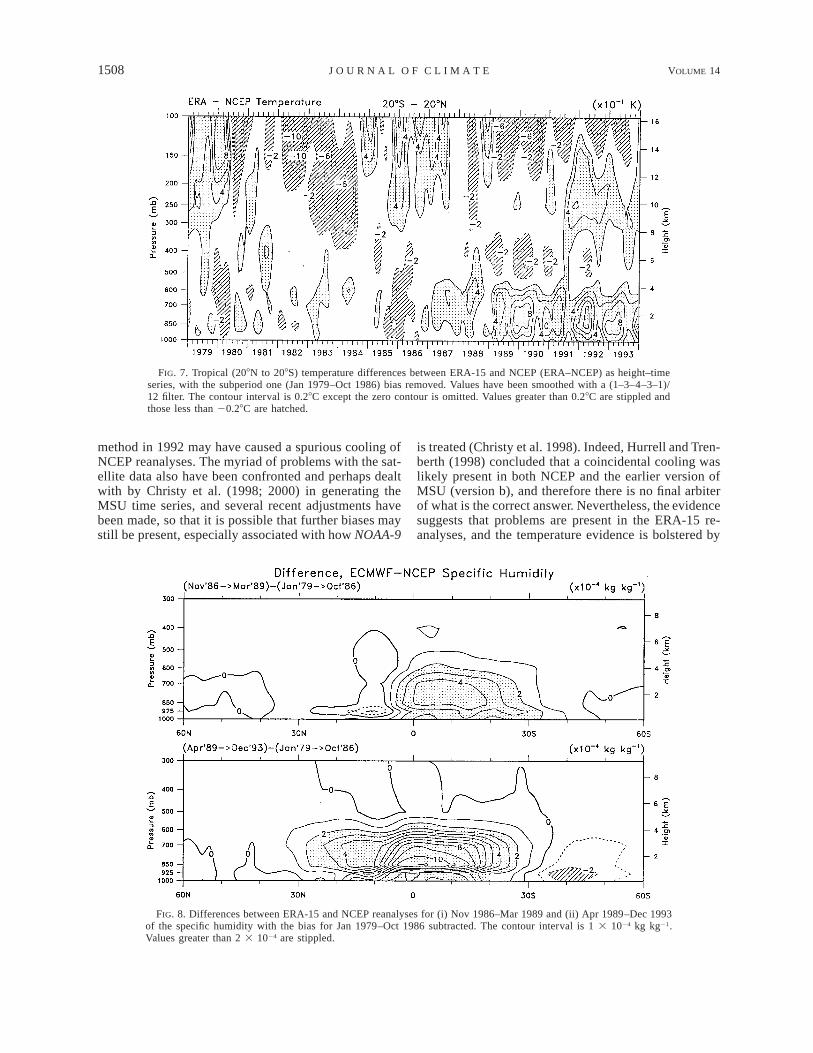
The relative warmth in the lower troposphere in thesetwo panels of Fig. 6 is consistent with that shown inFig. 3 for the 2LT layer, but the figure reveals a com-plicated vertical structure and, especially for subperiod2, that the discrepancy is not confined to the Tropics.Further illumination is provided by Fig. 7, which showsa height-time series of the differences for the Tropics(208N to 208S). Slight smoothing (1–3–4–3–1)/12 hasbeen performed to make the plot more readable. Againthe bias for subperiod 1 has been removed throughout.This figure shows the fluctuating differences prior toOctober 1986 below 400 mb and reveals the cold ERA-15 fluctuations in early 1980 and from late 1985 into1986. Much larger discrepancies are evident in the uppertroposphere, however.
After October 1986 all of the differences in Fig. 7 inthe lower troposphere are positive and especially so afterearly 1989 (the discontinuity is blurred by the smooth-ing). This figure reveals an annual cycle to the differ-ences with peak values early in the calendar year close
to 18C at 850 mb. Synchronous cool patches are presentat 400–500 mb and 100–150 mb with the same annualcycle. These differences have some resemblance tothose of Uppala (1997) in his Fig. 48, which shows theanalysis and first guess minus the radiosonde in the sameregion for ERA-15. This correspondence suggests thatthe NCEP reanalyses may be more closely followingthe low-frequency variability implied by the radio-sondes throughout the Tropics.
The existence of an annual cycle to the discrepanciesseen in Fig. 7 suggests some subtleties to the nature ofthe problems. Large annual cycles are present in dif-ferences between version c and version d of MSU-2LTafter about 1991 (Hurrell et al. 2000) and arise becauseof corrections for instrument body temperatures on thesatellite and erroneous calibration coefficients forNOAA-12 in version c (Christy et al. 2000). Such effectsare present in the radiances used in the ERA-15 assim-ilation and may not have been tuned out.
d. Moisture
Until now we have focused on temperatures. We havefound manifestations of these problems in other diag-nostics, notably the energy cycle, which will be reportedon elsewhere. Here we focus only on one other variable,that of specific humidity. The moisture fields in ERA-15 are influenced strongly by 1DVAR as three HIRSmoisture channels are included. NCEP does not use anyinformation from water vapor channels in their assim-ilation. As the analysis moisture variable is relative hu-midity, temperature analyses also affect the specific hu-midity.
Indeed, we find remarkably similar changes in thespecific humidity to those in temperature. Figure 8 is
1 APRIL 2001 1507T R E N B E R T H E T A L .
FIG. 6. Differences between ERA-15 and NCEP reanalyses for (i) Nov 1986–Mar 1989 and (ii) Apr 1989–Dec 1993of the temperatures with the bias for Jan 1979 to Oct 1986 subtracted. The contour interval is 0.28C. Values greaterthan 0.28C are stippled.
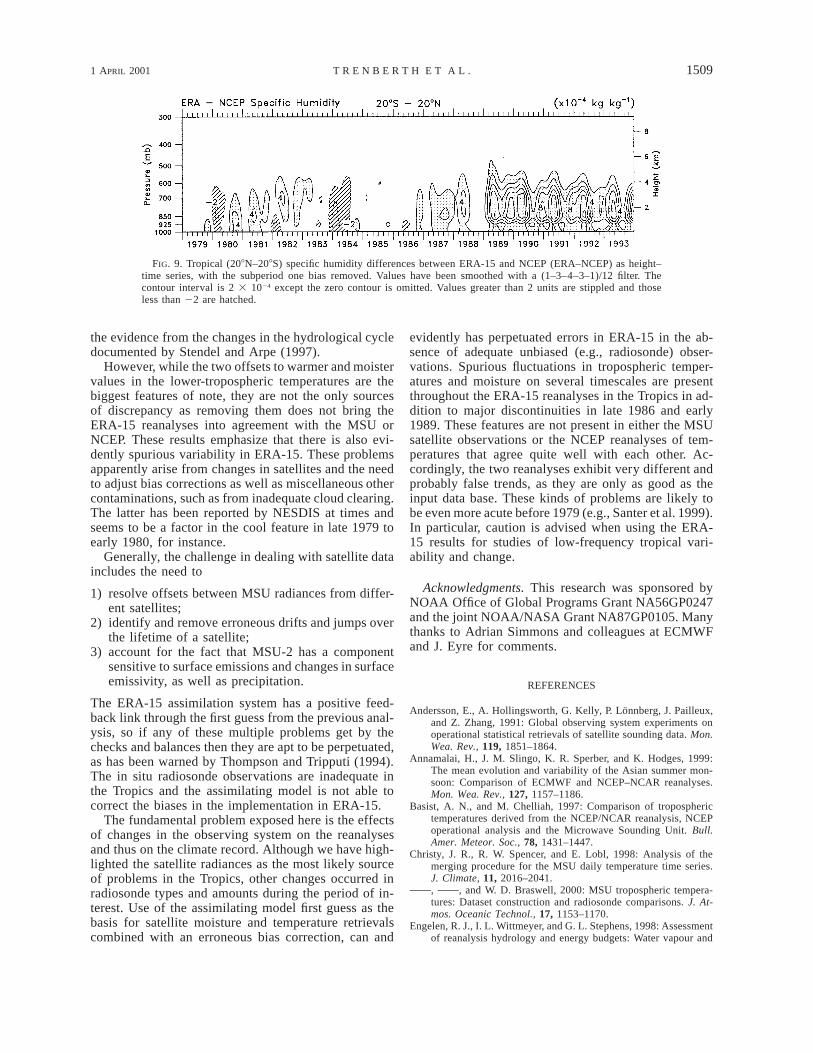
the equivalent of Fig. 6 and presents the differences ofsubperiods two and three with subperiod one for thespecific humidity field. Figure 9 shows the time seriesof the tropical averages of the ERA-15–NCEP specifichumidity with the bias for the January 1979 to October1986 removed, as in Fig. 7. Figures 7 and 9 are re-markably similar below 500 mb. The two discontinuitiesin October–November 1986 and March–April 1989 arepresent and several, but not all, of the other variationsmatch up. The cooling (Fig. 7) in early 1980 correspondsto a drying (Fig. 9) but the patterns do not correspondas well in 1984 and 1985. This may be partially becauseof the problems over western Amazonia and the fix thatwas implemented there (Kallberg (1997). Therefore thedifferences in the subperiods (Fig. 8) depict the effectsof the discontinuities on the moisture field. For Novem-
ber 1986 to March 1989 (subperiod 2) the moisteningwas mainly from 08–308S, while it was distributedthroughout the Tropics in the third subperiod. Thewarming and the concomitant moistening no doubt con-tributed to the spurious shift in the Inter-Tropical Con-vergence Zone over Africa, and other related changes(Stendel and Arpe 1997).
4. Concluding remarks
In this analysis we have tended to treat the MSU andNCEP reanalyses of temperature as a standard for com-parison, principally because they are somewhat inde-pendent and yet show close agreement, suggesting thatthey may be converging toward the truth. However,there is evidence that the changes in NESDIS retrieval
1508 VOLUME 14J O U R N A L O F C L I M A T E
FIG. 7. Tropical (208N to 208S) temperature differences between ERA-15 and NCEP (ERA–NCEP) as height–timeseries, with the subperiod one (Jan 1979–Oct 1986) bias removed. Values have been smoothed with a (1–3–4–3–1)/12 filter. The contour interval is 0.28C except the zero contour is omitted. Values greater than 0.28C are stippled andthose less than 20.28C are hatched.
FIG. 8. Differences between ERA-15 and NCEP reanalyses for (i) Nov 1986–Mar 1989 and (ii) Apr 1989–Dec 1993of the specific humidity with the bias for Jan 1979–Oct 1986 subtracted. The contour interval is 1 3 1024 kg kg21.Values greater than 2 3 1024 are stippled.
method in 1992 may have caused a spurious cooling ofNCEP reanalyses. The myriad of problems with the sat-ellite data also have been confronted and perhaps dealtwith by Christy et al. (1998; 2000) in generating theMSU time series, and several recent adjustments havebeen made, so that it is possible that further biases maystill be present, especially associated with how NOAA-9
is treated (Christy et al. 1998). Indeed, Hurrell and Tren-berth (1998) concluded that a coincidental cooling waslikely present in both NCEP and the earlier version ofMSU (version b), and therefore there is no final arbiterof what is the correct answer. Nevertheless, the evidencesuggests that problems are present in the ERA-15 re-analyses, and the temperature evidence is bolstered by
1 APRIL 2001 1509T R E N B E R T H E T A L .
FIG. 9. Tropical (208N–208S) specific humidity differences between ERA-15 and NCEP (ERA–NCEP) as height–time series, with the subperiod one bias removed. Values have been smoothed with a (1–3–4–3–1)/12 filter. Thecontour interval is 2 3 1024 except the zero contour is omitted. Values greater than 2 units are stippled and thoseless than 22 are hatched.
the evidence from the changes in the hydrological cycledocumented by Stendel and Arpe (1997).
However, while the two offsets to warmer and moistervalues in the lower-tropospheric temperatures are thebiggest features of note, they are not the only sourcesof discrepancy as removing them does not bring theERA-15 reanalyses into agreement with the MSU orNCEP. These results emphasize that there is also evi-dently spurious variability in ERA-15. These problemsapparently arise from changes in satellites and the needto adjust bias corrections as well as miscellaneous othercontaminations, such as from inadequate cloud clearing.The latter has been reported by NESDIS at times andseems to be a factor in the cool feature in late 1979 toearly 1980, for instance.
Generally, the challenge in dealing with satellite dataincludes the need to
1) resolve offsets between MSU radiances from differ-ent satellites;
2) identify and remove erroneous drifts and jumps overthe lifetime of a satellite;
3) account for the fact that MSU-2 has a componentsensitive to surface emissions and changes in surfaceemissivity, as well as precipitation.
The ERA-15 assimilation system has a positive feed-back link through the first guess from the previous anal-ysis, so if any of these multiple problems get by thechecks and balances then they are apt to be perpetuated,as has been warned by Thompson and Tripputi (1994).The in situ radiosonde observations are inadequate inthe Tropics and the assimilating model is not able tocorrect the biases in the implementation in ERA-15.
The fundamental problem exposed here is the effectsof changes in the observing system on the reanalysesand thus on the climate record. Although we have high-lighted the satellite radiances as the most likely sourceof problems in the Tropics, other changes occurred inradiosonde types and amounts during the period of in-terest. Use of the assimilating model first guess as thebasis for satellite moisture and temperature retrievalscombined with an erroneous bias correction, can and
evidently has perpetuated errors in ERA-15 in the ab-sence of adequate unbiased (e.g., radiosonde) obser-vations. Spurious fluctuations in tropospheric temper-atures and moisture on several timescales are presentthroughout the ERA-15 reanalyses in the Tropics in ad-dition to major discontinuities in late 1986 and early1989. These features are not present in either the MSUsatellite observations or the NCEP reanalyses of tem-peratures that agree quite well with each other. Ac-cordingly, the two reanalyses exhibit very different andprobably false trends, as they are only as good as theinput data base. These kinds of problems are likely tobe even more acute before 1979 (e.g., Santer et al. 1999).In particular, caution is advised when using the ERA-15 results for studies of low-frequency tropical vari-ability and change.
Acknowledgments. This research was sponsored byNOAA Office of Global Programs Grant NA56GP0247and the joint NOAA/NASA Grant NA87GP0105. Manythanks to Adrian Simmons and colleagues at ECMWFand J. Eyre for comments.
REFERENCES
Andersson, E., A. Hollingsworth, G. Kelly, P. Lonnberg, J. Pailleux,and Z. Zhang, 1991: Global observing system experiments onoperational statistical retrievals of satellite sounding data. Mon.Wea. Rev., 119, 1851–1864.
Annamalai, H., J. M. Slingo, K. R. Sperber, and K. Hodges, 1999:The mean evolution and variability of the Asian summer mon-soon: Comparison of ECMWF and NCEP–NCAR reanalyses.Mon. Wea. Rev., 127, 1157–1186.
Basist, A. N., and M. Chelliah, 1997: Comparison of tropospherictemperatures derived from the NCEP/NCAR reanalysis, NCEPoperational analysis and the Microwave Sounding Unit. Bull.Amer. Meteor. Soc., 78, 1431–1447.
Christy, J. R., R. W. Spencer, and E. Lobl, 1998: Analysis of themerging procedure for the MSU daily temperature time series.J. Climate, 11, 2016–2041., , and W. D. Braswell, 2000: MSU tropospheric tempera-tures: Dataset construction and radiosonde comparisons. J. At-mos. Oceanic Technol., 17, 1153–1170.
Engelen, R. J., I. L. Wittmeyer, and G. L. Stephens, 1998: Assessmentof reanalysis hydrology and energy budgets: Water vapour and
1510 VOLUME 14J O U R N A L O F C L I M A T E
radiative fluxes. Proc. First Int. WCRP Conf. on Reanalysis,Silver Springs, MD, WCRP-104, WMO/TD-876, 175–178.
Eyre, J. R., G. A. Kelly, A. P. McNally, E. Andersson, and A. Persson,1993: Assimilation of TOVS radiance information through one-dimensional variational analysis. Quart. J. Roy. Meteor. Soc.,119, 1427–1463.
Fiorino, M., 1999: The impact of the satellite observing system onlow-frequency temperature variability in the ECMWF and NCEPreanalyses. Proc. Second Int. Conf. on Reanalysis, Reading,United Kingdom, World Climate Research Programme, 23–27.
Gibson, J. K., P. Kallberg, S. Uppala, A. Hernandez, A. Nomura, andE. Serrano, 1997: ERA description. ECMWF Reanalysis ProjectRep. 1, 72 pp.
Hurrell, J. W., and K. E. Trenberth, 1998: Difficulties in obtainingreliable temperature trends: Reconciling the surface and satelliteMSU 2R trends. J. Climate, 11, 945–967., S. J. Brown, K. E. Trenberth, and J. R. Christy, 2000: Com-parison of tropospheric temperatures from radiosondes and sat-ellites: 1979–1998. Bull. Amer. Meteor., Soc., 81, 2165–2177.
Kallberg, P., 1997: Aspects of the reanalysed climate. ECMWF Re-analysis Project Rep. 2, 89 pp.
Kalnay, E., and Coauthors, 1996: The NCEP/NCAR 40-Year Re-analysis Project. Bull. Amer. Meteor. Soc., 77, 437–471.
Kelly, G., E. Andersson, A. Hollingsworth, P. Lonnberg, J. Pailleux,and Z. Zhang, 1991: Quality control of operational physical re-trievals of satellite sounding data. Mon. Wea. Rev., 119, 1866–1880.
Newman, M., P. D. Sardeshmukh, and J. W. Bergman, 2000: Anassessment of the NCEP, NASA, and ECMWF reanalyses overthe tropical west Pacific Warm Pool. Bull. Amer. Meteor. Soc.,81, 41–48.
Pawson, S., and M. Fiorino, 1998: A comparison of reanalyses in thetropical stratosphere. Part 1: Thermal structure and the annualcycle. Climate Dyn., 14, 631–644.
Santer, B. D., J. J. Hnilo, T. M. L. Wigley, J. S. Boyle, C. Doutriaux,M. Fiorino, D. E. Parker, and K. E. Taylor, 1999: Uncertaintiesin observationally based estimates of temperature change in thefree atmosphere. J. Geophys. Res., 104, 6305–6333.
Spencer, R. W., and J. R. Christy, 1992: Precision and radiosondevalidation of satellite gridpoint temperature anomalies. Part II:A tropospheric retrieval and trends during 1979–90. J. Climate,5, 858–866.
Stendel, M., and K. Arpe, 1997: Evaluation of the hydrological cyclein reanalyses and observations. Max-Planck-Institut fur Meteo-rologie Rep. 228, 52 pp. [Available from Max-Planck-Institutfur Meteorologie, Bundesstrasse 55, 20147 Hamburg, Germany.]
Thompson, O. E., and M. T. Tripputi, 1994: NWP-initialized satellitetemperature retrievals using statistical regularization and sin-gular value decomposition methods. Mon. Wea. Rev., 122, 897–926.
Trenberth, K. E., and J. G. Olson, 1988: An evaluation and inter-comparison of global analyses from NMC and ECMWF. Bull.Amer. Meteor. Soc., 69, 1047–1057., and C. J. Guillemot, 1998: Evaluation of the atmospheric mois-ture and hydrogical cycle in the NCEP/NCAR reanalyses. Cli-mate Dyn., 14, 213–231.
Uppala, S., 1997: Observing system performance in ERA. ECMWFReanalysis Project Rep. 3, 261 pp.
Wentz, F. J., and M. Schabel, 1998: Effects of satellite orbital decayon MSU lower tropospheric temperature trends. Nature, 394,661–664.