Embed Size (px)
DESCRIPTION
artigo
Citation preview
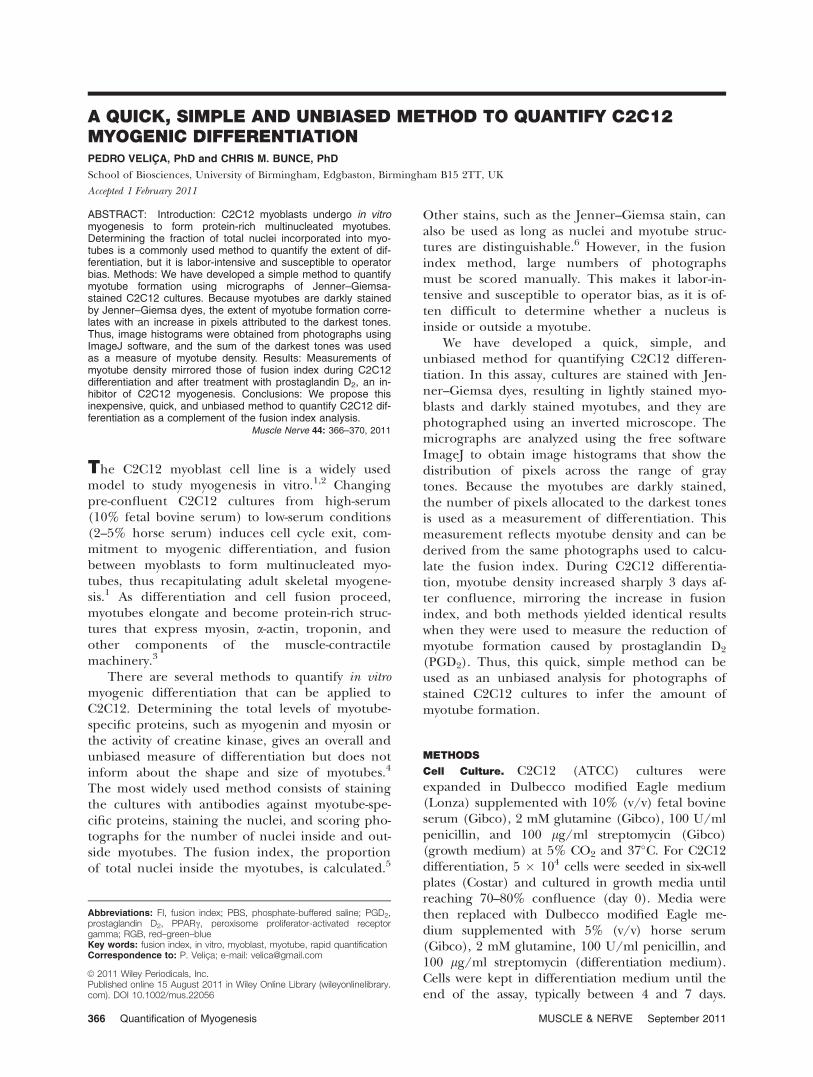
A QUICK, SIMPLE AND UNBIASED METHOD TO QUANTIFY C2C12MYOGENIC DIFFERENTIATIONPEDRO VELICA, PhD and CHRIS M. BUNCE, PhD
School of Biosciences, University of Birmingham, Edgbaston, Birmingham B15 2TT, UK
Accepted 1 February 2011
ABSTRACT: Introduction: C2C12 myoblasts undergo in vitromyogenesis to form protein-rich multinucleated myotubes.Determining the fraction of total nuclei incorporated into myo-tubes is a commonly used method to quantify the extent of dif-ferentiation, but it is labor-intensive and susceptible to operatorbias. Methods: We have developed a simple method to quantifymyotube formation using micrographs of Jenner–Giemsa-stained C2C12 cultures. Because myotubes are darkly stainedby Jenner–Giemsa dyes, the extent of myotube formation corre-lates with an increase in pixels attributed to the darkest tones.Thus, image histograms were obtained from photographs usingImageJ software, and the sum of the darkest tones was usedas a measure of myotube density. Results: Measurements ofmyotube density mirrored those of fusion index during C2C12differentiation and after treatment with prostaglandin D2, an in-hibitor of C2C12 myogenesis. Conclusions: We propose thisinexpensive, quick, and unbiased method to quantify C2C12 dif-ferentiation as a complement of the fusion index analysis.
Muscle Nerve 44: 366–370, 2011
The C2C12 myoblast cell line is a widely usedmodel to study myogenesis in vitro.1,2 Changingpre-confluent C2C12 cultures from high-serum(10% fetal bovine serum) to low-serum conditions(2–5% horse serum) induces cell cycle exit, com-mitment to myogenic differentiation, and fusionbetween myoblasts to form multinucleated myo-tubes, thus recapitulating adult skeletal myogene-sis.1 As differentiation and cell fusion proceed,myotubes elongate and become protein-rich struc-tures that express myosin, a-actin, troponin, andother components of the muscle-contractilemachinery.3
There are several methods to quantify in vitromyogenic differentiation that can be applied toC2C12. Determining the total levels of myotube-specific proteins, such as myogenin and myosin orthe activity of creatine kinase, gives an overall andunbiased measure of differentiation but does notinform about the shape and size of myotubes.4
The most widely used method consists of stainingthe cultures with antibodies against myotube-spe-cific proteins, staining the nuclei, and scoring pho-tographs for the number of nuclei inside and out-side myotubes. The fusion index, the proportionof total nuclei inside the myotubes, is calculated.5
Other stains, such as the Jenner–Giemsa stain, canalso be used as long as nuclei and myotube struc-tures are distinguishable.6 However, in the fusionindex method, large numbers of photographsmust be scored manually. This makes it labor-in-tensive and susceptible to operator bias, as it is of-ten difficult to determine whether a nucleus isinside or outside a myotube.
We have developed a quick, simple, andunbiased method for quantifying C2C12 differen-tiation. In this assay, cultures are stained with Jen-ner–Giemsa dyes, resulting in lightly stained myo-blasts and darkly stained myotubes, and they arephotographed using an inverted microscope. Themicrographs are analyzed using the free softwareImageJ to obtain image histograms that show thedistribution of pixels across the range of graytones. Because the myotubes are darkly stained,the number of pixels allocated to the darkest tonesis used as a measurement of differentiation. Thismeasurement reflects myotube density and can bederived from the same photographs used to calcu-late the fusion index. During C2C12 differentia-tion, myotube density increased sharply 3 days af-ter confluence, mirroring the increase in fusionindex, and both methods yielded identical resultswhen they were used to measure the reduction ofmyotube formation caused by prostaglandin D2
(PGD2). Thus, this quick, simple method can beused as an unbiased analysis for photographs ofstained C2C12 cultures to infer the amount ofmyotube formation.
METHODS
Cell Culture. C2C12 (ATCC) cultures wereexpanded in Dulbecco modified Eagle medium(Lonza) supplemented with 10% (v/v) fetal bovineserum (Gibco), 2 mM glutamine (Gibco), 100 U/mlpenicillin, and 100 lg/ml streptomycin (Gibco)(growth medium) at 5% CO2 and 37�C. For C2C12differentiation, 5 � 104 cells were seeded in six-wellplates (Costar) and cultured in growth media untilreaching 70–80% confluence (day 0). Media werethen replaced with Dulbecco modified Eagle me-dium supplemented with 5% (v/v) horse serum(Gibco), 2 mM glutamine, 100 U/ml penicillin, and100 lg/ml streptomycin (differentiation medium).Cells were kept in differentiation medium until theend of the assay, typically between 4 and 7 days.
Abbreviations: FI, fusion index; PBS, phosphate-buffered saline; PGD2,prostaglandin D2, PPARc, peroxisome proliferator-activated receptorgamma; RGB, red–green–blue
Correspondence to: P. Velica; e-mail: [email protected]
VC 2011 Wiley Periodicals, Inc.Published online 15 August 2011 in Wiley Online Library (wileyonlinelibrary.com). DOI 10.1002/mus.22056
Key words: fusion index, in vitro, myoblast, myotube, rapid quantification
366 Quantification of Myogenesis MUSCLE & NERVE September 2011
Myotube formation was monitored daily using aninverted microscope. All treatments and/or time-points were performed in biological triplicates.
Jenner–Giemsa Staining and Fusion Index Scoring. Cellsin wells were washed with phosphate-bufferedsaline (PBS), fixed with 100% methanol for 5 min,and left to air dry for 10 min. If not stained imme-diately after fixing, wells were covered with theirlids and stored at room temperature. Jenner stain-ing solution (BDH, Poole UK) was diluted 1:3 in 1mM sodium phosphate buffer (pH 5.6), and 1 mlwas incubated in the wells for 5 min followed bywashing with distilled water. Wells were then incu-bated with 1 ml Giemsa stain (BDH) diluted 1:20in 1 mM sodium phosphate buffer (pH 5.6) for 10min at room temperature before washing againwith water. Importantly, all wells within a singleexperiment were stained simultaneously using thesame batch of Jenner and Giemsa dyes. Each wellwas photographed in four randomly selectedregions using a digital camera (Olympus CamediaC-5050) adapted to an inverted microscope. Pro-tein-rich myotubes can be identified by a darkerpurple color, whereas nuclei stain pink. For eachfield, the number of nuclei incorporated in myo-tubes and the total number of nuclei were scored.Fusion index (FI) was calculated as the percentageof total nuclei incorporated in myotubes.
Histogram Analysis. Images had a resolution of2560 � 1920 pixels and were in a red–green–blue(RGB) color model. Data are presented in graytones, as ImageJ converts RGB images to grayscale. Gray tone images can also be used, but coloris useful when performing the aforementioned FIscoring. Digital photographs of Jenner–Giemsa-stained cultures were analyzed using the freeimage-processing software ImageJ, version 1.40g(http://rsbweb.nih.gov/ij). Image histogram analy-sis can be obtained by selecting ‘‘Analyze/Histo-gram’’ or pressing ‘‘ctrlþH.’’ The x-axis of theimage histogram represents the range of 255 graytones (0 ¼ black, 255 ¼ white), and the y-axis isthe number of pixels attributed to each tone. For
each image, the histogram data were copied into aspreadsheet, and the average pixel count for eachtone was calculated for the replicate images andused to plot an average histogram for each condi-tion or time-point. Histograms derived from myo-tube-rich cultures have a larger proportion of pix-els attributed to the darkest tones.
For quantification of myotube density the meannumber of pixels in each image attributed to tones0–75 was calculated between replicates for eachcondition or time-point. The calculations for sev-eral images can be rapidly performed using aspreadsheet template. The threshold of darkesttones (75) is chosen arbitrarily but depends on thehistogram shape. The shape may vary betweenexperiments and should include the interval oftones where the difference between conditions isgreatest. Importantly, the same threshold must beused for all images in a single experiment.
RESULTS
Histogram Analysis of Differentiating C2C12 Cultur-
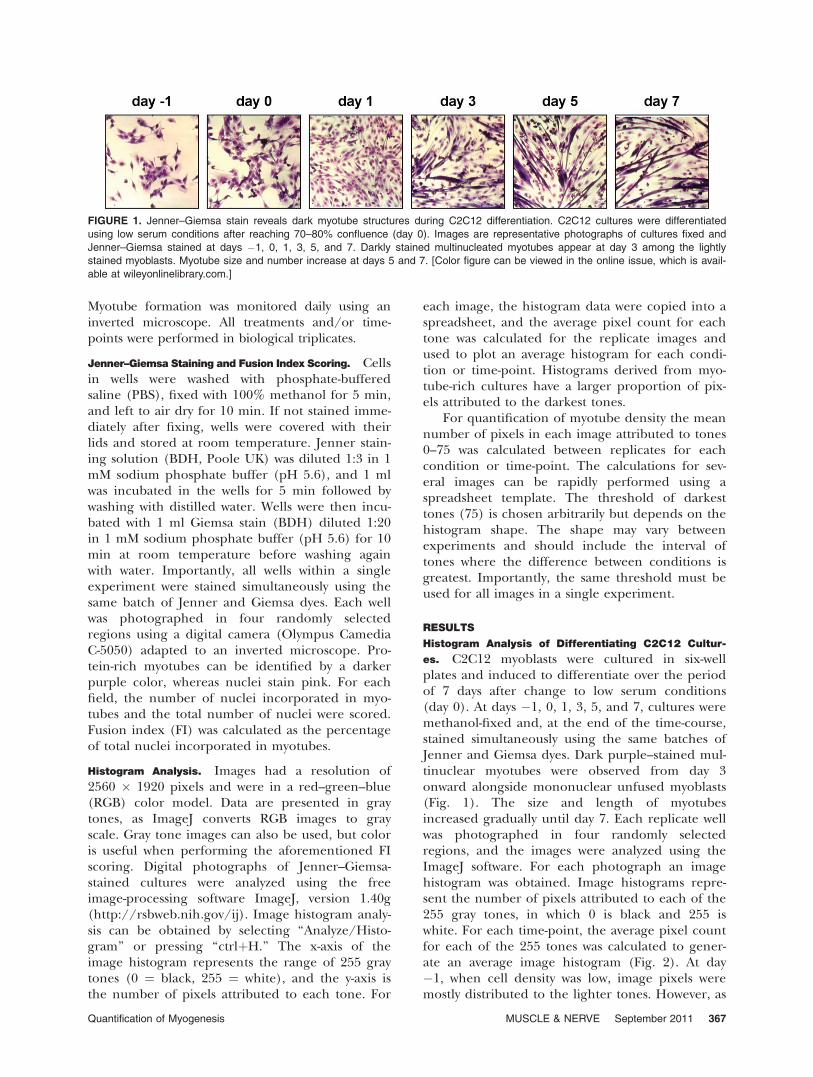
es. C2C12 myoblasts were cultured in six-wellplates and induced to differentiate over the periodof 7 days after change to low serum conditions(day 0). At days �1, 0, 1, 3, 5, and 7, cultures weremethanol-fixed and, at the end of the time-course,stained simultaneously using the same batches ofJenner and Giemsa dyes. Dark purple–stained mul-tinuclear myotubes were observed from day 3onward alongside mononuclear unfused myoblasts(Fig. 1). The size and length of myotubesincreased gradually until day 7. Each replicate wellwas photographed in four randomly selectedregions, and the images were analyzed using theImageJ software. For each photograph an imagehistogram was obtained. Image histograms repre-sent the number of pixels attributed to each of the255 gray tones, in which 0 is black and 255 iswhite. For each time-point, the average pixel countfor each of the 255 tones was calculated to gener-ate an average image histogram (Fig. 2). At day�1, when cell density was low, image pixels weremostly distributed to the lighter tones. However, as
FIGURE 1. Jenner–Giemsa stain reveals dark myotube structures during C2C12 differentiation. C2C12 cultures were differentiated
using low serum conditions after reaching 70–80% confluence (day 0). Images are representative photographs of cultures fixed and
Jenner–Giemsa stained at days �1, 0, 1, 3, 5, and 7. Darkly stained multinucleated myotubes appear at day 3 among the lightly
stained myoblasts. Myotube size and number increase at days 5 and 7. [Color figure can be viewed in the online issue, which is avail-
able at wileyonlinelibrary.com.]
Quantification of Myogenesis MUSCLE & NERVE September 2011 367
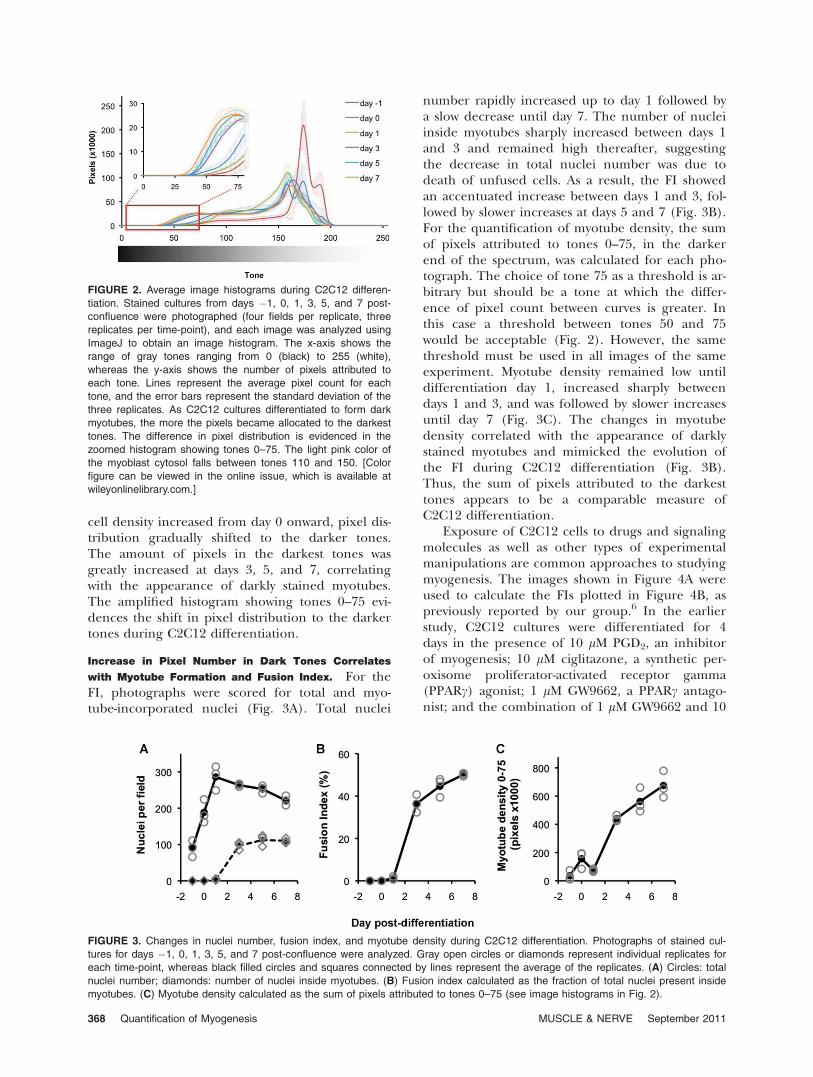
cell density increased from day 0 onward, pixel dis-tribution gradually shifted to the darker tones.The amount of pixels in the darkest tones wasgreatly increased at days 3, 5, and 7, correlatingwith the appearance of darkly stained myotubes.The amplified histogram showing tones 0–75 evi-dences the shift in pixel distribution to the darkertones during C2C12 differentiation.
Increase in Pixel Number in Dark Tones Correlates
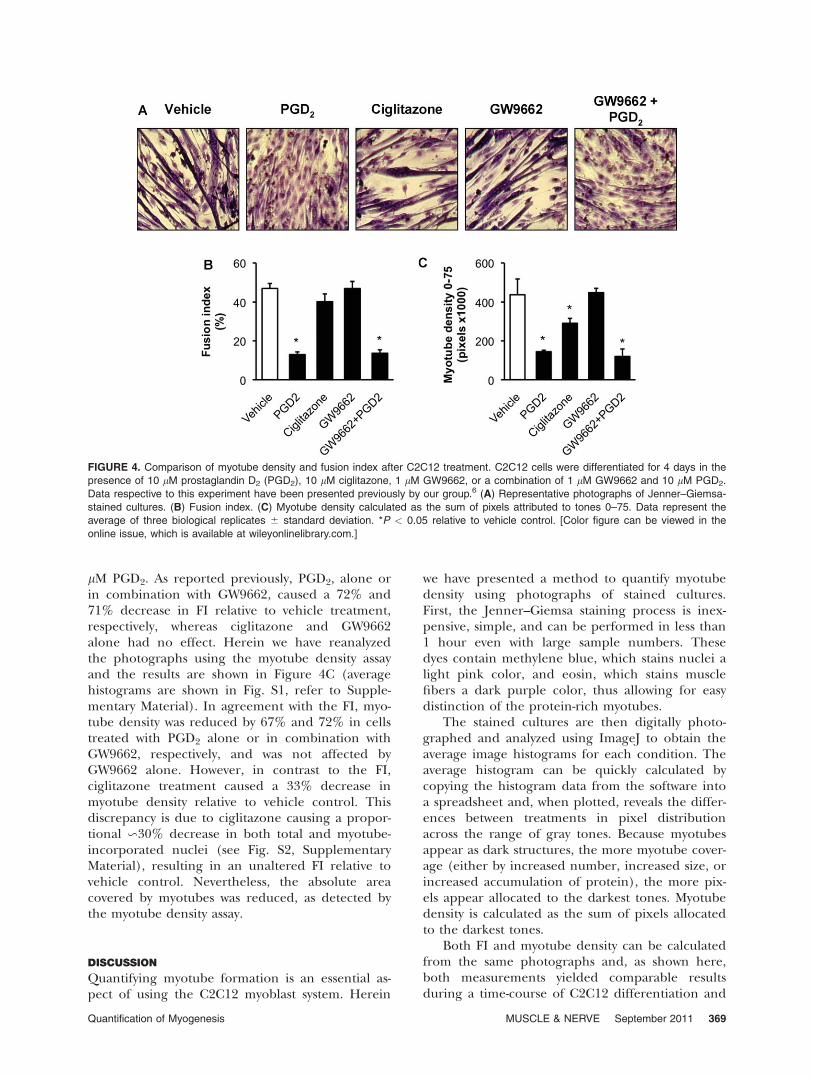
with Myotube Formation and Fusion Index. For theFI, photographs were scored for total and myo-tube-incorporated nuclei (Fig. 3A). Total nuclei
number rapidly increased up to day 1 followed bya slow decrease until day 7. The number of nucleiinside myotubes sharply increased between days 1and 3 and remained high thereafter, suggestingthe decrease in total nuclei number was due todeath of unfused cells. As a result, the FI showedan accentuated increase between days 1 and 3, fol-lowed by slower increases at days 5 and 7 (Fig. 3B).For the quantification of myotube density, the sumof pixels attributed to tones 0–75, in the darkerend of the spectrum, was calculated for each pho-tograph. The choice of tone 75 as a threshold is ar-bitrary but should be a tone at which the differ-ence of pixel count between curves is greater. Inthis case a threshold between tones 50 and 75would be acceptable (Fig. 2). However, the samethreshold must be used in all images of the sameexperiment. Myotube density remained low untildifferentiation day 1, increased sharply betweendays 1 and 3, and was followed by slower increasesuntil day 7 (Fig. 3C). The changes in myotubedensity correlated with the appearance of darklystained myotubes and mimicked the evolution ofthe FI during C2C12 differentiation (Fig. 3B).Thus, the sum of pixels attributed to the darkesttones appears to be a comparable measure ofC2C12 differentiation.
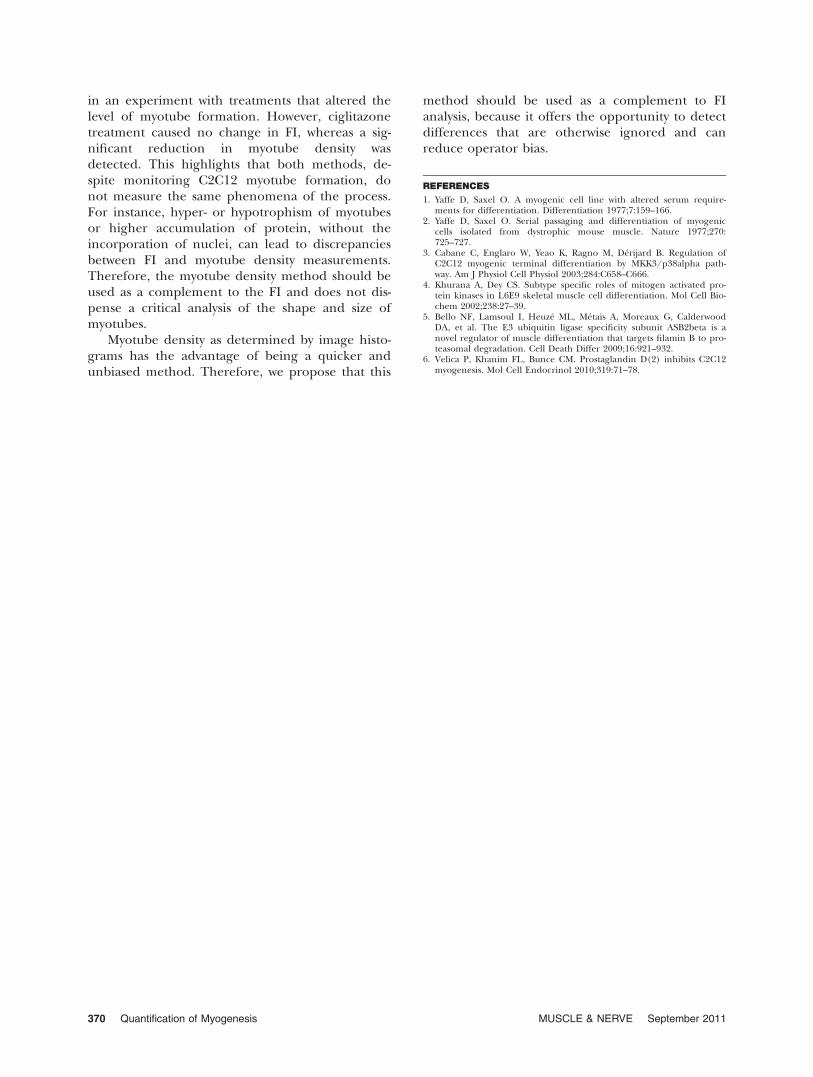
Exposure of C2C12 cells to drugs and signalingmolecules as well as other types of experimentalmanipulations are common approaches to studyingmyogenesis. The images shown in Figure 4A wereused to calculate the FIs plotted in Figure 4B, aspreviously reported by our group.6 In the earlierstudy, C2C12 cultures were differentiated for 4days in the presence of 10 lM PGD2, an inhibitorof myogenesis; 10 lM ciglitazone, a synthetic per-oxisome proliferator-activated receptor gamma(PPARc) agonist; 1 lM GW9662, a PPARc antago-nist; and the combination of 1 lM GW9662 and 10
FIGURE 2. Average image histograms during C2C12 differen-
tiation. Stained cultures from days �1, 0, 1, 3, 5, and 7 post-
confluence were photographed (four fields per replicate, three
replicates per time-point), and each image was analyzed using
ImageJ to obtain an image histogram. The x-axis shows the
range of gray tones ranging from 0 (black) to 255 (white),
whereas the y-axis shows the number of pixels attributed to
each tone. Lines represent the average pixel count for each
tone, and the error bars represent the standard deviation of the
three replicates. As C2C12 cultures differentiated to form dark
myotubes, the more the pixels became allocated to the darkest
tones. The difference in pixel distribution is evidenced in the
zoomed histogram showing tones 0–75. The light pink color of
the myoblast cytosol falls between tones 110 and 150. [Color
figure can be viewed in the online issue, which is available at
wileyonlinelibrary.com.]
FIGURE 3. Changes in nuclei number, fusion index, and myotube density during C2C12 differentiation. Photographs of stained cul-
tures for days �1, 0, 1, 3, 5, and 7 post-confluence were analyzed. Gray open circles or diamonds represent individual replicates for
each time-point, whereas black filled circles and squares connected by lines represent the average of the replicates. (A) Circles: total
nuclei number; diamonds: number of nuclei inside myotubes. (B) Fusion index calculated as the fraction of total nuclei present inside
myotubes. (C) Myotube density calculated as the sum of pixels attributed to tones 0–75 (see image histograms in Fig. 2).
368 Quantification of Myogenesis MUSCLE & NERVE September 2011
lM PGD2. As reported previously, PGD2, alone orin combination with GW9662, caused a 72% and71% decrease in FI relative to vehicle treatment,respectively, whereas ciglitazone and GW9662alone had no effect. Herein we have reanalyzedthe photographs using the myotube density assayand the results are shown in Figure 4C (averagehistograms are shown in Fig. S1, refer to Supple-mentary Material). In agreement with the FI, myo-tube density was reduced by 67% and 72% in cellstreated with PGD2 alone or in combination withGW9662, respectively, and was not affected byGW9662 alone. However, in contrast to the FI,ciglitazone treatment caused a 33% decrease inmyotube density relative to vehicle control. Thisdiscrepancy is due to ciglitazone causing a propor-tional �30% decrease in both total and myotube-incorporated nuclei (see Fig. S2, SupplementaryMaterial), resulting in an unaltered FI relative tovehicle control. Nevertheless, the absolute areacovered by myotubes was reduced, as detected bythe myotube density assay.
DISCUSSION
Quantifying myotube formation is an essential as-pect of using the C2C12 myoblast system. Herein
we have presented a method to quantify myotubedensity using photographs of stained cultures.First, the Jenner–Giemsa staining process is inex-pensive, simple, and can be performed in less than1 hour even with large sample numbers. Thesedyes contain methylene blue, which stains nuclei alight pink color, and eosin, which stains musclefibers a dark purple color, thus allowing for easydistinction of the protein-rich myotubes.
The stained cultures are then digitally photo-graphed and analyzed using ImageJ to obtain theaverage image histograms for each condition. Theaverage histogram can be quickly calculated bycopying the histogram data from the software intoa spreadsheet and, when plotted, reveals the differ-ences between treatments in pixel distributionacross the range of gray tones. Because myotubesappear as dark structures, the more myotube cover-age (either by increased number, increased size, orincreased accumulation of protein), the more pix-els appear allocated to the darkest tones. Myotubedensity is calculated as the sum of pixels allocatedto the darkest tones.
Both FI and myotube density can be calculatedfrom the same photographs and, as shown here,both measurements yielded comparable resultsduring a time-course of C2C12 differentiation and
FIGURE 4. Comparison of myotube density and fusion index after C2C12 treatment. C2C12 cells were differentiated for 4 days in the
presence of 10 lM prostaglandin D2 (PGD2), 10 lM ciglitazone, 1 lM GW9662, or a combination of 1 lM GW9662 and 10 lM PGD2.
Data respective to this experiment have been presented previously by our group.6 (A) Representative photographs of Jenner–Giemsa-
stained cultures. (B) Fusion index. (C) Myotube density calculated as the sum of pixels attributed to tones 0–75. Data represent the
average of three biological replicates 6 standard deviation. *P < 0.05 relative to vehicle control. [Color figure can be viewed in the
online issue, which is available at wileyonlinelibrary.com.]
Quantification of Myogenesis MUSCLE & NERVE September 2011 369
in an experiment with treatments that altered thelevel of myotube formation. However, ciglitazonetreatment caused no change in FI, whereas a sig-nificant reduction in myotube density wasdetected. This highlights that both methods, de-spite monitoring C2C12 myotube formation, donot measure the same phenomena of the process.For instance, hyper- or hypotrophism of myotubesor higher accumulation of protein, without theincorporation of nuclei, can lead to discrepanciesbetween FI and myotube density measurements.Therefore, the myotube density method should beused as a complement to the FI and does not dis-pense a critical analysis of the shape and size ofmyotubes.
Myotube density as determined by image histo-grams has the advantage of being a quicker andunbiased method. Therefore, we propose that this
method should be used as a complement to FIanalysis, because it offers the opportunity to detectdifferences that are otherwise ignored and canreduce operator bias.
REFERENCES
1. Yaffe D, Saxel O. A myogenic cell line with altered serum require-ments for differentiation. Differentiation 1977;7:159–166.
2. Yaffe D, Saxel O. Serial passaging and differentiation of myogeniccells isolated from dystrophic mouse muscle. Nature 1977;270:725–727.
3. Cabane C, Englaro W, Yeao K, Ragno M, Derijard B. Regulation ofC2C12 myogenic terminal differentiation by MKK3/p38alpha path-way. Am J Physiol Cell Physiol 2003;284:C658–C666.
4. Khurana A, Dey CS. Subtype specific roles of mitogen activated pro-tein kinases in L6E9 skeletal muscle cell differentiation. Mol Cell Bio-chem 2002;238:27–39.
5. Bello NF, Lamsoul I, Heuze ML, Metais A, Moreaux G, CalderwoodDA, et al. The E3 ubiquitin ligase specificity subunit ASB2beta is anovel regulator of muscle differentiation that targets filamin B to pro-teasomal degradation. Cell Death Differ 2009;16:921–932.
6. Velica P, Khanim FL, Bunce CM. Prostaglandin D(2) inhibits C2C12myogenesis. Mol Cell Endocrinol 2010;319:71–78.
370 Quantification of Myogenesis MUSCLE & NERVE September 2011