Embed Size (px)
Citation preview
1
Quantifying residues of phosphonic acid for tree nut export to European Union 1
2
3
Spencer S. Walse1, Wiley A. Hall IV
1, Marcel C. Bruggeman
2, Bill Beckham
3, Jeanette 4
Muhareb3, and Tom Jones
3 5
6
1USDA, Agricultural Research Service, San Joaquin Valley Agricultural Sciences Center, 7
9611 South Riverbend Avenue, Parlier CA 93648-9757 8
[email protected]; [email protected] 9
10
2NofaLab, Jan van Galenstraat 41 – NL 3115 JG Schiedam 11
12
13
3DFA of California 14
1855 S Van Ness Ave, Fresno, CA [email protected]; [email protected]; 15
17
18
Submitted 27 October 2015 as Year 1 reporting requirement for USDA-Foreign Agricultural 19
Service Technical Assistance for Specialty Crops grant #2014-26 entitled “Phosphorous Acid 20
MRL Barrier to EU Export of California Tree Nuts: Fundamentals of Environmental Analysis, 21
Fate, and Transport” 22
23
CONFIDENTIALITY NOTICE: This report (including any attachments) contains confidential information and is for the sole use of the intended 24 recipient(s) and its stated purpose and is protected by law. Any disclosure, copying, or distribution of this letter and its contents, or the taking of 25 any action based on it, is strictly prohibited. 26
27
28
2
Abstract. 29
A novel analytical approach, involving extraction with methanolic solvent followed by liquid 30
chromatography-tandem mass spectrometry (LC-MS/MS), was developed to quantify residues of 31
phosphonic acid and its phosphonate salts. Tree nuts were analyzed for residues and results 32
obtained with the novel approach were comparatively evaluated relative to published methods 33
used by the European Union for food and feed (i.e., QuPPe-Method Version 7.1 and Version 8.0). 34
Despite investigating several liquid chromatography (LC) stationary phases (anion exchange, 35
diol, and hypercarb) and eluents, chromatographic resolution between phosphonic acid and 36
phosphoric acid was not consistently achieved. Verification and quantification of phosphonic 37
acid in the presence of co-eluting phosphoric acid was accomplished with positive (+) 38
electrospray ionization tandem mass spectrometry (i.e., (+) ESI MS/MS), as negative ionization 39
yielded spectrometric interferences from phosphoric acid, as well as marked ion suppression, 40
which varied as a function of mass spectrometer type. Results are discussed in the context of key 41
methodological deficiencies associated with QuPPe-Method Version 7.1 and Version 8.0 as 42
related to qualifying maximum residue level (MRL) exceedances for fosetyl aluminum in tree 43
nuts based on quantification of phosphonic acid and its phosphonate salts. 44
45
46
47
48
49
50
51
3
Introduction 52
53
The European Union (EU) imports tree nuts (e.g., almonds, pistachios, and walnuts) from 54
California USA with an estimated value of $2.7 billion in 2014. The use of fosetyl aluminum, 55
which is not allowed in California on nut-bearing trees, is subject to maximum residue limits 56
(MRL) for fosetyl aluminum on food and feed of plant and animal origin per Annex III of 57
European Commission’s (EC) Regulation No 396/2005, as amended by No 991/2014. Therein, 58
fosetyl aluminum is defined as the “sum of fosetyl, phosphonic acid and their salts, expressed as 59
fosetyl”. However, this definition is complicated by the fact that residues of phosphonic acid (and 60
its phosphonate salts) can originate from many agrochemical sources, not solely fosetyl 61
aluminum. 62
63
Three distinct methods (M 1.1, M 1.2, and M 1.3) in Version 7.1 (November 2013) of EURL-64
SRM “Quick Method for the Analysis of Residues of numerous Highly Polar Pesticides in Foods 65
of Plant Origin involving Simultaneous Extraction with Methanol and LC-MS/MS Determination 66
(QuPPe-Method)”, which are all based on analysis with liquid chromatography and electrospray 67
ionization tandem mass spectroscopy (LC-ESI MS/MS), were cited for the quantification of 68
fosetyl, phosphonic acid, and their salts. While the analysis yielded accurate results for fosetyl 69
residues, it was recognized that the negative ion (-) MS2 mass transition listed for quantification 70
of phosphonic acid (m/z 8163) (precursor product) was also observed from phosphoric acid 71
and its salts, environmentally ubiquitous compounds (Scheme 1). QuPPe-Method Version 8 was 72
published in March 2015 with modification to four distinct chromatographic approaches (M 1.1, 73
M 1.2, M 1.3, and M1.4) and detailed discussion of the mass spectrometric shortcomings of 74
Version 7.1. The authors of Version 8.0 revised the negative ion (-) MS2 mass transition for 75
4
phosphonic acid (m/z 8179), however curiously, an (m/z 8179) transition can also be 76
observed for phosphoric acid (and its salts) (vide infra). 77
78
We report novel methodology to quantify residues of phosphonic acid (and it phosphonate salts) 79
in tree nuts (i.e, including walnuts, almonds, and pistachios) based on positive ion (+) MS2 mass 80
transitions that discriminate phosphoric acid (and its salts). A suite of tree nut samples were 81
analyzed with the novel methodology using three different instruments as well as, for reference, 82
the MS parameters of QuPPe-Method Version 7.1 and 8. Results are discussed in the context of 83
critical methodological deficiencies of QuPPe-Method Version 7.1 and 8.0 as related to 84
qualifying MRL exceedances for fosetyl-Al based in tree nuts on quantification of phosphonic 85
acid (and its phosphonate salts). 86
87
Materials and Methods 88
89
Standards, reagents, and solvents 90
Barnstead E-pure deionized (DI) water (18 M-cm) was used for solutions. HPLC-grade 91
methanol was from Burdick & Jackson (Muskegon, MI, USA). ACS-grade formic acid with > 92
96% purity was from Alfa Aesar (Ward Hill, MA) (Cat #36617). Phosphoric acid was from 93
JTBaker (Cat # 0262-02). Phosphonic acid (phosphorous acid) was obtained with a purity >99% 94
from GFS (Cat # 3566). Technical grade fosetyl-aluminum (aluminum tri(ethyl hydrogen 95
phosphonate) was obtained from Chem Service (Cat # N-12019-100mg). Technical grade 96
ethephon (2-chloroethyl phosphonic acid) was obtained from Chem Service (Cat # N-10002-97
250mg). Working stock solutions (100 ngL-1
and 100 ngL-1
) of phosphoric acid and 98
5
phosphonic acid were prepared in aqueous solutions of 0.1% formic acid and stored at ~5 °C. All 99
other chemicals were obtained from commercial sources unless otherwise noted. 100
101
Sampling, extraction procedure, and calibration standards 102
In general, residues of phosphonic acid and phosphoric acid were identified based on 103
spectrometric agreement with purchased standards. Detector response and liquid chromatography 104
(LC) retention indices were determined each day via serial dilutions of working aqueous stock 105
solutions (100 mg/mL (ppm) phosphonic acid + 100 mg/mL (ppm) phosphoric acid in 0.1% 106
formic acid (v/v)) into 0.1% formic acid (v/v) to yield calibration standards with a final volume 107
of 1mL. Specifically, tandem mass spectrometry was used for chemical verification and the 108
integral of peak area associated with the MS2 mass transition, referenced relative to linear least-109
squares analysis of a 5-point plot of concentration versus detector response, was used to 110
determine concentration of calibration standards. 111
112
Eighteen ~15-kg source-specific packages containing tree nuts, each of unknown origin and nut 113
type, were obtained “blinded” from the International Nut and Dried Fruit Council (Reus, Spain). 114
Tree nuts from each source were received after having been ground using a Robot Coupe grinder 115
(Model R45) for 15 s at speed 1, and passed through a sieve. Typically, a #10, #20, or #10 sieve 116
is used respectively for walnuts, almonds, or pistachios. Five sources were randomly selected 117
(#2, 4, 9, 12, &15), and an (~ 5 kg) allocation of each was distributed to the three laboratories 118
housing the respective LC-ESI MS/MS systems (A, B, & C) (Figure 1). 119
120
Two groupings, weighing respectively 500 g and 100 g, were portioned from the ~5kg allocation 121
of each source. The 500-g portion was extracted by QuPPe-Method Version 8.0 to comprise a 122
6
single sample. Alternatively, a novel procedure was used to extract the 100-g portion. A 10.0-g 123
nut sample, as measured gravimetrically, was taken from the 100-g portion and transferred to a 124
250-mL beaker. DI water (5mL) was added and the mixture was stored at room temperature for 125
one hour. An aqueous solution of 95% methanol (100 mL) was added before 1 mL of 1% formic 126
acid (v/v). The mixture was stirred with a stirring rod, fortified if necessary, and sonicated 127
(Branson Model 3800) for 5 min. The mixture was filtered with a 60-mm powder funnel and 15-128
cm diameter filter paper (VWR 415, cat# 28320-121) into a ~200-mL glass vessel (round 129
bottomed flask) for subsequent concentration (vide infra). Solids were rinsed from the beaker 130
with ~5mL of water onto the filter, which was then washed with an additional ~5mL of water 131
into the vessel. The filtrate was concentrated to a residue in the vessel using a rotary evaporator 132
at 40 C (Heidolph Laborota 4000). The residue was rinsed with ~3mL of DI water and 133
transferred into a 50-mL centrifuge tube. The vessel was rinsed 2 more times with ~3 mL DI 134
water and added to the centrifuge tube, the contents of which were then dried using a SpeedVac 135
concentrator. The residue was rinsed with ~3mL of aqueous 0.1% formic acid, transferred into a 136
3-mL plastic syringe (BD, Model 309585) with a Luer-Lok tip, and eluted through a 0.45-µm 137
Nylon syringe filter (Titon3) into a C18 Sep-Pak cartridge (Waters, WAT036810) outfitted onto 138
a solid phase extraction (SPE) vacuum manifold. Both the filter and C18 cartridge were pre-139
rinsed with 3 mL of methanol followed by 3 mL of water. Eluant was directed into a volumetric 140
12-mL screw-top vial (National B7999-12) with a PTFE-lined cap (Thermo Scientific B7815-141
15). The tube was then successively rinsed two additional times, each with an additional ~3mL 142
of aqueous 0.1% formic acid and the eluted as above. The eluant was diluted in the vial to 10 mL 143
and then transferred into to a 9-mm diameter, 2-mL screw-top vial with PTFE/Silicone lined 144
Verex caps for subsequent LC-ESI MS/MS analysis. 145
7
146
Residue quantification 147
Consistent with official EU guidance outlined in “Method Validation and Quality Control 148
Procedures for Pesticide Residue Analysis in Food and Feed, Document # 149
SANCO/12571/2013”, standard addition methodology (SAM), which inherently reflects analyte 150
recoveries and matrix effects, was used to quantify residue levels in a tree nut sample; analyte 151
concentration was measured in a nut sample as well as in quadruplicate nut samples that had the 152
methanolic solvent of each fortified (i.e., spiked) with different known quantities of working 153
stocks prior to sonication (vide supra). Each sample was analyzed in triplicate. Linear-least 154
squares analysis of the 15-point composite response was conducted as described above, and the 155
correlation coefficient as well as the (±) 95% confidence interval of the regression was 156
calculated. Residue levels were reported with (±) “standard error” as described for the 157
extrapolation method (equation 13) in Bruce and Gill (1999), which is equivalent to the standard 158
deviation (equation 1) reported in Bagur et al. (2005). Alternatively, a linear-least squares 159
analysis of each 5-point responses was conducted, with residue levels reported as average (±) 160
standard error (n = 3) as propagated in Skoog and Leary (1992). 161
162
Liquid chromatography tandem mass spectrometry-System A 163
An Agilent Technologies 1260 liquid chromatography system, a 2 x 50mm Dionex IonPac 164
AG11-HC column at 40 C, and an Agilent Technologies 6430 Triple Quadrapole mass 165
spectrometer were used at the DFA of California laboratory in Fresno, California. A column flow 166
of 0.3 mLmin-1
10mM ammonium acetate in 0.01% (v/v) aqueous formic acid was held isocratic 167
for 3 min. Column effluent was routed through 60 cm of red Peek tubing (0.2286 mm i.d.) to a 168
8
ESI source with spray voltage of 4000 V (+/-). Flow parameters for nitrogen source/nebulizer 169
and curtain gas were 35psi and 10 L min-1
at 350 C, respectively. 170
171
Multiple reaction monitoring (MRM) of positive (+) ions was used for quantification and 172
qualification based on parameter optimization of authentic standards. The focusing potential 173
(EMV) was 250 V (±), the ion dwell time was 700, and the fragmentation energy was 46 and 116 174
V for phosphonic acid and phosphoric acid, respectively. For phosphonic acid, ion-molecule 175
reaction with NH4 m/z 100 ([M + NH4]+) was observed and selected as the precursor ion. The 176
collision energies associated with the MS2 of m/z (100.0 65.2) and the (100.0 47.2) 177
reactions were 28 and 44 (V), respectively. Ions with m/z 65.2 ([M + NH4 - H20 - NH3]+) as 178
well as 47.2 ([M + NH4 - 2H20 - NH3]+) were quantified with ± 0.1 m/z resolution. For 179
phosphoric acid, m/z 99.0 ([M + H]+) was selected as the precursor ion. Collision energies 180
associated with the MS2 of m/z (99.0 81.1) and the (99.0 63.1) reactions were 20 and 36 181
(V), respectively. Again, product ions of m/z 81.1 ([M + H - H20]+) as well as 63.1 ([M + H - 182
2H20]+) were quantified with ± 0.1 m/z resolution. 183
184
Liquid chromatography tandem mass spectrometry-System B 185
Dual Shimadzu LC-20AD HPLC pumps, a Shimadzu SBD-20A UV detector (PDA), a 2 x 50mm 186
Type-C Cogent diol column at 40 C, and a Shimadzu 8040 triple quadrapole mass spectrometer 187
were used at the USDA-ARS, San Joaquin Agricultural Sciences Center in Parlier, California. A 188
column flow of 0.4 mLmin-1
0.10% (v/v) formic acid in a 30% acetonitrile (ACN) solution was 189
held isocratic for 9 min. Column effluent was routed through 60 cm of red Peek tubing (0.2286 190
mm i.d.) and to an ESI source with a spray voltage of 4500 V (+/-). Nitrogen at a rate of 3 and 191
9
15 Lmin-1
were used as the nebulizing and drying gas flows, respectively. The desolvation line 192
was set to 300 °C and the heating block to 400 °C. 193
194
Multiple reaction monitoring (MRM) of positive (+) ions was used for quantification and 195
qualification based on parameter optimization of authentic standards. The event dwell time was 196
0.256 s, the collision cell pressure was 230 kPa, and Q1 and Q3 were both set to unit resolution. 197
For phosphoric acid, an ion-molecule reaction with ACN m/z 140 ([M + H + ACN]+) was 198
observed and selected as the precursor ion. The MRM settings associated with the MS2 of m/z 199
(140.1 81.0) reaction ([M + H + ACN - ACN - H20 ]+) were a 82.0 ms dwell time, -25.0 V 200
Q1 pre bias,-29.0 V collision energy, and -30.0 V Q3 pre bias. The MRM settings for the (140.1 201
63.0) reaction ([M + H + ACN - ACN - 2H20 ]+) were a 82.0 ms dwell time, -14.0 V Q1 pre 202
bias,-44.0 V collision energy, and -24.0 V Q3 pre bias. For phosphonic acid, an ion-molecule 203
reaction with ACN, m/z 124 ([M + H + ACN]+) was selected as the precursor ion. The MRM 204
settings associated with the MS2 of m/z (124.0 64.9) reaction ([M + H + ACN - ACN - H20 205
]+) were a 125.0 ms dwell time, -12.0 V Q1 pre bias,-24.0 V collision energy, and -24.0 V Q3 206
pre bias; for the (124.0 46.7) reaction ([M + H + ACN - ACN - 2H20 ]+) the MRM settings 207
were a 125.0 ms dwell time, -24.0 V Q1 pre bias,-41.0 V collision energy, and -15.0 V Q3 pre 208
bias. 209
210
Liquid chromatography tandem mass spectrometry-System C 211
A Waters LC-MS/MS Xevo TQ-S system, MasslynxTM
Data acquisition software, and Target 212
lynx TM
data processing software, and a a 2 x 50mm Dionex IonPac AG11-HC column at 40 C, 213
and a Waters TQ-S mass spectrometer were used at the NofaLab laboratory. A column flow of 214
10
0.3 mLmin-1
30mM ammonium acetate in 0.01% (v/v) aqueous formic acid was held isocratic for 215
15 min. Flow parameters for nitrogen source/nebulizer, desolvation, and cone gas were, 216
respectively, 7 Bar, 650 Lh-1
, and 150 Lh-1
at 350 C. 217
218
Multiple reaction monitoring (MRM) of positive (+) ions was used for quantification and 219
qualification based on parameter optimization of authentic standards. The cone voltage was 40 220
(V) for phosphonic acid and phosphoric acid. For phosphonic acid, m/z 83 ([M + H]+) was 221
observed and selected as the precursor ion. The collision energies associated with the MS2 of 222
m/z (83 65.2) and the (83 47.2) reactions were 28 and 44 (V), respectively. Ions with m/z 223
65.2 ([M + H - H20]+) as well as 47.2 ([M + H - 2H20]+) were quantified with ± 0.1 m/z 224
resolution. For phosphoric acid, m/z 99.0 ([M+H]+) was selected as the precursor ion. Collision 225
energies associated with the MS2 of m/z (99.0 81.1) and the (99.0 63.1) reactions were 20 226
and 36 (V), respectively. Again, product ions of m/z 81.1 ([M + H - H20]+) as well as 63.1 ([M + 227
H - 2H20]+) were quantified with ± 0.1 m/z resolution. 228
229
Results and Discussion 230
231
Methodological comparison of residue quantification 232
Five tree nut samples, each from a different source, were prepared for the analysis of phosphonic 233
acid residues using either the methanolic extraction described above, or by the procedure cited in 234
QuPPe-Method Version 7.1 and 8.0. Thereafter, the extracts were analyzed using LC-(+)ESI 235
MS/MS Systems A, B, and C. Results were comparatively evaluated relative to samples 236
analyzed per QuPPe-Method M1.3 on LC-MS/MS System A operated with the negative ion (-) 237
MS2 mass transition cited in Version7.1 (m/z 8163), or alternatively, extracted with the novel 238
11
method described above and then analyzed with LC-MS/MS System B operated with the 239
negative ion (-) MS2 mass transition cited in Version 8.0 (m/z 8179). 240
241
Figure 2A shows results for each “blinded sample” (#2, 4, 9, 12, & 15) across the various 242
analytical approaches with residue levels reported as average (±) propagated standard error (n = 243
3)(vida supra) of the triplicate SAM analyses. A single factor-analysis of variance (ANOVA) 244
was applied to test the null hypothesis that the overall mean residue level of phosphonic acid 245
measured across methods for each sample/source differed from that of respective analytical 246
approaches at the 95% confidence interval (CI) (JMP, Version 10. SAS Institute Inc., Cary, NC, 247
1989-2011). None of the respective ANOVAs were significant (#2, F4,70 = 0.82, 0.52; #4, F4,70 = 248
0.28, 0.89; #9, F4,70 = 0.48, 0.77; #12, F4,70 = 0.48, 0.75; #15, F4,70 = 0.49, 0.74 ), results 249
suggestive of an agreement across all analytical methods. Yet, the “within –laboratory” 250
repeatability precision (RSDr) (AOAC, 2002), calculated as the fractional percentage of the 251
propagated standard error over the mean residue value, exceeded 36% for every triplicate 252
analyses; a result that is indicative of unacceptable reliability for all methods (Thompson and 253
Lowthian, 1997). 254
255
When residue levels were reported (±) the “standard error” from the 15-point composite response 256
(Figure 2B), however, the repeatability precision improved in all cases. RSDr’s associated with 257
the positive ion (+) MS2 mass transitions of LC-ESI MS/MS Systems A & B ranged from 20 to 258
25% for the methods employing the novel extraction described above and 31 to 58% for the 259
extraction of QuPPe-Method Version 7.1 and 8.0, a result indicating increased precision of the 260
former. A single factor- ANOVA was applied to test the null hypothesis that the overall mean 261
12
residue level of phosphonic acid measured across methods for each sample/source differed from 262
that of respective analytical approaches at the 95% CI. All ANOVAs were significant (#2, F4,70 = 263
39.5, <0.0005; #4, F4,70 = 15.9, <0.0005; #9, F4,70 = 27.5, <0.0005; #12, F4,70 =28.1, <0.0005; 264
#15, F4,70 = 28.5, <0.0005 ), results that support the existence of method-specific impacts on the 265
quantification of phosphonic acid residues in tree nuts. Tukey-Kramer HSD multiple means 266
comparison ( = 0.05) (SAS Institute, 2011) indicated, respective to each sample, no 267
statistically significant difference was observed across methods when quantification was with 268
positive ion (+) MS2 mass transitions as proposed above, with the exception of two samples (#2 269
& #12) extracted with QuPPe-Method Version (7.1 and) 8.0 that yielded statistically lower 270
residues. These results also provide evidence that chromatography, or at least the stationary 271
phases and eluents selected for this study, was unimportant due to the spectrometric resolution 272
afforded by LC-(+)ESI MS/MS (vide infra). With the exception of a single sample (#4) extracted 273
per QuPPe-Method Version (7.1 and) 8.0 (RSDr = 38%), significantly higher residue levels were 274
quantified for a respective sample when negative ion (-) MS2 mass transitions cited in QuPPe-275
Method Version 7.1 and 8.0 were used (relative to positive ion (+) MS2 mass transitions). It is 276
critical to note that chromatographic resolution between phosphoric acid and phosphonic acid 277
was not consistently reproducible with hypercarb stationary phase of M 1.3 and M1.4, so a 278
contribution of phosphoric acid to relative increase in phosphonic acid levels associated with the 279
negative ion (-) MS2 mass transitions cited in QuPPe-Method Version 7.1 was likely (vide infra). 280
281
A “between –laboratory” reproducibility precision (RSDR), calculated as the pooled RSDr’s from 282
all analyses using the novel extraction described above with the positive ion (+) MS2 mass 283
transitions of LC-ESI MS/MS Systems A & B, RSDR, was estimated to be 33.4% (inclusive of 284
13
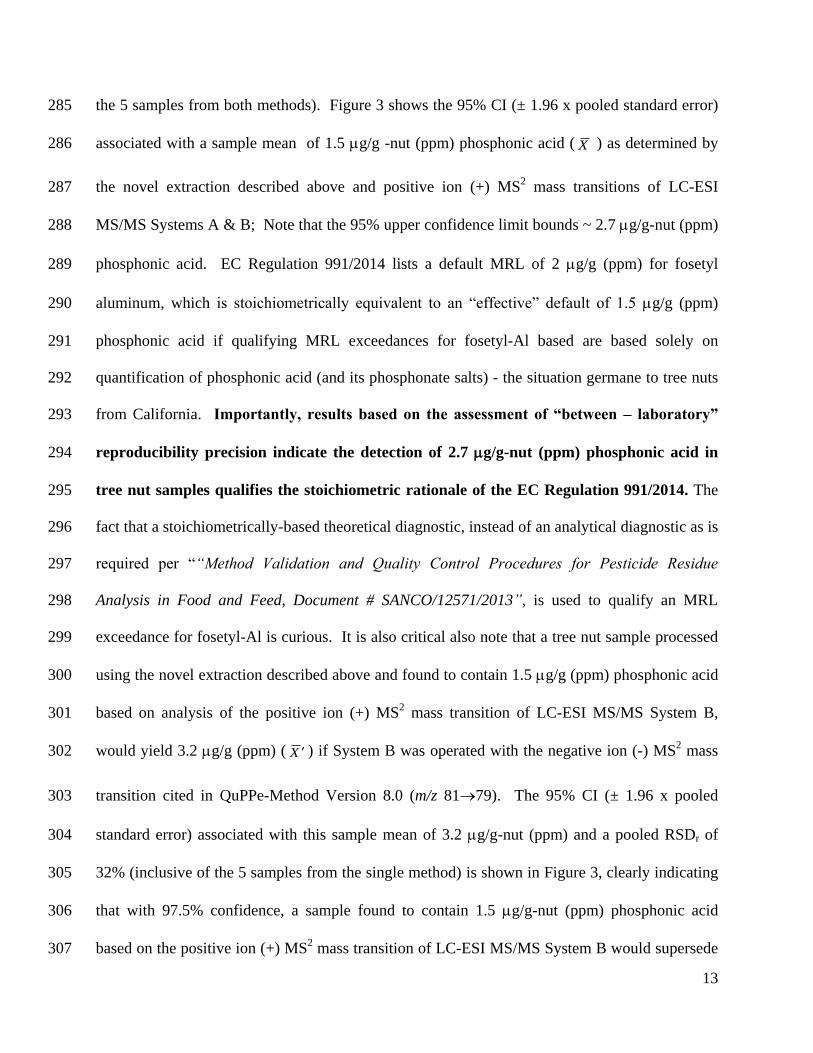
the 5 samples from both methods). Figure 3 shows the 95% CI (± 1.96 x pooled standard error) 285
associated with a sample mean of 1.5 g/g -nut (ppm) phosphonic acid ( X ) as determined by 286
the novel extraction described above and positive ion (+) MS2 mass transitions of LC-ESI 287
MS/MS Systems A & B; Note that the 95% upper confidence limit bounds ~ 2.7 g/g-nut (ppm) 288
phosphonic acid. EC Regulation 991/2014 lists a default MRL of 2 g/g (ppm) for fosetyl 289
aluminum, which is stoichiometrically equivalent to an “effective” default of 1.5 g/g (ppm) 290
phosphonic acid if qualifying MRL exceedances for fosetyl-Al based are based solely on 291
quantification of phosphonic acid (and its phosphonate salts) - the situation germane to tree nuts 292
from California. Importantly, results based on the assessment of “between – laboratory” 293
reproducibility precision indicate the detection of 2.7 g/g-nut (ppm) phosphonic acid in 294
tree nut samples qualifies the stoichiometric rationale of the EC Regulation 991/2014. The 295
fact that a stoichiometrically-based theoretical diagnostic, instead of an analytical diagnostic as is 296
required per ““Method Validation and Quality Control Procedures for Pesticide Residue 297
Analysis in Food and Feed, Document # SANCO/12571/2013”, is used to qualify an MRL 298
exceedance for fosetyl-Al is curious. It is also critical also note that a tree nut sample processed 299
using the novel extraction described above and found to contain 1.5 g/g (ppm) phosphonic acid 300
based on analysis of the positive ion (+) MS2 mass transition of LC-ESI MS/MS System B, 301
would yield 3.2 g/g (ppm) ( X ) if System B was operated with the negative ion (-) MS2 mass 302
transition cited in QuPPe-Method Version 8.0 (m/z 8179). The 95% CI (± 1.96 x pooled 303
standard error) associated with this sample mean of 3.2 g/g-nut (ppm) and a pooled RSDr of 304
32% (inclusive of the 5 samples from the single method) is shown in Figure 3, clearly indicating 305
that with 97.5% confidence, a sample found to contain 1.5 g/g-nut (ppm) phosphonic acid 306
based on the positive ion (+) MS2 mass transition of LC-ESI MS/MS System B would supersede 307
14
the “stoichiometric threshold” if analyzed instead with the negative ion (-) MS2 mass transition 308
cited in QuPPe-Method Version 8.0 (m/z 8179). 309
310
LC-(+)ESI MS/MS of System C yielded phosphonic acid residue levels of 2.4, 3.2, 1.7, 5.9, and 311
3.0, respectively, for “blinded samples” 2, 4, 9, 12, and 15. Results from these confirmatory 312
analyses with System C agree with those obtained using the positive ion (+) MS2 mass 313
transitions of LC-ESI MS/MS Systems A and B. More details of the analyses with System C are 314
available upon request. 315
316
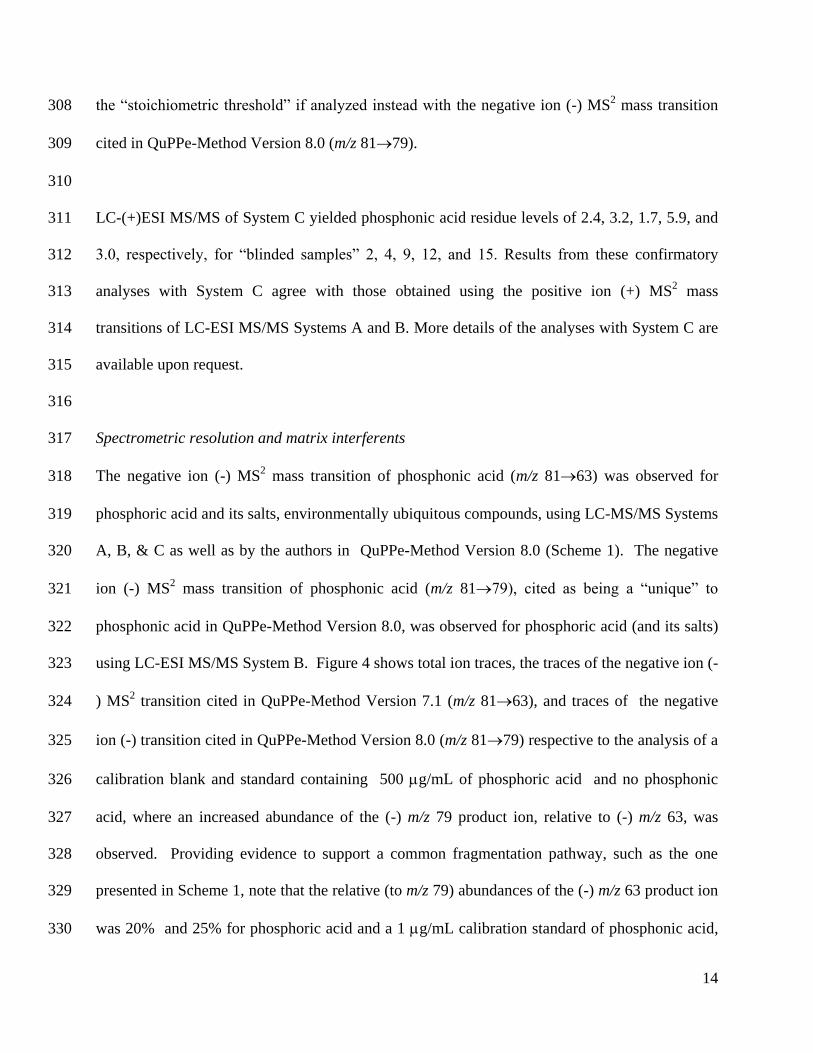
Spectrometric resolution and matrix interferents 317
The negative ion (-) MS2 mass transition of phosphonic acid (m/z 8163) was observed for 318
phosphoric acid and its salts, environmentally ubiquitous compounds, using LC-MS/MS Systems 319
A, B, & C as well as by the authors in QuPPe-Method Version 8.0 (Scheme 1). The negative 320
ion (-) MS2 mass transition of phosphonic acid (m/z 8179), cited as being a “unique” to 321
phosphonic acid in QuPPe-Method Version 8.0, was observed for phosphoric acid (and its salts) 322
using LC-ESI MS/MS System B. Figure 4 shows total ion traces, the traces of the negative ion (-323
) MS2 transition cited in QuPPe-Method Version 7.1 (m/z 8163), and traces of the negative 324
ion (-) transition cited in QuPPe-Method Version 8.0 (m/z 8179) respective to the analysis of a 325
calibration blank and standard containing 500 g/mL of phosphoric acid and no phosphonic 326
acid, where an increased abundance of the (-) m/z 79 product ion, relative to (-) m/z 63, was 327
observed. Providing evidence to support a common fragmentation pathway, such as the one 328
presented in Scheme 1, note that the relative (to m/z 79) abundances of the (-) m/z 63 product ion 329
was 20% and 25% for phosphoric acid and a 1 g/mL calibration standard of phosphonic acid, 330
15
respectively, indicating that the isotopic signature of the product ions was not discriminate when 331
using System B. 332
333
Phosphoric acid, its salts, and its esters are key components of many natural and anthropogenic 334
systems, including but not limited to, orchards for tree nut production. Analyses of tree nuts, 335
regardless of extraction procedure, using the postive ion (+) MS2 transitions cited above or the 336
negative ion (-) MS2 transition cited in QuPPe-Method Version 7.1 (m/z 9763), indicate 337
phosphoric acid and/or its salts at levels ranging from 20 to 650 g/g-nut (ppm). Interestingly, 338
the phytohormone, ethephon, is an ester of phosphonic acid included within the suite of 339
agrochemicals cited in QuPPe-Method Version 7.1 and 8.0 (Scheme 2). Ethephon is known to 340
hydrolyze into phosphoric acid, with Lantz and Casida (2013) directly probing the kinetics via 341
31P Nuclear Magnetic Resonance (NMR) spectroscopy to further support classical mechanistic 342
investigations of orangophosphate insecticide degradation. Kinetic studies of ethephon 343
hydrolysis using the positive ion (+) MS2 mass transition of LC-ESI MS/MS System B, as 344
related to documenting its stability in calibration standards, confirmed phosphoric acid as the 345
principle hydrolyzate, with no detection of phosphonic acid. Ethephon is cited as a spectrometric 346
interferent to phosphonic acid in QuPPe-Method Version 8.0, however, which raises further 347
concerns about the potential for the method to discriminate phosphonic acid in the presence of 348
phosphoric acid, its salts, and its esters. 349
350
Its many origins and potential abundance in tree nuts, decrease the potential for using 351
chromatographic resolution to overcome the negative ion (-) MS2
spectrometric interferences that 352
phosphoric acid, its salts, and it esters can impart on the quantification of phosphonic acid. The 353
16
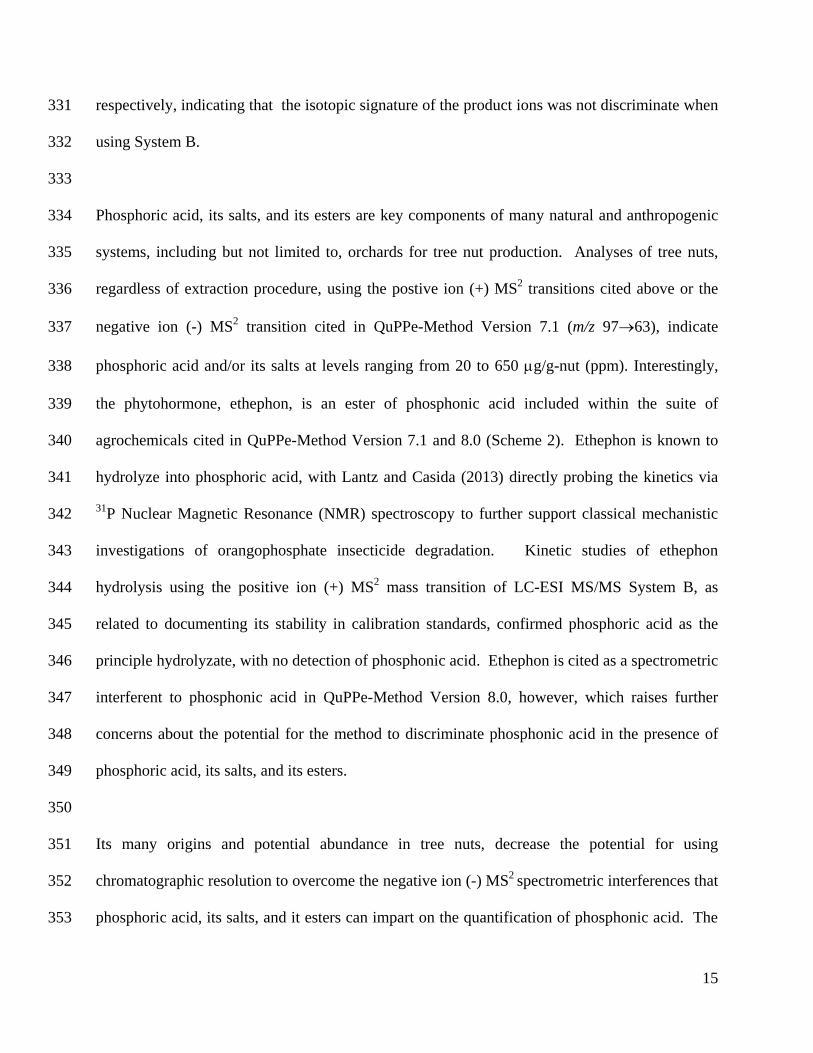
diol stationary phase of LC-ESIMS/MS System B was selected, not for its ability to 354
chromatographically separate phosphonic acid from phosphoric acid, which co-elute at 7 to 8 355
min (Rt, 7.7 0.5min, x SE), but rather for its ability to chromatographically eliminate polar 356
matrix interferents (vide infra), particularly spectrometric interferents of the negative ion (-) 357
transition cited in QuPPe-Method Version 8.0 (m/z 8179). Following the extraction of sample 358
#4 with the novel method described above, Figure 5 shows LC-(-)ESI MS/MS analysis with 359
System B and the total ion trace, the trace of the negative ion (-) MS2 transition cited in QuPPe-360
Method Version 7.1 (m/z 8163), and the trace of the negative ion (-) transition cited in QuPPe-361
Method Version 8.0 (m/z 8179). It is critical to note a clear spectrometric response of co-362
eluting phosphonic acid and phosphoric acid to both (m/z 8163) and (m/z 8179) as well as a 363
clear spectrometric response to only (m/z 8179) at a retention time preceding the elution of 364
phosphonic acid and phosphoric acid by ~0.5 min. These results indicate a marked potential for 365
spectrometric interference, although, the structure responsible for the interferents is unknown, its 366
origin and abundance in tree nut samples has not been tracked, and its chromatographic 367
interference with phosphonic acid across QuPPe methods (M 1.1, M 1.2, and M 1.3) can only be 368
speculated. Nevertheless, when considering the use of the negative ion (-) MS2 transition cited in 369
QuPPe-Method Version 8.0 (m/z 8179), such spectrometric evidence, and the uncertainties 370
associated with it, supports using SAM rather than a matrix-matched approach, for the 371
quantification of phosphonic acid residue levels in tree nuts. 372
373
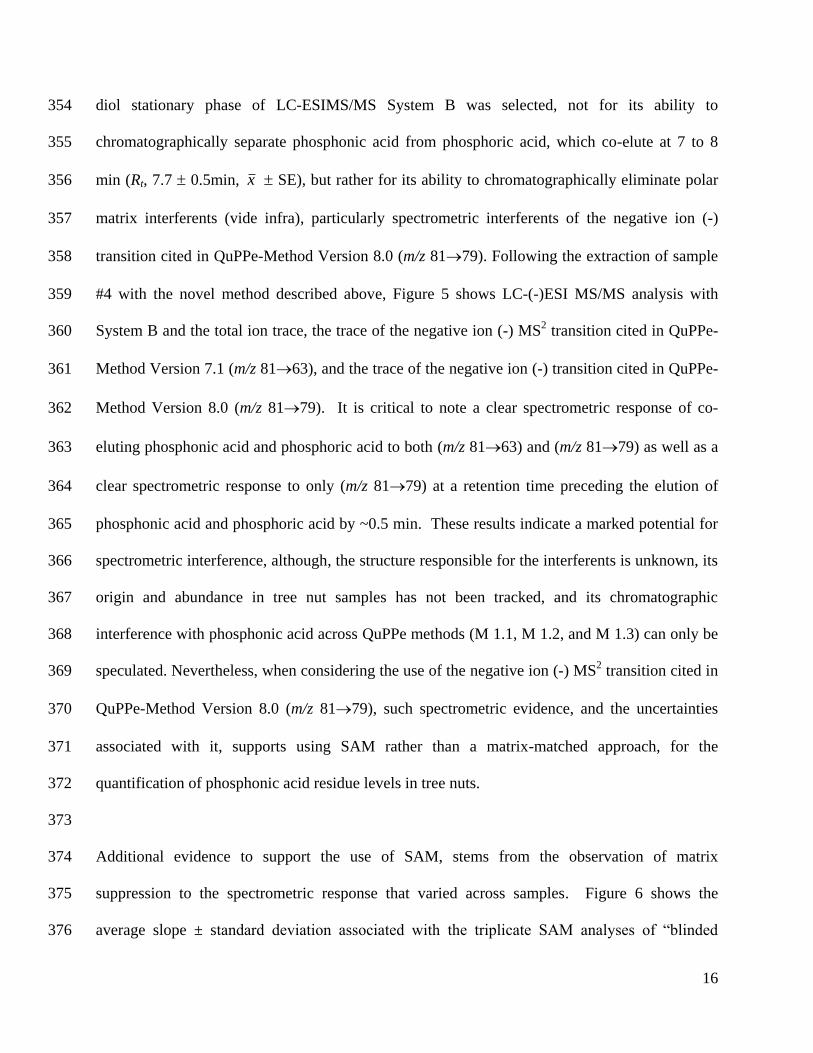
Additional evidence to support the use of SAM, stems from the observation of matrix 374
suppression to the spectrometric response that varied across samples. Figure 6 shows the 375
average slope ± standard deviation associated with the triplicate SAM analyses of “blinded 376
17
samples” #2, 4, and 9 relative to that for the calibration standards. The least amount of matrix 377
suppression, < 28% of the response to instrument calibration, was observed when samples were 378
extracted using the novel method described above and analyzed using LC-(+)ESIMS/MS System 379
B with the positive ion (+) MS2 transition for phosphonic acid (m/z 12464.9). By comparison, 380
when the positive ion (+) MS2 transition for phosphonic acid (m/z 12464.9) was monitored 381
using System B following extraction using QuPPe-Method Version (7.1 and) 8.0, matrix 382
interferents that suppress the spectrometric signal were apparently not removed, as only 52 to 383
68% of the response to instrument calibration was observed. However, note that when the 384
negative ion (-) MS2 transition cited in QuPPe-Method Version 8.0 (m/z 8179) was monitored, 385
> 58% suppression relative to the calibration response was observed, regardless of the extraction 386
procedure. Since extrapolation is implicitly more uncertain than interpolation, a matrix-matched 387
method using external calibration could potentially decrease the uncertainty associated with the 388
quantification of phosphonic acid, relative to SAM; however, results provide evidence to support 389
the conclusion that a “standard matrix blank” is not available for tree nuts, as matrix interferrents 390
are evident that vary as a function of sample type. 391
392
Conclusion 393
Results provide evidence that the negative ion (-) MS2 transition cited in QuPPe-Method Version 394
8.0 (m/z 8179) for the quantification of phosphonic acid is subject to spectrometric 395
interference from phosphoric acid, its salts, and its esters on certain ESI systems. The many 396
potential origins of phosphonic acid, its salts, and its esters as well as phosphoric acid its salts, 397
and its esters, decrease the potential for using chromatographic resolution to overcome the ESI 398
negative ion (-) MS2
spectrometric interferences, particularly given the complexity of tree nut 399
18
samples. An analytical technique was developed to unequivocally differentiate and quantify 400
phosphonic acid and its salts as well as phosphoric acid and its salts, as related to qualifying the 401
MRL exceedance for fosetyl-aluminum in tree nuts based on the detection of phosphonic acid. 402
The method involves extraction with methanolic solvent followed by LC-(+)ESIMS/MS, which 403
spectrometrically discriminates phosphonic acid (and its phosphonate salts) from phosphoric acid 404
(and its salts). A “between –laboratory” reproducibility precision (RSDR), calculated as the 405
pooled RSDr’s from all SAM analyses, was estimated to be 33.4%. Importantly, the 95% CI 406
bounding a sample mean of 1.5 g/g-nut (ppm) phosphonic acid, the “stoichiometric threshold of 407
EC Regulation 991/2014” for qualifying a fosetyl aluminum MRL exceedance based solely on 408
the detection of phosphonic acid, was 2.7 g/g-nut (ppm) phosphonic acid. Please understand 409
that work continues toward the optimization of the methodology to quantify levels of phosphonic 410
acid, its salts, and its esters in the tree nuts and the orchard as a function of agricultural, 411
geographical, and environmental influences. 412
413
Notes 414
Mention of trade names or commercial products in this publication is solely for the purpose of 415
providing specific information and does not imply recommendation or endorsement by the U.S. 416
Department of Agriculture. USDA is an equal opportunity provider and employer. 417
418
Acknowledgments 419
This research was funded by the Dried Fruit and Nut Association of California, the USDA-420
Agricultural Research Service, as well as the USDA-Foreign Agricultural Service Technical 421
Assistance for Specialty Crops grant #2014-26. 422

19
423
References 424
AOAC (2002)‘Guidelines for Single Laboratory Validation of Chemical Mehtods for Dietary 425
Suplements and Botanicals” 426
http://www.aoac.org/imis15_prod/AOAC_Docs/StandardsDevelopment/SLV_Guidelines_Dietar427
y_Supplements.pdf 428
429
Bagur, G.; Sanchez-Vinas, M.; Gazquez, D.; Ortega, M.; Romero, R. Estimation of the 430
uncertainty associated with the standard addition methodology when a matricx effect is detected. 431
Talanta. 2005, 66, 1168-1174. 432
433
Bruce, G. R.; Gill, P.S. Estimates of Precision in a Standard Additions Analysis. J. Chem. Educ. 434
1999, 76, 805-807. 435
436
EURL-SRM “Quick Method for the Analysis of Residues of numerous Highly Polar Pesticides in 437
Foods of Plant Origin involving Simultaneous Extraction with Methanol and LC-MS/MS 438
Determination (QuPPe-Method)” EU Reference Laboratory for pesticides requiring Single 439
Residue Methods (EURL-SRM) CVUA Stuttgart, Schaflandstr. 3/2, DE-70736 Fellbach, 440
Germany Website: www.eurl-pesticides.eu, E-Mail: [email protected] 441
442
European Commission: Health & Consumer protection Directorate-general “Method Validation 443
and Quality Control Procedures for Pesticide Residue Analysis in Food and Feed, Document # 444
SANCO/12571/2013”, 445
http://ec.europa.eu/food/plant/pesticides/guidance_documents/docs/qualcontrol_en.pdf 446
447
Lantz, S.R; Casida, J.E. Characterization of the Transient Oxaphosphetane BchE Inhibitor 448
Formed from Spontaneously Activated Ethephon. Chem. Res. Toxicol. 2013, 26, 1320-1322. 449
450
Skoog, D., & Leary, J. (1992) Principles of Instrumental Analysis, John Wiley & Sons New 451
York, NY 452
453
Thompson and Lowthian (1997) J. AOAC Int. (1997) 80, 676-679. 454
455
456
457
458
459
20
460
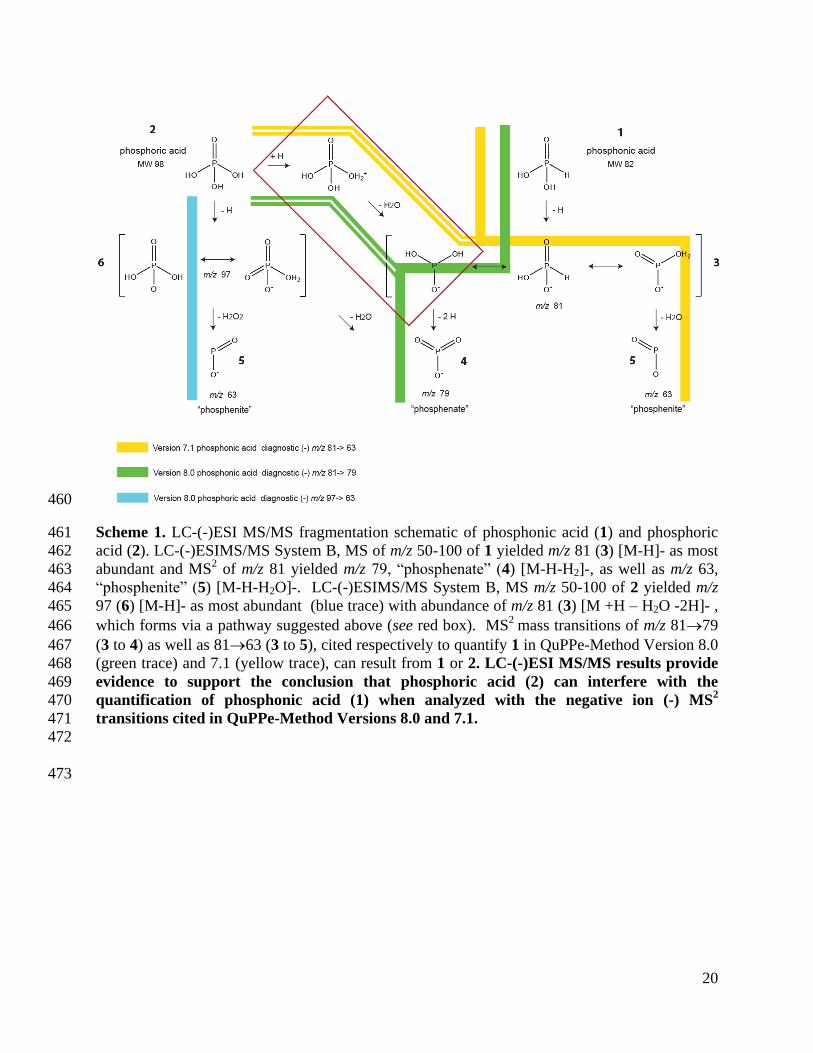
Scheme 1. LC-(-)ESI MS/MS fragmentation schematic of phosphonic acid (1) and phosphoric 461
acid (2). LC-(-)ESIMS/MS System B, MS of m/z 50-100 of 1 yielded m/z 81 (3) [M-H]- as most 462
abundant and MS2 of m/z 81 yielded m/z 79, “phosphenate” (4) [M-H-H2]-, as well as m/z 63, 463
“phosphenite” (5) [M-H-H2O]-. LC-(-)ESIMS/MS System B, MS m/z 50-100 of 2 yielded m/z 464
97 (6) [M-H]- as most abundant (blue trace) with abundance of m/z 81 (3) [M +H – H2O -2H]- , 465
which forms via a pathway suggested above (see red box). MS2
mass transitions of m/z 8179 466
(3 to 4) as well as 8163 (3 to 5), cited respectively to quantify 1 in QuPPe-Method Version 8.0 467
(green trace) and 7.1 (yellow trace), can result from 1 or 2. LC-(-)ESI MS/MS results provide 468
evidence to support the conclusion that phosphoric acid (2) can interfere with the 469
quantification of phosphonic acid (1) when analyzed with the negative ion (-) MS2
470
transitions cited in QuPPe-Method Versions 8.0 and 7.1. 471
472
473
21
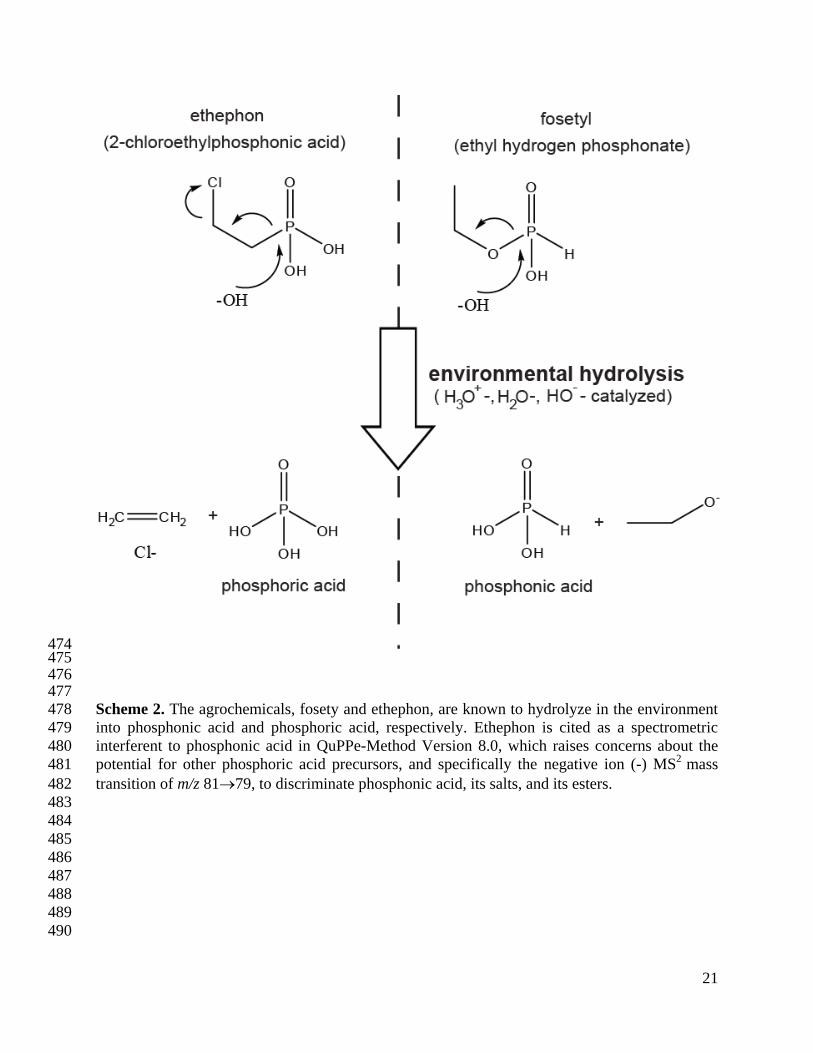
474 475 476 477 Scheme 2. The agrochemicals, fosety and ethephon, are known to hydrolyze in the environment 478
into phosphonic acid and phosphoric acid, respectively. Ethephon is cited as a spectrometric 479
interferent to phosphonic acid in QuPPe-Method Version 8.0, which raises concerns about the 480
potential for other phosphoric acid precursors, and specifically the negative ion (-) MS2
mass 481
transition of m/z 8179, to discriminate phosphonic acid, its salts, and its esters. 482
483
484
485
486
487
488
489
490
22
491
492
493 494
495
496
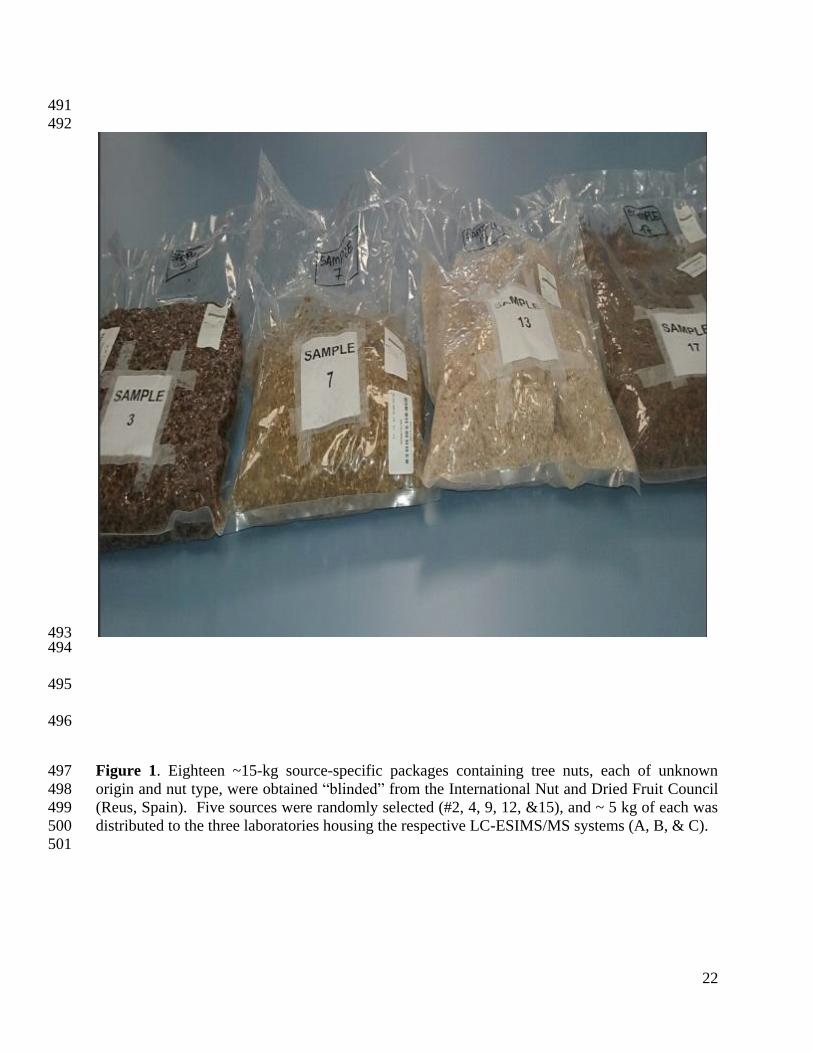
Figure 1. Eighteen ~15-kg source-specific packages containing tree nuts, each of unknown 497
origin and nut type, were obtained “blinded” from the International Nut and Dried Fruit Council 498
(Reus, Spain). Five sources were randomly selected (#2, 4, 9, 12, &15), and ~ 5 kg of each was 499
distributed to the three laboratories housing the respective LC-ESIMS/MS systems (A, B, & C). 500
501
23
502
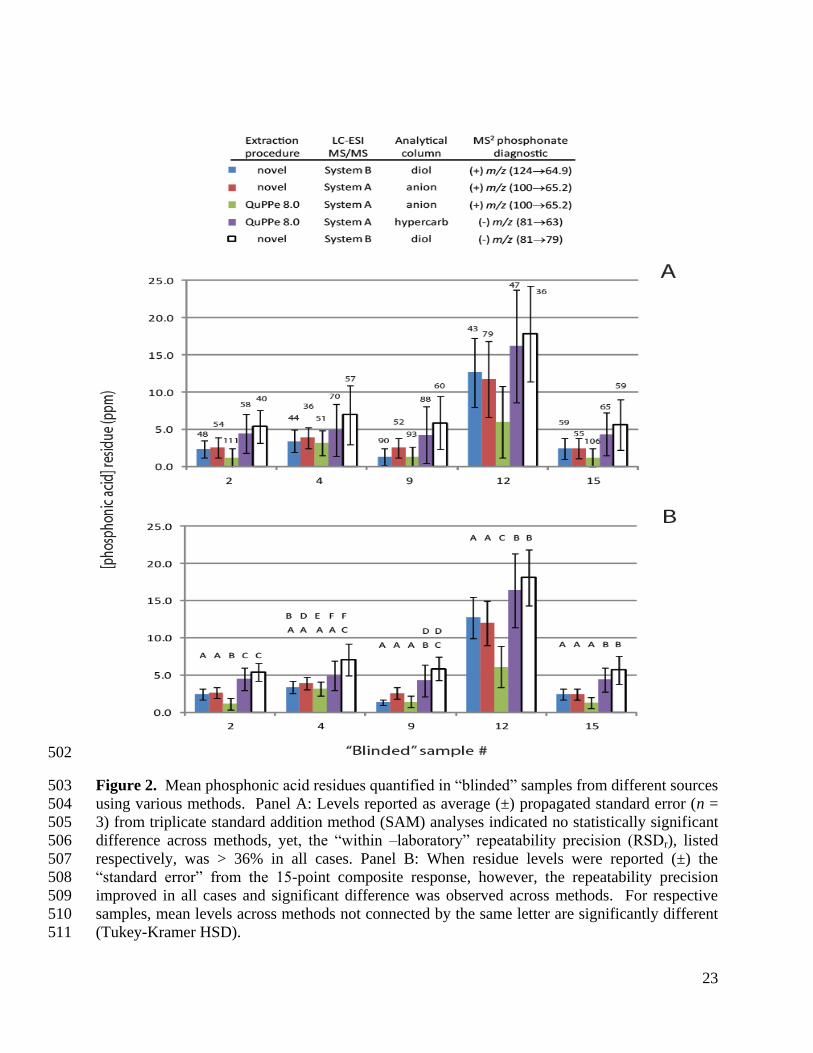
Figure 2. Mean phosphonic acid residues quantified in “blinded” samples from different sources 503
using various methods. Panel A: Levels reported as average (±) propagated standard error (n = 504
3) from triplicate standard addition method (SAM) analyses indicated no statistically significant 505
difference across methods, yet, the “within –laboratory” repeatability precision (RSDr), listed 506
respectively, was > 36% in all cases. Panel B: When residue levels were reported (±) the 507
“standard error” from the 15-point composite response, however, the repeatability precision 508
improved in all cases and significant difference was observed across methods. For respective 509
samples, mean levels across methods not connected by the same letter are significantly different 510
(Tukey-Kramer HSD). 511
24
512
513
514
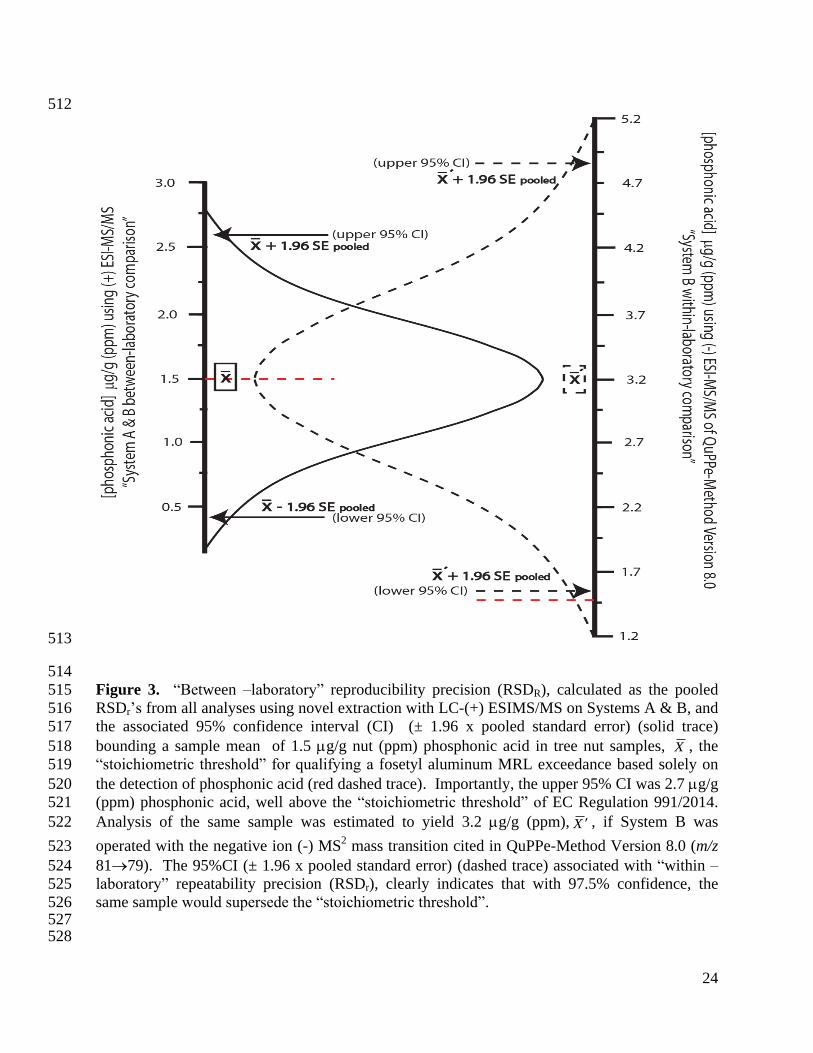
Figure 3. “Between –laboratory” reproducibility precision (RSDR), calculated as the pooled 515
RSDr’s from all analyses using novel extraction with LC-(+) ESIMS/MS on Systems A & B, and 516
the associated 95% confidence interval (CI) (± 1.96 x pooled standard error) (solid trace) 517
bounding a sample mean of 1.5 g/g nut (ppm) phosphonic acid in tree nut samples, X , the 518
“stoichiometric threshold” for qualifying a fosetyl aluminum MRL exceedance based solely on 519
the detection of phosphonic acid (red dashed trace). Importantly, the upper 95% CI was 2.7 g/g 520
(ppm) phosphonic acid, well above the “stoichiometric threshold” of EC Regulation 991/2014. 521
Analysis of the same sample was estimated to yield 3.2 g/g (ppm), X , if System B was 522
operated with the negative ion (-) MS2 mass transition cited in QuPPe-Method Version 8.0 (m/z 523
8179). The 95%CI (± 1.96 x pooled standard error) (dashed trace) associated with “within –524
laboratory” repeatability precision (RSDr), clearly indicates that with 97.5% confidence, the 525
same sample would supersede the “stoichiometric threshold”. 526 527 528
25
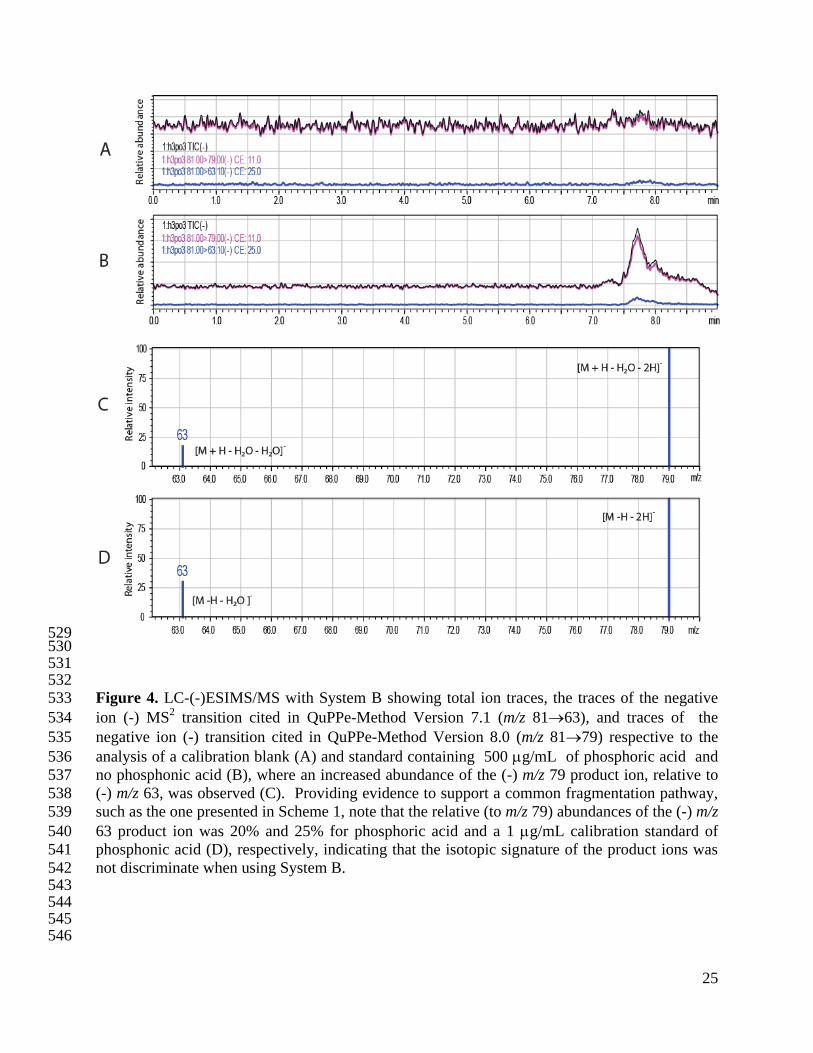
529 530 531 532 Figure 4. LC-(-)ESIMS/MS with System B showing total ion traces, the traces of the negative 533
ion (-) MS2 transition cited in QuPPe-Method Version 7.1 (m/z 8163), and traces of the 534
negative ion (-) transition cited in QuPPe-Method Version 8.0 (m/z 8179) respective to the 535
analysis of a calibration blank (A) and standard containing 500 g/mL of phosphoric acid and 536
no phosphonic acid (B), where an increased abundance of the (-) m/z 79 product ion, relative to 537
(-) m/z 63, was observed (C). Providing evidence to support a common fragmentation pathway, 538
such as the one presented in Scheme 1, note that the relative (to m/z 79) abundances of the (-) m/z 539
63 product ion was 20% and 25% for phosphoric acid and a 1 g/mL calibration standard of 540
phosphonic acid (D), respectively, indicating that the isotopic signature of the product ions was 541
not discriminate when using System B. 542 543 544 545 546
26
547 548 549 550
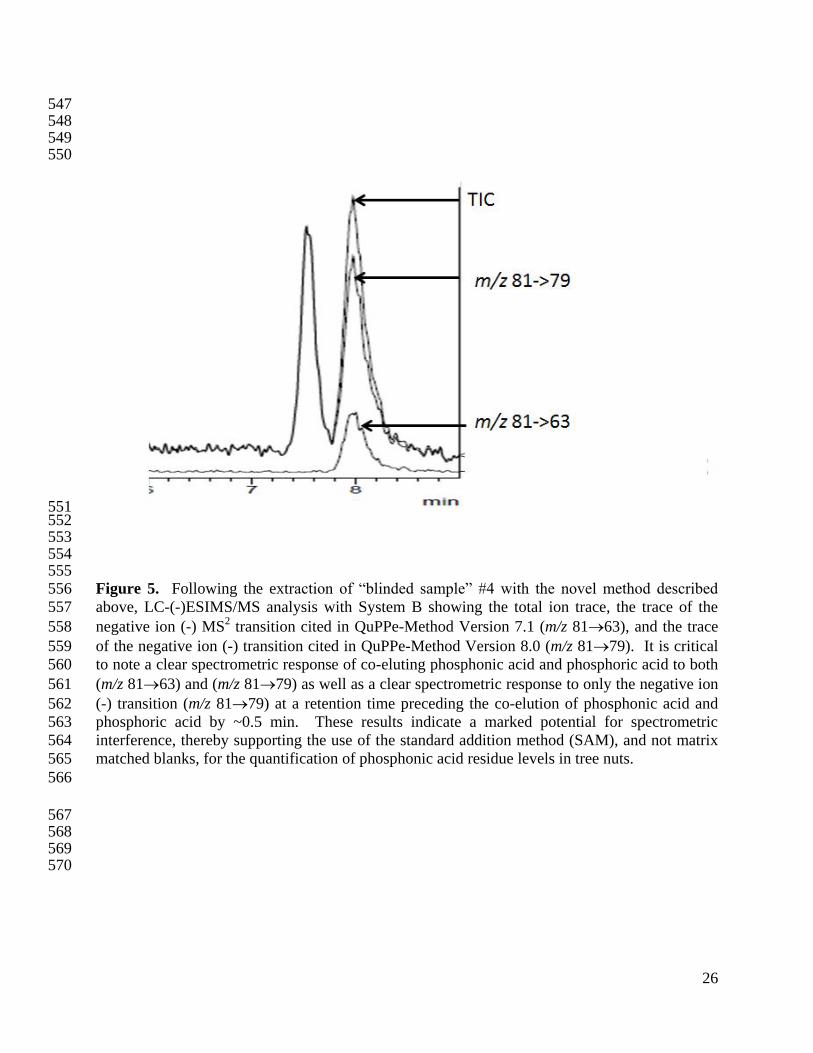
551 552 553 554 555 Figure 5. Following the extraction of “blinded sample” #4 with the novel method described 556
above, LC-(-)ESIMS/MS analysis with System B showing the total ion trace, the trace of the 557
negative ion (-) MS2 transition cited in QuPPe-Method Version 7.1 (m/z 8163), and the trace 558
of the negative ion (-) transition cited in QuPPe-Method Version 8.0 (m/z 8179). It is critical 559
to note a clear spectrometric response of co-eluting phosphonic acid and phosphoric acid to both 560
(m/z 8163) and (m/z 8179) as well as a clear spectrometric response to only the negative ion 561
(-) transition (m/z 8179) at a retention time preceding the co-elution of phosphonic acid and 562
phosphoric acid by ~0.5 min. These results indicate a marked potential for spectrometric 563
interference, thereby supporting the use of the standard addition method (SAM), and not matrix 564
matched blanks, for the quantification of phosphonic acid residue levels in tree nuts. 565
566
567 568 569 570
27
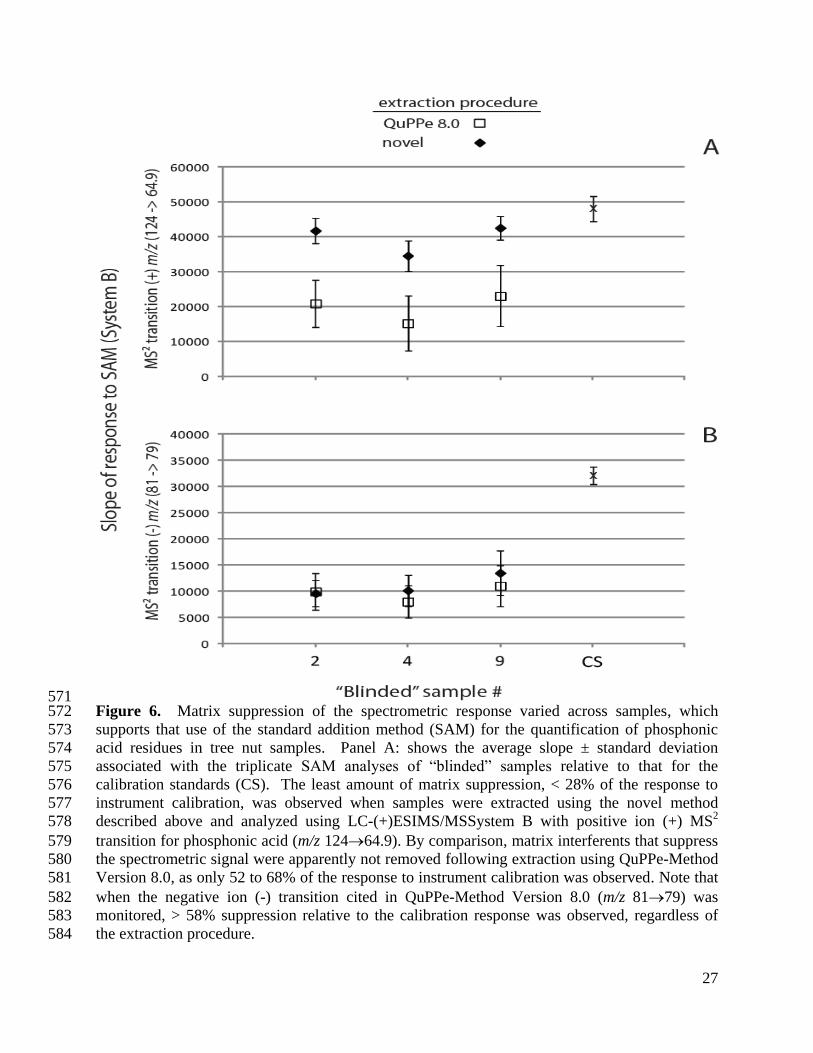
571 Figure 6. Matrix suppression of the spectrometric response varied across samples, which 572
supports that use of the standard addition method (SAM) for the quantification of phosphonic 573
acid residues in tree nut samples. Panel A: shows the average slope ± standard deviation 574
associated with the triplicate SAM analyses of “blinded” samples relative to that for the 575
calibration standards (CS). The least amount of matrix suppression, < 28% of the response to 576
instrument calibration, was observed when samples were extracted using the novel method 577
described above and analyzed using LC-(+)ESIMS/MSSystem B with positive ion (+) MS2 578
transition for phosphonic acid (m/z 12464.9). By comparison, matrix interferents that suppress 579
the spectrometric signal were apparently not removed following extraction using QuPPe-Method 580
Version 8.0, as only 52 to 68% of the response to instrument calibration was observed. Note that 581
when the negative ion (-) transition cited in QuPPe-Method Version 8.0 (m/z 8179) was 582
monitored, > 58% suppression relative to the calibration response was observed, regardless of 583
the extraction procedure. 584