Embed Size (px)
Citation preview
31 International Journal of Chromatographic Science 2013, 3(2): 31-34
Original Article
QUANTITATIVE DETERMINATION OF PARACETAMOL AND CAFFEINE
FROM FORMULATED TABLETS BY REVERSED PHASE-HPLC
SEPARATION TECHNIQUE
R. Chandra1, K. Dutt Sharma
Department of Pharmaceutical Chemistry, Dolphin P.G. Institute of Biomedical and Natural Sciences, Dehradun-248001,
Uttarakhand, INDIA
*Corresponding author. Email: [email protected]
Received 10 July 2013; accepted 20 August 2013
Abstract
This RP-HPLC method has been described for the determination binary formulated tablets of paracetamol and caffeine.
However, none have been cross validated using formulated products. The present study depicts an accurate, stable, rapid,
simple, precise and reducible reversed-phase high performance liquid chromatographic (RP-HPLC) separation method.
The present isocratic method was carried out on C18-column with mobile phase methanol and water in the ratio of 40:60 (by
volume) at the flow rate 1.0 mL/minute. The detection was carried out at λmax=243 nm. The retention time of paracetamol
and caffeine were 3.03 and 4.23 minutes, respectively. Under the optimal condition, the linearity were found for
paracetamol R2=0.999 and for caffeine R
2=0.994. The limit of detection and limit of quantification for paracetamol were
computed 0.04 and 0.12 µg/mL and for caffeine 0.05 and 0.15 µg/mL, respectively. The recoveries of paracetamol and
caffeine were in the range of 99.62-99.45 % and 104.48-100.56 %. The proposed method was successfully validated to
determine paracetamol and caffeine from its formulated tablets.
© 2013 Universal Research Publications. All rights reserved
Key words: Development, Paracetamol, Caffeine, RP-HPLC, Validation
1. INTRODUCTION Paracetamol is used as antipyretic, analgesic and anti-
inflammatory. Chemically, it is 4-Hydroxy Acetanilide.
This is available in combination form in different
formulations. The antipyretic, analgesic and anti-
inflammatory effect of paracetamol is due to inhibiting
prostaglandin synthesis cyclooxygenase-1(COX-1) and
cyclooxygenase-2 (COX-2) [1-3]. It is prevent to fever,
headaches, pain of arthritis, aches, colds, flu and period
pain. Paracetamol in combination form with caffeine used
in migraine attack, child birth and avoid postpartum
hemorrhage [4]. Caffeine is the most wanted drug of the
world [5]. The chemical name of caffeine is 1, 3, 7-
trimethylxanthine. Caffeine is used as a stimulant, due to
acts on the central nervous system [6]. Paracetamol in
formulated combination form with caffeine and other drugs
has been validated various methods with spectrophotometry
and high performance liquid chromatography [7-14]. The
main aim of this study was to develop a new RP-HPLC
method for determination of paracetamol and caffeine from
formulated tablets, in accordance with International
conference harmonized guidelines [15].
2. EXPERIMENTAL
2.1 Chemicals and Reagents
Paracetamol and caffeine reference standard (label claim
99.7%pure) was purchased from Ranbaxy Pharmaceutical
Ltd. Tablets of paracetamol and caffeine with 250 mg and
100 mg purchased from Lupin Pharmaceutical Ltd. HPLC
grade methanol and water were purchased from Merck
India Limited and 0.45µm nylon membrane filter was
supplied by Pall life Sciences, Mumbai.
2.2 Instrumentation
The instrument, a reversed phase-high performance liquid
chromatograph was used for method development. The
chromatograph consisting, a binary pump, column
thermostat and a UV-detector. The eluent was analyzed
using a C18 column at wavelength (λmax) 243 nm with
mobile phase methanol and water in the ratio of 40:60 (by
volume). Injection volume was used 20 µL. The mobile
phase was filtered through 0.45µm nylon filter membrane
followed by sonicate for five min prior to use.
2.3 Preparation of Stock Solution
Stock solution containing 250 µg/mL of paracetamol and
100 µg/mL of caffeine were prepared separately in mobile
phase. The stock solutions were filtered through a 0.45 µm
nylon membrane followed by sonicate for five minutes.
Serial dilutions were prepared by appropriate dilution of the
stock solutions with mobile phase.
2.4 Methods Validation
The methods were validated according to ICH guidelines
Available online at http://www.urpjournals.com
International Journal of Chromatographic Science
Universal Research Publications. All rights reserved
32 International Journal of Chromatographic Science 2013, 3(2): 31-34
with respect to linearity, specificity, precision, and system
suitability test, limit of detection (LOD) and limit of
quantification (LOQ) [15].
2.5 Linearity
For the measuring linearity were prepared serial dilutions
of 5, 10, 20, 25, 50 and 100 µg/mL from the stock solution
of paracetamol and caffeine. A total volume of 10 mL was
maintained with mobile phase methanol and water. These
different serial dilutions were filtered through a 0.45µm
nylon membrane and sonicate. The each solution of 20 µL
was injected into the column in thrice. The calibration
curves were obtained by plotting peak areas versus known
concentrations in µg/mL.
2.6 Specificity
Specificity was determined with exepient of formulated
tablets. An equivalent weight was taken and solution
prepared similarly to the sample solution. The prepared
solution was determined as per the described method. After
determination was not reported any interference with
exepient at the retention time of the peaks of paracetamol
and caffeine. Therefore, it is concluded that the method is
specific.
2.7 Accuracy
The accuracy of the method was determined by recovery
method. The recovery was checked at the five theoretical
concentrations levels 10, 20, 40, 50 and 100 µg. The
chromatograms were recorded and the percentage recovery
was calculated.
2.8 System Suitability test
The Reproducibility of sample was checked of the system
to measurement of peak area and was carried out using
three replicates of same concentration of standard and
sample, respectively.
2.9 Limit of Detection (LOD) and limit of
Quantification (LOQ)
It is a lowest response of the instrument at lowest
concentration, so the detectable signal value called as limit
of detection and quantifiable noise value called as limit of
quantification. It was measured by signal to noise ratio. To
determine the limit of detection (LOD) and limit of
quantification (LOQ), to prepare three replications [16-19]
of low concentrations serial dilutions of mixed standard of
paracetamol and caffeine from the standard stock solution.
3. Results and Discussion
3.1 Selection of mobile phase
It was a basic need of liquid chromatography. To select the
mobile phase various composition of mobile phases were
checked with water and methanol in different ratio 25:75,
35:65 and 45:55 (by volume) on C18
column at wave length
243 nm and methanol and water 20:80, 30:70 and 40:60 (by
volume) on C18
column at wave length 243 nm. The mobile
phase methanol and water in the ratio of 40:60 (by volume)
was selected. At this mobile phase was obtained suitable
retention time and peak area of both drugs with better
resolution.
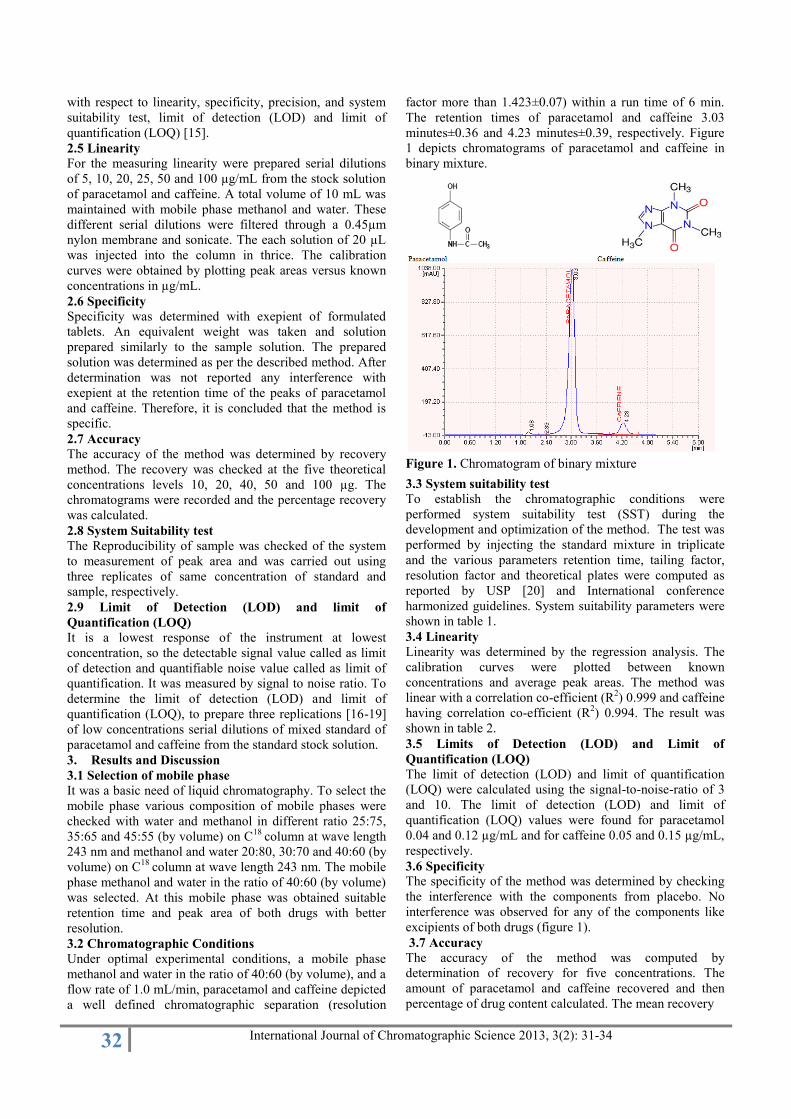
3.2 Chromatographic Conditions Under optimal experimental conditions, a mobile phase
methanol and water in the ratio of 40:60 (by volume), and a
flow rate of 1.0 mL/min, paracetamol and caffeine depicted
a well defined chromatographic separation (resolution
factor more than 1.423±0.07) within a run time of 6 min.
The retention times of paracetamol and caffeine 3.03
minutes±0.36 and 4.23 minutes±0.39, respectively. Figure
1 depicts chromatograms of paracetamol and caffeine in
binary mixture.
Figure 1. Chromatogram of binary mixture
3.3 System suitability test To establish the chromatographic conditions were
performed system suitability test (SST) during the
development and optimization of the method. The test was
performed by injecting the standard mixture in triplicate
and the various parameters retention time, tailing factor,
resolution factor and theoretical plates were computed as
reported by USP [20] and International conference
harmonized guidelines. System suitability parameters were
shown in table 1.
3.4 Linearity
Linearity was determined by the regression analysis. The
calibration curves were plotted between known
concentrations and average peak areas. The method was
linear with a correlation co-efficient (R2) 0.999 and caffeine
having correlation co-efficient (R2) 0.994. The result was
shown in table 2.
3.5 Limits of Detection (LOD) and Limit of
Quantification (LOQ)
The limit of detection (LOD) and limit of quantification
(LOQ) were calculated using the signal-to-noise-ratio of 3
and 10. The limit of detection (LOD) and limit of
quantification (LOQ) values were found for paracetamol
0.04 and 0.12 µg/mL and for caffeine 0.05 and 0.15 µg/mL,
respectively.
3.6 Specificity
The specificity of the method was determined by checking
the interference with the components from placebo. No
interference was observed for any of the components like
excipients of both drugs (figure 1).
3.7 Accuracy
The accuracy of the method was computed by
determination of recovery for five concentrations. The
amount of paracetamol and caffeine recovered and then
percentage of drug content calculated. The mean recovery
33 International Journal of Chromatographic Science 2013, 3(2): 31-34
Tab. 1. Statistical Summary of validation system suitability parameters.
Parameters Paracetamol Caffiene
Mean SE Mean SE
Retention time 3.03 minutes ± 0.36 4.23 minutes ± 0.39
Tailing factor 0.82 ± 0.06 0.81 ± 0.07
Resolution factor 1.42 ± 0.07 1.33 ± 0.06
Theoretical plates 475.34 ± 0.44 2012 ± 0.05
SE= Standard Error (±)
Tab. 2. Statistical summary of Linearity, limit of detection and limit of quantification.
Parameters Paracetamol Caffeine
Number of samples per curve 6 6
Correlation range (µg/mL) 10-100 10-100
Regression equation Y=4629x+34584 Y=860.4x-1056
Regression coefficient R2=0.999 R
2=0.994
Limit of detection (µg/mL) 0.04 0.05
Limit of quantification(µg/mL) 0.12 0.15
Tab. 3. Recovery experiment for paracetamol and caffeine
Paracetamol Caffeine
Added in µg Found Recovery % Added in µg Found Recovery %
10 9.96 99.62 10 10.44 104.48
20 19.14 95.72 20 20.93 104.68
40 39.9 99.96 40 38.21 95.53
50 51.4 102.89 50 49.83 99.67
100 99.45 99.45 100 100.56 100.56
Mean=99.53
SD=2.55
CV%=2.56
Mean=100.98
SD=3.79
CV%=3.75
SD=standard deviation
CV%=coefficient variation percentage
of paracetamol and caffeine were found 99.53 % and
100.98 % with less than 10 % coefficient variation (table 3)
[7]. Hence, the results were statistically significant. The
recovery results showed that the method was very accurate
for quantitative determination of paracetamol and caffeine
from formulated tablets.
4. Conclusion
The RP-HPLC validation method was developed with
isocratic mode. Selected experimental methods were
providing high resolution and repeatability of peaks. For
the repeatability of the peaks and retention time the
required temperature was 200C [21].This validated method
more reliable to simultaneous determination of paracetamol
and caffeine from its binary formulated tablets. There was
no interference from the excipients used in the tablet
formulations and hence the methods are suitable for
analysis of formulated tablets. The results of validation
show that the described HPLC reverse phase separation
methods are simple, linear, precise, accurate and selective.
Hence the above method can be recommended for
simultaneous determination of paracetamol and caffeine.
References
1. Kumble, RM; Singh, SG; Stability-indicating RP-
HPLC method for analysis of paracetamol and
tramadol in a pharmaceutical dosage form. E Journal
of Chemistry. 9(3): 1347-1356 (2012).
2. Satoskar, RS; Bhandarkar, SD; Ainapare, SS;
Pharmacology and pharmacotherapeutics. 16th ed.
Popular prakashan; Mumbai: 1999. p. 164.
3. The Indian pharmacopoeia. Published by the Indian
pharmacopoeia commission, Ghaziabad, Vol-III, pp.
1516 (2007).
4. www.healthcaremagic.com
5. Alvi, SN; Hammami, M M; Validated HPLC Method for Determination of Caffeine Level in Human Plasma using Synthetic Plasma: Application to Bioavailability Studies. Journal of
Chromatographic Science. 49 (4): 292-296 (2011). 6. Nehlig, A; Daval, JL; Debry, G; Caffeine and the
central nervous system: mechanisms of action,
biochemical, metabolic and psychostimulant effects.
Brain Research Reviews. 17(2): 139–70 (1992).
7. Suzen, S; Akay, C; Tartilmis, S; Erdol, RS; Onal, A;
Cevheroglu, S; Quantitation of acetaminophen in
pharmaceutical formulations using high-performance
liquid chromatography. J. Fac. Pharm. Ankara. 27(2):
93-100 (1998).
8. Mulla, T;, Rao, JR; Yadav, SS; Bharekar, VV; Rajput,
MP; Development and Validation of HPLC Method
For Simultaneous Quantitation of Paracetamol And
Dexketoprofen Trometamol in Bulk Drug and
Formulation. International Journal of Comprehensive
Pharmacy. 2(7): 1-4 (2011).
9. Altun, ML; HPLC method for the analysis of
paracetamol, caffeine and dipyrone. Turk J Chem. 33:
521-528 (2002).
10. Tsvetkova, B; Pencheva, I; Zlatkov, A; Peikov, P;
34 International Journal of Chromatographic Science 2013, 3(2): 31-34
Simultaneous high-performance liquid chromato-
-graphy determination of paracetamol and ascorbic
acid in tablet dosage forms.African Journal of
Pharmacy and Pharmacology. 6(17): 1332-1336
(2012).
11. Pattan, SR; Jamdar, SG; Godge, RK; Dighe, NS;
Dathankar, AV; Nirmal, SA; Pai, MG; RP-HPLC
Method for simultaneous estimation of Paracetamol
and Etoricoxib from Bulk and Tablets. Journal of
chemical and pharmaceutical research. 1(1): 329-335
(2009).
12. Ashraful, SM; Abuzar, SM; Paul, PK; Validation of
UV-Spectrophotometric and RP-HPLC methods for
the simultaneous analysis of Paracetamol and
Aceclofenac in marketed tablets. International journal
of pharmacy and Life Science. 2(12): 1267-1275
(2011).
13. El-Din, MS; Zeid, ME; Zeid, AM; Development and
Validation of RP-HPLC Method for simultaneous
Determination of Ascorbic acid and Salicylamide in
their binary mixtures: Application to combined tablets.
J Chromat Separation Techniques. 3(5): 1-7 (2012).
14. Dimal, AS; Neel, JP; Sunil, LB; Usman, KC; Kashyap,
KB; Stability Indicating LC-Method for Estimation of
Paracetamol and Lornoxicam in Combined Dosage
Form. J Sci Pharm. 79:113-122 (2011).
15. International conference on harmonization. Q1A (R-2)
stability testing of new drug substances and products
international conference on harmonization. IFPMA,
Geneva (2003).
16. Guide for Validation of Analytical and Bioanalytical
Methods. Resolution R.E.n. 899. Brazilian Sanitary
Surviellance Agency, Brasflia,DF; (2003).
17. Q2B Validation of Analytical Procedures:
Methodology. International Conference on
Harmonization. Washington, DC (1996).
18. US Pharmacopeia 27th
US pharmacopeial Convention.
Rockville, MD, pp: 2256, (2004).
19. Rolim, A; Maciel, CPM; Validation Assay for Total
Flavonoids, as Rutin Equivalents, from Trichilia
catigua Adr. Juss (Meliaceae) and Ptychopetalum
olacoides Bentham (Olacaceae) Commercial Extract. J
AOAC International. 88: 1015-1019 (2005).
20. The united States Pharmacopoeia 30th
and the National
formulary 25th
. Rockville, MD, USA (2007).
21. Upadhyay, HC; Verma, RK; Srivastava, SK;
Quantitative Determination of Bioactive 4-Hydroxy-a-
Tetralone, Tetralone-4-O-b-D-Glucopyranoside and
Ellagic Acid in Ammannia baccifera (Linn.) by
Reversed-Phase High-Performance Liquid
Chromatography. Journal of Chromatographic Science.
51:21–25 (2013).
Source of support: Nil; Conflict of interest: The authors declare no conflict of interest.