Embed Size (px)
Citation preview
Quantitative Easing & Tapering
Global Bond Yield Trends
Negative Interest Rates in Eurozone?
Global GDP & Inflationary Trend
Market Performance & Insights
Equity & Debt Market Overview
Snapshot of Recommended Funds
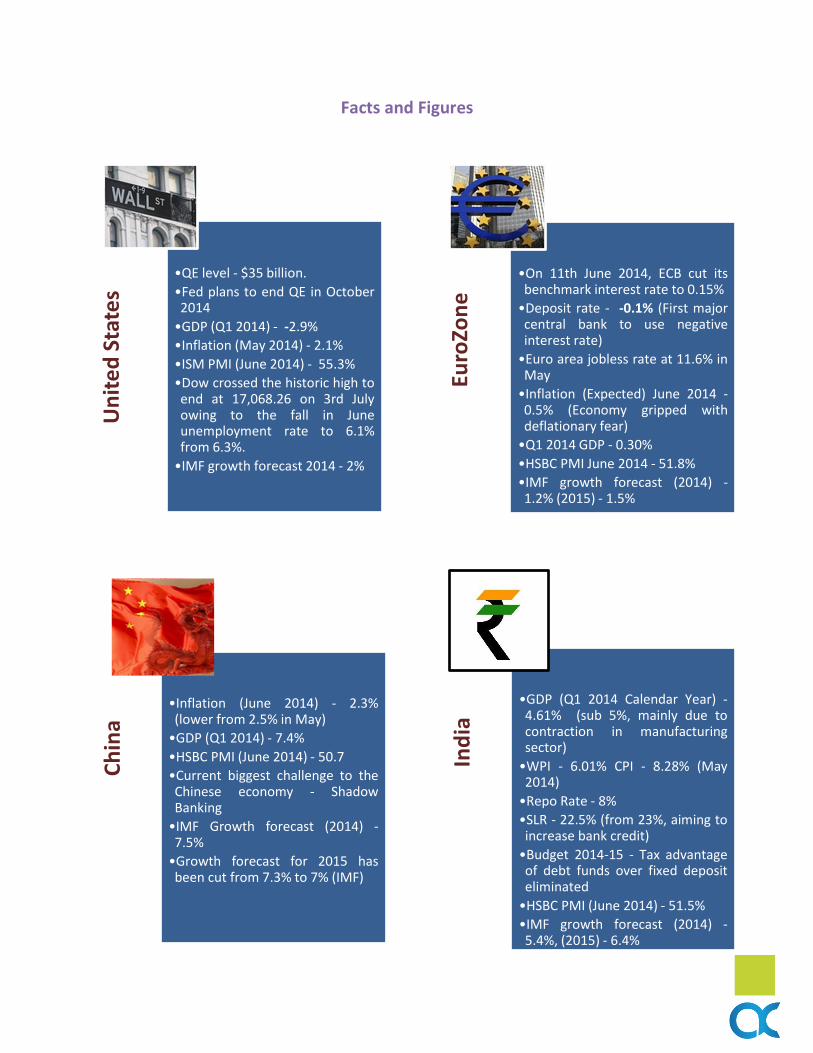
Facts and FiguresU
nit
ed
Sta
tes
•QE level - $35 billion.
•Fed plans to end QE in October 2014
•GDP (Q1 2014) - -2.9%
•Inflation (May 2014) - 2.1%
•ISM PMI (June 2014) - 55.3%
•Dow crossed the historic high to end at 17,068.26 on 3rd July owing to the fall in June unemployment rate to 6.1% from 6.3%.
•IMF growth forecast 2014 - 2% Eu
roZo
ne
•On 11th June 2014, ECB cut its benchmark interest rate to 0.15%
•Deposit rate - -0.1% (First major central bank to use negative interest rate)
•Euro area jobless rate at 11.6% in May
•Inflation (Expected) June 2014 - 0.5% (Economy gripped with deflationary fear)
•Q1 2014 GDP - 0.30%
•HSBC PMI June 2014 - 51.8%
•IMF growth forecast (2014) - 1.2% (2015) - 1.5%
Ch
ina
•Inflation (June 2014) - 2.3% (lower from 2.5% in May)
•GDP (Q1 2014) - 7.4%
•HSBC PMI (June 2014) - 50.7
•Current biggest challenge to the Chinese economy - Shadow Banking
•IMF Growth forecast (2014) - 7.5%
•Growth forecast for 2015 has been cut from 7.3% to 7% (IMF)
Ind
ia
•GDP (Q1 2014 Calendar Year) - 4.61% (sub 5%, mainly due to contraction in manufacturing sector)
•WPI - 6.01% CPI - 8.28% (May 2014)
•Repo Rate - 8%
•SLR - 22.5% (from 23%, aiming to increase bank credit)
•Budget 2014-15 - Tax advantage of debt funds over fixed deposit eliminated
•HSBC PMI (June 2014) - 51.5%
•IMF growth forecast (2014) - 5.4%, (2015) - 6.4%
Quantitative Easing
It was tried first by a central bank in Japan to get it
out of a period of deflation following its asset
bubble collapse in the 1990s.
Under QE a central bank purchases government
bonds from insurance companies, pension funds and
Banks. This in turn pushes up the bond prices and
lowers the interest rates. Hence they become less
attractive investment and discourages savings
leading to rise in spending by individuals and
businesses for consumption of goods and services.
Such low interest rate scenario forces individuals and
businesses to invest in equity or fixed income
security to earn higher interest rate on their savings.
This floods money into investment institutions. Hope
is, this would inherently increase investment in the
economy (since the interest rates are low!!) and
boost the economy.
Usually, central banks try to raise the amount of
lending activity in the economy indirectly, by cutting
interest rates. But when interest rates cannot go any
lower, a central bank's only option is to pump money
into the economy directly. The way central bank
does this is by buying government bonds. Pumping
liquidity into the economy by sustained buying of
treasury and mortgage-backed securities from banks
results in cash injection into banks and lowers
interest rates which in turn should lead to larger
lending and a boost to economic activity.
Tapering
The term “taper” was introduced to the global
economy on 22nd
May, 2013, by the then Fed
Chairman Ben Bernanke, who stated that Fed may
taper the $85 bn bond buying program (QE) in the
coming months. This announcement lead the market
participants of believe, interest rates are likely to
increase in the investment safe heaven. Fed started
the taper talk when the US 2013 Q2 GDP came in at
2.5% and unemployment rate decreased to 7.4% in
July 2013. This lead to heavy capital outflow and
currency depreciation in EM countries with large
external deficits, particularly, Indonesia and India. It
further led to worsening current account deficit, thin
reserves and high inflation rates.
MACROECONOMIC OUTLOOK – GLOBAL
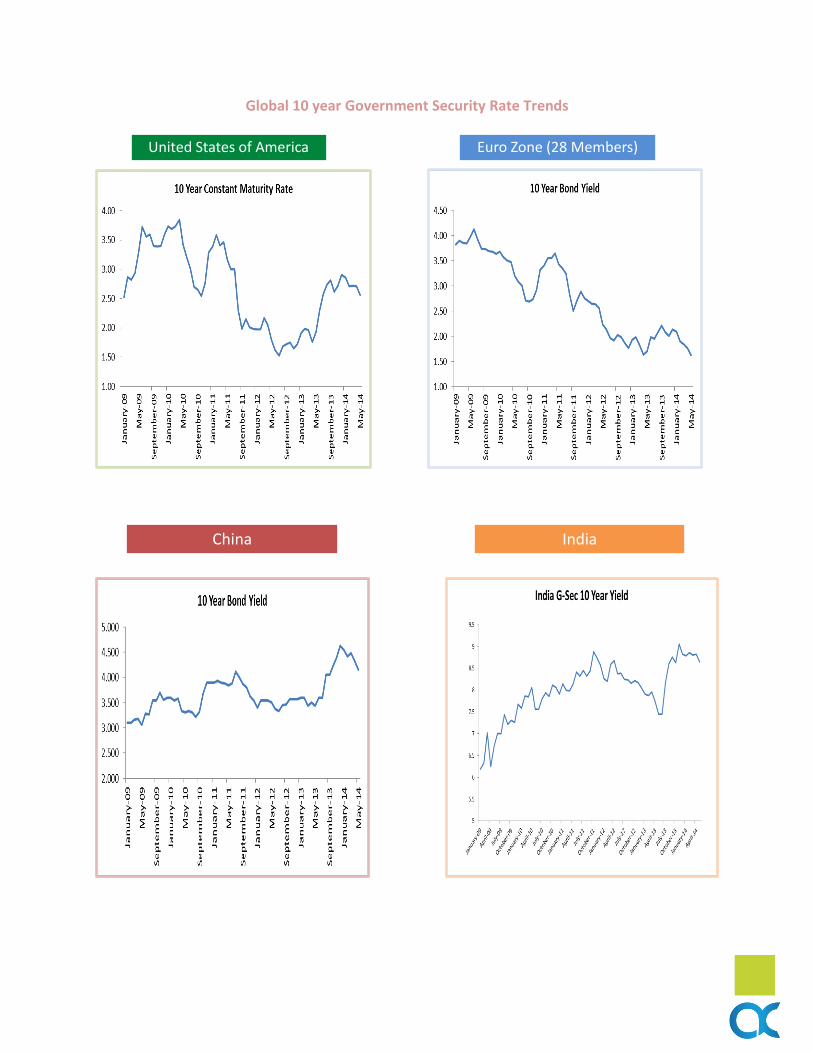
Global 10 year Government Security Rate Trends
United States of America Euro Zone (28 Members)
China India
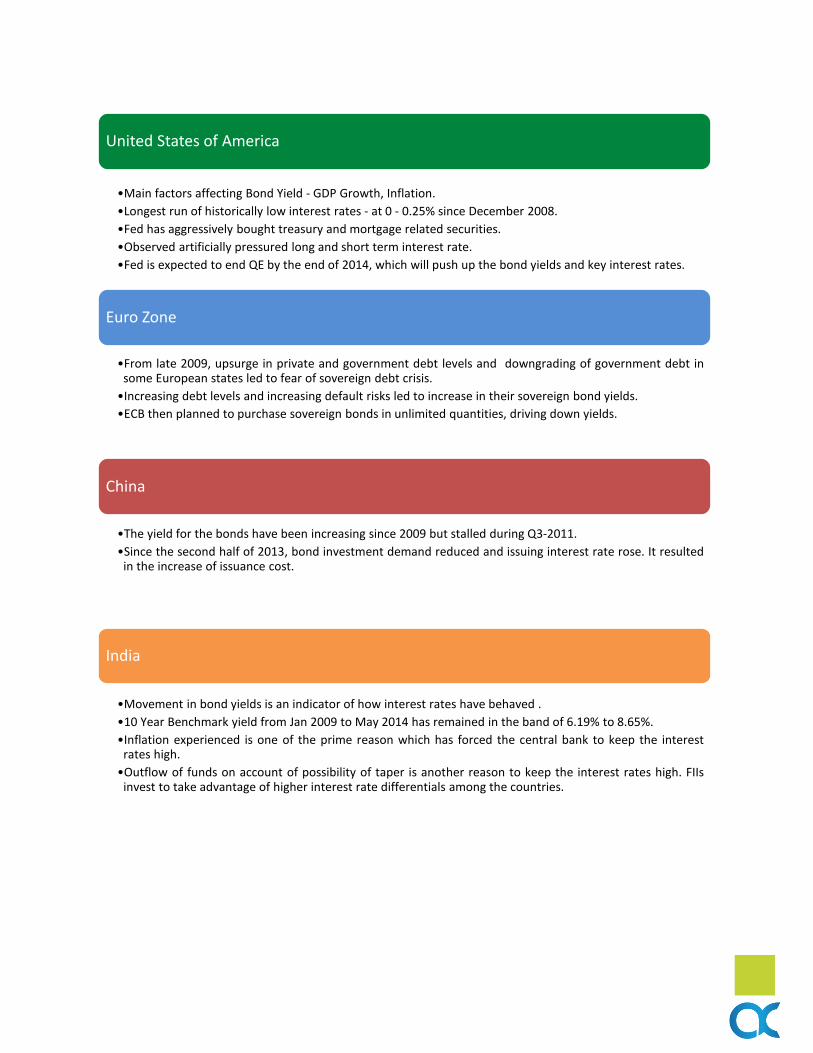
United States of America
•Main factors affecting Bond Yield - GDP Growth, Inflation.
•Longest run of historically low interest rates - at 0 - 0.25% since December 2008.
•Fed has aggressively bought treasury and mortgage related securities.
•Observed artificially pressured long and short term interest rate.
•Fed is expected to end QE by the end of 2014, which will push up the bond yields and key interest rates.
Euro Zone
•From late 2009, upsurge in private and government debt levels and downgrading of government debt in some European states led to fear of sovereign debt crisis.
•Increasing debt levels and increasing default risks led to increase in their sovereign bond yields.
•ECB then planned to purchase sovereign bonds in unlimited quantities, driving down yields.
China
•The yield for the bonds have been increasing since 2009 but stalled during Q3-2011.
•Since the second half of 2013, bond investment demand reduced and issuing interest rate rose. It resulted in the increase of issuance cost.
India
•Movement in bond yields is an indicator of how interest rates have behaved .
•10 Year Benchmark yield from Jan 2009 to May 2014 has remained in the band of 6.19% to 8.65%.
•Inflation experienced is one of the prime reason which has forced the central bank to keep the interest rates high.
•Outflow of funds on account of possibility of taper is another reason to keep the interest rates high. FIIs invest to take advantage of higher interest rate differentials among the countries.
Negative Interest Rates in Eurozone – What does it mean?
Negative Interest Rates in Eurozone – What does it mean?
The ECB has cut its benchmark interest rate to 0.15% from 11 June’14, a new record low. Before, it had been
0.25%. By cutting it further, the ECB hopes to bring down interest rates. ECB wants banks to lend more to
businesses. This is because bank lending is falling in the 18-member state Eurozone.
In Eurozone, after several years of crisis, there are concerns that the recovery is not sustainable, in large part
due to falling bank lending.
Bank lending is a way of increasing the money supply. Growth relies on there being more money around for
consumers to spend and businesses to invest in expanding their output and hiring more staff. So if banks
aren't lending much then the prospects for economic growth are limited. Hence to stimulate the flow of more
credit, the ECB has slashed its key rate in the hope that borrowing costs will fall for firms.
But the ECB hasn't just cut its benchmark rate. It has also cut its deposit rate to a negative figure – minus
0.1%.
The ECB has a "deposit facility", which means banks can hold some of their excess cash at the central bank,
also ECB pays interest on those deposits.
Now that the deposit rate is negative, banks have to pay central bank for availing this facility of parking their
funds with it. This is to encourage banks to lend their cash out rather than hold it with the ECB.
It also slashed its marginal lending facility – where it offers cheap overnight credit to banks in need to some
quick funds – to 0.4% from its previous 0.75%.
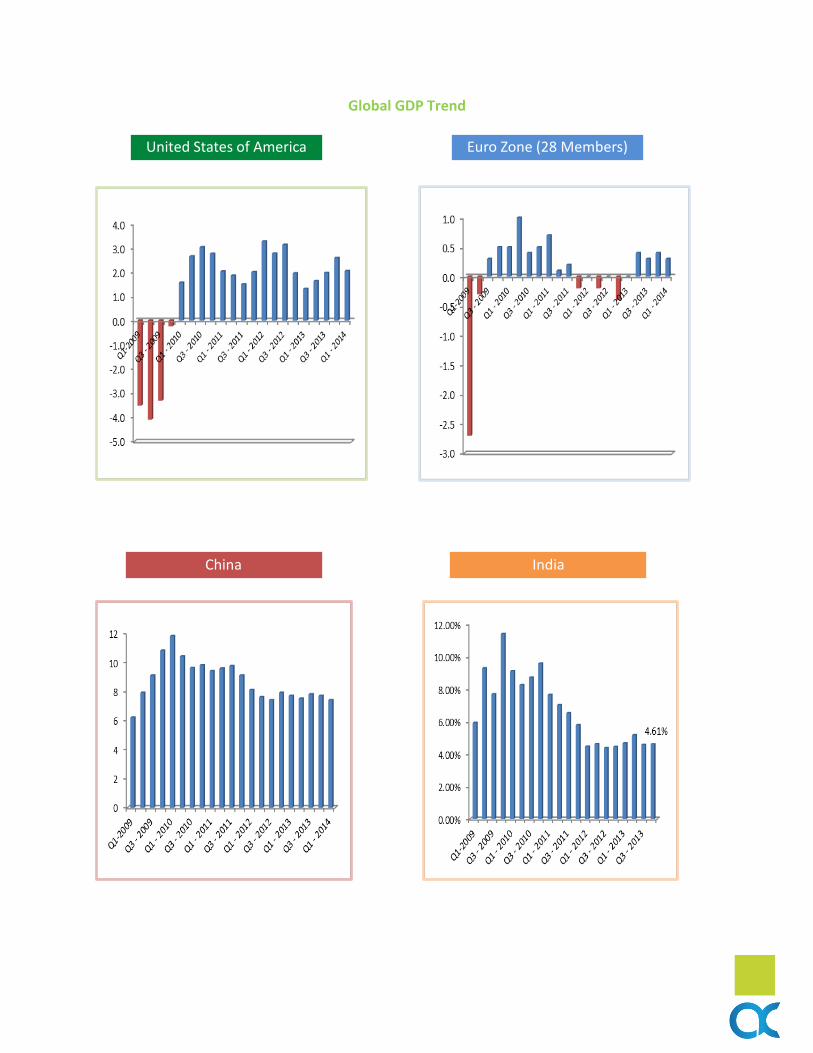
Global GDP Trend
United States of America Euro Zone (28 Members)
China India
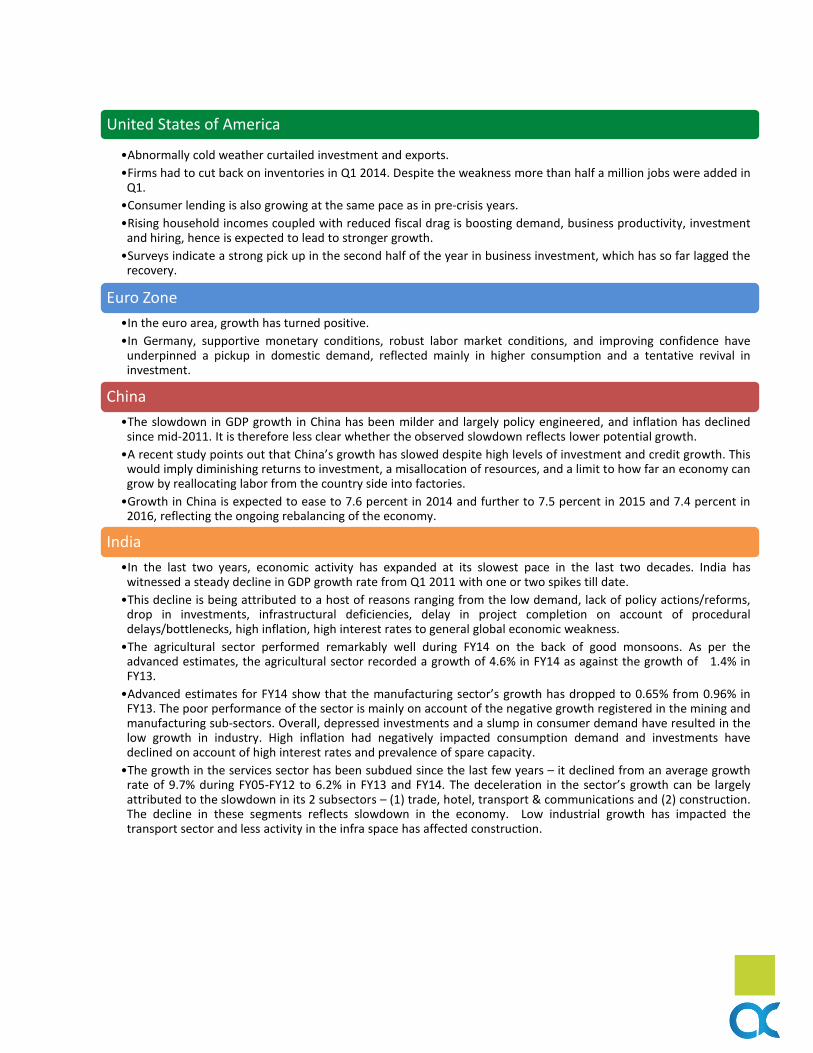
United States of America
•Abnormally cold weather curtailed investment and exports.
•Firms had to cut back on inventories in Q1 2014. Despite the weakness more than half a million jobs were added in Q1.
•Consumer lending is also growing at the same pace as in pre-crisis years.
•Rising household incomes coupled with reduced fiscal drag is boosting demand, business productivity, investment and hiring, hence is expected to lead to stronger growth.
•Surveys indicate a strong pick up in the second half of the year in business investment, which has so far lagged the recovery.
Euro Zone
•In the euro area, growth has turned positive.
•In Germany, supportive monetary conditions, robust labor market conditions, and improving confidence have underpinned a pickup in domestic demand, reflected mainly in higher consumption and a tentative revival in investment.
China
•The slowdown in GDP growth in China has been milder and largely policy engineered, and inflation has declined since mid-2011. It is therefore less clear whether the observed slowdown reflects lower potential growth.
•A recent study points out that China’s growth has slowed despite high levels of investment and credit growth. This would imply diminishing returns to investment, a misallocation of resources, and a limit to how far an economy can grow by reallocating labor from the country side into factories.
•Growth in China is expected to ease to 7.6 percent in 2014 and further to 7.5 percent in 2015 and 7.4 percent in 2016, reflecting the ongoing rebalancing of the economy.
India
•In the last two years, economic activity has expanded at its slowest pace in the last two decades. India has witnessed a steady decline in GDP growth rate from Q1 2011 with one or two spikes till date.
•This decline is being attributed to a host of reasons ranging from the low demand, lack of policy actions/reforms, drop in investments, infrastructural deficiencies, delay in project completion on account of procedural delays/bottlenecks, high inflation, high interest rates to general global economic weakness.
•The agricultural sector performed remarkably well during FY14 on the back of good monsoons. As per the advanced estimates, the agricultural sector recorded a growth of 4.6% in FY14 as against the growth of 1.4% in FY13.
•Advanced estimates for FY14 show that the manufacturing sector’s growth has dropped to 0.65% from 0.96% in FY13. The poor performance of the sector is mainly on account of the negative growth registered in the mining and manufacturing sub-sectors. Overall, depressed investments and a slump in consumer demand have resulted in the low growth in industry. High inflation had negatively impacted consumption demand and investments have declined on account of high interest rates and prevalence of spare capacity.
•The growth in the services sector has been subdued since the last few years – it declined from an average growth rate of 9.7% during FY05-FY12 to 6.2% in FY13 and FY14. The deceleration in the sector’s growth can be largely attributed to the slowdown in its 2 subsectors – (1) trade, hotel, transport & communications and (2) construction. The decline in these segments reflects slowdown in the economy. Low industrial growth has impacted the transport sector and less activity in the infra space has affected construction.
Global Inflationary Trend
United States of America Euro Zone (28 Members)
China India
United States of America
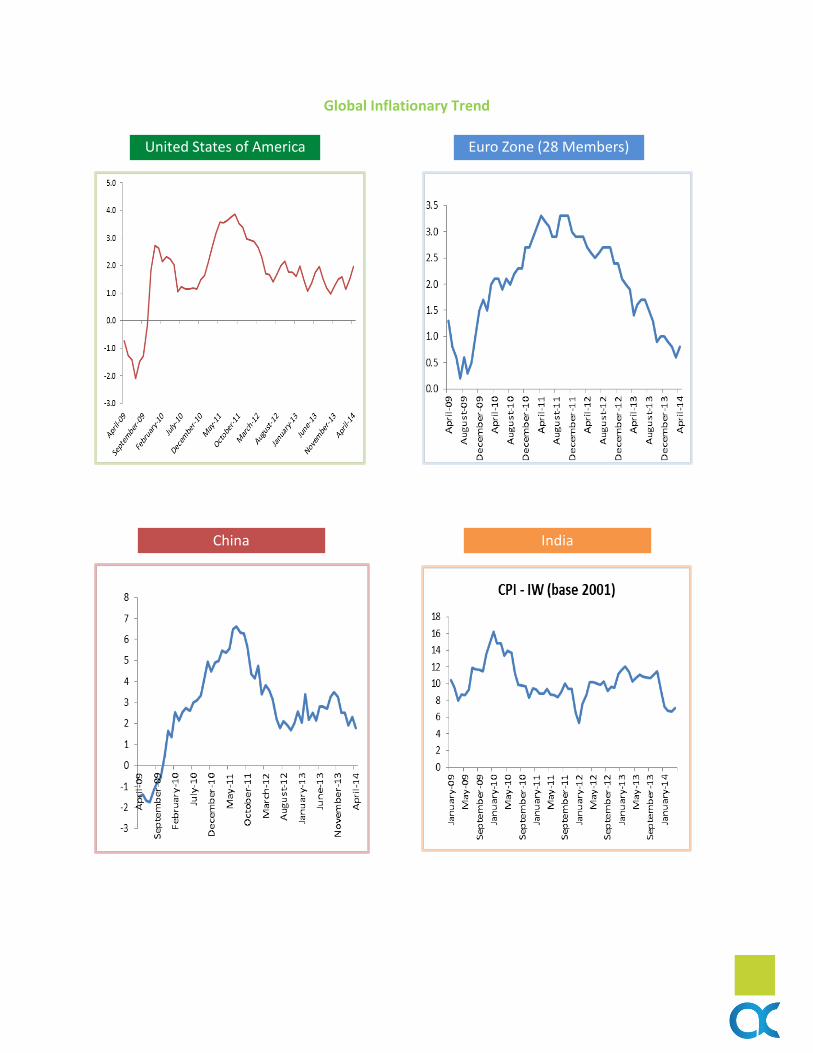
•The whole sub prime crisis is the reason behind the high deflation that existed in the economy and also the fall in the stock market that happened from 2007 to 2009.
•From Feb’2014 US has seen increase in inflation from 1.1% to 2.0% in April. Higher inflation is a sign of higher demand.
Euro Zone
•Since November’2011, according to Eurostat’s flash estimate, overall HICP inflation stood at 0.5% in May 2014.
•The subdued current rate of inflation reflects a stagnation of energy prices, food prices and non-energy industrial goods prices, as well as a subdued trend in services prices.
• Headline HICP inflation is expected to remain at low levels until the third quarter of 2014.
•Deflationary fears are gripping the Eurozone economy. If deflation were to occur, it would spark something called a "liquidity trap". This is where banks, businesses and individuals hold onto money because it will naturally increase in value as prices deflate. By holding onto cash it is not spent or invested – harming economic growth.
China
•CHINA'S consumer price index (CPI) increased 2.5 percent year on year in May, up from 1.8 percent in the previous month.
•CPI inflation declined to 2.3 percent (year on year) in the first quarter of 2014 due to a moderation of food prices. In April CPI inflation decelerated further to 1.8 percent, in part due to seasonality.
•In 2014, Inflation will stay contained. It is expected to be 3.0 percent, slightly higher than in 2013 but below the government’s target of 3.5 percent.
•There is a risk that food prices might increase more than expected due to the tensions in Ukraine, which appears increasingly likely this year and could cause considerable damage on crop yields.
India
•The upward trend witnessed from March 2009 to Jan 2010 was largely due to the QE effect. India has been the significant beneficiary of Global Monetary Easing program. This increase in global liquidity lead to the increase in commodity prices. Increased inflation reduced domestic saving and moderated profit margin.
•CPI for the month of May’14 saw a marginal decline (8.3%) following two successive months of increase. After rising to 9.7% in April’14 (y-o-y), the food, beverages and tobacco segment recorded a moderation in their price levels with inflation for May’14 being recorded at 9.4%. Moderation of inflation was mainly on account moderation in food articles and vegetable indices.
•Fuel and light inflation declined from 6% in April ’14 to 5.1% in May ’14.
•While CPI inflation has eased but its future path will stay contingent on monsoon, turmoil in Iraq, hike in rail freight. However the hike in rail freight (6.5%) would only put pressure on prices in near term. In long run, this step will help reduce the fiscal deficit.
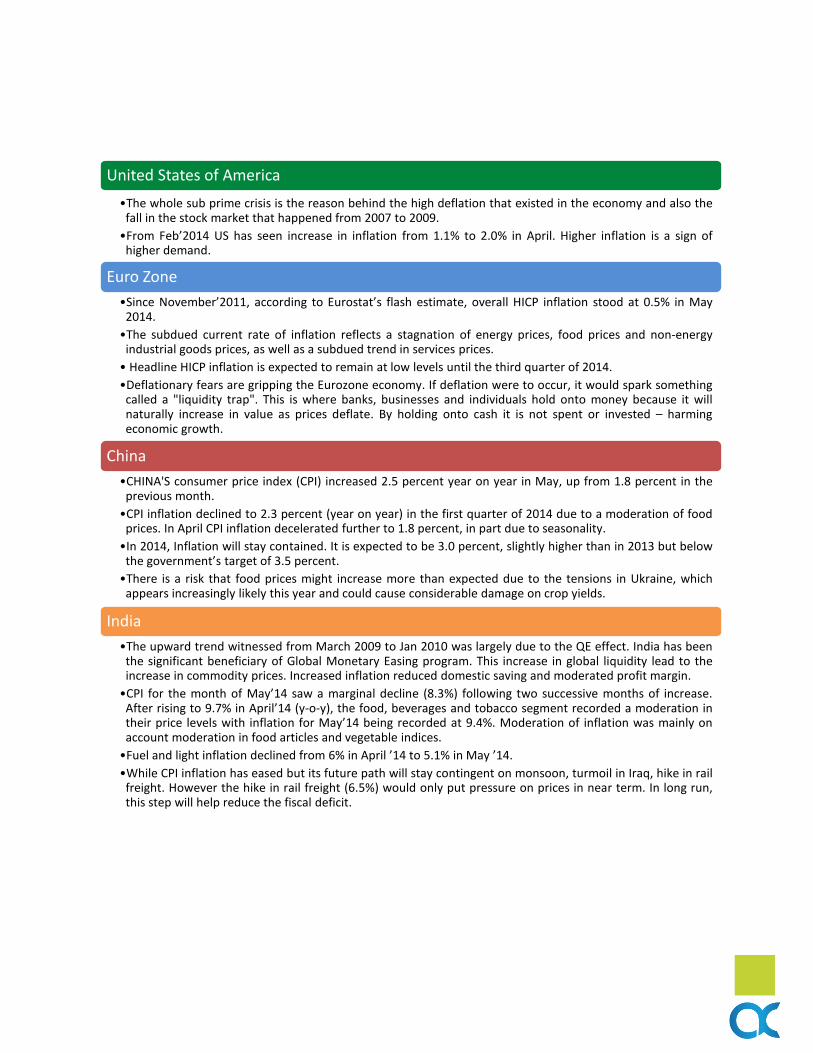
Global Markets - Quarterly Performance
Global Markets Asian Markets
Economy Overview – India
The Indian economy has been through challenging times in the last two years, faced with the twin problem of
prolonged high inflation and low growth. This was also reflected in lower business sentiments, reduced
investments, lowered consumption, compressed revenues, increased government welfare measures and pressure
on deficits.
The financial year gone by (FY14) was marred by continued low GDP growth, declining industrial output, decline in
investment, higher inflation, lower quality of bank assets, high current account deficit (which has been brought
down drastically through affirmative policy action) and depreciation in the domestic exchange rate.
The Narendra Modi led Bharatiya Janata Party (BJP) registered the biggest mandate for a single-party since 1984. This augurs well for the country as it means we are going to have a stable government which will not be fully dependent on its allies for pushing through with an economic agenda, though would still require support when legislative action is required.
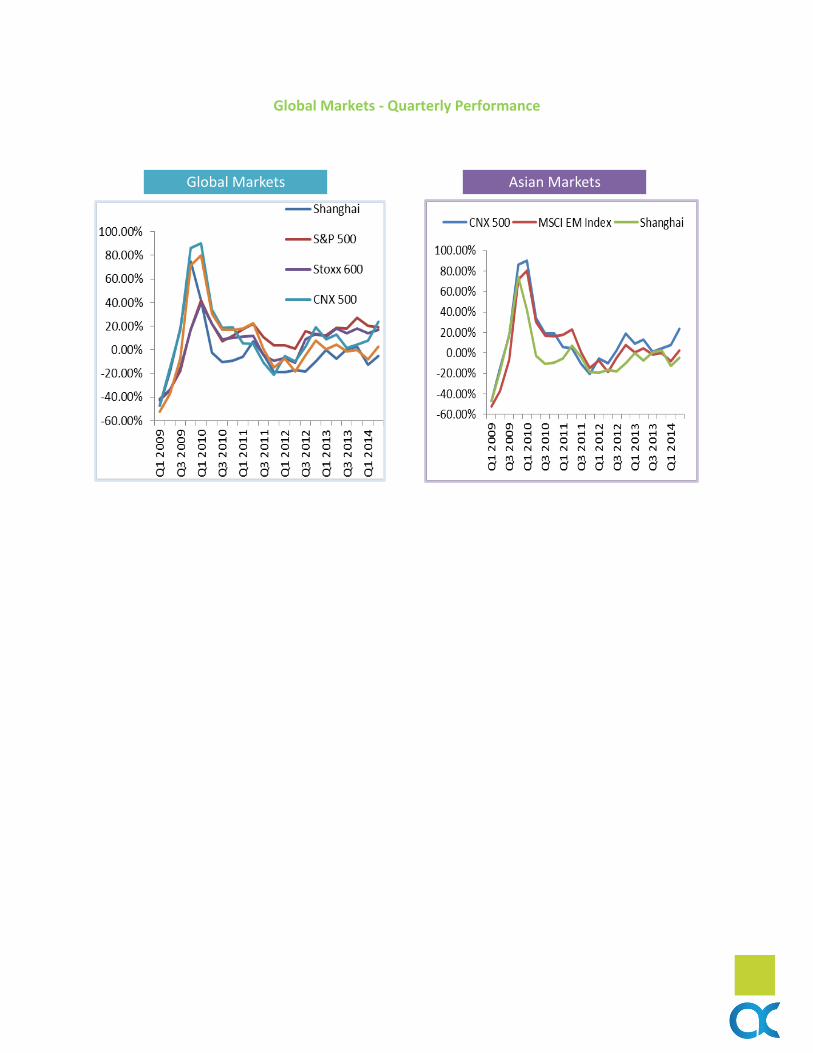
CAD as %GDP Fiscal Deficit - (2012 - 2014)
FII FDI
PMI
Current Account Deficit
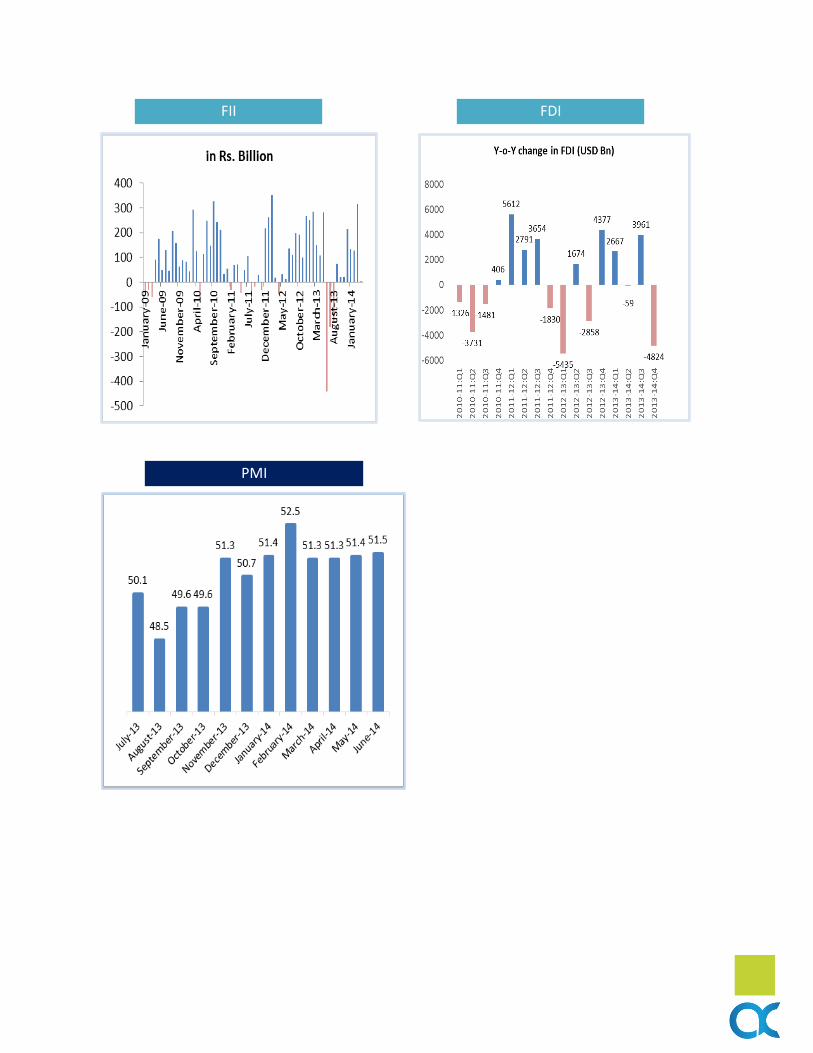
•High inflation drove real deposit rate into negative territory, which led to decline in financial savings and increased saving in form of gold, leading to higher imports of gold. This further widened CAD.
•Curb on gold imports and weaker domestic economy led to sharp decline in overall imports.
•On the contrary, exports got a boost from recovery in the US and Euro. As a result CAD fell to 0.2% of GDP during the final quarter of FY2013-14.
•In FY15, CRISIL expects CAD to widen to 2.2% of GDP as steps towards removal of restrictions on gold imports have already begun. Since growth is expected to pick up, hence imports of capital and consumption are also expected to rise.
•Financing CAD might pose a challenge in FY15 as global liquidity declines with continued tapering of US Fed’s bond purchase program.
Fiscal Deficit
•Large increase in MSP for various crops, MNREGA Scheme, incomplete and delayed pass through of higher international oil prices to domestic prices added to the fiscal pressure.
FII
•In FY14, country witnessed a sudden and significant outflows of funds, which led to sharp drop in FII inflows and consequently for the year country saw a 66% decline in net inflows from previous year.
•Such a phenomenon was observed on news of US winding down its monetary stimulus program and stronger than expected growth in the US economy which prompted investors to shift their asset holding from emerging economies to the US market.
•Since Jan 2014, India has been the most favored nation for FII inflows.
Exchange Rate
•The steep decline in the Indian rupee was the matter of grave concern for a large part of FY14.
•Following a series of policy measures by the RBI and the government, the Rupee strengthened from its record lows (Rs.68/$) and has been fairly stable in recent months at Rs.60-61/$.
•The stability in the domestic currency is being aided by the improvements in the country’s economic fundamentals i.e. narrowing of CAD and the increase of foreign inflows into the country.
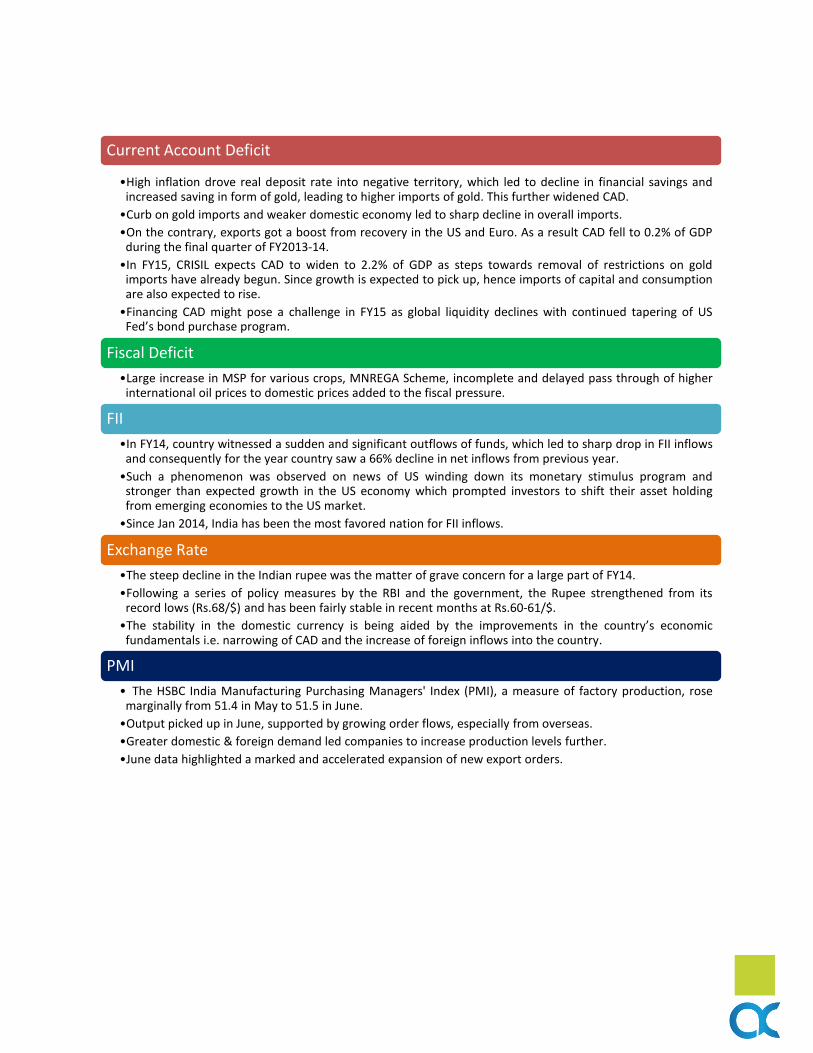
PMI
• The HSBC India Manufacturing Purchasing Managers' Index (PMI), a measure of factory production, rose marginally from 51.4 in May to 51.5 in June.
•Output picked up in June, supported by growing order flows, especially from overseas.
•Greater domestic & foreign demand led companies to increase production levels further.
•June data highlighted a marked and accelerated expansion of new export orders.
Equity Market Overview
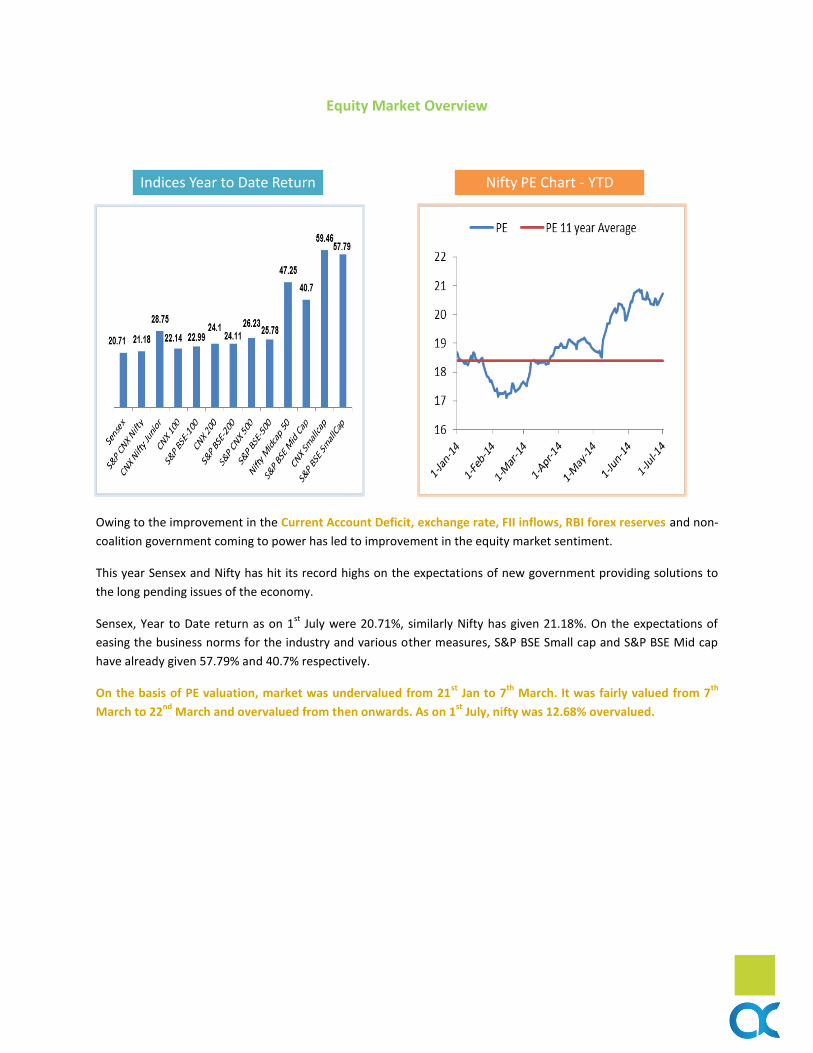
Owing to the improvement in the Current Account Deficit, exchange rate, FII inflows, RBI forex reserves and non-
coalition government coming to power has led to improvement in the equity market sentiment.
This year Sensex and Nifty has hit its record highs on the expectations of new government providing solutions to
the long pending issues of the economy.
Sensex, Year to Date return as on 1st
July were 20.71%, similarly Nifty has given 21.18%. On the expectations of
easing the business norms for the industry and various other measures, S&P BSE Small cap and S&P BSE Mid cap
have already given 57.79% and 40.7% respectively.
On the basis of PE valuation, market was undervalued from 21st
Jan to 7th
March. It was fairly valued from 7th
March to 22nd
March and overvalued from then onwards. As on 1st
July, nifty was 12.68% overvalued.
Indices Year to Date Return Nifty PE Chart - YTD
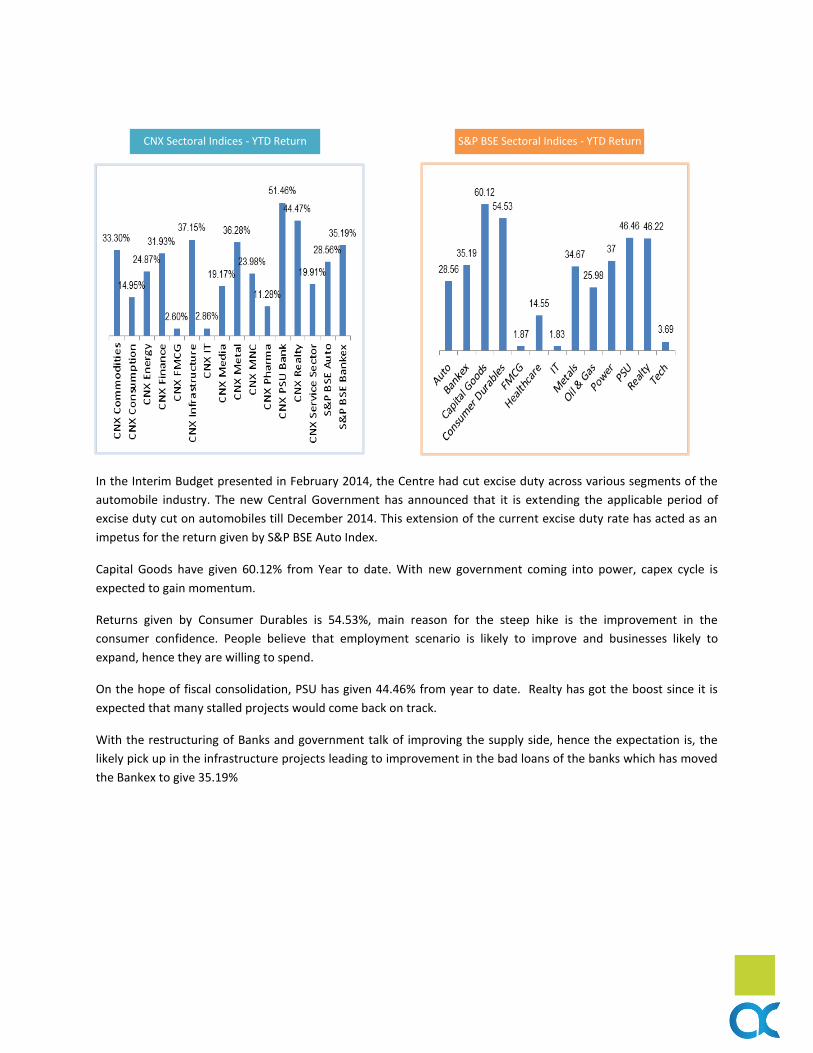
In the Interim Budget presented in February 2014, the Centre had cut excise duty across various segments of the
automobile industry. The new Central Government has announced that it is extending the applicable period of
excise duty cut on automobiles till December 2014. This extension of the current excise duty rate has acted as an
impetus for the return given by S&P BSE Auto Index.
Capital Goods have given 60.12% from Year to date. With new government coming into power, capex cycle is
expected to gain momentum.
Returns given by Consumer Durables is 54.53%, main reason for the steep hike is the improvement in the
consumer confidence. People believe that employment scenario is likely to improve and businesses likely to
expand, hence they are willing to spend.
On the hope of fiscal consolidation, PSU has given 44.46% from year to date. Realty has got the boost since it is
expected that many stalled projects would come back on track.
With the restructuring of Banks and government talk of improving the supply side, hence the expectation is, the
likely pick up in the infrastructure projects leading to improvement in the bad loans of the banks which has moved
the Bankex to give 35.19%
CNX Sectoral Indices - YTD Return S&P BSE Sectoral Indices - YTD Return
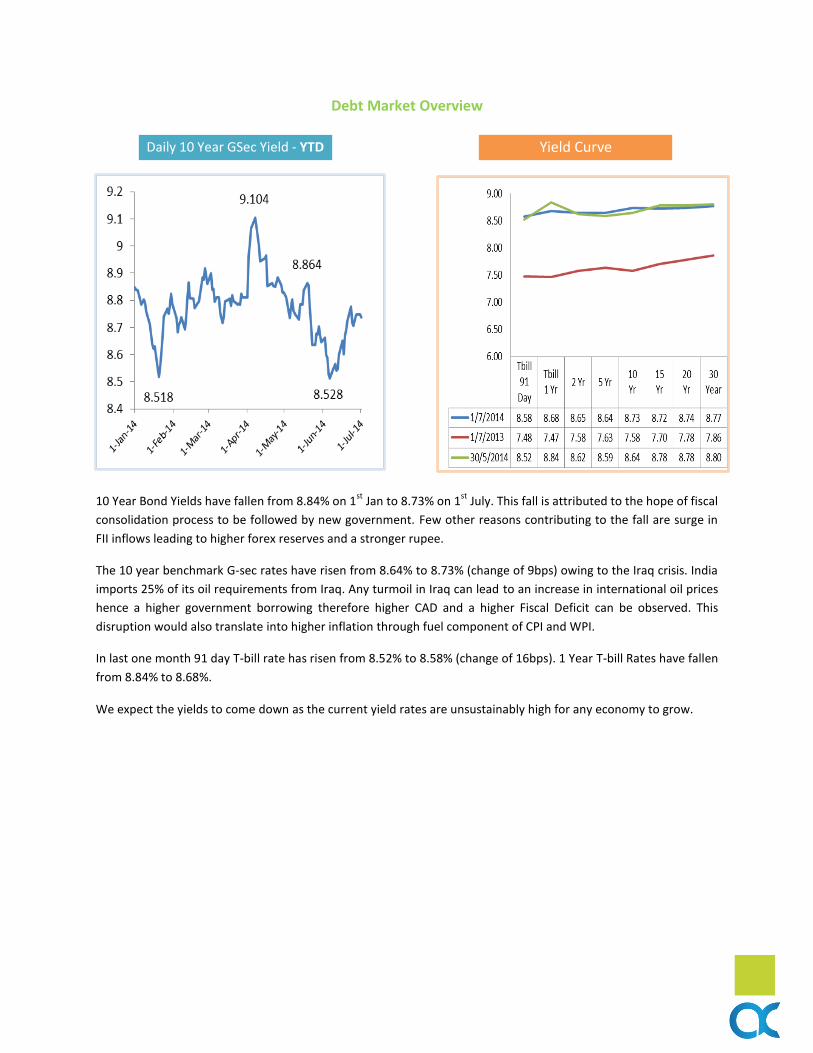
Debt Market Overview
10 Year Bond Yields have fallen from 8.84% on 1st
Jan to 8.73% on 1st
July. This fall is attributed to the hope of fiscal
consolidation process to be followed by new government. Few other reasons contributing to the fall are surge in
FII inflows leading to higher forex reserves and a stronger rupee.
The 10 year benchmark G-sec rates have risen from 8.64% to 8.73% (change of 9bps) owing to the Iraq crisis. India
imports 25% of its oil requirements from Iraq. Any turmoil in Iraq can lead to an increase in international oil prices
hence a higher government borrowing therefore higher CAD and a higher Fiscal Deficit can be observed. This
disruption would also translate into higher inflation through fuel component of CPI and WPI.
In last one month 91 day T-bill rate has risen from 8.52% to 8.58% (change of 16bps). 1 Year T-bill Rates have fallen
from 8.84% to 8.68%.
We expect the yields to come down as the current yield rates are unsustainably high for any economy to grow.
Daily 10 Year GSec Yield - YTD Yield Curve
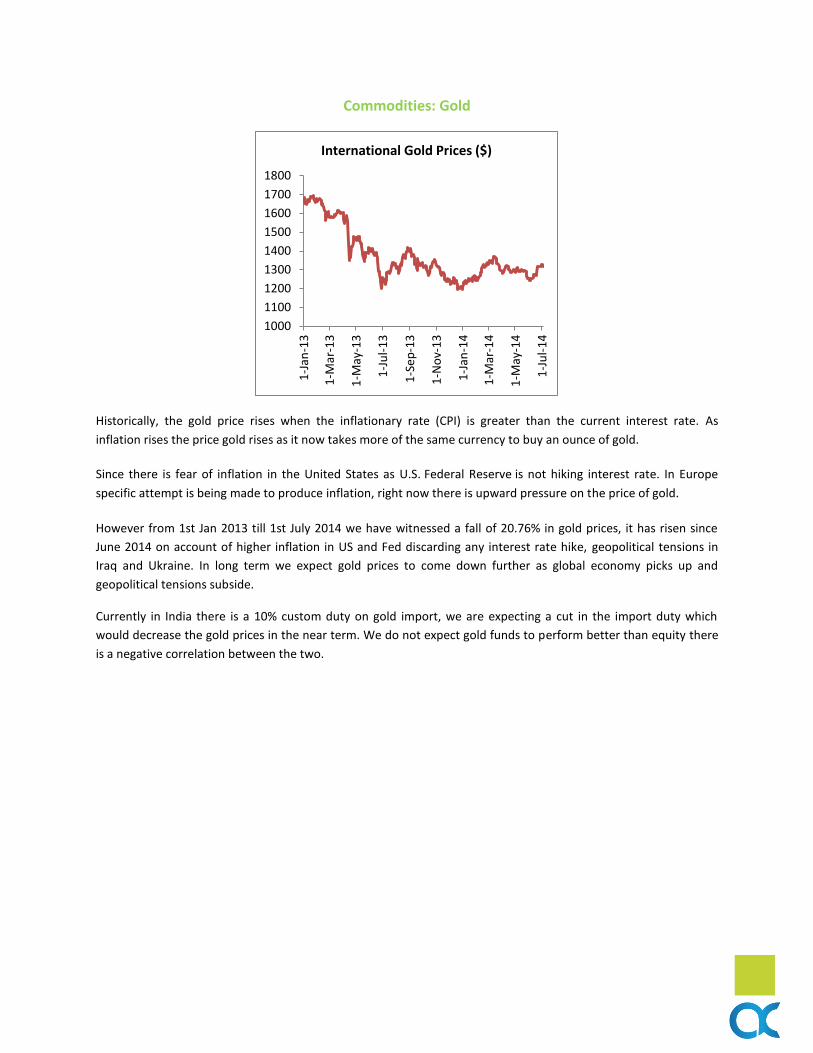
Commodities: Gold
Historically, the gold price rises when the inflationary rate (CPI) is greater than the current interest rate. As
inflation rises the price gold rises as it now takes more of the same currency to buy an ounce of gold.
Since there is fear of inflation in the United States as U.S. Federal Reserve is not hiking interest rate. In Europe
specific attempt is being made to produce inflation, right now there is upward pressure on the price of gold.
However from 1st Jan 2013 till 1st July 2014 we have witnessed a fall of 20.76% in gold prices, it has risen since
June 2014 on account of higher inflation in US and Fed discarding any interest rate hike, geopolitical tensions in
Iraq and Ukraine. In long term we expect gold prices to come down further as global economy picks up and
geopolitical tensions subside.
Currently in India there is a 10% custom duty on gold import, we are expecting a cut in the import duty which
would decrease the gold prices in the near term. We do not expect gold funds to perform better than equity there
is a negative correlation between the two.
1000
1100
1200
1300
1400
1500
1600
1700
1800
1-J
an-1
3
1-M
ar-1
3
1-M
ay-1
3
1-J
ul-
13
1-S
ep
-13
1-N
ov-
13
1-J
an-1
4
1-M
ar-1
4
1-M
ay-1
4
1-J
ul-
14
International Gold Prices ($)
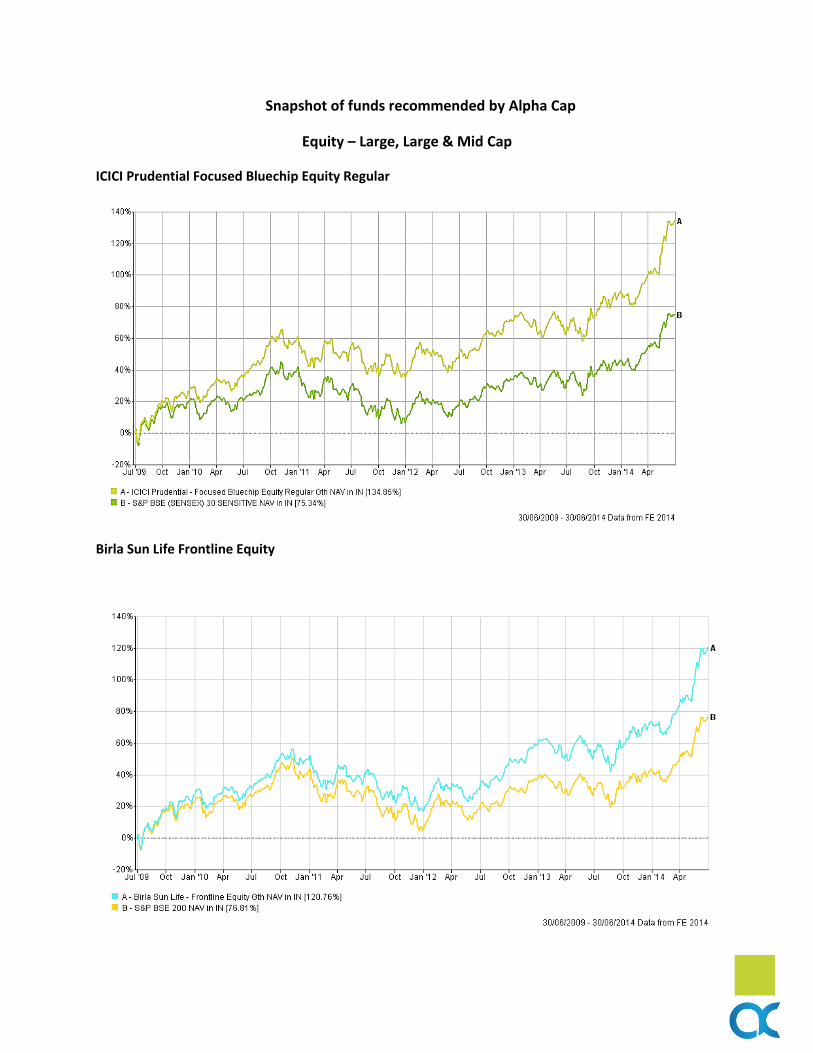
Snapshot of funds recommended by Alpha Cap
Equity – Large, Large & Mid Cap
ICICI Prudential Focused Bluechip Equity Regular
Birla Sun Life Frontline Equity
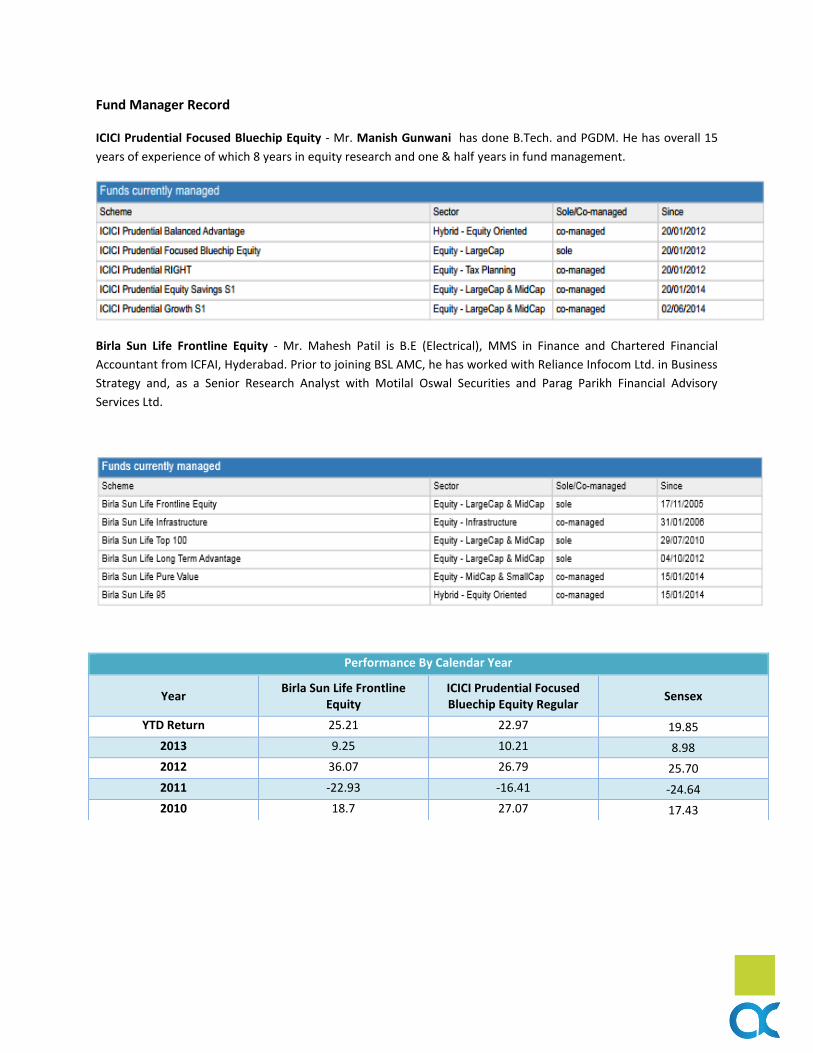
Fund Manager Record
ICICI Prudential Focused Bluechip Equity - Mr. Manish Gunwani has done B.Tech. and PGDM. He has overall 15
years of experience of which 8 years in equity research and one & half years in fund management.
Birla Sun Life Frontline Equity - Mr. Mahesh Patil is B.E (Electrical), MMS in Finance and Chartered Financial
Accountant from ICFAI, Hyderabad. Prior to joining BSL AMC, he has worked with Reliance Infocom Ltd. in Business
Strategy and, as a Senior Research Analyst with Motilal Oswal Securities and Parag Parikh Financial Advisory
Services Ltd.
Performance By Calendar Year
Year Birla Sun Life Frontline
Equity ICICI Prudential Focused Bluechip Equity Regular
Sensex
YTD Return 25.21 22.97 19.85
2013 9.25 10.21 8.98
2012 36.07 26.79 25.70
2011 -22.93 -16.41 -24.64
2010 18.7 27.07 17.43
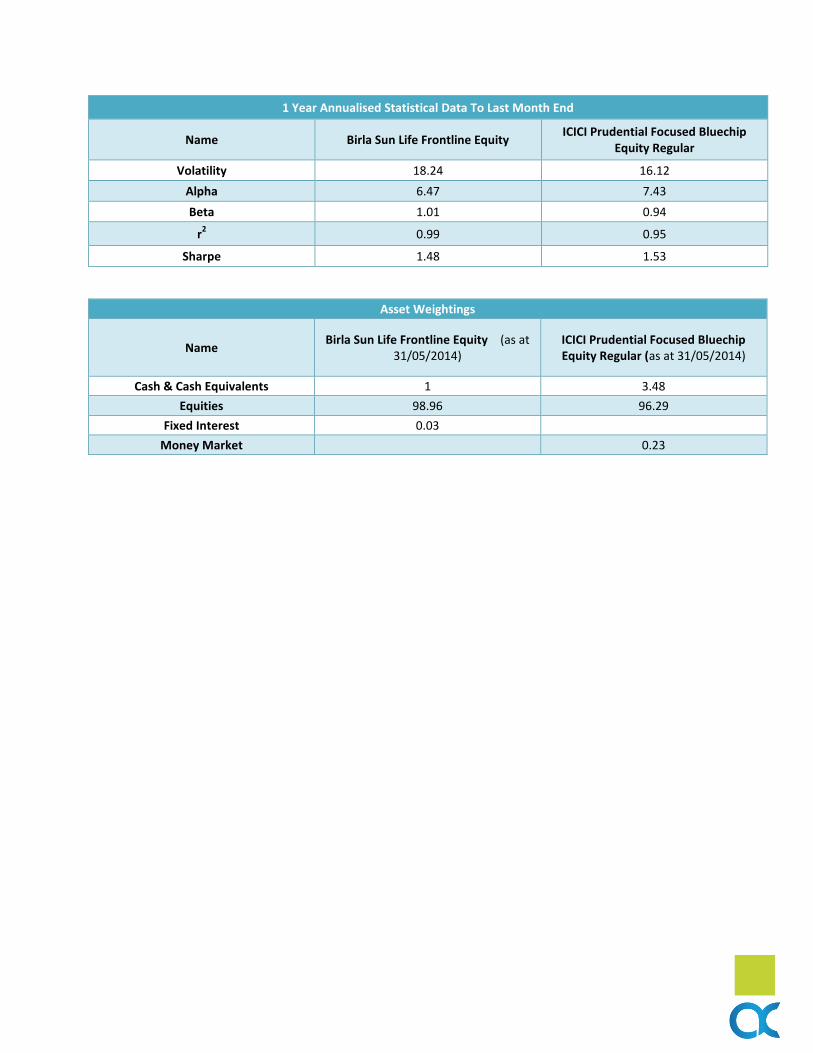
1 Year Annualised Statistical Data To Last Month End
Name Birla Sun Life Frontline Equity ICICI Prudential Focused Bluechip
Equity Regular
Volatility 18.24 16.12
Alpha 6.47 7.43
Beta 1.01 0.94
r2 0.99 0.95
Sharpe 1.48 1.53
Asset Weightings
Name Birla Sun Life Frontline Equity (as at
31/05/2014) ICICI Prudential Focused Bluechip Equity Regular (as at 31/05/2014)
Cash & Cash Equivalents 1 3.48
Equities 98.96 96.29
Fixed Interest 0.03
Money Market
0.23
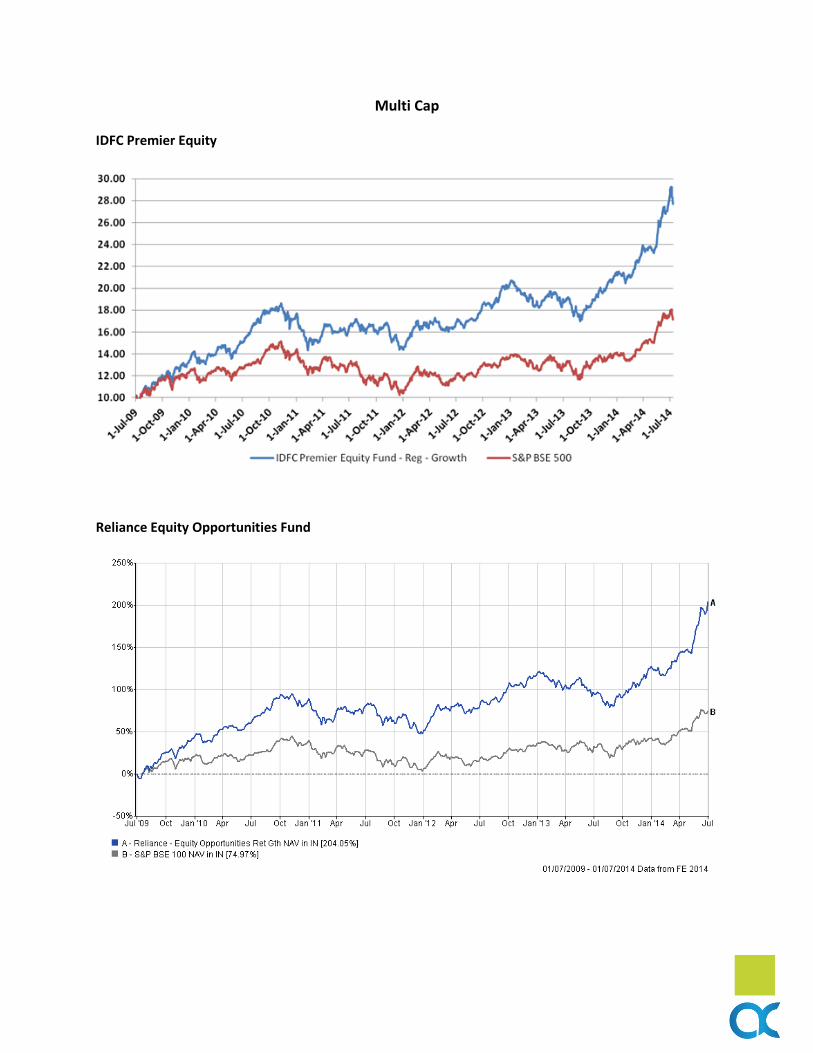
Multi Cap
IDFC Premier Equity
Reliance Equity Opportunities Fund
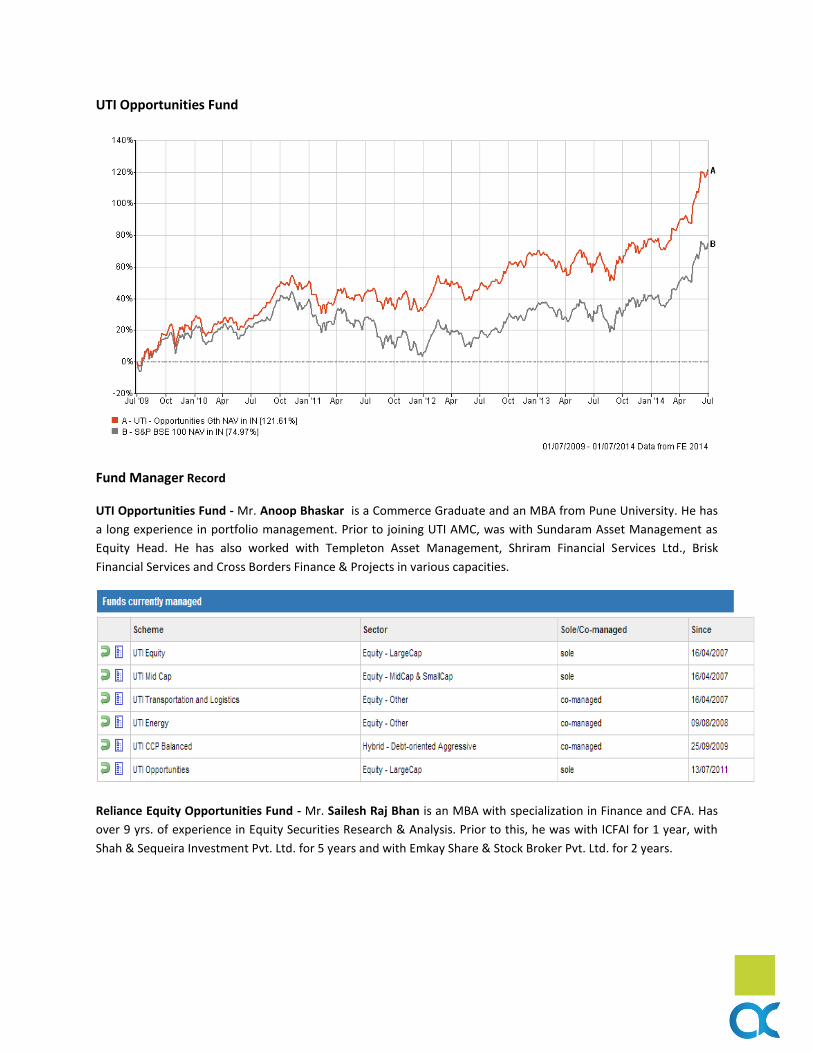
UTI Opportunities Fund
Fund Manager Record
UTI Opportunities Fund - Mr. Anoop Bhaskar is a Commerce Graduate and an MBA from Pune University. He has
a long experience in portfolio management. Prior to joining UTI AMC, was with Sundaram Asset Management as
Equity Head. He has also worked with Templeton Asset Management, Shriram Financial Services Ltd., Brisk
Financial Services and Cross Borders Finance & Projects in various capacities.
Reliance Equity Opportunities Fund - Mr. Sailesh Raj Bhan is an MBA with specialization in Finance and CFA. Has
over 9 yrs. of experience in Equity Securities Research & Analysis. Prior to this, he was with ICFAI for 1 year, with
Shah & Sequeira Investment Pvt. Ltd. for 5 years and with Emkay Share & Stock Broker Pvt. Ltd. for 2 years.
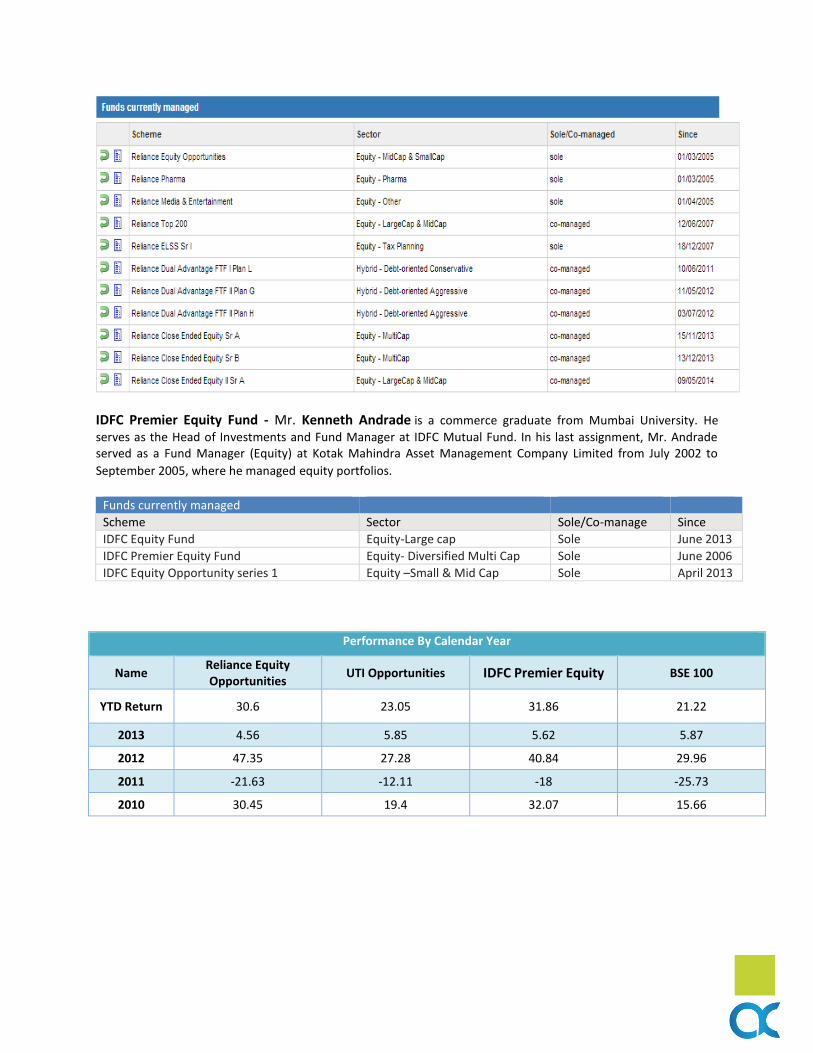
IDFC Premier Equity Fund - Mr. Kenneth Andrade is a commerce graduate from Mumbai University. He
serves as the Head of Investments and Fund Manager at IDFC Mutual Fund. In his last assignment, Mr. Andrade served as a Fund Manager (Equity) at Kotak Mahindra Asset Management Company Limited from July 2002 to
September 2005, where he managed equity portfolios.
Funds currently managed
Scheme Sector Sole/Co-manage Since
IDFC Equity Fund Equity-Large cap Sole June 2013
IDFC Premier Equity Fund Equity- Diversified Multi Cap Sole June 2006
IDFC Equity Opportunity series 1 Equity –Small & Mid Cap Sole April 2013
Performance By Calendar Year
Name Reliance Equity Opportunities
UTI Opportunities IDFC Premier Equity BSE 100
YTD Return 30.6 23.05 31.86 21.22
2013 4.56 5.85 5.62 5.87
2012 47.35 27.28 40.84 29.96
2011 -21.63 -12.11 -18 -25.73
2010 30.45 19.4 32.07 15.66
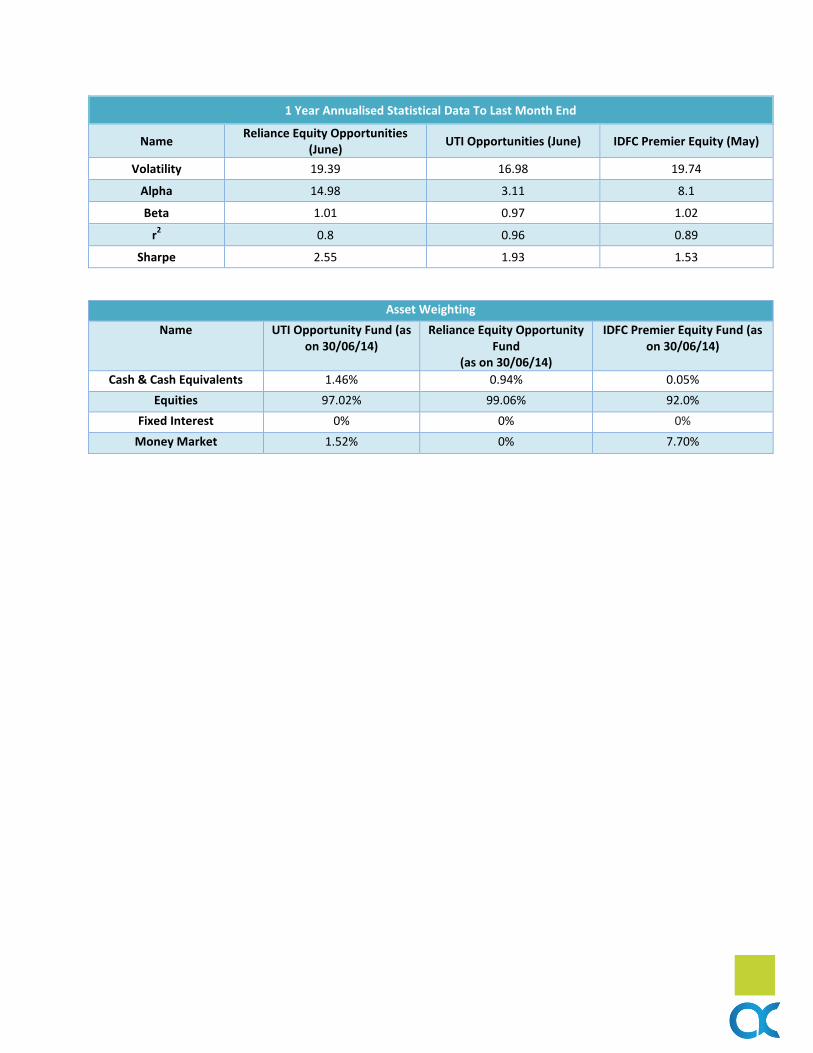
1 Year Annualised Statistical Data To Last Month End
Name Reliance Equity Opportunities
(June) UTI Opportunities (June) IDFC Premier Equity (May)
Volatility 19.39 16.98 19.74
Alpha 14.98 3.11 8.1
Beta 1.01 0.97 1.02
r2 0.8 0.96 0.89
Sharpe 2.55 1.93 1.53
Asset Weighting
Name UTI Opportunity Fund (as on 30/06/14)
Reliance Equity Opportunity Fund
(as on 30/06/14)
IDFC Premier Equity Fund (as on 30/06/14)
Cash & Cash Equivalents 1.46% 0.94% 0.05%
Equities 97.02% 99.06% 92.0%
Fixed Interest 0% 0% 0%
Money Market 1.52% 0% 7.70%
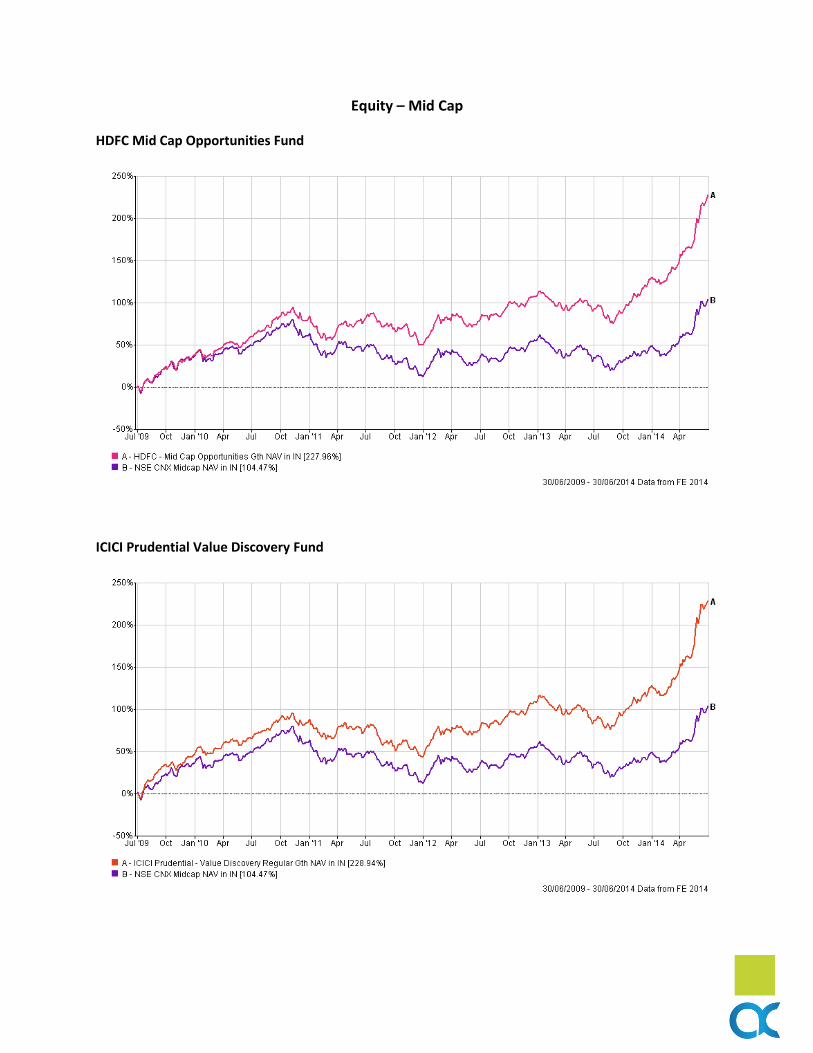
Equity – Mid Cap
HDFC Mid Cap Opportunities Fund
ICICI Prudential Value Discovery Fund
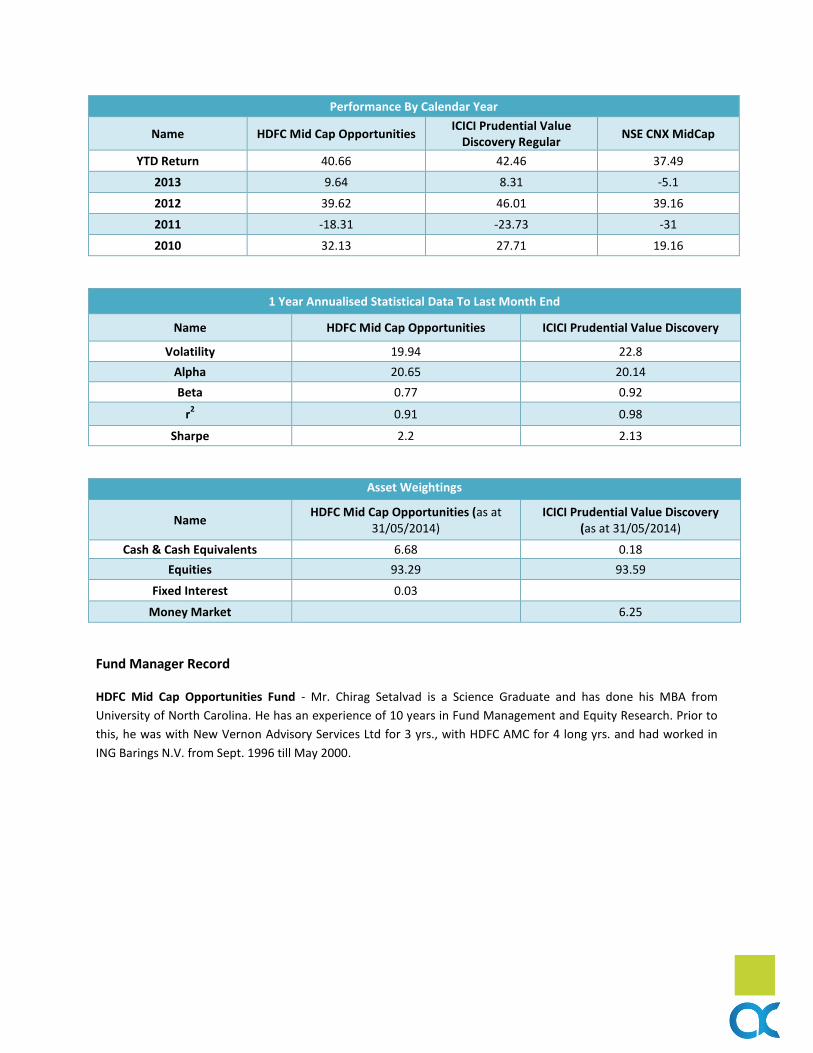
Performance By Calendar Year
Name HDFC Mid Cap Opportunities ICICI Prudential Value
Discovery Regular NSE CNX MidCap
YTD Return 40.66 42.46 37.49
2013 9.64 8.31 -5.1
2012 39.62 46.01 39.16
2011 -18.31 -23.73 -31
2010 32.13 27.71 19.16
1 Year Annualised Statistical Data To Last Month End
Name HDFC Mid Cap Opportunities ICICI Prudential Value Discovery
Volatility 19.94 22.8
Alpha 20.65 20.14
Beta 0.77 0.92
r2 0.91 0.98
Sharpe 2.2 2.13
Asset Weightings
Name HDFC Mid Cap Opportunities (as at
31/05/2014) ICICI Prudential Value Discovery
(as at 31/05/2014)
Cash & Cash Equivalents 6.68 0.18
Equities 93.29 93.59
Fixed Interest 0.03
Money Market
6.25
Fund Manager Record
HDFC Mid Cap Opportunities Fund - Mr. Chirag Setalvad is a Science Graduate and has done his MBA from
University of North Carolina. He has an experience of 10 years in Fund Management and Equity Research. Prior to
this, he was with New Vernon Advisory Services Ltd for 3 yrs., with HDFC AMC for 4 long yrs. and had worked in
ING Barings N.V. from Sept. 1996 till May 2000.
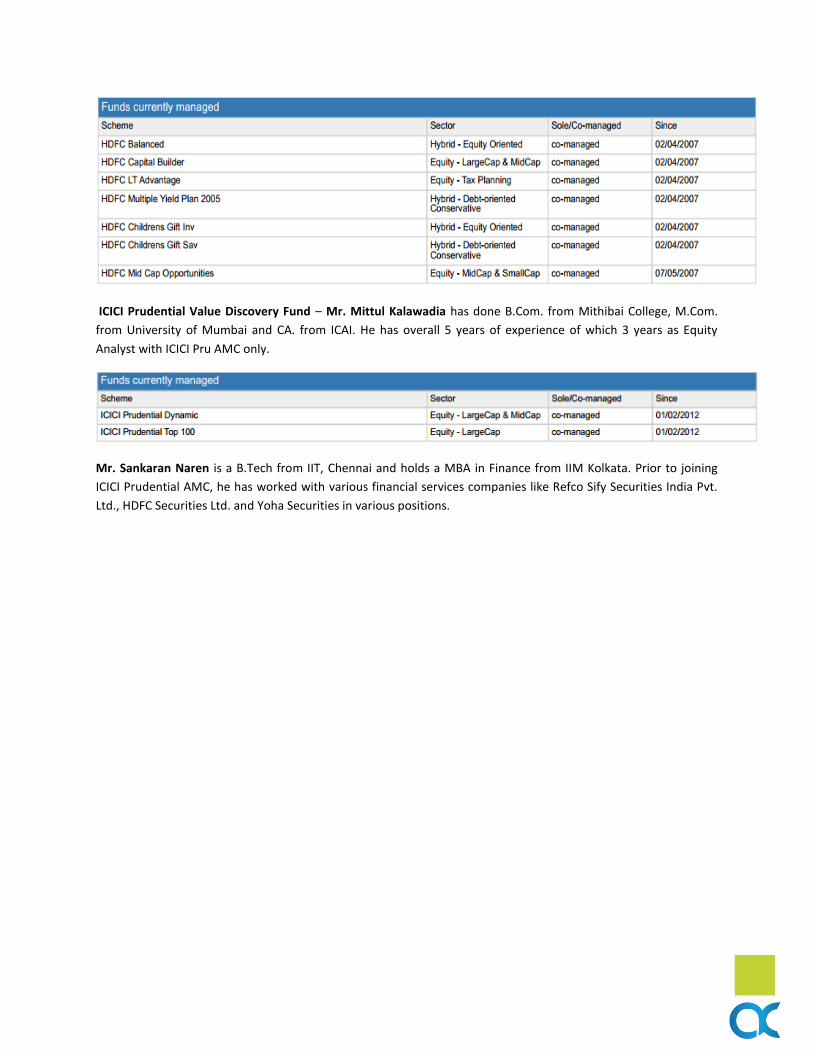
ICICI Prudential Value Discovery Fund – Mr. Mittul Kalawadia has done B.Com. from Mithibai College, M.Com.
from University of Mumbai and CA. from ICAI. He has overall 5 years of experience of which 3 years as Equity
Analyst with ICICI Pru AMC only.
Mr. Sankaran Naren is a B.Tech from IIT, Chennai and holds a MBA in Finance from IIM Kolkata. Prior to joining
ICICI Prudential AMC, he has worked with various financial services companies like Refco Sify Securities India Pvt.
Ltd., HDFC Securities Ltd. and Yoha Securities in various positions.
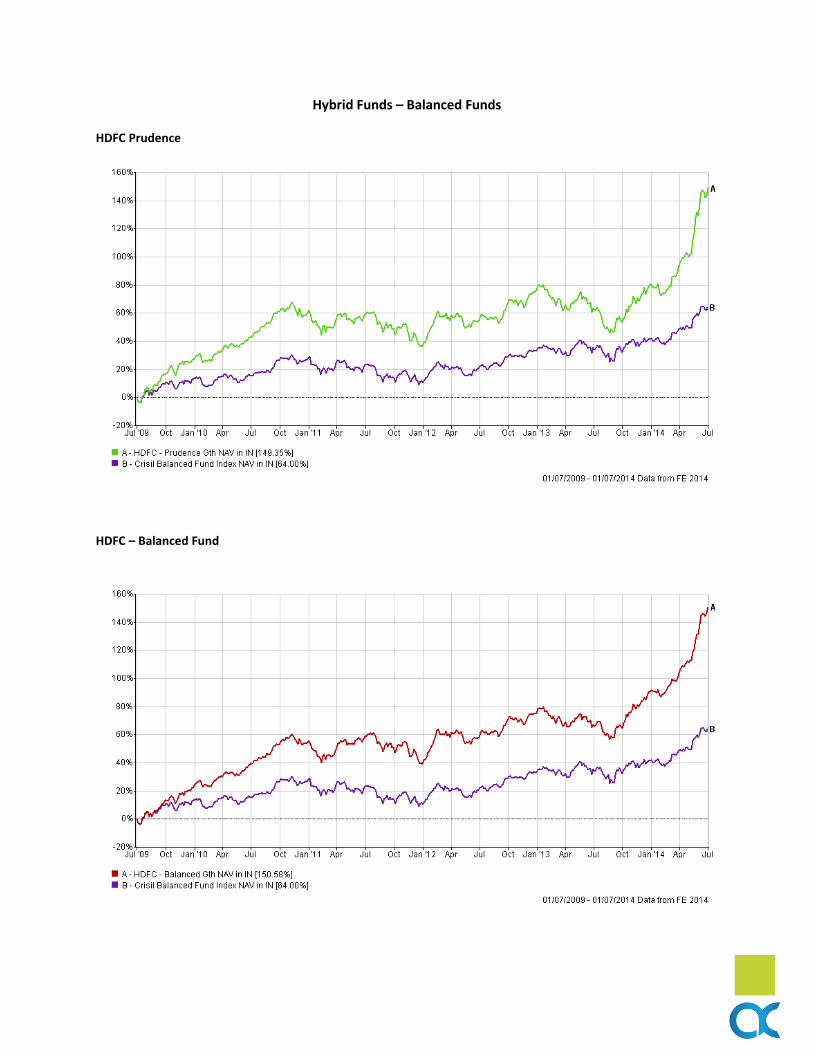
Hybrid Funds – Balanced Funds
HDFC Prudence
HDFC – Balanced Fund
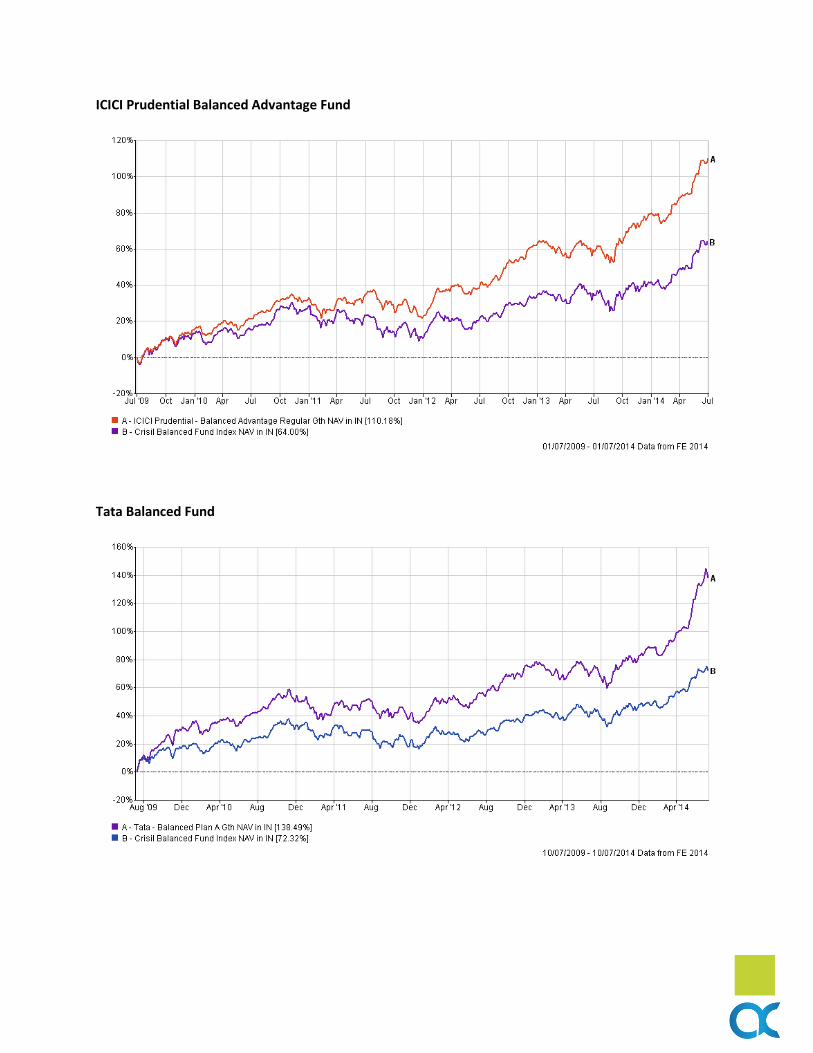
ICICI Prudential Balanced Advantage Fund
Tata Balanced Fund
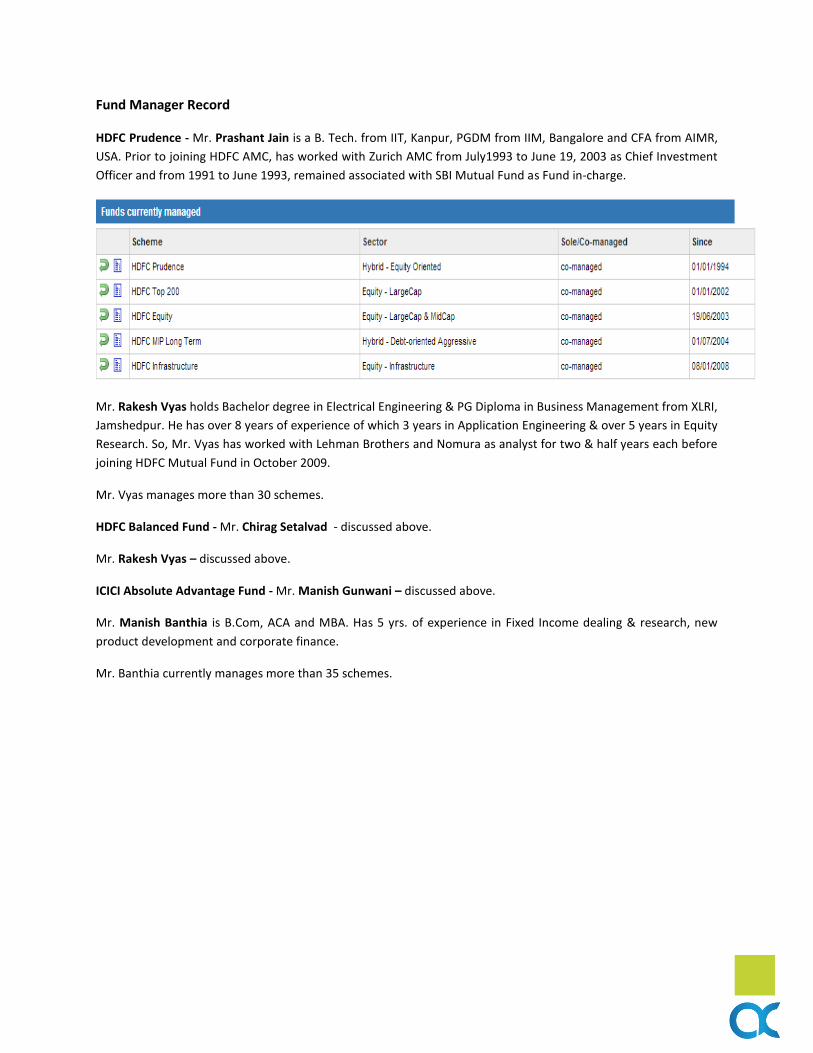
Fund Manager Record
HDFC Prudence - Mr. Prashant Jain is a B. Tech. from IIT, Kanpur, PGDM from IIM, Bangalore and CFA from AIMR,
USA. Prior to joining HDFC AMC, has worked with Zurich AMC from July1993 to June 19, 2003 as Chief Investment
Officer and from 1991 to June 1993, remained associated with SBI Mutual Fund as Fund in-charge.
Mr. Rakesh Vyas holds Bachelor degree in Electrical Engineering & PG Diploma in Business Management from XLRI,
Jamshedpur. He has over 8 years of experience of which 3 years in Application Engineering & over 5 years in Equity
Research. So, Mr. Vyas has worked with Lehman Brothers and Nomura as analyst for two & half years each before
joining HDFC Mutual Fund in October 2009.
Mr. Vyas manages more than 30 schemes.
HDFC Balanced Fund - Mr. Chirag Setalvad - discussed above.
Mr. Rakesh Vyas – discussed above.
ICICI Absolute Advantage Fund - Mr. Manish Gunwani – discussed above.
Mr. Manish Banthia is B.Com, ACA and MBA. Has 5 yrs. of experience in Fixed Income dealing & research, new
product development and corporate finance.
Mr. Banthia currently manages more than 35 schemes.
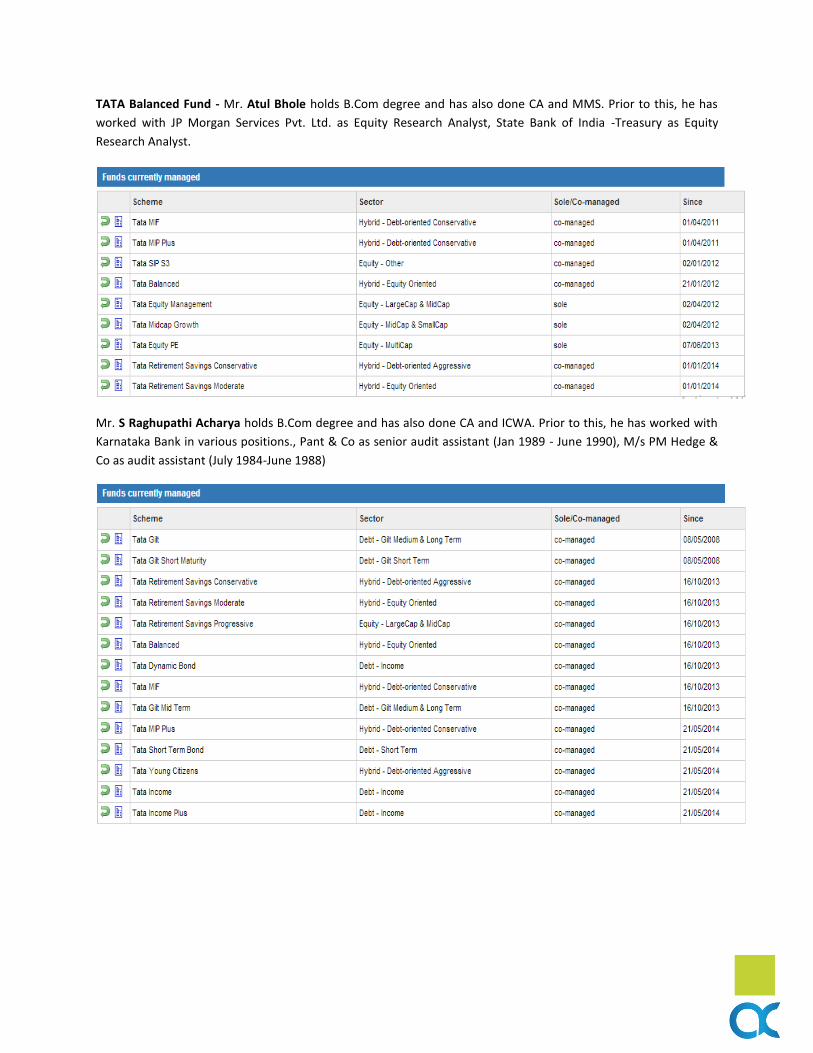
TATA Balanced Fund - Mr. Atul Bhole holds B.Com degree and has also done CA and MMS. Prior to this, he has
worked with JP Morgan Services Pvt. Ltd. as Equity Research Analyst, State Bank of India -Treasury as Equity
Research Analyst.
Mr. S Raghupathi Acharya holds B.Com degree and has also done CA and ICWA. Prior to this, he has worked with
Karnataka Bank in various positions., Pant & Co as senior audit assistant (Jan 1989 - June 1990), M/s PM Hedge &
Co as audit assistant (July 1984-June 1988)
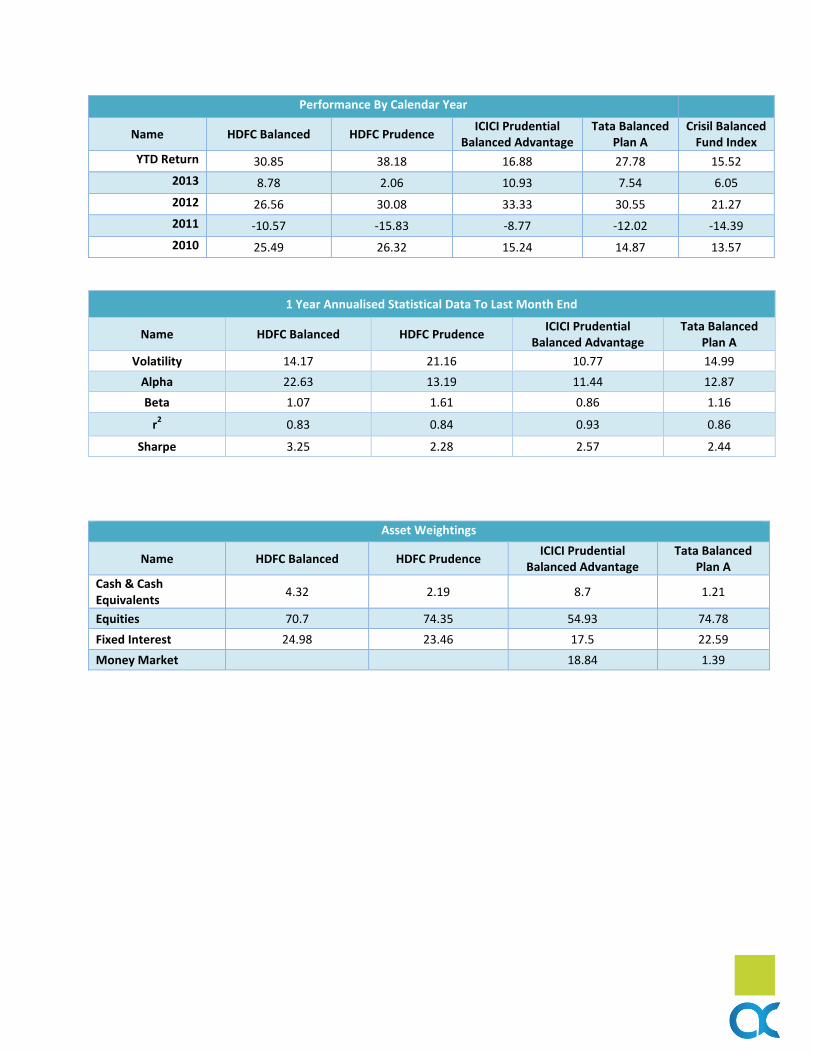
Performance By Calendar Year
Name HDFC Balanced HDFC Prudence ICICI Prudential
Balanced Advantage Tata Balanced
Plan A Crisil Balanced
Fund Index
YTD Return 30.85 38.18 16.88 27.78 15.52
2013 8.78 2.06 10.93 7.54 6.05
2012 26.56 30.08 33.33 30.55 21.27
2011 -10.57 -15.83 -8.77 -12.02 -14.39
2010 25.49 26.32 15.24 14.87 13.57
1 Year Annualised Statistical Data To Last Month End
Name HDFC Balanced HDFC Prudence ICICI Prudential
Balanced Advantage Tata Balanced
Plan A
Volatility 14.17 21.16 10.77 14.99
Alpha 22.63 13.19 11.44 12.87
Beta 1.07 1.61 0.86 1.16
r2 0.83 0.84 0.93 0.86
Sharpe 3.25 2.28 2.57 2.44
Asset Weightings
Name HDFC Balanced HDFC Prudence ICICI Prudential
Balanced Advantage Tata Balanced
Plan A
Cash & Cash Equivalents
4.32 2.19 8.7 1.21
Equities 70.7 74.35 54.93 74.78
Fixed Interest 24.98 23.46 17.5 22.59
Money Market
18.84 1.39
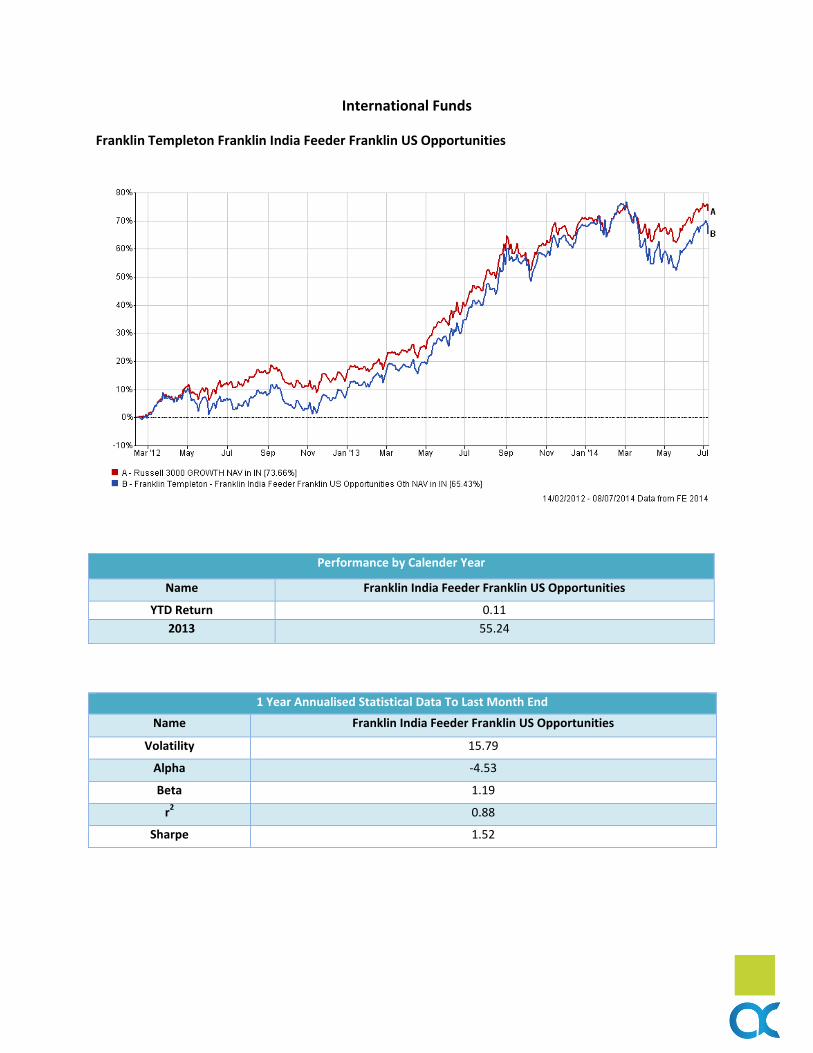
International Funds
Franklin Templeton Franklin India Feeder Franklin US Opportunities
Performance by Calender Year
Name Franklin India Feeder Franklin US Opportunities
YTD Return 0.11
2013 55.24
1 Year Annualised Statistical Data To Last Month End
Name Franklin India Feeder Franklin US Opportunities
Volatility 15.79
Alpha -4.53
Beta 1.19
r2 0.88
Sharpe 1.52
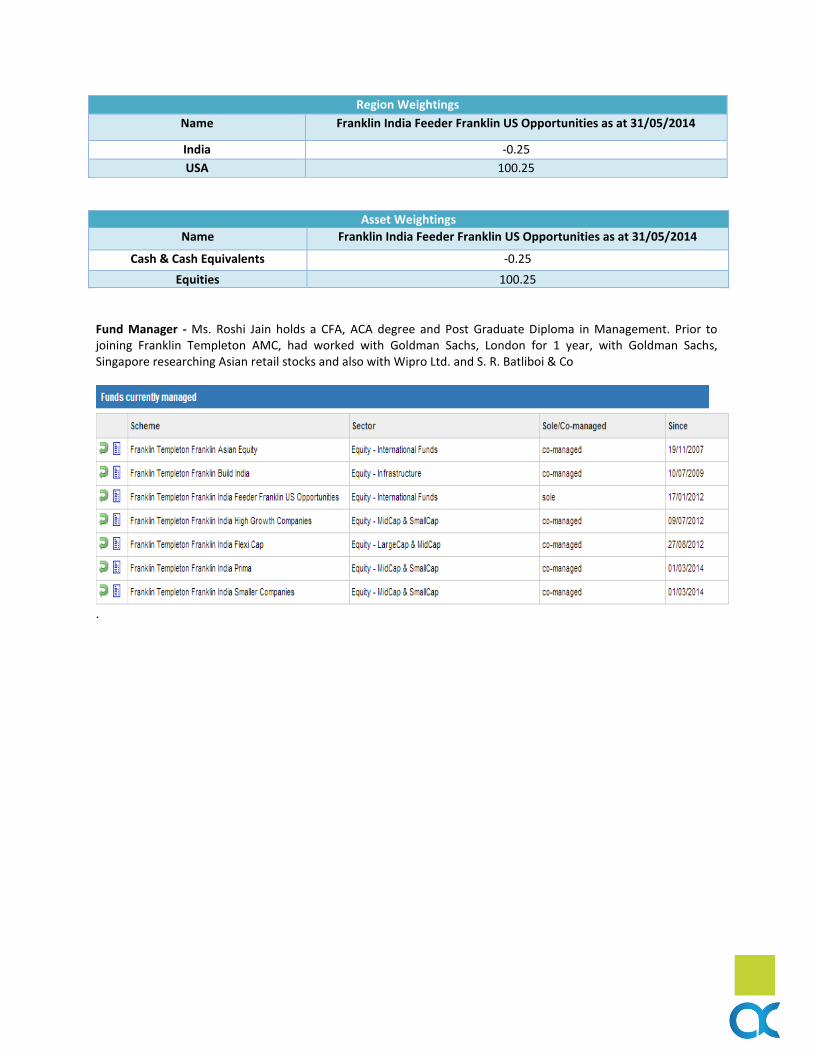
Region Weightings
Name Franklin India Feeder Franklin US Opportunities as at 31/05/2014
India -0.25
USA 100.25
Asset Weightings
Name Franklin India Feeder Franklin US Opportunities as at 31/05/2014
Cash & Cash Equivalents -0.25
Equities 100.25
Fund Manager - Ms. Roshi Jain holds a CFA, ACA degree and Post Graduate Diploma in Management. Prior to joining Franklin Templeton AMC, had worked with Goldman Sachs, London for 1 year, with Goldman Sachs, Singapore researching Asian retail stocks and also with Wipro Ltd. and S. R. Batliboi & Co
.
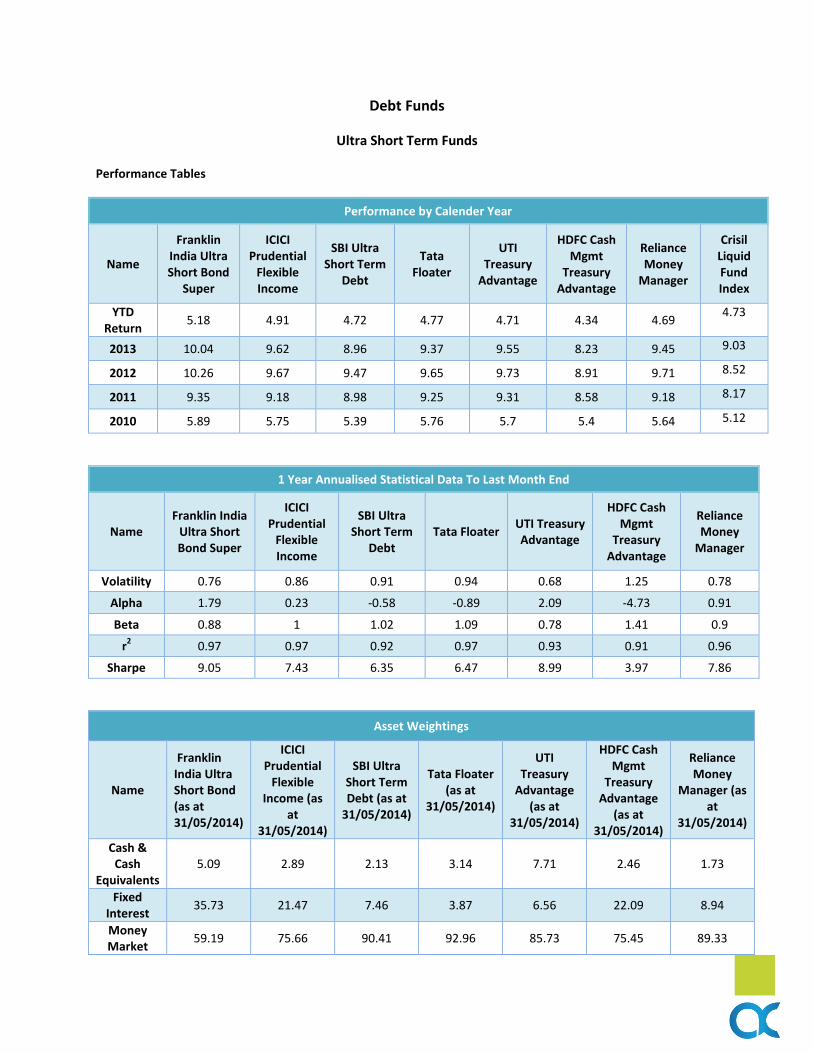
Debt Funds
Ultra Short Term Funds
Performance Tables
Performance by Calender Year
Name
Franklin India Ultra Short Bond
Super
ICICI Prudential
Flexible Income
SBI Ultra Short Term
Debt
Tata Floater
UTI Treasury
Advantage
HDFC Cash Mgmt
Treasury Advantage
Reliance Money
Manager
Crisil Liquid Fund Index
YTD Return
5.18 4.91 4.72 4.77 4.71 4.34 4.69 4.73
2013 10.04 9.62 8.96 9.37 9.55 8.23 9.45 9.03
2012 10.26 9.67 9.47 9.65 9.73 8.91 9.71 8.52
2011 9.35 9.18 8.98 9.25 9.31 8.58 9.18 8.17
2010 5.89 5.75 5.39 5.76 5.7 5.4 5.64 5.12
1 Year Annualised Statistical Data To Last Month End
Name Franklin India
Ultra Short Bond Super
ICICI Prudential
Flexible Income
SBI Ultra Short Term
Debt Tata Floater
UTI Treasury Advantage
HDFC Cash Mgmt
Treasury Advantage
Reliance Money
Manager
Volatility 0.76 0.86 0.91 0.94 0.68 1.25 0.78
Alpha 1.79 0.23 -0.58 -0.89 2.09 -4.73 0.91
Beta 0.88 1 1.02 1.09 0.78 1.41 0.9
r2 0.97 0.97 0.92 0.97 0.93 0.91 0.96
Sharpe 9.05 7.43 6.35 6.47 8.99 3.97 7.86
Asset Weightings
Name
Franklin India Ultra Short Bond (as at 31/05/2014)
ICICI Prudential
Flexible Income (as
at 31/05/2014)
SBI Ultra Short Term Debt (as at
31/05/2014)
Tata Floater (as at
31/05/2014)
UTI Treasury
Advantage (as at
31/05/2014)
HDFC Cash Mgmt
Treasury Advantage
(as at 31/05/2014)
Reliance Money
Manager (as at
31/05/2014)
Cash & Cash
Equivalents 5.09 2.89 2.13 3.14 7.71 2.46 1.73
Fixed Interest
35.73 21.47 7.46 3.87 6.56 22.09 8.94
Money Market
59.19 75.66 90.41 92.96 85.73 75.45 89.33
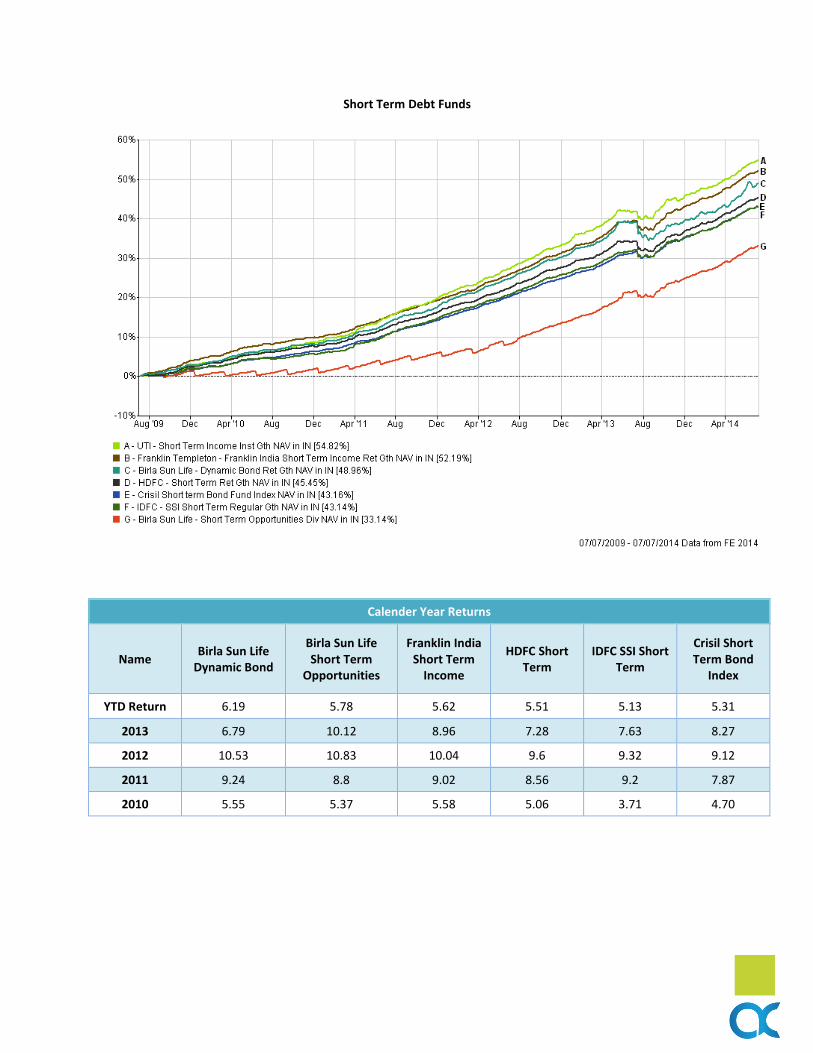
Short Term Debt Funds
Calender Year Returns
Name Birla Sun Life
Dynamic Bond
Birla Sun Life Short Term
Opportunities
Franklin India Short Term
Income
HDFC Short Term
IDFC SSI Short Term
Crisil Short Term Bond
Index
YTD Return 6.19 5.78 5.62 5.51 5.13 5.31
2013 6.79 10.12 8.96 7.28 7.63 8.27
2012 10.53 10.83 10.04 9.6 9.32 9.12
2011 9.24 8.8 9.02 8.56 9.2 7.87
2010 5.55 5.37 5.58 5.06 3.71 4.70
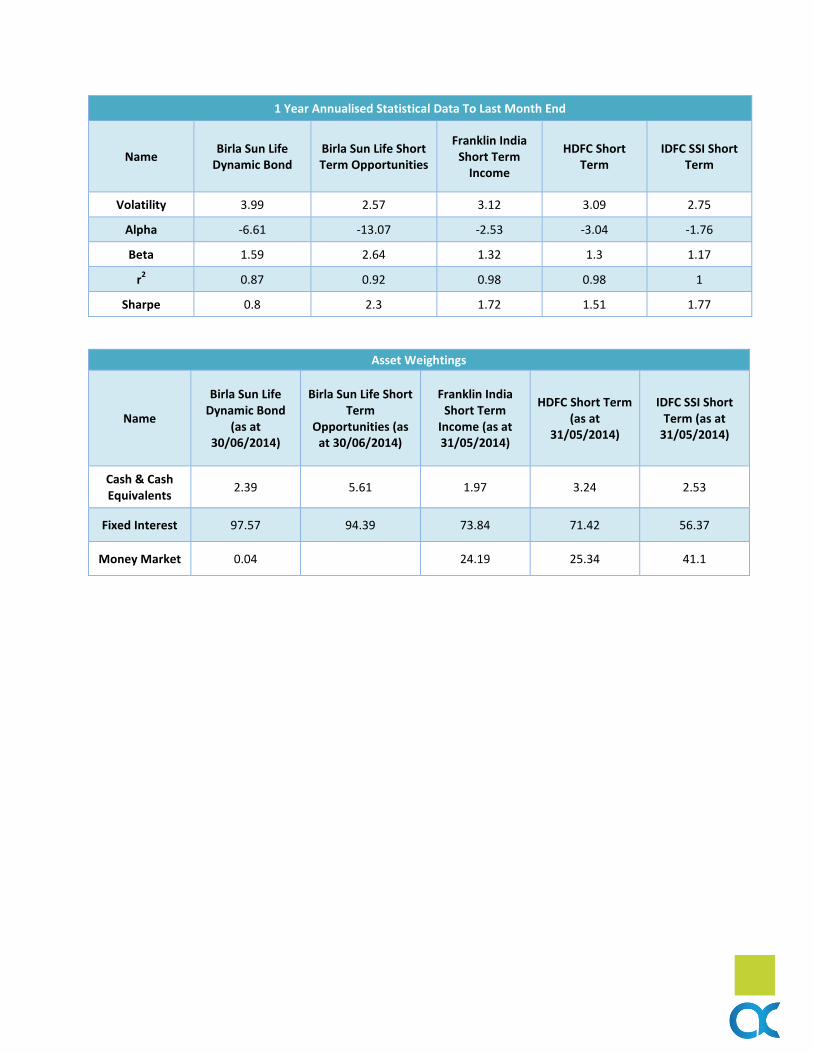
1 Year Annualised Statistical Data To Last Month End
Name Birla Sun Life
Dynamic Bond Birla Sun Life Short Term Opportunities
Franklin India Short Term
Income
HDFC Short Term
IDFC SSI Short Term
Volatility 3.99 2.57 3.12 3.09 2.75
Alpha -6.61 -13.07 -2.53 -3.04 -1.76
Beta 1.59 2.64 1.32 1.3 1.17
r2 0.87 0.92 0.98 0.98 1
Sharpe 0.8 2.3 1.72 1.51 1.77
Asset Weightings
Name
Birla Sun Life Dynamic Bond
(as at 30/06/2014)
Birla Sun Life Short Term
Opportunities (as at 30/06/2014)
Franklin India Short Term
Income (as at 31/05/2014)
HDFC Short Term (as at
31/05/2014)
IDFC SSI Short Term (as at
31/05/2014)
Cash & Cash Equivalents
2.39 5.61 1.97 3.24 2.53
Fixed Interest 97.57 94.39 73.84 71.42 56.37
Money Market 0.04
24.19 25.34 41.1
This report has been prepared by Investment Committee:
Mukesh Jindal CFA, CAIA, CFP Akhil Bhardwaj
Partner, Alpha Capital Partner, Alpha Capital
Shruti Singh Rovind Kumar
Senior Analyst, Research Desk Senior Analyst, Research Desk
Pankaj Kumar
Senior Analyst
For further queries and clarification please contact: [email protected]
Disclaimer
Mutual Fund investments are subject to market risks, read all scheme related documents carefully.
In the preparation of the material contained in this document, Alpha Capital has used information that is publicly
available, including information developed in-house. Some of the material used in the document may have been
obtained from members/persons other than the company and/or its affiliates and which may have been made
available to the company and/or to its affiliates. Information gathered and material used in this document is
believed to be from reliable sources. The company however does not warrant the accuracy, reasonableness and /
or completeness of any information. We have included statements / opinions / recommendations in this
document, which contain words, or phrases such as “will”, “expect”, “should”, “believe” and similar expressions or
variations of such expressions that are “forward looking statements”. Actual results may differ materially from
those suggested by the forward looking statements due to risk or uncertainties associated with our expectations
with respect to, but not limited to, exposure to market risks, general economic and political conditions in India and
other countries globally, which have an impact on our services and / or investments, the monetary and interest
policies of India, inflation, deflation, unanticipated turbulence in interest rates, foreign exchange rates, equity
prices or other rates or prices etc.
Alpha Capital, the Mutual Fund, The Trust and any of its officers, directors, personnel and employees, shall not
liable for any loss, damage of any nature, including but not limited to direct, indirect, punitive, special, exemplary,
consequential, as also any loss of profit in any way arising from the use of this material in any manner.