Embed Size (px)
Citation preview
QUARTERLY BANKING PROFILE Third Quarter 2016
FDIC QUARTERLY 1
INSURED INSTITUTION PERFORMANCE
Banking Industry Net Income Is $5.2 Billion Higher Than a Year EarlierCommunity Bank Revenue and Loan Growth Outpace IndustryTotal Loan Balances Rise 6.8 Percent During the Past Year
Net Income Registers Strong Increase
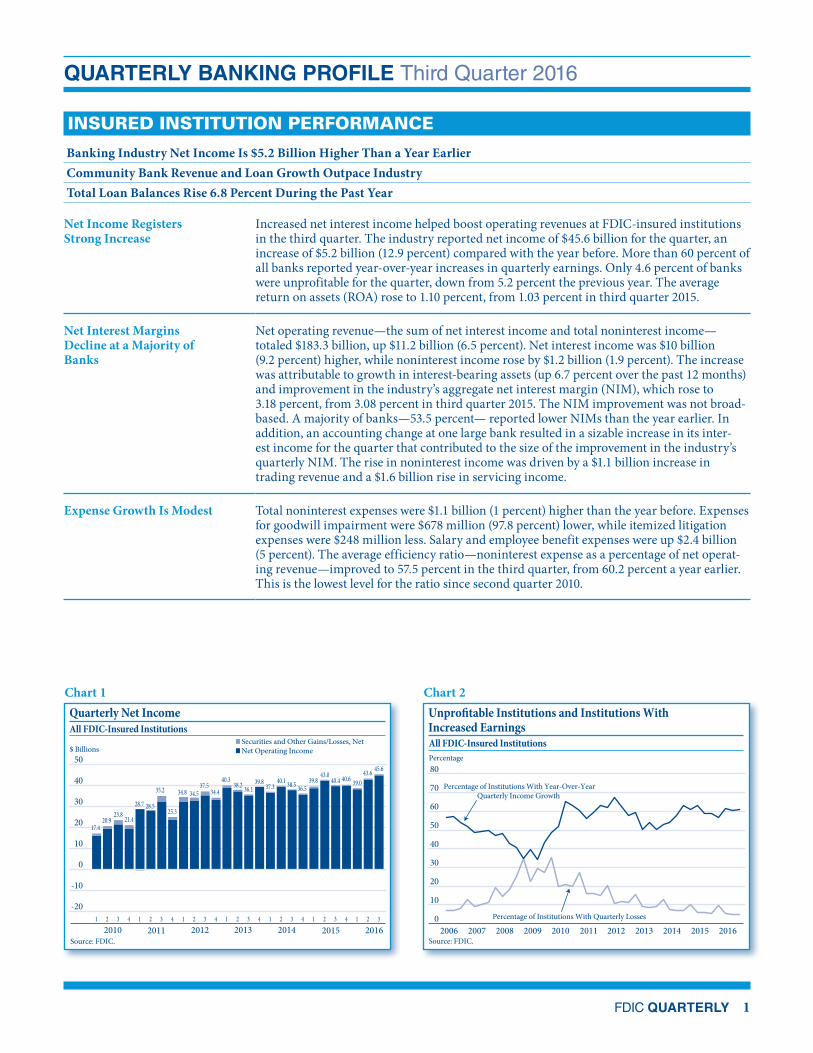
Increased net interest income helped boost operating revenues at FDIC-insured institutions in the third quarter. The industry reported net income of $45.6 billion for the quarter, an increase of $5.2 billion (12.9 percent) compared with the year before. More than 60 percent of all banks reported year-over-year increases in quarterly earnings. Only 4.6 percent of banks were unprofitable for the quarter, down from 5.2 percent the previous year. The average return on assets (ROA) rose to 1.10 percent, from 1.03 percent in third quarter 2015.
Net Interest Margins Decline at a Majority of Banks
Net operating revenue—the sum of net interest income and total noninterest income—totaled $183.3 billion, up $11.2 billion (6.5 percent). Net interest income was $10 billion (9.2 percent) higher, while noninterest income rose by $1.2 billion (1.9 percent). The increase was attributable to growth in interest-bearing assets (up 6.7 percent over the past 12 months) and improvement in the industry’s aggregate net interest margin (NIM), which rose to 3.18 percent, from 3.08 percent in third quarter 2015. The NIM improvement was not broad-based. A majority of banks—53.5 percent— reported lower NIMs than the year earlier. In addition, an accounting change at one large bank resulted in a sizable increase in its inter-est income for the quarter that contributed to the size of the improvement in the industry’s quarterly NIM. The rise in noninterest income was driven by a $1.1 billion increase in trading revenue and a $1.6 billion rise in servicing income.
Expense Growth Is Modest Total noninterest expenses were $1.1 billion (1 percent) higher than the year before. Expenses for goodwill impairment were $678 million (97.8 percent) lower, while itemized litigation expenses were $248 million less. Salary and employee benefit expenses were up $2.4 billion (5 percent). The average efficiency ratio—noninterest expense as a percentage of net operat-ing revenue—improved to 57.5 percent in the third quarter, from 60.2 percent a year earlier. This is the lowest level for the ratio since second quarter 2010.
Securities and Other Gains/Losses, NetNet Operating Income
Quarterly Net IncomeAll FDIC-Insured Institutions
$ Billions
Source: FDIC.
-20
-10
0
10
20
30
40
50
1 2 3 4 1 2 3 4 1 2 3 4 1 2 3 4 1 2 3 4 1 2 3 4 1 2 32010 2011
17.420.9
23.821.4
28.7
2012
28.5
35.2
25.3
34.8
2013
34.537.5
34.4
2014
40.338.2 36.1
39.837.3
2015
40.1 38.5 36.5
2016
39.843.0
40.4 40.6 39.043.6 45.6
Chart 1
Source: FDIC.
Percentage
Unpro�table Institutions and Institutions With Increased EarningsAll FDIC-Insured Institutions
0
10
20
30
40
50
60
70
80
2006 2007 2008 2009 2010 2011 2012 2013 2014 2015 2016
Percentage of Institutions With Year-Over-YearQuarterly Income Growth
Percentage of Institutions With Quarterly Losses
Chart 2
2016 •Volume 10 • Number 4
2 FDIC QUARTERLY
Loss Provisions Absorb a Rising Share of Revenues
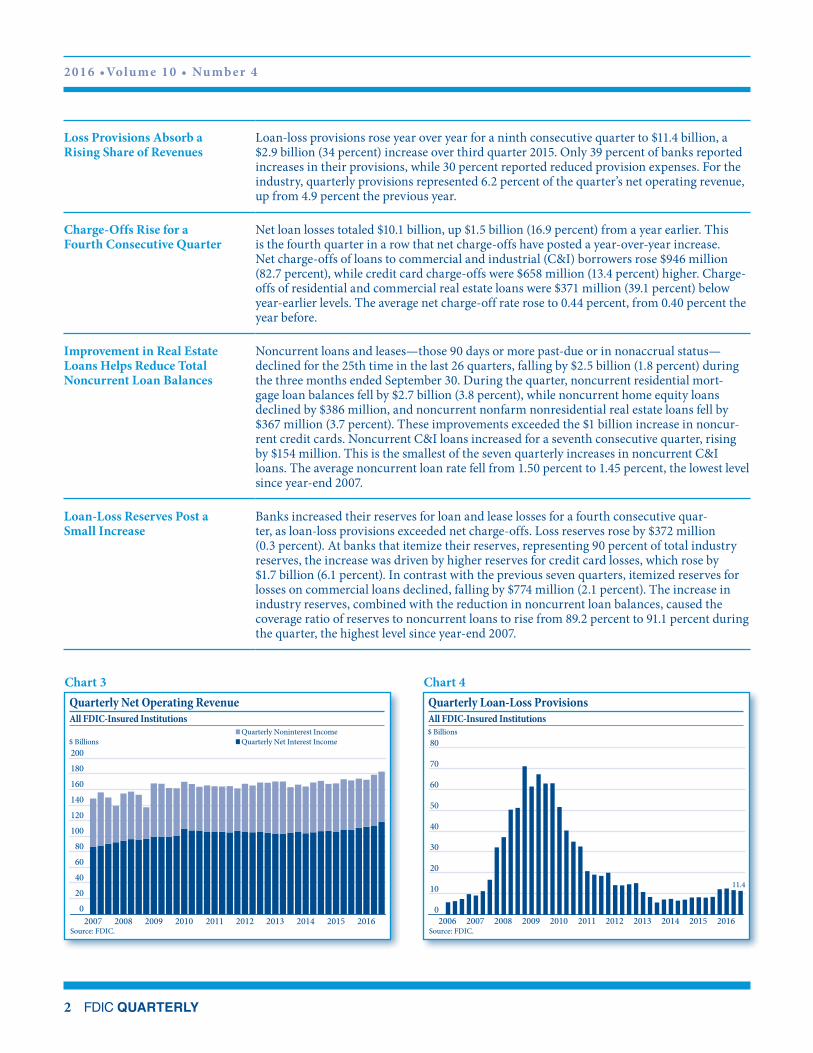
Loan-loss provisions rose year over year for a ninth consecutive quarter to $11.4 billion, a $2.9 billion (34 percent) increase over third quarter 2015. Only 39 percent of banks reported increases in their provisions, while 30 percent reported reduced provision expenses. For the industry, quarterly provisions represented 6.2 percent of the quarter’s net operating revenue, up from 4.9 percent the previous year.
Charge-Offs Rise for a Fourth Consecutive Quarter
Net loan losses totaled $10.1 billion, up $1.5 billion (16.9 percent) from a year earlier. This is the fourth quarter in a row that net charge-offs have posted a year-over-year increase. Net charge-offs of loans to commercial and industrial (C&I) borrowers rose $946 million (82.7 percent), while credit card charge-offs were $658 million (13.4 percent) higher. Charge-offs of residential and commercial real estate loans were $371 million (39.1 percent) below year-earlier levels. The average net charge-off rate rose to 0.44 percent, from 0.40 percent the year before.
Improvement in Real Estate Loans Helps Reduce Total Noncurrent Loan Balances
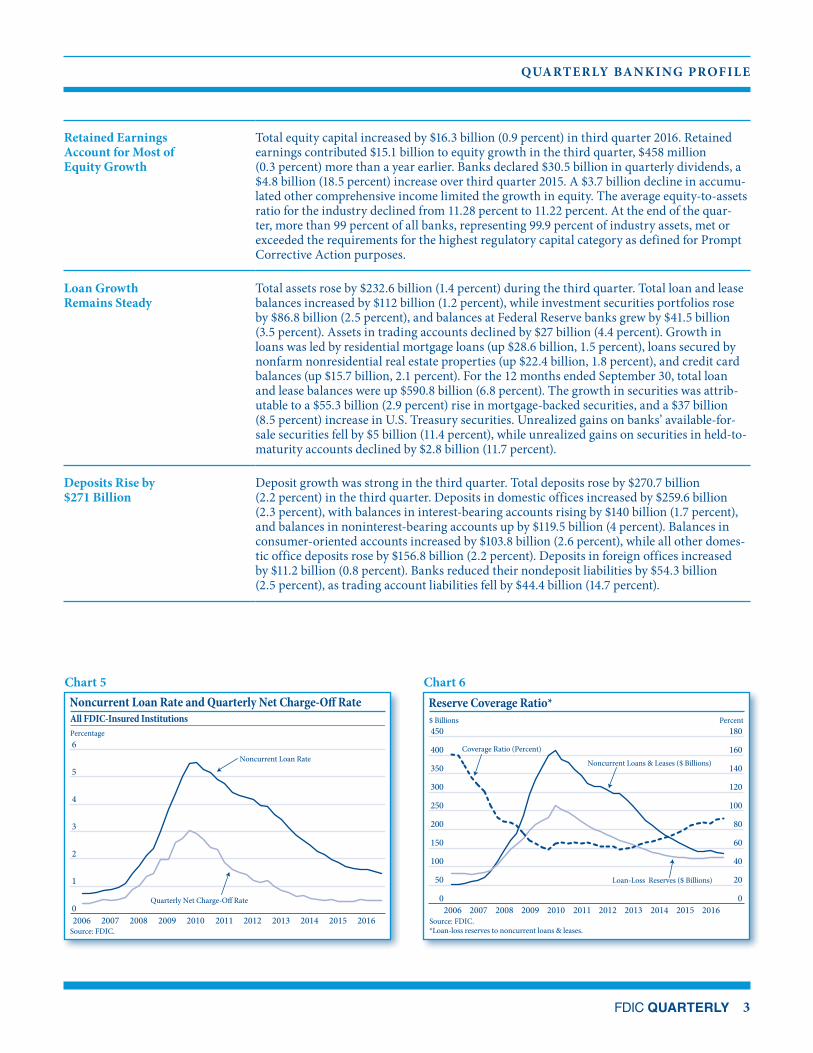
Noncurrent loans and leases—those 90 days or more past-due or in nonaccrual status—declined for the 25th time in the last 26 quarters, falling by $2.5 billion (1.8 percent) during the three months ended September 30. During the quarter, noncurrent residential mort-gage loan balances fell by $2.7 billion (3.8 percent), while noncurrent home equity loans declined by $386 million, and noncurrent nonfarm nonresidential real estate loans fell by $367 million (3.7 percent). These improvements exceeded the $1 billion increase in noncur-rent credit cards. Noncurrent C&I loans increased for a seventh consecutive quarter, rising by $154 million. This is the smallest of the seven quarterly increases in noncurrent C&I loans. The average noncurrent loan rate fell from 1.50 percent to 1.45 percent, the lowest level since year-end 2007.
Loan-Loss Reserves Post a Small Increase
Banks increased their reserves for loan and lease losses for a fourth consecutive quar-ter, as loan-loss provisions exceeded net charge-offs. Loss reserves rose by $372 million (0.3 percent). At banks that itemize their reserves, representing 90 percent of total industry reserves, the increase was driven by higher reserves for credit card losses, which rose by $1.7 billion (6.1 percent). In contrast with the previous seven quarters, itemized reserves for losses on commercial loans declined, falling by $774 million (2.1 percent). The increase in industry reserves, combined with the reduction in noncurrent loan balances, caused the coverage ratio of reserves to noncurrent loans to rise from 89.2 percent to 91.1 percent during the quarter, the highest level since year-end 2007.
Quarterly Noninterest Income Quarterly Net Interest Income
Quarterly Net Operating Revenue All FDIC-Insured Institutions
$ Billions
Source: FDIC.
020406080
100120140160180200
2007 2008 2009 2010 2011 2012 2013 2014 2015 2016
Chart 3Quarterly Loan-Loss ProvisionsAll FDIC-Insured Institutions$ Billions
Source: FDIC.
11.4
0
10
20
30
40
50
60
70
80
2006 2007 2008 2009 2010 2011 2012 2013 2014 2015 2016
Chart 4
QUARTERLY BANKING PROFILE
FDIC QUARTERLY 3
Retained Earnings Account for Most of Equity Growth
Total equity capital increased by $16.3 billion (0.9 percent) in third quarter 2016. Retained earnings contributed $15.1 billion to equity growth in the third quarter, $458 million (0.3 percent) more than a year earlier. Banks declared $30.5 billion in quarterly dividends, a $4.8 billion (18.5 percent) increase over third quarter 2015. A $3.7 billion decline in accumu-lated other comprehensive income limited the growth in equity. The average equity-to-assets ratio for the industry declined from 11.28 percent to 11.22 percent. At the end of the quar-ter, more than 99 percent of all banks, representing 99.9 percent of industry assets, met or exceeded the requirements for the highest regulatory capital category as defined for Prompt Corrective Action purposes.
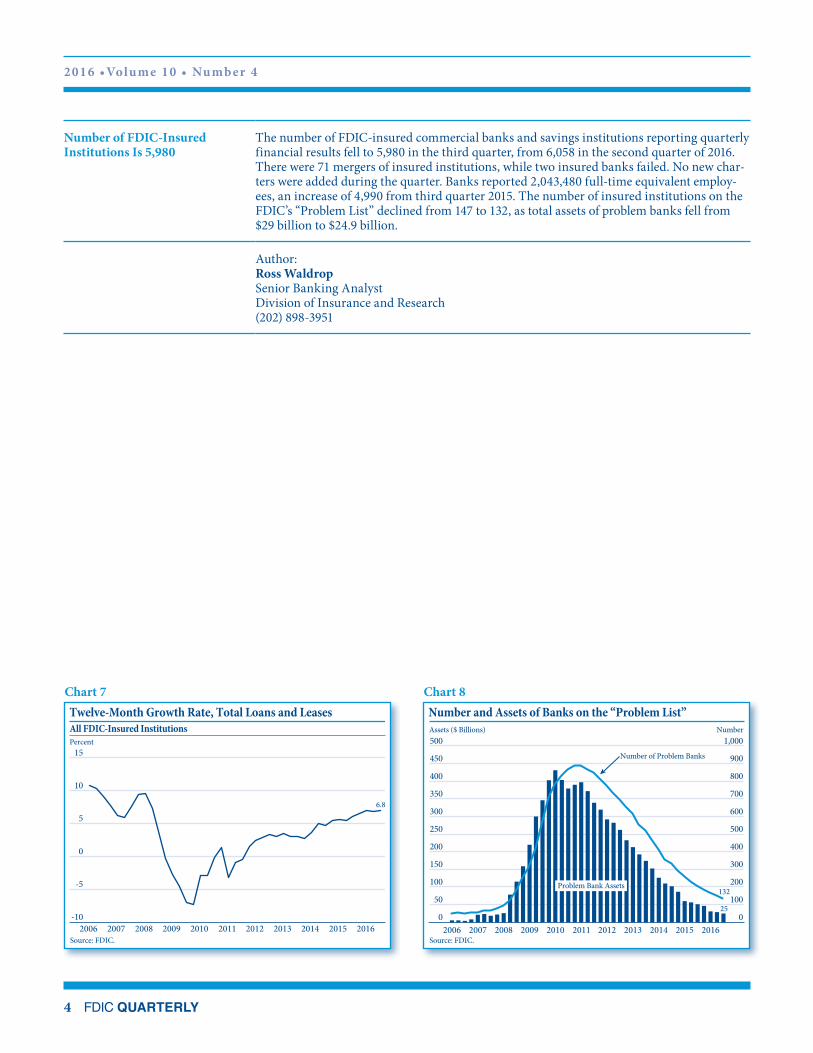
Loan Growth Remains Steady
Total assets rose by $232.6 billion (1.4 percent) during the third quarter. Total loan and lease balances increased by $112 billion (1.2 percent), while investment securities portfolios rose by $86.8 billion (2.5 percent), and balances at Federal Reserve banks grew by $41.5 billion (3.5 percent). Assets in trading accounts declined by $27 billion (4.4 percent). Growth in loans was led by residential mortgage loans (up $28.6 billion, 1.5 percent), loans secured by nonfarm nonresidential real estate properties (up $22.4 billion, 1.8 percent), and credit card balances (up $15.7 billion, 2.1 percent). For the 12 months ended September 30, total loan and lease balances were up $590.8 billion (6.8 percent). The growth in securities was attrib-utable to a $55.3 billion (2.9 percent) rise in mortgage-backed securities, and a $37 billion (8.5 percent) increase in U.S. Treasury securities. Unrealized gains on banks’ available-for-sale securities fell by $5 billion (11.4 percent), while unrealized gains on securities in held-to-maturity accounts declined by $2.8 billion (11.7 percent).
Deposits Rise by $271 Billion
Deposit growth was strong in the third quarter. Total deposits rose by $270.7 billion (2.2 percent) in the third quarter. Deposits in domestic offices increased by $259.6 billion (2.3 percent), with balances in interest-bearing accounts rising by $140 billion (1.7 percent), and balances in noninterest-bearing accounts up by $119.5 billion (4 percent). Balances in consumer-oriented accounts increased by $103.8 billion (2.6 percent), while all other domes-tic office deposits rose by $156.8 billion (2.2 percent). Deposits in foreign offices increased by $11.2 billion (0.8 percent). Banks reduced their nondeposit liabilities by $54.3 billion (2.5 percent), as trading account liabilities fell by $44.4 billion (14.7 percent).
Source: FDIC.
Percentage
Noncurrent Loan Rate and Quarterly Net Charge-O RateAll FDIC-Insured Institutions
0
1
2
3
4
5
6
2006 2007 2008 2009 2010 2011 2012 2013 2014 2015 2016
Noncurrent Loan Rate
Quarterly Net Charge-O� Rate
Chart 5
Source: FDIC.*Loan-loss reserves to noncurrent loans & leases.
$ Billions Percent
Reserve Coverage Ratio*
0
50
100
150
200
250
300
350
400
450
2006 2007 2008 2009 2010 2011 2012 2013 2014 2015 20160
20
40
60
80
100
120
140
160
180
Noncurrent Loans & Leases ($ Billions)
Loan-Loss Reserves ($ Billions)
Coverage Ratio (Percent)
Chart 6
2016 •Volume 10 • Number 4
4 FDIC QUARTERLY
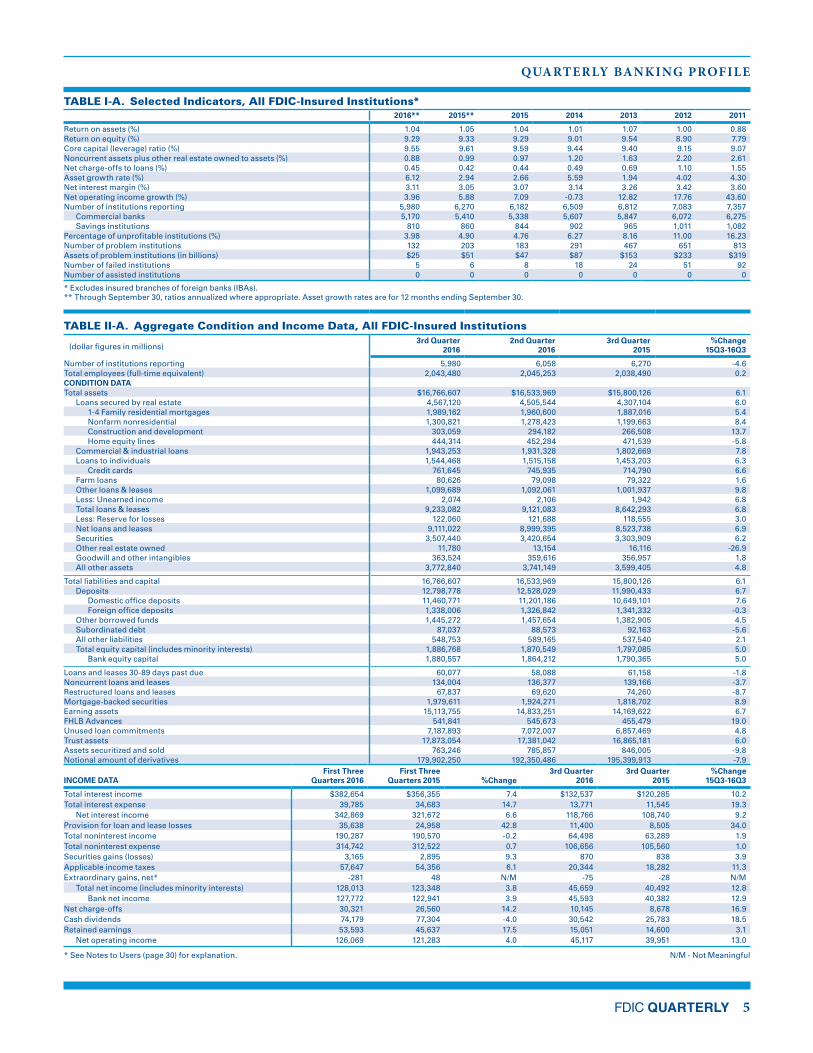
Number of FDIC-Insured Institutions Is 5,980
The number of FDIC-insured commercial banks and savings institutions reporting quarterly financial results fell to 5,980 in the third quarter, from 6,058 in the second quarter of 2016. There were 71 mergers of insured institutions, while two insured banks failed. No new char-ters were added during the quarter. Banks reported 2,043,480 full-time equivalent employ-ees, an increase of 4,990 from third quarter 2015. The number of insured institutions on the FDIC’s “Problem List” declined from 147 to 132, as total assets of problem banks fell from $29 billion to $24.9 billion.
Author: Ross Waldrop Senior Banking Analyst Division of Insurance and Research (202) 898-3951
Twelve-Month Growth Rate, Total Loans and LeasesAll FDIC-Insured InstitutionsPercent
Source: FDIC.
6.8
-10
-5
0
5
10
15
2006 2007 2008 2009 2010 2011 2012 2013 2014 2015 2016
Chart 7
Source: FDIC.
Assets ($ Billions) Number
Number and Assets of Banks on the “Problem List”
0
50
100
150
200
250
300
350
400
450
500
0
100
200
300
400
500
600
700
800
900
1,000
132
25
2006 2007 2008 2009 2010 2011 2012 2013 2014 2015 2016
Problem Bank Assets
Number of Problem Banks
Chart 8
QUARTERLY BANKING PROFILE
FDIC QUARTERLY 5
TABLE I-A. Selected Indicators, All FDIC-Insured Institutions*2016** 2015** 2015 2014 2013 2012 2011
Return on assets (%) 1.04 1.05 1.04 1.01 1.07 1.00 0.88Return on equity (%) 9.29 9.33 9.29 9.01 9.54 8.90 7.79Core capital (leverage) ratio (%) 9.55 9.61 9.59 9.44 9.40 9.15 9.07Noncurrent assets plus other real estate owned to assets (%) 0.88 0.99 0.97 1.20 1.63 2.20 2.61Net charge-offs to loans (%) 0.45 0.42 0.44 0.49 0.69 1.10 1.55Asset growth rate (%) 6.12 2.94 2.66 5.59 1.94 4.02 4.30Net interest margin (%) 3.11 3.05 3.07 3.14 3.26 3.42 3.60Net operating income growth (%) 3.96 5.88 7.09 -0.73 12.82 17.76 43.60Number of institutions reporting 5,980 6,270 6,182 6,509 6,812 7,083 7,357 Commercial banks 5,170 5,410 5,338 5,607 5,847 6,072 6,275 Savings institutions 810 860 844 902 965 1,011 1,082Percentage of unprofitable institutions (%) 3.98 4.90 4.76 6.27 8.16 11.00 16.23Number of problem institutions 132 203 183 291 467 651 813Assets of problem institutions (in billions) $25 $51 $47 $87 $153 $233 $319Number of failed institutions 5 6 8 18 24 51 92Number of assisted institutions 0 0 0 0 0 0 0
* Excludes insured branches of foreign banks (IBAs).** Through September 30, ratios annualized where appropriate. Asset growth rates are for 12 months ending September 30.
TABLE II-A. Aggregate Condition and Income Data, All FDIC-Insured Institutions
(dollar figures in millions) 3rd Quarter
20162nd Quarter
20163rd Quarter
2015%Change
15Q3-16Q3
Number of institutions reporting 5,980 6,058 6,270 -4.6Total employees (full-time equivalent) 2,043,480 2,045,253 2,038,490 0.2CONDITION DATATotal assets $16,766,607 $16,533,969 $15,800,126 6.1 Loans secured by real estate 4,567,120 4,505,544 4,307,104 6.0 1-4 Family residential mortgages 1,989,162 1,960,600 1,887,016 5.4 Nonfarm nonresidential 1,300,821 1,278,423 1,199,663 8.4 Construction and development 303,059 294,182 266,508 13.7 Home equity lines 444,314 452,284 471,539 -5.8 Commercial & industrial loans 1,943,253 1,931,328 1,802,669 7.8 Loans to individuals 1,544,468 1,515,158 1,453,203 6.3 Credit cards 761,645 745,935 714,790 6.6 Farm loans 80,626 79,098 79,322 1.6 Other loans & leases 1,099,689 1,092,061 1,001,937 9.8 Less: Unearned income 2,074 2,106 1,942 6.8 Total loans & leases 9,233,082 9,121,083 8,642,293 6.8 Less: Reserve for losses 122,060 121,688 118,555 3.0 Net loans and leases 9,111,022 8,999,395 8,523,738 6.9 Securities 3,507,440 3,420,654 3,303,909 6.2 Other real estate owned 11,780 13,154 16,116 -26.9 Goodwill and other intangibles 363,524 359,616 356,957 1.8 All other assets 3,772,840 3,741,149 3,599,405 4.8
Total liabilities and capital 16,766,607 16,533,969 15,800,126 6.1 Deposits 12,798,778 12,528,029 11,990,433 6.7 Domestic office deposits 11,460,771 11,201,186 10,649,101 7.6 Foreign office deposits 1,338,006 1,326,842 1,341,332 -0.3 Other borrowed funds 1,445,272 1,457,654 1,382,905 4.5 Subordinated debt 87,037 88,573 92,163 -5.6 All other liabilities 548,753 589,165 537,540 2.1 Total equity capital (includes minority interests) 1,886,768 1,870,549 1,797,085 5.0 Bank equity capital 1,880,557 1,864,212 1,790,365 5.0
Loans and leases 30-89 days past due 60,077 58,088 61,158 -1.8Noncurrent loans and leases 134,004 136,377 139,166 -3.7Restructured loans and leases 67,837 69,620 74,260 -8.7Mortgage-backed securities 1,979,611 1,924,271 1,818,702 8.9Earning assets 15,113,755 14,833,251 14,169,622 6.7FHLB Advances 541,841 545,673 455,479 19.0Unused loan commitments 7,187,893 7,072,007 6,857,469 4.8Trust assets 17,873,054 17,381,042 16,865,181 6.0Assets securitized and sold 763,246 785,857 846,005 -9.8Notional amount of derivatives 179,902,250 192,350,486 195,399,913 -7.9
INCOME DATAFirst Three
Quarters 2016First Three
Quarters 2015 %Change3rd Quarter
20163rd Quarter
2015%Change
15Q3-16Q3
Total interest income $382,654 $356,355 7.4 $132,537 $120,285 10.2Total interest expense 39,785 34,683 14.7 13,771 11,545 19.3 Net interest income 342,869 321,672 6.6 118,766 108,740 9.2Provision for loan and lease losses 35,638 24,958 42.8 11,400 8,505 34.0Total noninterest income 190,287 190,570 -0.2 64,498 63,289 1.9Total noninterest expense 314,742 312,522 0.7 106,656 105,560 1.0Securities gains (losses) 3,165 2,895 9.3 870 838 3.9Applicable income taxes 57,647 54,356 6.1 20,344 18,282 11.3Extraordinary gains, net* -281 48 N/M -75 -28 N/M Total net income (includes minority interests) 128,013 123,348 3.8 45,659 40,492 12.8 Bank net income 127,772 122,941 3.9 45,593 40,382 12.9Net charge-offs 30,321 26,560 14.2 10,145 8,678 16.9Cash dividends 74,179 77,304 -4.0 30,542 25,783 18.5Retained earnings 53,593 45,637 17.5 15,051 14,600 3.1 Net operating income 126,069 121,283 4.0 45,117 39,951 13.0
* See Notes to Users (page 30) for explanation. N/M - Not Meaningful
2016 •Volume 10 • Number 4
6 FDIC QUARTERLY
TABLE III-A. Third Quarter 2016, All FDIC-Insured InstitutionsAsset Concentration Groups*
THIRD QUARTER (The way it is...)
All Insured Institutions
Credit Card
BanksInternational
BanksAgricultural
BanksCommercial
LendersMortgage
LendersConsumer
Lenders
Other Specialized <$1 Billion
All Other <$1 Billion
All Other >$1 Billion
Number of institutions reporting 5,980 13 5 1,461 3,013 478 62 304 584 60 Commercial banks 5,170 12 5 1,444 2,708 116 47 278 506 54 Savings institutions 810 1 0 17 305 362 15 26 78 6Total assets (in billions) $16,766.6 $500.8 $4,145.8 $273.5 $5,678.8 $386.8 $205.5 $54.6 $103.3 $5,417.7 Commercial banks 15,637.2 431.2 4,145.8 267.4 5,186.5 145.7 100.1 49.7 86.8 5,223.9 Savings institutions 1,129.4 69.5 0.0 6.1 492.3 241.1 105.3 4.9 16.4 193.8Total deposits (in billions) 12,798.8 261.7 2,992.1 224.1 4,465.5 310.2 171.8 43.8 86.8 4,242.9 Commercial banks 11,907.5 208.3 2,992.1 220.8 4,096.3 123.6 83.6 40.5 73.4 4,069.0 Savings institutions 891.3 53.4 0.0 3.3 369.2 186.7 88.2 3.3 13.4 173.9Bank net income (in millions) 45,593 2,833 9,274 880 14,147 994 519 362 244 16,341 Commercial banks 42,234 2,336 9,274 845 12,741 459 297 177 218 15,888 Savings institutions 3,359 498 0 35 1,406 535 222 185 26 453
Performance Ratios (annualized, %)Yield on earning assets 3.55 11.77 2.70 4.22 3.69 3.19 4.13 2.95 3.98 3.20Cost of funding earning assets 0.37 1.22 0.36 0.49 0.40 0.43 0.46 0.32 0.41 0.25 Net interest margin 3.18 10.54 2.35 3.73 3.29 2.76 3.66 2.63 3.58 2.95Noninterest income to assets 1.55 2.61 1.76 0.71 1.34 1.12 1.55 6.69 1.00 1.55Noninterest expense to assets 2.57 5.46 2.37 2.57 2.74 2.28 2.93 5.52 3.09 2.23Loan and lease loss provision to assets 0.27 3.30 0.17 0.13 0.17 -0.04 0.54 0.05 0.10 0.21Net operating income to assets 1.09 2.26 0.89 1.26 1.00 1.01 1.02 2.58 0.91 1.21Pretax return on assets 1.59 3.55 1.29 1.53 1.43 1.55 1.61 3.64 1.18 1.79Return on assets 1.10 2.26 0.90 1.29 1.01 1.04 1.02 2.66 0.95 1.22Return on equity 9.76 15.08 9.17 11.14 8.40 9.12 10.11 17.21 7.90 10.90Net charge-offs to loans and leases 0.44 3.11 0.48 0.09 0.23 0.04 0.66 0.16 0.19 0.41Loan and lease loss provision to net charge-offs 112.37 137.38 98.89 210.80 107.76 -165.92 116.37 104.23 94.59 98.68Efficiency ratio 57.45 43.63 61.66 60.98 62.85 60.53 56.70 60.59 71.23 51.86% of unprofitable institutions 4.58 0.00 0.00 1.85 5.04 7.11 0.00 5.92 7.19 1.67% of institutions with earnings gains 60.80 53.85 80.00 55.65 65.78 56.07 66.13 54.61 53.25 73.33
Structural Changes New reporters 0 0 0 0 0 0 0 0 0 0 Institutions absorbed by mergers 71 0 0 12 48 4 0 1 6 0 Failed institutions 2 0 0 0 1 0 0 0 1 0
PRIOR THIRD QUARTERS (The way it was...)
Return on assets (%) 2015 1.03 2.83 0.84 0.37 1.00 0.57 1.08 2.55 0.76 1.08 2013 0.99 3.38 0.52 1.24 0.99 0.92 1.04 1.98 0.85 1.07 2011 1.03 3.04 1.07 1.28 0.77 0.76 2.08 2.12 1.06 0.99
Net charge-offs to loans & leases (%) 2015 0.40 2.61 0.49 0.08 0.20 0.12 0.58 0.19 0.18 0.37 2013 0.60 2.91 0.86 0.09 0.35 0.30 0.68 0.46 0.31 0.42 2011 1.46 5.07 1.68 0.41 1.14 0.77 1.56 0.27 0.54 1.27
* See Table V-A (page 10) for explanations.
QUARTERLY BANKING PROFILE
FDIC QUARTERLY 7
TABLE III-A. Third Quarter 2016, All FDIC-Insured Institutions Asset Size Distribution Geographic Regions*
THIRD QUARTER (The way it is...)
All Insured Institutions
Less Than $100
Million
$100 Million to $1 Billion
$1 Billion to $10 Billion
$10 Billion to $250 Billion
Greater Than $250
BillionNew York Atlanta Chicago
Kansas City Dallas
San Francisco
Number of institutions reporting 5,980 1,589 3,656 621 104 10 731 731 1,287 1,500 1,280 451 Commercial banks 5,170 1,397 3,169 506 88 10 379 661 1,075 1,444 1,198 413 Savings institutions 810 192 487 115 16 0 352 70 212 56 82 38Total assets (in billions) $16,766.6 $94.1 $1,171.8 $1,741.0 $4,983.0 $8,776.7 $3,158.5 $3,478.0 $3,785.5 $3,644.3 $1,001.6 $1,698.8 Commercial banks 15,637.2 83.1 993.1 1,427.6 4,356.6 8,776.7 2,725.0 3,393.5 3,672.9 3,585.3 878.8 1,381.7 Savings institutions 1,129.4 10.9 178.7 313.4 626.4 0.0 433.5 84.5 112.6 59.0 122.8 317.1Total deposits (in billions) 12,798.8 78.4 972.2 1,379.9 3,798.8 6,569.5 2,377.3 2,722.8 2,797.1 2,711.7 820.5 1,369.4 Commercial banks 11,907.5 69.9 830.5 1,141.5 3,296.0 6,569.5 2,051.4 2,655.5 2,715.8 2,665.6 718.7 1,100.4 Savings institutions 891.3 8.5 141.6 238.4 502.8 0.0 325.9 67.4 81.3 46.1 101.8 268.9Bank net income (in millions) 45,593 226 3,282 4,755 13,475 23,854 6,793 10,833 9,274 9,944 2,867 5,883 Commercial banks 42,234 199 2,789 4,078 11,315 23,854 5,983 10,634 8,912 9,812 2,491 4,402 Savings institutions 3,359 28 494 677 2,160 0 810 199 361 132 376 1,481
Performance Ratios (annualized, %)Yield on earning assets 3.55 4.16 4.16 4.04 3.99 3.09 3.52 3.88 2.78 3.64 3.99 4.10Cost of funding earning assets 0.37 0.44 0.46 0.43 0.45 0.29 0.44 0.31 0.30 0.42 0.33 0.40 Net interest margin 3.18 3.71 3.69 3.61 3.54 2.80 3.08 3.57 2.48 3.22 3.66 3.70Noninterest income to assets 1.55 1.23 1.26 1.26 1.51 1.68 1.34 1.49 1.91 1.33 1.46 1.81Noninterest expense to assets 2.57 3.46 3.18 2.82 2.65 2.38 2.52 2.54 2.59 2.40 3.10 2.70Loan and lease loss provision to assets 0.27 0.11 0.12 0.21 0.47 0.20 0.32 0.34 0.11 0.27 0.22 0.45Net operating income to assets 1.09 0.93 1.10 1.09 1.08 1.09 0.86 1.25 0.99 1.07 1.15 1.38Pretax return on assets 1.59 1.13 1.42 1.57 1.64 1.59 1.25 1.82 1.42 1.58 1.53 2.14Return on assets 1.10 0.97 1.13 1.11 1.09 1.10 0.86 1.25 1.00 1.10 1.16 1.40Return on equity 9.76 7.37 9.84 9.39 8.95 10.38 7.19 10.09 9.73 10.85 10.36 11.55Net charge-offs to loans and leases 0.44 0.15 0.12 0.23 0.62 0.43 0.50 0.51 0.27 0.47 0.28 0.58Loan and lease loss provision to net charge-offs 112.37 126.25 152.17 130.95 120.91 97.95 117.02 111.95 86.49 110.81 118.17 128.21Efficiency ratio 57.45 74.23 67.64 60.96 55.13 56.46 60.73 53.45 62.53 55.74 63.66 50.87% of unprofitable institutions 4.58 9.31 3.17 1.45 0.96 0.00 5.34 7.52 5.75 2.73 3.36 4.88% of institutions with earnings gains 60.80 51.98 61.82 75.20 73.08 70.00 63.47 64.02 61.77 58.60 57.42 65.41
Structural Changes New reporters 0 0 0 0 0 0 0 0 0 0 0 0 Institutions absorbed by mergers 71 29 33 8 1 0 9 10 13 18 14 7 Failed institutions 2 2 0 0 0 0 0 1 0 0 1 0
PRIOR THIRD QUARTERS (The way it was…)Return on assets (%) 2015 1.03 0.95 1.05 1.10 1.00 1.02 0.89 1.02 0.92 1.16 1.15 1.18 2013 0.99 0.73 0.92 1.16 1.11 0.90 1.06 0.94 0.53 1.25 1.06 1.54 2011 1.03 0.61 0.65 0.91 1.11 1.09 0.97 0.76 0.96 1.26 1.06 1.46
Net charge-offs to loans & leases (%) 2015 0.40 0.16 0.15 0.22 0.52 0.42 0.43 0.44 0.27 0.46 0.24 0.51 2013 0.60 0.28 0.34 0.31 0.80 0.59 0.81 0.55 0.46 0.75 0.28 0.50 2011 1.46 0.63 0.92 1.00 1.89 1.42 1.79 1.70 1.02 1.66 0.88 1.05
* See Table V-A (page 11) for explanations.
2016 •Volume 10 • Number 4
8 FDIC QUARTERLY
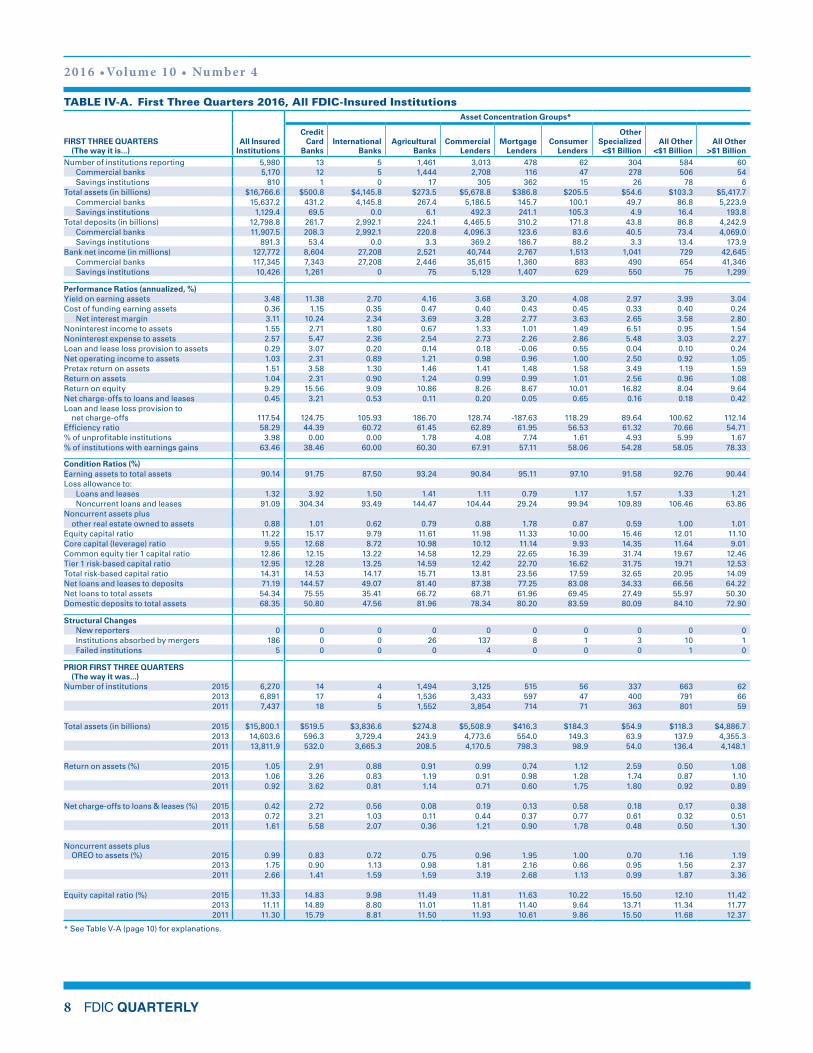
TABLE IV-A. First Three Quarters 2016, All FDIC-Insured InstitutionsAsset Concentration Groups*
FIRST THREE QUARTERS (The way it is...)
All Insured Institutions
Credit Card
BanksInternational
BanksAgricultural
BanksCommercial
LendersMortgage
LendersConsumer
Lenders
Other Specialized <$1 Billion
All Other <$1 Billion
All Other >$1 Billion
Number of institutions reporting 5,980 13 5 1,461 3,013 478 62 304 584 60 Commercial banks 5,170 12 5 1,444 2,708 116 47 278 506 54 Savings institutions 810 1 0 17 305 362 15 26 78 6Total assets (in billions) $16,766.6 $500.8 $4,145.8 $273.5 $5,678.8 $386.8 $205.5 $54.6 $103.3 $5,417.7 Commercial banks 15,637.2 431.2 4,145.8 267.4 5,186.5 145.7 100.1 49.7 86.8 5,223.9 Savings institutions 1,129.4 69.5 0.0 6.1 492.3 241.1 105.3 4.9 16.4 193.8Total deposits (in billions) 12,798.8 261.7 2,992.1 224.1 4,465.5 310.2 171.8 43.8 86.8 4,242.9 Commercial banks 11,907.5 208.3 2,992.1 220.8 4,096.3 123.6 83.6 40.5 73.4 4,069.0 Savings institutions 891.3 53.4 0.0 3.3 369.2 186.7 88.2 3.3 13.4 173.9Bank net income (in millions) 127,772 8,604 27,208 2,521 40,744 2,767 1,513 1,041 729 42,645 Commercial banks 117,345 7,343 27,208 2,446 35,615 1,360 883 490 654 41,346 Savings institutions 10,426 1,261 0 75 5,129 1,407 629 550 75 1,299
Performance Ratios (annualized, %)Yield on earning assets 3.48 11.38 2.70 4.16 3.68 3.20 4.08 2.97 3.99 3.04Cost of funding earning assets 0.36 1.15 0.35 0.47 0.40 0.43 0.45 0.33 0.40 0.24 Net interest margin 3.11 10.24 2.34 3.69 3.28 2.77 3.63 2.65 3.58 2.80Noninterest income to assets 1.55 2.71 1.80 0.67 1.33 1.01 1.49 6.51 0.95 1.54Noninterest expense to assets 2.57 5.47 2.36 2.54 2.73 2.26 2.86 5.48 3.03 2.27Loan and lease loss provision to assets 0.29 3.07 0.20 0.14 0.18 -0.06 0.55 0.04 0.10 0.24Net operating income to assets 1.03 2.31 0.89 1.21 0.98 0.96 1.00 2.50 0.92 1.05Pretax return on assets 1.51 3.58 1.30 1.46 1.41 1.48 1.58 3.49 1.19 1.59Return on assets 1.04 2.31 0.90 1.24 0.99 0.99 1.01 2.56 0.96 1.08Return on equity 9.29 15.56 9.09 10.86 8.26 8.67 10.01 16.82 8.04 9.64Net charge-offs to loans and leases 0.45 3.21 0.53 0.11 0.20 0.05 0.65 0.16 0.18 0.42Loan and lease loss provision to net charge-offs 117.54 124.75 105.93 186.70 128.74 -187.63 118.29 89.64 100.62 112.14Efficiency ratio 58.29 44.39 60.72 61.45 62.89 61.95 56.53 61.32 70.66 54.71% of unprofitable institutions 3.98 0.00 0.00 1.78 4.08 7.74 1.61 4.93 5.99 1.67% of institutions with earnings gains 63.46 38.46 60.00 60.30 67.91 57.11 58.06 54.28 58.05 78.33
Condition Ratios (%)Earning assets to total assets 90.14 91.75 87.50 93.24 90.84 95.11 97.10 91.58 92.76 90.44Loss allowance to: Loans and leases 1.32 3.92 1.50 1.41 1.11 0.79 1.17 1.57 1.33 1.21 Noncurrent loans and leases 91.09 304.34 93.49 144.47 104.44 29.24 99.94 109.89 106.46 63.86Noncurrent assets plus other real estate owned to assets 0.88 1.01 0.62 0.79 0.88 1.78 0.87 0.59 1.00 1.01Equity capital ratio 11.22 15.17 9.79 11.61 11.98 11.33 10.00 15.46 12.01 11.10Core capital (leverage) ratio 9.55 12.68 8.72 10.98 10.12 11.14 9.93 14.35 11.64 9.01Common equity tier 1 capital ratio 12.86 12.15 13.22 14.58 12.29 22.65 16.39 31.74 19.67 12.46Tier 1 risk-based capital ratio 12.95 12.28 13.25 14.59 12.42 22.70 16.62 31.75 19.71 12.53Total risk-based capital ratio 14.31 14.53 14.17 15.71 13.81 23.56 17.59 32.65 20.95 14.09Net loans and leases to deposits 71.19 144.57 49.07 81.40 87.38 77.25 83.08 34.33 66.56 64.22Net loans to total assets 54.34 75.55 35.41 66.72 68.71 61.96 69.45 27.49 55.97 50.30Domestic deposits to total assets 68.35 50.80 47.56 81.96 78.34 80.20 83.59 80.09 84.10 72.90
Structural Changes New reporters 0 0 0 0 0 0 0 0 0 0 Institutions absorbed by mergers 186 0 0 26 137 8 1 3 10 1 Failed institutions 5 0 0 0 4 0 0 0 1 0
PRIOR FIRST THREE QUARTERS (The way it was...)
Number of institutions 2015 6,270 14 4 1,494 3,125 515 56 337 663 62 2013 6,891 17 4 1,536 3,433 597 47 400 791 66 2011 7,437 18 5 1,552 3,854 714 71 363 801 59
Total assets (in billions) 2015 $15,800.1 $519.5 $3,836.6 $274.8 $5,508.9 $416.3 $184.3 $54.9 $118.3 $4,886.7 2013 14,603.6 596.3 3,729.4 243.9 4,773.6 554.0 149.3 63.9 137.9 4,355.3 2011 13,811.9 532.0 3,665.3 208.5 4,170.5 798.3 98.9 54.0 136.4 4,148.1
Return on assets (%) 2015 1.05 2.91 0.88 0.91 0.99 0.74 1.12 2.59 0.50 1.08 2013 1.06 3.26 0.83 1.19 0.91 0.98 1.28 1.74 0.87 1.10 2011 0.92 3.62 0.81 1.14 0.71 0.60 1.75 1.80 0.92 0.89
Net charge-offs to loans & leases (%) 2015 0.42 2.72 0.56 0.08 0.19 0.13 0.58 0.18 0.17 0.38 2013 0.72 3.21 1.03 0.11 0.44 0.37 0.77 0.61 0.32 0.51 2011 1.61 5.58 2.07 0.36 1.21 0.90 1.78 0.48 0.50 1.30
Noncurrent assets plus OREO to assets (%) 2015 0.99 0.83 0.72 0.75 0.96 1.95 1.00 0.70 1.16 1.19 2013 1.75 0.90 1.13 0.98 1.81 2.16 0.66 0.95 1.56 2.37 2011 2.66 1.41 1.59 1.59 3.19 2.68 1.13 0.99 1.87 3.36
Equity capital ratio (%) 2015 11.33 14.83 9.98 11.49 11.81 11.63 10.22 15.50 12.10 11.42 2013 11.11 14.89 8.80 11.01 11.81 11.40 9.64 13.71 11.34 11.77 2011 11.30 15.79 8.81 11.50 11.93 10.61 9.86 15.50 11.68 12.37
* See Table V-A (page 10) for explanations.
QUARTERLY BANKING PROFILE
FDIC QUARTERLY 9
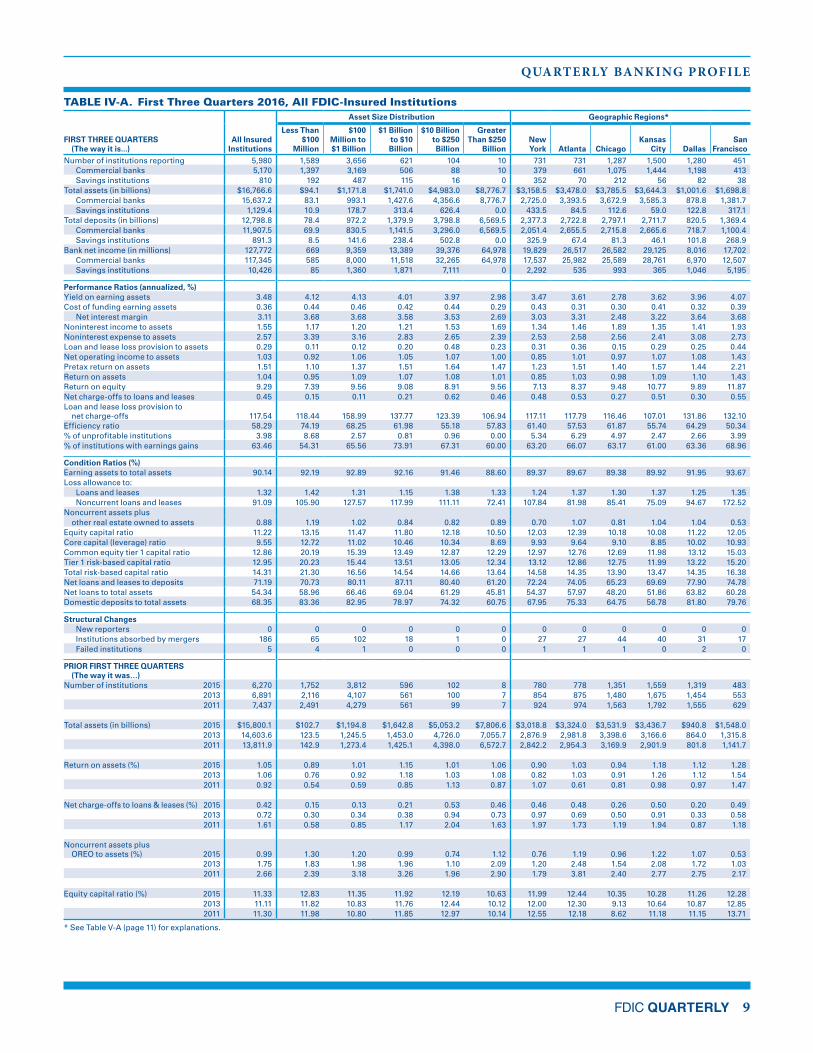
TABLE IV-A. First Three Quarters 2016, All FDIC-Insured Institutions Asset Size Distribution Geographic Regions*
FIRST THREE QUARTERS (The way it is...)
All Insured Institutions
Less Than $100
Million
$100 Million to $1 Billion
$1 Billion to $10 Billion
$10 Billion to $250 Billion
Greater Than $250
BillionNew York Atlanta Chicago
Kansas City Dallas
San Francisco
Number of institutions reporting 5,980 1,589 3,656 621 104 10 731 731 1,287 1,500 1,280 451 Commercial banks 5,170 1,397 3,169 506 88 10 379 661 1,075 1,444 1,198 413 Savings institutions 810 192 487 115 16 0 352 70 212 56 82 38Total assets (in billions) $16,766.6 $94.1 $1,171.8 $1,741.0 $4,983.0 $8,776.7 $3,158.5 $3,478.0 $3,785.5 $3,644.3 $1,001.6 $1,698.8 Commercial banks 15,637.2 83.1 993.1 1,427.6 4,356.6 8,776.7 2,725.0 3,393.5 3,672.9 3,585.3 878.8 1,381.7 Savings institutions 1,129.4 10.9 178.7 313.4 626.4 0.0 433.5 84.5 112.6 59.0 122.8 317.1Total deposits (in billions) 12,798.8 78.4 972.2 1,379.9 3,798.8 6,569.5 2,377.3 2,722.8 2,797.1 2,711.7 820.5 1,369.4 Commercial banks 11,907.5 69.9 830.5 1,141.5 3,296.0 6,569.5 2,051.4 2,655.5 2,715.8 2,665.6 718.7 1,100.4 Savings institutions 891.3 8.5 141.6 238.4 502.8 0.0 325.9 67.4 81.3 46.1 101.8 268.9Bank net income (in millions) 127,772 669 9,359 13,389 39,376 64,978 19,829 26,517 26,582 29,125 8,016 17,702 Commercial banks 117,345 585 8,000 11,518 32,265 64,978 17,537 25,982 25,589 28,761 6,970 12,507 Savings institutions 10,426 85 1,360 1,871 7,111 0 2,292 535 993 365 1,046 5,195
Performance Ratios (annualized, %)Yield on earning assets 3.48 4.12 4.13 4.01 3.97 2.98 3.47 3.61 2.78 3.62 3.96 4.07Cost of funding earning assets 0.36 0.44 0.46 0.42 0.44 0.29 0.43 0.31 0.30 0.41 0.32 0.39 Net interest margin 3.11 3.68 3.68 3.58 3.53 2.69 3.03 3.31 2.48 3.22 3.64 3.68Noninterest income to assets 1.55 1.17 1.20 1.21 1.53 1.69 1.34 1.46 1.89 1.35 1.41 1.93Noninterest expense to assets 2.57 3.39 3.16 2.83 2.65 2.39 2.53 2.58 2.56 2.41 3.08 2.73Loan and lease loss provision to assets 0.29 0.11 0.12 0.20 0.48 0.23 0.31 0.36 0.15 0.29 0.25 0.44Net operating income to assets 1.03 0.92 1.06 1.05 1.07 1.00 0.85 1.01 0.97 1.07 1.08 1.43Pretax return on assets 1.51 1.10 1.37 1.51 1.64 1.47 1.23 1.51 1.40 1.57 1.44 2.21Return on assets 1.04 0.95 1.09 1.07 1.08 1.01 0.85 1.03 0.98 1.09 1.10 1.43Return on equity 9.29 7.39 9.56 9.08 8.91 9.56 7.13 8.37 9.48 10.77 9.89 11.87Net charge-offs to loans and leases 0.45 0.15 0.11 0.21 0.62 0.46 0.48 0.53 0.27 0.51 0.30 0.55Loan and lease loss provision to net charge-offs 117.54 118.44 158.99 137.77 123.39 106.94 117.11 117.79 116.46 107.01 131.86 132.10Efficiency ratio 58.29 74.19 68.25 61.98 55.18 57.83 61.40 57.53 61.87 55.74 64.29 50.34% of unprofitable institutions 3.98 8.68 2.57 0.81 0.96 0.00 5.34 6.29 4.97 2.47 2.66 3.99% of institutions with earnings gains 63.46 54.31 65.56 73.91 67.31 60.00 63.20 66.07 63.17 61.00 63.36 68.96
Condition Ratios (%)Earning assets to total assets 90.14 92.19 92.89 92.16 91.46 88.60 89.37 89.67 89.38 89.92 91.95 93.67Loss allowance to: Loans and leases 1.32 1.42 1.31 1.15 1.38 1.33 1.24 1.37 1.30 1.37 1.25 1.35 Noncurrent loans and leases 91.09 105.90 127.57 117.99 111.11 72.41 107.84 81.98 85.41 75.09 94.67 172.52Noncurrent assets plus other real estate owned to assets 0.88 1.19 1.02 0.84 0.82 0.89 0.70 1.07 0.81 1.04 1.04 0.53Equity capital ratio 11.22 13.15 11.47 11.80 12.18 10.50 12.03 12.39 10.18 10.08 11.22 12.05Core capital (leverage) ratio 9.55 12.72 11.02 10.46 10.34 8.69 9.93 9.64 9.10 8.85 10.02 10.93Common equity tier 1 capital ratio 12.86 20.19 15.39 13.49 12.87 12.29 12.97 12.76 12.69 11.98 13.12 15.03Tier 1 risk-based capital ratio 12.95 20.23 15.44 13.51 13.05 12.34 13.12 12.86 12.75 11.99 13.22 15.20Total risk-based capital ratio 14.31 21.30 16.56 14.54 14.66 13.64 14.58 14.35 13.90 13.47 14.35 16.38Net loans and leases to deposits 71.19 70.73 80.11 87.11 80.40 61.20 72.24 74.05 65.23 69.69 77.90 74.78Net loans to total assets 54.34 58.96 66.46 69.04 61.29 45.81 54.37 57.97 48.20 51.86 63.82 60.28Domestic deposits to total assets 68.35 83.36 82.95 78.97 74.32 60.75 67.95 75.33 64.75 56.78 81.80 79.76
Structural Changes New reporters 0 0 0 0 0 0 0 0 0 0 0 0 Institutions absorbed by mergers 186 65 102 18 1 0 27 27 44 40 31 17 Failed institutions 5 4 1 0 0 0 1 1 1 0 2 0
PRIOR FIRST THREE QUARTERS (The way it was…)Number of institutions 2015 6,270 1,752 3,812 596 102 8 780 778 1,351 1,559 1,319 483 2013 6,891 2,116 4,107 561 100 7 854 875 1,480 1,675 1,454 553 2011 7,437 2,491 4,279 561 99 7 924 974 1,563 1,792 1,555 629
Total assets (in billions) 2015 $15,800.1 $102.7 $1,194.8 $1,642.8 $5,053.2 $7,806.6 $3,018.8 $3,324.0 $3,531.9 $3,436.7 $940.8 $1,548.0 2013 14,603.6 123.5 1,245.5 1,453.0 4,726.0 7,055.7 2,876.9 2,981.8 3,398.6 3,166.6 864.0 1,315.8 2011 13,811.9 142.9 1,273.4 1,425.1 4,398.0 6,572.7 2,842.2 2,954.3 3,169.9 2,901.9 801.8 1,141.7
Return on assets (%) 2015 1.05 0.89 1.01 1.15 1.01 1.06 0.90 1.03 0.94 1.18 1.12 1.28 2013 1.06 0.76 0.92 1.18 1.03 1.08 0.82 1.03 0.91 1.26 1.12 1.54 2011 0.92 0.54 0.59 0.85 1.13 0.87 1.07 0.61 0.81 0.98 0.97 1.47
Net charge-offs to loans & leases (%) 2015 0.42 0.15 0.13 0.21 0.53 0.46 0.46 0.48 0.26 0.50 0.20 0.49 2013 0.72 0.30 0.34 0.38 0.94 0.73 0.97 0.69 0.50 0.91 0.33 0.58 2011 1.61 0.58 0.85 1.17 2.04 1.63 1.97 1.73 1.19 1.94 0.87 1.18
Noncurrent assets plus OREO to assets (%) 2015 0.99 1.30 1.20 0.99 0.74 1.12 0.76 1.19 0.96 1.22 1.07 0.53 2013 1.75 1.83 1.98 1.96 1.10 2.09 1.20 2.48 1.54 2.08 1.72 1.03 2011 2.66 2.39 3.18 3.26 1.96 2.90 1.79 3.81 2.40 2.77 2.75 2.17
Equity capital ratio (%) 2015 11.33 12.83 11.35 11.92 12.19 10.63 11.99 12.44 10.35 10.28 11.26 12.28 2013 11.11 11.82 10.83 11.76 12.44 10.12 12.00 12.30 9.13 10.64 10.87 12.85 2011 11.30 11.98 10.80 11.85 12.97 10.14 12.55 12.18 8.62 11.18 11.15 13.71
* See Table V-A (page 11) for explanations.
2016 •Volume 10 • Number 4
10 FDIC QUARTERLY
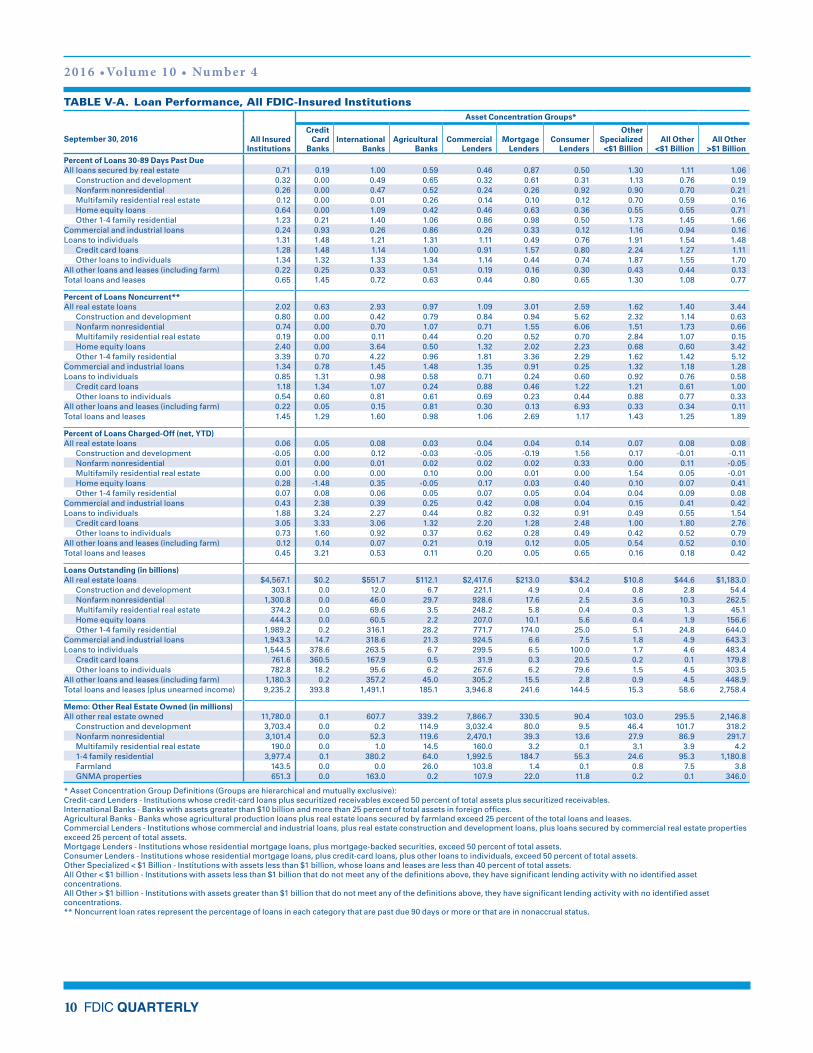
TABLE V-A. Loan Performance, All FDIC-Insured InstitutionsAsset Concentration Groups*
September 30, 2016 All Insured Institutions
Credit Card
BanksInternational
BanksAgricultural
BanksCommercial
LendersMortgage
LendersConsumer
Lenders
Other Specialized <$1 Billion
All Other <$1 Billion
All Other >$1 Billion
Percent of Loans 30-89 Days Past DueAll loans secured by real estate 0.71 0.19 1.00 0.59 0.46 0.87 0.50 1.30 1.11 1.06 Construction and development 0.32 0.00 0.49 0.65 0.32 0.61 0.31 1.13 0.76 0.19 Nonfarm nonresidential 0.26 0.00 0.47 0.52 0.24 0.26 0.92 0.90 0.70 0.21 Multifamily residential real estate 0.12 0.00 0.01 0.26 0.14 0.10 0.12 0.70 0.59 0.16 Home equity loans 0.64 0.00 1.09 0.42 0.46 0.63 0.36 0.55 0.55 0.71 Other 1-4 family residential 1.23 0.21 1.40 1.06 0.86 0.98 0.50 1.73 1.45 1.66Commercial and industrial loans 0.24 0.93 0.26 0.86 0.26 0.33 0.12 1.16 0.94 0.16Loans to individuals 1.31 1.48 1.21 1.31 1.11 0.49 0.76 1.91 1.54 1.48 Credit card loans 1.28 1.48 1.14 1.00 0.91 1.57 0.80 2.24 1.27 1.11 Other loans to individuals 1.34 1.32 1.33 1.34 1.14 0.44 0.74 1.87 1.55 1.70All other loans and leases (including farm) 0.22 0.25 0.33 0.51 0.19 0.16 0.30 0.43 0.44 0.13Total loans and leases 0.65 1.45 0.72 0.63 0.44 0.80 0.65 1.30 1.08 0.77
Percent of Loans Noncurrent**All real estate loans 2.02 0.63 2.93 0.97 1.09 3.01 2.59 1.62 1.40 3.44 Construction and development 0.80 0.00 0.42 0.79 0.84 0.94 5.62 2.32 1.14 0.63 Nonfarm nonresidential 0.74 0.00 0.70 1.07 0.71 1.55 6.06 1.51 1.73 0.66 Multifamily residential real estate 0.19 0.00 0.11 0.44 0.20 0.52 0.70 2.84 1.07 0.15 Home equity loans 2.40 0.00 3.64 0.50 1.32 2.02 2.23 0.68 0.60 3.42 Other 1-4 family residential 3.39 0.70 4.22 0.96 1.81 3.36 2.29 1.62 1.42 5.12Commercial and industrial loans 1.34 0.78 1.45 1.48 1.35 0.91 0.25 1.32 1.18 1.28Loans to individuals 0.85 1.31 0.98 0.58 0.71 0.24 0.60 0.92 0.76 0.58 Credit card loans 1.18 1.34 1.07 0.24 0.88 0.46 1.22 1.21 0.61 1.00 Other loans to individuals 0.54 0.60 0.81 0.61 0.69 0.23 0.44 0.88 0.77 0.33All other loans and leases (including farm) 0.22 0.05 0.15 0.81 0.30 0.13 6.93 0.33 0.34 0.11Total loans and leases 1.45 1.29 1.60 0.98 1.06 2.69 1.17 1.43 1.25 1.89
Percent of Loans Charged-Off (net, YTD)All real estate loans 0.06 0.05 0.08 0.03 0.04 0.04 0.14 0.07 0.08 0.08 Construction and development -0.05 0.00 0.12 -0.03 -0.05 -0.19 1.56 0.17 -0.01 -0.11 Nonfarm nonresidential 0.01 0.00 0.01 0.02 0.02 0.02 0.33 0.00 0.11 -0.05 Multifamily residential real estate 0.00 0.00 0.00 0.10 0.00 0.01 0.00 1.54 0.05 -0.01 Home equity loans 0.28 -1.48 0.35 -0.05 0.17 0.03 0.40 0.10 0.07 0.41 Other 1-4 family residential 0.07 0.08 0.06 0.05 0.07 0.05 0.04 0.04 0.09 0.08Commercial and industrial loans 0.43 2.38 0.39 0.25 0.42 0.08 0.04 0.15 0.41 0.42Loans to individuals 1.88 3.24 2.27 0.44 0.82 0.32 0.91 0.49 0.55 1.54 Credit card loans 3.05 3.33 3.06 1.32 2.20 1.28 2.48 1.00 1.80 2.76 Other loans to individuals 0.73 1.60 0.92 0.37 0.62 0.28 0.49 0.42 0.52 0.79All other loans and leases (including farm) 0.12 0.14 0.07 0.21 0.19 0.12 0.05 0.54 0.52 0.10Total loans and leases 0.45 3.21 0.53 0.11 0.20 0.05 0.65 0.16 0.18 0.42
Loans Outstanding (in billions)All real estate loans $4,567.1 $0.2 $551.7 $112.1 $2,417.6 $213.0 $34.2 $10.8 $44.6 $1,183.0 Construction and development 303.1 0.0 12.0 6.7 221.1 4.9 0.4 0.8 2.8 54.4 Nonfarm nonresidential 1,300.8 0.0 46.0 29.7 928.6 17.6 2.5 3.6 10.3 262.5 Multifamily residential real estate 374.2 0.0 69.6 3.5 248.2 5.8 0.4 0.3 1.3 45.1 Home equity loans 444.3 0.0 60.5 2.2 207.0 10.1 5.6 0.4 1.9 156.6 Other 1-4 family residential 1,989.2 0.2 316.1 28.2 771.7 174.0 25.0 5.1 24.8 644.0Commercial and industrial loans 1,943.3 14.7 318.6 21.3 924.5 6.6 7.5 1.8 4.9 643.3Loans to individuals 1,544.5 378.6 263.5 6.7 299.5 6.5 100.0 1.7 4.6 483.4 Credit card loans 761.6 360.5 167.9 0.5 31.9 0.3 20.5 0.2 0.1 179.8 Other loans to individuals 782.8 18.2 95.6 6.2 267.6 6.2 79.6 1.5 4.5 303.5All other loans and leases (including farm) 1,180.3 0.2 357.2 45.0 305.2 15.5 2.8 0.9 4.5 448.9Total loans and leases (plus unearned income) 9,235.2 393.8 1,491.1 185.1 3,946.8 241.6 144.5 15.3 58.6 2,758.4
Memo: Other Real Estate Owned (in millions)All other real estate owned 11,780.0 0.1 607.7 339.2 7,866.7 330.5 90.4 103.0 295.5 2,146.8 Construction and development 3,703.4 0.0 0.2 114.9 3,032.4 80.0 9.5 46.4 101.7 318.2 Nonfarm nonresidential 3,101.4 0.0 52.3 119.6 2,470.1 39.3 13.6 27.9 86.9 291.7 Multifamily residential real estate 190.0 0.0 1.0 14.5 160.0 3.2 0.1 3.1 3.9 4.2 1-4 family residential 3,977.4 0.1 380.2 64.0 1,992.5 184.7 55.3 24.6 95.3 1,180.8 Farmland 143.5 0.0 0.0 26.0 103.8 1.4 0.1 0.8 7.5 3.8 GNMA properties 651.3 0.0 163.0 0.2 107.9 22.0 11.8 0.2 0.1 346.0
* Asset Concentration Group Definitions (Groups are hierarchical and mutually exclusive):Credit-card Lenders - Institutions whose credit-card loans plus securitized receivables exceed 50 percent of total assets plus securitized receivables.International Banks - Banks with assets greater than $10 billion and more than 25 percent of total assets in foreign offices.Agricultural Banks - Banks whose agricultural production loans plus real estate loans secured by farmland exceed 25 percent of the total loans and leases.Commercial Lenders - Institutions whose commercial and industrial loans, plus real estate construction and development loans, plus loans secured by commercial real estate properties exceed 25 percent of total assets.Mortgage Lenders - Institutions whose residential mortgage loans, plus mortgage-backed securities, exceed 50 percent of total assets.Consumer Lenders - Institutions whose residential mortgage loans, plus credit-card loans, plus other loans to individuals, exceed 50 percent of total assets.Other Specialized < $1 Billion - Institutions with assets less than $1 billion, whose loans and leases are less than 40 percent of total assets.All Other < $1 billion - Institutions with assets less than $1 billion that do not meet any of the definitions above, they have significant lending activity with no identified asset concentrations.All Other > $1 billion - Institutions with assets greater than $1 billion that do not meet any of the definitions above, they have significant lending activity with no identified asset concentrations.** Noncurrent loan rates represent the percentage of loans in each category that are past due 90 days or more or that are in nonaccrual status.
QUARTERLY BANKING PROFILE
FDIC QUARTERLY 11
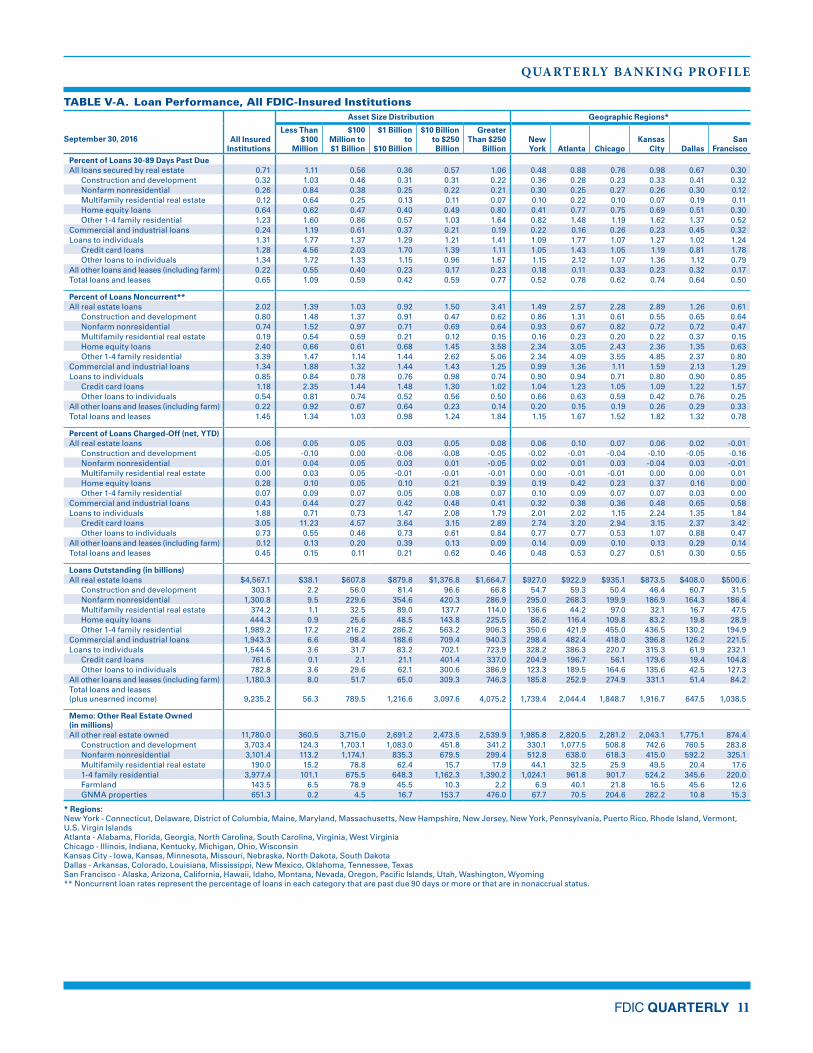
TABLE V-A. Loan Performance, All FDIC-Insured InstitutionsAsset Size Distribution Geographic Regions*
September 30, 2016 All Insured Institutions
Less Than $100
Million
$100 Million to $1 Billion
$1 Billion to
$10 Billion
$10 Billion to $250 Billion
Greater Than $250
BillionNew York Atlanta Chicago
Kansas City Dallas
San Francisco
Percent of Loans 30-89 Days Past Due All loans secured by real estate 0.71 1.11 0.56 0.36 0.57 1.06 0.48 0.88 0.76 0.98 0.67 0.30 Construction and development 0.32 1.03 0.46 0.31 0.31 0.22 0.36 0.28 0.23 0.33 0.41 0.32 Nonfarm nonresidential 0.26 0.84 0.38 0.25 0.22 0.21 0.30 0.25 0.27 0.26 0.30 0.12 Multifamily residential real estate 0.12 0.64 0.25 0.13 0.11 0.07 0.10 0.22 0.10 0.07 0.19 0.11 Home equity loans 0.64 0.62 0.47 0.40 0.49 0.80 0.41 0.77 0.75 0.69 0.51 0.30 Other 1-4 family residential 1.23 1.60 0.86 0.57 1.03 1.64 0.82 1.48 1.19 1.62 1.37 0.52Commercial and industrial loans 0.24 1.19 0.61 0.37 0.21 0.19 0.22 0.16 0.26 0.23 0.45 0.32Loans to individuals 1.31 1.77 1.37 1.29 1.21 1.41 1.09 1.77 1.07 1.27 1.02 1.24 Credit card loans 1.28 4.56 2.03 1.70 1.39 1.11 1.05 1.43 1.05 1.19 0.81 1.78 Other loans to individuals 1.34 1.72 1.33 1.15 0.96 1.67 1.15 2.12 1.07 1.36 1.12 0.79All other loans and leases (including farm) 0.22 0.55 0.40 0.23 0.17 0.23 0.18 0.11 0.33 0.23 0.32 0.17Total loans and leases 0.65 1.09 0.59 0.42 0.59 0.77 0.52 0.78 0.62 0.74 0.64 0.50
Percent of Loans Noncurrent** All real estate loans 2.02 1.39 1.03 0.92 1.50 3.41 1.49 2.57 2.28 2.89 1.26 0.61 Construction and development 0.80 1.48 1.37 0.91 0.47 0.62 0.86 1.31 0.61 0.55 0.65 0.64 Nonfarm nonresidential 0.74 1.52 0.97 0.71 0.69 0.64 0.93 0.67 0.82 0.72 0.72 0.47 Multifamily residential real estate 0.19 0.54 0.59 0.21 0.12 0.15 0.16 0.23 0.20 0.22 0.37 0.15 Home equity loans 2.40 0.66 0.61 0.68 1.45 3.58 2.34 3.05 2.43 2.36 1.35 0.63 Other 1-4 family residential 3.39 1.47 1.14 1.44 2.62 5.06 2.34 4.09 3.55 4.85 2.37 0.80Commercial and industrial loans 1.34 1.88 1.32 1.44 1.43 1.25 0.99 1.36 1.11 1.59 2.13 1.29Loans to individuals 0.85 0.84 0.78 0.76 0.98 0.74 0.90 0.94 0.71 0.80 0.90 0.85 Credit card loans 1.18 2.35 1.44 1.48 1.30 1.02 1.04 1.23 1.05 1.09 1.22 1.57 Other loans to individuals 0.54 0.81 0.74 0.52 0.56 0.50 0.66 0.63 0.59 0.42 0.76 0.25All other loans and leases (including farm) 0.22 0.92 0.67 0.64 0.23 0.14 0.20 0.15 0.19 0.26 0.29 0.33Total loans and leases 1.45 1.34 1.03 0.98 1.24 1.84 1.15 1.67 1.52 1.82 1.32 0.78
Percent of Loans Charged-Off (net, YTD) All real estate loans 0.06 0.05 0.05 0.03 0.05 0.08 0.06 0.10 0.07 0.06 0.02 -0.01 Construction and development -0.05 -0.10 0.00 -0.06 -0.08 -0.05 -0.02 -0.01 -0.04 -0.10 -0.05 -0.16 Nonfarm nonresidential 0.01 0.04 0.05 0.03 0.01 -0.05 0.02 0.01 0.03 -0.04 0.03 -0.01 Multifamily residential real estate 0.00 0.03 0.05 -0.01 -0.01 -0.01 0.00 -0.01 -0.01 0.00 0.00 0.01 Home equity loans 0.28 0.10 0.05 0.10 0.21 0.39 0.19 0.42 0.23 0.37 0.16 0.00 Other 1-4 family residential 0.07 0.09 0.07 0.05 0.08 0.07 0.10 0.09 0.07 0.07 0.03 0.00Commercial and industrial loans 0.43 0.44 0.27 0.42 0.48 0.41 0.32 0.38 0.36 0.48 0.65 0.58Loans to individuals 1.88 0.71 0.73 1.47 2.08 1.79 2.01 2.02 1.15 2.24 1.35 1.84 Credit card loans 3.05 11.23 4.57 3.64 3.15 2.89 2.74 3.20 2.94 3.15 2.37 3.42 Other loans to individuals 0.73 0.55 0.46 0.73 0.61 0.84 0.77 0.77 0.53 1.07 0.88 0.47All other loans and leases (including farm) 0.12 0.13 0.20 0.39 0.13 0.09 0.14 0.09 0.10 0.13 0.29 0.14Total loans and leases 0.45 0.15 0.11 0.21 0.62 0.46 0.48 0.53 0.27 0.51 0.30 0.55
Loans Outstanding (in billions) All real estate loans $4,567.1 $38.1 $607.8 $879.8 $1,376.8 $1,664.7 $927.0 $922.9 $935.1 $873.5 $408.0 $500.6 Construction and development 303.1 2.2 56.0 81.4 96.6 66.8 54.7 59.3 50.4 46.4 60.7 31.5 Nonfarm nonresidential 1,300.8 9.5 229.6 354.6 420.3 286.9 295.0 268.3 199.9 186.9 164.3 186.4 Multifamily residential real estate 374.2 1.1 32.5 89.0 137.7 114.0 136.6 44.2 97.0 32.1 16.7 47.5 Home equity loans 444.3 0.9 25.6 48.5 143.8 225.5 86.2 116.4 109.8 83.2 19.8 28.9 Other 1-4 family residential 1,989.2 17.2 216.2 286.2 563.2 906.3 350.6 421.9 455.0 436.5 130.2 194.9Commercial and industrial loans 1,943.3 6.6 98.4 188.6 709.4 940.3 298.4 482.4 418.0 396.8 126.2 221.5Loans to individuals 1,544.5 3.6 31.7 83.2 702.1 723.9 328.2 386.3 220.7 315.3 61.9 232.1 Credit card loans 761.6 0.1 2.1 21.1 401.4 337.0 204.9 196.7 56.1 179.6 19.4 104.8 Other loans to individuals 782.8 3.6 29.6 62.1 300.6 386.9 123.3 189.5 164.6 135.6 42.5 127.3All other loans and leases (including farm) 1,180.3 8.0 51.7 65.0 309.3 746.3 185.8 252.9 274.9 331.1 51.4 84.2Total loans and leases (plus unearned income) 9,235.2 56.3 789.5 1,216.6 3,097.6 4,075.2 1,739.4 2,044.4 1,848.7 1,916.7 647.5 1,038.5
Memo: Other Real Estate Owned (in millions) All other real estate owned 11,780.0 360.5 3,715.0 2,691.2 2,473.5 2,539.9 1,985.8 2,820.5 2,281.2 2,043.1 1,775.1 874.4 Construction and development 3,703.4 124.3 1,703.1 1,083.0 451.8 341.2 330.1 1,077.5 508.8 742.6 760.5 283.8 Nonfarm nonresidential 3,101.4 113.2 1,174.1 835.3 679.5 299.4 512.8 638.0 618.3 415.0 592.2 325.1 Multifamily residential real estate 190.0 15.2 78.8 62.4 15.7 17.9 44.1 32.5 25.9 49.5 20.4 17.6 1-4 family residential 3,977.4 101.1 675.5 648.3 1,162.3 1,390.2 1,024.1 961.8 901.7 524.2 345.6 220.0 Farmland 143.5 6.5 78.9 45.5 10.3 2.2 6.9 40.1 21.8 16.5 45.6 12.6 GNMA properties 651.3 0.2 4.5 16.7 153.7 476.0 67.7 70.5 204.6 282.2 10.8 15.3
* Regions:New York - Connecticut, Delaware, District of Columbia, Maine, Maryland, Massachusetts, New Hampshire, New Jersey, New York, Pennsylvania, Puerto Rico, Rhode Island, Vermont, U.S. Virgin IslandsAtlanta - Alabama, Florida, Georgia, North Carolina, South Carolina, Virginia, West VirginiaChicago - Illinois, Indiana, Kentucky, Michigan, Ohio, WisconsinKansas City - Iowa, Kansas, Minnesota, Missouri, Nebraska, North Dakota, South DakotaDallas - Arkansas, Colorado, Louisiana, Mississippi, New Mexico, Oklahoma, Tennessee, TexasSan Francisco - Alaska, Arizona, California, Hawaii, Idaho, Montana, Nevada, Oregon, Pacific Islands, Utah, Washington, Wyoming** Noncurrent loan rates represent the percentage of loans in each category that are past due 90 days or more or that are in nonaccrual status.
2016 •Volume 10 • Number 4
12 FDIC QUARTERLY
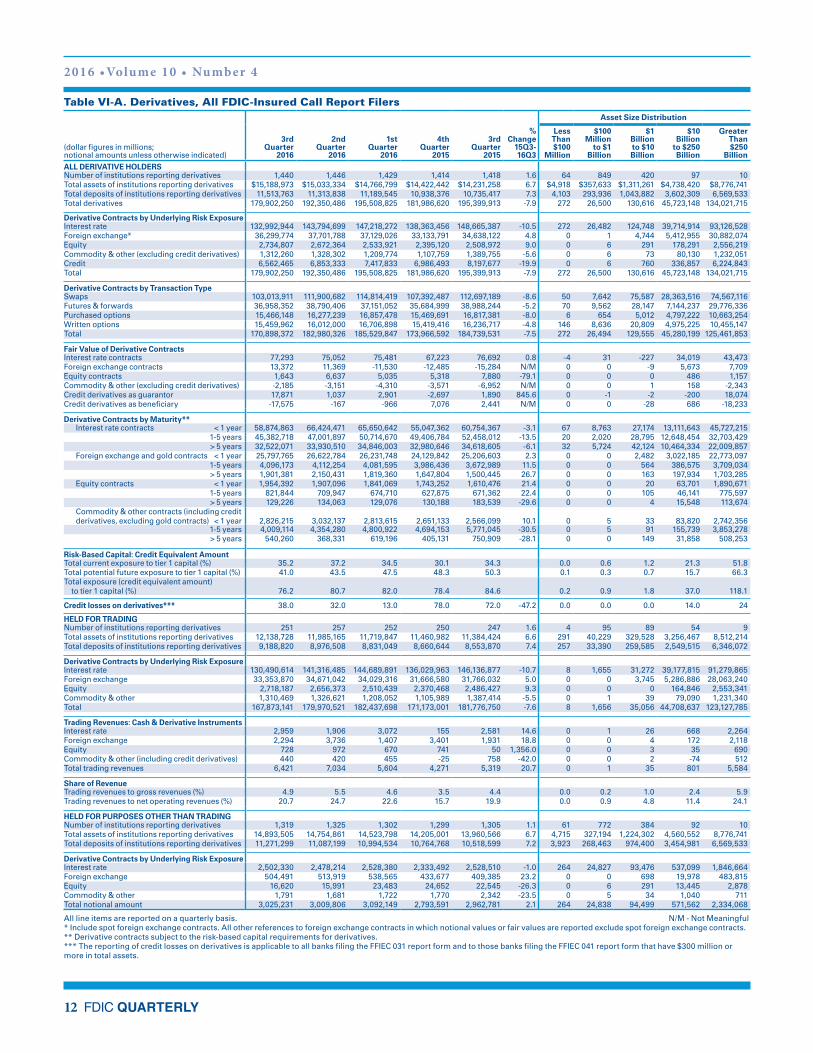
Table VI-A. Derivatives, All FDIC-Insured Call Report Filers
3rd Quarter
2016
2nd Quarter
2016
1st Quarter
2016
4th Quarter
2015
3rd Quarter
2015
% Change
15Q3- 16Q3
Asset Size Distribution
(dollar figures in millions; notional amounts unless otherwise indicated)
Less Than $100
Million
$100 Million
to $1 Billion
$1 Billion to $10 Billion
$10 Billion
to $250 Billion
Greater Than $250
BillionALL DERIVATIVE HOLDERS Number of institutions reporting derivatives 1,440 1,446 1,429 1,414 1,418 1.6 64 849 420 97 10Total assets of institutions reporting derivatives $15,188,973 $15,033,334 $14,766,799 $14,422,442 $14,231,258 6.7 $4,918 $357,633 $1,311,261 $4,738,420 $8,776,741Total deposits of institutions reporting derivatives 11,513,763 11,313,838 11,189,545 10,938,376 10,735,417 7.3 4,103 293,936 1,043,882 3,602,309 6,569,533Total derivatives 179,902,250 192,350,486 195,508,825 181,986,620 195,399,913 -7.9 272 26,500 130,616 45,723,148 134,021,715
Derivative Contracts by Underlying Risk Exposure Interest rate 132,992,944 143,794,699 147,218,272 138,363,456 148,665,387 -10.5 272 26,482 124,748 39,714,914 93,126,528Foreign exchange* 36,299,774 37,701,788 37,129,026 33,133,791 34,638,122 4.8 0 1 4,744 5,412,955 30,882,074Equity 2,734,807 2,672,364 2,533,921 2,395,120 2,508,972 9.0 0 6 291 178,291 2,556,219Commodity & other (excluding credit derivatives) 1,312,260 1,328,302 1,209,774 1,107,759 1,389,755 -5.6 0 6 73 80,130 1,232,051Credit 6,562,465 6,853,333 7,417,833 6,986,493 8,197,677 -19.9 0 6 760 336,857 6,224,843Total 179,902,250 192,350,486 195,508,825 181,986,620 195,399,913 -7.9 272 26,500 130,616 45,723,148 134,021,715
Derivative Contracts by Transaction Type Swaps 103,013,911 111,900,682 114,814,419 107,392,487 112,697,189 -8.6 50 7,642 75,587 28,363,516 74,567,116Futures & forwards 36,958,352 38,790,406 37,151,052 35,684,999 38,988,244 -5.2 70 9,562 28,147 7,144,237 29,776,336Purchased options 15,466,148 16,277,239 16,857,478 15,469,691 16,817,381 -8.0 6 654 5,012 4,797,222 10,663,254Written options 15,459,962 16,012,000 16,706,898 15,419,416 16,236,717 -4.8 146 8,636 20,809 4,975,225 10,455,147Total 170,898,372 182,980,326 185,529,847 173,966,592 184,739,531 -7.5 272 26,494 129,555 45,280,199 125,461,853
Fair Value of Derivative Contracts Interest rate contracts 77,293 75,052 75,481 67,223 76,692 0.8 -4 31 -227 34,019 43,473Foreign exchange contracts 13,372 11,369 -11,530 -12,485 -15,284 N/M 0 0 -9 5,673 7,709Equity contracts 1,643 6,637 5,035 5,318 7,880 -79.1 0 0 0 486 1,157Commodity & other (excluding credit derivatives) -2,185 -3,151 -4,310 -3,571 -6,952 N/M 0 0 1 158 -2,343Credit derivatives as guarantor 17,871 1,037 2,901 -2,697 1,890 845.6 0 -1 -2 -200 18,074Credit derivatives as beneficiary -17,575 -167 -966 7,076 2,441 N/M 0 0 -28 686 -18,233
Derivative Contracts by Maturity** Interest rate contracts < 1 year 58,874,863 66,424,471 65,650,642 55,047,362 60,754,367 -3.1 67 8,763 27,174 13,111,643 45,727,215 1-5 years 45,382,718 47,001,897 50,714,670 49,406,784 52,458,012 -13.5 20 2,020 28,795 12,648,454 32,703,429 > 5 years 32,522,071 33,930,510 34,846,003 32,980,646 34,618,605 -6.1 32 5,724 42,124 10,464,334 22,009,857 Foreign exchange and gold contracts < 1 year 25,797,765 26,622,784 26,231,748 24,129,842 25,206,603 2.3 0 0 2,482 3,022,185 22,773,097 1-5 years 4,096,173 4,112,254 4,081,595 3,986,436 3,672,989 11.5 0 0 564 386,575 3,709,034 > 5 years 1,901,381 2,150,431 1,819,360 1,647,804 1,500,445 26.7 0 0 163 197,934 1,703,285 Equity contracts < 1 year 1,954,392 1,907,096 1,841,069 1,743,252 1,610,476 21.4 0 0 20 63,701 1,890,671 1-5 years 821,844 709,947 674,710 627,875 671,362 22.4 0 0 105 46,141 775,597 > 5 years 129,226 134,063 129,076 130,188 183,539 -29.6 0 0 4 15,548 113,674 Commodity & other contracts (including credit
derivatives, excluding gold contracts) < 1 year 2,826,215 3,032,137 2,813,615 2,651,133 2,566,099 10.1 0 5 33 83,820 2,742,356 1-5 years 4,009,114 4,354,280 4,800,922 4,694,153 5,771,045 -30.5 0 5 91 155,739 3,853,278 > 5 years 540,260 368,331 619,196 405,131 750,909 -28.1 0 0 149 31,858 508,253
Risk-Based Capital: Credit Equivalent Amount Total current exposure to tier 1 capital (%) 35.2 37.2 34.5 30.1 34.3 0.0 0.6 1.2 21.3 51.8Total potential future exposure to tier 1 capital (%) 41.0 43.5 47.5 48.3 50.3 0.1 0.3 0.7 15.7 66.3Total exposure (credit equivalent amount) to tier 1 capital (%) 76.2 80.7 82.0 78.4 84.6 0.2 0.9 1.8 37.0 118.1
Credit losses on derivatives*** 38.0 32.0 13.0 78.0 72.0 -47.2 0.0 0.0 0.0 14.0 24
HELD FOR TRADING Number of institutions reporting derivatives 251 257 252 250 247 1.6 4 95 89 54 9Total assets of institutions reporting derivatives 12,138,728 11,985,165 11,719,847 11,460,982 11,384,424 6.6 291 40,229 329,528 3,256,467 8,512,214Total deposits of institutions reporting derivatives 9,188,820 8,976,508 8,831,049 8,660,644 8,553,870 7.4 257 33,390 259,585 2,549,515 6,346,072
Derivative Contracts by Underlying Risk Exposure Interest rate 130,490,614 141,316,485 144,689,891 136,029,963 146,136,877 -10.7 8 1,655 31,272 39,177,815 91,279,865Foreign exchange 33,353,870 34,671,042 34,029,316 31,666,580 31,766,032 5.0 0 0 3,745 5,286,886 28,063,240Equity 2,718,187 2,656,373 2,510,439 2,370,468 2,486,427 9.3 0 0 0 164,846 2,553,341Commodity & other 1,310,469 1,326,621 1,208,052 1,105,989 1,387,414 -5.5 0 1 39 79,090 1,231,340Total 167,873,141 179,970,521 182,437,698 171,173,001 181,776,750 -7.6 8 1,656 35,056 44,708,637 123,127,785
Trading Revenues: Cash & Derivative Instruments Interest rate 2,959 1,906 3,072 155 2,581 14.6 0 1 26 668 2,264Foreign exchange 2,294 3,736 1,407 3,401 1,931 18.8 0 0 4 172 2,118Equity 728 972 670 741 50 1,356.0 0 0 3 35 690Commodity & other (including credit derivatives) 440 420 455 -25 758 -42.0 0 0 2 -74 512Total trading revenues 6,421 7,034 5,604 4,271 5,319 20.7 0 1 35 801 5,584
Share of Revenue Trading revenues to gross revenues (%) 4.9 5.5 4.6 3.5 4.4 0.0 0.2 1.0 2.4 5.9Trading revenues to net operating revenues (%) 20.7 24.7 22.6 15.7 19.9 0.0 0.9 4.8 11.4 24.1
HELD FOR PURPOSES OTHER THAN TRADING Number of institutions reporting derivatives 1,319 1,325 1,302 1,299 1,305 1.1 61 772 384 92 10Total assets of institutions reporting derivatives 14,893,505 14,754,861 14,523,798 14,205,001 13,960,566 6.7 4,715 327,194 1,224,302 4,560,552 8,776,741Total deposits of institutions reporting derivatives 11,271,299 11,087,199 10,994,534 10,764,768 10,518,599 7.2 3,923 268,463 974,400 3,454,981 6,569,533
Derivative Contracts by Underlying Risk Exposure Interest rate 2,502,330 2,478,214 2,528,380 2,333,492 2,528,510 -1.0 264 24,827 93,476 537,099 1,846,664Foreign exchange 504,491 513,919 538,565 433,677 409,385 23.2 0 0 698 19,978 483,815Equity 16,620 15,991 23,483 24,652 22,545 -26.3 0 6 291 13,445 2,878Commodity & other 1,791 1,681 1,722 1,770 2,342 -23.5 0 5 34 1,040 711Total notional amount 3,025,231 3,009,806 3,092,149 2,793,591 2,962,781 2.1 264 24,838 94,499 571,562 2,334,068
All line items are reported on a quarterly basis. N/M - Not Meaningful* Include spot foreign exchange contracts. All other references to foreign exchange contracts in which notional values or fair values are reported exclude spot foreign exchange contracts.** Derivative contracts subject to the risk-based capital requirements for derivatives.*** The reporting of credit losses on derivatives is applicable to all banks filing the FFIEC 031 report form and to those banks filing the FFIEC 041 report form that have $300 million or more in total assets.
QUARTERLY BANKING PROFILE
FDIC QUARTERLY 13
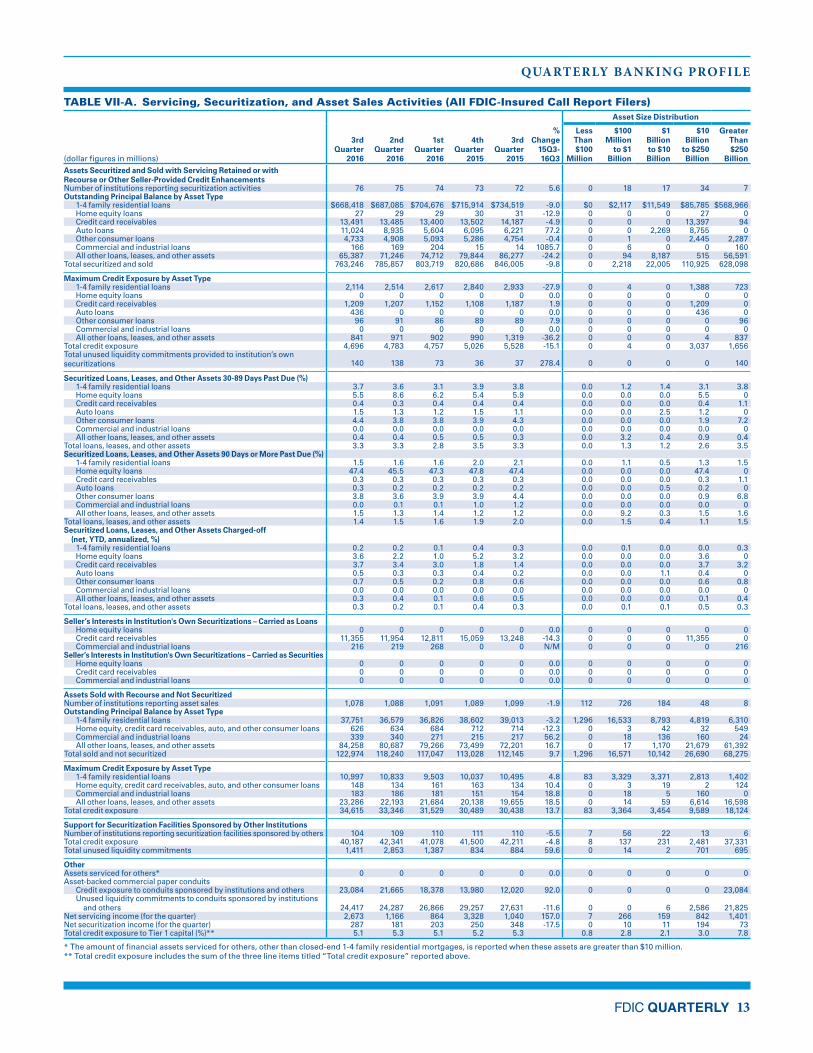
TABLE VII-A. Servicing, Securitization, and Asset Sales Activities (All FDIC-Insured Call Report Filers)Asset Size Distribution
(dollar figures in millions)
3rd Quarter
2016
2nd Quarter
2016
1st Quarter
2016
4th Quarter
2015
3rd Quarter
2015
% Change
15Q3- 16Q3
Less Than $100
Million
$100 Million
to $1 Billion
$1 Billion to $10 Billion
$10 Billion
to $250 Billion
Greater Than $250
BillionAssets Securitized and Sold with Servicing Retained or with Recourse or Other Seller-Provided Credit Enhancements Number of institutions reporting securitization activities 76 75 74 73 72 5.6 0 18 17 34 7Outstanding Principal Balance by Asset Type 1-4 family residential loans $668,418 $687,085 $704,676 $715,914 $734,519 -9.0 $0 $2,117 $11,549 $85,785 $568,966 Home equity loans 27 29 29 30 31 -12.9 0 0 0 27 0 Credit card receivables 13,491 13,485 13,400 13,502 14,187 -4.9 0 0 0 13,397 94 Auto loans 11,024 8,935 5,604 6,095 6,221 77.2 0 0 2,269 8,755 0 Other consumer loans 4,733 4,908 5,093 5,286 4,754 -0.4 0 1 0 2,445 2,287 Commercial and industrial loans 166 169 204 15 14 1085.7 0 6 0 0 160 All other loans, leases, and other assets 65,387 71,246 74,712 79,844 86,277 -24.2 0 94 8,187 515 56,591Total securitized and sold 763,246 785,857 803,719 820,686 846,005 -9.8 0 2,218 22,005 110,925 628,098
Maximum Credit Exposure by Asset Type 1-4 family residential loans 2,114 2,514 2,617 2,840 2,933 -27.9 0 4 0 1,388 723 Home equity loans 0 0 0 0 0 0.0 0 0 0 0 0 Credit card receivables 1,209 1,207 1,152 1,108 1,187 1.9 0 0 0 1,209 0 Auto loans 436 0 0 0 0 0.0 0 0 0 436 0 Other consumer loans 96 91 86 89 89 7.9 0 0 0 0 96 Commercial and industrial loans 0 0 0 0 0 0.0 0 0 0 0 0 All other loans, leases, and other assets 841 971 902 990 1,319 -36.2 0 0 0 4 837Total credit exposure 4,696 4,783 4,757 5,026 5,528 -15.1 0 4 0 3,037 1,656Total unused liquidity commitments provided to institution’s own securitizations 140 138 73 36 37 278.4 0 0 0 0 140
Securitized Loans, Leases, and Other Assets 30-89 Days Past Due (%) 1-4 family residential loans 3.7 3.6 3.1 3.9 3.8 0.0 1.2 1.4 3.1 3.8 Home equity loans 5.5 8.6 6.2 5.4 5.9 0.0 0.0 0.0 5.5 0 Credit card receivables 0.4 0.3 0.4 0.4 0.4 0.0 0.0 0.0 0.4 1.1 Auto loans 1.5 1.3 1.2 1.5 1.1 0.0 0.0 2.5 1.2 0 Other consumer loans 4.4 3.8 3.8 3.9 4.3 0.0 0.0 0.0 1.9 7.2 Commercial and industrial loans 0.0 0.0 0.0 0.0 0.0 0.0 0.0 0.0 0.0 0 All other loans, leases, and other assets 0.4 0.4 0.5 0.5 0.3 0.0 3.2 0.4 0.9 0.4Total loans, leases, and other assets 3.3 3.3 2.8 3.5 3.3 0.0 1.3 1.2 2.6 3.5Securitized Loans, Leases, and Other Assets 90 Days or More Past Due (%) 1-4 family residential loans 1.5 1.6 1.6 2.0 2.1 0.0 1.1 0.5 1.3 1.5 Home equity loans 47.4 45.5 47.3 47.8 47.4 0.0 0.0 0.0 47.4 0 Credit card receivables 0.3 0.3 0.3 0.3 0.3 0.0 0.0 0.0 0.3 1.1 Auto loans 0.3 0.2 0.2 0.2 0.2 0.0 0.0 0.5 0.2 0 Other consumer loans 3.8 3.6 3.9 3.9 4.4 0.0 0.0 0.0 0.9 6.8 Commercial and industrial loans 0.0 0.1 0.1 1.0 1.2 0.0 0.0 0.0 0.0 0 All other loans, leases, and other assets 1.5 1.3 1.4 1.2 1.2 0.0 9.2 0.3 1.5 1.6Total loans, leases, and other assets 1.4 1.5 1.6 1.9 2.0 0.0 1.5 0.4 1.1 1.5Securitized Loans, Leases, and Other Assets Charged-off (net, YTD, annualized, %) 1-4 family residential loans 0.2 0.2 0.1 0.4 0.3 0.0 0.1 0.0 0.0 0.3 Home equity loans 3.6 2.2 1.0 5.2 3.2 0.0 0.0 0.0 3.6 0 Credit card receivables 3.7 3.4 3.0 1.8 1.4 0.0 0.0 0.0 3.7 3.2 Auto loans 0.5 0.3 0.3 0.4 0.2 0.0 0.0 1.1 0.4 0 Other consumer loans 0.7 0.5 0.2 0.8 0.6 0.0 0.0 0.0 0.6 0.8 Commercial and industrial loans 0.0 0.0 0.0 0.0 0.0 0.0 0.0 0.0 0.0 0 All other loans, leases, and other assets 0.3 0.4 0.1 0.6 0.5 0.0 0.0 0.0 0.1 0.4Total loans, leases, and other assets 0.3 0.2 0.1 0.4 0.3 0.0 0.1 0.1 0.5 0.3
Seller’s Interests in Institution's Own Securitizations – Carried as Loans Home equity loans 0 0 0 0 0 0.0 0 0 0 0 0 Credit card receivables 11,355 11,954 12,811 15,059 13,248 -14.3 0 0 0 11,355 0 Commercial and industrial loans 216 219 268 0 0 N/M 0 0 0 0 216Seller’s Interests in Institution's Own Securitizations – Carried as Securities Home equity loans 0 0 0 0 0 0.0 0 0 0 0 0 Credit card receivables 0 0 0 0 0 0.0 0 0 0 0 0 Commercial and industrial loans 0 0 0 0 0 0.0 0 0 0 0 0
Assets Sold with Recourse and Not Securitized Number of institutions reporting asset sales 1,078 1,088 1,091 1,089 1,099 -1.9 112 726 184 48 8Outstanding Principal Balance by Asset Type 1-4 family residential loans 37,751 36,579 36,826 38,602 39,013 -3.2 1,296 16,533 8,793 4,819 6,310 Home equity, credit card receivables, auto, and other consumer loans 626 634 684 712 714 -12.3 0 3 42 32 549 Commercial and industrial loans 339 340 271 215 217 56.2 0 18 136 160 24 All other loans, leases, and other assets 84,258 80,687 79,266 73,499 72,201 16.7 0 17 1,170 21,679 61,392Total sold and not securitized 122,974 118,240 117,047 113,028 112,145 9.7 1,296 16,571 10,142 26,690 68,275
Maximum Credit Exposure by Asset Type 1-4 family residential loans 10,997 10,833 9,503 10,037 10,495 4.8 83 3,329 3,371 2,813 1,402 Home equity, credit card receivables, auto, and other consumer loans 148 134 161 163 134 10.4 0 3 19 2 124 Commercial and industrial loans 183 186 181 151 154 18.8 0 18 5 160 0 All other loans, leases, and other assets 23,286 22,193 21,684 20,138 19,655 18.5 0 14 59 6,614 16,598Total credit exposure 34,615 33,346 31,529 30,489 30,438 13.7 83 3,364 3,454 9,589 18,124
Support for Securitization Facilities Sponsored by Other Institutions Number of institutions reporting securitization facilities sponsored by others 104 109 110 111 110 -5.5 7 56 22 13 6Total credit exposure 40,187 42,341 41,078 41,500 42,211 -4.8 8 137 231 2,481 37,331Total unused liquidity commitments 1,411 2,853 1,387 834 884 59.6 0 14 2 701 695
OtherAssets serviced for others* 0 0 0 0 0 0.0 0 0 0 0 0Asset-backed commercial paper conduits Credit exposure to conduits sponsored by institutions and others 23,084 21,665 18,378 13,980 12,020 92.0 0 0 0 0 23,084 Unused liquidity commitments to conduits sponsored by institutions and others 24,417 24,287 26,866 29,257 27,631 -11.6 0 0 6 2,586 21,825Net servicing income (for the quarter) 2,673 1,166 864 3,328 1,040 157.0 7 266 159 842 1,401Net securitization income (for the quarter) 287 181 203 250 348 -17.5 0 10 11 194 73Total credit exposure to Tier 1 capital (%)** 5.1 5.3 5.1 5.2 5.3 0.8 2.8 2.1 3.0 7.8
* The amount of financial assets serviced for others, other than closed-end 1-4 family residential mortgages, is reported when these assets are greater than $10 million.** Total credit exposure includes the sum of the three line items titled “Total credit exposure” reported above.

QUARTERLY BANKING PROFILE
FDIC QUARTERLY 15
COMMUNITY BANK PERFORMANCE
Community banks are identified based on criteria defined in the FDIC’s Community Banking Study. When comparing community bank performance across quarters, prior-quarter dollar amounts are based on community banks designated in the current quarter, adjusted for mergers. In contrast, prior-quarter performance ratios are based on community banks designated during the previous quarter.
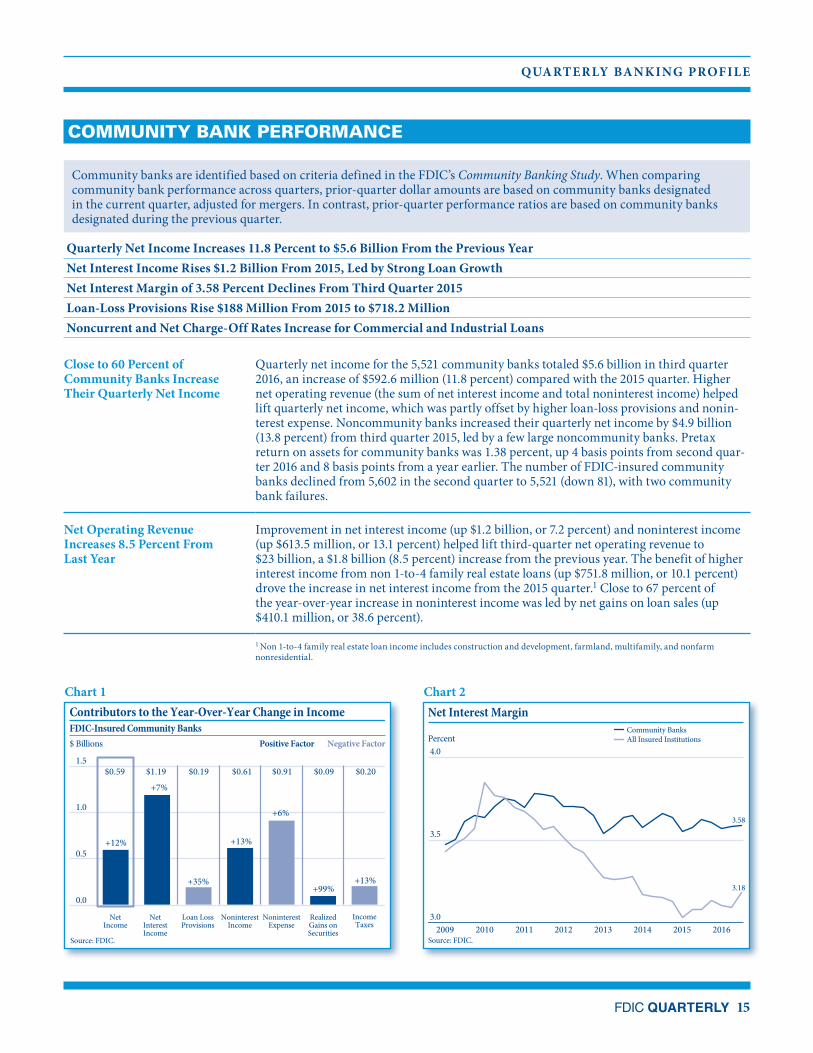
Quarterly Net Income Increases 11.8 Percent to $5.6 Billion From the Previous YearNet Interest Income Rises $1.2 Billion From 2015, Led by Strong Loan GrowthNet Interest Margin of 3.58 Percent Declines From Third Quarter 2015Loan-Loss Provisions Rise $188 Million From 2015 to $718.2 MillionNoncurrent and Net Charge-Off Rates Increase for Commercial and Industrial Loans
Close to 60 Percent of Community Banks Increase Their Quarterly Net Income
Quarterly net income for the 5,521 community banks totaled $5.6 billion in third quarter 2016, an increase of $592.6 million (11.8 percent) compared with the 2015 quarter. Higher net operating revenue (the sum of net interest income and total noninterest income) helped lift quarterly net income, which was partly offset by higher loan-loss provisions and nonin-terest expense. Noncommunity banks increased their quarterly net income by $4.9 billion (13.8 percent) from third quarter 2015, led by a few large noncommunity banks. Pretax return on assets for community banks was 1.38 percent, up 4 basis points from second quar-ter 2016 and 8 basis points from a year earlier. The number of FDIC-insured community banks declined from 5,602 in the second quarter to 5,521 (down 81), with two community bank failures.
Net Operating Revenue Increases 8.5 Percent From Last Year
Improvement in net interest income (up $1.2 billion, or 7.2 percent) and noninterest income (up $613.5 million, or 13.1 percent) helped lift third-quarter net operating revenue to $23 billion, a $1.8 billion (8.5 percent) increase from the previous year. The benefit of higher interest income from non 1-to-4 family real estate loans (up $751.8 million, or 10.1 percent) drove the increase in net interest income from the 2015 quarter.1 Close to 67 percent of the year-over-year increase in noninterest income was led by net gains on loan sales (up $410.1 million, or 38.6 percent).
Contributors to the Year-Over-Year Change in Income FDIC-Insured Community Banks
Source: FDIC.
$ Billions
NetIncome
NetInterestIncome
Loan LossProvisions
NoninterestIncome
NoninterestExpense
RealizedGains onSecurities
IncomeTaxes
Positive Factor Negative Factor
0.0
0.5
1.0
1.5$0.19$0.59 $1.19 $0.61 $0.91 $0.09 $0.20
+35%
+12%
+7%
+13%
+6%
+99%+13%
Chart 1
Source: FDIC.
Net Interest Margin
Percent
3.0
3.5
4.0
Community Banks All Insured Institutions
3.58
3.18
2009 2010 2011 2012 2013 2014 2015 2016
Chart 2
1 Non 1-to-4 family real estate loan income includes construction and development, farmland, multifamily, and nonfarm nonresidential.
2016 •Volume 10 • Number 4
16 FDIC QUARTERLY
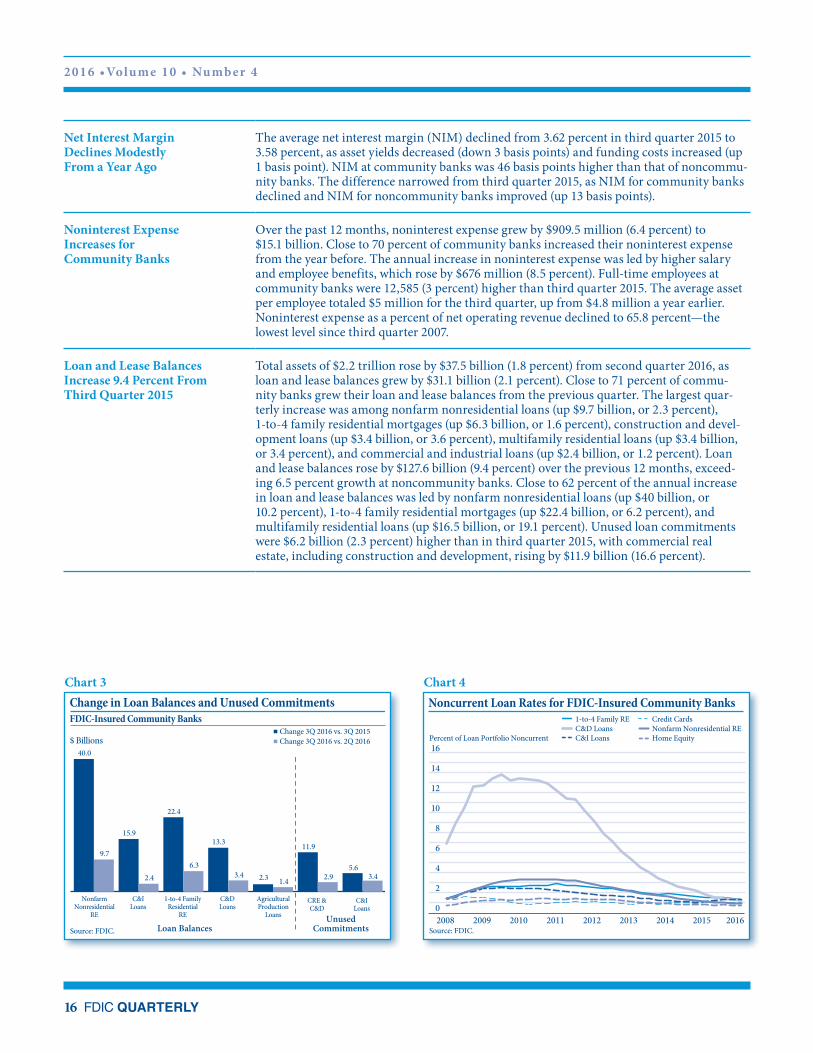
Change in Loan Balances and Unused Commitments FDIC-Insured Community Banks
Source: FDIC.
$ BillionsChange 3Q 2016 vs. 3Q 2015Change 3Q 2016 vs. 2Q 2016
Loan BalancesUnused
Commitments
NonfarmNonresidential
RE
C&ILoans
1-to-4 FamilyResidential
RE
C&DLoans
AgriculturalProduction
Loans
CRE &C&D
C&ILoans
40.0
15.913.3
22.4
2.3
11.9
5.6
9.7
2.46.3
3.41.4 2.9 3.4
Chart 3Noncurrent Loan Rates for FDIC-Insured Community Banks
Source: FDIC.
Percent of Loan Portfolio Noncurrent
0
2
4
6
8
10
12
14
16
C&D Loans Nonfarm Nonresidential RE1-to-4 Family RE
C&I Loans Home Equity
Credit Cards
2008 2009 2010 2011 2012 2013 2014 2015 2016
Chart 4
Net Interest Margin Declines Modestly From a Year Ago
The average net interest margin (NIM) declined from 3.62 percent in third quarter 2015 to 3.58 percent, as asset yields decreased (down 3 basis points) and funding costs increased (up 1 basis point). NIM at community banks was 46 basis points higher than that of noncommu-nity banks. The difference narrowed from third quarter 2015, as NIM for community banks declined and NIM for noncommunity banks improved (up 13 basis points).
Noninterest Expense Increases for Community Banks
Over the past 12 months, noninterest expense grew by $909.5 million (6.4 percent) to $15.1 billion. Close to 70 percent of community banks increased their noninterest expense from the year before. The annual increase in noninterest expense was led by higher salary and employee benefits, which rose by $676 million (8.5 percent). Full-time employees at community banks were 12,585 (3 percent) higher than third quarter 2015. The average asset per employee totaled $5 million for the third quarter, up from $4.8 million a year earlier. Noninterest expense as a percent of net operating revenue declined to 65.8 percent—the lowest level since third quarter 2007.
Loan and Lease Balances Increase 9.4 Percent From Third Quarter 2015
Total assets of $2.2 trillion rose by $37.5 billion (1.8 percent) from second quarter 2016, as loan and lease balances grew by $31.1 billion (2.1 percent). Close to 71 percent of commu-nity banks grew their loan and lease balances from the previous quarter. The largest quar-terly increase was among nonfarm nonresidential loans (up $9.7 billion, or 2.3 percent), 1-to-4 family residential mortgages (up $6.3 billion, or 1.6 percent), construction and devel-opment loans (up $3.4 billion, or 3.6 percent), multifamily residential loans (up $3.4 billion, or 3.4 percent), and commercial and industrial loans (up $2.4 billion, or 1.2 percent). Loan and lease balances rose by $127.6 billion (9.4 percent) over the previous 12 months, exceed-ing 6.5 percent growth at noncommunity banks. Close to 62 percent of the annual increase in loan and lease balances was led by nonfarm nonresidential loans (up $40 billion, or 10.2 percent), 1-to-4 family residential mortgages (up $22.4 billion, or 6.2 percent), and multifamily residential loans (up $16.5 billion, or 19.1 percent). Unused loan commitments were $6.2 billion (2.3 percent) higher than in third quarter 2015, with commercial real estate, including construction and development, rising by $11.9 billion (16.6 percent).
QUARTERLY BANKING PROFILE
FDIC QUARTERLY 17
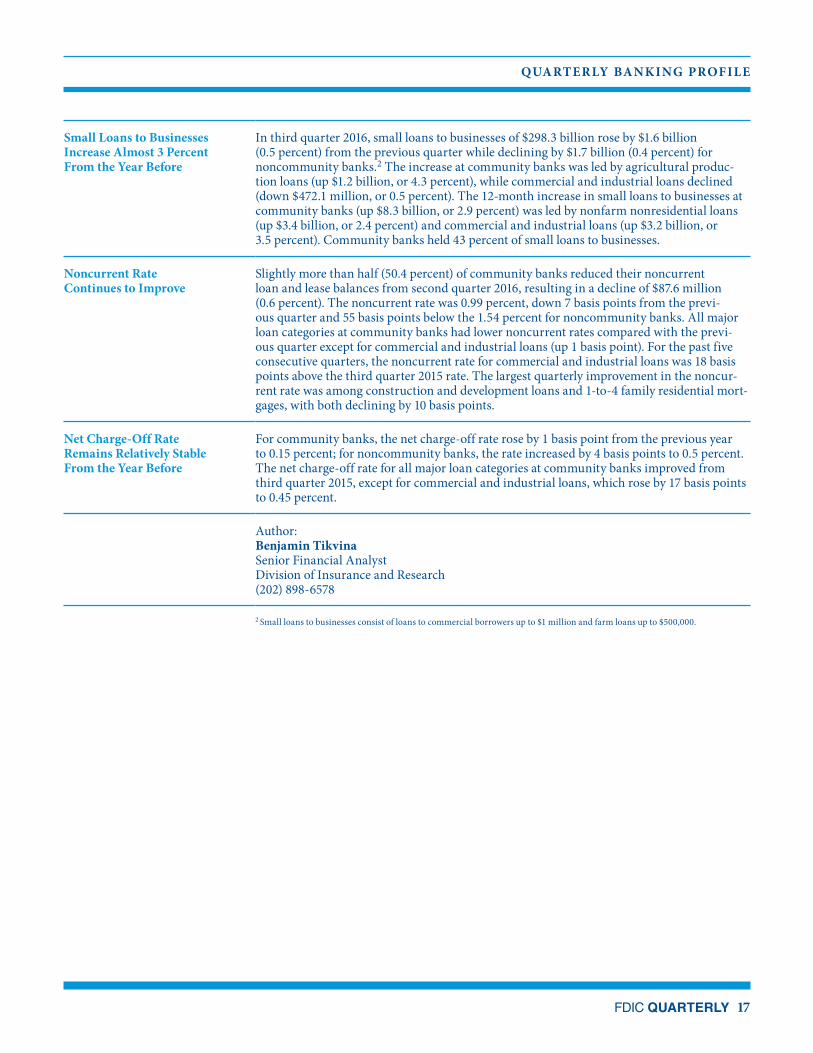
Small Loans to Businesses Increase Almost 3 Percent From the Year Before
In third quarter 2016, small loans to businesses of $298.3 billion rose by $1.6 billion (0.5 percent) from the previous quarter while declining by $1.7 billion (0.4 percent) for noncommunity banks.2 The increase at community banks was led by agricultural produc-tion loans (up $1.2 billion, or 4.3 percent), while commercial and industrial loans declined (down $472.1 million, or 0.5 percent). The 12-month increase in small loans to businesses at community banks (up $8.3 billion, or 2.9 percent) was led by nonfarm nonresidential loans (up $3.4 billion, or 2.4 percent) and commercial and industrial loans (up $3.2 billion, or 3.5 percent). Community banks held 43 percent of small loans to businesses.
Noncurrent Rate Continues to Improve
Slightly more than half (50.4 percent) of community banks reduced their noncurrent loan and lease balances from second quarter 2016, resulting in a decline of $87.6 million (0.6 percent). The noncurrent rate was 0.99 percent, down 7 basis points from the previ-ous quarter and 55 basis points below the 1.54 percent for noncommunity banks. All major loan categories at community banks had lower noncurrent rates compared with the previ-ous quarter except for commercial and industrial loans (up 1 basis point). For the past five consecutive quarters, the noncurrent rate for commercial and industrial loans was 18 basis points above the third quarter 2015 rate. The largest quarterly improvement in the noncur-rent rate was among construction and development loans and 1-to-4 family residential mort-gages, with both declining by 10 basis points.
Net Charge-Off Rate Remains Relatively Stable From the Year Before
For community banks, the net charge-off rate rose by 1 basis point from the previous year to 0.15 percent; for noncommunity banks, the rate increased by 4 basis points to 0.5 percent. The net charge-off rate for all major loan categories at community banks improved from third quarter 2015, except for commercial and industrial loans, which rose by 17 basis points to 0.45 percent.
Author: Benjamin Tikvina Senior Financial Analyst Division of Insurance and Research (202) 898-6578
2 Small loans to businesses consist of loans to commercial borrowers up to $1 million and farm loans up to $500,000.
2016 •Volume 10 • Number 4
18 FDIC QUARTERLY
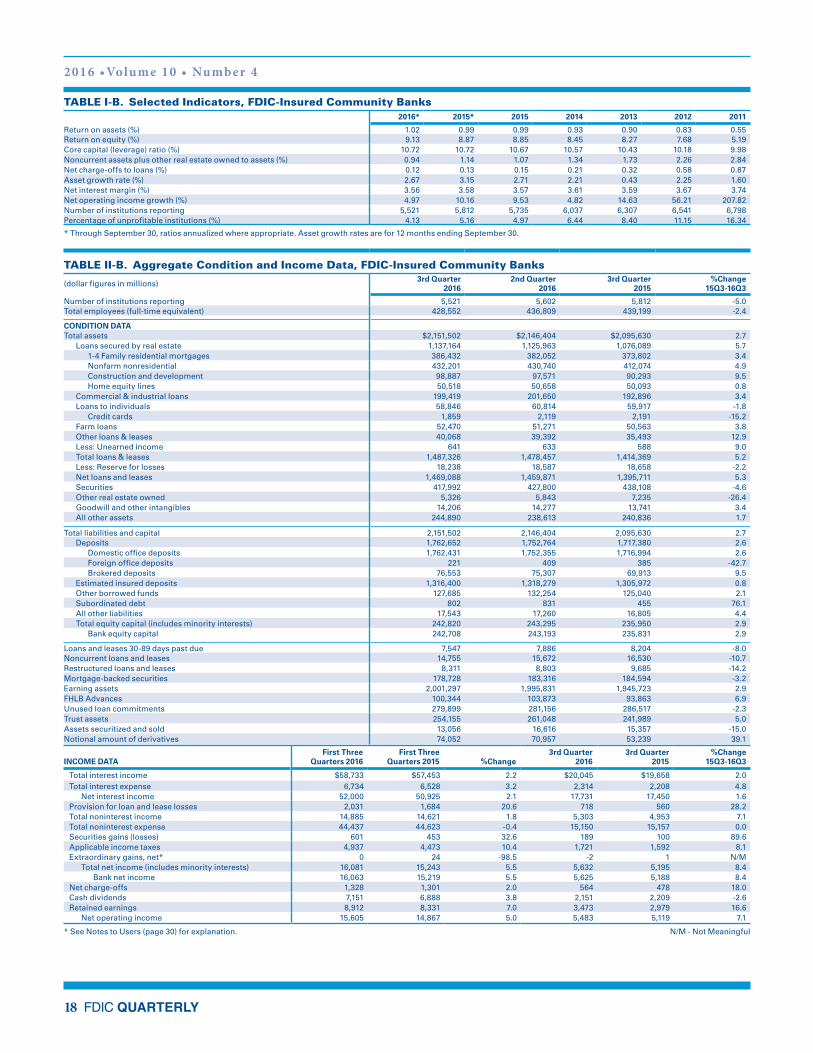
TABLE I-B. Selected Indicators, FDIC-Insured Community Banks2016* 2015* 2015 2014 2013 2012 2011
Return on assets (%) 1.02 0.99 0.99 0.93 0.90 0.83 0.55Return on equity (%) 9.13 8.87 8.85 8.45 8.27 7.68 5.19Core capital (leverage) ratio (%) 10.72 10.72 10.67 10.57 10.43 10.18 9.98Noncurrent assets plus other real estate owned to assets (%) 0.94 1.14 1.07 1.34 1.73 2.26 2.84Net charge-offs to loans (%) 0.12 0.13 0.15 0.21 0.32 0.58 0.87Asset growth rate (%) 2.67 3.15 2.71 2.21 0.43 2.25 1.60Net interest margin (%) 3.56 3.58 3.57 3.61 3.59 3.67 3.74Net operating income growth (%) 4.97 10.16 9.53 4.82 14.63 56.21 207.82Number of institutions reporting 5,521 5,812 5,735 6,037 6,307 6,541 6,798Percentage of unprofitable institutions (%) 4.13 5.16 4.97 6.44 8.40 11.15 16.34
* Through September 30, ratios annualized where appropriate. Asset growth rates are for 12 months ending September 30.
TABLE II-B. Aggregate Condition and Income Data, FDIC-Insured Community Banks
(dollar figures in millions) 3rd Quarter 2016
2nd Quarter 2016
3rd Quarter 2015
%Change 15Q3-16Q3
Number of institutions reporting 5,521 5,602 5,812 -5.0Total employees (full-time equivalent) 428,552 436,809 439,199 -2.4
CONDITION DATATotal assets $2,151,502 $2,146,404 $2,095,630 2.7 Loans secured by real estate 1,137,164 1,125,963 1,076,089 5.7 1-4 Family residential mortgages 386,432 382,052 373,802 3.4 Nonfarm nonresidential 432,201 430,740 412,074 4.9 Construction and development 98,887 97,571 90,293 9.5 Home equity lines 50,518 50,658 50,093 0.8 Commercial & industrial loans 199,419 201,650 192,896 3.4 Loans to individuals 58,846 60,814 59,917 -1.8 Credit cards 1,859 2,119 2,191 -15.2 Farm loans 52,470 51,271 50,563 3.8 Other loans & leases 40,068 39,392 35,493 12.9 Less: Unearned income 641 633 588 9.0 Total loans & leases 1,487,326 1,478,457 1,414,369 5.2 Less: Reserve for losses 18,238 18,587 18,658 -2.2 Net loans and leases 1,469,088 1,459,871 1,395,711 5.3 Securities 417,992 427,800 438,108 -4.6 Other real estate owned 5,326 5,843 7,235 -26.4 Goodwill and other intangibles 14,206 14,277 13,741 3.4 All other assets 244,890 238,613 240,836 1.7
Total liabilities and capital 2,151,502 2,146,404 2,095,630 2.7 Deposits 1,762,652 1,752,764 1,717,380 2.6 Domestic office deposits 1,762,431 1,752,355 1,716,994 2.6 Foreign office deposits 221 409 385 -42.7 Brokered deposits 76,553 75,307 69,913 9.5 Estimated insured deposits 1,316,400 1,318,279 1,305,972 0.8 Other borrowed funds 127,685 132,254 125,040 2.1 Subordinated debt 802 831 455 76.1 All other liabilities 17,543 17,260 16,805 4.4 Total equity capital (includes minority interests) 242,820 243,295 235,950 2.9 Bank equity capital 242,708 243,193 235,831 2.9
Loans and leases 30-89 days past due 7,547 7,886 8,204 -8.0Noncurrent loans and leases 14,755 15,672 16,530 -10.7Restructured loans and leases 8,311 8,803 9,685 -14.2Mortgage-backed securities 178,728 183,316 184,594 -3.2Earning assets 2,001,297 1,995,831 1,945,723 2.9FHLB Advances 100,344 103,873 93,863 6.9Unused loan commitments 279,899 281,156 286,517 -2.3Trust assets 254,155 261,048 241,989 5.0Assets securitized and sold 13,056 16,616 15,357 -15.0Notional amount of derivatives 74,052 70,957 53,239 39.1
INCOME DATAFirst Three
Quarters 2016First Three
Quarters 2015 %Change3rd Quarter
20163rd Quarter
2015%Change
15Q3-16Q3
Total interest income $58,733 $57,453 2.2 $20,045 $19,658 2.0Total interest expense 6,734 6,528 3.2 2,314 2,208 4.8 Net interest income 52,000 50,925 2.1 17,731 17,450 1.6Provision for loan and lease losses 2,031 1,684 20.6 718 560 28.2Total noninterest income 14,885 14,621 1.8 5,303 4,953 7.1Total noninterest expense 44,437 44,623 -0.4 15,150 15,157 0.0Securities gains (losses) 601 453 32.6 189 100 89.6Applicable income taxes 4,937 4,473 10.4 1,721 1,592 8.1Extraordinary gains, net* 0 24 -98.5 -2 1 N/M Total net income (includes minority interests) 16,081 15,243 5.5 5,632 5,195 8.4 Bank net income 16,063 15,219 5.5 5,625 5,188 8.4Net charge-offs 1,328 1,301 2.0 564 478 18.0Cash dividends 7,151 6,888 3.8 2,151 2,209 -2.6Retained earnings 8,912 8,331 7.0 3,473 2,979 16.6 Net operating income 15,605 14,867 5.0 5,483 5,119 7.1
* See Notes to Users (page 30) for explanation. N/M - Not Meaningful
QUARTERLY BANKING PROFILE
FDIC QUARTERLY 19
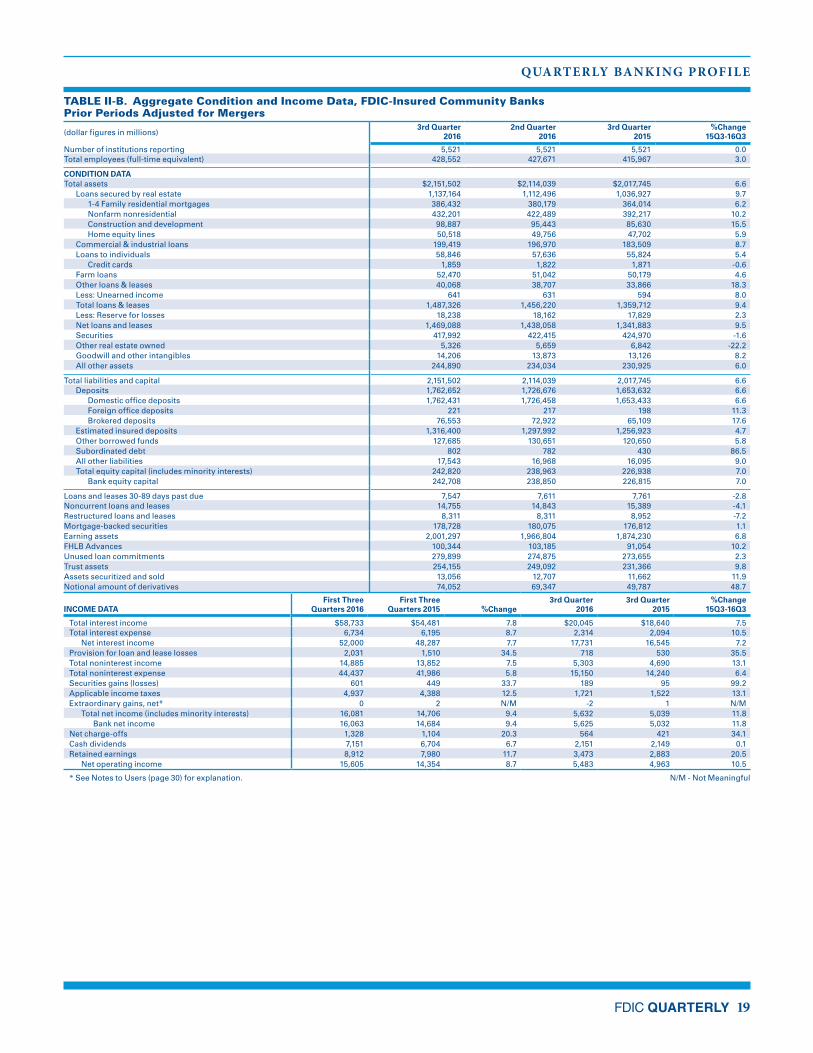
TABLE II-B. Aggregate Condition and Income Data, FDIC-Insured Community BanksPrior Periods Adjusted for Mergers
(dollar figures in millions) 3rd Quarter
20162nd Quarter
20163rd Quarter
2015%Change
15Q3-16Q3
Number of institutions reporting 5,521 5,521 5,521 0.0Total employees (full-time equivalent) 428,552 427,671 415,967 3.0
CONDITION DATATotal assets $2,151,502 $2,114,039 $2,017,745 6.6 Loans secured by real estate 1,137,164 1,112,496 1,036,927 9.7 1-4 Family residential mortgages 386,432 380,179 364,014 6.2 Nonfarm nonresidential 432,201 422,489 392,217 10.2 Construction and development 98,887 95,443 85,630 15.5 Home equity lines 50,518 49,756 47,702 5.9 Commercial & industrial loans 199,419 196,970 183,509 8.7 Loans to individuals 58,846 57,636 55,824 5.4 Credit cards 1,859 1,822 1,871 -0.6 Farm loans 52,470 51,042 50,179 4.6 Other loans & leases 40,068 38,707 33,866 18.3 Less: Unearned income 641 631 594 8.0 Total loans & leases 1,487,326 1,456,220 1,359,712 9.4 Less: Reserve for losses 18,238 18,162 17,829 2.3 Net loans and leases 1,469,088 1,438,058 1,341,883 9.5 Securities 417,992 422,415 424,970 -1.6 Other real estate owned 5,326 5,659 6,842 -22.2 Goodwill and other intangibles 14,206 13,873 13,126 8.2 All other assets 244,890 234,034 230,925 6.0
Total liabilities and capital 2,151,502 2,114,039 2,017,745 6.6 Deposits 1,762,652 1,726,676 1,653,632 6.6 Domestic office deposits 1,762,431 1,726,458 1,653,433 6.6 Foreign office deposits 221 217 198 11.3 Brokered deposits 76,553 72,922 65,109 17.6 Estimated insured deposits 1,316,400 1,297,992 1,256,923 4.7 Other borrowed funds 127,685 130,651 120,650 5.8 Subordinated debt 802 782 430 86.5 All other liabilities 17,543 16,968 16,095 9.0 Total equity capital (includes minority interests) 242,820 238,963 226,938 7.0 Bank equity capital 242,708 238,850 226,815 7.0
Loans and leases 30-89 days past due 7,547 7,611 7,761 -2.8Noncurrent loans and leases 14,755 14,843 15,389 -4.1Restructured loans and leases 8,311 8,311 8,952 -7.2Mortgage-backed securities 178,728 180,075 176,812 1.1Earning assets 2,001,297 1,966,804 1,874,230 6.8FHLB Advances 100,344 103,185 91,054 10.2Unused loan commitments 279,899 274,875 273,655 2.3Trust assets 254,155 249,092 231,366 9.8Assets securitized and sold 13,056 12,707 11,662 11.9Notional amount of derivatives 74,052 69,347 49,787 48.7
INCOME DATAFirst Three
Quarters 2016First Three
Quarters 2015 %Change3rd Quarter
20163rd Quarter
2015%Change
15Q3-16Q3
Total interest income $58,733 $54,481 7.8 $20,045 $18,640 7.5Total interest expense 6,734 6,195 8.7 2,314 2,094 10.5 Net interest income 52,000 48,287 7.7 17,731 16,545 7.2Provision for loan and lease losses 2,031 1,510 34.5 718 530 35.5Total noninterest income 14,885 13,852 7.5 5,303 4,690 13.1Total noninterest expense 44,437 41,986 5.8 15,150 14,240 6.4Securities gains (losses) 601 449 33.7 189 95 99.2Applicable income taxes 4,937 4,388 12.5 1,721 1,522 13.1Extraordinary gains, net* 0 2 N/M -2 1 N/M Total net income (includes minority interests) 16,081 14,706 9.4 5,632 5,039 11.8 Bank net income 16,063 14,684 9.4 5,625 5,032 11.8Net charge-offs 1,328 1,104 20.3 564 421 34.1Cash dividends 7,151 6,704 6.7 2,151 2,149 0.1Retained earnings 8,912 7,980 11.7 3,473 2,883 20.5 Net operating income 15,605 14,354 8.7 5,483 4,963 10.5
* See Notes to Users (page 30) for explanation. N/M - Not Meaningful
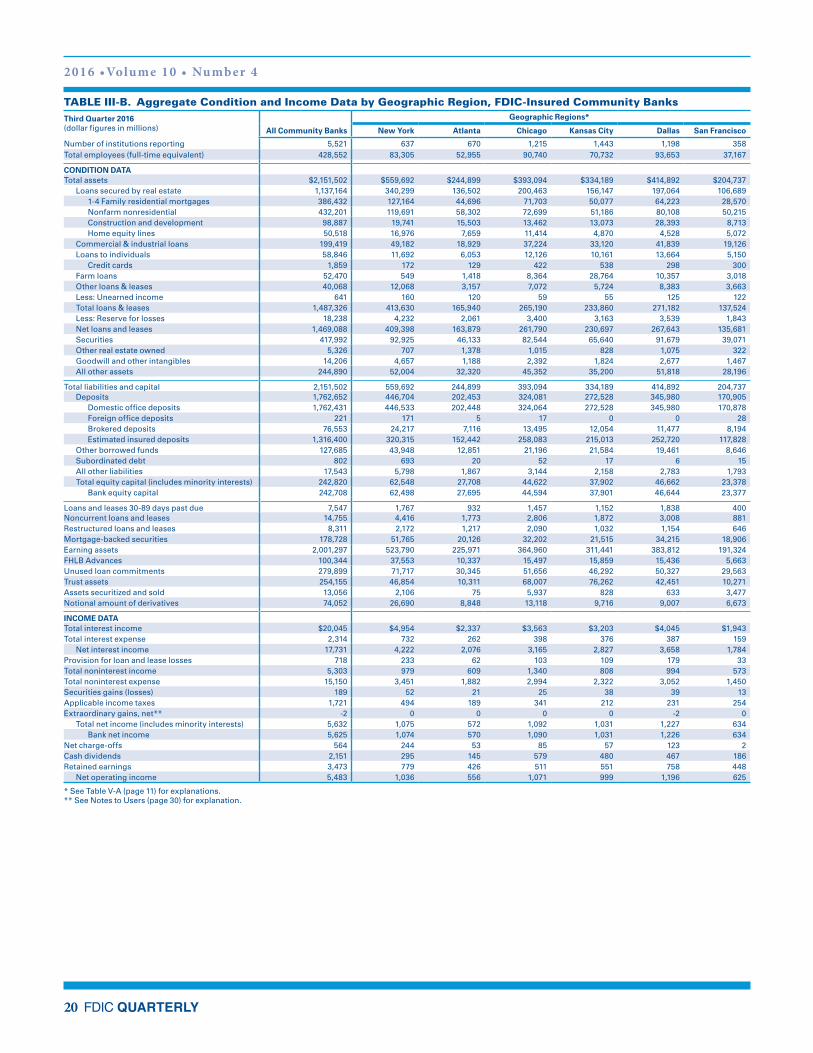
2016 •Volume 10 • Number 4
20 FDIC QUARTERLY
TABLE III-B. Aggregate Condition and Income Data by Geographic Region, FDIC-Insured Community BanksThird Quarter 2016(dollar figures in millions) All Community Banks
Geographic Regions*
New York Atlanta Chicago Kansas City Dallas San Francisco
Number of institutions reporting 5,521 637 670 1,215 1,443 1,198 358Total employees (full-time equivalent) 428,552 83,305 52,955 90,740 70,732 93,653 37,167
CONDITION DATATotal assets $2,151,502 $559,692 $244,899 $393,094 $334,189 $414,892 $204,737 Loans secured by real estate 1,137,164 340,299 136,502 200,463 156,147 197,064 106,689 1-4 Family residential mortgages 386,432 127,164 44,696 71,703 50,077 64,223 28,570 Nonfarm nonresidential 432,201 119,691 58,302 72,699 51,186 80,108 50,215 Construction and development 98,887 19,741 15,503 13,462 13,073 28,393 8,713 Home equity lines 50,518 16,976 7,659 11,414 4,870 4,528 5,072 Commercial & industrial loans 199,419 49,182 18,929 37,224 33,120 41,839 19,126 Loans to individuals 58,846 11,692 6,053 12,126 10,161 13,664 5,150 Credit cards 1,859 172 129 422 538 298 300 Farm loans 52,470 549 1,418 8,364 28,764 10,357 3,018 Other loans & leases 40,068 12,068 3,157 7,072 5,724 8,383 3,663 Less: Unearned income 641 160 120 59 55 125 122 Total loans & leases 1,487,326 413,630 165,940 265,190 233,860 271,182 137,524 Less: Reserve for losses 18,238 4,232 2,061 3,400 3,163 3,539 1,843 Net loans and leases 1,469,088 409,398 163,879 261,790 230,697 267,643 135,681 Securities 417,992 92,925 46,133 82,544 65,640 91,679 39,071 Other real estate owned 5,326 707 1,378 1,015 828 1,075 322 Goodwill and other intangibles 14,206 4,657 1,188 2,392 1,824 2,677 1,467 All other assets 244,890 52,004 32,320 45,352 35,200 51,818 28,196
Total liabilities and capital 2,151,502 559,692 244,899 393,094 334,189 414,892 204,737 Deposits 1,762,652 446,704 202,453 324,081 272,528 345,980 170,905 Domestic office deposits 1,762,431 446,533 202,448 324,064 272,528 345,980 170,878 Foreign office deposits 221 171 5 17 0 0 28 Brokered deposits 76,553 24,217 7,116 13,495 12,054 11,477 8,194 Estimated insured deposits 1,316,400 320,315 152,442 258,083 215,013 252,720 117,828 Other borrowed funds 127,685 43,948 12,851 21,196 21,584 19,461 8,646 Subordinated debt 802 693 20 52 17 6 15 All other liabilities 17,543 5,798 1,867 3,144 2,158 2,783 1,793 Total equity capital (includes minority interests) 242,820 62,548 27,708 44,622 37,902 46,662 23,378 Bank equity capital 242,708 62,498 27,695 44,594 37,901 46,644 23,377
Loans and leases 30-89 days past due 7,547 1,767 932 1,457 1,152 1,838 400Noncurrent loans and leases 14,755 4,416 1,773 2,806 1,872 3,008 881Restructured loans and leases 8,311 2,172 1,217 2,090 1,032 1,154 646Mortgage-backed securities 178,728 51,765 20,126 32,202 21,515 34,215 18,906Earning assets 2,001,297 523,790 225,971 364,960 311,441 383,812 191,324FHLB Advances 100,344 37,553 10,337 15,497 15,859 15,436 5,663Unused loan commitments 279,899 71,717 30,345 51,656 46,292 50,327 29,563Trust assets 254,155 46,854 10,311 68,007 76,262 42,451 10,271Assets securitized and sold 13,056 2,106 75 5,937 828 633 3,477Notional amount of derivatives 74,052 26,690 8,848 13,118 9,716 9,007 6,673
INCOME DATATotal interest income $20,045 $4,954 $2,337 $3,563 $3,203 $4,045 $1,943Total interest expense 2,314 732 262 398 376 387 159 Net interest income 17,731 4,222 2,076 3,165 2,827 3,658 1,784Provision for loan and lease losses 718 233 62 103 109 179 33Total noninterest income 5,303 979 609 1,340 808 994 573Total noninterest expense 15,150 3,451 1,882 2,994 2,322 3,052 1,450Securities gains (losses) 189 52 21 25 38 39 13Applicable income taxes 1,721 494 189 341 212 231 254Extraordinary gains, net** -2 0 0 0 0 -2 0 Total net income (includes minority interests) 5,632 1,075 572 1,092 1,031 1,227 634 Bank net income 5,625 1,074 570 1,090 1,031 1,226 634Net charge-offs 564 244 53 85 57 123 2Cash dividends 2,151 295 145 579 480 467 186Retained earnings 3,473 779 426 511 551 758 448 Net operating income 5,483 1,036 556 1,071 999 1,196 625
* See Table V-A (page 11) for explanations.** See Notes to Users (page 30) for explanation.
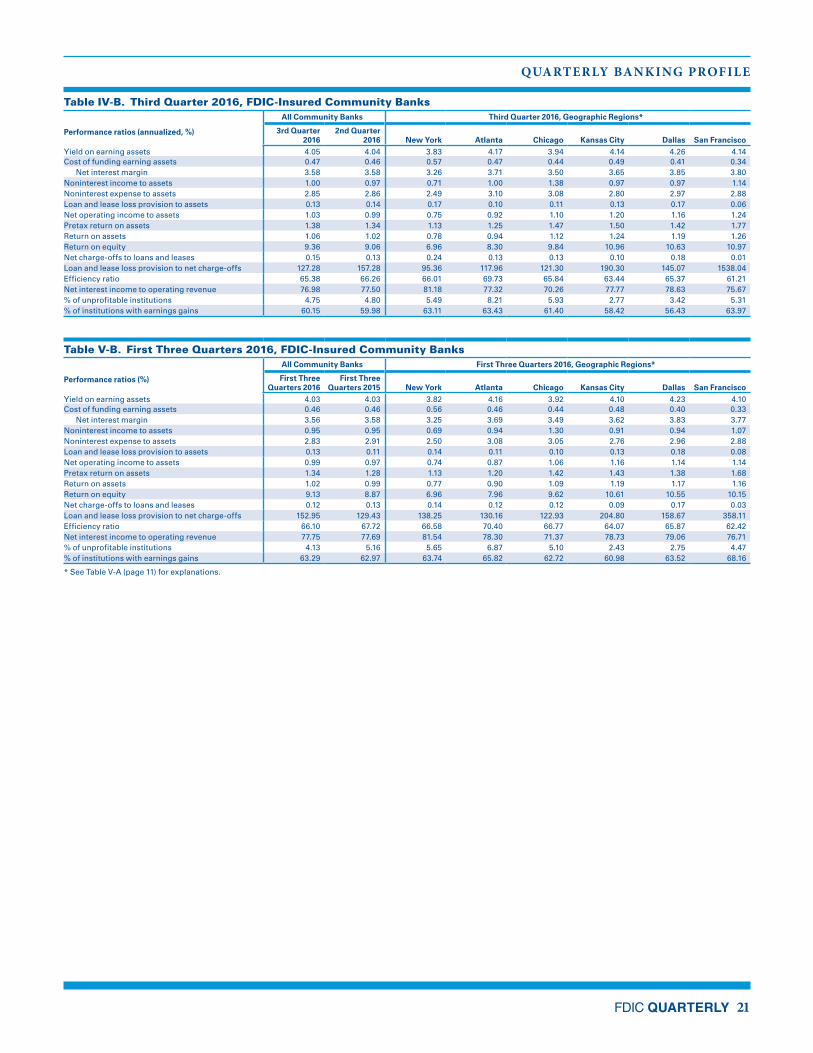
QUARTERLY BANKING PROFILE
FDIC QUARTERLY 21
Table IV-B. Third Quarter 2016, FDIC-Insured Community Banks
Performance ratios (annualized, %)
All Community Banks Third Quarter 2016, Geographic Regions*
3rd Quarter 2016
2nd Quarter 2016 New York Atlanta Chicago Kansas City Dallas San Francisco
Yield on earning assets 4.05 4.04 3.83 4.17 3.94 4.14 4.26 4.14Cost of funding earning assets 0.47 0.46 0.57 0.47 0.44 0.49 0.41 0.34 Net interest margin 3.58 3.58 3.26 3.71 3.50 3.65 3.85 3.80Noninterest income to assets 1.00 0.97 0.71 1.00 1.38 0.97 0.97 1.14Noninterest expense to assets 2.85 2.86 2.49 3.10 3.08 2.80 2.97 2.88Loan and lease loss provision to assets 0.13 0.14 0.17 0.10 0.11 0.13 0.17 0.06Net operating income to assets 1.03 0.99 0.75 0.92 1.10 1.20 1.16 1.24Pretax return on assets 1.38 1.34 1.13 1.25 1.47 1.50 1.42 1.77Return on assets 1.06 1.02 0.78 0.94 1.12 1.24 1.19 1.26Return on equity 9.36 9.06 6.96 8.30 9.84 10.96 10.63 10.97Net charge-offs to loans and leases 0.15 0.13 0.24 0.13 0.13 0.10 0.18 0.01Loan and lease loss provision to net charge-offs 127.28 157.28 95.36 117.96 121.30 190.30 145.07 1538.04Efficiency ratio 65.38 66.26 66.01 69.73 65.84 63.44 65.37 61.21Net interest income to operating revenue 76.98 77.50 81.18 77.32 70.26 77.77 78.63 75.67% of unprofitable institutions 4.75 4.80 5.49 8.21 5.93 2.77 3.42 5.31% of institutions with earnings gains 60.15 59.98 63.11 63.43 61.40 58.42 56.43 63.97
Table V-B. First Three Quarters 2016, FDIC-Insured Community Banks
Performance ratios (%)
All Community Banks First Three Quarters 2016, Geographic Regions*
First Three Quarters 2016
First Three Quarters 2015 New York Atlanta Chicago Kansas City Dallas San Francisco
Yield on earning assets 4.03 4.03 3.82 4.16 3.92 4.10 4.23 4.10Cost of funding earning assets 0.46 0.46 0.56 0.46 0.44 0.48 0.40 0.33 Net interest margin 3.56 3.58 3.25 3.69 3.49 3.62 3.83 3.77Noninterest income to assets 0.95 0.95 0.69 0.94 1.30 0.91 0.94 1.07Noninterest expense to assets 2.83 2.91 2.50 3.08 3.05 2.76 2.96 2.88Loan and lease loss provision to assets 0.13 0.11 0.14 0.11 0.10 0.13 0.18 0.08Net operating income to assets 0.99 0.97 0.74 0.87 1.06 1.16 1.14 1.14Pretax return on assets 1.34 1.28 1.13 1.20 1.42 1.43 1.38 1.68Return on assets 1.02 0.99 0.77 0.90 1.09 1.19 1.17 1.16Return on equity 9.13 8.87 6.96 7.96 9.62 10.61 10.55 10.15Net charge-offs to loans and leases 0.12 0.13 0.14 0.12 0.12 0.09 0.17 0.03Loan and lease loss provision to net charge-offs 152.95 129.43 138.25 130.16 122.93 204.80 158.67 358.11Efficiency ratio 66.10 67.72 66.58 70.40 66.77 64.07 65.87 62.42Net interest income to operating revenue 77.75 77.69 81.54 78.30 71.37 78.73 79.06 76.71% of unprofitable institutions 4.13 5.16 5.65 6.87 5.10 2.43 2.75 4.47% of institutions with earnings gains 63.29 62.97 63.74 65.82 62.72 60.98 63.52 68.16
* See Table V-A (page 11) for explanations.
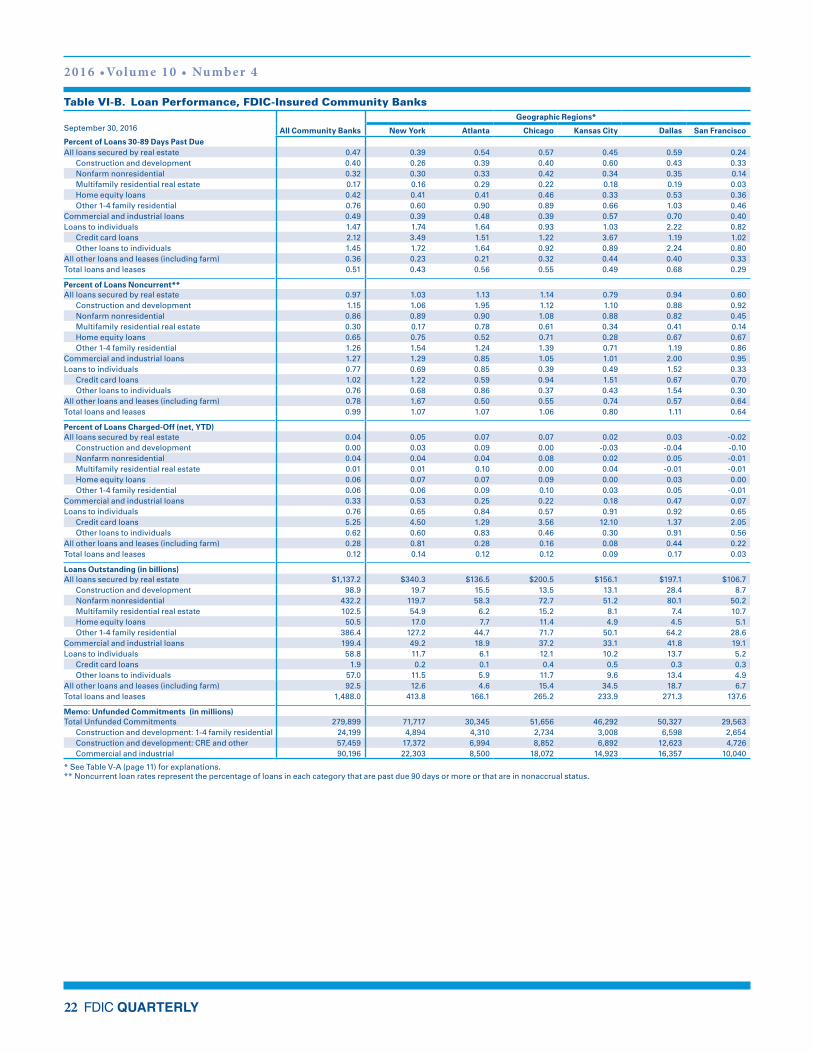
2016 •Volume 10 • Number 4
22 FDIC QUARTERLY
Table VI-B. Loan Performance, FDIC-Insured Community Banks
September 30, 2016Geographic Regions*
All Community Banks New York Atlanta Chicago Kansas City Dallas San FranciscoPercent of Loans 30-89 Days Past DueAll loans secured by real estate 0.47 0.39 0.54 0.57 0.45 0.59 0.24 Construction and development 0.40 0.26 0.39 0.40 0.60 0.43 0.33 Nonfarm nonresidential 0.32 0.30 0.33 0.42 0.34 0.35 0.14 Multifamily residential real estate 0.17 0.16 0.29 0.22 0.18 0.19 0.03 Home equity loans 0.42 0.41 0.41 0.46 0.33 0.53 0.36 Other 1-4 family residential 0.76 0.60 0.90 0.89 0.66 1.03 0.46Commercial and industrial loans 0.49 0.39 0.48 0.39 0.57 0.70 0.40Loans to individuals 1.47 1.74 1.64 0.93 1.03 2.22 0.82 Credit card loans 2.12 3.49 1.51 1.22 3.67 1.19 1.02 Other loans to individuals 1.45 1.72 1.64 0.92 0.89 2.24 0.80All other loans and leases (including farm) 0.36 0.23 0.21 0.32 0.44 0.40 0.33Total loans and leases 0.51 0.43 0.56 0.55 0.49 0.68 0.29
Percent of Loans Noncurrent**All loans secured by real estate 0.97 1.03 1.13 1.14 0.79 0.94 0.60 Construction and development 1.15 1.06 1.95 1.12 1.10 0.88 0.92 Nonfarm nonresidential 0.86 0.89 0.90 1.08 0.88 0.82 0.45 Multifamily residential real estate 0.30 0.17 0.78 0.61 0.34 0.41 0.14 Home equity loans 0.65 0.75 0.52 0.71 0.28 0.67 0.67 Other 1-4 family residential 1.26 1.54 1.24 1.39 0.71 1.19 0.86Commercial and industrial loans 1.27 1.29 0.85 1.05 1.01 2.00 0.95Loans to individuals 0.77 0.69 0.85 0.39 0.49 1.52 0.33 Credit card loans 1.02 1.22 0.59 0.94 1.51 0.67 0.70 Other loans to individuals 0.76 0.68 0.86 0.37 0.43 1.54 0.30All other loans and leases (including farm) 0.78 1.67 0.50 0.55 0.74 0.57 0.64Total loans and leases 0.99 1.07 1.07 1.06 0.80 1.11 0.64
Percent of Loans Charged-Off (net, YTD)All loans secured by real estate 0.04 0.05 0.07 0.07 0.02 0.03 -0.02 Construction and development 0.00 0.03 0.09 0.00 -0.03 -0.04 -0.10 Nonfarm nonresidential 0.04 0.04 0.04 0.08 0.02 0.05 -0.01 Multifamily residential real estate 0.01 0.01 0.10 0.00 0.04 -0.01 -0.01 Home equity loans 0.06 0.07 0.07 0.09 0.00 0.03 0.00 Other 1-4 family residential 0.06 0.06 0.09 0.10 0.03 0.05 -0.01Commercial and industrial loans 0.33 0.53 0.25 0.22 0.18 0.47 0.07Loans to individuals 0.76 0.65 0.84 0.57 0.91 0.92 0.65 Credit card loans 5.25 4.50 1.29 3.56 12.10 1.37 2.05 Other loans to individuals 0.62 0.60 0.83 0.46 0.30 0.91 0.56All other loans and leases (including farm) 0.28 0.81 0.28 0.16 0.08 0.44 0.22Total loans and leases 0.12 0.14 0.12 0.12 0.09 0.17 0.03
Loans Outstanding (in billions)All loans secured by real estate $1,137.2 $340.3 $136.5 $200.5 $156.1 $197.1 $106.7 Construction and development 98.9 19.7 15.5 13.5 13.1 28.4 8.7 Nonfarm nonresidential 432.2 119.7 58.3 72.7 51.2 80.1 50.2 Multifamily residential real estate 102.5 54.9 6.2 15.2 8.1 7.4 10.7 Home equity loans 50.5 17.0 7.7 11.4 4.9 4.5 5.1 Other 1-4 family residential 386.4 127.2 44.7 71.7 50.1 64.2 28.6Commercial and industrial loans 199.4 49.2 18.9 37.2 33.1 41.8 19.1Loans to individuals 58.8 11.7 6.1 12.1 10.2 13.7 5.2 Credit card loans 1.9 0.2 0.1 0.4 0.5 0.3 0.3 Other loans to individuals 57.0 11.5 5.9 11.7 9.6 13.4 4.9All other loans and leases (including farm) 92.5 12.6 4.6 15.4 34.5 18.7 6.7Total loans and leases 1,488.0 413.8 166.1 265.2 233.9 271.3 137.6
Memo: Unfunded Commitments (in millions)Total Unfunded Commitments 279,899 71,717 30,345 51,656 46,292 50,327 29,563 Construction and development: 1-4 family residential 24,199 4,894 4,310 2,734 3,008 6,598 2,654 Construction and development: CRE and other 57,459 17,372 6,994 8,852 6,892 12,623 4,726 Commercial and industrial 90,196 22,303 8,500 18,072 14,923 16,357 10,040
* See Table V-A (page 11) for explanations.** Noncurrent loan rates represent the percentage of loans in each category that are past due 90 days or more or that are in nonaccrual status.
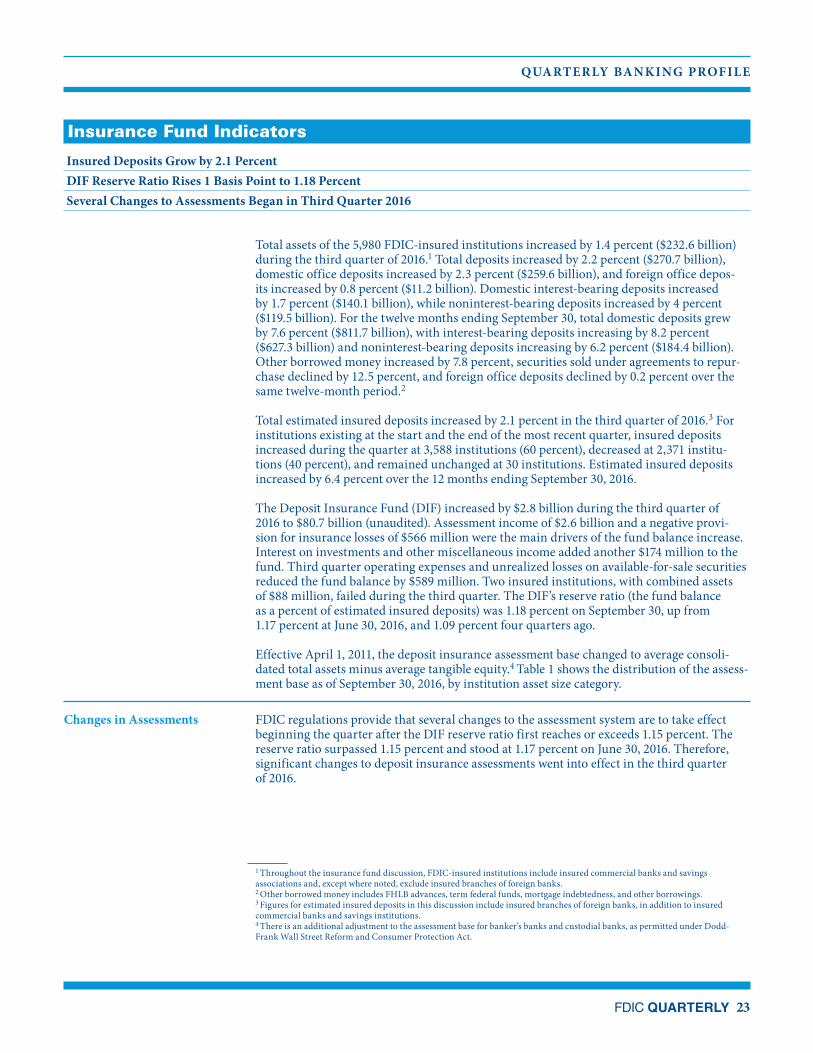
QUARTERLY BANKING PROFILE
FDIC QUARTERLY 23
Insurance Fund Indicators
Insured Deposits Grow by 2.1 PercentDIF Reserve Ratio Rises 1 Basis Point to 1.18 PercentSeveral Changes to Assessments Began in Third Quarter 2016
Total assets of the 5,980 FDIC-insured institutions increased by 1.4 percent ($232.6 billion) during the third quarter of 2016.1 Total deposits increased by 2.2 percent ($270.7 billion), domestic office deposits increased by 2.3 percent ($259.6 billion), and foreign office depos-its increased by 0.8 percent ($11.2 billion). Domestic interest-bearing deposits increased by 1.7 percent ($140.1 billion), while noninterest-bearing deposits increased by 4 percent ($119.5 billion). For the twelve months ending September 30, total domestic deposits grew by 7.6 percent ($811.7 billion), with interest-bearing deposits increasing by 8.2 percent ($627.3 billion) and noninterest-bearing deposits increasing by 6.2 percent ($184.4 billion). Other borrowed money increased by 7.8 percent, securities sold under agreements to repur-chase declined by 12.5 percent, and foreign office deposits declined by 0.2 percent over the same twelve-month period.2
Total estimated insured deposits increased by 2.1 percent in the third quarter of 2016.3 For institutions existing at the start and the end of the most recent quarter, insured deposits increased during the quarter at 3,588 institutions (60 percent), decreased at 2,371 institu-tions (40 percent), and remained unchanged at 30 institutions. Estimated insured deposits increased by 6.4 percent over the 12 months ending September 30, 2016.
The Deposit Insurance Fund (DIF) increased by $2.8 billion during the third quarter of 2016 to $80.7 billion (unaudited). Assessment income of $2.6 billion and a negative provi-sion for insurance losses of $566 million were the main drivers of the fund balance increase. Interest on investments and other miscellaneous income added another $174 million to the fund. Third quarter operating expenses and unrealized losses on available-for-sale securities reduced the fund balance by $589 million. Two insured institutions, with combined assets of $88 million, failed during the third quarter. The DIF’s reserve ratio (the fund balance as a percent of estimated insured deposits) was 1.18 percent on September 30, up from 1.17 percent at June 30, 2016, and 1.09 percent four quarters ago.
Effective April 1, 2011, the deposit insurance assessment base changed to average consoli-dated total assets minus average tangible equity.4 Table 1 shows the distribution of the assess-ment base as of September 30, 2016, by institution asset size category.
Changes in Assessments FDIC regulations provide that several changes to the assessment system are to take effect beginning the quarter after the DIF reserve ratio first reaches or exceeds 1.15 percent. The reserve ratio surpassed 1.15 percent and stood at 1.17 percent on June 30, 2016. Therefore, significant changes to deposit insurance assessments went into effect in the third quarter of 2016.
1 Throughout the insurance fund discussion, FDIC-insured institutions include insured commercial banks and savings associations and, except where noted, exclude insured branches of foreign banks. 2 Other borrowed money includes FHLB advances, term federal funds, mortgage indebtedness, and other borrowings.3 Figures for estimated insured deposits in this discussion include insured branches of foreign banks, in addition to insured commercial banks and savings institutions.4 There is an additional adjustment to the assessment base for banker’s banks and custodial banks, as permitted under Dodd-Frank Wall Street Reform and Consumer Protection Act.
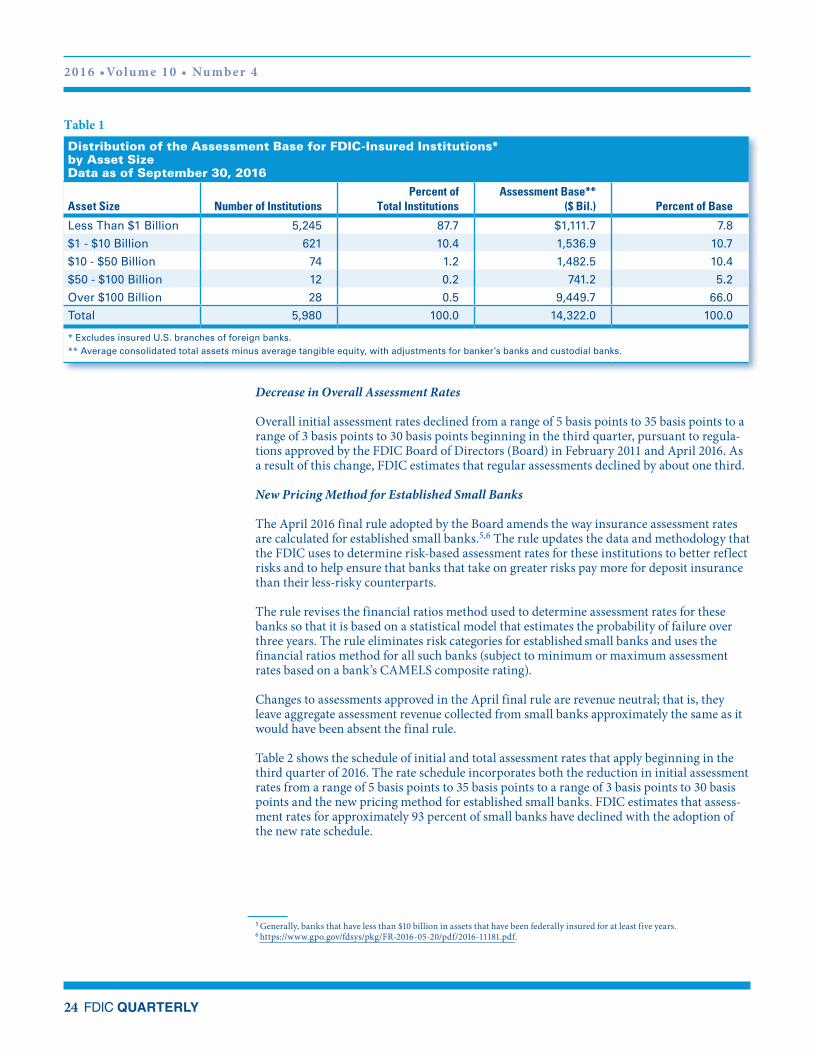
2016 •Volume 10 • Number 4
24 FDIC QUARTERLY
Decrease in Overall Assessment Rates
Overall initial assessment rates declined from a range of 5 basis points to 35 basis points to a range of 3 basis points to 30 basis points beginning in the third quarter, pursuant to regula-tions approved by the FDIC Board of Directors (Board) in February 2011 and April 2016. As a result of this change, FDIC estimates that regular assessments declined by about one third.
New Pricing Method for Established Small Banks
The April 2016 final rule adopted by the Board amends the way insurance assessment rates are calculated for established small banks.5,6 The rule updates the data and methodology that the FDIC uses to determine risk-based assessment rates for these institutions to better reflect risks and to help ensure that banks that take on greater risks pay more for deposit insurance than their less-risky counterparts.
The rule revises the financial ratios method used to determine assessment rates for these banks so that it is based on a statistical model that estimates the probability of failure over three years. The rule eliminates risk categories for established small banks and uses the financial ratios method for all such banks (subject to minimum or maximum assessment rates based on a bank’s CAMELS composite rating).
Changes to assessments approved in the April final rule are revenue neutral; that is, they leave aggregate assessment revenue collected from small banks approximately the same as it would have been absent the final rule.
Table 2 shows the schedule of initial and total assessment rates that apply beginning in the third quarter of 2016. The rate schedule incorporates both the reduction in initial assessment rates from a range of 5 basis points to 35 basis points to a range of 3 basis points to 30 basis points and the new pricing method for established small banks. FDIC estimates that assess-ment rates for approximately 93 percent of small banks have declined with the adoption of the new rate schedule.
Distribution of the Assessment Base for FDIC-Insured Institutions* by Asset SizeData as of September 30, 2016
Asset Size Number of InstitutionsPercent of
Total InstitutionsAssessment Base**
($ Bil.) Percent of Base
Less Than $1 Billion 5,245 87.7 $1,111.7 7.8
$1 - $10 Billion 621 10.4 1,536.9 10.7
$10 - $50 Billion 74 1.2 1,482.5 10.4
$50 - $100 Billion 12 0.2 741.2 5.2
Over $100 Billion 28 0.5 9,449.7 66.0
Total 5,980 100.0 14,322.0 100.0
* Excludes insured U.S. branches of foreign banks.** Average consolidated total assets minus average tangible equity, with adjustments for banker’s banks and custodial banks.
Table 1
5 Generally, banks that have less than $10 billion in assets that have been federally insured for at least five years.6 https://www.gpo.gov/fdsys/pkg/FR-2016-05-20/pdf/2016-11181.pdf.
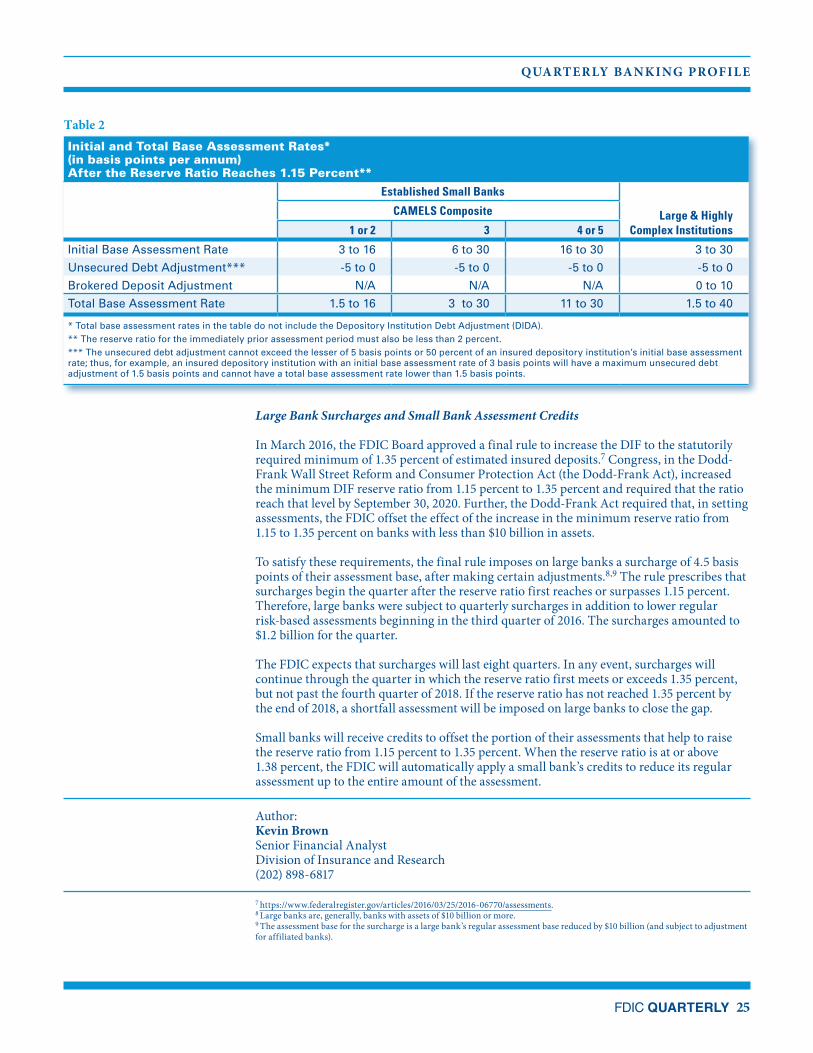
QUARTERLY BANKING PROFILE
FDIC QUARTERLY 25
Initial and Total Base Assessment Rates* (in basis points per annum)After the Reserve Ratio Reaches 1.15 Percent**
Established Small Banks
Large & Highly Complex Institutions
CAMELS Composite
1 or 2 3 4 or 5
Initial Base Assessment Rate 3 to 16 6 to 30 16 to 30 3 to 30
Unsecured Debt Adjustment*** -5 to 0 -5 to 0 -5 to 0 -5 to 0
Brokered Deposit Adjustment N/A N/A N/A 0 to 10
Total Base Assessment Rate 1.5 to 16 3 to 30 11 to 30 1.5 to 40
* Total base assessment rates in the table do not include the Depository Institution Debt Adjustment (DIDA).** The reserve ratio for the immediately prior assessment period must also be less than 2 percent.*** The unsecured debt adjustment cannot exceed the lesser of 5 basis points or 50 percent of an insured depository institution’s initial base assessment rate; thus, for example, an insured depository institution with an initial base assessment rate of 3 basis points will have a maximum unsecured debt adjustment of 1.5 basis points and cannot have a total base assessment rate lower than 1.5 basis points.
Table 2
Large Bank Surcharges and Small Bank Assessment Credits
In March 2016, the FDIC Board approved a final rule to increase the DIF to the statutorily required minimum of 1.35 percent of estimated insured deposits.7 Congress, in the Dodd-Frank Wall Street Reform and Consumer Protection Act (the Dodd-Frank Act), increased the minimum DIF reserve ratio from 1.15 percent to 1.35 percent and required that the ratio reach that level by September 30, 2020. Further, the Dodd-Frank Act required that, in setting assessments, the FDIC offset the effect of the increase in the minimum reserve ratio from 1.15 to 1.35 percent on banks with less than $10 billion in assets.
To satisfy these requirements, the final rule imposes on large banks a surcharge of 4.5 basis points of their assessment base, after making certain adjustments.8,9 The rule prescribes that surcharges begin the quarter after the reserve ratio first reaches or surpasses 1.15 percent. Therefore, large banks were subject to quarterly surcharges in addition to lower regular risk-based assessments beginning in the third quarter of 2016. The surcharges amounted to $1.2 billion for the quarter.
The FDIC expects that surcharges will last eight quarters. In any event, surcharges will continue through the quarter in which the reserve ratio first meets or exceeds 1.35 percent, but not past the fourth quarter of 2018. If the reserve ratio has not reached 1.35 percent by the end of 2018, a shortfall assessment will be imposed on large banks to close the gap.
Small banks will receive credits to offset the portion of their assessments that help to raise the reserve ratio from 1.15 percent to 1.35 percent. When the reserve ratio is at or above 1.38 percent, the FDIC will automatically apply a small bank’s credits to reduce its regular assessment up to the entire amount of the assessment.
Author: Kevin Brown Senior Financial Analyst Division of Insurance and Research (202) 898-6817
7 https://www.federalregister.gov/articles/2016/03/25/2016-06770/assessments. 8 Large banks are, generally, banks with assets of $10 billion or more.9 The assessment base for the surcharge is a large bank’s regular assessment base reduced by $10 billion (and subject to adjustment for affiliated banks).
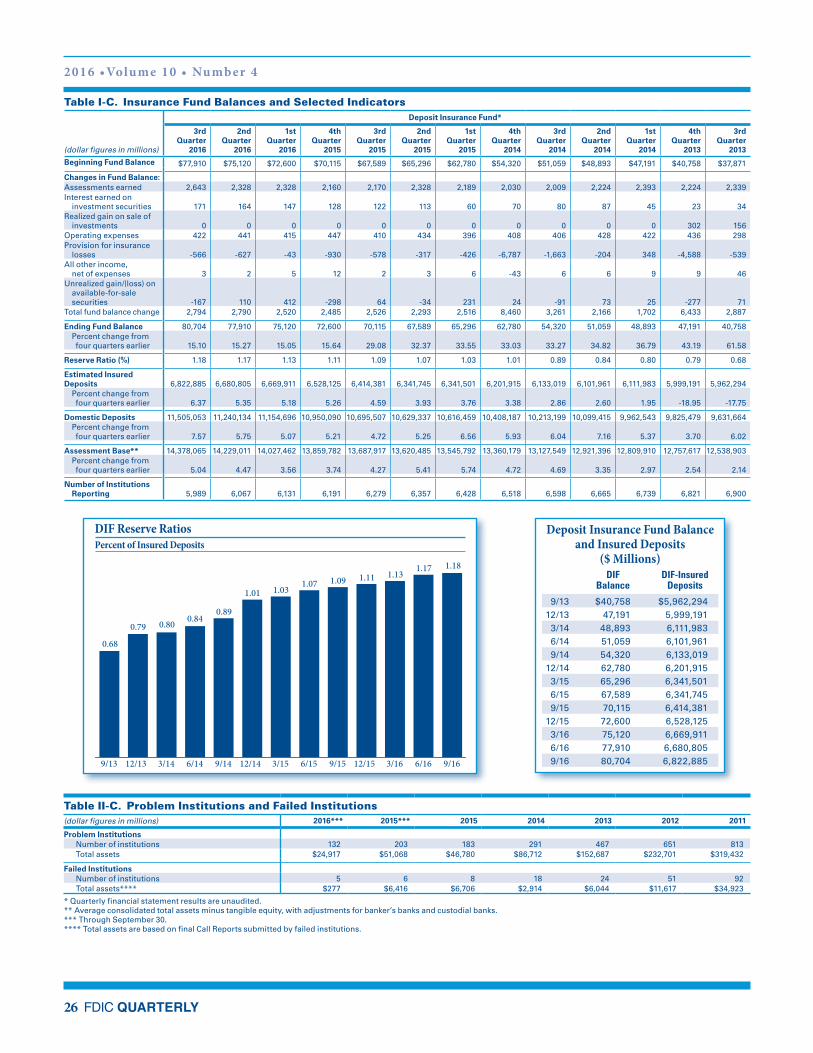
2016 •Volume 10 • Number 4
26 FDIC QUARTERLY
DIF Reserve RatiosPercent of Insured Deposits
0.89
1.01 1.03 1.07 1.09 1.111.17
0.68
0.79 0.80 0.84
1.131.18
9/13 12/13 3/14 6/14 9/14 12/14 3/15 6/15 9/15 12/15 3/16 6/16 9/16
Table I-C. Insurance Fund Balances and Selected Indicators
(dollar figures in millions)
Deposit Insurance Fund*
3rd Quarter
2016
2nd Quarter
2016
1st Quarter
2016
4th Quarter
2015
3rd Quarter
2015
2nd Quarter
2015
1st Quarter
2015
4th Quarter
2014
3rd Quarter
2014
2nd Quarter
2014
1st Quarter
2014
4th Quarter
2013
3rd Quarter
2013
Beginning Fund Balance $77,910 $75,120 $72,600 $70,115 $67,589 $65,296 $62,780 $54,320 $51,059 $48,893 $47,191 $40,758 $37,871
Changes in Fund Balance:Assessments earned 2,643 2,328 2,328 2,160 2,170 2,328 2,189 2,030 2,009 2,224 2,393 2,224 2,339Interest earned on investment securities 171 164 147 128 122 113 60 70 80 87 45 23 34Realized gain on sale of investments 0 0 0 0 0 0 0 0 0 0 0 302 156Operating expenses 422 441 415 447 410 434 396 408 406 428 422 436 298Provision for insurance losses -566 -627 -43 -930 -578 -317 -426 -6,787 -1,663 -204 348 -4,588 -539All other income, net of expenses 3 2 5 12 2 3 6 -43 6 6 9 9 46Unrealized gain/(loss) on available-for-sale securities -167 110 412 -298 64 -34 231 24 -91 73 25 -277 71Total fund balance change 2,794 2,790 2,520 2,485 2,526 2,293 2,516 8,460 3,261 2,166 1,702 6,433 2,887
Ending Fund Balance 80,704 77,910 75,120 72,600 70,115 67,589 65,296 62,780 54,320 51,059 48,893 47,191 40,758 Percent change from four quarters earlier 15.10 15.27 15.05 15.64 29.08 32.37 33.55 33.03 33.27 34.82 36.79 43.19 61.58
Reserve Ratio (%) 1.18 1.17 1.13 1.11 1.09 1.07 1.03 1.01 0.89 0.84 0.80 0.79 0.68
Estimated Insured Deposits 6,822,885 6,680,805 6,669,911 6,528,125 6,414,381 6,341,745 6,341,501 6,201,915 6,133,019 6,101,961 6,111,983 5,999,191 5,962,294 Percent change from four quarters earlier 6.37 5.35 5.18 5.26 4.59 3.93 3.76 3.38 2.86 2.60 1.95 -18.95 -17.75
Domestic Deposits 11,505,053 11,240,134 11,154,696 10,950,090 10,695,507 10,629,337 10,616,459 10,408,187 10,213,199 10,099,415 9,962,543 9,825,479 9,631,664 Percent change from four quarters earlier 7.57 5.75 5.07 5.21 4.72 5.25 6.56 5.93 6.04 7.16 5.37 3.70 6.02
Assessment Base** 14,378,065 14,229,011 14,027,462 13,859,782 13,687,917 13,620,485 13,545,792 13,360,179 13,127,549 12,921,396 12,809,910 12,757,617 12,538,903 Percent change from four quarters earlier 5.04 4.47 3.56 3.74 4.27 5.41 5.74 4.72 4.69 3.35 2.97 2.54 2.14
Number of Institutions Reporting 5,989 6,067 6,131 6,191 6,279 6,357 6,428 6,518 6,598 6,665 6,739 6,821 6,900
Deposit Insurance Fund Balance and Insured Deposits
($ Millions)DIF
BalanceDIF-Insured
Deposits
9/13 $40,758 $5,962,29412/13 47,191 5,999,1913/14 48,893 6,111,9836/14 51,059 6,101,9619/14 54,320 6,133,019
12/14 62,780 6,201,9153/15 65,296 6,341,5016/15 67,589 6,341,7459/15 70,115 6,414,381
12/15 72,600 6,528,1253/16 75,120 6,669,9116/16 77,910 6,680,8059/16 80,704 6,822,885
Table II-C. Problem Institutions and Failed Institutions(dollar figures in millions) 2016*** 2015*** 2015 2014 2013 2012 2011
Problem Institutions Number of institutions 132 203 183 291 467 651 813 Total assets $24,917 $51,068 $46,780 $86,712 $152,687 $232,701 $319,432
Failed Institutions Number of institutions 5 6 8 18 24 51 92 Total assets**** $277 $6,416 $6,706 $2,914 $6,044 $11,617 $34,923
* Quarterly financial statement results are unaudited.** Average consolidated total assets minus tangible equity, with adjustments for banker’s banks and custodial banks.*** Through September 30.**** Total assets are based on final Call Reports submitted by failed institutions.
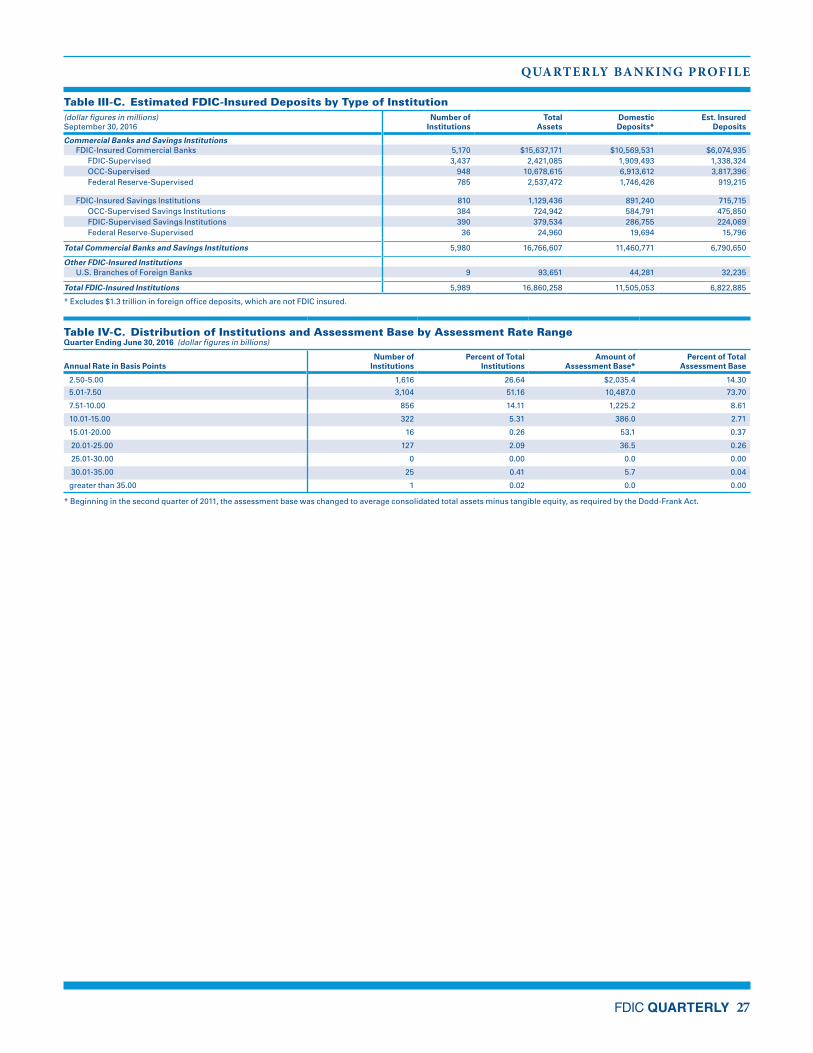
QUARTERLY BANKING PROFILE
FDIC QUARTERLY 27
Table III-C. Estimated FDIC-Insured Deposits by Type of Institution(dollar figures in millions)September 30, 2016
Number of Institutions
Total Assets
Domestic Deposits*
Est. Insured Deposits
Commercial Banks and Savings Institutions FDIC-Insured Commercial Banks 5,170 $15,637,171 $10,569,531 $6,074,935 FDIC-Supervised 3,437 2,421,085 1,909,493 1,338,324 OCC-Supervised 948 10,678,615 6,913,612 3,817,396 Federal Reserve-Supervised 785 2,537,472 1,746,426 919,215
FDIC-Insured Savings Institutions 810 1,129,436 891,240 715,715 OCC-Supervised Savings Institutions 384 724,942 584,791 475,850 FDIC-Supervised Savings Institutions 390 379,534 286,755 224,069 Federal Reserve-Supervised 36 24,960 19,694 15,796
Total Commercial Banks and Savings Institutions 5,980 16,766,607 11,460,771 6,790,650
Other FDIC-Insured Institutions U.S. Branches of Foreign Banks 9 93,651 44,281 32,235
Total FDIC-Insured Institutions 5,989 16,860,258 11,505,053 6,822,885
* Excludes $1.3 trillion in foreign office deposits, which are not FDIC insured.
Table IV-C. Distribution of Institutions and Assessment Base by Assessment Rate RangeQuarter Ending June 30, 2016 (dollar figures in billions)
Annual Rate in Basis PointsNumber of
InstitutionsPercent of Total
InstitutionsAmount of
Assessment Base*Percent of Total
Assessment Base
2.50-5.00 1,616 26.64 $2,035.4 14.30
5.01-7.50 3,104 51.16 10,487.0 73.70
7.51-10.00 856 14.11 1,225.2 8.61
10.01-15.00 322 5.31 386.0 2.71
15.01-20.00 16 0.26 53.1 0.37
20.01-25.00 127 2.09 36.5 0.26
25.01-30.00 0 0.00 0.0 0.00
30.01-35.00 25 0.41 5.7 0.04
greater than 35.00 1 0.02 0.0 0.00
* Beginning in the second quarter of 2011, the assessment base was changed to average consolidated total assets minus tangible equity, as required by the Dodd-Frank Act.
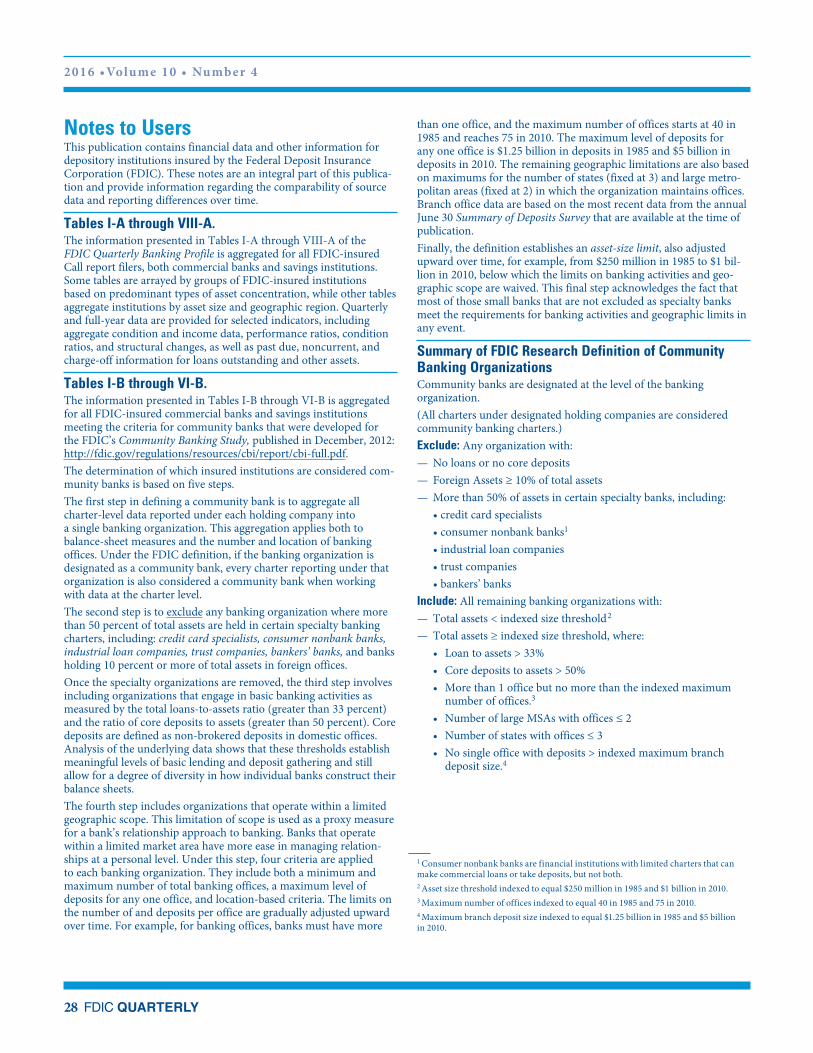
2016 •Volume 10 • Number 4
28 FDIC QUARTERLY
Notes to UsersThis publication contains financial data and other information for depository institutions insured by the Federal Deposit Insurance Corporation (FDIC). These notes are an integral part of this publica-tion and provide information regarding the com parability of source data and reporting differences over time.
Tables I-A through VIII-A.The information presented in Tables I-A through VIII-A of the FDIC Quarterly Banking Profile is aggregated for all FDIC-insured Call report filers, both commercial banks and savings institutions. Some tables are arrayed by groups of FDIC-insured institutions based on predominant types of asset concentration, while other tables aggregate institutions by asset size and geographic region. Quarterly and full-year data are provided for selected indicators, including aggregate condition and income data, performance ratios, condition ratios, and structural changes, as well as past due, noncurrent, and charge-off information for loans outstanding and other assets.
Tables I-B through VI-B.The information presented in Tables I-B through VI-B is aggregated for all FDIC-insured commercial banks and savings institutions meeting the criteria for community banks that were developed for the FDIC’s Community Banking Study, published in December, 2012: http://fdic.gov/regulations/resources/cbi/report/cbi-full.pdf.The determination of which insured institutions are considered com-munity banks is based on five steps.The first step in defining a community bank is to aggre gate all charter-level data reported under each holding company into a single banking organization. This aggrega tion applies both to balance-sheet measures and the number and location of banking offices. Under the FDIC definition, if the banking organization is designated as a community bank, every charter reporting under that organization is also considered a community bank when working with data at the charter level.The second step is to exclude any banking organization where more than 50 percent of total assets are held in certain specialty banking charters, including: credit card specialists, consumer nonbank banks, industrial loan compa nies, trust companies, bankers’ banks, and banks holding 10 percent or more of total assets in foreign offices.Once the specialty organizations are removed, the third step involves including organizations that engage in basic banking activities as measured by the total loans-to-assets ratio (greater than 33 percent) and the ratio of core depos its to assets (greater than 50 percent). Core deposits are defined as non-brokered deposits in domestic offices. Analysis of the underlying data shows that these thresholds establish meaningful levels of basic lending and deposit gathering and still allow for a degree of diversity in how indi vidual banks construct their balance sheets.The fourth step includes organizations that operate within a limited geographic scope. This limitation of scope is used as a proxy measure for a bank’s relationship approach to banking. Banks that operate within a limited market area have more ease in managing relation-ships at a personal level. Under this step, four criteria are applied to each banking organization. They include both a minimum and maximum number of total banking offices, a maximum level of deposits for any one office, and location-based criteria. The limits on the number of and deposits per office are gradually adjusted upward over time. For example, for banking offices, banks must have more
than one office, and the maximum number of offices starts at 40 in 1985 and reaches 75 in 2010. The maximum level of deposits for any one office is $1.25 billion in deposits in 1985 and $5 billion in deposits in 2010. The remaining geographic limitations are also based on maximums for the number of states (fixed at 3) and large metro-politan areas (fixed at 2) in which the organization maintains offices. Branch office data are based on the most recent data from the annual June 30 Summary of Deposits Survey that are available at the time of publication.Finally, the definition establishes an asset-size limit, also adjusted upward over time, for example, from $250 million in 1985 to $1 bil-lion in 2010, below which the limits on banking activi ties and geo-graphic scope are waived. This final step acknowledges the fact that most of those small banks that are not excluded as specialty banks meet the requirements for banking activities and geographic limits in any event.
Summary of FDIC Research Definition of Community Banking OrganizationsCommunity banks are designated at the level of the banking organization.(All charters under designated holding companies are considered community banking charters.)Exclude: Any organization with:— No loans or no core deposits— Foreign Assets ≥ 10% of total assets— More than 50% of assets in certain specialty banks, including:
• credit card specialists• consumer nonbank banks1
• industrial loan companies• trust companies• bankers’ banks
Include: All remaining banking organizations with:— Total assets < indexed size threshold 2
— Total assets ≥ indexed size threshold, where:• Loan to assets > 33%• Core deposits to assets > 50%• More than 1 office but no more than the indexed maximum
number of offices.3
• Number of large MSAs with offices ≤ 2• Number of states with offices ≤ 3• No single office with deposits > indexed maximum branch
deposit size.4
1 Consumer nonbank banks are financial institutions with limited charters that can make commercial loans or take deposits, but not both.2 Asset size threshold indexed to equal $250 million in 1985 and $1 billion in 2010.3 Maximum number of offices indexed to equal 40 in 1985 and 75 in 2010.4 Maximum branch deposit size indexed to equal $1.25 billion in 1985 and $5 billion in 2010.
QUARTERLY BANKING PROFILE
FDIC QUARTERLY 29
Tables I-C through IV-C.A separate set of tables (Tables I-C through IV-C) provides compara-tive quarterly data related to the Deposit Insurance Fund (DIF), prob-lem institutions, failed/assisted institutions, estimated FDIC-insured deposits, as well as assessment rate information. Depository institu-tions that are not insured by the FDIC through the DIF are not includ-ed in the FDIC Quarterly Banking Profile. U.S. branches of institutions headquartered in foreign countries and non-deposit trust companies are not included unless otherwise indicated. Efforts are made to obtain financial reports for all active institutions. However, in some cases, final financial reports are not available for institutions that have closed or converted their charters.
DATA SOURCESThe financial information appearing in this publication is obtained primarily from the Federal Financial Institutions Examination Council (FFIEC) Consolidated Reports of Condition and Income (Call Reports) and the OTS Thrift Financial Reports submitted by all FDIC-insured depository institutions. (TFR filers began filing Call Reports effective with the quarter ending March 31, 2012.) This information is stored on and retrieved from the FDIC’s Research Information System (RIS) database.
COMPUTATION METHODOLOGYParent institutions are required to file consolidated reports, while their subsidiary financial institutions are still required to file sepa-rate reports. Data from subsidiary institution reports are included in the Quarterly Banking Profile tables, which can lead to double-counting. No adjustments are made for any double-counting of sub-sidiary data. Additionally, certain adjustments are made to the OTS Thrift Financial Reports to provide closer conformance with the reporting and accounting requirements of the FFIEC Call Reports. (TFR filers began filing Call Reports effective with the quarter ending March 31, 2012.)All condition and performance ratios represent weighted averages, i.e., the sum of the individual numerator values divided by the sum of individual denominator values. All asset and liability figures used in calculating performance ratios represent average amounts for the period (beginning-of-period amount plus end-of-period amount plus any interim periods, divided by the total number of periods). For “pooling-of-interest” mergers, the assets of the acquired institution(s) are included in average assets since the year-to-date income includes the results of all merged institutions. No adjustments are made for “purchase accounting” mergers. Growth rates represent the percent-age change over a 12-month period in totals for institutions in the base period to totals for institutions in the current period. For the community bank subgroup, growth rates will reflect changes over time in the number and identities of institutions designated as com-munity banks, as well as changes in the assets and liabilities, and income and expenses of group members. Unless indicated otherwise, growth rates are not adjusted for mergers or other changes in the composition of the community bank subgroup.All data are collected and presented based on the location of each reporting institution’s main office. Reported data may include assets and liabilities located outside of the reporting institution’s home state. In addition, institutions may relocate across state lines or change their charters, resulting in an inter-regional or inter-industry migra-tion, e.g., institutions can move their home offices between regions, savings institutions can convert to commercial banks, or commercial banks may convert to savings institutions.
ACCOUNTING CHANGESAccounting for Measurement-Period Adjustments Related to a Business Combination In September 2015, the Financial Accounting Standards Board (FASB) issued Accounting Standards Update (ASU) No. 2015-16, “Simplifying the Accounting for Measurement-Period Adjustments.” Under Accounting Standards Codification Topic 805, Business Combinations (formerly FASB Statement No. 141(R), “Business Combinations”), if the initial accounting for a business combination is incomplete by the end of the reporting period in which the combi-nation occurs, the acquirer reports provisional amounts in its finan-cial statements for the items for which the accounting is incomplete. During the measurement period, the acquirer is required to adjust the provisional amounts recognized at the acquisition date, with a corre-sponding adjustment to goodwill, to reflect new information obtained about facts and circumstances that existed as of the acquisition date that, if known, would have affected the measurement of the amounts recognized as of that date. At present under Topic 805, an acquirer is required to retrospectively adjust the provisional amounts recognized at the acquisition date to reflect the new information. To simplify the accounting for the adjustments made to provisional amounts, ASU 2015-16 eliminates the requirement to retrospectively account for the adjustments. Accordingly, the ASU amends Topic 805 to require an acquirer to recognize adjustments to provisional amounts that are identified during the measurement period in the reporting period in which adjustment amounts are determined. Under the ASU, the acquirer also must recognize in the financial statements for the same reporting period the effect on earnings, if any, resulting from the adjustments to the provisional amounts as if the accounting for the business combination had been completed as of the acquisition date. In general, the measurement period in a business combination is the period after the acquisition date during which the acquirer may adjust provisional amounts reported for identifiable assets acquired, liabilities assumed, and consideration transferred for the acquiree for which the initial accounting for the business combination is incom-plete at the end of the reporting period in which the combination occurs. Topic 805 provides additional guidance on the measurement period, which shall not exceed one year from the acquisition date, and adjustments to provisional amounts during this period. For institutions that are public business entities, as defined under U.S. GAAP, ASU 2015-16 is effective for fiscal years, and interim periods within those fiscal years, beginning after December 15, 2015. For institutions that are not public business entities (i.e., that are private companies), the ASU is effective for fiscal years beginning after December 15, 2016, and interim periods within fiscal years begin-ning after December 15, 2017. The ASU’s amendments to Topic 805 should be applied prospectively to adjustments to provisional amounts that occur after the effective date of the ASU. Thus, institu-tions with a calendar year fiscal year that are public business entities must apply the ASU to any adjustments to provisional amounts that occur after January 1, 2016, beginning with their Call Reports for March 31, 2016. Institutions with a calendar year fiscal year that are private companies must apply the ASU to any adjustments to provi-sional amounts that occur after January 1, 2017, beginning with their Call Reports for December 31, 2017. Early application of ASU 2015-16 is permitted in Call Reports that have not been submitted. For additional information, institutions should refer to ASU 2015-16, which is available at http://www.fasb.org/jsp/FASB/Page/SectionPage&cid=1176156316498.
2016 •Volume 10 • Number 4
30 FDIC QUARTERLY
Debt Issuance Costs In April 2015, the FASB issued ASU No. 2015-03, “Simplifying the Presentation of Debt Issuance Costs.” This ASU requires debt issu-ance costs associated with a recognized debt liability to be presented as a direct deduction from the face amount of the related debt liabil-ity, similar to debt discounts. The ASU is limited to the presentation of debt issuance costs; therefore, the recognition and measure-ment guidance for such costs is unaffected. At present, Accounting Standards Codification (ASC) Subtopic 835-30, Interest—Imputation of Interest, requires debt issuance costs to be reported on the balance sheet as an asset (i.e., a deferred charge). For Call Report purposes, the costs of issuing debt currently are reported, net of accumulated amortization, in “Other assets.”For institutions that are public business entities, as defined under U.S. GAAP, ASU 2015-03 is effective for fiscal years, and interim periods within those fiscal years, beginning after December 15, 2015. For example, institutions with a calendar year fiscal year that are public business entities must apply the ASU in their Call Reports beginning March 31, 2016. For institutions that are not public business entities (i.e., that are private companies), the ASU is effective for fiscal years beginning after December 15, 2015, and interim periods within fis-cal years beginning after December 15, 2016. Thus, institutions with a calendar year fiscal year that are private companies must apply the ASU in their December 31, 2016, and subsequent quarterly Call Reports. Early adoption of the guidance in ASU 2015-03 is permitted.Extraordinary ItemsIn January 2015, the FASB issued ASU No. 2015-01, “Simplifying Income Statement Presentation by Eliminating the Concept of Extraordinary Items.” This ASU eliminates from U.S. GAAP the concept of extraordinary items. At present, ASC Subtopic 225-20, Income Statement—Extraordinary and Unusual Items (formerly Accounting Principles Board Opinion No. 30, “Reporting the Results of Operations”), requires an entity to separately classify, present, and disclose extraordinary events and transactions. An event or transac-tion is presumed to be an ordinary and usual activity of the reporting entity unless evidence clearly supports its classification as an extraor-dinary item. If an event or transaction currently meets the criteria for extraordinary classification, an institution must segregate the extraor-dinary item from the results of its ordinary operations and report the extraordinary item in its income statement as “Extraordinary items and other adjustments, net of income taxes.” ASU 2015-01 is effective for fiscal years, and interim periods within those fiscal years, beginning after December 15, 2015. Thus, for example, institutions with a calendar year fiscal year must begin to apply the ASU in their Call Reports for March 31, 2016. Early adoption of ASU 2015-01 is permitted provided that the guidance is applied from the beginning of the fiscal year of adoption. For Call Report purposes, an institution with a calendar year fiscal year must apply the ASU prospectively, that is, in general, to events or transac-tions occurring after the date of adoption. However, an institution with a fiscal year other than a calendar year may elect to apply ASU 2015-01 prospectively or, alternatively, it may elect to apply the ASU retrospectively to all prior calendar quarters included in the institu-tion’s year-to-date Call Report income statement that includes the beginning of the fiscal year of adoption. After an institution adopts ASU 2015-01, any event or transaction that would have met the criteria for extraordinary classification before the adoption of the ASU should be reported in “Other nonin-terest income,” or “Other noninterest expense,” as appropriate, unless the event or transaction would otherwise be reportable in the income
statement. [As a result of the recent accounting change, year-to-date Third Quarter 2016 “Extraordinary gains, net” on the QBP includes only Discontinued operations expense. Accordingly, comparisons to periods prior to September 2016 are not meaningful, since prior periods included all Extraordinary gains and Discontinued opera-tions expense.] For additional information, institutions should refer to ASU 2015-01, which is available at http://www.fasb.org/jsp/FASB/Page/SectionPage&cid=1176156316498. Accounting by Private Companies for Identifiable Intangible Assets in a Business CombinationIn December 2014, the FASB issued ASU No. 2014-18, “Accounting for Identifiable Intangible Assets in a Business Combination,” which is a consensus of the Private Company Council (PCC). This ASU provides an accounting alternative that permits a private company, as defined in U.S. GAAP (and discussed in a later section of these Supple mental Instructions), to simplify the accounting for certain intangible assets. The accounting alternative applies when a private company is required to recognize or otherwise consider the fair value of intangible assets as a result of certain transactions, including when applying the acquisition method to a business combination under ASC Topic 805, Business Combinations (formerly FASB Statement No. 141 (revised 2007), “Business Combinations”).Under ASU 2014-18, a private company that elects the accounting alternative should no longer recognize separately from goodwill:• Customer-related intangible assets unless they are capable of being
sold or licensed independently from the other assets of a business, and
• Noncompetition agreements.However, because mortgage servicing rights and core deposit intan-gibles are regarded as capable of being sold or licensed independently, a private company that elects this accounting alternative must recog-nize these intangible assets separately from goodwill, initially measure them at fair value, and subsequently measure them in accordance with ASC Topic 350, Intangibles–Goodwill and Other (formerly FASB Statement No. 142, “Goodwill and Other Intangible Assets”).A private company that elects the accounting alternative in ASU 2014-18 also must adopt the private company goodwill account-ing alternative described in ASU 2014-02, “Accounting for Goodwill.” However, a private company that elects the goodwill accounting alternative in ASU 2014-02 is not required to adopt the accounting alternative for identifiable intangible assets in ASU 2014-18.A private company’s decision to adopt ASU 2014-18 must be made upon the occurrence of the first business combination (or other transaction within the scope of the ASU) in fiscal years beginning after December 15, 2015. The effective date of the private company’s decision to adopt the accounting alternative for identifiable intangible assets depends on the timing of that first transaction.If the first transaction occurs in the private company’s first fiscal year beginning after December 15, 2015, the adoption will be effective for that fiscal year’s annual financial reporting period and all interim and annual periods thereafter. If the first transaction occurs in a fiscal year beginning after December 15, 2016, the adoption will be effec-tive in the interim period that includes the date of the transaction and subsequent interim and annual periods thereafter.Early application of the intangibles accounting alternative is permit-ted for any annual or interim period for which a private company’s financial statements have not yet been made available for issuance. Customer-related intangible assets and noncompetition agree-ments that exist as of the beginning of the period of adoption should
QUARTERLY BANKING PROFILE
FDIC QUARTERLY 31
continue to be accounted for separately from goodwill, i.e., such existing intangible assets should not be combined with goodwill.A bank or savings association that meets the private company defini-tion in U.S. GAAP is permitted, but not required, to adopt ASU 2014-18 for Call Report purposes and may choose to early adopt the ASU, provided it also adopts the private company goodwill accounting alternative. If a private institution issues U.S. GAAP financial state-ments and adopts ASU 2014-18, it should apply the ASU’s intangible asset accounting alternative in its Call Report in a manner consistent with its reporting of intangible assets in its financial statements.For additional information on the private company accounting alter-native for identifiable intangible assets, institutions should refer to ASU 2014-18, which is available at http://www.fasb.org/jsp/FASB/Page/SectionPage&cid=1176156316498.Private Company Accounting Alternatives In May 2012, the Financial Accounting Foundation, the independent private sector organization responsible for the oversight of the FASB, approved the establishment of the PCC to improve the process of set-ting accounting standards for private companies. The PCC is charged with working jointly with the FASB to determine whether and in what circumstances to provide alternative recognition, measurement, disclosure, display, effective date, and transition guidance for private companies reporting under U.S. GAAP. Alternative guidance for pri-vate companies may include modifications or exceptions to otherwise applicable existing U.S. GAAP standards. The banking agencies have concluded that a bank or savings associa-tion that is a private company, as defined in U.S. GAAP (as discussed in a later section of these Supplemental Instructions), is permitted to use private company accounting alternatives issued by the FASB when preparing its Call Reports, except as provided in 12 U.S.C. 1831n(a) as described in the following sentence. If the agencies determine that a particular accounting principle within U.S. GAAP, including a private company accounting alternative, is inconsistent with the statutorily specified supervisory objectives, the agencies may prescribe an accounting principle for regulatory reporting purposes that is no less stringent than U.S. GAAP. In such a situation, an insti-tution would not be permitted to use that particular private company accounting alternative or other accounting principle within U.S. GAAP for Call Report purposes. The agencies would provide appro-priate notice if they were to disallow any accounting alternative under the statutory process.Accounting by Private Companies for Goodwill On January 16, 2014, the FASB issued ASU No. 2014-02, “Accounting for Goodwill,” which is a consensus of the PCC. This ASU generally permits a private company to elect to amortize good-will on a straight-line basis over a period of ten years (or less than ten years if more appropriate) and apply a simplified impairment model to goodwill. In addition, if a private company chooses to adopt the ASU’s goodwill accounting alternative, the ASU requires the private company to make an accounting policy election to test goodwill for impairment at either the entity level or the reporting unit level. Goodwill must be tested for impairment when a triggering event occurs that indicates that the fair value of an entity (or a reporting unit) may be below its carrying amount. In contrast, U.S. GAAP does not otherwise permit goodwill to be amortized, instead requiring goodwill to be tested for impairment at the reporting unit level annu-ally and between annual tests in certain circumstances. The ASU’s goodwill accounting alternative, if elected by a private company, is effective prospectively for new goodwill recognized in annual periods beginning after December 15, 2014, and in interim periods within
annual periods beginning after December 15, 2015. Goodwill exist-ing as of the beginning of the period of adoption is to be amortized prospectively over ten years (or less than ten years if more appropri-ate). The ASU states that early application of the goodwill accounting alternative is permitted for any annual or interim period for which a private company’s financial statements have not yet been made avail-able for issuance. A bank or savings association that meets the private company defini-tion in ASU 2014-02, as discussed in the following section of these Supplemental Instructions (i.e., a private institution), is permitted, but not required, to adopt this ASU for Call Report purposes and may choose to early adopt the ASU. If a private institution issues U.S. GAAP financial statements and adopts the ASU, it should apply the ASU’s goodwill accounting alternative in its Call Report in a manner consistent with its reporting of goodwill in its financial statements. Thus, for example, a private institution with a calendar year fis-cal year that chooses to adopt ASU 2014-02 must apply the ASU’s provisions in its December 31, 2015, and subsequent quarterly Call Reports unless early application of the ASU was elected. This would require the private institution to report in its December 31, 2015, Call Report one year’s amortization of goodwill existing as of January 1, 2015, and the amortization of any new goodwill recognized in 2015. For additional information on the private company accounting alternative for goodwill, institutions should refer to ASU 2014-02, which is available at http://www.fasb.org/jsp/FASB/Page/SectionPage&cid=1176156316498. Definitions of Private Company and Public Business EntityAccording to ASU No. 2014-02, “Accounting for Goodwill,” a private company is a business entity that is not a public business entity. ASU No. 2013-12, “Definition of a Public Business Entity,” which was issued in December 2013, added this term to the Master Glossary in the Accounting Standards Codification. This ASU states that a business entity, such as a bank or savings association, that meets any one of five criteria set forth in the ASU is a public business entity for reporting purposes under U.S. GAAP, including for Call Report pur-poses. An institution that is a public business entity is not permitted to apply the private company goodwill accounting alternative dis-cussed in the preceding section when preparing its Call Report.For additional information on the definition of a public business entity, institutions should refer to ASU 2013-12, which is available at http://www.fasb.org/jsp/FASB/Page/SectionPage&cid= 1176156316498.Reporting Certain Government-Guaranteed Mortgage Loans Upon Foreclosure In August 2014, the FASB issued Accounting Standards Update (ASU) No. 2014-14, “Classification of Certain Government-Guaranteed Mortgage Loans Upon Foreclosure,” to address diversity in practice for how government-guaranteed mortgage loans are recorded upon foreclosure. The ASU updates guidance contained in ASC Subtopic 310-40, Receivables—Troubled Debt Restructurings by Creditors (formerly FASB Statement No. 15, “Accounting by Debtors and Creditors for Troubled Debt Restructurings,” as amended), because U.S. GAAP previously did not provide specific guidance on how to categorize or measure foreclosed mortgage loans that are gov-ernment guaranteed. The ASU clarifies the conditions under which a creditor must derecognize a government-guaranteed mortgage loan and recognize a separate “other receivable” upon foreclosure (that is, when a creditor receives physical possession of real estate property collateralizing a mortgage loan in accordance with the guidance in ASC Subtopic 310-40).
2016 •Volume 10 • Number 4
32 FDIC QUARTERLY
Under the ASU, institutions should derecognize a mortgage loan and record a separate other receivable upon foreclosure of the real estate collateral if the following conditions are met: • The loan has a government guarantee that is not separable from the
loan before foreclosure. • At the time of foreclosure, the institution has the intent to convey
the property to the guarantor and make a claim on the guarantee and it has the ability to recover under that claim.
• At the time of foreclosure, any amount of the claim that is deter-mined on the basis of the fair value of the real estate is fixed (that is, the real estate property has been appraised for purposes of the claim and thus the institution is not exposed to changes in the fair value of the property).
This guidance is applicable to fully and partially government- guaranteed mortgage loans provided the three conditions identified above have been met. In such situations, upon foreclosure, the sepa-rate other receivable should be measured based on the amount of the loan balance (principal and interest) expected to be recovered from the guarantor. For institutions that are public business entities, as defined under U.S. GAAP (as discussed in an earlier section of these Supplemental Instructions), ASU 2014-14 is effective for fiscal years, and interim periods within those fiscal years, beginning after December 15, 2014. For example, institutions with a calendar year fiscal year that are public business entities must apply the ASU in their Call Reports beginning March 31, 2015. However, institutions that are not public business entities (i.e., that are private companies) are not required to apply the guidance in ASU 2014-14 until annual periods end-ing after December 15, 2015, and interim periods beginning after December 15, 2015. Thus, institutions with a calendar year fiscal year that are private companies must apply the ASU in their December 31, 2015, and subsequent quarterly Call Reports. Earlier adoption of the guidance in ASU 2014-14 is permitted if the institution has already adopted the amendments in ASU No. 2014-04, “Reclassification of Residential Real Estate Collateralized Consumer Mortgage Loans upon Foreclosure.” For additional information, institutions should refer to ASU 2014-14, which is available at http://www.fasb.org/jsp/FASB/Page/SectionPage&cid=1176156316498. Reclassification of Residential Real Estate Collateralized Consumer Mortgage Loans Upon ForeclosureIn January 2014, the FASB issued Accounting Standards Update (ASU) No. 2014-04, “Reclassification of Residential Real Estate Collateralized Consumer Mortgage Loans upon Foreclosure,” to address diversity in practice for when certain loan receivables should be derecognized and the real estate collateral recognized. The ASU updated guidance contained in Accounting Standards Codification Subtopic 310-40, Receivables–Troubled Debt Restructurings by Creditors (formerly FASB Statement No.15, “Accounting by Debtors and Creditors for Troubled Debt Restructurings,” as amended).Under prior accounting guidance, all loan receivables were reclas-sified to other real estate owned (OREO) when the institution, as creditor, obtained physical possession of the property, regardless of whether formal foreclosure proceedings had taken place. The new ASU clarifies when a creditor is considered to have received physical possession (resulting from an in-substance repossession or foreclo-sure) of residential real estate collateralizing a consumer mortgage loan. Under the new guidance, physical possession for these residen-tial real estate properties is considered to have occurred and a loan receivable would be reclassified to OREO only upon:
• The institution obtaining legal title upon completion of a fore-closure even if the borrower has redemption rights that provide the borrower with a legal right for a period of time after foreclosure to reclaim the property by paying certain amounts specified by law, or
• The completion of a deed in lieu of foreclosure or similar legal agreement under which the borrower conveys all interest in the residential real estate property to the institution to satisfy the loan.
Loans secured by real estate other than consumer mortgage loans col-lateralized by residential real estate should continue to be reclassified to OREO when the institution has received physical possession of a borrower’s real estate, regardless of whether formal foreclosure pro-ceedings take place.For institutions that are public business entities, as defined under U.S. generally accepted accounting principles, ASU 2014-04 is effective for fiscal years, and interim periods within those fiscal years, beginning after December 15, 2014. For example, institutions with a calendar year fiscal year that are public business entities must apply the ASU in their Call Reports beginning March 31, 2015. However, institu-tions that are not public business entities are not required to apply the guidance in ASU 2014-04 until annual periods beginning after December 15, 2014, and interim periods within annual periods begin-ning after December 15, 2015. Thus, institutions with a calendar year fiscal year that are not public business entities must apply the ASU in their December 31, 2015, and subsequent quarterly Call Reports. Earlier adoption of the guidance in ASU 2014-04 is permitted. Entities can elect to apply the ASU on either a modified retrospective transition basis or a prospective transition basis. Applying the ASU on a prospective transition basis should be less complex for institutions than applying the ASU on a modified retrospective transition basis. Under the prospective transition method, an institution should apply the new guidance to all instances where it receives physical possession of residential real estate property collateralizing consumer mortgage loans that occur after the date of adoption of the ASU. Under the modified retrospective transition method, an institution should apply a cumulative-effect adjustment to residential consumer mortgage loans and OREO existing as of the beginning of the annual period for which the ASU is effective. As a result of adopting the ASU on a modified retrospective basis, assets reclassified from OREO to loans should be measured at the carrying value of the real estate at the date of adoption while assets reclassified from loans to OREO should be measured at the lower of the net amount of the loan receivable or the OREO property’s fair value less costs to sell at the time of adoption.For additional information, institutions should refer to ASU 2014-04, which is available at http://www.fasb.org/jsp/FASB/Page/SectionPage &cid=1176156316498.True-Up Liability Under an FDIC Loss-Sharing AgreementAn insured depository institution that acquires a failed insured insti-tution may enter into a loss-sharing agreement with the FDIC under which the FDIC agrees to absorb a portion of the losses on a specified pool of the failed institution’s assets during a specified time period. The acquiring institution typically records an indemnification asset representing its right to receive payments from the FDIC for losses during the specified time period on assets covered under the loss-sharing agreement.Since 2009, most loss-sharing agreements have included a true-up provision that may require the acquiring institution to reimburse the FDIC if cumulative losses in the acquired loss-share portfolio are less than the amount of losses claimed by the institution throughout the loss-sharing period. Typically, a true-up liability may result because the recovery period on the loss-share assets (e.g., eight years) is
QUARTERLY BANKING PROFILE
FDIC QUARTERLY 33
longer than the period during which the FDIC agrees to reimburse the acquiring institution for losses on the loss-share portfolio (e.g., five years).Consistent with U.S. GAAP and bank guidance for “Offsetting,” institutions are permitted to offset assets and liabilities recognized in the Report of Condition when a “right of setoff” exists. Under ASC Subtopic 210-20, Balance Sheet—Offsetting (formerly FASB Interpretation No. 39, “Offsetting of Amounts Related to Certain Contracts”), in general, a right of setoff exists when a reporting institution and another party each owes the other determinable amounts, the reporting institution has the right to set off the amounts each party owes and also intends to set off, and the right of setoff is enforceable at law. Because the conditions for the existence of a right of offset in ASC Subtopic 210-20 normally would not be met with respect to an indemnification asset and a true-up liability under a loss-sharing agreement with the FDIC, this asset and liability should not be netted for Call Report purposes. Therefore, institutions should report the indemnification asset gross (i.e., without regard to any true-up liability) in Other Assets, and any true-up liability in Other Liabilities.In addition, an institution should not continue to report assets covered by loss-sharing agreements after the expiration of the loss-sharing period even if the terms of the loss-sharing agreement require reimbursements from the institution to the FDIC for certain amounts during the recovery period.Indemnification Assets and Accounting Standards Update No. 2012-06 – In October 2012, the FASB issued Accounting Standards Update (ASU) No. 2012-06, “Subsequent Accounting for an Indemnification Asset Recognized at the Acquisition Date as a Result of a Government-Assisted Acquisition of a Financial Institution,” to address the subsequent measurement of an indemnifi-cation asset recognized in an acquisition of a financial institution that includes an FDIC loss-sharing agreement. This ASU amends ASC Topic 805, Business Combinations (formerly FASB Statement No. 141 (revised 2007), “Business Combinations”), which includes guidance applicable to FDIC-assisted acquisitions of failed institutions.Under the ASU, when an institution experiences a change in the cash flows expected to be collected on an FDIC loss- sharing indem-nification asset because of a change in the cash flows expected to be collected on the assets covered by the loss-sharing agreement, the institution should account for the change in the measurement of the indemnification asset on the same basis as the change in the assets subject to indemnification. Any amortization of changes in the value of the indemnification asset should be limited to the lesser of the term of the indemnification agreement and the remaining life of the indemnified assets.The ASU is effective for fiscal years, and interim periods within those fiscal years, beginning on or after December 15, 2012. For institu-tions with a calendar year fiscal year, the ASU takes effect January 1, 2013. Early adoption of the ASU is permitted. The ASU’s provisions should be applied prospectively to any new indemnification assets acquired after the date of adoption and to indemnification assets existing as of the date of adoption arising from an FDIC-assisted acquisition of a financial institution. Institutions with indemnifica-tion assets arising from FDIC loss-sharing agreements are expected to adopt ASU 2012-06 for Call Report purposes in accordance with the effective date of this standard. For additional information, refer to ASU 2012-06, available at http://www.fasb.org/jsp/FASB/Page/SectionPage&cid=1176156316498.Goodwill Impairment Testing – In September 2011, the FASB issued Accounting Standards Update (ASU) No. 2011-08, “Testing Goodwill
for Impairment,” to address concerns about the cost and complex-ity of the existing goodwill impairment test in ASC Topic 350, Intangibles-Goodwill and Other (formerly FASB Statement No. 142, “Goodwill and Other Intangible Assets”). The ASU’s amendments to ASC Topic 350 are effective for annual and interim goodwill impair-ment tests performed for fiscal years beginning after December 15, 2011 (i.e., for annual or interim tests performed on or after January 1, 2012, for institutions with a calendar year fiscal year). Early adoption of the ASU was permitted. Under ASU 2011-08, an institution has the option of first assessing qualitative factors to determine whether it is necessary to perform the two-step quantitative goodwill impair-ment test described in ASC Topic 350. If, after considering all rele-vant events and circumstances, an institution determines it is unlikely (that is, a likelihood of 50 percent or less) that the fair value of a reporting unit is less than its carrying amount (including goodwill), then the institution does not need to perform the two-step goodwill impairment test. If the institution instead concludes that the opposite is true (that is, it is likely that the fair value of a reporting unit is less than its carrying amount), then it is required to perform the first step and, if necessary, the second step of the two-step goodwill impair-ment test. Under ASU 2011-08, an institution may choose to bypass the qualitative assessment for any reporting unit in any period and proceed directly to performing the first step of the two-step goodwill impairment test.Accounting for Loan Participations – Amended ASC Topic 860 (formerly FAS 166) modified the criteria that must be met in order for a transfer of a portion of a financial asset, such as a loan partici-pation, to qualify for sale accounting—refer to previously published Quarterly Banking Profile notes: http://www5.fdic.gov/qbp/2011mar/qbpnot.html.Other-Than-Temporary Impairment – When the fair value of an investment in an individual available-for-sale or held-to-maturity security is less than its cost basis, the impairment is either temporary or other-than-temporary. The amount of the total other-than-tempo-rary impairment related to credit loss must be recognized in earnings, but the amount of total impairment related to other factors must be recognized in other comprehensive income, net of applicable taxes. To determine whether the impairment is other-than-temporary, an institution must apply the applicable accounting guidance—refer to previously published Quarterly Banking Profile notes: http://www5.fdic.gov/qbp/2011mar/qbpnot.html.Accounting Standards Codification – refer to previously published Quarterly Banking Profile notes: http://www5.fdic.gov/qbp/2011sep/qbpnot.html.
DEFINITIONS (in alphabetical order)All other assets – total cash, balances due from depository insti-tutions, premises, fixed assets, direct investments in real estate, investment in unconsolidated subsidiaries, customers’ liability on acceptances outstanding, assets held in trading accounts, federal funds sold, securities purchased with agreements to resell, fair mar-ket value of derivatives, prepaid deposit insurance assessments, and other assets.All other liabilities – bank’s liability on acceptances, limited-life pre-ferred stock, allowance for estimated off-balance-sheet credit losses, fair market value of derivatives, and other liabilities.Assessment base – effective April 1, 2011, the deposit insurance assessment base changed to “average consolidated total assets minus average tangible equity” with an additional adjustment to the assess-ment base for banker’s banks and custodial banks, as permitted under
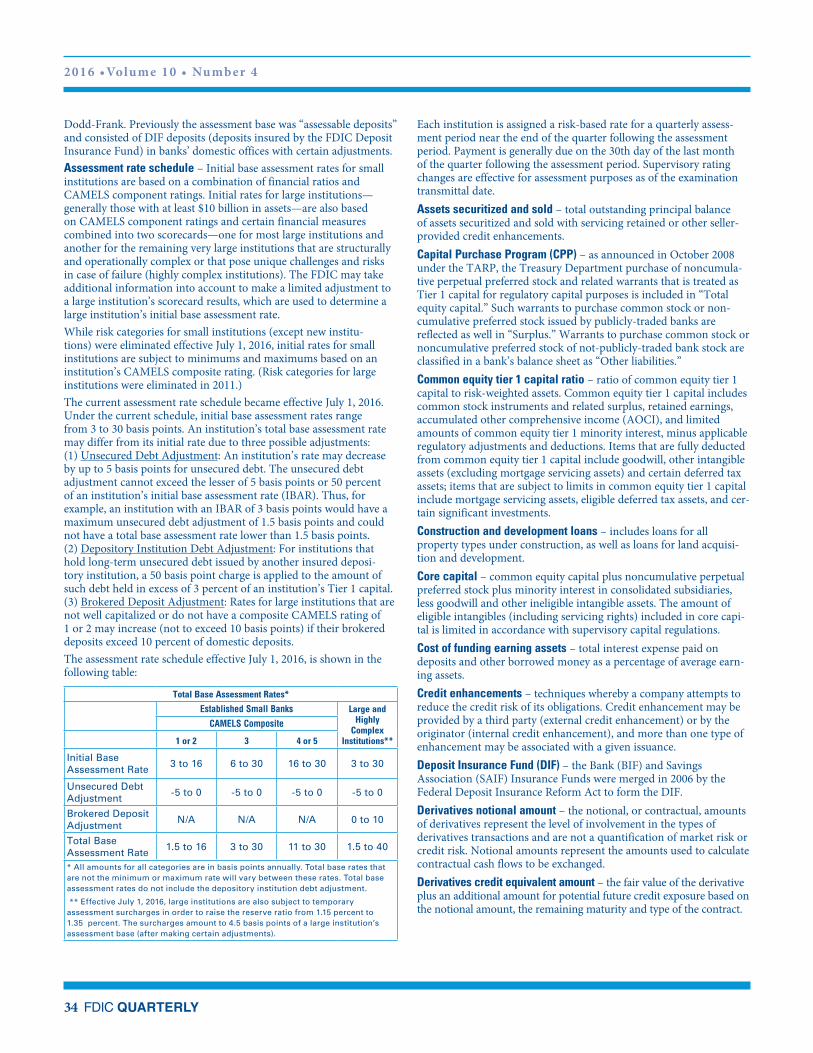
2016 •Volume 10 • Number 4
34 FDIC QUARTERLY
Dodd-Frank. Previously the assessment base was “assessable deposits” and consisted of DIF deposits (deposits insured by the FDIC Deposit Insurance Fund) in banks’ domestic offices with certain adjustments.Assessment rate schedule – Initial base assessment rates for small institutions are based on a combination of financial ratios and CAMELS component ratings. Initial rates for large institutions—generally those with at least $10 billion in assets—are also based on CAMELS component ratings and certain financial measures combined into two scorecards—one for most large institutions and another for the remaining very large institutions that are structurally and operationally complex or that pose unique challenges and risks in case of failure (highly complex institutions). The FDIC may take additional information into account to make a limited adjustment to a large institution’s scorecard results, which are used to determine a large institution’s initial base assessment rate.While risk categories for small institutions (except new institu-tions) were eliminated effective July 1, 2016, initial rates for small institutions are subject to minimums and maximums based on an institution’s CAMELS composite rating. (Risk categories for large institutions were eliminated in 2011.)The current assessment rate schedule became effective July 1, 2016. Under the current schedule, initial base assessment rates range from 3 to 30 basis points. An institution’s total base assessment rate may differ from its initial rate due to three possible adjustments: (1) Unsecured Debt Adjustment: An institution’s rate may decrease by up to 5 basis points for unsecured debt. The unsecured debt adjustment cannot exceed the lesser of 5 basis points or 50 percent of an institution’s initial base assessment rate (IBAR). Thus, for example, an institution with an IBAR of 3 basis points would have a maximum unsecured debt adjustment of 1.5 basis points and could not have a total base assessment rate lower than 1.5 basis points. (2) Depository Institution Debt Adjustment: For institutions that hold long-term unsecured debt issued by another insured deposi-tory institution, a 50 basis point charge is applied to the amount of such debt held in excess of 3 percent of an institution’s Tier 1 capital. (3) Brokered Deposit Adjustment: Rates for large institutions that are not well capitalized or do not have a composite CAMELS rating of 1 or 2 may increase (not to exceed 10 basis points) if their brokered deposits exceed 10 percent of domestic deposits.The assessment rate schedule effective July 1, 2016, is shown in the following table:
Total Base Assessment Rates*
Established Small Banks Large and Highly
Complex Institutions**
CAMELS Composite
1 or 2 3 4 or 5
Initial Base Assessment Rate
3 to 16 6 to 30 16 to 30 3 to 30
Unsecured Debt Adjustment
-5 to 0 -5 to 0 -5 to 0 -5 to 0
Brokered Deposit Adjustment
N/A N/A N/A 0 to 10
Total Base Assessment Rate
1.5 to 16 3 to 30 11 to 30 1.5 to 40
* All amounts for all categories are in basis points annually. Total base rates that are not the minimum or maximum rate will vary between these rates. Total base assessment rates do not include the depository institution debt adjustment.
** Effective July 1, 2016, large institutions are also subject to temporary assessment surcharges in order to raise the reserve ratio from 1.15 percent to 1.35 percent. The surcharges amount to 4.5 basis points of a large institution’s assessment base (after making certain adjustments).
Each institution is assigned a risk-based rate for a quarterly assess-ment period near the end of the quarter following the assessment period. Payment is generally due on the 30th day of the last month of the quarter following the assessment period. Supervisory rating changes are effective for assessment purposes as of the examination transmittal date.Assets securitized and sold – total outstanding principal balance of assets securitized and sold with servicing retained or other seller-provided credit enhancements.Capital Purchase Program (CPP) – as announced in October 2008 under the TARP, the Treasury Department purchase of noncumula-tive perpetual preferred stock and related warrants that is treated as Tier 1 capital for regulatory capital purposes is included in “Total equity capital.” Such warrants to purchase common stock or non-cumulative preferred stock issued by publicly-traded banks are reflected as well in “Surplus.” Warrants to purchase common stock or noncumulative preferred stock of not-publicly-traded bank stock are classified in a bank’s balance sheet as “Other liabilities.”Common equity tier 1 capital ratio – ratio of common equity tier 1 capital to risk-weighted assets. Common equity tier 1 capital includes common stock instruments and related surplus, retained earnings, accumulated other comprehensive income (AOCI), and limited amounts of common equity tier 1 minority interest, minus applicable regulatory adjustments and deductions. Items that are fully deducted from common equity tier 1 capital include goodwill, other intangible assets (excluding mortgage servicing assets) and certain deferred tax assets; items that are subject to limits in common equity tier 1 capital include mortgage servicing assets, eligible deferred tax assets, and cer-tain significant investments.Construction and development loans – includes loans for all property types under construction, as well as loans for land acquisi-tion and development.Core capital – common equity capital plus noncumulative perpetual preferred stock plus minority interest in consolidated subsidiaries, less goodwill and other ineligible intangible assets. The amount of eligible intangibles (including servicing rights) included in core capi-tal is limited in accordance with supervisory capital regulations.Cost of funding earning assets – total interest expense paid on deposits and other borrowed money as a percentage of average earn-ing assets.Credit enhancements – techniques whereby a company attempts to reduce the credit risk of its obligations. Credit enhancement may be provided by a third party (external credit enhancement) or by the originator (internal credit enhancement), and more than one type of enhancement may be associ ated with a given issuance.Deposit Insurance Fund (DIF) – the Bank (BIF) and Savings Association (SAIF) Insurance Funds were merged in 2006 by the Federal Deposit Insurance Reform Act to form the DIF.Derivatives notional amount – the notional, or contractual, amounts of derivatives represent the level of involvement in the types of derivatives transactions and are not a quantification of market risk or credit risk. Notional amounts represent the amounts used to calculate contractual cash flows to be exchanged.Derivatives credit equivalent amount – the fair value of the derivative plus an additional amount for potential future credit exposure based on the notional amount, the remaining maturity and type of the contract.
QUARTERLY BANKING PROFILE
FDIC QUARTERLY 35
Derivatives transaction types:Futures and forward contracts – contracts in which the buyer agrees to purchase and the seller agrees to sell, at a specified future date, a specific quantity of an underlying variable or index at a specified price or yield. These contracts exist for a variety of variables or indices, (traditional agricultural or physical commod-ities, as well as currencies and interest rates). Futures contracts are standardized and are traded on organized exchanges which set limits on counterparty credit exposure. Forward contracts do not have standardized terms and are traded over the counter.Option contracts – contracts in which the buyer acquires the right to buy from or sell to another party some specified amount of an un derlying variable or index at a stated price (strike price) during a period or on a specified future date, in return for compensation (such as a fee or premium). The seller is obligated to purchase or sell the variable or index at the discretion of the buyer of the contract.Swaps – obligations between two parties to exchange a series of cash flows at periodic intervals (settlement dates), for a specified period. The cash flows of a swap are either fixed, or determined for each settlement date by multiplying the quantity (notional principal) of the underlying variable or index by specified refer-ence rates or prices. Except for currency swaps, the notional prin-cipal is used to calculate each payment but is not exchanged.
Derivatives underlying risk exposure – the potential exposure char-acterized by the level of banks’ concentration in particular underlying instruments, in general. Exposure can result from market risk, credit risk, and operational risk, as well as, interest rate risk.Domestic deposits to total assets – total domestic office deposits as a percent of total assets on a consolidated basis.Earning assets – all loans and other investments that earn interest or dividend income.Efficiency ratio – Noninterest expense less amortization of intangible assets as a percent of net interest income plus noninterest income. This ratio measures the proportion of net operating revenues that are absorbed by overhead expenses, so that a lower value indicates greater efficiency.Estimated insured deposits – in general, insured deposits are total domestic deposits minus estimated uninsured deposits. Beginning March 31, 2008, for institutions that file Call Reports, insured depos-its are total assessable deposits minus estimated uninsured deposits. Beginning September 30, 2009, insured deposits include deposits in accounts of $100,000 to $250,000 that are covered by a temporary increase in the FDIC’s standard maximum deposit insurance amount (SMDIA). The Dodd-Frank Wall Street Reform and Consumer Protection Act enacted on July 21, 2010, made permanent the stan-dard maximum deposit insurance amount (SMDIA) of $250,000. Also, the Dodd-Frank Act amended the Federal Deposit Insurance Act to include noninterest-bearing transaction accounts as a new temporary deposit insurance account category. All funds held in noninterest-bearing transaction accounts were fully insured, without limit, from December 31, 2010, through December 31, 2012.Failed/assisted institutions – an institution fails when regulators take control of the institution, placing the assets and liabilities into a bridge bank, conservatorship, receivership, or another healthy insti-tution. This action may require the FDIC to provide funds to cover losses. An institution is defined as “assisted” when the institution remains open and receives assistance in order to continue operating.
Fair Value – the valuation of various assets and liabilities on the bal-ance sheet—including trading assets and liabilities, available-for-sale securities, loans held for sale, assets and liabilities accounted for under the fair value option, and foreclosed assets—involves the use of fair values. During periods of market stress, the fair values of some financial instruments and nonfinancial assets may decline.FHLB advances – all borrowings by FDIC insured institutions from the Federal Home Loan Bank System (FHLB), as reported by Call Report filers, and by TFR filers prior to March 31, 2012.Goodwill and other intangibles – intangible assets include servicing rights, purchased credit card relationships, and other identifiable intangible assets. Goodwill is the excess of the purchase price over the fair market value of the net assets acquired, less subsequent impair-ment adjustments. Other intangible assets are recorded at fair value, less subsequent quarterly amortization and impairment adjustments.Loans secured by real estate – includes home equity loans, junior liens secured by 1-4 family residential properties, and all other loans secured by real estate.Loans to individuals – includes outstanding credit card balances and other secured and unsecured consumer loans.Long-term assets (5+ years) – loans and debt securities with remain-ing maturities or repricing intervals of over five years.Maximum credit exposure – the maximum contractual credit exposure remaining under recourse arrangements and other seller-provided credit enhancements provided by the reporting bank to securitizations.Mortgage-backed securities – certificates of participation in pools of residential mortgages and collateralized mortgage obligations issued or guaranteed by government-sponsored or private enter-prises. Also, see “Securities,” below.Net charge-offs – total loans and leases charged off (removed from balance sheet because of uncollectability), less amounts recovered on loans and leases previously charged off.Net interest margin – the difference between interest and dividends earned on interest-bearing assets and interest paid to depositors and other creditors, expressed as a percentage of average earning assets. No adjustments are made for interest income that is tax exempt.Net loans to total assets – loans and lease financing receivables, net of unearned income, allowance and reserves, as a percent of total assets on a consolidated basis.Net operating income – income excluding discretionary transac-tions such as gains (or losses) on the sale of investment securities and extraordinary items. Income taxes subtracted from operating income have been adjusted to exclude the portion applicable to securities gains (or losses).Noncurrent assets – the sum of loans, leases, debt securities, and other assets that are 90 days or more past d ue, or in nonaccrual status.Noncurrent loans & leases – the sum of loans and leases 90 days or more past due, and loans and leases in nonaccrual status.Number of institutions reporting – the number of institutions that actually filed a financial report.New reporters – insured institutions filing quarterly financial reports for the first time.Other borrowed funds – federal funds purchased, securities sold with agreements to repurchase, demand notes issued to the U.S. Treasury, FHLB advances, other borrowed money, mortgage indebtedness,
2016 •Volume 10 • Number 4
36 FDIC QUARTERLY
obligations under capitalized leases and trading liabilities, less revalu-ation losses on assets held in trading accounts.Other real estate owned – primarily foreclosed property. Direct and indirect investments in real estate ventures are excluded. The amount is reflected net of valuation allowances. For institutions that file a Thrift Financial Report (TFR), the valuation allowance subtracted also includes allowances for other repossessed assets. Also, for TFR filers the components of other real estate owned are reported gross of valu-ation allowances. (TFR filers began filing Call Reports effective with the quarter ending March 31, 2012.)Percent of institutions with earnings gains – the percent of institu-tions that increased their net income (or decreased their losses) com-pared to the same period a year earlier.“Problem” institutions – federal regulators assign a composite rating to each financial institution, based upon an evaluation of financial and operational criteria. The rating is based on a scale of 1 to 5 in ascending order of supervisory concern. “Problem” institutions are those institutions with financial, operational, or managerial weak-nesses that threaten their continued financial viability. Depending upon the degree of risk and supervisory concern, they are rated either a “4” or “5.” The number and assets of “problem” institutions are based on FDIC composite ratings. Prior to March 31, 2008, for institutions whose primary federal regulator was the OTS, the OTS composite rating was used.Recourse – an arrangement in which a bank retains, in form or in substance, any credit risk directly or indirectly associated with an asset it has sold (in accordance with generally accepted accounting principles) that exceeds a pro rata share of the bank’s claim on the asset. If a bank has no claim on an asset it has sold, then the retention of any credit risk is recourse.Reserves for losses – the allowance for loan and lease losses on a consolidated basis.Restructured loans and leases – loan and lease financing receiv-ables with terms restructured from the original contract. Excludes restructured loans and leases that are not in compliance with the modified terms.Retained earnings – net income less cash dividends on common and preferred stock for the reporting period.Return on assets – bank net income (including gains or losses on securities and extraordinary items) as a percentage of aver age total (consolidated) assets. The basic yardstick of bank profitability.Return on equity – bank net income (including gains or losses on securities and extraordinary items) as a percentage of average total equity capital.Risk-weighted assets – assets adjusted for risk-based capital defini-tions which include on-balance-sheet as well as off- balance-sheet items multiplied by risk-weights that range from zero to 200 percent. A conversion factor is used to assign a balance sheet equivalent amount for selected off-balance-sheet accounts.Securities – excludes securities held in trading accounts. Banks’ secu-rities portfolios consist of securities designated as “held-to- maturity,” which are reported at amortized cost (book value), and securities des-ignated as “available-for-sale,” reported at fair (market) value.Securities gains (losses) – realized gains (losses) on held-to- maturity and available-for-sale securities, before adjustments for income taxes. Thrift Financial Report (TFR) filers also include gains (losses) on the sales of assets held for sale. (TFR filers began filing Call Reports effective with the quarter ending March 31, 2012.)
Seller’s interest in institution’s own securitizations – the reporting bank’s ownership interest in loans and other assets that have been securitized, except an interest that is a form of recourse or other seller-provided credit enhancement. Seller’s interests differ from the securities issued to investors by the securitization structure. The principal amount of a seller’s interest is generally equal to the total principal amount of the pool of assets included in the securitization structure less the principal amount of those assets attributable to investors, i.e., in the form of securities issued to investors.Small Business Lending Fund – The Small Business Lending Fund (SBLF) was enacted into law in September 2010 as part of the Small Business Jobs Act of 2010 to encourage lending to small businesses by providing capital to qualified community institutions with assets of less than $10 billion. The SBLF Program is administered by the U.S. Treasury Department (http://www.treasury.gov/resource-center/sb-programs/Pages/Small-Business-Lending-Fund.aspx).Under the SBLF Program, the Treasury Department purchased noncumulative perpetual preferred stock from qualifying depository institutions and holding companies (other than Subchapter S and mutual institutions). When this stock has been issued by a depository institution, it is reported as “Perpetual preferred stock and related surplus.” For regulatory capital purposes, this noncumulative perpetual preferred stock qualifies as a component of Tier 1 capital. Qualifying Subchapter S corporations and mutual institutions issue unsecured subordinated debentures to the Treasury Department through the SBLF. Depository institutions that issued these debentures report them as “Subordinated notes and debentures.” For regulatory capital purposes, the debentures are eligible for inclusion in an institution’s Tier 2 capital in accordance with their primary federal regulator’s capital standards. To participate in the SBLF Program, an institution with outstanding securities issued to the Treasury Department under the Capital Purchase Program (CPP) was required to refinance or repay in full the CPP securities at the time of the SBLF funding. Any outstanding warrants that an institution issued to the Treasury Department under the CPP remain outstanding after the refinancing of the CPP stock through the SBLF Program unless the institution chooses to repurchase them.Subchapter S corporation – a Subchapter S corporation is treated as a pass-through entity, similar to a partnership, for federal income tax purposes. It is generally not subject to any federal income taxes at the corporate level. This can have the effect of reducing institutions’ reported taxes and increasing their after-tax earnings.Trust assets – market value, or other reasonably available value of fiduciary and related assets, to include marketable securities, and other financial and physical assets. Common physical assets held in fiduciary accounts include real estate, equipment, collectibles, and household goods. Such fiduciary assets are not included in the assets of the financial institution.Unearned income & contra accounts – unearned income for Call Report filers only.Unused loan commitments – includes credit card lines, home equity lines, commitments to make loans for construction, loans secured by commercial real estate, and unused commitments to originate or purchase loans. (Excluded are commitments after June 2003 for o riginated mortgage loans held for sale, which are accounted for as derivatives on the balance sheet.)Yield on earning assets – total interest, dividend, and fee income earned on loans and investments as a percentage of average earning assets.