Embed Size (px)
Citation preview
Quarterly Earnings Presentation
Q3 FY17
1
Except for the historical information contained herein, statements in this release which
contain words or phrases such as “will”, “aim”, “will likely result”, “would”, “believe”, “may”,
“expect”, “will continue”, “anticipate”, “estimate”, “intend”, “plan”, “contemplate”, “seek to”,
“future”, “objective”, “goal”, “strategy”, “philosophy”, “project”, “should”, “will pursue” and
similar expressions or variations of such expressions may constitute "forward-looking
statements". These forward-looking statements involve a number of risks, uncertainties and
other factors that could cause actual results to differ materially from those suggested by the
forward-looking statements. These risks and uncertainties include, but are not limited to
our ability to successfully implement our strategy, future levels of non-performing loans,
our growth and expansion, the adequacy of our allowance for credit losses, our provisioning
policies, technological changes, investment income, cash flow projections, our exposure to
market risks as well as other risks. Axis Bank Limited undertakes no obligation to update
forward-looking statements to reflect events or circumstances after the date thereof.
Safe Harbor
2
Performance Highlights
Growth
Earnings Quality
Retail Franchise
Asset Quality
Other important information
3
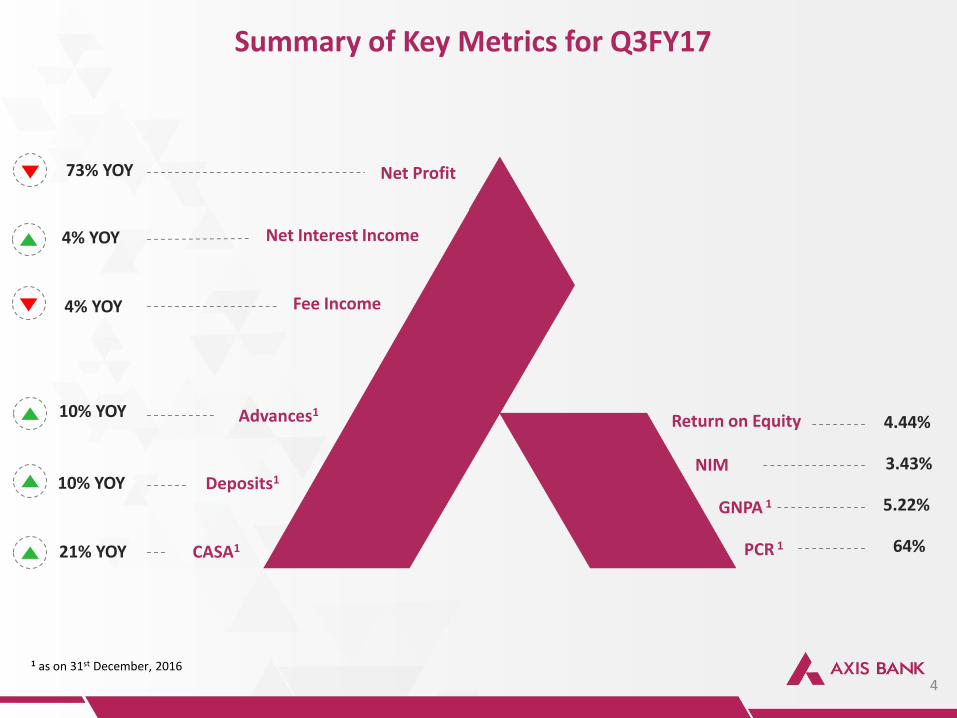
Net Profit
Net Interest Income
Fee Income
Advances1
Deposits1
CASA1
73% YOY
4% YOY
4% YOY
10% YOY
10% YOY
21% YOY
Summary of Key Metrics for Q3FY17
4
Return on Equity
NIM
GNPA 1
PCR 1
4.44%
1 as on 31st December, 2016
3.43%
5.22%
64%

43% 45%
Advances 10% YOY
16% YOY
48%
Retail franchise registered healthy performance
Retail Advances Retail Fee Income
Earnings Profile
19% YOY 8% YOY
Operating Revenue `7,734 crores
19% YOY
Operating Profit `4,640 crores
Return on Assets** Return on Equity**
CASA 21% YOY
SA Deposits 27% YOY
Tier I CAR*
12.99% 16.59%
Well capitalised
Total CAR*
Profit remains suppressed due to provision costs. However operating parameters continue to be resilient.
5
0.39% 4.44%
Deposits 10% YOY Fee Income 4% YOY
*Including unaudited Net Profit for 9MFY17; ** annualised
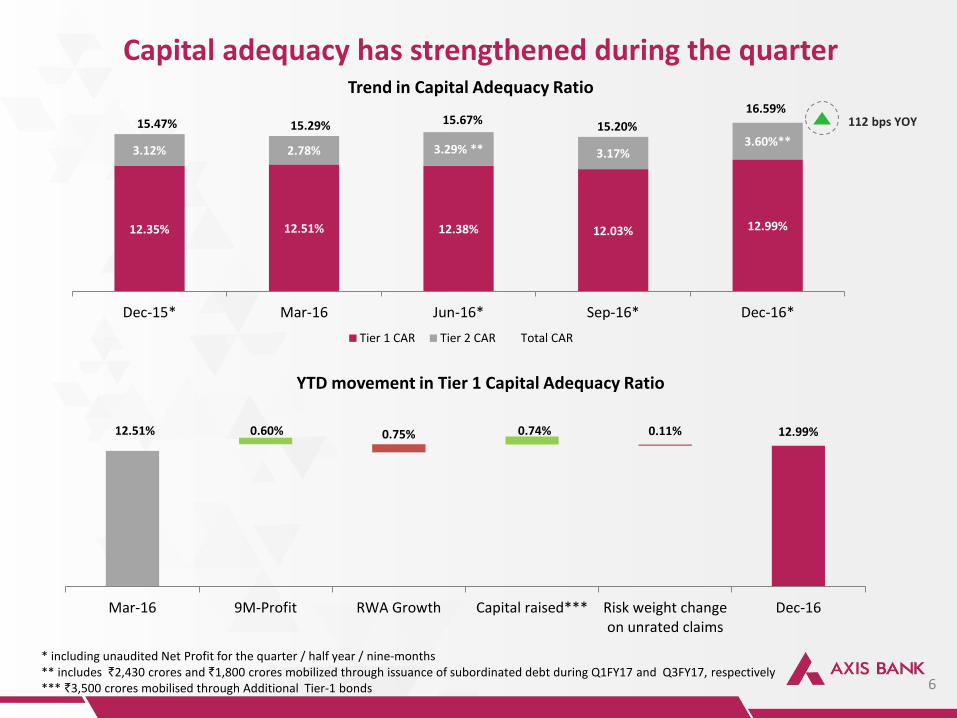
Capital adequacy has strengthened during the quarter
6
12.35% 12.51% 12.38% 12.03% 12.99%
3.12% 2.78% 3.29% ** 3.17% 3.60%**
15.47% 15.29% 15.67% 15.20%
16.59%
Dec-15* Mar-16 Jun-16* Sep-16* Dec-16*
Tier 1 CAR Tier 2 CAR Total CAR
* including unaudited Net Profit for the quarter / half year / nine-months ** includes `2,430 crores and `1,800 crores mobilized through issuance of subordinated debt during Q1FY17 and Q3FY17, respectively *** `3,500 crores mobilised through Additional Tier-1 bonds
112 bps YOY
YTD movement in Tier 1 Capital Adequacy Ratio
Trend in Capital Adequacy Ratio
12.51% 12.99% 0.60% 0.74% 0.75% 0.11%
Mar-16 9M-Profit RWA Growth Capital raised*** Risk weight changeon unrated claims
Dec-16
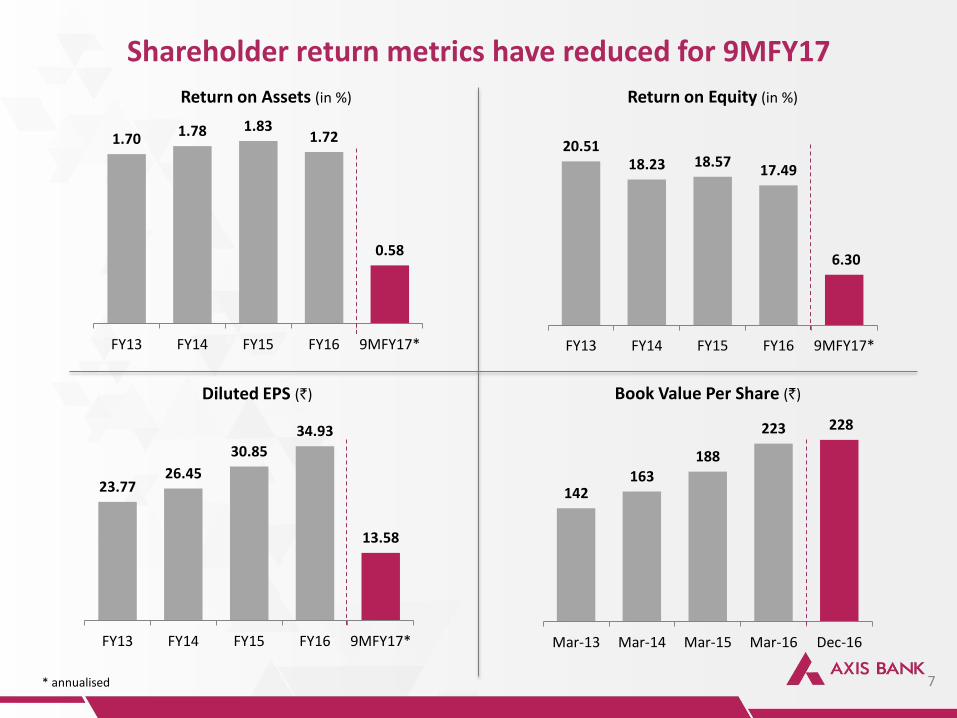
1.70 1.78 1.83 1.72
0.58
FY13 FY14 FY15 FY16 9MFY17*
Return on Assets (in %)
142 163
188
223 228
Mar-13 Mar-14 Mar-15 Mar-16 Dec-16
Book Value Per Share (`)
20.51 18.23 18.57
17.49
6.30
FY13 FY14 FY15 FY16 9MFY17*
Return on Equity (in %)
Shareholder return metrics have reduced for 9MFY17
7 * annualised
23.77 26.45
30.85
34.93
13.58
FY13 FY14 FY15 FY16 9MFY17*
Diluted EPS (`)
Performance Highlights
Growth
Earnings Quality
Retail Franchise
Asset Quality
Other important information
8
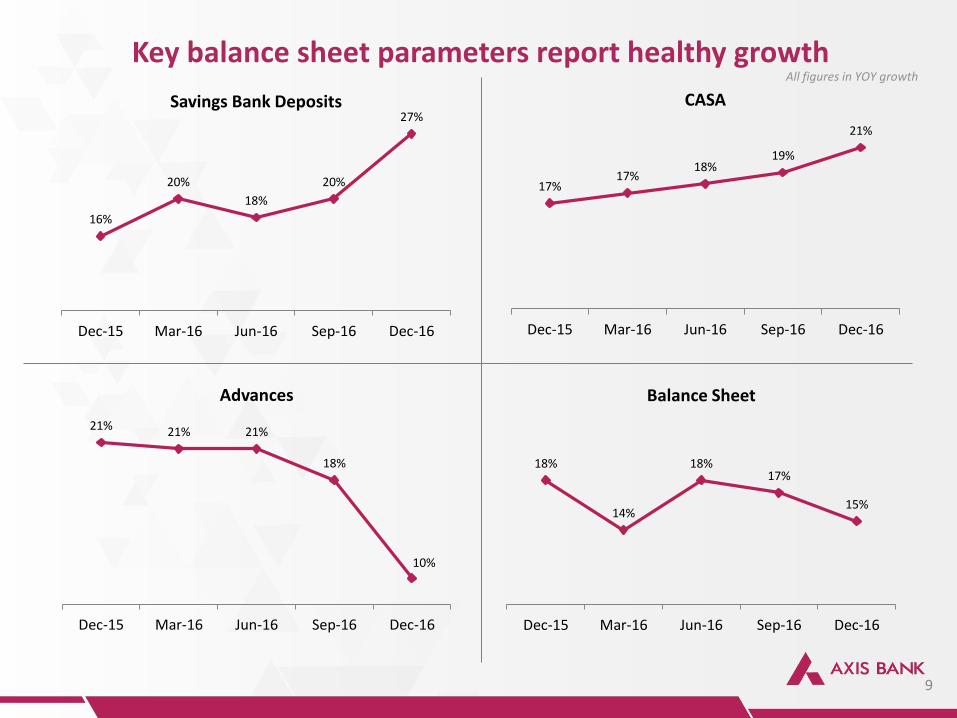
Key balance sheet parameters report healthy growth
9
16%
20%
18%
20%
27%
Dec-15 Mar-16 Jun-16 Sep-16 Dec-16
Savings Bank Deposits
17% 17%
18% 19%
21%
Dec-15 Mar-16 Jun-16 Sep-16 Dec-16
CASA
All figures in YOY growth
18%
14%
18% 17%
15%
Dec-15 Mar-16 Jun-16 Sep-16 Dec-16
Balance Sheet
21% 21% 21%
18%
10%
Dec-15 Mar-16 Jun-16 Sep-16 Dec-16
Advances
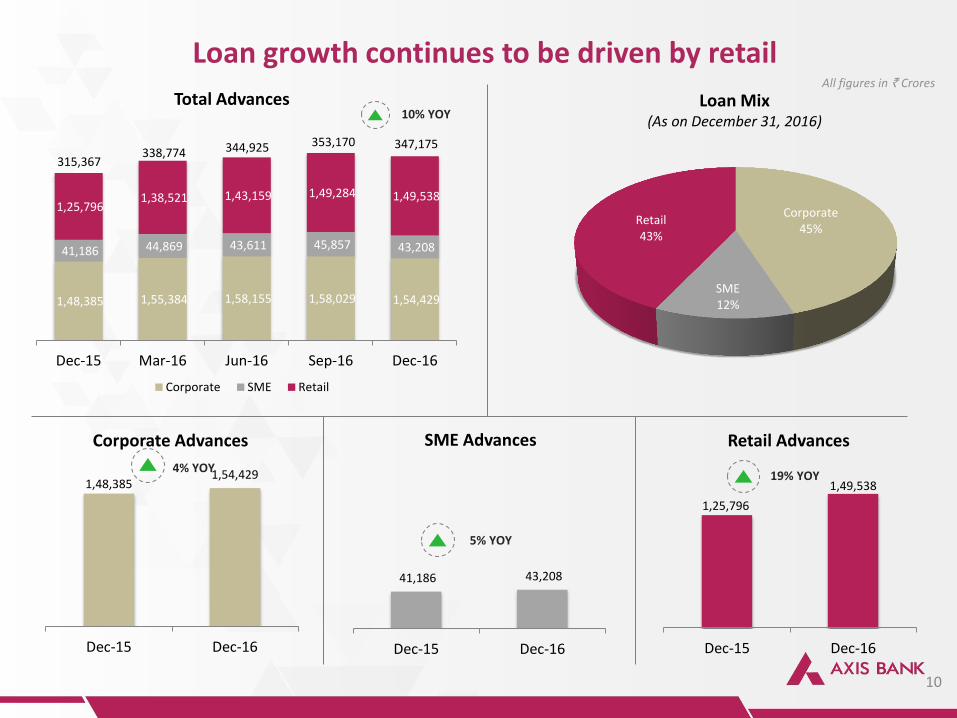
1,48,385
1,54,429
Dec-15 Dec-16
Corporate Advances
4% YOY
10
Loan Mix (As on December 31, 2016)
Loan growth continues to be driven by retail All figures in ` Crores
1,48,385 1,55,384 1,58,155 1,58,029 1,54,429
41,186 44,869 43,611 45,857 43,208
1,25,796 1,38,521 1,43,159 1,49,284 1,49,538
Dec-15 Mar-16 Jun-16 Sep-16 Dec-16
Corporate SME Retail
338,774 344,925
Total Advances
Corporate 45%
SME 12%
Retail 43%
41,186 43,208
Dec-15 Dec-16
SME Advances
5% YOY
1,25,796
1,49,538
Dec-15 Dec-16
Retail Advances
19% YOY
353,170
10% YOY
315,367
347,175
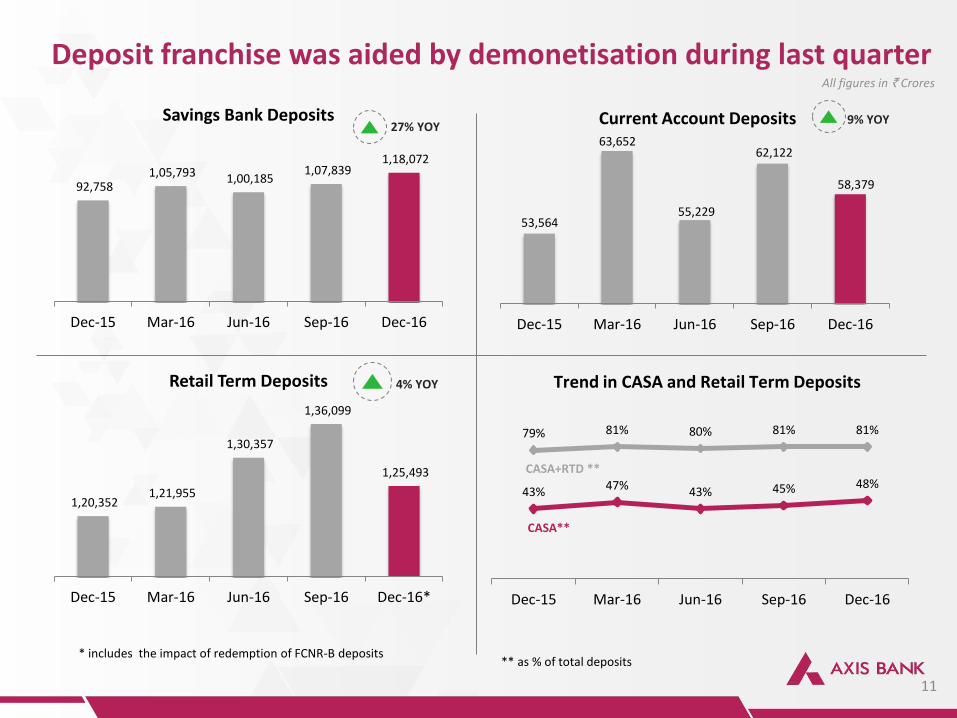
92,758 1,05,793 1,00,185
1,07,839 1,18,072
Dec-15 Mar-16 Jun-16 Sep-16 Dec-16
Savings Bank Deposits 27% YOY
Deposit franchise was aided by demonetisation during last quarter
11
** as % of total deposits
53,564
63,652
55,229
62,122
58,379
Dec-15 Mar-16 Jun-16 Sep-16 Dec-16
Current Account Deposits 9% YOY
1,20,352 1,21,955
1,30,357
1,36,099
1,25,493
Dec-15 Mar-16 Jun-16 Sep-16 Dec-16*
Retail Term Deposits 4% YOY
43% 47% 43% 45% 48%
79% 81% 80% 81% 81%
Dec-15 Mar-16 Jun-16 Sep-16 Dec-16
Trend in CASA and Retail Term Deposits
CASA**
CASA+RTD **
All figures in ` Crores
* includes the impact of redemption of FCNR-B deposits
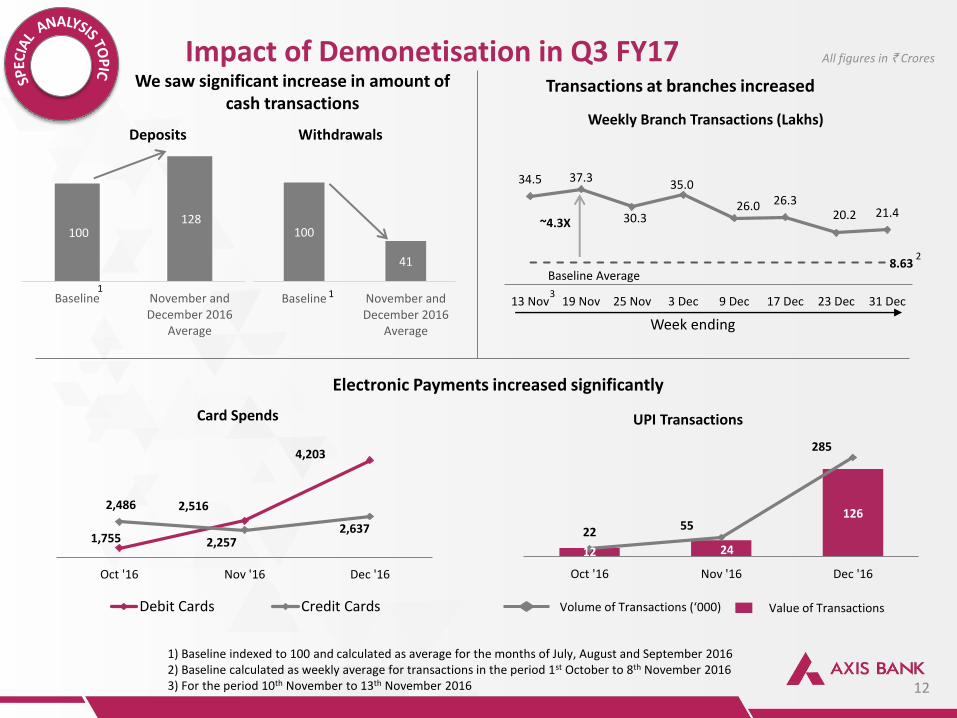
Impact of Demonetisation in Q3 FY17 We saw significant increase in amount of
cash transactions Transactions at branches increased
Electronic Payments increased significantly
34.5 37.3
30.3
35.0
26.0 26.3 20.2 21.4
13 Nov 19 Nov 25 Nov 3 Dec 9 Dec 17 Dec 23 Dec 31 Dec
~4.3X
8.63
Baseline Average
Weekly Branch Transactions (Lakhs)
1,755
2,516
4,203
2,486
2,257 2,637
Oct '16 Nov '16 Dec '16
Debit Cards Credit Cards
Card Spends
12 24
126
22 55
285
Oct '16 Nov '16 Dec '16
Value of Transactions Volume of Transactions (‘000)
UPI Transactions
100 128
Baseline November andDecember 2016
Average
100
41
Baseline November andDecember 2016
Average
Deposits Withdrawals
2
Week ending
1) Baseline indexed to 100 and calculated as average for the months of July, August and September 2016 2) Baseline calculated as weekly average for transactions in the period 1st October to 8th November 2016 3) For the period 10th November to 13th November 2016
1 1 3
All figures in ` Crores
12
Performance Highlights
Growth
13
Earnings Quality
Retail Franchise
Asset Quality
Other important information
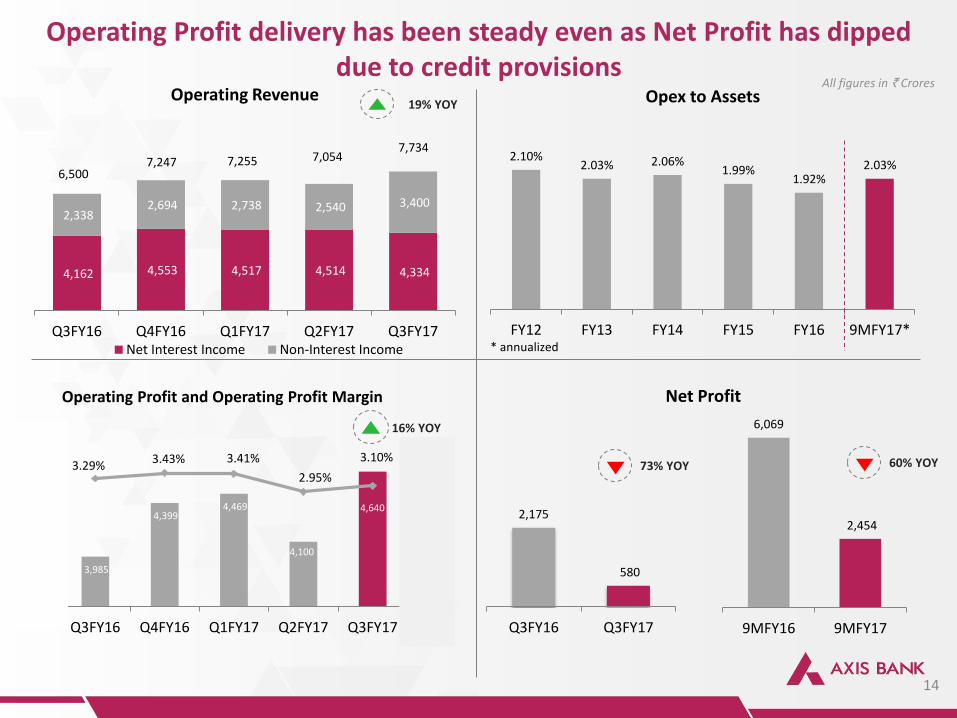
3,985
4,399 4,469
4,100
4,640
3.29% 3.43% 3.41%
2.95%
3.10%
0.00%
0.50%
1.00%
1.50%
2.00%
2.50%
3.00%
3.50%
4.00%
3,600
3,800
4,000
4,200
4,400
4,600
4,800
Q3FY16 Q4FY16 Q1FY17 Q2FY17 Q3FY17
Operating Profit and Operating Profit Margin
16% YOY 6,069
2,454
9MFY16 9MFY17
Operating Profit delivery has been steady even as Net Profit has dipped due to credit provisions
14
4,162 4,553 4,517 4,514 4,334
2,338 2,694 2,738 2,540 3,400
Q3FY16 Q4FY16 Q1FY17 Q2FY17 Q3FY17
Operating Revenue
Net Interest Income Non-Interest Income
6,500
7,247 7,255 7,054
19% YOY
7,734
All figures in ` Crores
2.10% 2.03% 2.06%
1.99% 1.92%
2.03%
FY12 FY13 FY14 FY15 FY16 9MFY17*
Opex to Assets
2,175
580
Q3FY16 Q3FY17
60% YOY
Net Profit
73% YOY
* annualized
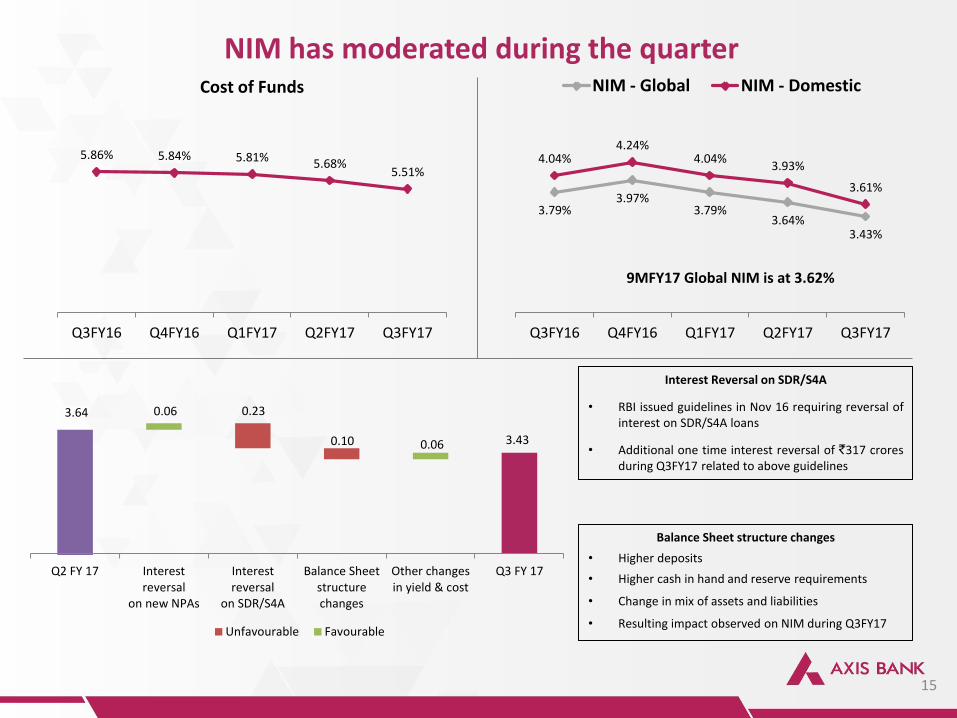
NIM has moderated during the quarter
15
5.86% 5.84% 5.81% 5.68% 5.51%
Q3FY16 Q4FY16 Q1FY17 Q2FY17 Q3FY17
Cost of Funds
3.79% 3.97%
3.79% 3.64%
3.43%
4.04% 4.24%
4.04% 3.93%
3.61%
Q3FY16 Q4FY16 Q1FY17 Q2FY17 Q3FY17
NIM - Global NIM - Domestic
9MFY17 Global NIM is at 3.62%
Interest Reversal on SDR/S4A
• RBI issued guidelines in Nov 16 requiring reversal of interest on SDR/S4A loans
• Additional one time interest reversal of `317 crores during Q3FY17 related to above guidelines
Balance Sheet structure changes
• Higher deposits
• Higher cash in hand and reserve requirements
• Change in mix of assets and liabilities
• Resulting impact observed on NIM during Q3FY17
3.43
0.23
0.10
3.64 0.06
0.06
Q2 FY 17 Interestreversal
on new NPAs
Interestreversal
on SDR/S4A
Balance Sheetstructurechanges
Other changesin yield & cost
Q3 FY 17
Unfavourable Favourable
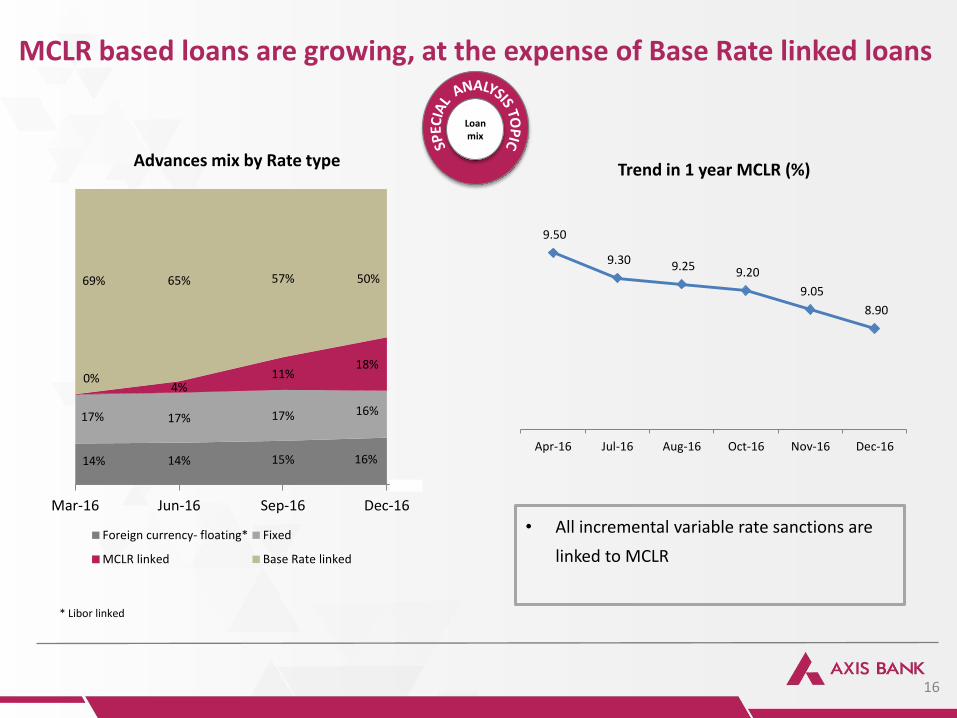
14% 14% 15% 16%
17% 17% 17% 16%
0% 4%
11% 18%
69% 65% 57% 50%
Mar-16 Jun-16 Sep-16 Dec-16
Foreign currency- floating* Fixed
MCLR linked Base Rate linked
16
MCLR based loans are growing, at the expense of Base Rate linked loans
Advances mix by Rate type
Loan mix
* Libor linked
9.50
9.30 9.25 9.20
9.05
8.90
Apr-16 Jul-16 Aug-16 Oct-16 Nov-16 Dec-16
Trend in 1 year MCLR (%)
• All incremental variable rate sanctions are
linked to MCLR
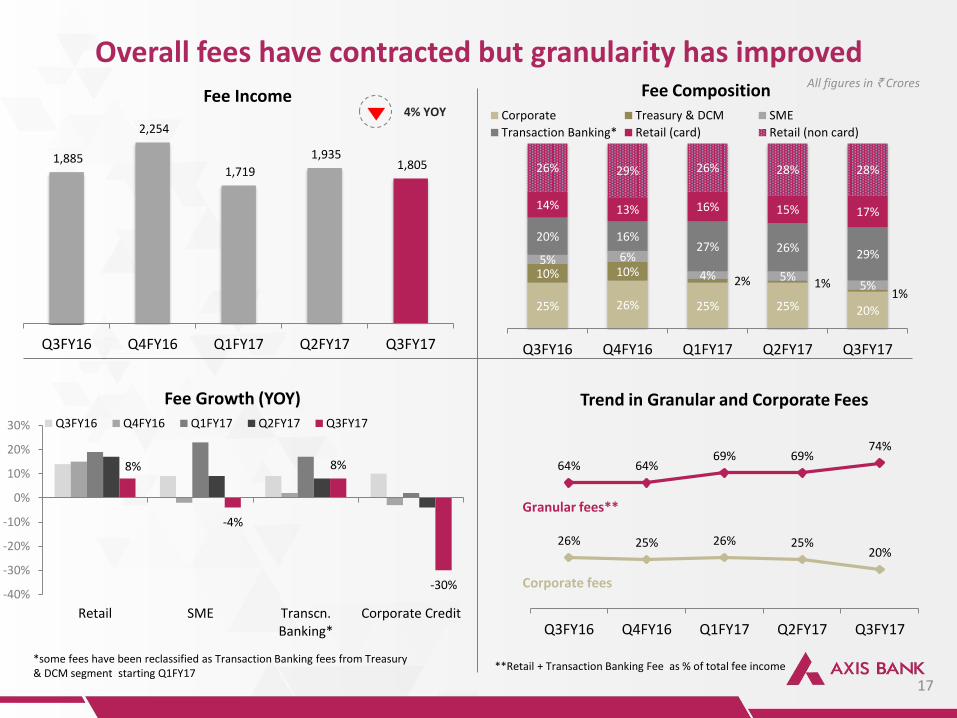
1,885
2,254
1,719
1,935 1,805
Q3FY16 Q4FY16 Q1FY17 Q2FY17 Q3FY17
Fee Income
Overall fees have contracted but granularity has improved
17
All figures in ` Crores
25% 26% 25% 25% 20%
10% 10% 2% 1%
1%
5% 6%
4% 5% 5%
20% 16% 27% 26% 29%
14% 13% 16% 15% 17%
26% 29% 26% 28% 28%
Q3FY16 Q4FY16 Q1FY17 Q2FY17 Q3FY17
Corporate Treasury & DCM SME
Transaction Banking* Retail (card) Retail (non card)
Fee Composition
8%
-4%
8%
-30% -40%
-30%
-20%
-10%
0%
10%
20%
30%
Retail SME Transcn.Banking*
Corporate Credit
Fee Growth (YOY) Q3FY16 Q4FY16 Q1FY17 Q2FY17 Q3FY17
26% 25% 26% 25% 20%
64% 64% 69% 69%
74%
Q3FY16 Q4FY16 Q1FY17 Q2FY17 Q3FY17
Trend in Granular and Corporate Fees
Corporate fees
Granular fees**
**Retail + Transaction Banking Fee as % of total fee income
4% YOY
*some fees have been reclassified as Transaction Banking fees from Treasury & DCM segment starting Q1FY17
Performance Highlights
Growth
Retail Franchise
Asset Quality
Other important information
18
Earnings Quality
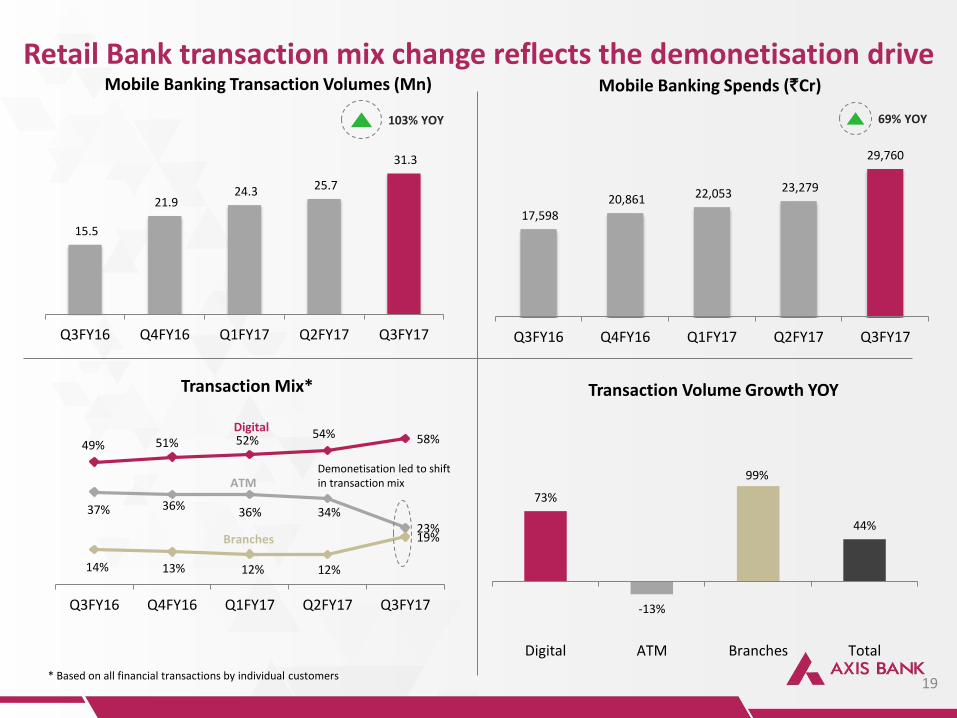
49% 51% 52% 54% 58%
37% 36% 36% 34%
23%
14% 13% 12% 12%
19%
Q3FY16 Q4FY16 Q1FY17 Q2FY17 Q3FY17
Transaction Mix*
Digital
ATM
Branches
Demonetisation led to shift in transaction mix
Retail Bank transaction mix change reflects the demonetisation drive
19
17,598 20,861 22,053 23,279
29,760
Q3FY16 Q4FY16 Q1FY17 Q2FY17 Q3FY17
Mobile Banking Spends (`Cr)
73%
-13%
99%
44%
Digital ATM Branches Total
Transaction Volume Growth YOY
* Based on all financial transactions by individual customers
69% YOY
15.5
21.9 24.3 25.7
31.3
Q3FY16 Q4FY16 Q1FY17 Q2FY17 Q3FY17
Mobile Banking Transaction Volumes (Mn)
103% YOY

47,876
50,135
52,398
56,098 56,762
Dec-15 Mar-16 Jun-16 Sep-16 Dec-16
Employee Strength
Network has been expanding at a steady pace
20
31
-
154
62
99 102 100 105
Q4FY15 Q1FY16 Q2FY16 Q3FY16 Q4FY16 Q1FY17 Q2FY17 Q3FY17
New Branches Opened
26% 26% 27% 27% 28%
23% 24% 24% 24% 24%
30% 30% 30% 30% 30%
21% 20% 19% 19% 18%
Dec-15 Mar-16 Jun-16 Sep-16 Dec-16
Branch Mix*
Metro Urban Semi-Urban Rural
3,211 2,805 2,904 3,006
12,631 12,743
12,871
13,448
13,726
Dec-15 Mar-16 Jun-16 Sep-16 Dec-16
ATMs
3,106
* Includes extension counters
19% YOY
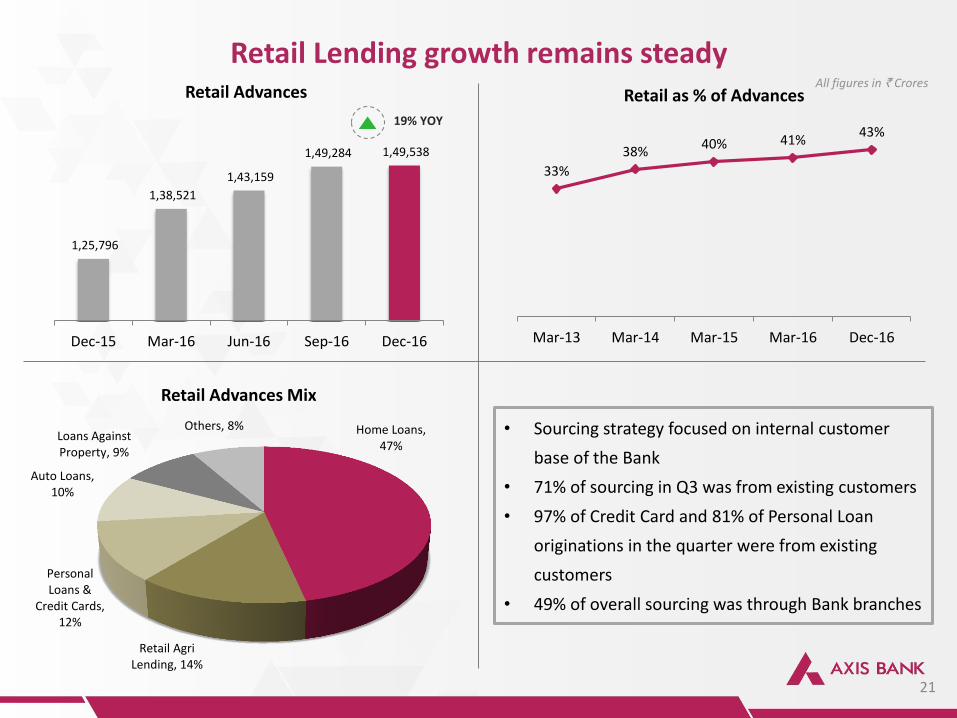
33%
38% 40% 41%
43%
Mar-13 Mar-14 Mar-15 Mar-16 Dec-16
Retail as % of Advances
Retail Lending growth remains steady
21
1,25,796
1,38,521
1,43,159
1,49,284 1,49,538
Dec-15 Mar-16 Jun-16 Sep-16 Dec-16
Retail Advances
19% YOY
All figures in ` Crores
Home Loans, 47%
Retail Agri Lending, 14%
Personal Loans &
Credit Cards, 12%
Auto Loans, 10%
Loans Against Property, 9%
Others, 8%
Retail Advances Mix
• Sourcing strategy focused on internal customer
base of the Bank
• 71% of sourcing in Q3 was from existing customers
• 97% of Credit Card and 81% of Personal Loan
originations in the quarter were from existing
customers
• 49% of overall sourcing was through Bank branches
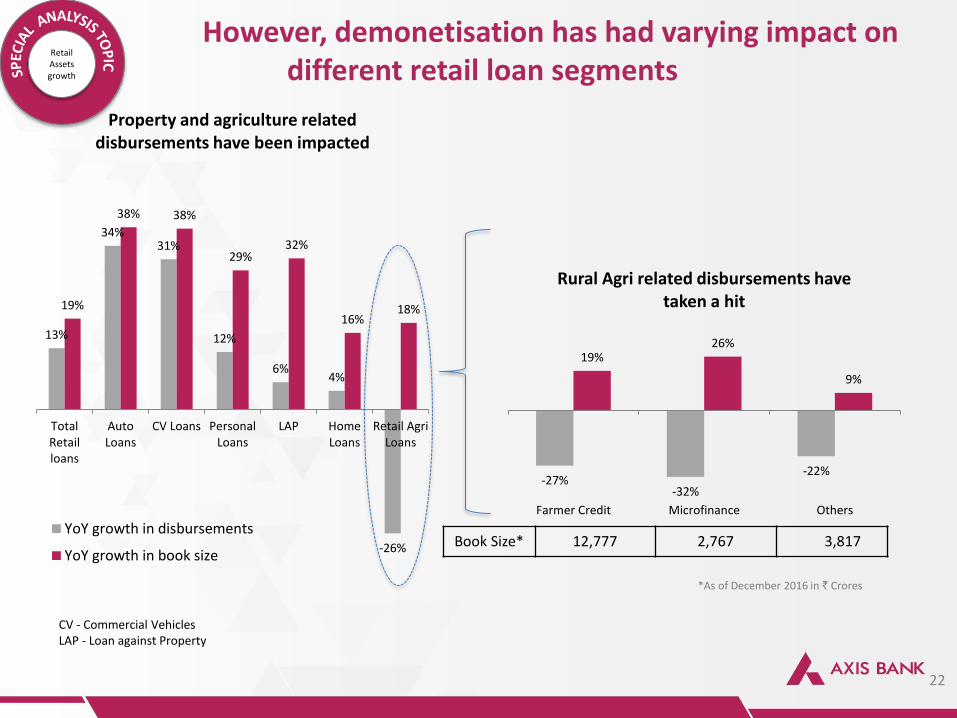
However, demonetisation has had varying impact on different retail loan segments
22
13%
34% 31%
12%
6% 4%
-26%
19%
38% 38%
29% 32%
16% 18%
TotalRetailloans
AutoLoans
CV Loans PersonalLoans
LAP HomeLoans
Retail AgriLoans
Property and agriculture related disbursements have been impacted
YoY growth in disbursements
YoY growth in book size
-27% -32%
-22%
19% 26%
9%
Farmer Credit Microfinance Others
Rural Agri related disbursements have taken a hit
CV - Commercial Vehicles LAP - Loan against Property
Retail Assets growth
Book Size* 12,777 2,767 3,817
*As of December 2016 in ` Crores

8,635
15,750
242 280
0
100
200
300
400
500
600
700
800
900
1,000
0
2,000
4,000
6,000
8,000
10,000
12,000
14,000
16,000
18,000
Q3FY16 Q4FY16 Q1FY17 Q2FY17 Q3FY17
Cards Spends
82% YOY
Transactions and payments businesses got significant boost post demonetisation
23
15.4 15.5 16.3 16.8
18.5
Dec-15 Mar-16 Jun-16 Sep-16 Dec-16
Debit Cards - Cards In Force 20% YOY
Credit and Debit Cards, ` Cr
Forex Cards, USD Mn (RHS)
All figures in Mn
2.2 2.4
2.6 2.8
3.1
Dec-15 Mar-16 Jun-16 Sep-16 Dec-16
Credit Cards - Cards In Force
Strong positioning in the payments space
16% YOY
1 – based on cards issued; 2 – based on card spends
41% YOY
*Based on RBI data as on Oct 2016 except for Forex Cards
Product Market share* Ranking*
Credit Cards1 10.6% 4th
Debit Cards2 5.8% 4th
Forex Cards 45% 1st
Merchant Acquisition
18.3% 3rd
Performance Highlights
Growth
Asset Quality
Other important information
24
Earnings Quality
Retail Franchise
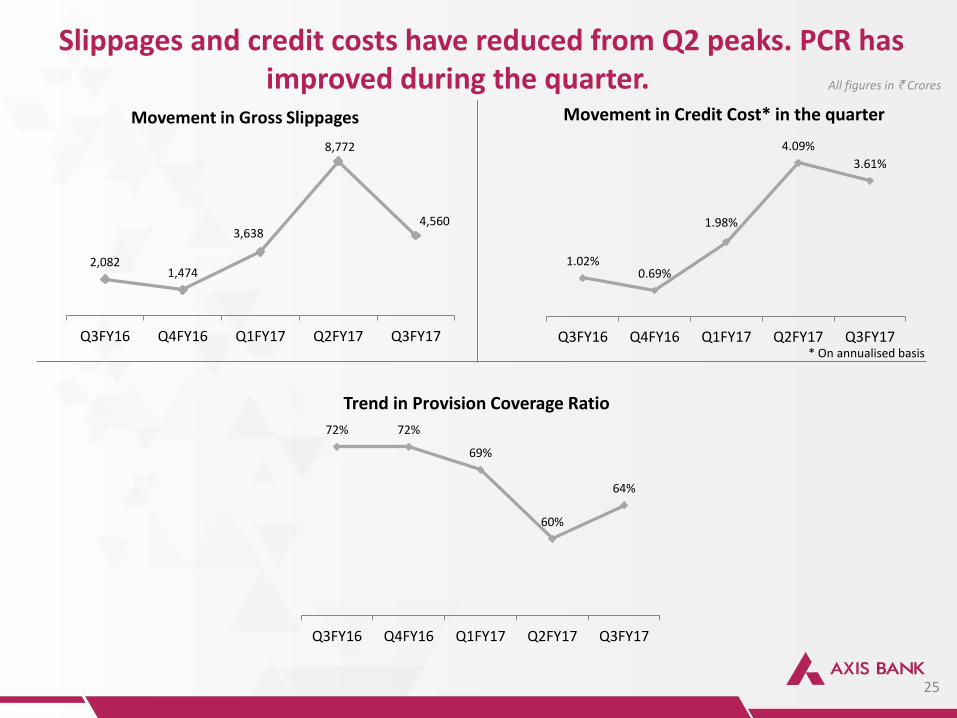
1.02% 0.69%
1.98%
4.09%
3.61%
Q3FY16 Q4FY16 Q1FY17 Q2FY17 Q3FY17
Movement in Credit Cost* in the quarter
25
Slippages and credit costs have reduced from Q2 peaks. PCR has improved during the quarter.
2,082 1,474
3,638
8,772
4,560
Q3FY16 Q4FY16 Q1FY17 Q2FY17 Q3FY17
Movement in Gross Slippages
* On annualised basis
72% 72%
69%
60%
64%
Q3FY16 Q4FY16 Q1FY17 Q2FY17 Q3FY17
Trend in Provision Coverage Ratio
All figures in ` Crores
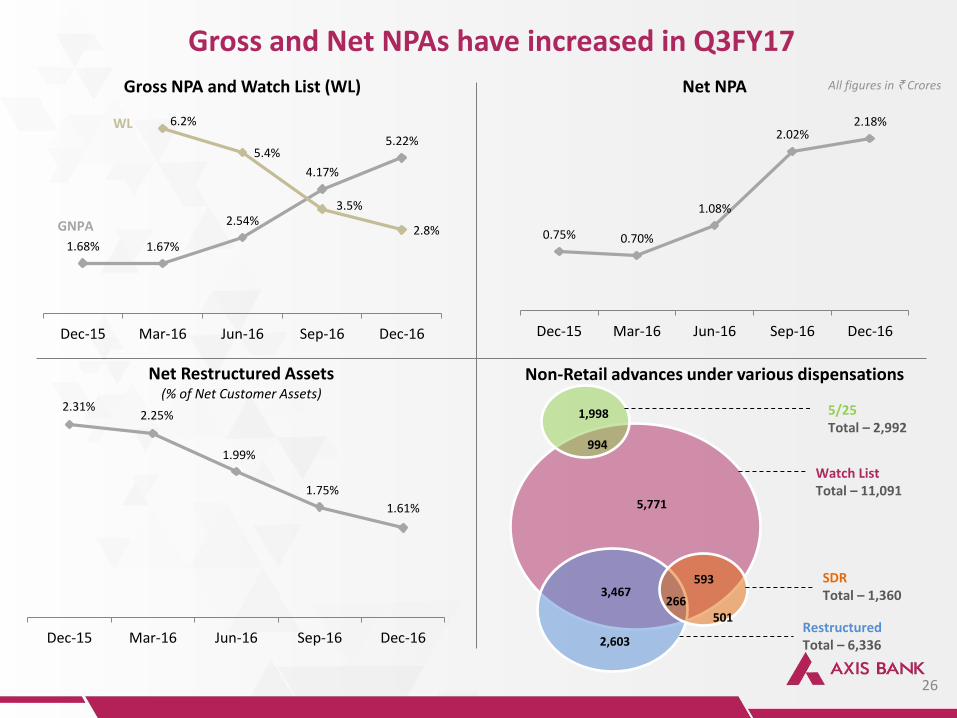
Gross and Net NPAs have increased in Q3FY17
26
2.31% 2.25%
1.99%
1.75%
1.61%
Dec-15 Mar-16 Jun-16 Sep-16 Dec-16
Net Restructured Assets (% of Net Customer Assets)
0.75% 0.70%
1.08%
2.02% 2.18%
Dec-15 Mar-16 Jun-16 Sep-16 Dec-16
Net NPA
1.68% 1.67%
2.54%
4.17%
5.22%
6.2%
5.4%
3.5%
2.8%
Dec-15 Mar-16 Jun-16 Sep-16 Dec-16
Gross NPA and Watch List (WL)
GNPA
WL
Non-Retail advances under various dispensations
3,467
994
1,998
593
266 501
2,603
5,771
5/25 Total – 2,992
Watch List Total – 11,091
SDR Total – 1,360
Restructured Total – 6,336
All figures in ` Crores
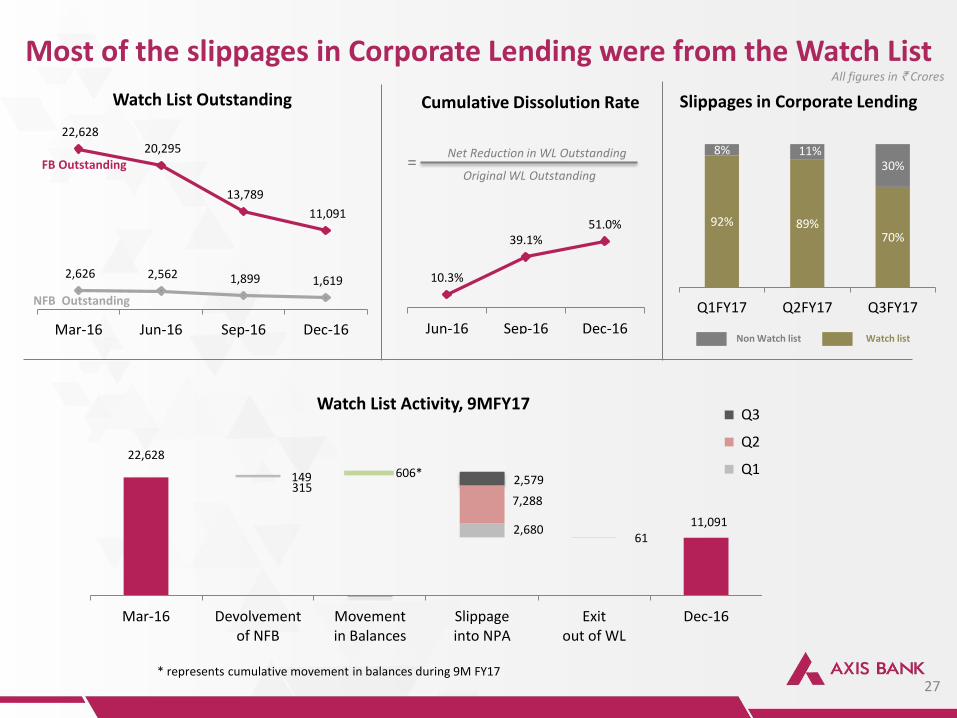
Most of the slippages in Corporate Lending were from the Watch List
27
22,628 20,295
13,789
11,091
2,626 2,562 1,899 1,619
Mar-16 Jun-16 Sep-16 Dec-16
Watch List Outstanding
All figures in ` Crores
FB Outstanding
NFB Outstanding
Slippages in Corporate Lending Cumulative Dissolution Rate
Net Reduction in WL Outstanding
Original WL Outstanding =
92% 89% 70%
8% 11% 30%
Q1FY17 Q2FY17 Q3FY17
Non Watch list Watch list
10.3%
39.1% 51.0%
Jun-16 Sep-16 Dec-16
22,628
11,091
315
2,680
149
7,288
61
2,579
Mar-16 Devolvementof NFB
Movementin Balances
Slippageinto NPA
Exitout of WL
Dec-16
Watch List Activity, 9MFY17 Q3
Q2
Q1606*
* represents cumulative movement in balances during 9M FY17
28
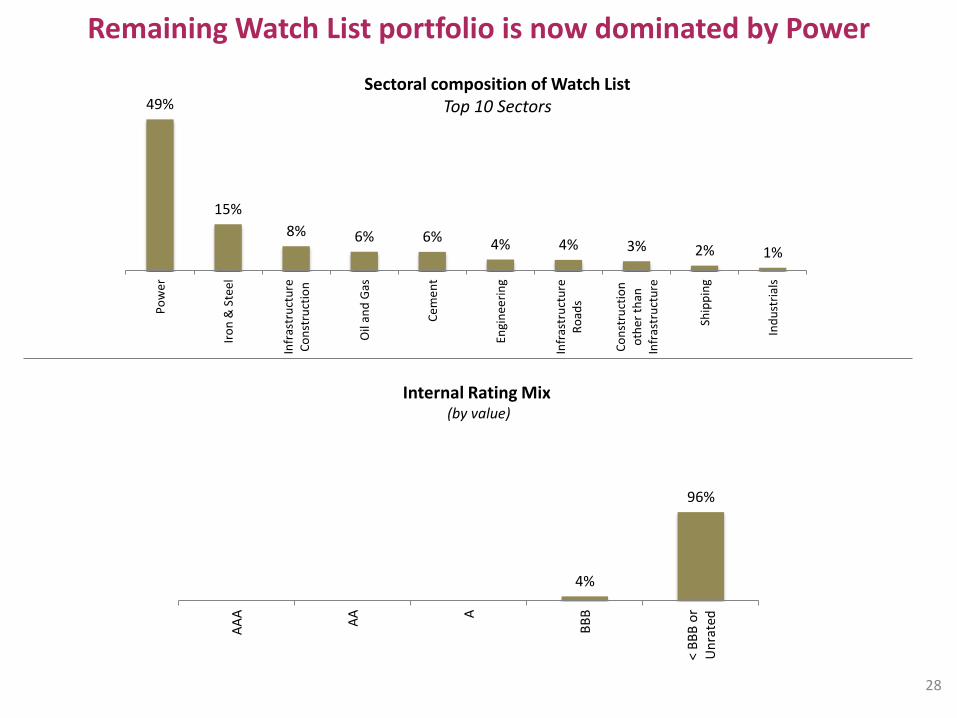
Sectoral composition of Watch List Top 10 Sectors
4%
96%
AA
A
AA A
BB
B
< B
BB
or
Un
rate
d
Internal Rating Mix (by value)
Remaining Watch List portfolio is now dominated by Power
49%
15%
8% 6% 6% 4% 4% 3% 2% 1%
Po
wer
Iro
n &
Ste
el
Infr
astr
uct
ure
Co
nst
ruct
ion
Oil
and
Gas
Ce
me
nt
Engi
nee
rin
g
Infr
astr
uct
ure
Ro
ads
Co
nst
ruct
ion
oth
er t
han
Infr
astr
uct
ure
Ship
pin
g
Ind
ust
rial
s
29
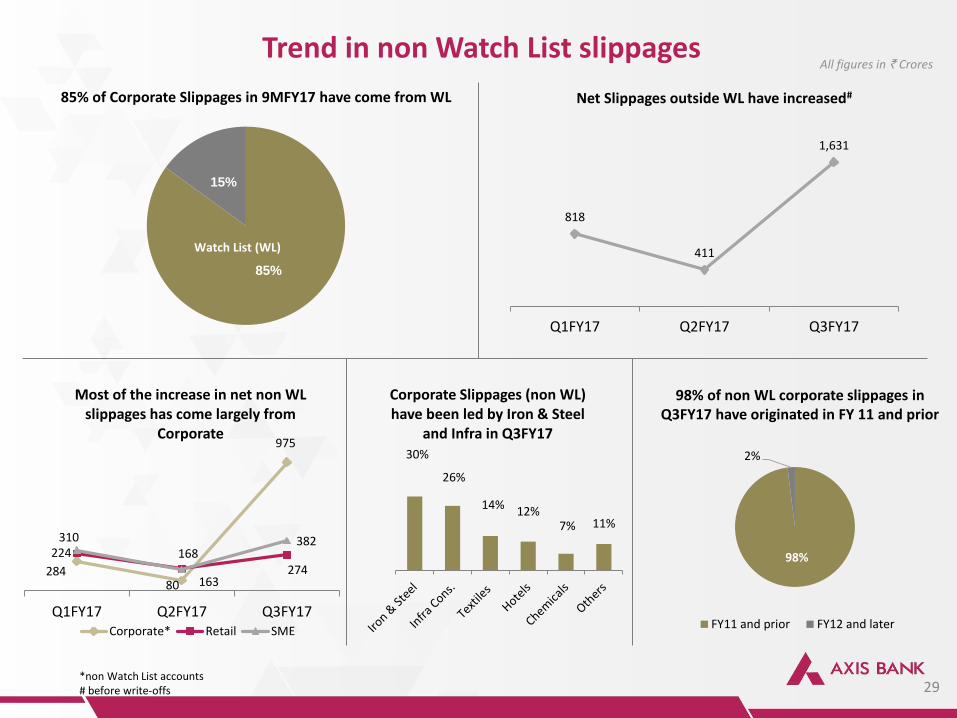
Trend in non Watch List slippages
30%
26%
14% 12% 7% 11%
Corporate Slippages (non WL) have been led by Iron & Steel
and Infra in Q3FY17
224
80
975
284
168 274
310
163
382
Q1FY17 Q2FY17 Q3FY17
Most of the increase in net non WL slippages has come largely from
Corporate
Corporate* Retail SME
818
411
1,631
Q1FY17 Q2FY17 Q3FY17
Net Slippages outside WL have increased#
All figures in ` Crores
85%
15%
Watch List (WL)
85% of Corporate Slippages in 9MFY17 have come from WL
*non Watch List accounts # before write-offs
98%
2%
FY11 and prior FY12 and later
98% of non WL corporate slippages in Q3FY17 have originated in FY 11 and prior
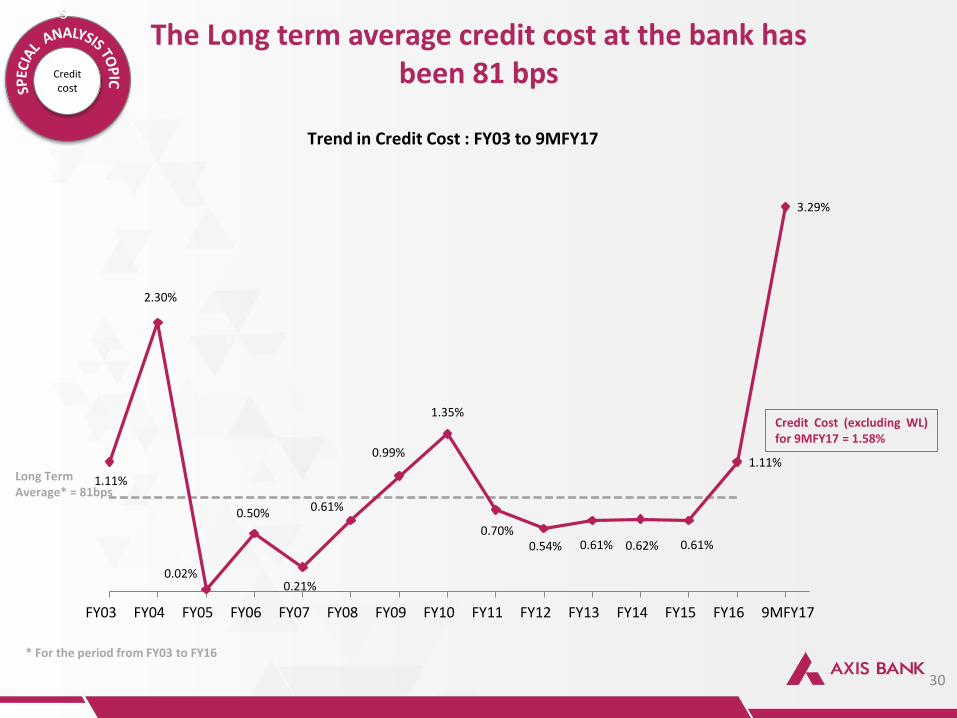
1.11%
2.30%
0.02%
0.50%
0.21%
0.61%
0.99%
1.35%
0.70% 0.54% 0.61% 0.62% 0.61%
1.11%
3.29%
FY03 FY04 FY05 FY06 FY07 FY08 FY09 FY10 FY11 FY12 FY13 FY14 FY15 FY16 9MFY17
Trend in Credit Cost : FY03 to 9MFY17
The Long term average credit cost at the bank has been 81 bps
30
Long Term Average* = 81bps
* For the period from FY03 to FY16
Credit Cost (excluding WL) for 9MFY17 = 1.58%
Credit
cost
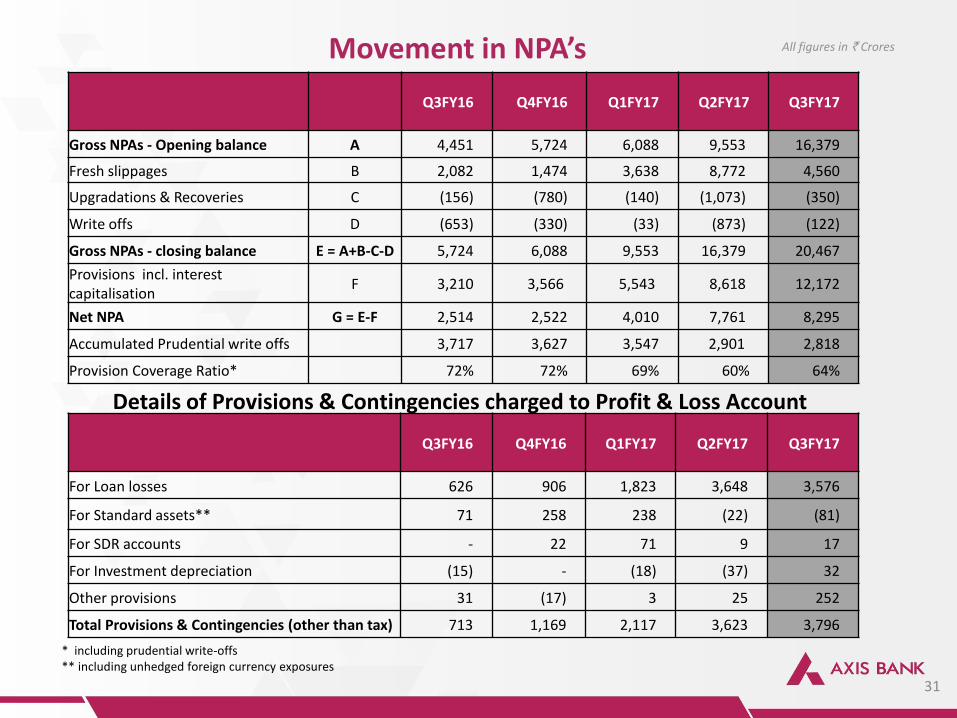
Q3FY16 Q4FY16 Q1FY17 Q2FY17
Q3FY17
Gross NPAs - Opening balance A 4,451 5,724 6,088 9,553 16,379
Fresh slippages B 2,082 1,474 3,638 8,772 4,560
Upgradations & Recoveries C (156) (780) (140) (1,073) (350)
Write offs D (653) (330) (33) (873) (122)
Gross NPAs - closing balance E = A+B-C-D 5,724 6,088 9,553 16,379 20,467
Provisions incl. interest capitalisation
F 3,210 3,566 5,543 8,618 12,172
Net NPA G = E-F 2,514 2,522 4,010 7,761 8,295
Accumulated Prudential write offs 3,717 3,627 3,547 2,901 2,818
Provision Coverage Ratio* 72% 72% 69% 60% 64%
Movement in NPA’s
Q3FY16 Q4FY16 Q1FY17 Q2FY17
Q3FY17
For Loan losses 626 906 1,823 3,648 3,576
For Standard assets** 71 258 238 (22) (81)
For SDR accounts - 22 71 9 17
For Investment depreciation (15) - (18) (37) 32
Other provisions 31 (17) 3 25 252
Total Provisions & Contingencies (other than tax) 713 1,169 2,117 3,623 3,796
All figures in ` Crores
Details of Provisions & Contingencies charged to Profit & Loss Account
* including prudential write-offs ** including unhedged foreign currency exposures
31
32
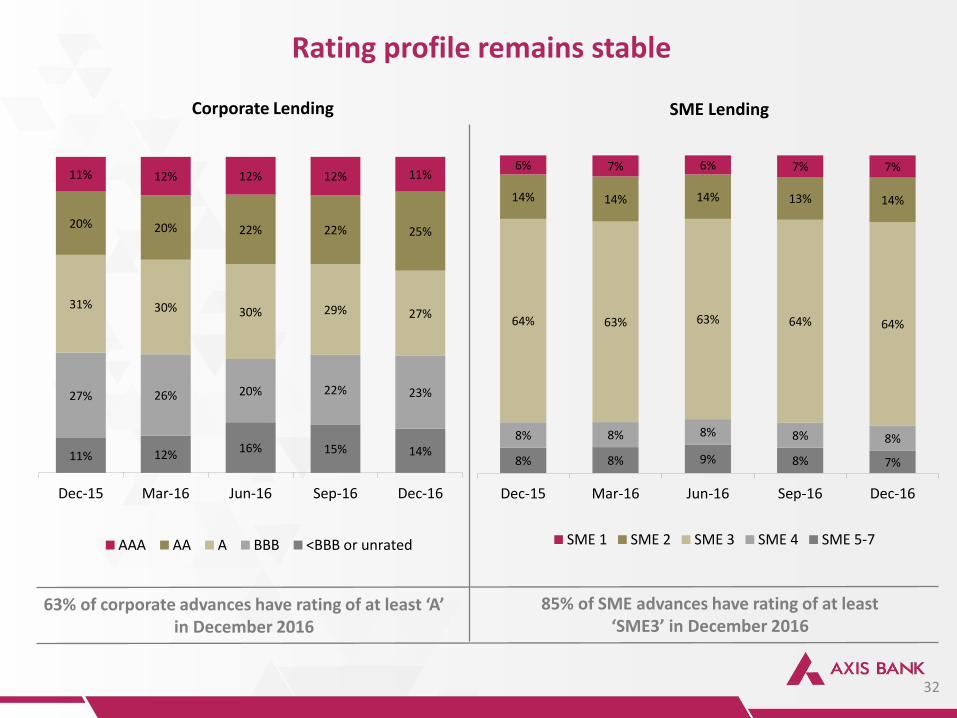
Rating profile remains stable
11% 12% 16% 15% 14%
27% 26% 20% 22% 23%
31% 30% 30% 29% 27%
20% 20% 22% 22% 25%
11% 12% 12% 12% 11%
Dec-15 Mar-16 Jun-16 Sep-16 Dec-16
AAA AA A BBB <BBB or unrated
63% of corporate advances have rating of at least ‘A’ in December 2016
8% 8% 9% 8% 7%
8% 8% 8% 8% 8%
64% 63% 63% 64% 64%
14% 14% 14% 13% 14%
6% 7% 6% 7% 7%
Dec-15 Mar-16 Jun-16 Sep-16 Dec-16
SME 1 SME 2 SME 3 SME 4 SME 5-7
85% of SME advances have rating of at least ‘SME3’ in December 2016
Corporate Lending SME Lending
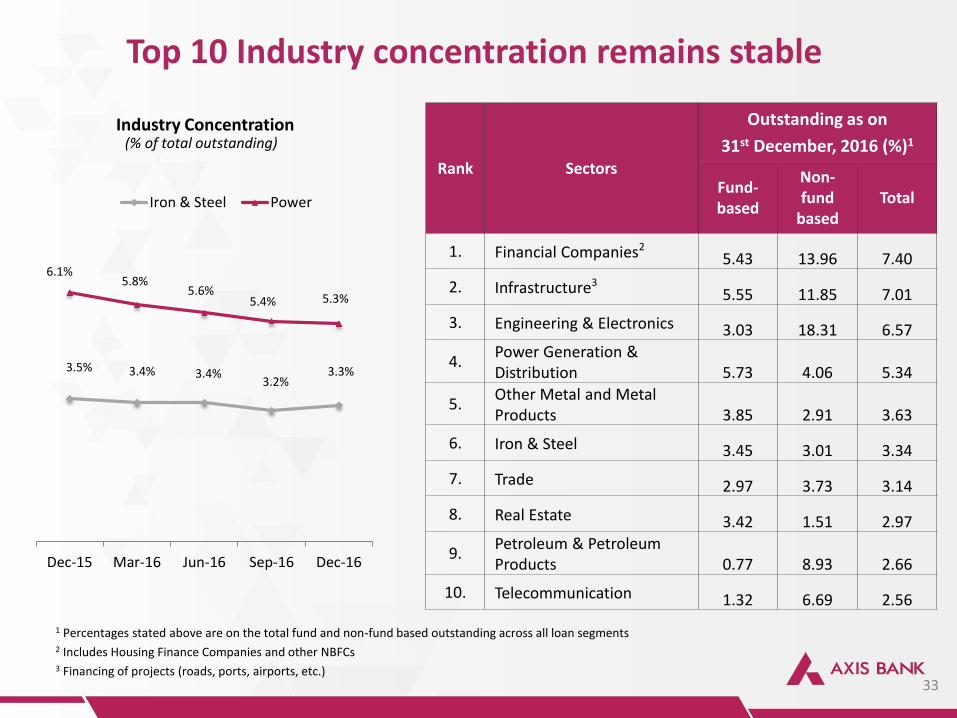
Top 10 Industry concentration remains stable
Rank Sectors
Outstanding as on
31st December, 2016 (%)1
Fund-based
Non-fund
based Total
1. Financial Companies2 5.43 13.96 7.40
2. Infrastructure3 5.55 11.85 7.01
3. Engineering & Electronics 3.03 18.31 6.57
4. Power Generation & Distribution 5.73 4.06 5.34
5. Other Metal and Metal Products 3.85 2.91 3.63
6. Iron & Steel 3.45 3.01 3.34
7. Trade 2.97 3.73 3.14
8. Real Estate 3.42 1.51 2.97
9. Petroleum & Petroleum Products 0.77 8.93 2.66
10. Telecommunication 1.32 6.69 2.56
1 Percentages stated above are on the total fund and non-fund based outstanding across all loan segments 2 Includes Housing Finance Companies and other NBFCs 3 Financing of projects (roads, ports, airports, etc.)
33
3.5% 3.4% 3.4% 3.2%
3.3%
6.1% 5.8%
5.6% 5.4% 5.3%
Dec-15 Mar-16 Jun-16 Sep-16 Dec-16
Industry Concentration
Iron & Steel Power
(% of total outstanding)
Performance Highlights
Growth
Other important information
34
Earnings Quality
Retail Franchise
Asset Quality
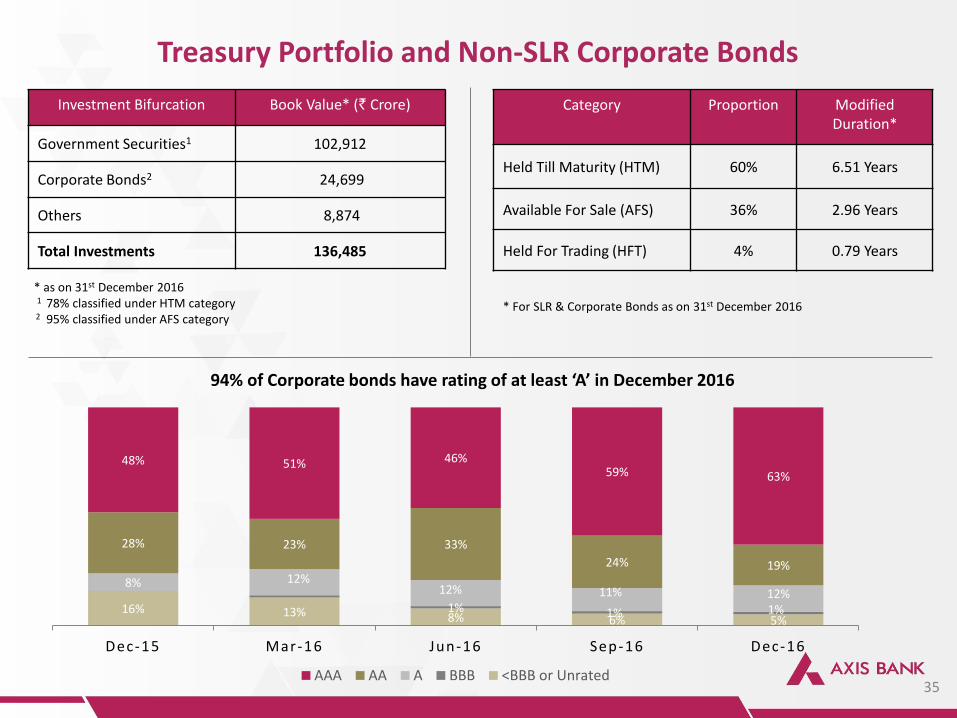
Treasury Portfolio and Non-SLR Corporate Bonds
Investment Bifurcation Book Value* (` Crore)
Government Securities1 102,912
Corporate Bonds2 24,699
Others 8,874
Total Investments 136,485
Category Proportion Modified Duration*
Held Till Maturity (HTM) 60% 6.51 Years
Available For Sale (AFS) 36% 2.96 Years
Held For Trading (HFT) 4% 0.79 Years
* as on 31st December 2016 1 78% classified under HTM category 2 95% classified under AFS category
* For SLR & Corporate Bonds as on 31st December 2016
16% 13% 8% 6% 5% 1% 1% 1%
8% 12% 12% 11% 12%
28% 23% 33%
24% 19%
48% 51% 46% 59% 63%
Dec-15 Mar-16 Jun-16 Sep-16 Dec-16
94% of Corporate bonds have rating of at least ‘A’ in December 2016
AAA AA A BBB <BBB or Unrated35
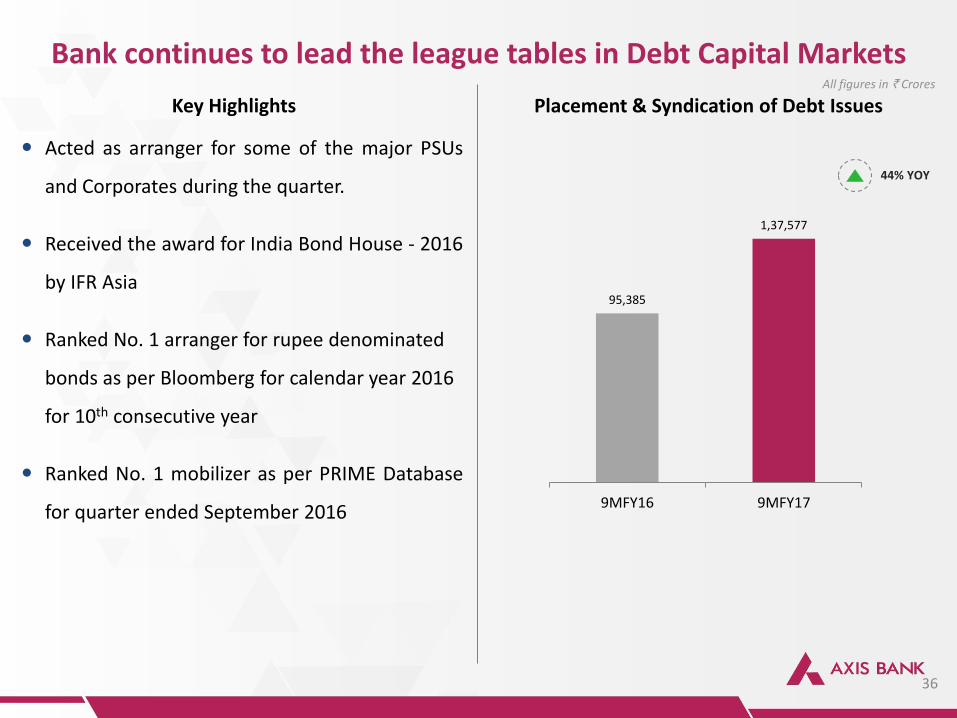
Bank continues to lead the league tables in Debt Capital Markets
Key Highlights Placement & Syndication of Debt Issues
Acted as arranger for some of the major PSUs
and Corporates during the quarter.
Received the award for India Bond House - 2016
by IFR Asia
Ranked No. 1 arranger for rupee denominated
bonds as per Bloomberg for calendar year 2016
for 10th consecutive year
Ranked No. 1 mobilizer as per PRIME Database
for quarter ended September 2016
36
30% YOY
All figures in ` Crores
95,385
1,37,577
9MFY16 9MFY17
44% YOY
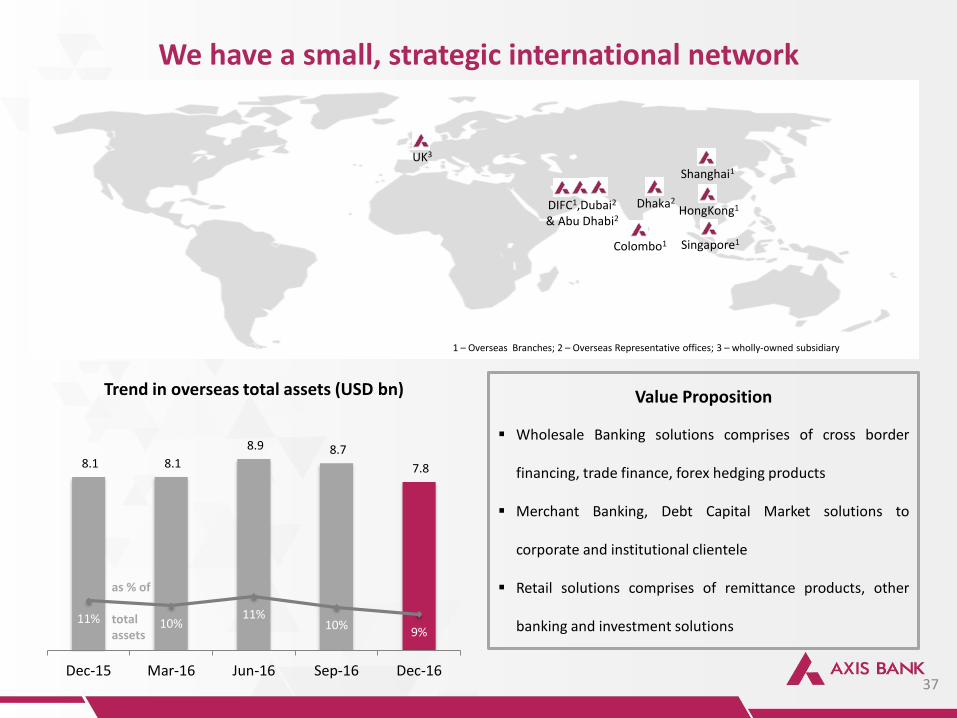
We have a small, strategic international network
37
Colombo1 Singapore1
HongKong1
UK3
Shanghai1
Dhaka2 DIFC1,Dubai2
& Abu Dhabi2
1 – Overseas Branches; 2 – Overseas Representative offices; 3 – wholly-owned subsidiary
8.1 8.1
8.9 8.7
7.8
11% 10% 11%
10% 9%
Dec-15 Mar-16 Jun-16 Sep-16 Dec-16
Trend in overseas total assets (USD bn)
as % of total assets
Value Proposition
Wholesale Banking solutions comprises of cross border
financing, trade finance, forex hedging products
Merchant Banking, Debt Capital Market solutions to
corporate and institutional clientele
Retail solutions comprises of remittance products, other
banking and investment solutions
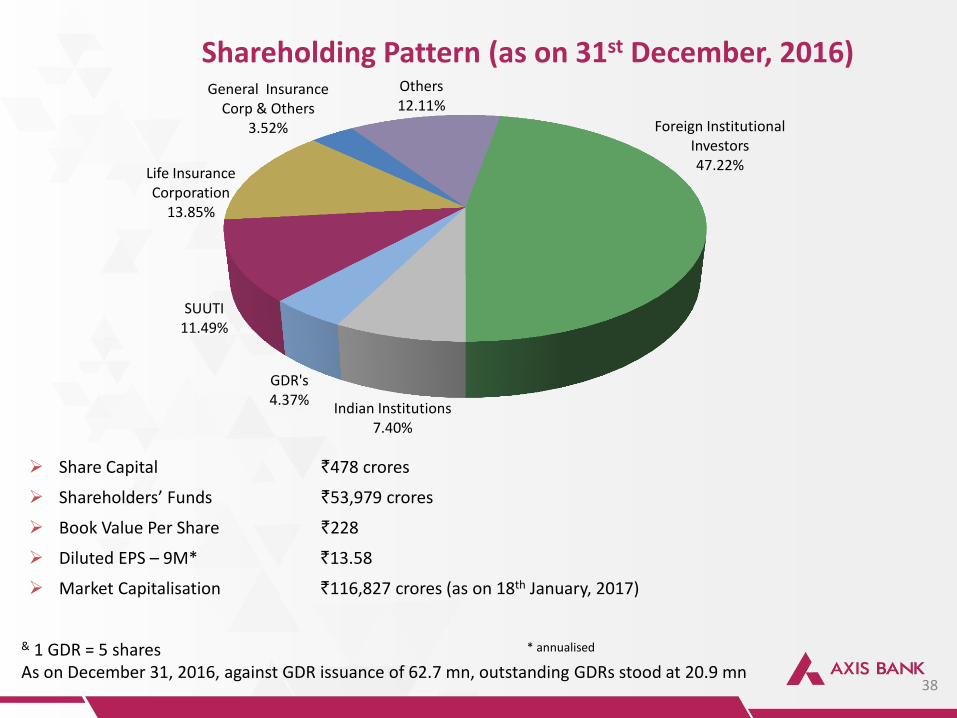
Shareholding Pattern (as on 31st December, 2016)
Share Capital `478 crores
Shareholders’ Funds `53,979 crores
Book Value Per Share `228
Diluted EPS – 9M* `13.58
Market Capitalisation `116,827 crores (as on 18th January, 2017)
& 1 GDR = 5 shares As on December 31, 2016, against GDR issuance of 62.7 mn, outstanding GDRs stood at 20.9 mn
38
Foreign Institutional Investors 47.22%
Indian Institutions 7.40%
GDR's 4.37%
SUUTI 11.49%
Life Insurance Corporation
13.85%
General Insurance Corp & Others
3.52%
Others 12.11%
* annualised
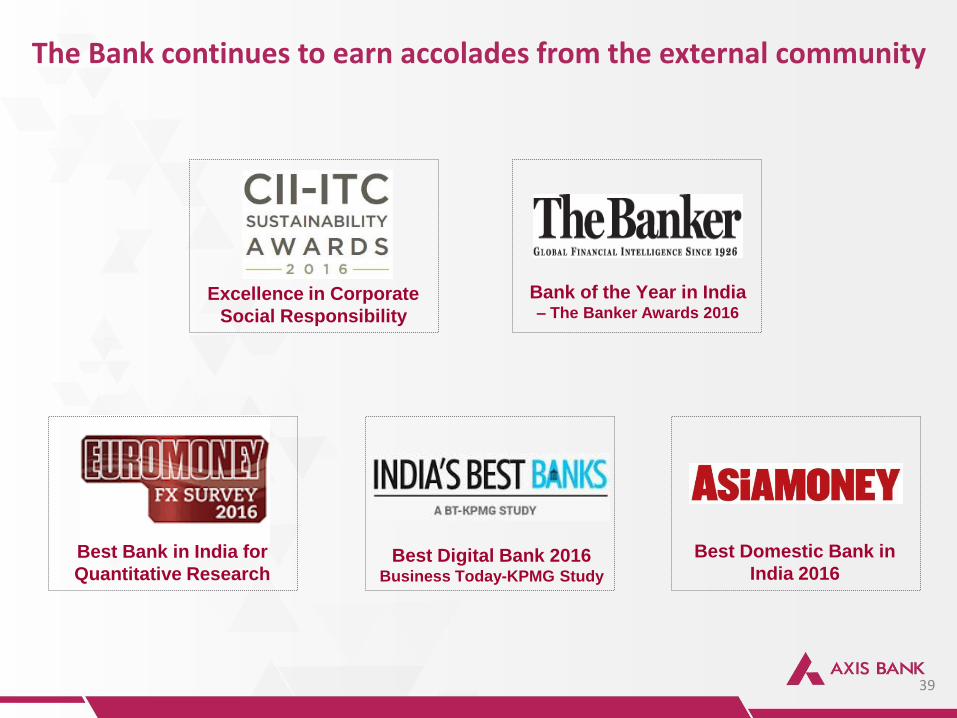
The Bank continues to earn accolades from the external community
39
Bank of the Year in India – The Banker Awards 2016
Excellence in Corporate
Social Responsibility
Best Bank in India for
Quantitative Research Best Digital Bank 2016
Business Today-KPMG Study
Best Domestic Bank in
India 2016

Thank You
40