Embed Size (px)
Citation preview
Queensland Commercial Macropod Management Program
Annual Report 2017
Annual Report 2014
Prepared by: Environmental Services and Regulation, Department of Environment and Science
© State of Queensland, 2018.
The Queensland Government supports and encourages the dissemination and exchange of its information. The copyright in this
publication is licensed under a Creative Commons Attribution 3.0 Australia (CC BY) licence.
Under this licence you are free, without having to seek our permission, to use this publication in accordance with the licence
terms.
You must keep intact the copyright notice and attribute the State of Queensland as the source of the publication.
For more information on this licence, visit http://creativecommons.org/licenses/by/3.0/au/deed.en
Disclaimer
This document has been prepared with all due diligence and care, based on the best available information at the time of
publication. The department holds no responsibility for any errors or omissions within this document. Any decisions made by
other parties based on this document are solely the responsibility of those parties. Information contained in this document is
from a number of sources and, as such, does not necessarily represent government or departmental policy.
If you need to access this document in a language other than English, please call the Translating and Interpreting Service (TIS
National) on 131 450 and ask them to telephone Library Services on +61 7 3170 5470.
This publication can be made available in an alternative format (e.g. large print or audiotape) on request for people with vision
impairment; phone +61 7 3170 5470 or email <[email protected]>.
March 2018
iii
Preface This annual report summarises the activities of the Commercial Macropod Management Program in Queensland for the period 1 January 2017 to 31 December 2017. In accordance with the Wildlife Trade Management Plan for Export—Commercially Harvested Macropods 2013–2017, the report addresses:
actual harvest by zone and species compared to quota
harvest sex ratio, average carcass weights and skin take
any special quota used
non-commercial harvest mortality
compliance statistics
unusual circumstances
research and experiments
program improvements.
For the 2017 harvest period, 1029 commercial wildlife harvesting licences for macropods, commonly known as harvester licences were issued. There were 83 commercial wildlife licences for dead macropods, commonly known as dealer’s licences, nine commercial wildlife licences for dead macropods (meat processing) and two commercial wildlife licences for dead macropods (tanning) current. Data from dealer returns, entered up to 18 February 2018, indicates that there were 868,129 macropods commercially harvested, representing 26.4 % of the overall quota. The harvest was predominantly for carcasses used for both human consumption and pet food.
No quota was exceeded for any species in any zone in 2017. The highest percentage use of quota was for common wallaroos in the central zone at 37.1%. In all harvest zones, the percentage of the population used for each species was less than 5%.
The commercial harvest is typically biased towards males due to their generally larger size and weight when compared to females. For 2017, the harvest for each species was biased towards males by 94% or greater.
During the 2017 harvest period, the department issued seven infringement notices and 44 warning notices for offences relating to the commercial macropod harvest.
iv
Contents
Preface ................................................................................................................................................... iii
1. Background .................................................................................................................................... 1
2. Harvest management ..................................................................................................................... 4
3. Harvest ........................................................................................................................................... 5
3.1 Harvest sex ratio ................................................................................................................... 8
3.2 Carcass and skin harvest .................................................................................................... 11
3.3 Average weight ................................................................................................................... 13
4. Special quotas ............................................................................................................................. 15
5. The extent of non-commercial harvest mortality ....................................................................... 15
6. Damage mitigation permits ......................................................................................................... 15
7. Disease outbreak mortality ......................................................................................................... 16
8. Long-term population, quota and harvest trends ...................................................................... 16
9. Compliance .................................................................................................................................. 21
9.1 Inspections .......................................................................................................................... 21
9.2 Compliance and enforcement measures ............................................................................. 22
10. Unusual circumstances ............................................................................................................... 23
11. Research and experiments ......................................................................................................... 23
12. Program improvements ............................................................................................................... 23
13. References ................................................................................................................................... 24
Appendix 1 ............................................................................................................................................ 25
Queensland Commercial Macropod Management Program—Annual Report 2017
1
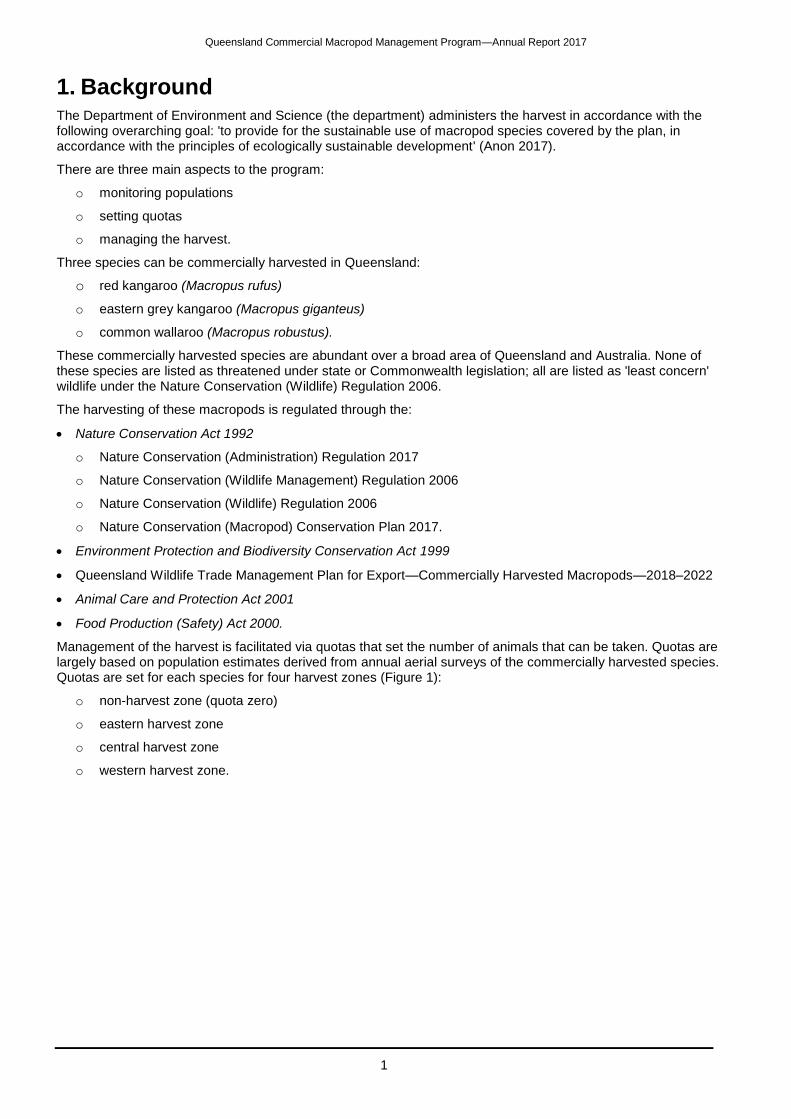
1. Background The Department of Environment and Science (the department) administers the harvest in accordance with the following overarching goal: 'to provide for the sustainable use of macropod species covered by the plan, in accordance with the principles of ecologically sustainable development' (Anon 2017).
There are three main aspects to the program:
o monitoring populations
o setting quotas
o managing the harvest.
Three species can be commercially harvested in Queensland:
o red kangaroo (Macropus rufus)
o eastern grey kangaroo (Macropus giganteus)
o common wallaroo (Macropus robustus).
These commercially harvested species are abundant over a broad area of Queensland and Australia. None of these species are listed as threatened under state or Commonwealth legislation; all are listed as 'least concern' wildlife under the Nature Conservation (Wildlife) Regulation 2006.
The harvesting of these macropods is regulated through the:
Nature Conservation Act 1992
o Nature Conservation (Administration) Regulation 2017
o Nature Conservation (Wildlife Management) Regulation 2006
o Nature Conservation (Wildlife) Regulation 2006
o Nature Conservation (Macropod) Conservation Plan 2017.
Environment Protection and Biodiversity Conservation Act 1999
Queensland Wildlife Trade Management Plan for Export—Commercially Harvested Macropods—2018–2022
Animal Care and Protection Act 2001
Food Production (Safety) Act 2000.
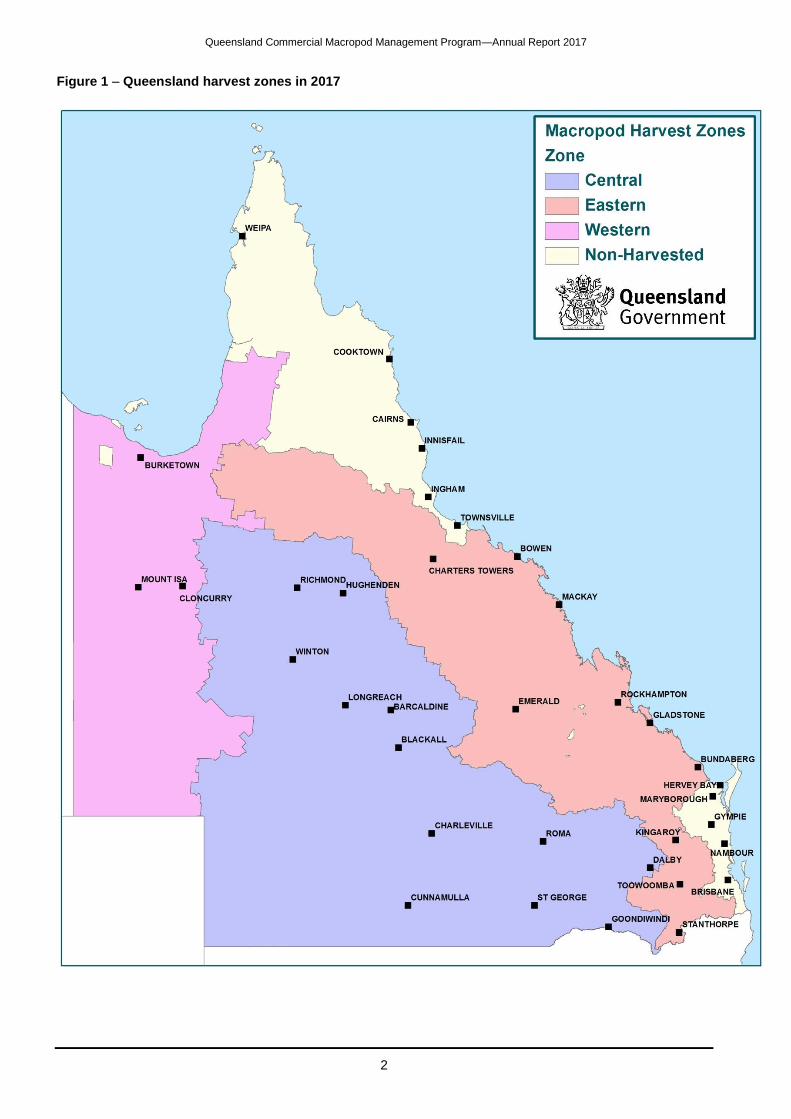
Management of the harvest is facilitated via quotas that set the number of animals that can be taken. Quotas are largely based on population estimates derived from annual aerial surveys of the commercially harvested species. Quotas are set for each species for four harvest zones (Figure 1):
o non-harvest zone (quota zero)
o eastern harvest zone
o central harvest zone
o western harvest zone.
Queensland Commercial Macropod Management Program—Annual Report 2017
2
Figure 1 – Queensland harvest zones in 2017
Queensland Commercial Macropod Management Program—Annual Report 2017
3
Quotas are calculated using a fixed proportion of the estimated macropod populations within the harvest areas. Proportions are adjusted for each species across the harvest zones in relation to the margins of error present in population estimates derived from the aerial surveys. The maximum proportions used for each species are 15% of the populations for eastern grey kangaroos and common wallaroos and 20% of the population for red kangaroos for the central zone. For the eastern and western zones, where survey effort is less extensive when compared to the central zone, the more conservative maximum proportion of 10% is applied for all three species.
These sustainable-use harvest proportions are based on research and modelling undertaken by Caughley et al. (1987) and Hacker et al. (2002) and are currently accepted by the scientific community, state and Australian governments, for determining state quota limits.
This annual report summarises the activities of the Commercial Macropod Management Program for the period 1 January 2017 to 31 December 2017. In accordance with the Wildlife Trade Management Plan for Export—Commercially Harvested Macropods—2013–2017, the report will address:
o actual harvest by zone and species compared to quota
o harvest sex ratio, average carcass weights and skin take
o any special quota used
o non-commercial harvest mortality
o compliance statistics
o unusual circumstances
o research and experiments
o program improvements.
All macropod species are ‘protected animals’ in Queensland under the Nature Conservation (Wildlife) Regulation 2006. The Nature Conservation (Administration) Regulation 2006 provides for the licensing of a range of activities in relation to the commercial harvesting of macropods in Queensland.
Macropods can only be taken in accordance with the Wildlife Trade Management Plan for Export—Commercially Harvested Macropods—2013–2017 and the Nature Conservation (Macropod) Conservation Plan 2005 under a licence issued by the department.
The harvest is controlled by the use of self-locking numbered plastic tags with a unique colour code for each species and year. The following applies to the use of tags:
Tags are issued to a specific harvester and are not transferable to any other harvester.
Tags must be securely attached to the skin of every macropod commercially harvested.
A tag can only be removed from the macropod skin during the skin tanning process at a licensed tannery.
The tags are self-locking and tamper-evident.
The tags are individually numbered and of a different colour for each consecutive year and species.
A fee (fixed by regulation) is charged for the sale of tags.
Record and return of operations are submitted to the department by harvesters and dealers at regular periods. Harvest statistics from returns are used to monitor and manage the harvest.
Queensland Commercial Macropod Management Program—Annual Report 2017
4
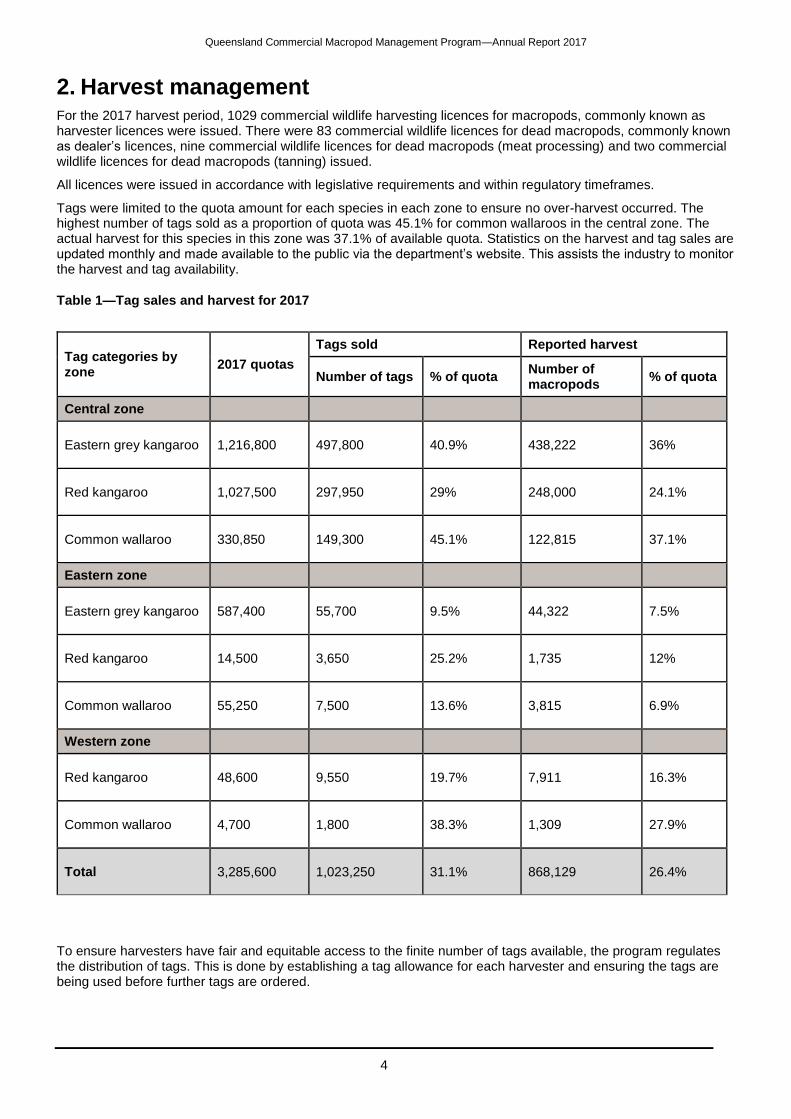
2. Harvest management For the 2017 harvest period, 1029 commercial wildlife harvesting licences for macropods, commonly known as harvester licences were issued. There were 83 commercial wildlife licences for dead macropods, commonly known as dealer’s licences, nine commercial wildlife licences for dead macropods (meat processing) and two commercial wildlife licences for dead macropods (tanning) issued.
All licences were issued in accordance with legislative requirements and within regulatory timeframes.
Tags were limited to the quota amount for each species in each zone to ensure no over-harvest occurred. The highest number of tags sold as a proportion of quota was 45.1% for common wallaroos in the central zone. The actual harvest for this species in this zone was 37.1% of available quota. Statistics on the harvest and tag sales are updated monthly and made available to the public via the department’s website. This assists the industry to monitor the harvest and tag availability.
Table 1—Tag sales and harvest for 2017
To ensure harvesters have fair and equitable access to the finite number of tags available, the program regulates the distribution of tags. This is done by establishing a tag allowance for each harvester and ensuring the tags are being used before further tags are ordered.
Tag categories by zone
2017 quotas
Tags sold Reported harvest
Number of tags % of quota Number of macropods
% of quota
Central zone
Eastern grey kangaroo 1,216,800
497,800
40.9% 438,222
36%
Red kangaroo 1,027,500 297,950
29% 248,000
24.1%
Common wallaroo 330,850
149,300
45.1% 122,815
37.1%
Eastern zone
Eastern grey kangaroo 587,400
55,700
9.5% 44,322
7.5%
Red kangaroo 14,500
3,650
25.2% 1,735
12%
Common wallaroo 55,250
7,500
13.6% 3,815
6.9%
Western zone
Red kangaroo 48,600
9,550
19.7% 7,911
16.3%
Common wallaroo 4,700
1,800
38.3% 1,309
27.9%
Total 3,285,600 1,023,250
31.1% 868,129
26.4%
Queensland Commercial Macropod Management Program—Annual Report 2017
5
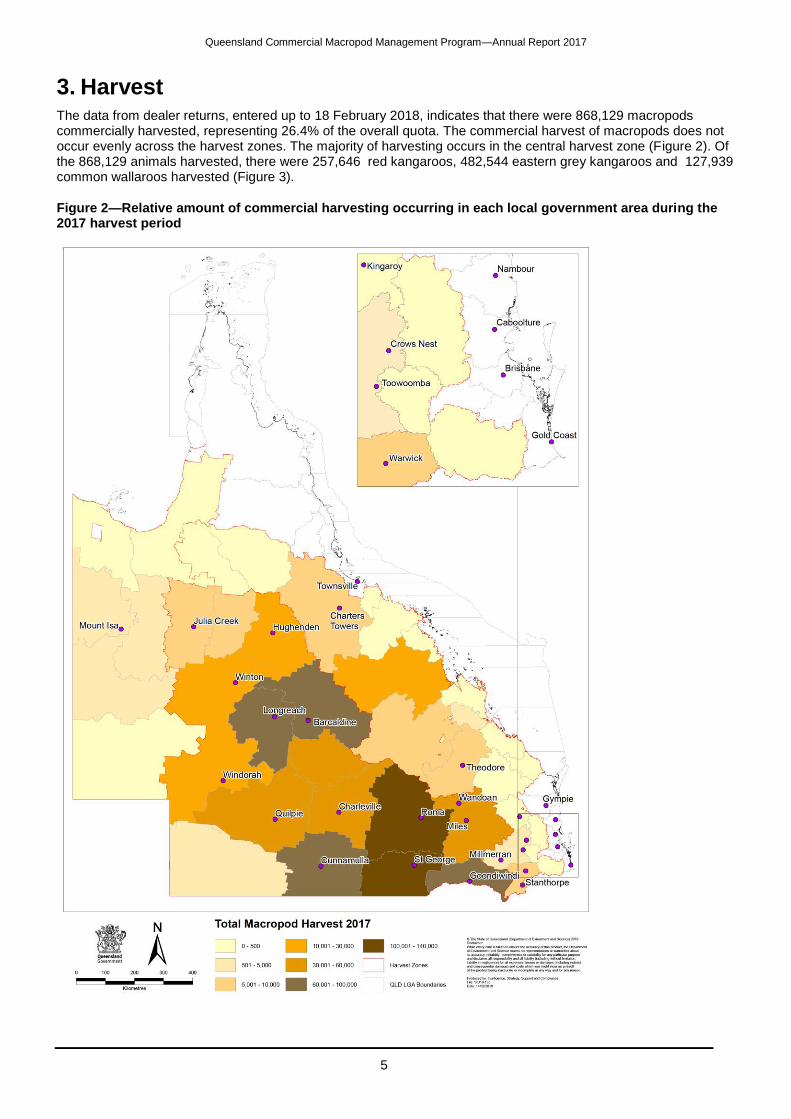
3. Harvest The data from dealer returns, entered up to 18 February 2018, indicates that there were 868,129 macropods commercially harvested, representing 26.4% of the overall quota. The commercial harvest of macropods does not occur evenly across the harvest zones. The majority of harvesting occurs in the central harvest zone (Figure 2). Of the 868,129 animals harvested, there were 257,646 red kangaroos, 482,544 eastern grey kangaroos and 127,939 common wallaroos harvested (Figure 3).
Figure 2—Relative amount of commercial harvesting occurring in each local government area during the 2017 harvest period
Queensland Commercial Macropod Management Program—Annual Report 2017
6
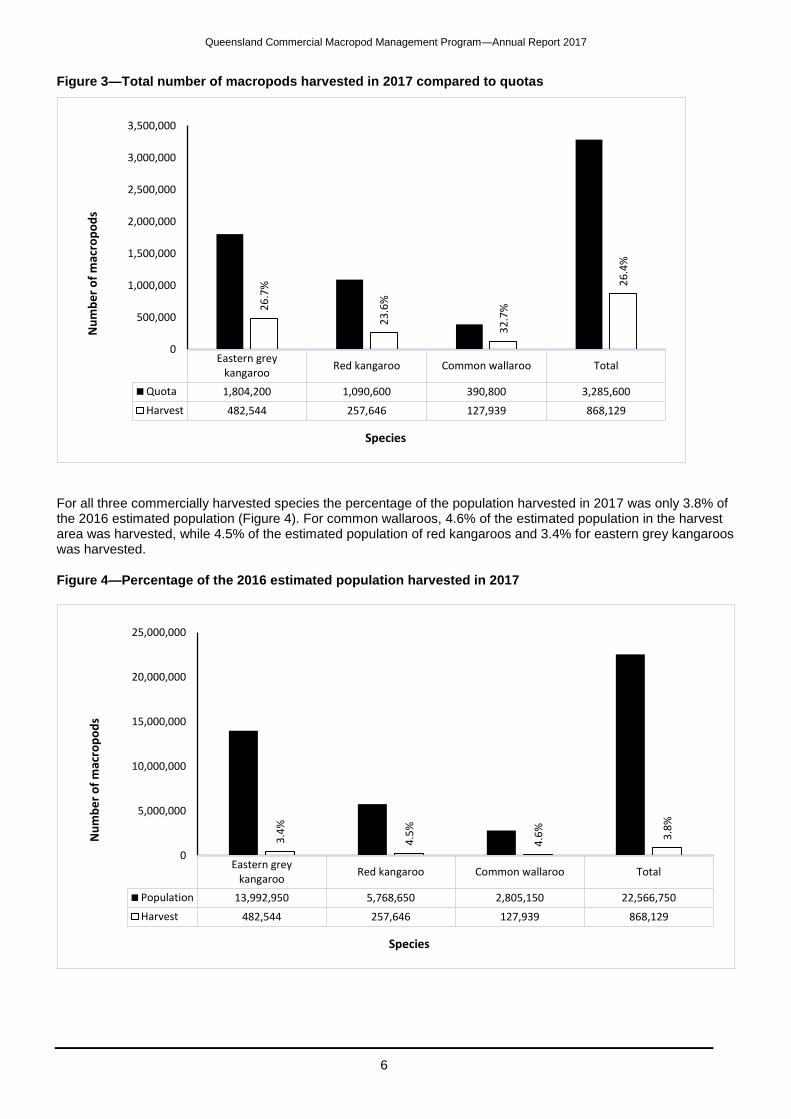
Figure 3—Total number of macropods harvested in 2017 compared to quotas
For all three commercially harvested species the percentage of the population harvested in 2017 was only 3.8% of the 2016 estimated population (Figure 4). For common wallaroos, 4.6% of the estimated population in the harvest area was harvested, while 4.5% of the estimated population of red kangaroos and 3.4% for eastern grey kangaroos was harvested.
Figure 4—Percentage of the 2016 estimated population harvested in 2017
Eastern greykangaroo
Red kangaroo Common wallaroo Total
Quota 1,804,200 1,090,600 390,800 3,285,600
Harvest 482,544 257,646 127,939 868,129
26
.7%
23
.6%
32
.7%
26
.4%
0
500,000
1,000,000
1,500,000
2,000,000
2,500,000
3,000,000
3,500,000
Nu
mb
er
of
mac
rop
od
s
Species
Eastern greykangaroo
Red kangaroo Common wallaroo Total
Population 13,992,950 5,768,650 2,805,150 22,566,750
Harvest 482,544 257,646 127,939 868,129
3.4
%
4.5
%
4.6
%
3.8
%
0
5,000,000
10,000,000
15,000,000
20,000,000
25,000,000
Nu
mb
er
of
mac
rop
od
s
Species
Queensland Commercial Macropod Management Program—Annual Report 2017
7
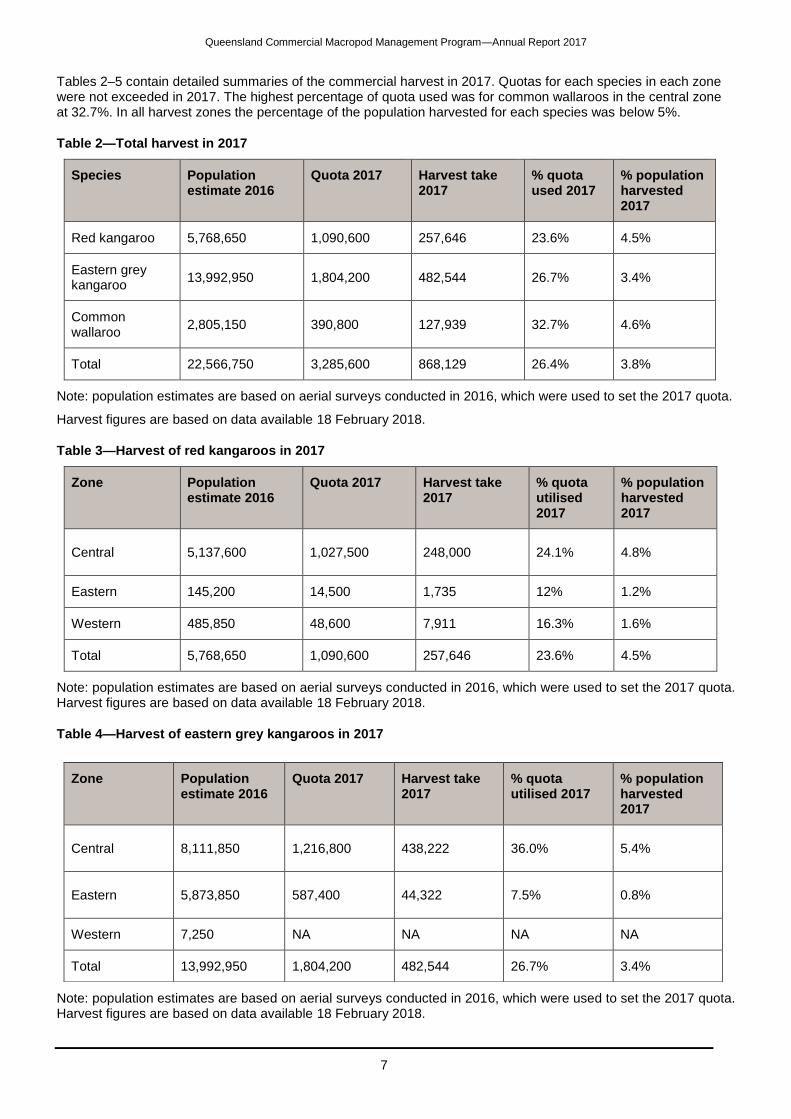
Tables 2–5 contain detailed summaries of the commercial harvest in 2017. Quotas for each species in each zone were not exceeded in 2017. The highest percentage of quota used was for common wallaroos in the central zone at 32.7%. In all harvest zones the percentage of the population harvested for each species was below 5%.
Table 2—Total harvest in 2017
Species Population estimate 2016
Quota 2017 Harvest take 2017
% quota used 2017
% population harvested 2017
Red kangaroo 5,768,650 1,090,600 257,646 23.6% 4.5%
Eastern grey kangaroo
13,992,950 1,804,200 482,544 26.7% 3.4%
Common wallaroo
2,805,150 390,800 127,939 32.7% 4.6%
Total 22,566,750 3,285,600 868,129 26.4% 3.8%
Note: population estimates are based on aerial surveys conducted in 2016, which were used to set the 2017 quota.
Harvest figures are based on data available 18 February 2018.
Table 3—Harvest of red kangaroos in 2017
Zone Population estimate 2016
Quota 2017 Harvest take 2017
% quota utilised 2017
% population harvested 2017
Central 5,137,600 1,027,500 248,000
24.1% 4.8%
Eastern 145,200 14,500 1,735 12% 1.2%
Western 485,850 48,600 7,911 16.3% 1.6%
Total 5,768,650 1,090,600 257,646 23.6% 4.5%
Note: population estimates are based on aerial surveys conducted in 2016, which were used to set the 2017 quota. Harvest figures are based on data available 18 February 2018.
Table 4—Harvest of eastern grey kangaroos in 2017
Note: population estimates are based on aerial surveys conducted in 2016, which were used to set the 2017 quota. Harvest figures are based on data available 18 February 2018.
Zone Population estimate 2016
Quota 2017 Harvest take 2017
% quota utilised 2017
% population harvested 2017
Central 8,111,850 1,216,800
438,222
36.0%
5.4%
Eastern 5,873,850 587,400
44,322
7.5%
0.8%
Western 7,250 NA NA NA NA
Total 13,992,950 1,804,200 482,544 26.7% 3.4%
Queensland Commercial Macropod Management Program—Annual Report 2017
8
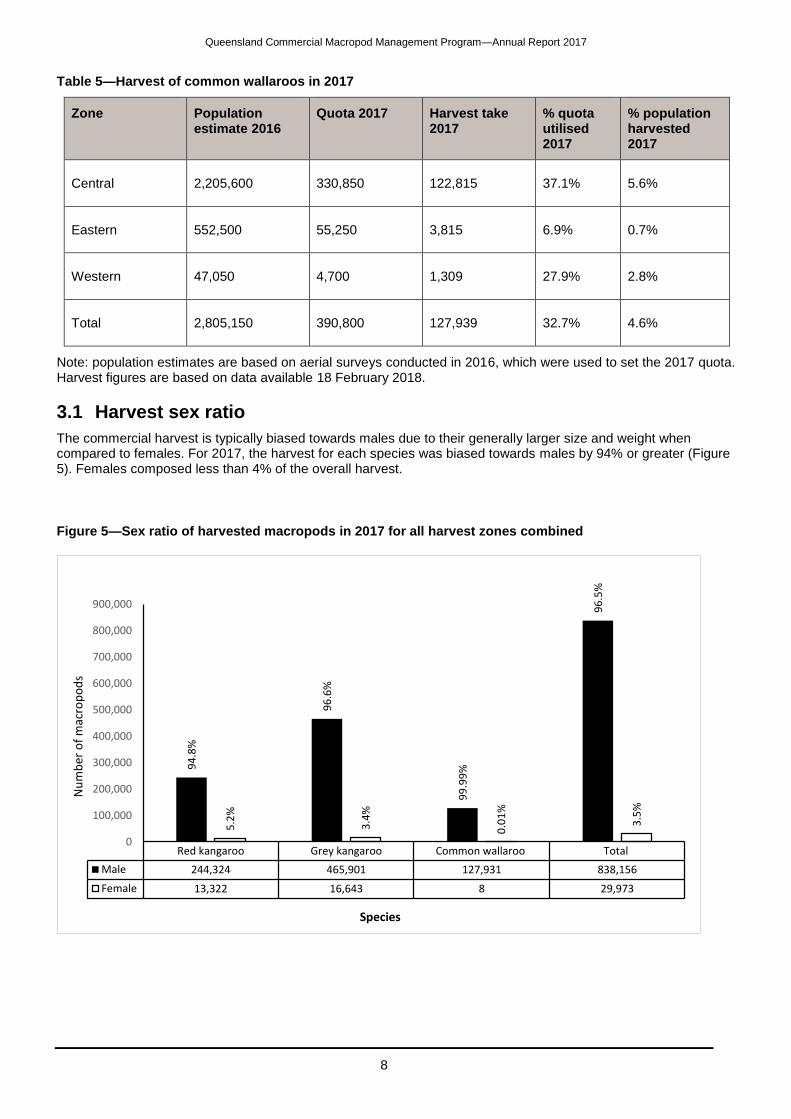
Table 5—Harvest of common wallaroos in 2017
Zone Population estimate 2016
Quota 2017 Harvest take 2017
% quota utilised 2017
% population harvested 2017
Central 2,205,600 330,850
122,815
37.1%
5.6%
Eastern 552,500 55,250
3,815
6.9%
0.7%
Western 47,050 4,700 1,309
27.9%
2.8%
Total
2,805,150 390,800 127,939 32.7% 4.6%
Note: population estimates are based on aerial surveys conducted in 2016, which were used to set the 2017 quota. Harvest figures are based on data available 18 February 2018.
3.1 Harvest sex ratio
The commercial harvest is typically biased towards males due to their generally larger size and weight when compared to females. For 2017, the harvest for each species was biased towards males by 94% or greater (Figure 5). Females composed less than 4% of the overall harvest.
Figure 5—Sex ratio of harvested macropods in 2017 for all harvest zones combined
Red kangaroo Grey kangaroo Common wallaroo Total
Male 244,324 465,901 127,931 838,156
Female 13,322 16,643 8 29,973
94
.8%
96
.6%
99
.99
%
96
.5%
5.2
%
3.4
%
0.0
1%
3.5
%
0
100,000
200,000
300,000
400,000
500,000
600,000
700,000
800,000
900,000
Nu
mb
er o
f m
acro
po
ds
Species
Queensland Commercial Macropod Management Program—Annual Report 2017
9
For red kangaroos, the highest percentage of females harvested was in the central zone at 5.3%. The overall take of females for this species was also 5.2% of the harvest (Figure 6).
Figure 6—Sex ratio of harvested red kangaroos in 2017
For eastern grey kangaroos the greatest percentage take of females was 5.1% in the eastern zone. Overall for this species, females comprised 3.4% of the harvest (Figure 7).
Figure 7—Sex ratio of harvested eastern grey kangaroos in 2017
Central Eastern Western Total
Male 234,858 1,555 7,911 244,324
Female 13,142 180 0 13,322
94
.7%
89
.6%
10
0%
94
.8%
5.3
%
10
.4%
5.2
%
0
50,000
100,000
150,000
200,000
250,000
300,000
Nu
mb
er
of
mac
rop
od
s
Species
Central Eastern Western Total
Male 423,825 42,076 0 465,901
Female 14,397 2,246 0 16,643
96
.7%
94
.9%
NA
96
.6%
3.3
%
5.1
%
NA 3
.4%
0
50,000
100,000
150,000
200,000
250,000
300,000
350,000
400,000
450,000
500,000
Nu
mb
er
of
mac
rop
od
s
Species
Queensland Commercial Macropod Management Program—Annual Report 2017
10
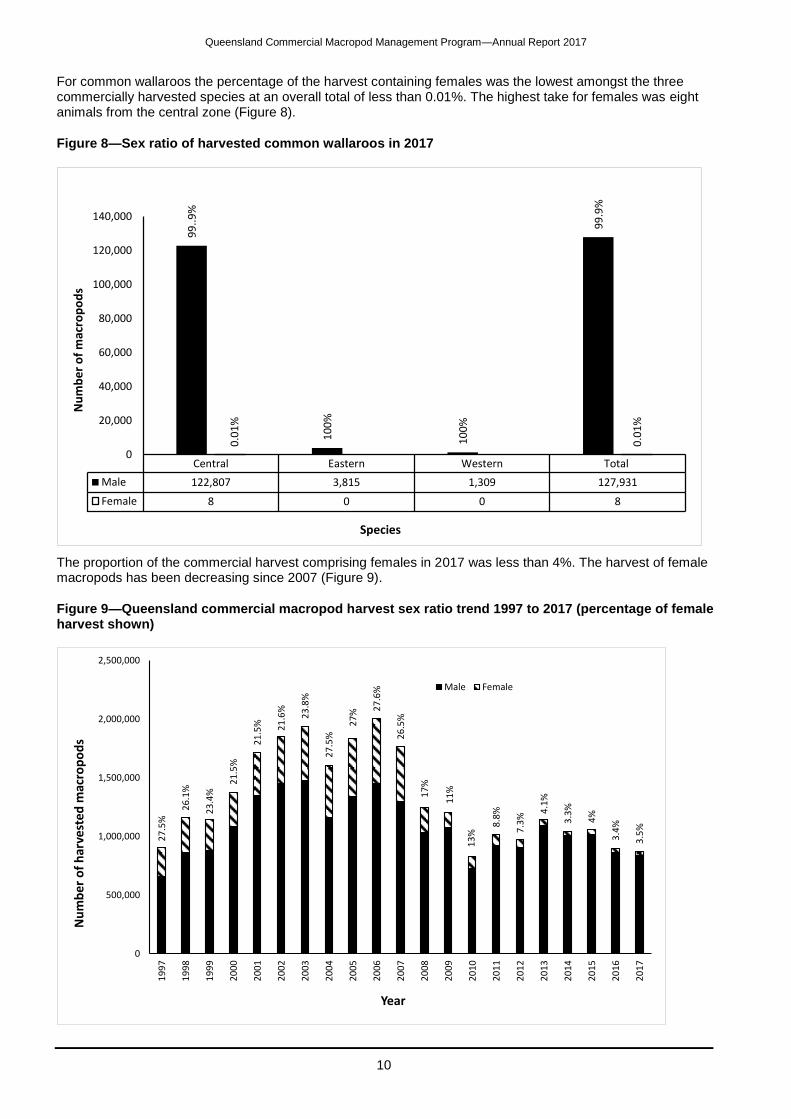
For common wallaroos the percentage of the harvest containing females was the lowest amongst the three commercially harvested species at an overall total of less than 0.01%. The highest take for females was eight animals from the central zone (Figure 8).
Figure 8—Sex ratio of harvested common wallaroos in 2017
The proportion of the commercial harvest comprising females in 2017 was less than 4%. The harvest of female macropods has been decreasing since 2007 (Figure 9).
Figure 9—Queensland commercial macropod harvest sex ratio trend 1997 to 2017 (percentage of female harvest shown)
Central Eastern Western Total
Male 122,807 3,815 1,309 127,931
Female 8 0 0 8
99
..9
%
10
0%
10
0%
99
.9%
0.0
1%
0.0
1%
0
20,000
40,000
60,000
80,000
100,000
120,000
140,000
Nu
mb
er
of
mac
rop
od
s
Species
27
.5%
26
.1%
23
.4%
21
.5%
21
.5% 21
.6%
23
.8%
27
.5%
27
% 27
.6%
26
.5%
17
%
11
%
13
%
8.8
%
7.3
%
4.1
%
3.3
%
4%
3.4
%
3.5
%
0
500,000
1,000,000
1,500,000
2,000,000
2,500,000
19
97
19
98
19
99
20
00
20
01
20
02
20
03
20
04
20
05
20
06
20
07
20
08
20
09
20
10
20
11
20
12
20
13
20
14
20
15
20
16
20
17
Nu
mb
er
of
har
vest
ed m
acro
po
ds
Year
Male Female
Queensland Commercial Macropod Management Program—Annual Report 2017
11
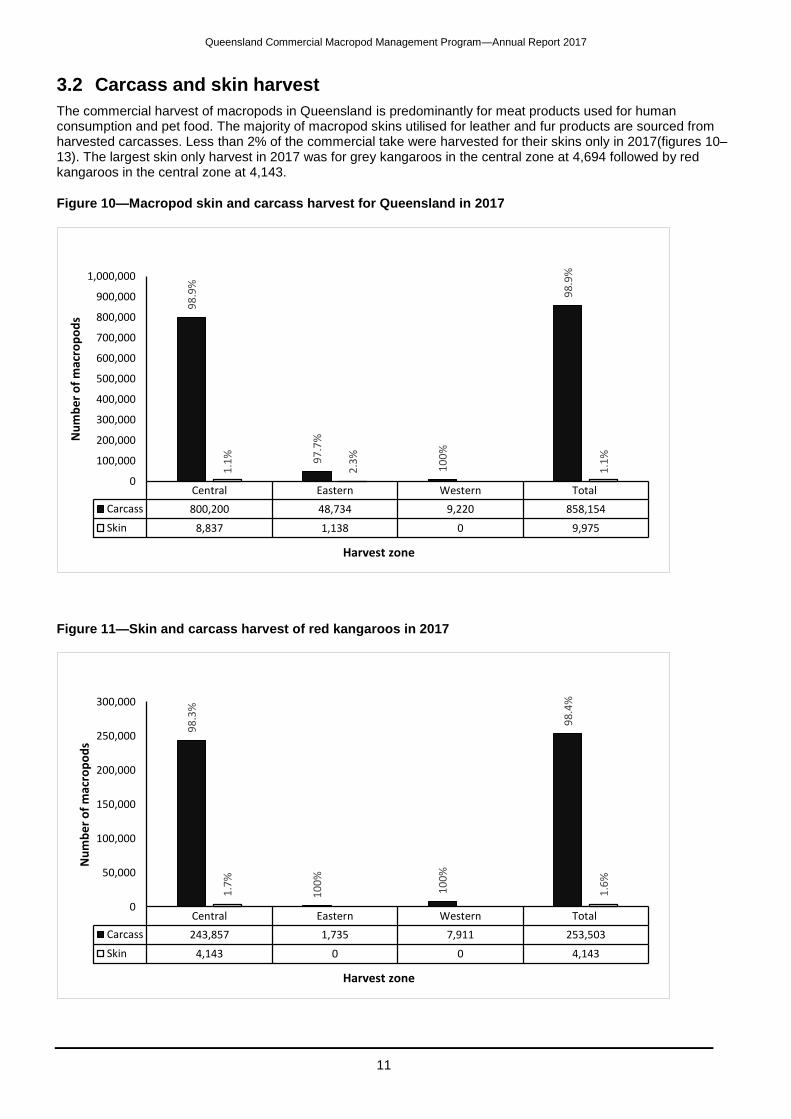
3.2 Carcass and skin harvest
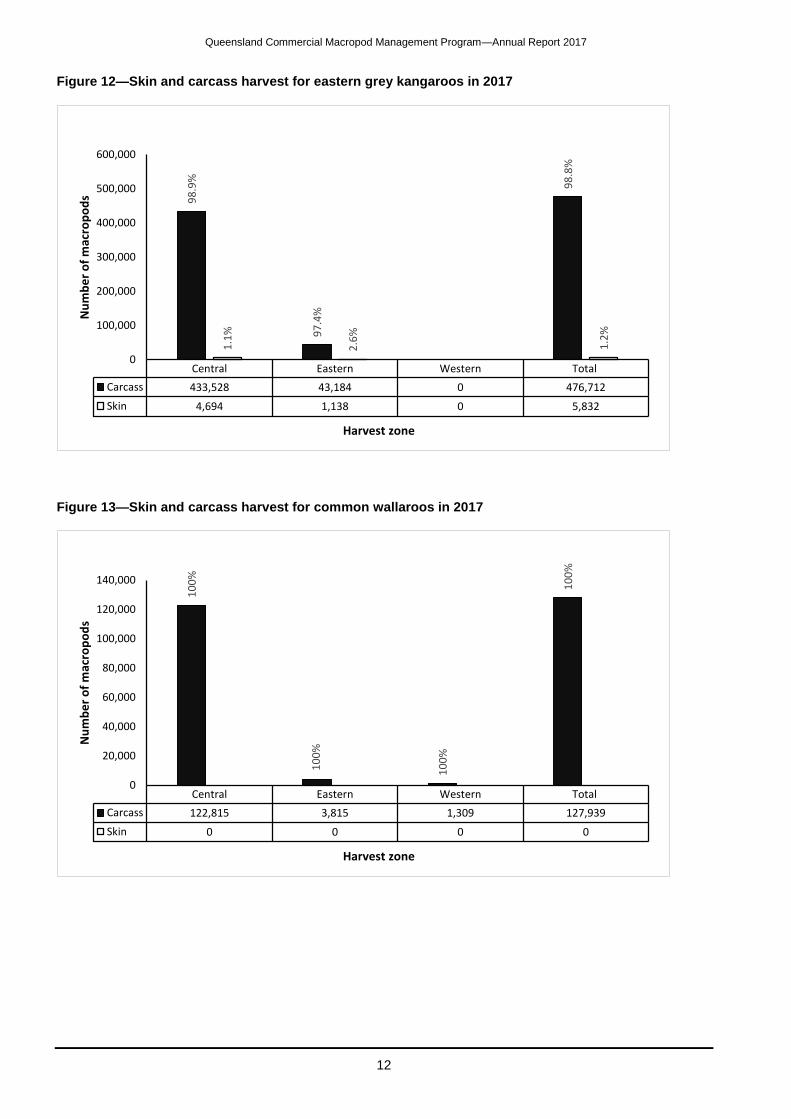
The commercial harvest of macropods in Queensland is predominantly for meat products used for human consumption and pet food. The majority of macropod skins utilised for leather and fur products are sourced from harvested carcasses. Less than 2% of the commercial take were harvested for their skins only in 2017(figures 10–13). The largest skin only harvest in 2017 was for grey kangaroos in the central zone at 4,694 followed by red kangaroos in the central zone at 4,143.
Figure 10—Macropod skin and carcass harvest for Queensland in 2017
Figure 11—Skin and carcass harvest of red kangaroos in 2017
Central Eastern Western Total
Carcass 800,200 48,734 9,220 858,154
Skin 8,837 1,138 0 9,975
98
.9%
97
.7%
10
0%
98
.9%
1.1
%
2.3
%
1.1
%
0
100,000
200,000
300,000
400,000
500,000
600,000
700,000
800,000
900,000
1,000,000
Nu
mb
er
of
mac
rop
od
s
Harvest zone
Central Eastern Western Total
Carcass 243,857 1,735 7,911 253,503
Skin 4,143 0 0 4,143
98
.3%
10
0%
10
0%
98
.4%
1.7
%
1.6
%
0
50,000
100,000
150,000
200,000
250,000
300,000
Nu
mb
er
of
mac
rop
od
s
Harvest zone
Queensland Commercial Macropod Management Program—Annual Report 2017
12
Figure 12—Skin and carcass harvest for eastern grey kangaroos in 2017
Figure 13—Skin and carcass harvest for common wallaroos in 2017
Central Eastern Western Total
Carcass 433,528 43,184 0 476,712
Skin 4,694 1,138 0 5,832
98
.9%
97
.4%
98
.8%
1.1
%
2.6
%
1.2
%
0
100,000
200,000
300,000
400,000
500,000
600,000
Nu
mb
er
of
mac
rop
od
s
Harvest zone
Central Eastern Western Total
Carcass 122,815 3,815 1,309 127,939
Skin 0 0 0 0
10
0%
10
0%
10
0%
10
0%
0
20,000
40,000
60,000
80,000
100,000
120,000
140,000
Nu
mb
er
of
mac
rop
od
s
Harvest zone
Queensland Commercial Macropod Management Program—Annual Report 2017
13
3.3 Average weight
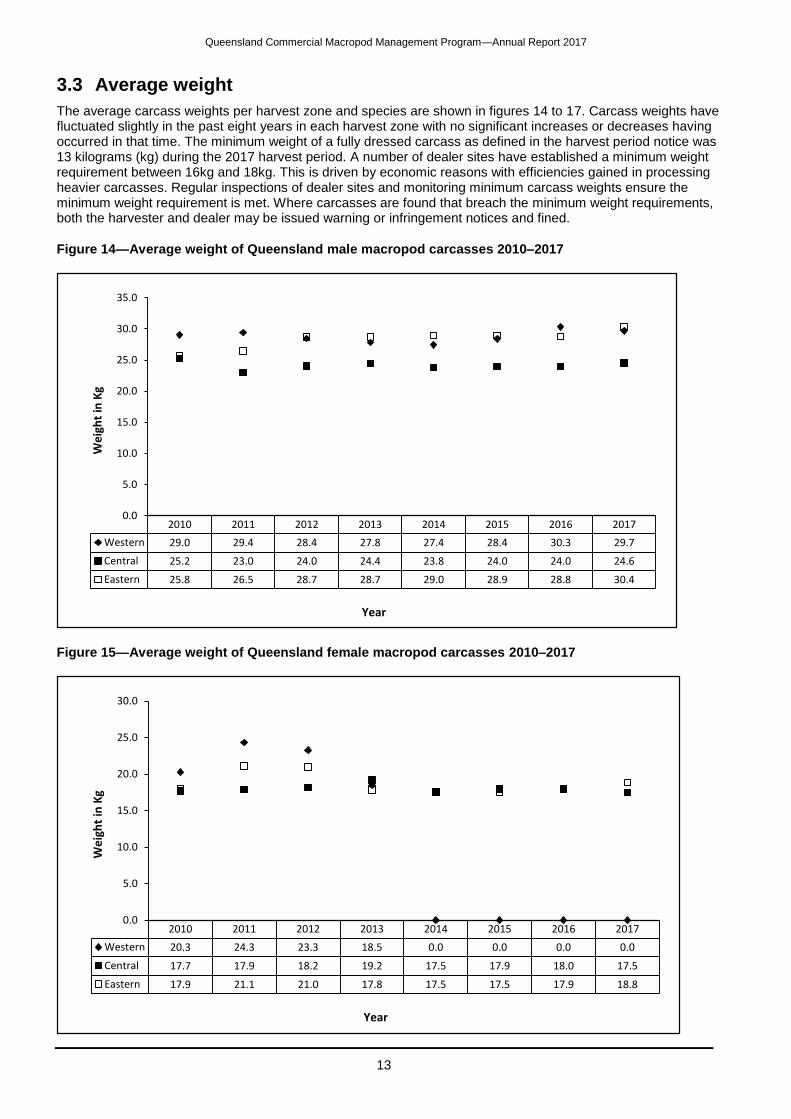
The average carcass weights per harvest zone and species are shown in figures 14 to 17. Carcass weights have fluctuated slightly in the past eight years in each harvest zone with no significant increases or decreases having occurred in that time. The minimum weight of a fully dressed carcass as defined in the harvest period notice was 13 kilograms (kg) during the 2017 harvest period. A number of dealer sites have established a minimum weight requirement between 16kg and 18kg. This is driven by economic reasons with efficiencies gained in processing heavier carcasses. Regular inspections of dealer sites and monitoring minimum carcass weights ensure the minimum weight requirement is met. Where carcasses are found that breach the minimum weight requirements, both the harvester and dealer may be issued warning or infringement notices and fined.
Figure 14—Average weight of Queensland male macropod carcasses 2010–2017
Figure 15—Average weight of Queensland female macropod carcasses 2010–2017
2010 2011 2012 2013 2014 2015 2016 2017
Western 29.0 29.4 28.4 27.8 27.4 28.4 30.3 29.7
Central 25.2 23.0 24.0 24.4 23.8 24.0 24.0 24.6
Eastern 25.8 26.5 28.7 28.7 29.0 28.9 28.8 30.4
0.0
5.0
10.0
15.0
20.0
25.0
30.0
35.0
We
igh
t in
Kg
Year
2010 2011 2012 2013 2014 2015 2016 2017
Western 20.3 24.3 23.3 18.5 0.0 0.0 0.0 0.0
Central 17.7 17.9 18.2 19.2 17.5 17.9 18.0 17.5
Eastern 17.9 21.1 21.0 17.8 17.5 17.5 17.9 18.8
0.0
5.0
10.0
15.0
20.0
25.0
30.0
We
igh
t in
Kg
Year
Queensland Commercial Macropod Management Program—Annual Report 2017
14
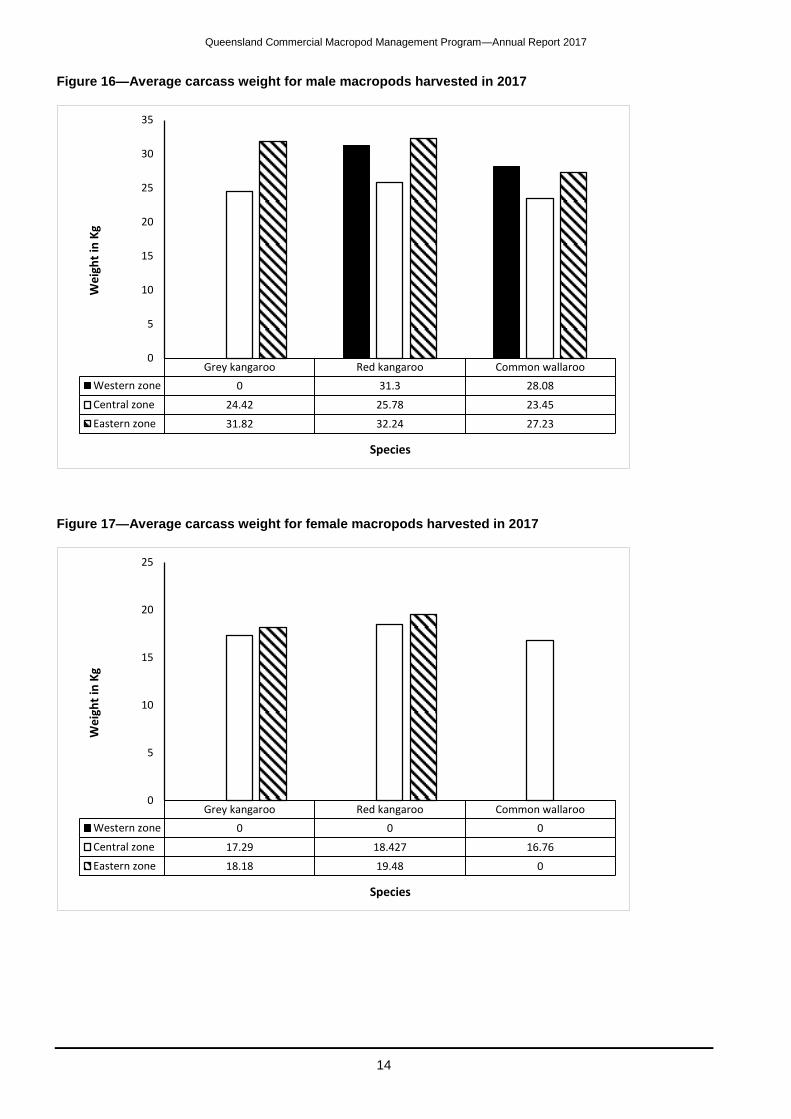
Figure 16—Average carcass weight for male macropods harvested in 2017
Figure 17—Average carcass weight for female macropods harvested in 2017
Grey kangaroo Red kangaroo Common wallaroo
Western zone 0 31.3 28.08
Central zone 24.42 25.78 23.45
Eastern zone 31.82 32.24 27.23
0
5
10
15
20
25
30
35
We
igh
t in
Kg
Species
Grey kangaroo Red kangaroo Common wallaroo
Western zone 0 0 0
Central zone 17.29 18.427 16.76
Eastern zone 18.18 19.48 0
0
5
10
15
20
25
We
igh
t in
Kg
Species
Queensland Commercial Macropod Management Program—Annual Report 2017
15
4. Special quotas A special quota can only be considered once the commercial harvest quota for a particular species has been reached in a harvest zone. Situations where a special quota may be considered include where there is a high macropod population density in a particular area or where adverse weather conditions such as prolonged drought are having a detrimental effect on macropod health. No special quotas were set in 2017.
5. The extent of non-commercial harvest mortality There are many forms of macropod mortality outside of the commercial harvest. It is possible for the department to collect and report data on two forms of non-commercial harvest mortality which can be considered when determining commercial quotas. These are damage mitigation permits (DMPs), and disease outbreak mortality.
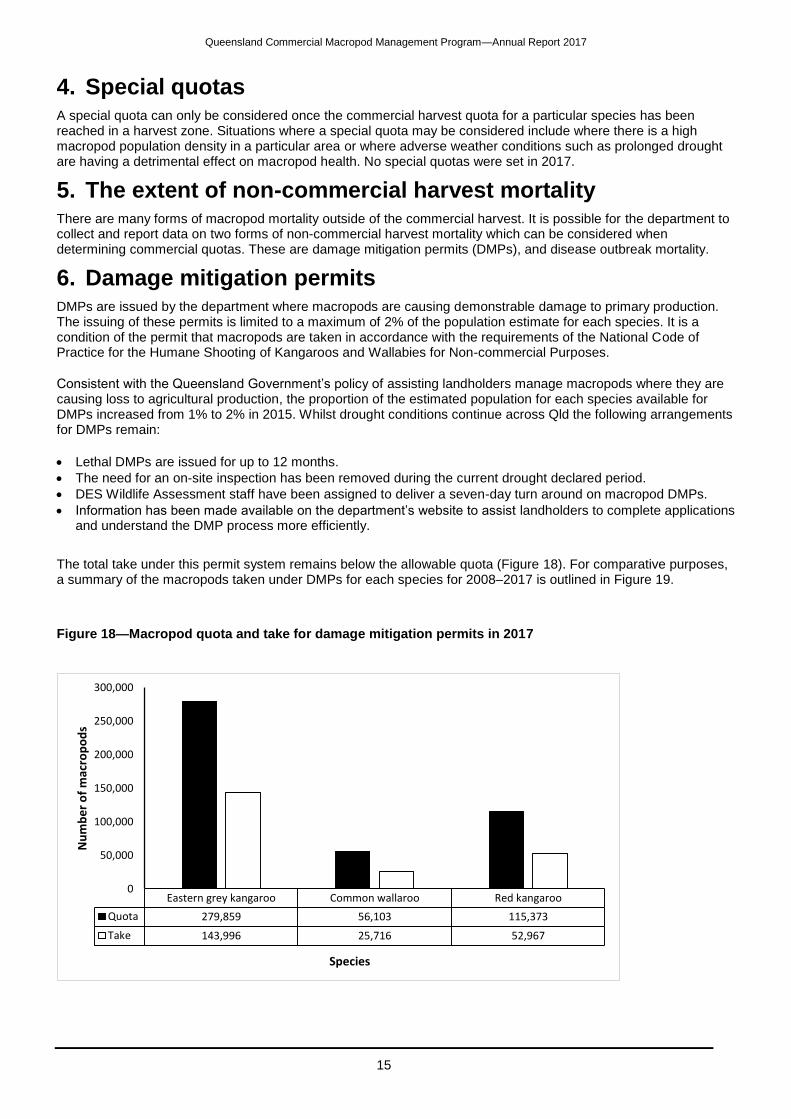
6. Damage mitigation permits DMPs are issued by the department where macropods are causing demonstrable damage to primary production. The issuing of these permits is limited to a maximum of 2% of the population estimate for each species. It is a condition of the permit that macropods are taken in accordance with the requirements of the National Code of Practice for the Humane Shooting of Kangaroos and Wallabies for Non-commercial Purposes.
Consistent with the Queensland Government’s policy of assisting landholders manage macropods where they are causing loss to agricultural production, the proportion of the estimated population for each species available for DMPs increased from 1% to 2% in 2015. Whilst drought conditions continue across Qld the following arrangements for DMPs remain:
Lethal DMPs are issued for up to 12 months.
The need for an on-site inspection has been removed during the current drought declared period.
DES Wildlife Assessment staff have been assigned to deliver a seven-day turn around on macropod DMPs.
Information has been made available on the department’s website to assist landholders to complete applications and understand the DMP process more efficiently.
The total take under this permit system remains below the allowable quota (Figure 18). For comparative purposes, a summary of the macropods taken under DMPs for each species for 2008–2017 is outlined in Figure 19.
Figure 18—Macropod quota and take for damage mitigation permits in 2017
Eastern grey kangaroo Common wallaroo Red kangaroo
Quota 279,859 56,103 115,373
Take 143,996 25,716 52,967
0
50,000
100,000
150,000
200,000
250,000
300,000
Nu
mb
er
of
mac
rop
od
s
Species
Queensland Commercial Macropod Management Program—Annual Report 2017
16
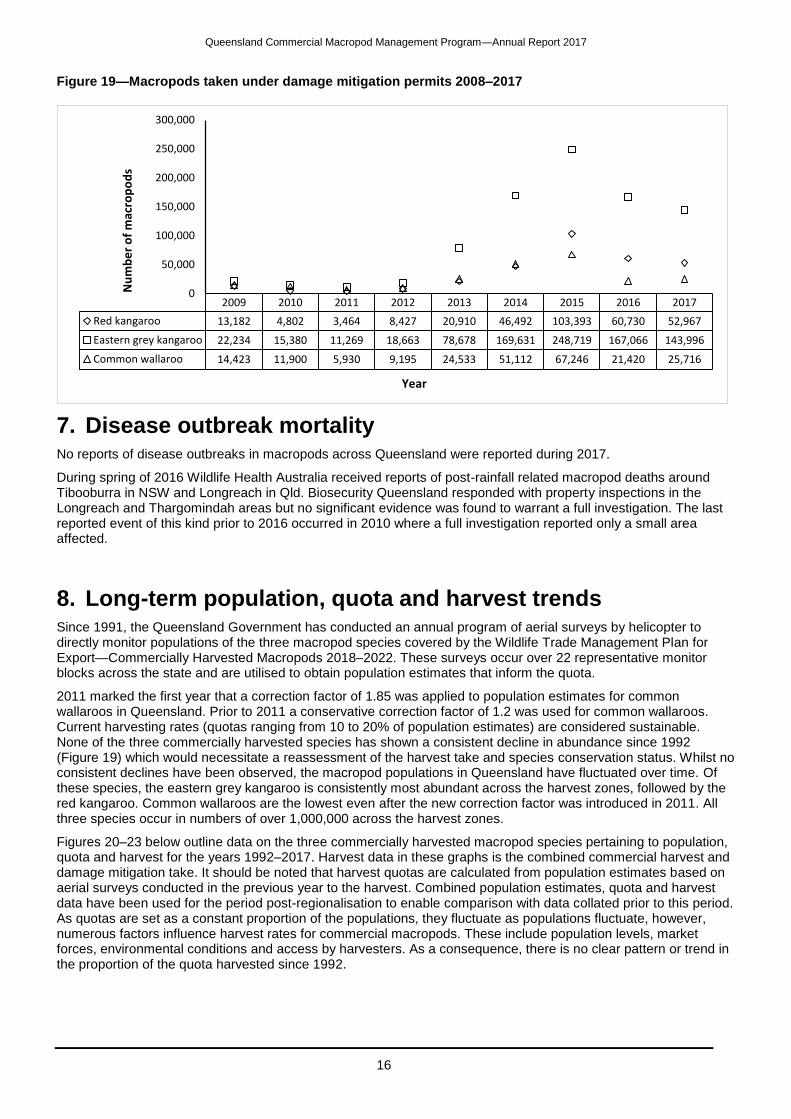
Figure 19—Macropods taken under damage mitigation permits 2008–2017
7. Disease outbreak mortality No reports of disease outbreaks in macropods across Queensland were reported during 2017.
During spring of 2016 Wildlife Health Australia received reports of post-rainfall related macropod deaths around Tibooburra in NSW and Longreach in Qld. Biosecurity Queensland responded with property inspections in the Longreach and Thargomindah areas but no significant evidence was found to warrant a full investigation. The last reported event of this kind prior to 2016 occurred in 2010 where a full investigation reported only a small area affected.
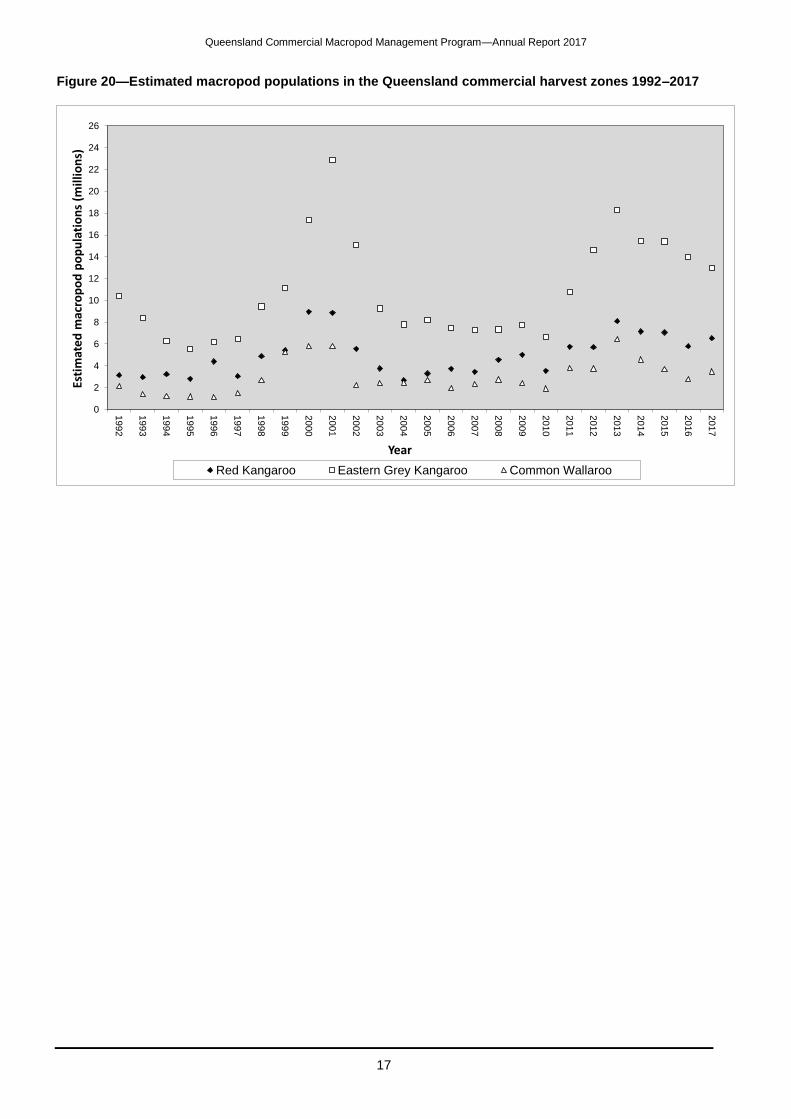
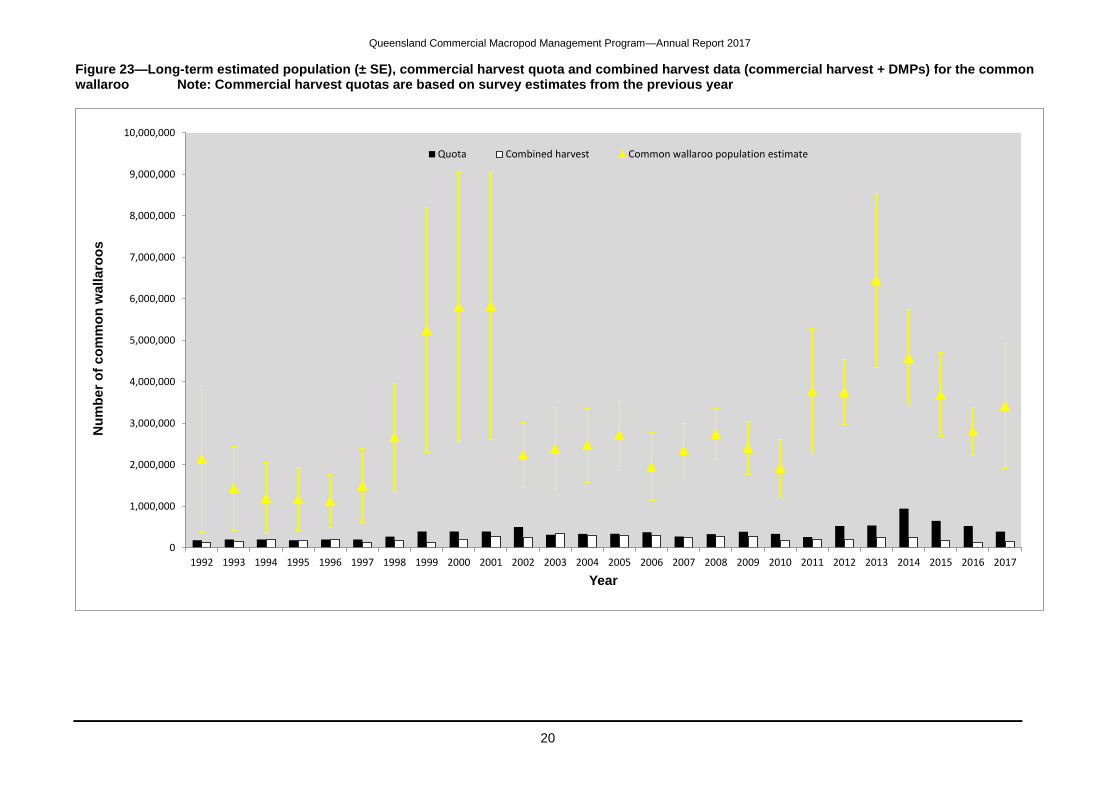
8. Long-term population, quota and harvest trends Since 1991, the Queensland Government has conducted an annual program of aerial surveys by helicopter to directly monitor populations of the three macropod species covered by the Wildlife Trade Management Plan for Export—Commercially Harvested Macropods 2018–2022. These surveys occur over 22 representative monitor blocks across the state and are utilised to obtain population estimates that inform the quota.
2011 marked the first year that a correction factor of 1.85 was applied to population estimates for common wallaroos in Queensland. Prior to 2011 a conservative correction factor of 1.2 was used for common wallaroos. Current harvesting rates (quotas ranging from 10 to 20% of population estimates) are considered sustainable. None of the three commercially harvested species has shown a consistent decline in abundance since 1992 (Figure 19) which would necessitate a reassessment of the harvest take and species conservation status. Whilst no consistent declines have been observed, the macropod populations in Queensland have fluctuated over time. Of these species, the eastern grey kangaroo is consistently most abundant across the harvest zones, followed by the red kangaroo. Common wallaroos are the lowest even after the new correction factor was introduced in 2011. All three species occur in numbers of over 1,000,000 across the harvest zones.
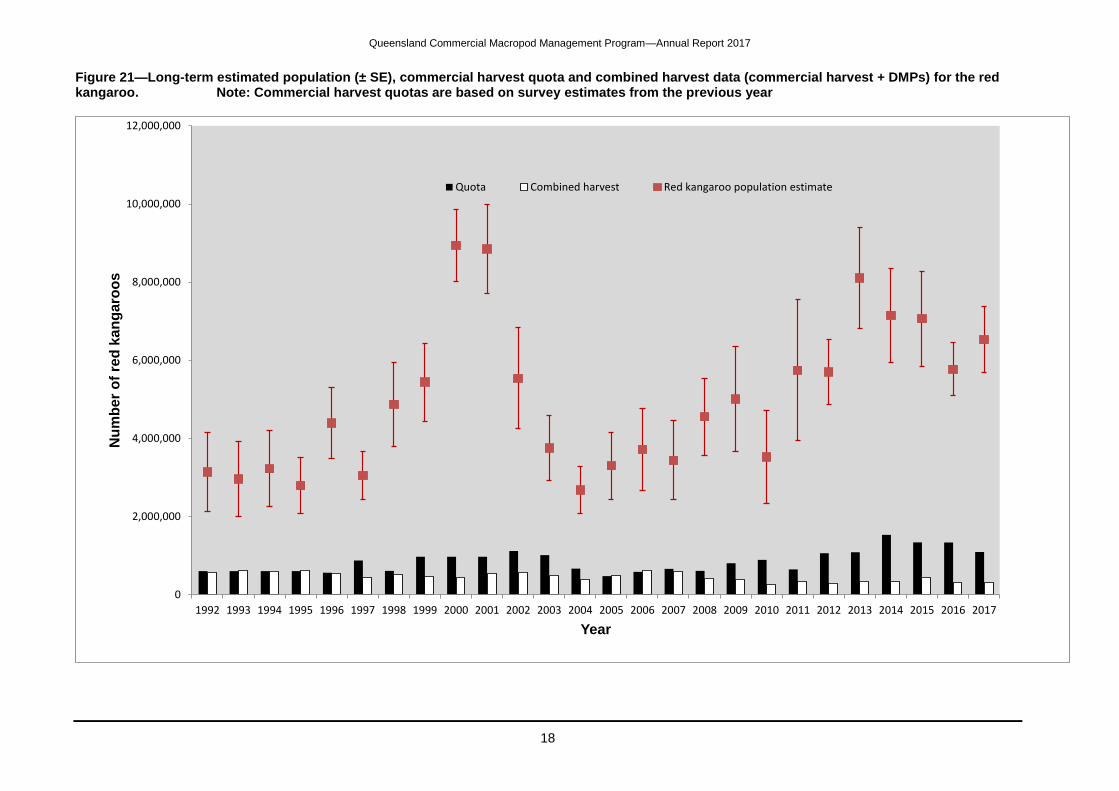
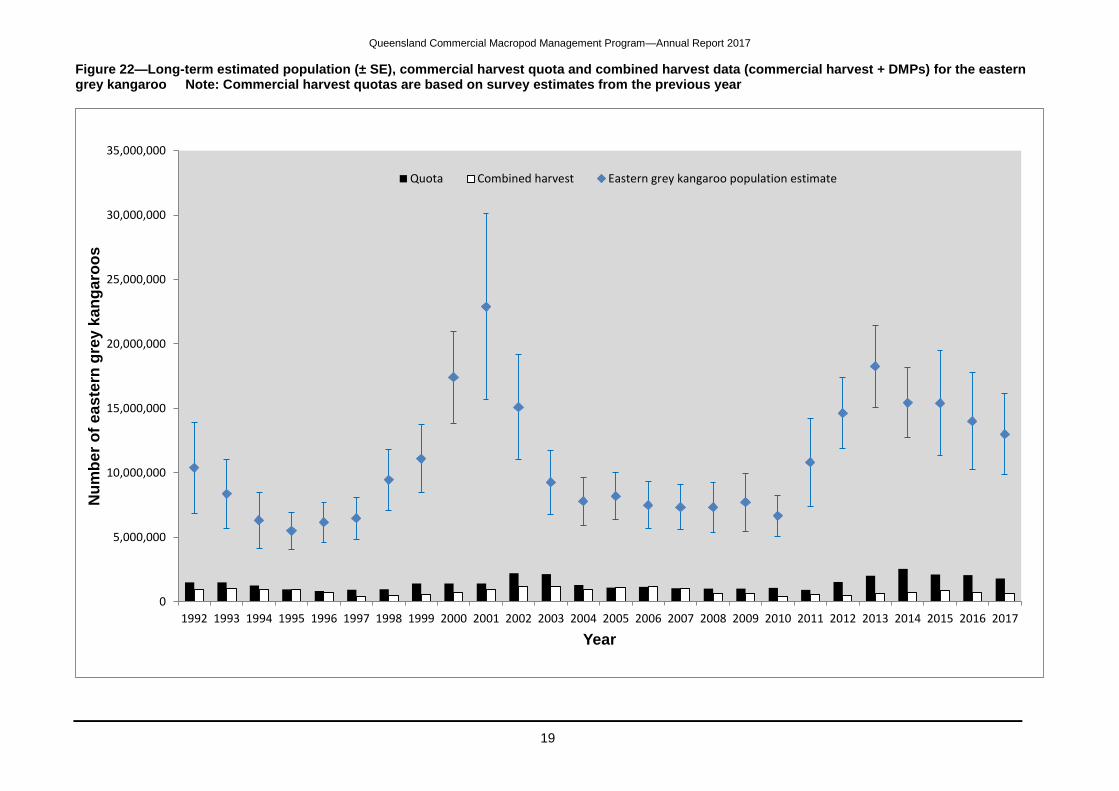
Figures 20–23 below outline data on the three commercially harvested macropod species pertaining to population, quota and harvest for the years 1992–2017. Harvest data in these graphs is the combined commercial harvest and damage mitigation take. It should be noted that harvest quotas are calculated from population estimates based on aerial surveys conducted in the previous year to the harvest. Combined population estimates, quota and harvest data have been used for the period post-regionalisation to enable comparison with data collated prior to this period. As quotas are set as a constant proportion of the populations, they fluctuate as populations fluctuate, however, numerous factors influence harvest rates for commercial macropods. These include population levels, market forces, environmental conditions and access by harvesters. As a consequence, there is no clear pattern or trend in the proportion of the quota harvested since 1992.
2009 2010 2011 2012 2013 2014 2015 2016 2017
Red kangaroo 13,182 4,802 3,464 8,427 20,910 46,492 103,393 60,730 52,967
Eastern grey kangaroo 22,234 15,380 11,269 18,663 78,678 169,631 248,719 167,066 143,996
Common wallaroo 14,423 11,900 5,930 9,195 24,533 51,112 67,246 21,420 25,716
0
50,000
100,000
150,000
200,000
250,000
300,000N
um
be
r o
f m
acro
po
ds
Year
Queensland Commercial Macropod Management Program—Annual Report 2017
17
Figure 20—Estimated macropod populations in the Queensland commercial harvest zones 1992–2017
0
2
4
6
8
10
12
14
16
18
20
22
24
26
19
92
19
93
19
94
19
95
19
96
19
97
19
98
19
99
20
00
20
01
20
02
20
03
20
04
20
05
20
06
20
07
20
08
20
09
20
10
20
11
20
12
20
13
20
14
20
15
20
16
20
17
Esti
mat
ed m
acro
po
d p
op
ula
tio
ns
(mill
ion
s)
Year
Red Kangaroo Eastern Grey Kangaroo Common Wallaroo
Queensland Commercial Macropod Management Program—Annual Report 2017
18
Figure 21—Long-term estimated population (± SE), commercial harvest quota and combined harvest data (commercial harvest + DMPs) for the red kangaroo. Note: Commercial harvest quotas are based on survey estimates from the previous year
0
2,000,000
4,000,000
6,000,000
8,000,000
10,000,000
12,000,000
1992 1993 1994 1995 1996 1997 1998 1999 2000 2001 2002 2003 2004 2005 2006 2007 2008 2009 2010 2011 2012 2013 2014 2015 2016 2017
Nu
mb
er
of
red
ka
ng
aro
os
Year
Quota Combined harvest Red kangaroo population estimate
Queensland Commercial Macropod Management Program—Annual Report 2017
19
Figure 22—Long-term estimated population (± SE), commercial harvest quota and combined harvest data (commercial harvest + DMPs) for the eastern grey kangaroo Note: Commercial harvest quotas are based on survey estimates from the previous year
0
5,000,000
10,000,000
15,000,000
20,000,000
25,000,000
30,000,000
35,000,000
1992 1993 1994 1995 1996 1997 1998 1999 2000 2001 2002 2003 2004 2005 2006 2007 2008 2009 2010 2011 2012 2013 2014 2015 2016 2017
Nu
mb
er
of
ea
ste
rn g
rey k
an
garo
os
Year
Quota Combined harvest Eastern grey kangaroo population estimate
Queensland Commercial Macropod Management Program—Annual Report 2017
20
Figure 23—Long-term estimated population (± SE), commercial harvest quota and combined harvest data (commercial harvest + DMPs) for the common wallaroo Note: Commercial harvest quotas are based on survey estimates from the previous year
0
1,000,000
2,000,000
3,000,000
4,000,000
5,000,000
6,000,000
7,000,000
8,000,000
9,000,000
10,000,000
1992 1993 1994 1995 1996 1997 1998 1999 2000 2001 2002 2003 2004 2005 2006 2007 2008 2009 2010 2011 2012 2013 2014 2015 2016 2017
Nu
mb
er
of
co
mm
on
wa
lla
roo
s
Year
Quota Combined harvest Common wallaroo population estimate
Queensland Commercial Macropod Management Program—Annual Report 2017
21
9. Compliance During the 2017 harvest period, inspections of dealer sites, processor sites and harvesters were completed state wide. Overall compliance was considered good. Inspections were targeted towards higher risk sites.
The commercial harvest of macropods in Queensland requires compliance, investigation and enforcement resources. Compliance activities are conducted both infield and through desktop auditing. There are two compliance officers authorised under the Nature Conservation Act 1992 within the Macropod Management Unit. The majority of commercial macropod harvest field compliance activities are undertaken by these officers; however the department undertakes collaborative compliance work with wildlife rangers, the Queensland Police Service, and Safe Food Production Queensland (SFPQ).
Other compliance activities are conducted by the macropod management unit including licence audits, harvest return analysis and entry, report compilation and licence application assessment. Licensees are assessed at time of application against suitability criteria. These include accrual of 10 or more demerit points, convictions against the Nature Conservation Act 1992 or any other matters relevant to the person’s ability to carry out the activities authorised by the licence in a competent and ethical way.
Compliance priorities for the 2017 harvest period were:
Harvesters hold the appropriate licence.
Ensure macropods are correctly tagged with a valid 2017 harvest period tag.
Ensure macropods are tagged with the correct species/zone tag.
Ensure non-head-shot macropods are not traded.
Ensure compliance with the National Code of Practise for the Humane Shooting of Kangaroos and Wallabies for Commercial Purposes 2008.
Ensure harvesters produce/carry valid written landholder consent as per licence conditions.
Ensure timely, complete and accurate harvest returns from dealers.
The integrity of a quota relies upon the premise that tags are not reused or applied to the wrong species or used in the wrong harvest zone. To objectively and adequately demonstrate effective compliance levels, an inspection target of 1% of the overall harvest; with 10% of the sample inspected at a detailed level has been established.
9.1 Inspections
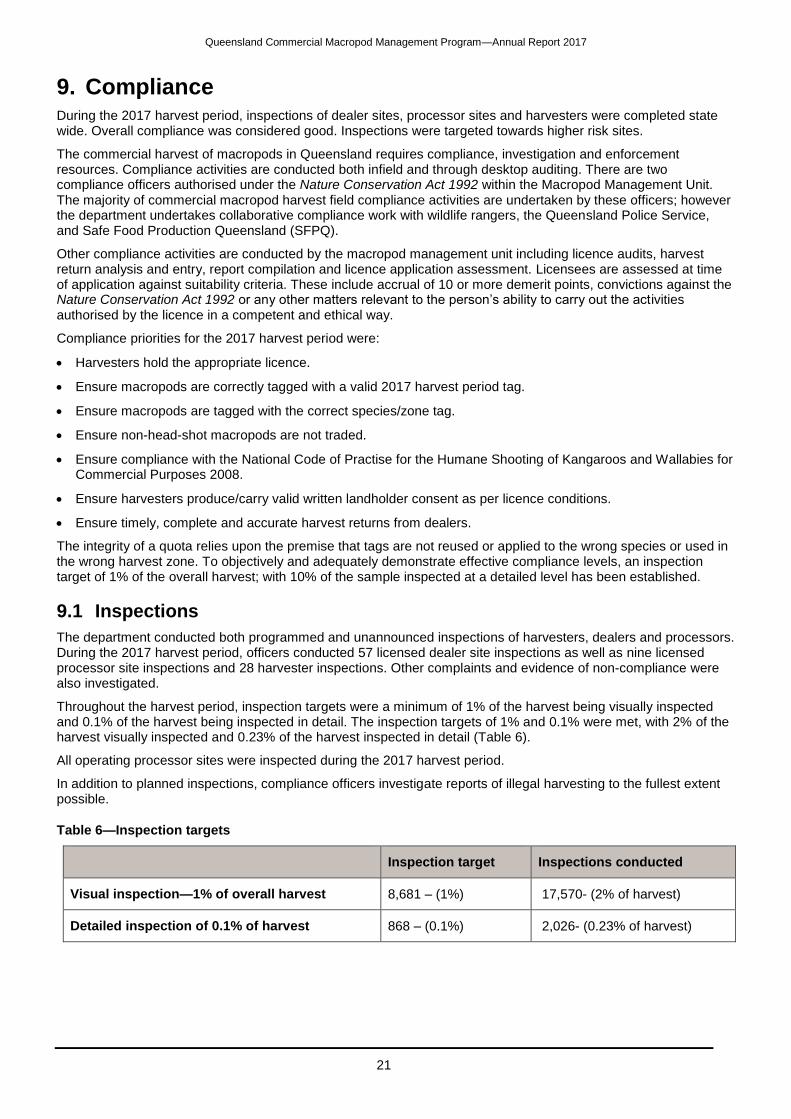
The department conducted both programmed and unannounced inspections of harvesters, dealers and processors. During the 2017 harvest period, officers conducted 57 licensed dealer site inspections as well as nine licensed processor site inspections and 28 harvester inspections. Other complaints and evidence of non-compliance were also investigated.
Throughout the harvest period, inspection targets were a minimum of 1% of the harvest being visually inspected and 0.1% of the harvest being inspected in detail. The inspection targets of 1% and 0.1% were met, with 2% of the harvest visually inspected and 0.23% of the harvest inspected in detail (Table 6).
All operating processor sites were inspected during the 2017 harvest period.
In addition to planned inspections, compliance officers investigate reports of illegal harvesting to the fullest extent possible.
Table 6—Inspection targets
Inspection target Inspections conducted
Visual inspection—1% of overall harvest 8,681 – (1%) 17,570- (2% of harvest)
Detailed inspection of 0.1% of harvest 868 – (0.1%) 2,026- (0.23% of harvest)
Queensland Commercial Macropod Management Program—Annual Report 2017
22
9.2 Compliance and enforcement measures
Breaches of legislation are subject to enforcement action such as warning notices, fines, licence cancellation and prosecution.
Enforcement action is taken in accordance with the department’s enforcement guidelines. Written warnings or infringement notices are given at the discretion of compliance officers, in accordance with the department’s enforcement guidelines and in consultation with the Manager. Decisions on possible prosecutions involve consultation with the Manager and department’s litigation division.
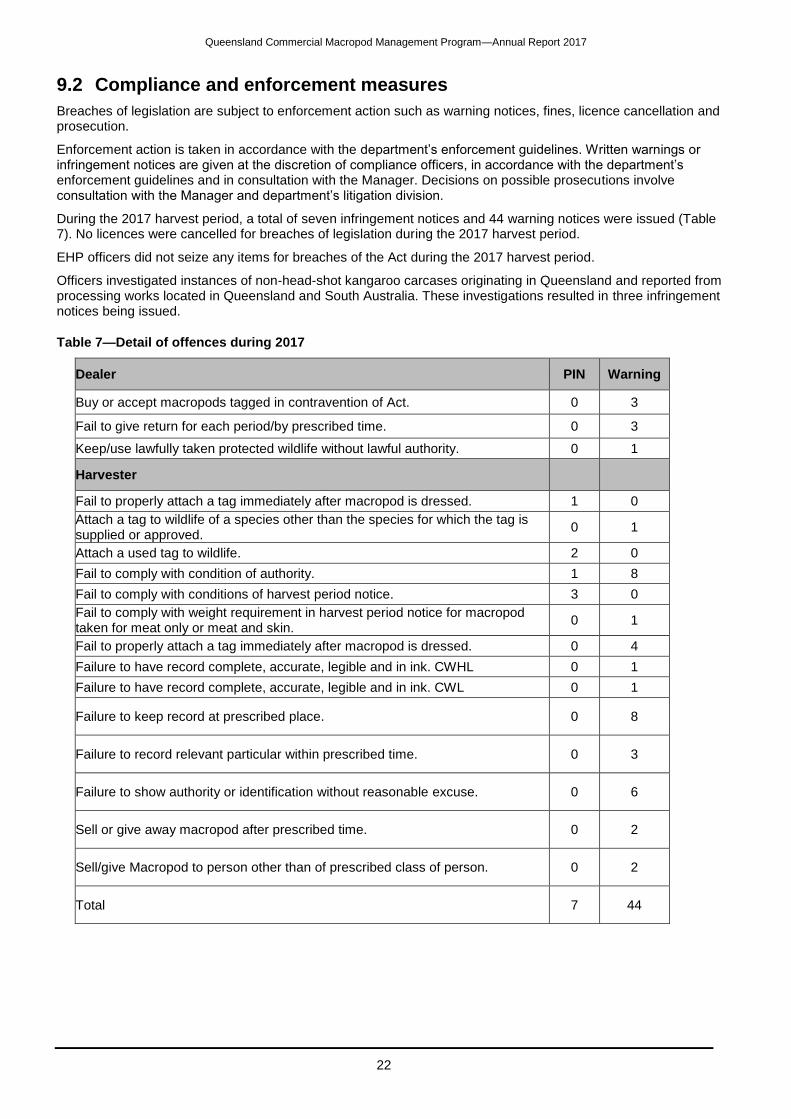
During the 2017 harvest period, a total of seven infringement notices and 44 warning notices were issued (Table 7). No licences were cancelled for breaches of legislation during the 2017 harvest period.
EHP officers did not seize any items for breaches of the Act during the 2017 harvest period.
Officers investigated instances of non-head-shot kangaroo carcases originating in Queensland and reported from processing works located in Queensland and South Australia. These investigations resulted in three infringement notices being issued.
Table 7—Detail of offences during 2017
Dealer PIN Warning
Buy or accept macropods tagged in contravention of Act. 0 3
Fail to give return for each period/by prescribed time. 0 3
Keep/use lawfully taken protected wildlife without lawful authority. 0 1
Harvester
Fail to properly attach a tag immediately after macropod is dressed. 1 0
Attach a tag to wildlife of a species other than the species for which the tag is supplied or approved.
0 1
Attach a used tag to wildlife. 2 0
Fail to comply with condition of authority. 1 8
Fail to comply with conditions of harvest period notice. 3 0
Fail to comply with weight requirement in harvest period notice for macropod taken for meat only or meat and skin.
0 1
Fail to properly attach a tag immediately after macropod is dressed. 0 4
Failure to have record complete, accurate, legible and in ink. CWHL 0 1
Failure to have record complete, accurate, legible and in ink. CWL 0 1
Failure to keep record at prescribed place. 0 8
Failure to record relevant particular within prescribed time. 0 3
Failure to show authority or identification without reasonable excuse. 0 6
Sell or give away macropod after prescribed time. 0 2
Sell/give Macropod to person other than of prescribed class of person. 0 2
Total 7 44
Queensland Commercial Macropod Management Program—Annual Report 2017
23
10. Unusual circumstances 2017 was the warmest year on record for Queensland with many areas of the harvest zones recording the highest mean temperatures. Minimum temperatures through winter were also the highest on record for many areas. Although widespread rain across the harvest area in 2016 brought reprieve to the previous years of drought extremely dry conditions returned during 2017. Below average rainfall was recorded for most of central and western parts of the state. The majority of the macropod harvest zones remained drought declared throughout most of 2017.
11. Research and experiments The Macropod management unit facilitated and assisted a joint research project undertaken with Biosecurity Queensland. The project compared the efficacy of a commercial drone based wildlife survey with the established helicopter surveys conducted by the macropod unit. The results of this research will be submitted for publication in a peer reviewed journal during 2018. The unit also trialled imaging hardware for the automated counting of macropods in collaboration with the CSIRO. This work will continue during 2018.
During 2017 the macropod management unit continued assisting the Kangaroo Industry Association of Australia assess the RooSafe mobile web application. This research is ongoing and is also expected to be completed in 2018.
The department continues to respond to requests for data from researchers and other stakeholders as they arise.
12. Program improvements During 2017, the department implemented a new web based licencing system across all business units called Connect. This project delivers a licencing database with online capabilities for customers. Whilst a paper based system of applying for licences and tags is still available over 200 macropod management unit clients created Connect accounts during the second half of 2017.
The Nature Conservation (Macropod) Conservation Plan 2017 commenced 1 September 2017 replacing the Nature Conservation (Macropod) Conservation Plan 2005. Whilst there was no change to overall policy both structural and administrative changes were made to improve regulating the harvest of macropods in Queensland.
Structural changes designed to streamline the Macropod Conservation Plan and remove regulatory duplication, primarily:
o combining the ‘Commercial wildlife harvesting licence’ and ‘Recreational wildlife harvesting licence’ into a renamed ‘Macropod harvesting licence’; and
o removing the ‘Commercial wildlife licence (mobile)’ for dead macropods as there had been no requirement for this licence by the harvest industry;
Administrative changes to improve the regulation of the harvest included: o Applicants must be 18+ and hold firearms licence to apply for harvesting licence o Only licensee is permitted to kill joeys, relevant person no longer permitted o Relevant person is no longer permitted to transport carcases/skins to dealer site. Only the licensee
is permitted. o Harvesters are able to sell until midday the day after the HP ends or other time if specified in the HP
notice.
Full details of the new plan can be found at:
https://www.qld.gov.au/environment/plants-animals/wildlife-permits/macropods-fees
Queensland Commercial Macropod Management Program—Annual Report 2017
24
13. References Anon. 2011. Wildlife Trade Management Plan for Export – Commercially Harvested Macropods – 2012–2017. Queensland Parks and Wildlife Service; Brisbane.
Anon. 2017. Wildlife Trade Management Plan for Export – Commercially Harvested Macropods – 2018–2022. Queensland Parks and Wildlife Service; Brisbane.
Caughley, G., Shepard, N. and G. Short. 1987. Kangaroos, their ecology and management in the sheep rangelands of Australia. Cambridge University Press; Cambridge.
Clancy, T.F., Pople, A.R., and L.A. Gibson. 1997. Comparison of helicopter line transects with walked line transects for estimating densities of kangaroos. Wildlife Research 24: 397–409.
Hacker, R, McLeod, S., Druhan, J., Tenhumberg, B. and U. Pradhan. 2002. Managing Kangaroos in the Murray-Darling Basin. Technical Report to the Murray-Darling Basin Commission; Canberra.
Pople, A.R. 2006. Modelling the spatial and temporal dynamics of kangaroo populations for harvest management. Final report to the Department of Environment and Heritage; Canberra.
Pople, A.R. and G.C. Grigg. 1999. Commercial harvesting of Kangaroos in Australia. Report to Environment Australia.
Queensland Commercial Macropod Management Program—Annual Report 2017
25
Appendix 1
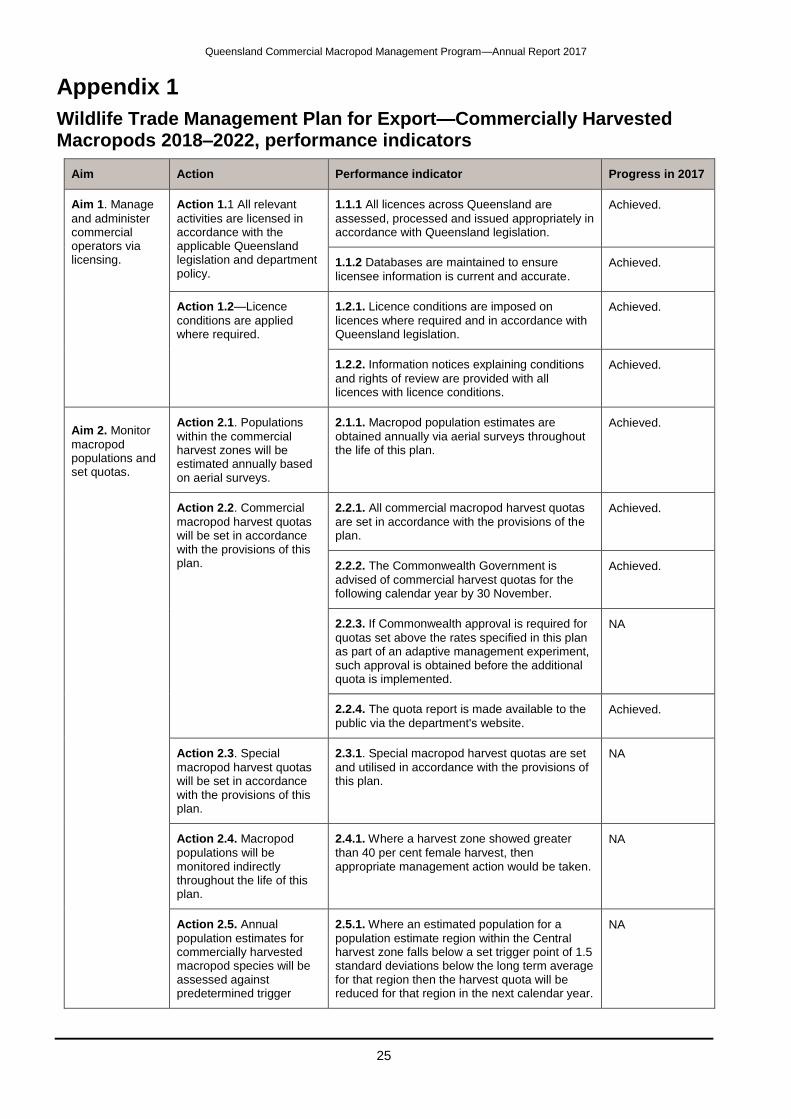
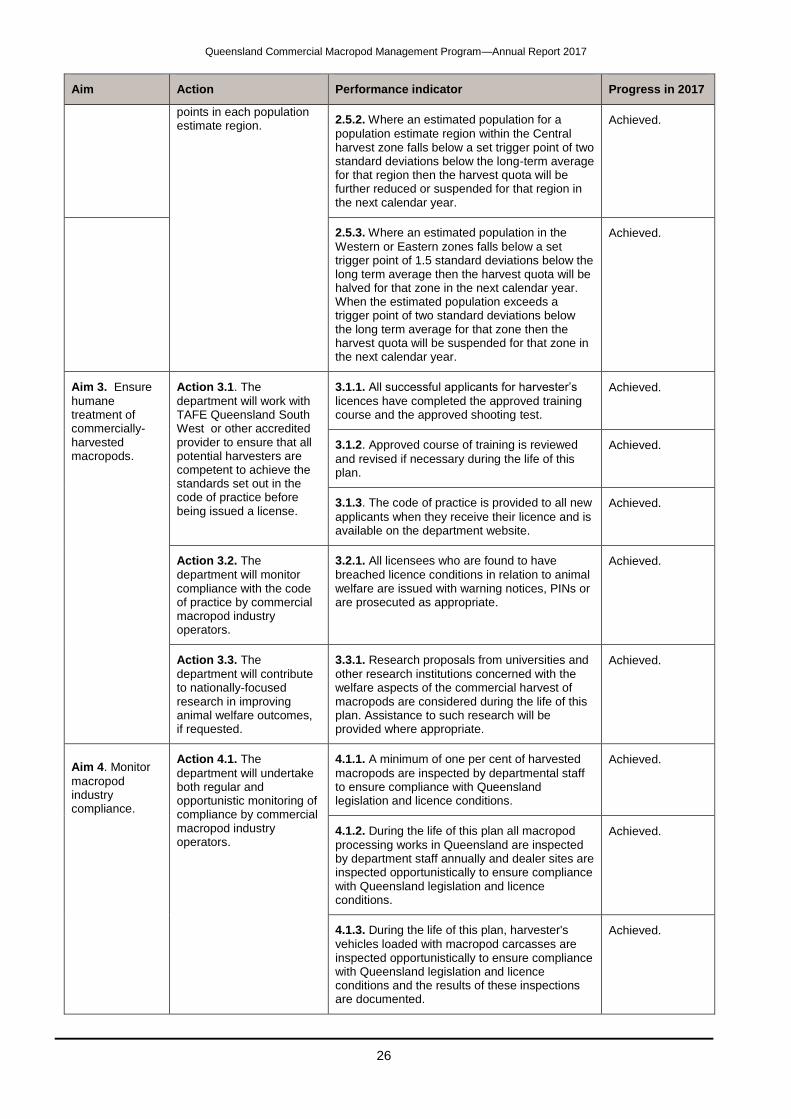
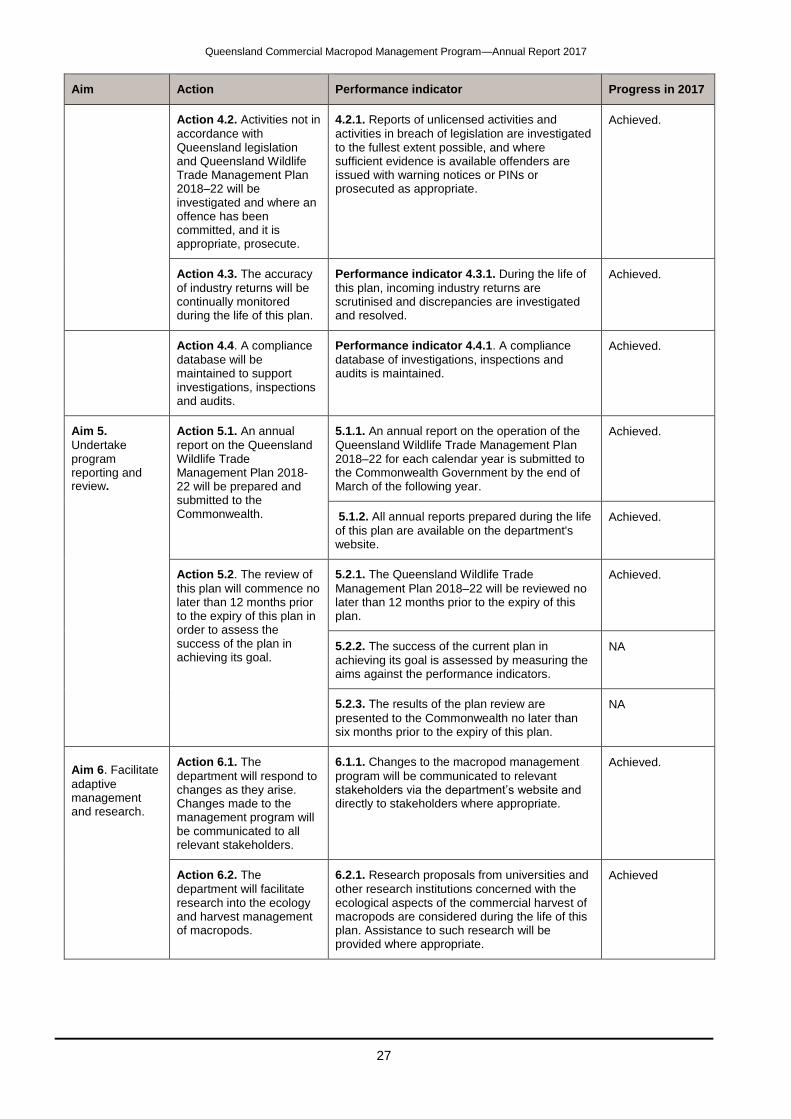
Wildlife Trade Management Plan for Export—Commercially Harvested Macropods 2018–2022, performance indicators
Aim Action Performance indicator Progress in 2017
Aim 1. Manage
and administer commercial operators via licensing.
Action 1.1 All relevant
activities are licensed in accordance with the applicable Queensland legislation and department policy.
1.1.1 All licences across Queensland are
assessed, processed and issued appropriately in accordance with Queensland legislation.
Achieved.
1.1.2 Databases are maintained to ensure
licensee information is current and accurate. Achieved.
Action 1.2—Licence
conditions are applied where required.
1.2.1. Licence conditions are imposed on
licences where required and in accordance with Queensland legislation.
Achieved.
1.2.2. Information notices explaining conditions
and rights of review are provided with all licences with licence conditions.
Achieved.
Aim 2. Monitor
macropod populations and set quotas.
Action 2.1. Populations
within the commercial harvest zones will be estimated annually based on aerial surveys.
2.1.1. Macropod population estimates are
obtained annually via aerial surveys throughout the life of this plan.
Achieved.
Action 2.2. Commercial
macropod harvest quotas will be set in accordance with the provisions of this plan.
2.2.1. All commercial macropod harvest quotas
are set in accordance with the provisions of the plan.
Achieved.
2.2.2. The Commonwealth Government is
advised of commercial harvest quotas for the following calendar year by 30 November.
Achieved.
2.2.3. If Commonwealth approval is required for
quotas set above the rates specified in this plan as part of an adaptive management experiment, such approval is obtained before the additional quota is implemented.
NA
2.2.4. The quota report is made available to the
public via the department's website. Achieved.
Action 2.3. Special
macropod harvest quotas will be set in accordance with the provisions of this plan.
2.3.1. Special macropod harvest quotas are set
and utilised in accordance with the provisions of this plan.
NA
Action 2.4. Macropod
populations will be monitored indirectly throughout the life of this plan.
2.4.1. Where a harvest zone showed greater
than 40 per cent female harvest, then appropriate management action would be taken.
NA
Action 2.5. Annual
population estimates for commercially harvested macropod species will be assessed against predetermined trigger
2.5.1. Where an estimated population for a
population estimate region within the Central harvest zone falls below a set trigger point of 1.5 standard deviations below the long term average for that region then the harvest quota will be reduced for that region in the next calendar year.
NA
Queensland Commercial Macropod Management Program—Annual Report 2017
26
Aim Action Performance indicator Progress in 2017
points in each population estimate region.
2.5.2. Where an estimated population for a
population estimate region within the Central harvest zone falls below a set trigger point of two standard deviations below the long-term average for that region then the harvest quota will be further reduced or suspended for that region in the next calendar year.
Achieved.
2.5.3. Where an estimated population in the
Western or Eastern zones falls below a set trigger point of 1.5 standard deviations below the long term average then the harvest quota will be halved for that zone in the next calendar year. When the estimated population exceeds a trigger point of two standard deviations below the long term average for that zone then the harvest quota will be suspended for that zone in the next calendar year.
Achieved.
Aim 3. Ensure
humane treatment of commercially-harvested macropods.
Action 3.1. The
department will work with TAFE Queensland South West or other accredited provider to ensure that all potential harvesters are competent to achieve the standards set out in the code of practice before being issued a license.
3.1.1. All successful applicants for harvester’s
licences have completed the approved training course and the approved shooting test.
Achieved.
3.1.2. Approved course of training is reviewed
and revised if necessary during the life of this plan.
Achieved.
3.1.3. The code of practice is provided to all new
applicants when they receive their licence and is available on the department website.
Achieved.
Action 3.2. The
department will monitor compliance with the code of practice by commercial macropod industry operators.
3.2.1. All licensees who are found to have
breached licence conditions in relation to animal welfare are issued with warning notices, PINs or are prosecuted as appropriate.
Achieved.
Action 3.3. The
department will contribute to nationally-focused research in improving animal welfare outcomes, if requested.
3.3.1. Research proposals from universities and
other research institutions concerned with the welfare aspects of the commercial harvest of macropods are considered during the life of this plan. Assistance to such research will be provided where appropriate.
Achieved.
Aim 4. Monitor
macropod industry compliance.
Action 4.1. The
department will undertake both regular and opportunistic monitoring of compliance by commercial macropod industry operators.
4.1.1. A minimum of one per cent of harvested
macropods are inspected by departmental staff to ensure compliance with Queensland legislation and licence conditions.
Achieved.
4.1.2. During the life of this plan all macropod
processing works in Queensland are inspected by department staff annually and dealer sites are inspected opportunistically to ensure compliance with Queensland legislation and licence conditions.
Achieved.
4.1.3. During the life of this plan, harvester's
vehicles loaded with macropod carcasses are inspected opportunistically to ensure compliance with Queensland legislation and licence conditions and the results of these inspections are documented.
Achieved.
Queensland Commercial Macropod Management Program—Annual Report 2017
27
Aim Action Performance indicator Progress in 2017
Action 4.2. Activities not in
accordance with Queensland legislation and Queensland Wildlife Trade Management Plan 2018–22 will be investigated and where an offence has been committed, and it is appropriate, prosecute.
4.2.1. Reports of unlicensed activities and
activities in breach of legislation are investigated to the fullest extent possible, and where sufficient evidence is available offenders are issued with warning notices or PINs or prosecuted as appropriate.
Achieved.
Action 4.3. The accuracy
of industry returns will be continually monitored during the life of this plan.
Performance indicator 4.3.1. During the life of
this plan, incoming industry returns are scrutinised and discrepancies are investigated and resolved.
Achieved.
Action 4.4. A compliance
database will be maintained to support investigations, inspections and audits.
Performance indicator 4.4.1. A compliance
database of investigations, inspections and audits is maintained.
Achieved.
Aim 5.
Undertake program reporting and review.
Action 5.1. An annual
report on the Queensland Wildlife Trade Management Plan 2018-22 will be prepared and submitted to the Commonwealth.
5.1.1. An annual report on the operation of the
Queensland Wildlife Trade Management Plan 2018–22 for each calendar year is submitted to the Commonwealth Government by the end of March of the following year.
Achieved.
5.1.2. All annual reports prepared during the life
of this plan are available on the department's website.
Achieved.
Action 5.2. The review of
this plan will commence no later than 12 months prior to the expiry of this plan in order to assess the success of the plan in achieving its goal.
5.2.1. The Queensland Wildlife Trade
Management Plan 2018–22 will be reviewed no later than 12 months prior to the expiry of this plan.
Achieved.
5.2.2. The success of the current plan in
achieving its goal is assessed by measuring the aims against the performance indicators.
NA
5.2.3. The results of the plan review are
presented to the Commonwealth no later than six months prior to the expiry of this plan.
NA
Aim 6. Facilitate
adaptive management and research.
Action 6.1. The
department will respond to changes as they arise. Changes made to the management program will be communicated to all relevant stakeholders.
6.1.1. Changes to the macropod management
program will be communicated to relevant stakeholders via the department’s website and directly to stakeholders where appropriate.
Achieved.
Action 6.2. The
department will facilitate research into the ecology and harvest management of macropods.
6.2.1. Research proposals from universities and
other research institutions concerned with the ecological aspects of the commercial harvest of macropods are considered during the life of this plan. Assistance to such research will be provided where appropriate.
Achieved
Queensland Commercial Macropod Management Program—Annual Report 2017
28
Aim Action Performance indicator Progress in 2017
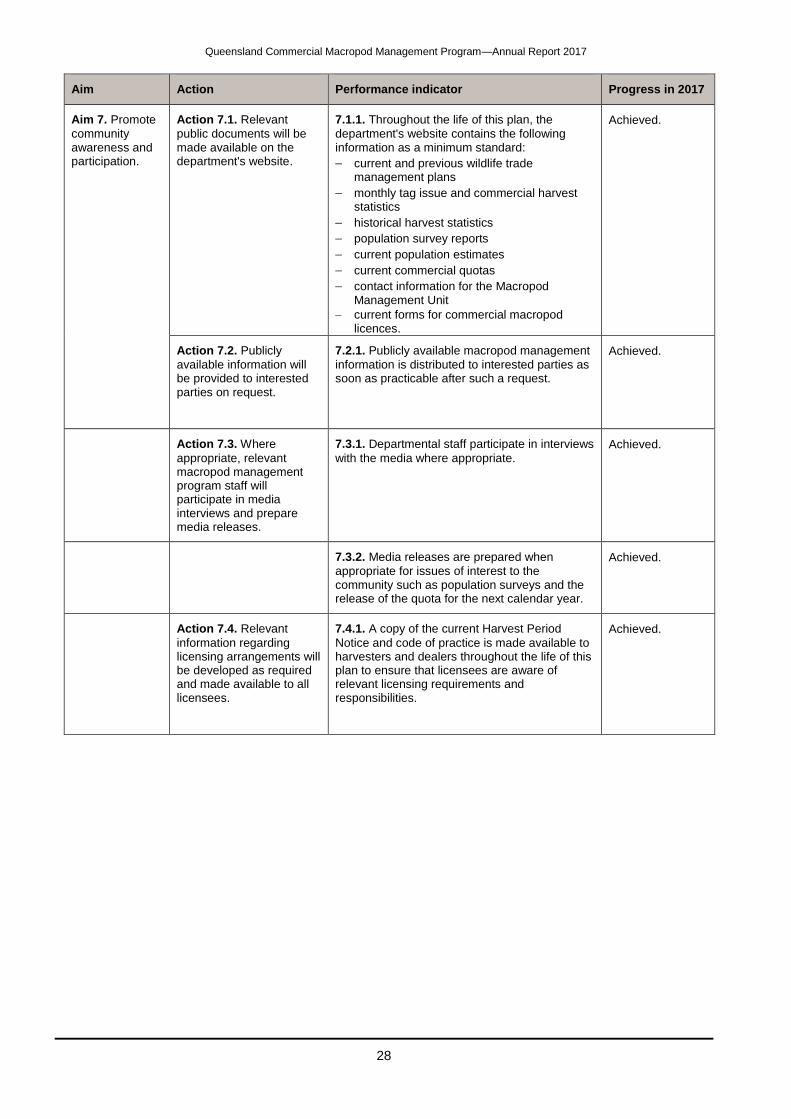
Aim 7. Promote
community awareness and participation.
Action 7.1. Relevant
public documents will be made available on the department's website.
7.1.1. Throughout the life of this plan, the
department's website contains the following information as a minimum standard:
current and previous wildlife trade management plans
monthly tag issue and commercial harvest statistics
historical harvest statistics
population survey reports
current population estimates
current commercial quotas
contact information for the Macropod Management Unit
current forms for commercial macropod licences.
Achieved.
Action 7.2. Publicly
available information will be provided to interested parties on request.
7.2.1. Publicly available macropod management
information is distributed to interested parties as soon as practicable after such a request.
Achieved.
Action 7.3. Where
appropriate, relevant macropod management program staff will participate in media interviews and prepare media releases.
7.3.1. Departmental staff participate in interviews
with the media where appropriate.
Achieved.
7.3.2. Media releases are prepared when
appropriate for issues of interest to the community such as population surveys and the release of the quota for the next calendar year.
Achieved.
Action 7.4. Relevant
information regarding licensing arrangements will be developed as required and made available to all licensees.
7.4.1. A copy of the current Harvest Period
Notice and code of practice is made available to harvesters and dealers throughout the life of this plan to ensure that licensees are aware of relevant licensing requirements and responsibilities.
Achieved.