Embed Size (px)
Citation preview
Quick Start Expectations1. Fill in planner and HWRS
HW: p. 22, #9-162. Get a signature on HWRS3. On desk: calculator, journal, HWRS, pencil, pen,
4. Warm Up: in journal together…
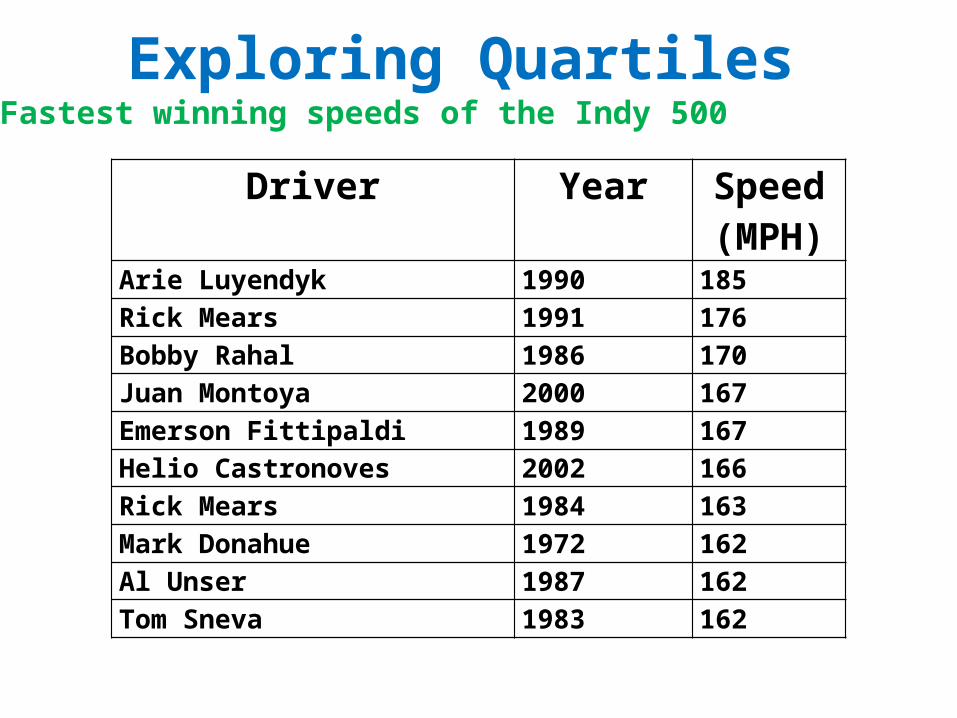
Exploring Quartiles
Driver Year Speed (MPH)
Arie Luyendyk 1990 185Rick Mears 1991 176Bobby Rahal 1986 170Juan Montoya 2000 167Emerson Fittipaldi 1989 167Helio Castronoves 2002 166Rick Mears 1984 163Mark Donahue 1972 162Al Unser 1987 162Tom Sneva 1983 162
Fastest winning speeds of the Indy 500
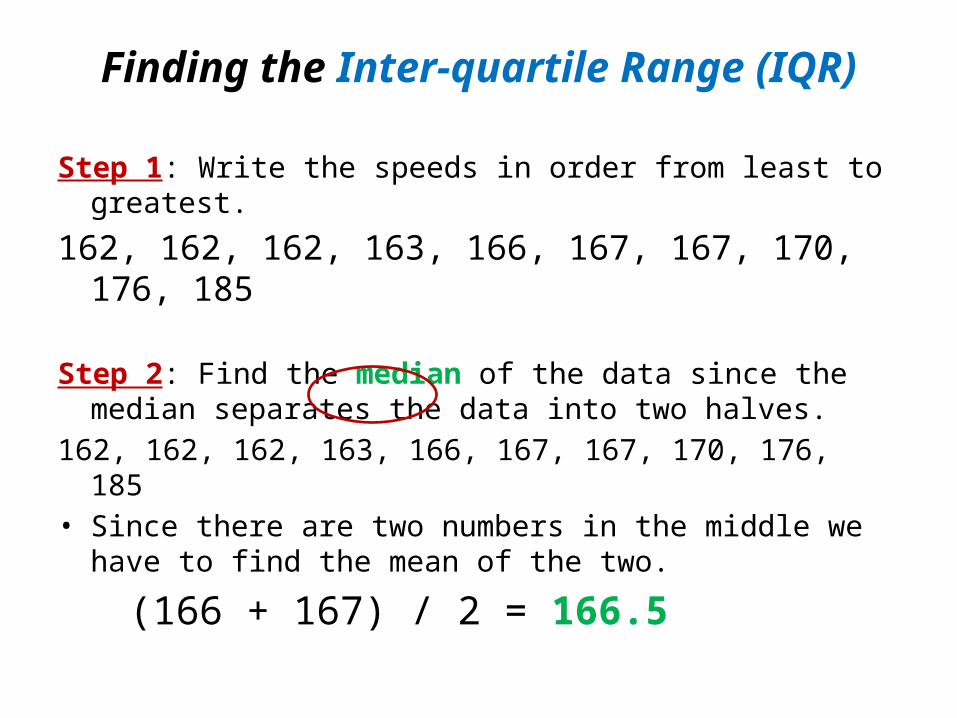
Finding the Inter-quartile Range (IQR)
Step 1: Write the speeds in order from least to greatest.
162, 162, 162, 163, 166, 167, 167, 170, 176, 185
Step 2: Find the median of the data since the median separates the data into two halves.
162, 162, 162, 163, 166, 167, 167, 170, 176, 185• Since there are two numbers in the middle we have to find
the mean of the two.
(166 + 167) / 2 = 166.5
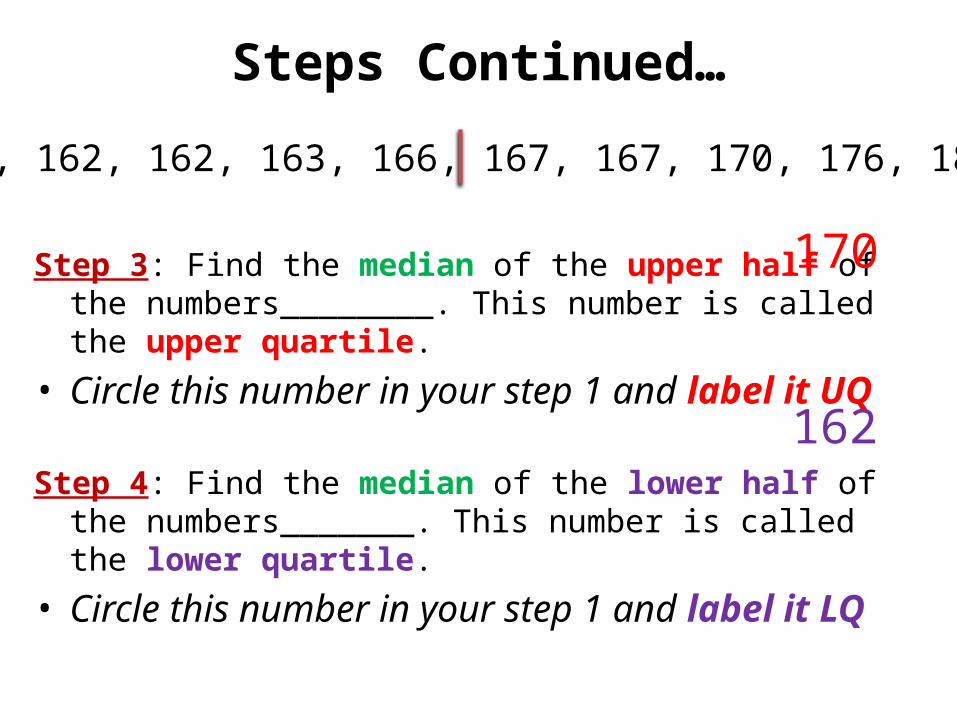
Steps Continued…
Step 3: Find the median of the upper half of the numbers________. This number is called the upper quartile.
• Circle this number in your step 1 and label it UQ
Step 4: Find the median of the lower half of the numbers_______. This number is called the lower quartile.
• Circle this number in your step 1 and label it LQ
170
162
162, 162, 162, 163, 166, 167, 167, 170, 176, 185
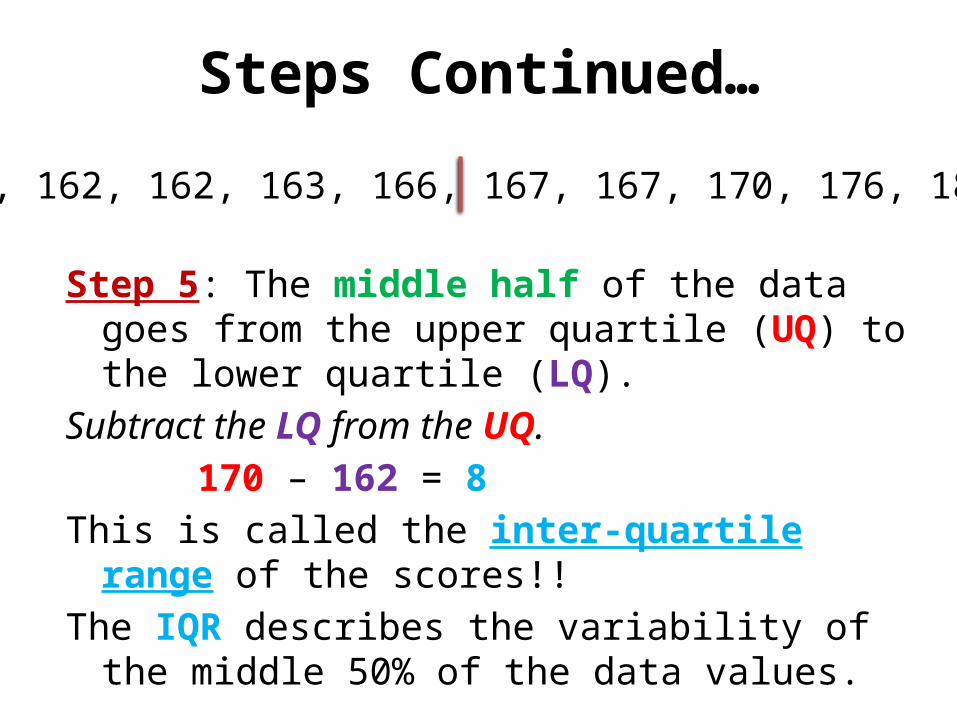
Steps Continued…
Step 5: The middle half of the data goes from the upper quartile (UQ) to the lower quartile (LQ).
Subtract the LQ from the UQ. 170 – 162 = 8
This is called the inter-quartile range of the scores!!The IQR describes the variability of the middle 50% of
the data values.
162, 162, 162, 163, 166, 167, 167, 170, 176, 185
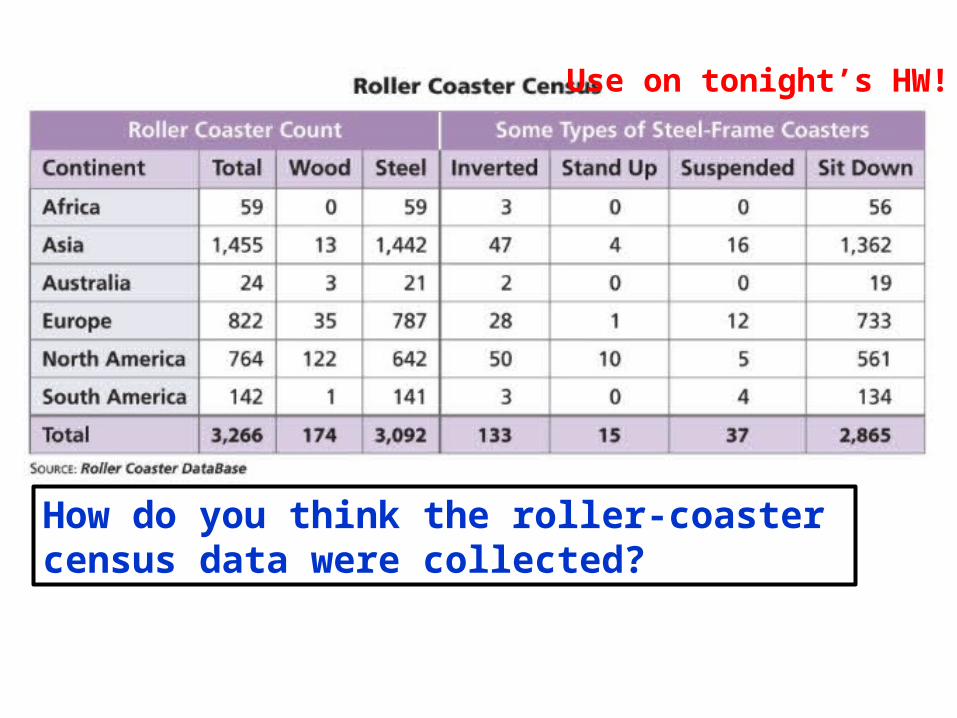
How do you think the roller-coaster census data were collected?
Use on tonight’s HW!
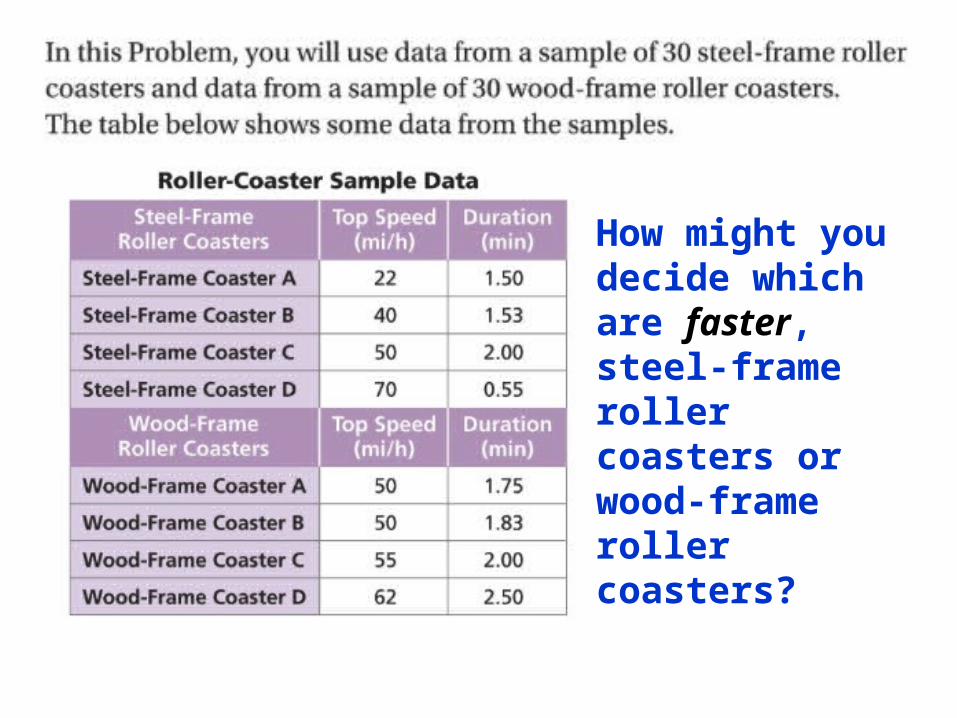
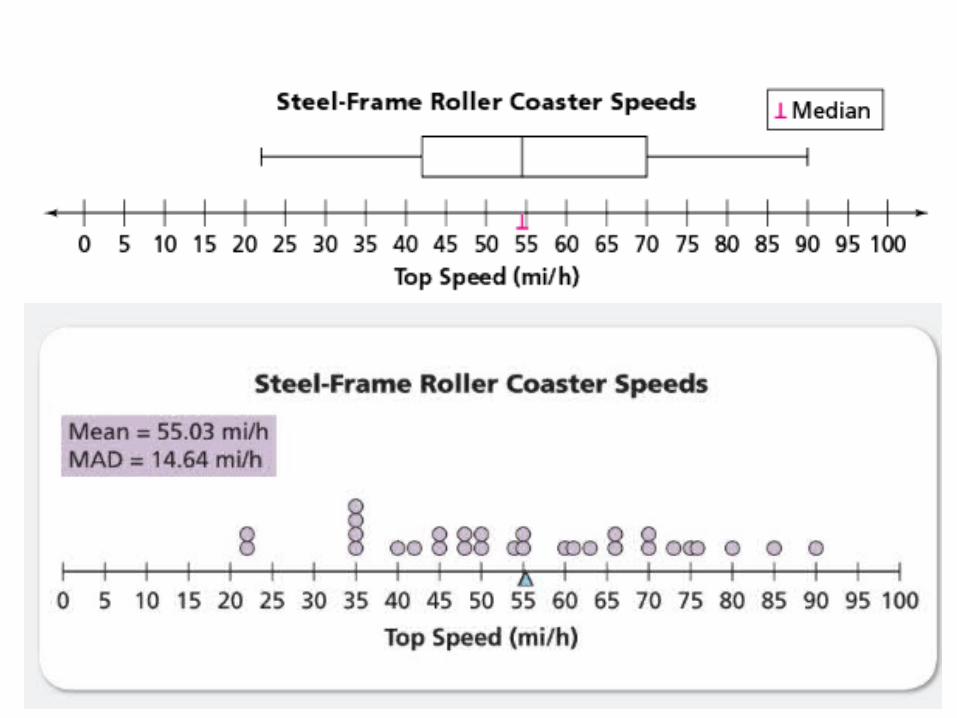
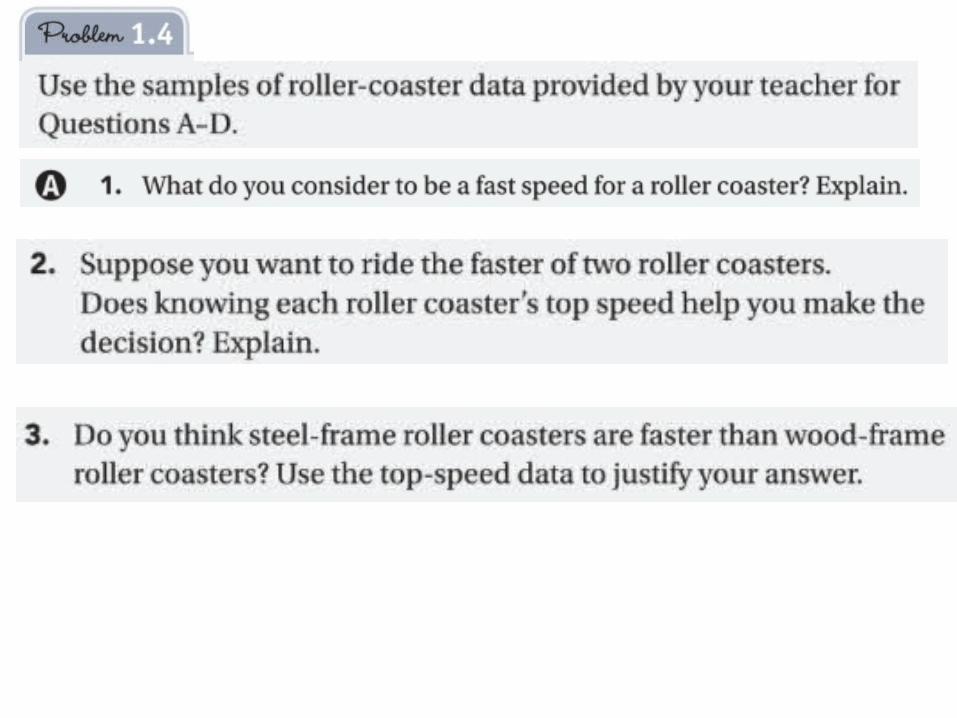
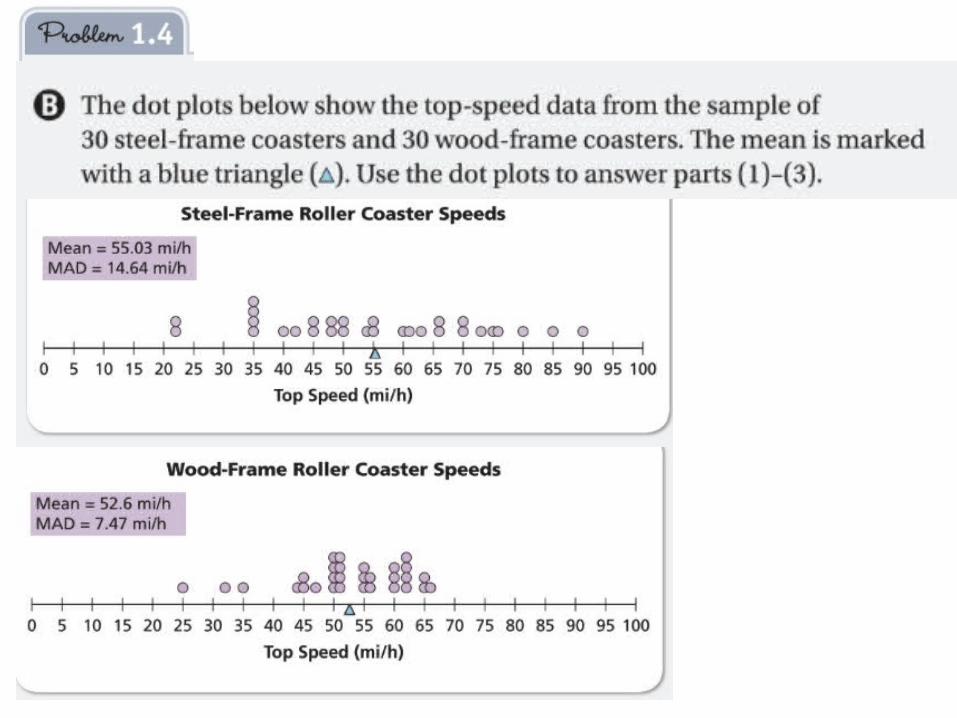
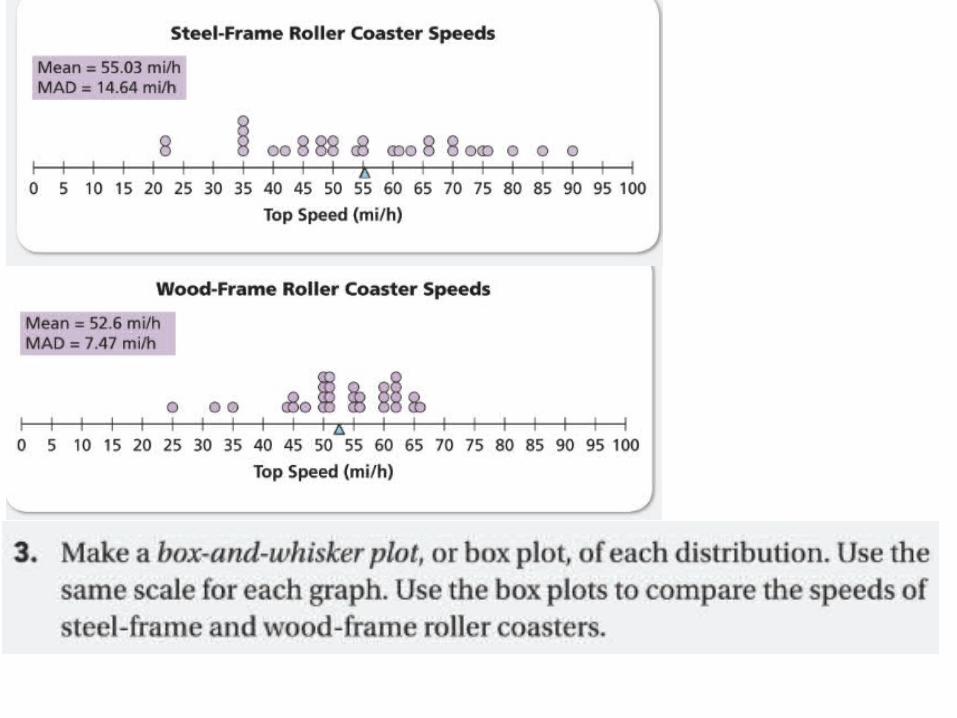
How might you decide which are faster, steel-frame roller coasters or wood-frame roller coasters?
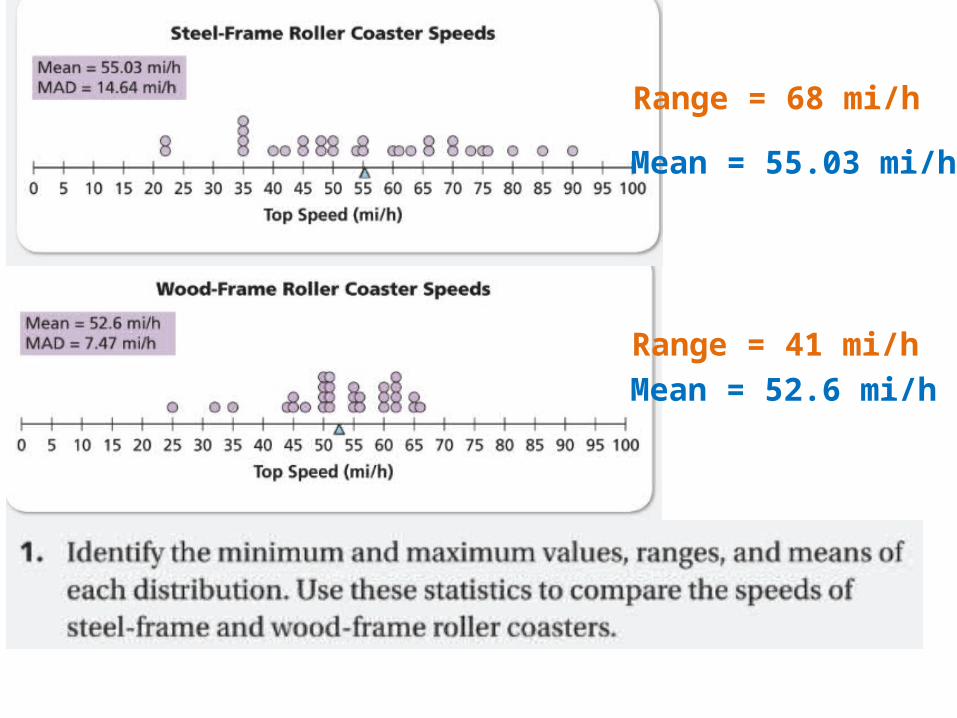
Range = 68 mi/h
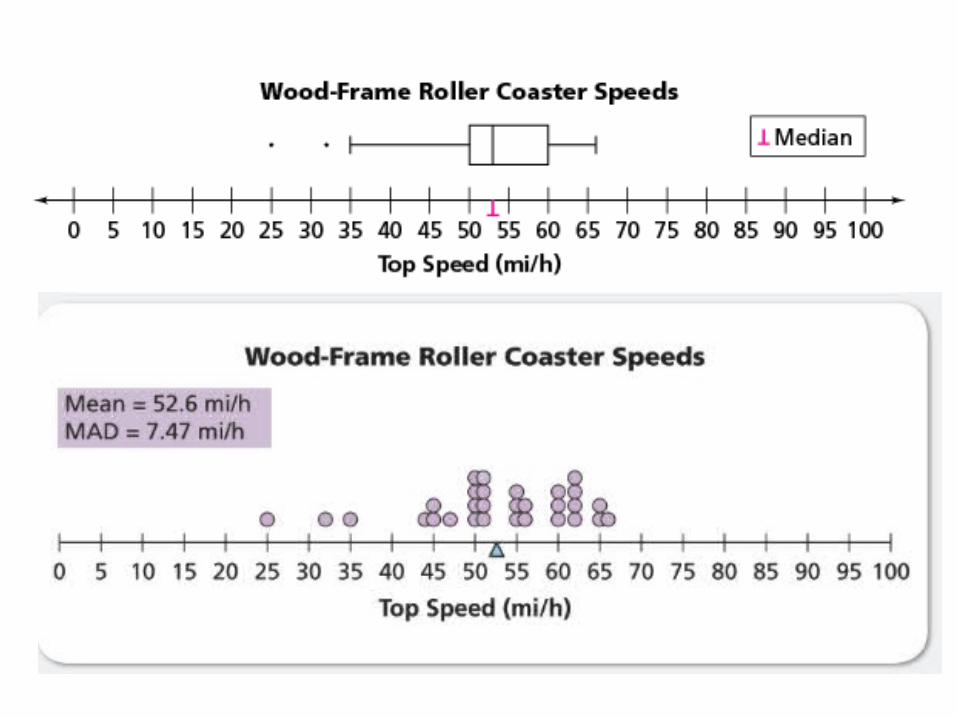
Range = 41 mi/h
Mean = 55.03 mi/h
Mean = 52.6 mi/h
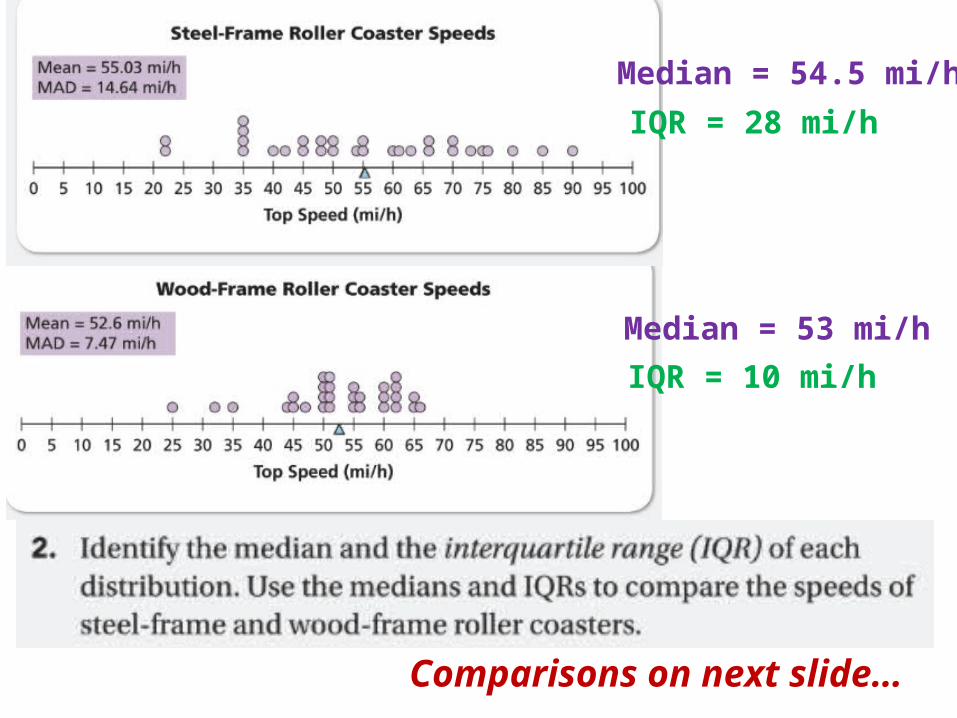
Median = 54.5 mi/h
Median = 53 mi/h
IQR = 28 mi/h
IQR = 10 mi/h
Comparisons on next slide…
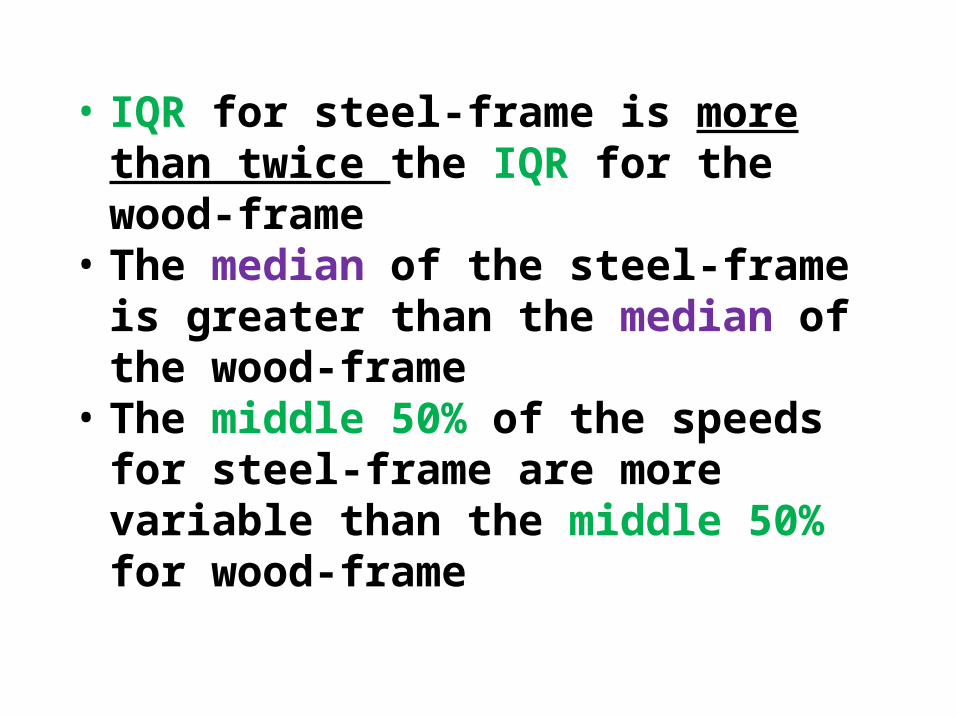
• IQR for steel-frame is more than twice the IQR for the wood-frame
• The median of the steel-frame is greater than the median of the wood-frame
• The middle 50% of the speeds for steel-frame are more variable than the middle 50% for wood-frame
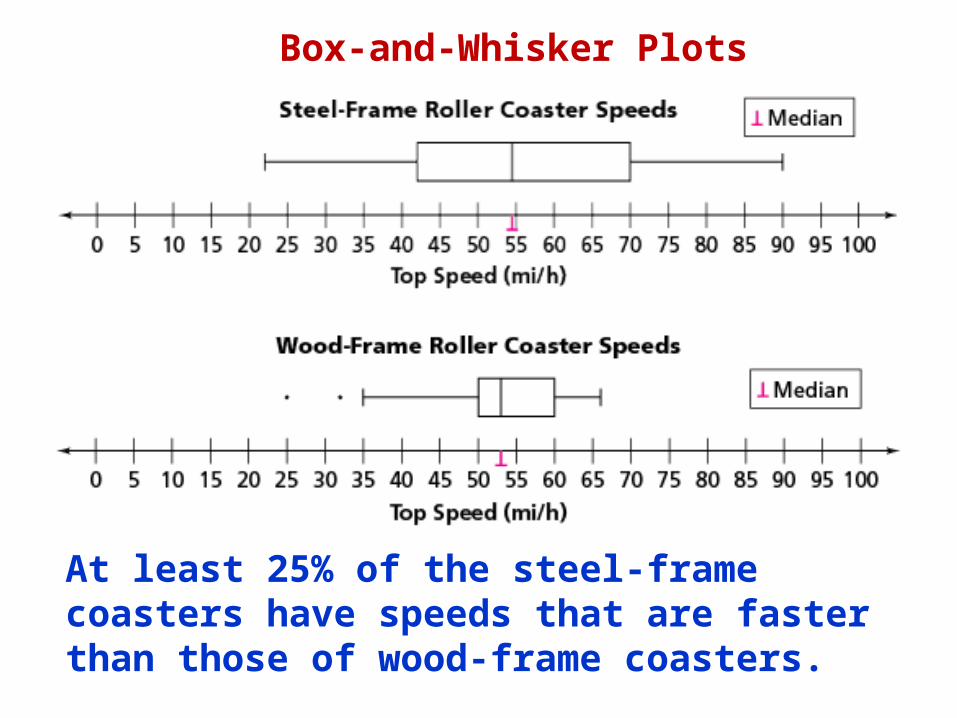
Box-and-Whisker Plots
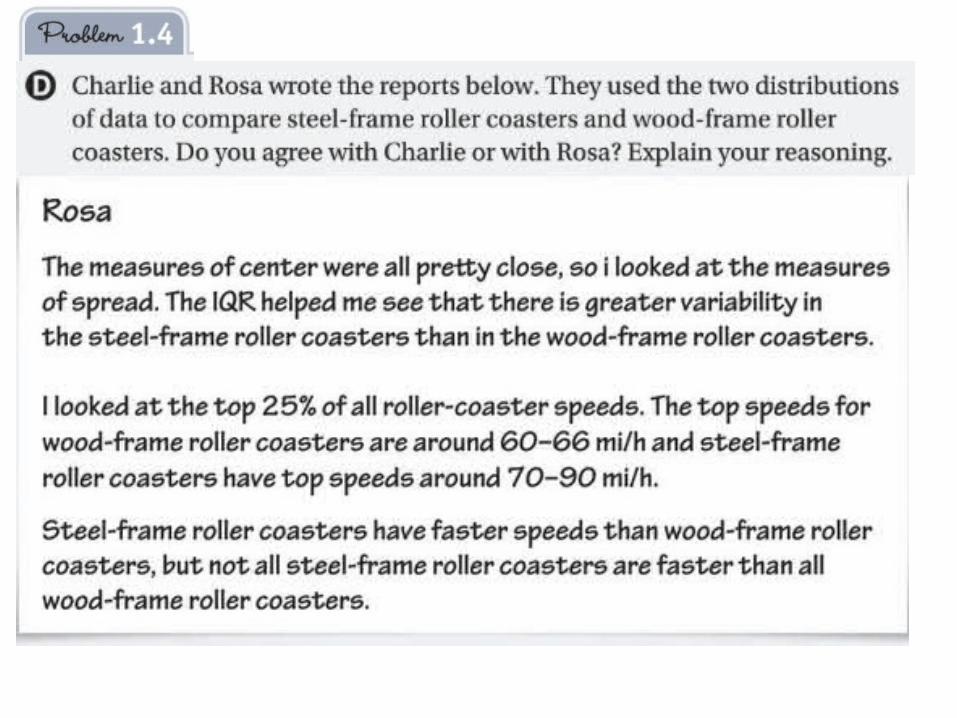
At least 25% of the steel-frame coasters have speeds that are faster than those of wood-frame coasters.
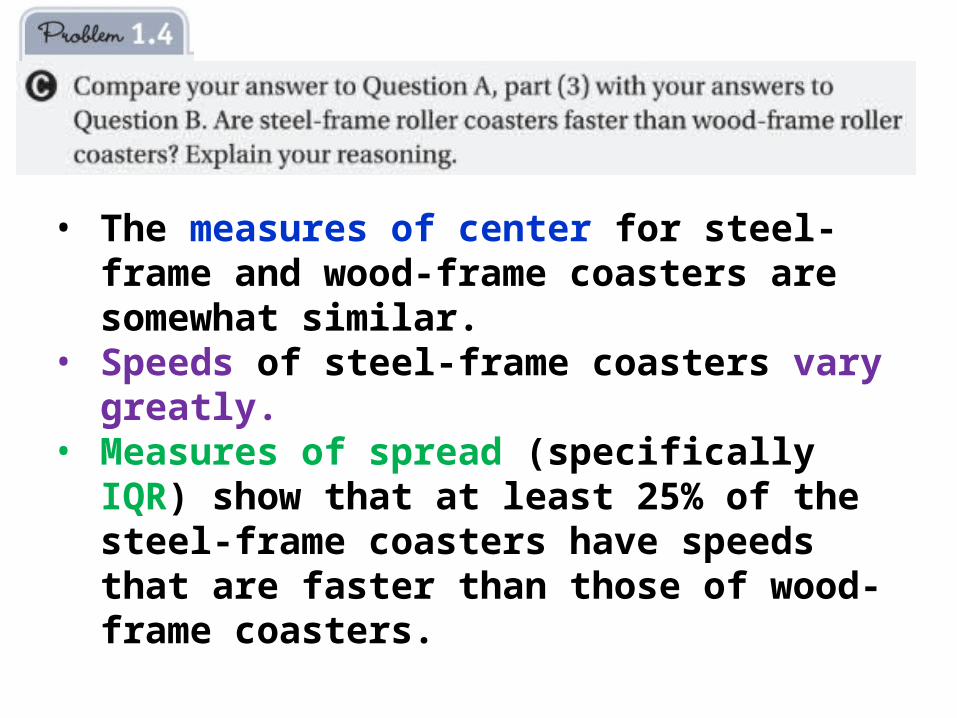
• The measures of center for steel-frame and wood-frame coasters are somewhat similar.
• Speeds of steel-frame coasters vary greatly.• Measures of spread (specifically IQR) show that at
least 25% of the steel-frame coasters have speeds that are faster than those of wood-frame coasters.