Embed Size (px)
Citation preview
© Copyright 2014 Quintiles
William Blair35th Annual Growth Stock Conference
June 9, 2015
NYSE: Q
2
Forward Looking Statements and Use of Non-GAAP Financial MeasuresThis presentation contains forward-looking statements within the meaning of Section 27A of the Securities Act of 1933, as amended and Section 21E of the Securities Exchange Act of 1934, as amended. Such forward-looking statements reflect, among other things, the Company’s current expectations and anticipated results of operations, all of which are subject to known and unknown risks, uncertainties and other factors that may cause actual results, performance or achievements, market trends or industry results to differ materially from those expressed or implied by such forward-looking statements. Therefore, any statements contained herein that are not statements of historical fact may be forward-looking statements and should be evaluated as such. Without limiting the foregoing, the words “anticipates,” “believes,” “estimates,” “expects,” “intends,” “may,” “plans,” “projects,” “should,” “guidance,” “targets,” “will” and the negative thereof and similar words and expressions are intended to identify forward-looking statements. Actual results may differ materially from the Company’s expectations due to a number of factors, including that most of the Company’s contracts may be terminated on short notice, the Company may be unable to maintain large customer contracts or to enter into new contracts, the Company may under-price its contracts, overrun its cost estimates, or fail to receive approval for or experience delays in documenting change orders, the historical indications of the relationship of backlog to revenues may not be indicative of their future relationship, the Company is subject to the complex and changing regulatory and international environments in which the Company operates, the Company may be unable to successfully identify, acquire and integrate businesses, the Company’s substantial indebtedness, and other risks more fully set forth in the Company's filings with the SEC, including the Company’s annual report on Form 10-K for the fiscal year ended December 31, 2014, filed with the SEC on February 12, 2015, as such factors may be amended or updated from time to time in the Company’s periodic filings with the SEC, which are accessible on the SEC's website at www.sec.gov. The Company assumes no obligation to update any forward-looking statement after the date of this presentation, whether as a result of new information, future developments or otherwise.
This presentation includes financial measures not prepared in accordance with accounting principles generally accepted in the United States (“GAAP”). Management believes that these non-GAAP financial measures provide useful supplemental information to management and investors regarding the underlying performance of the Company’s business operations and are more indicative of core operating results as they exclude certain items whose fluctuations from period-to-period do not necessarily correspond to changes in the core operations of the Company’s business. Investors and potential investors are encouraged to review the reconciliations of the non-GAAP financial measures to their most directly comparable GAAP measures attached to this presentation.
3
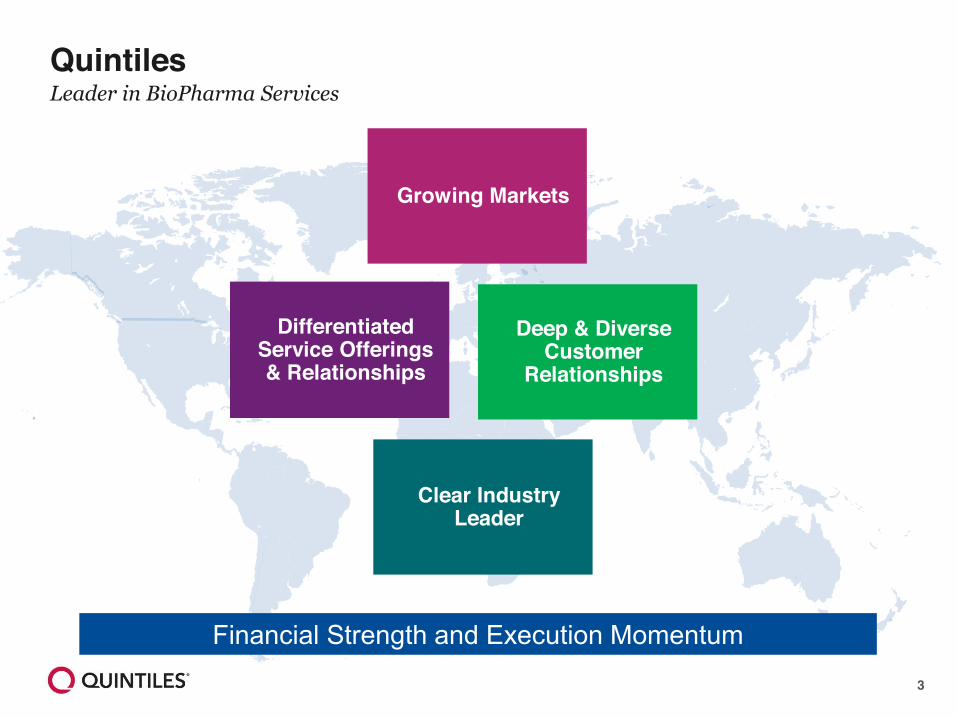
Deep & Diverse Customer
Relationships
QuintilesLeader in BioPharma Services
Clear Industry Leader
Growing Markets
Differentiated Service Offerings & Relationships
Financial Strength and Execution Momentum
4
Connecting insights with superiordelivery for better outcomes
Strategic Agenda
• Profitable growth at above market rates
• Investments leveraging our scale
• World class customer relationship management
• Productivity, delivery & quality
• Top leadership and people development
5
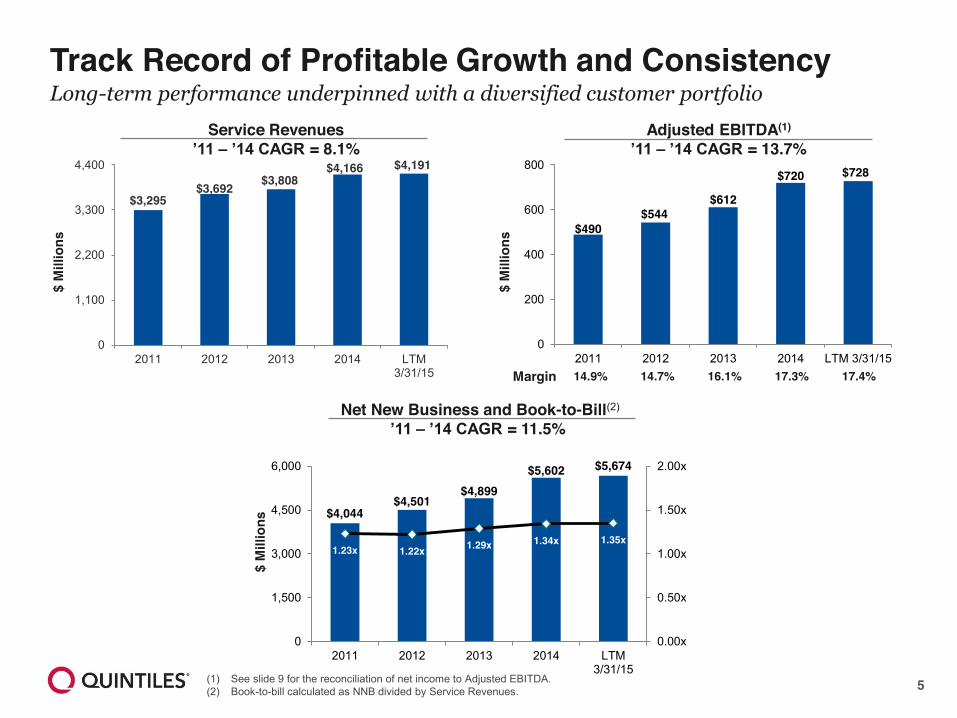
Track Record of Profitable Growth and Consistency Long-term performance underpinned with a diversified customer portfolio
(1) See slide 9 for the reconciliation of net income to Adjusted EBITDA.(2) Book-to-bill calculated as NNB divided by Service Revenues.
CONFIDENTIAL
$490$544
$612
$720 $728
0
200
400
600
800
2011 2012 2013 2014 LTM 3/31/15
$3,295$3,692 $3,808
$4,166 $4,191
0
1,100
2,200
3,300
4,400
2011 2012 2013 2014 LTM3/31/15
$4,044$4,501
$4,899$5,602 $5,674
1.23x 1.22x 1.29x 1.34x 1.35x
0.00x
0.50x
1.00x
1.50x
2.00x
0
1,500
3,000
4,500
6,000
2011 2012 2013 2014 LTM3/31/15
$ M
illio
ns
$ M
illio
ns
$ M
illio
ns
14.9% 14.7% 16.1% 17.3% 17.4%Margin
Service Revenues’11 – ’14 CAGR = 8.1%
Adjusted EBITDA(1)
’11 – ’14 CAGR = 13.7%
Net New Business and Book-to-Bill(2)
’11 – ’14 CAGR = 11.5%
6
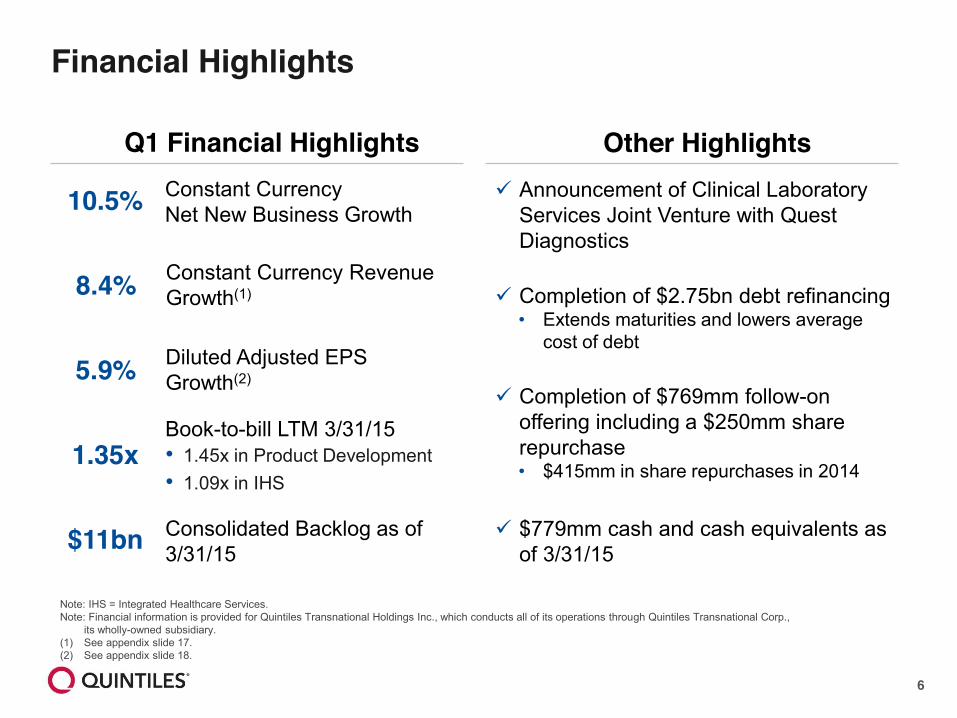
Financial Highlights
Note: IHS = Integrated Healthcare Services.Note: Financial information is provided for Quintiles Transnational Holdings Inc., which conducts all of its operations through Quintiles Transnational Corp.,
its wholly-owned subsidiary.(1) See appendix slide 17.(2) See appendix slide 18.
Q1 Financial Highlights
10.5% Constant CurrencyNet New Business Growth
1.35xBook-to-bill LTM 3/31/15• 1.45x in Product Development• 1.09x in IHS
$11bn Consolidated Backlog as of3/31/15
Other Highlights9 Announcement of Clinical Laboratory
Services Joint Venture with Quest Diagnostics
9 Completion of $2.75bn debt refinancing• Extends maturities and lowers average
cost of debt
9 Completion of $769mm follow-on offering including a $250mm share repurchase• $415mm in share repurchases in 2014
9 $779mm cash and cash equivalents as of 3/31/15
5.9% Diluted Adjusted EPSGrowth(2)
8.4% Constant Currency RevenueGrowth(1)
7
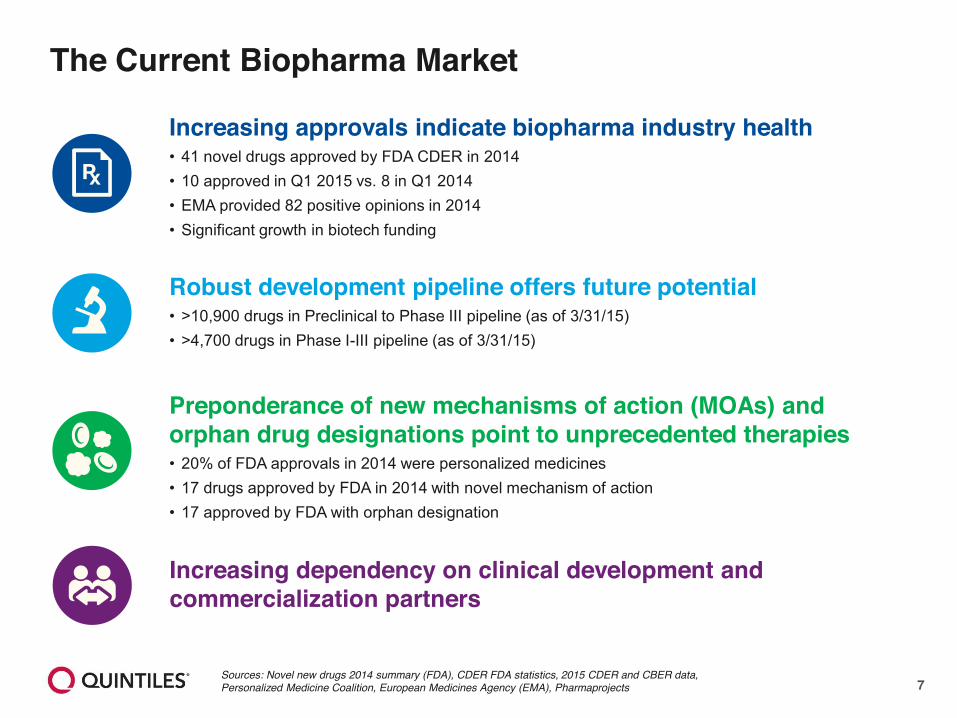
The Current Biopharma Market
Increasing approvals indicate biopharma industry health• 41 novel drugs approved by FDA CDER in 2014• 10 approved in Q1 2015 vs. 8 in Q1 2014• EMA provided 82 positive opinions in 2014• Significant growth in biotech funding
Robust development pipeline offers future potential• >10,900 drugs in Preclinical to Phase III pipeline (as of 3/31/15)• >4,700 drugs in Phase I-III pipeline (as of 3/31/15)
Preponderance of new mechanisms of action (MOAs) and orphan drug designations point to unprecedented therapies• 20% of FDA approvals in 2014 were personalized medicines• 17 drugs approved by FDA in 2014 with novel mechanism of action• 17 approved by FDA with orphan designation
Increasing dependency on clinical development and commercialization partners
Sources: Novel new drugs 2014 summary (FDA), CDER FDA statistics, 2015 CDER and CBER data, Personalized Medicine Coalition, European Medicines Agency (EMA), Pharmaprojects
8
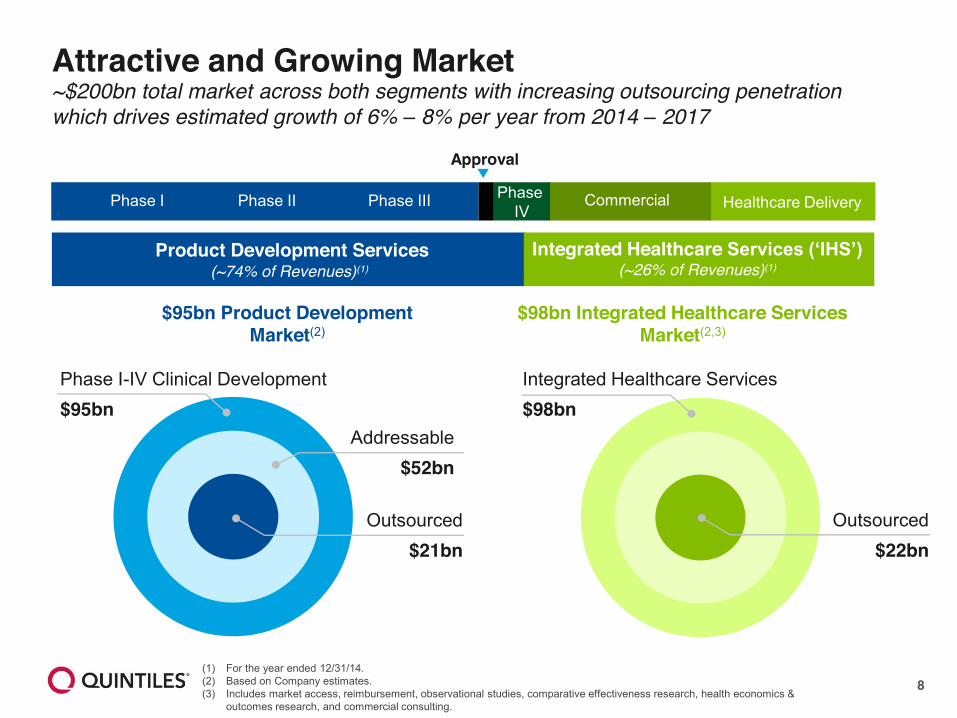
Attractive and Growing Market~$200bn total market across both segments with increasing outsourcing penetration which drives estimated growth of 6% – 8% per year from 2014 – 2017
$95bn Product Development Market(2)
$98bn Integrated Healthcare Services Market(2,3)
Phase I-IV Clinical Development$95bn
Outsourced$21bn
Addressable$52bn
Integrated Healthcare Services$98bn
Outsourced$22bn
(1) For the year ended 12/31/14.(2) Based on Company estimates.(3) Includes market access, reimbursement, observational studies, comparative effectiveness research, health economics &
outcomes research, and commercial consulting.
Product Development Services (~74% of Revenues)(1)
Integrated Healthcare Services (‘IHS’) (~26% of Revenues)(1)
Approval
Phase I Phase II Phase III Healthcare DeliveryCommercialPhase IV
9
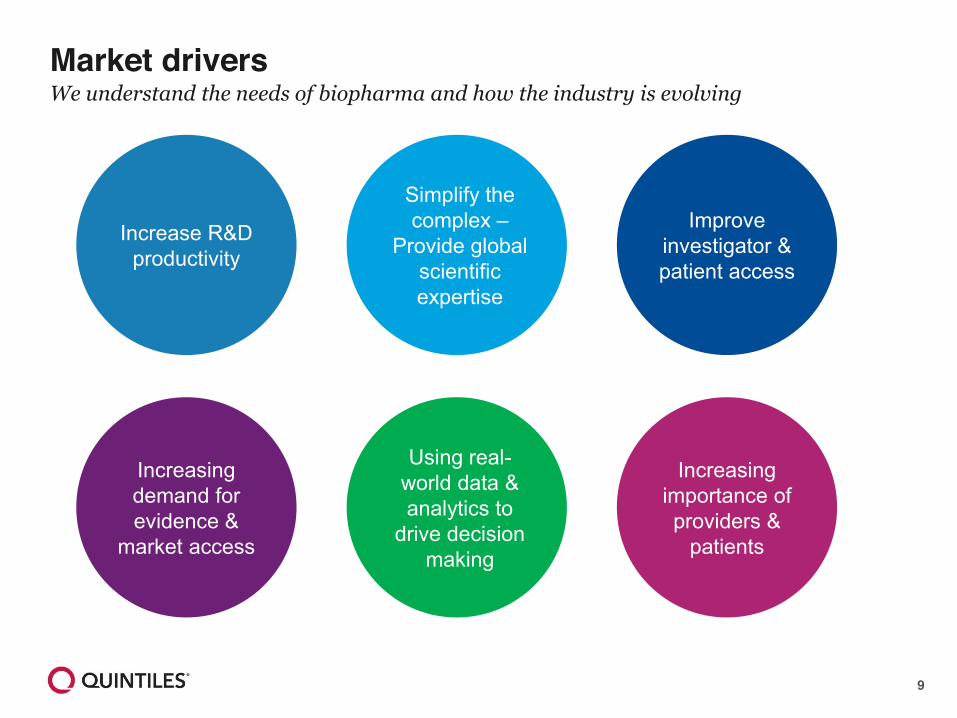
Increase R&D productivity
Simplify the complex –
Provide global scientific expertise
Improve investigator & patient access
Using real-world data & analytics to
drive decision making
Increasing importance of providers &
patients
Increasing demand for evidence &
market access
Market drivers We understand the needs of biopharma and how the industry is evolving
10
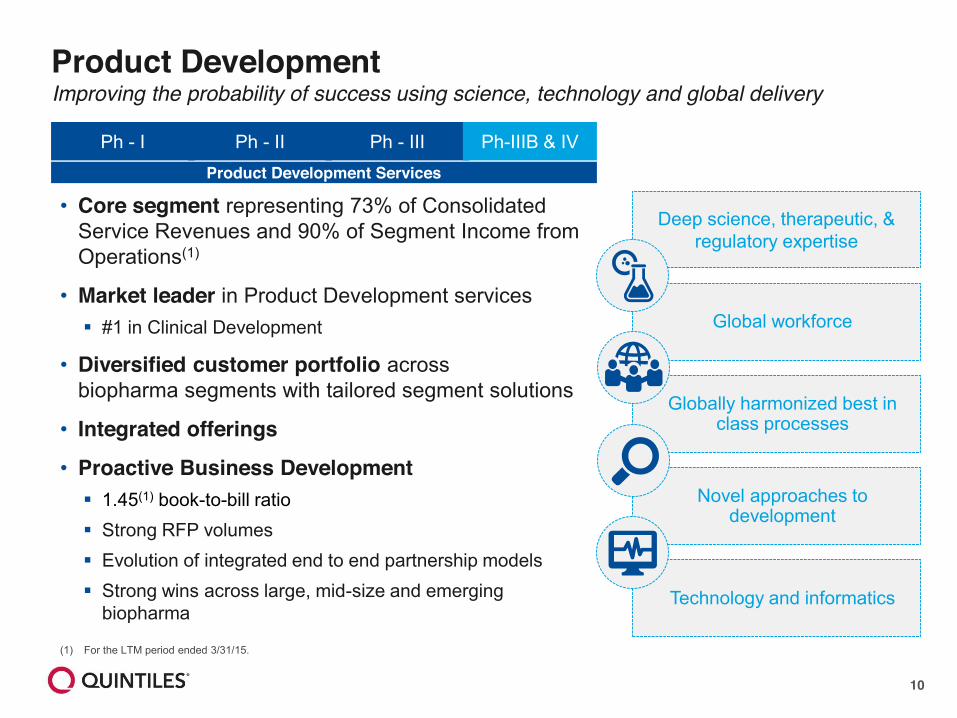
• Core segment representing 73% of Consolidated Service Revenues and 90% of Segment Income from Operations(1)
• Market leader in Product Development services� #1 in Clinical Development
• Diversified customer portfolio across biopharma segments with tailored segment solutions
• Integrated offerings
• Proactive Business Development� 1.45(1) book-to-bill ratio � Strong RFP volumes� Evolution of integrated end to end partnership models � Strong wins across large, mid-size and emerging
biopharma
Product Development
Ph - I Ph - II Ph - III Ph-IIIB & IVProduct Development Services
Technology and informatics
Deep science, therapeutic, & regulatory expertise
Globally harmonized best in class processes
Novel approaches to development
Global workforce
Improving the probability of success using science, technology and global delivery
(1) For the LTM period ended 3/31/15.
11
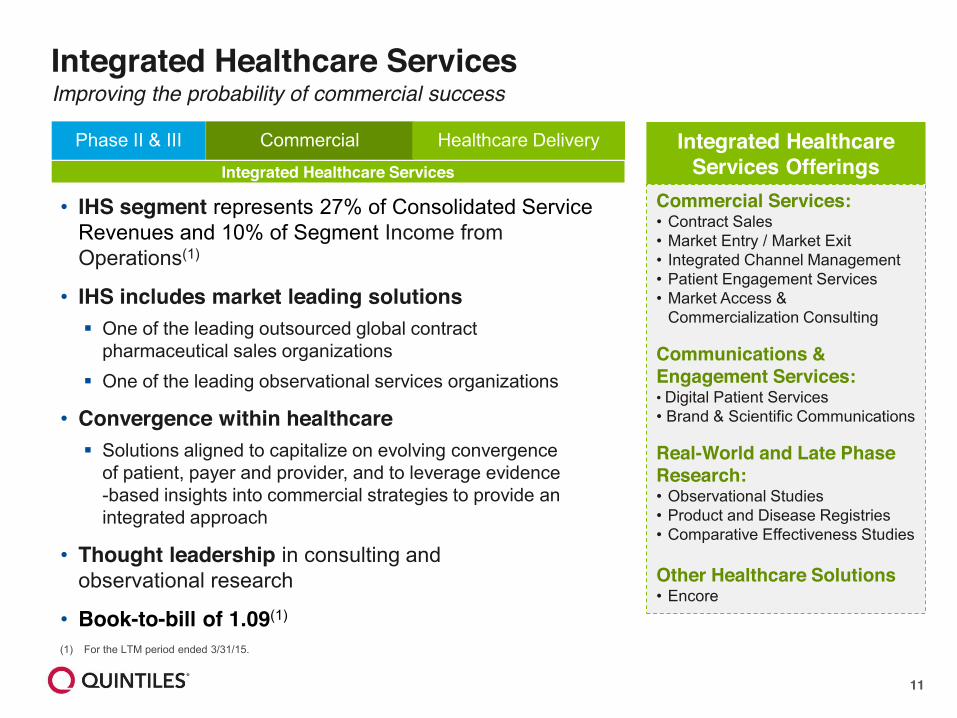
• IHS segment represents 27% of Consolidated Service Revenues and 10% of Segment Income from Operations(1)
• IHS includes market leading solutions � One of the leading outsourced global contract
pharmaceutical sales organizations � One of the leading observational services organizations
• Convergence within healthcare � Solutions aligned to capitalize on evolving convergence
of patient, payer and provider, and to leverage evidence-based insights into commercial strategies to provide an integrated approach
• Thought leadership in consulting and observational research
• Book-to-bill of 1.09(1)
Integrated Healthcare Services
Integrated Healthcare Services Offerings
Commercial Services:• Contract Sales • Market Entry / Market Exit• Integrated Channel Management• Patient Engagement Services• Market Access &
Commercialization Consulting
Communications & Engagement Services:• Digital Patient Services• Brand & Scientific Communications
Real-World and Late Phase Research:• Observational Studies• Product and Disease Registries• Comparative Effectiveness Studies
Other Healthcare Solutions• Encore
Integrated Healthcare Services
Phase II & III Commercial Healthcare Delivery
Improving the probability of commercial success
(1) For the LTM period ended 3/31/15.
12
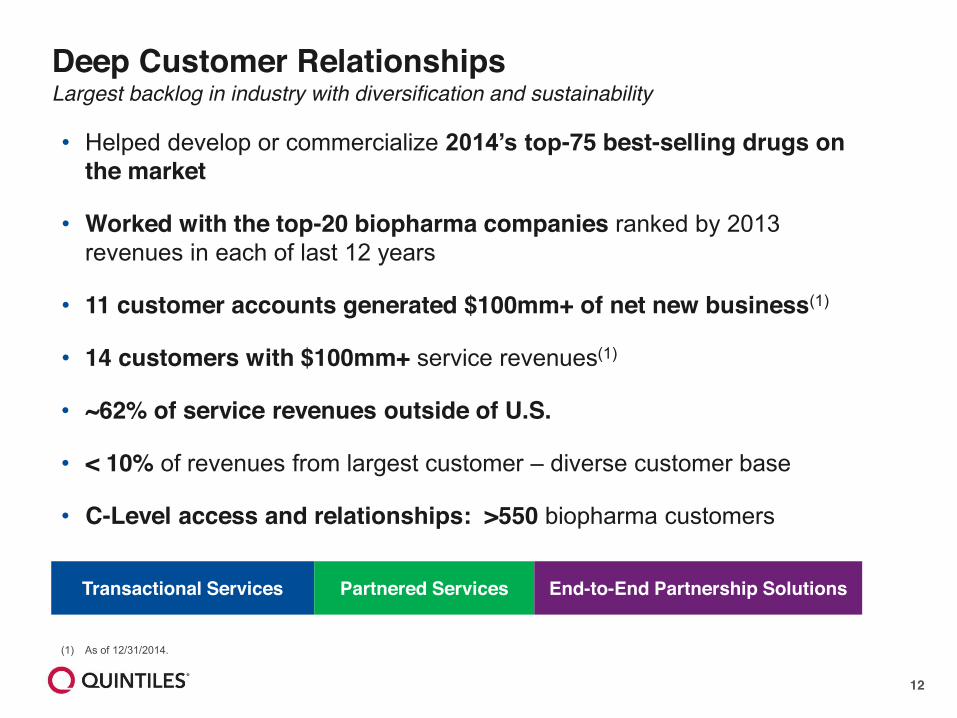
Deep Customer Relationships Largest backlog in industry with diversification and sustainability
• Helped develop or commercialize 2014’s top-75 best-selling drugs on the market
• Worked with the top-20 biopharma companies ranked by 2013 revenues in each of last 12 years
• 11 customer accounts generated $100mm+ of net new business(1)
• 14 customers with $100mm+ service revenues(1)
• ~62% of service revenues outside of U.S.
• < 10% of revenues from largest customer – diverse customer base
• C-Level access and relationships: >550 biopharma customers
Transactional Services Partnered Services End-to-End Partnership Solutions
(1) As of 12/31/2014.
13
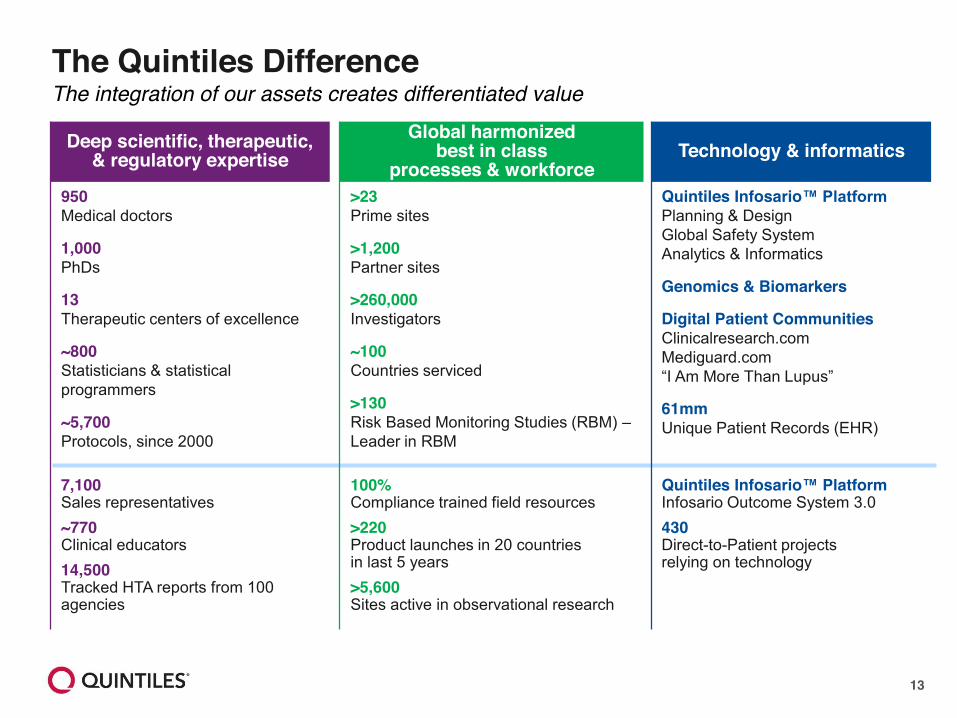
Quintiles Infosario™ PlatformPlanning & DesignGlobal Safety SystemAnalytics & Informatics
Genomics & Biomarkers
Digital Patient CommunitiesClinicalresearch.comMediguard.com“I Am More Than Lupus”
61mm Unique Patient Records (EHR)
>23Prime sites
>1,200 Partner sites
>260,000Investigators
~100 Countries serviced
>130 Risk Based Monitoring Studies (RBM) –Leader in RBM
950Medical doctors
1,000PhDs
13Therapeutic centers of excellence
~800Statisticians & statistical programmers
~5,700 Protocols, since 2000
The Quintiles Difference
Deep scientific, therapeutic, & regulatory expertise
Global harmonized best in class
processes & workforceTechnology & informatics
Quintiles Infosario™ PlatformInfosario Outcome System 3.0430Direct-to-Patient projects relying on technology
100% Compliance trained field resources>220 Product launches in 20 countries in last 5 years>5,600Sites active in observational research
7,100Sales representatives~770Clinical educators14,500Tracked HTA reports from 100 agencies
The integration of our assets creates differentiated value
14
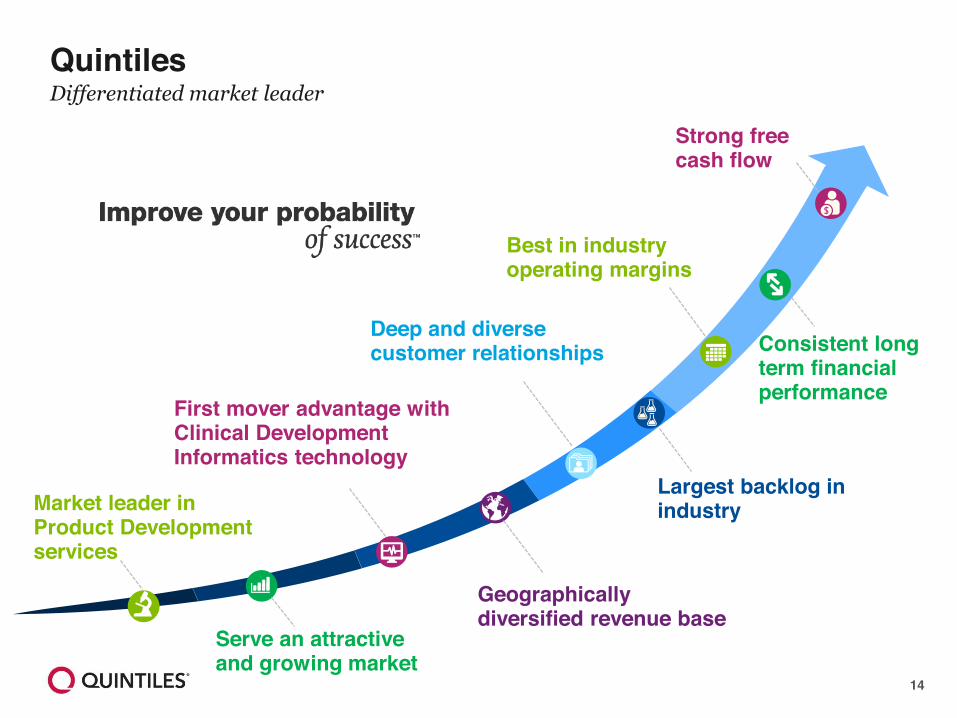
QuintilesDifferentiated market leader
Market leader in Product Development services
Deep and diverse customer relationships
Serve an attractive and growing market
Geographically diversified revenue base
Strong free cash flow
First mover advantage with Clinical Development Informatics technology
Largest backlog in industry
Best in industry operating margins
Consistent long term financial performance

15
Appendix
16
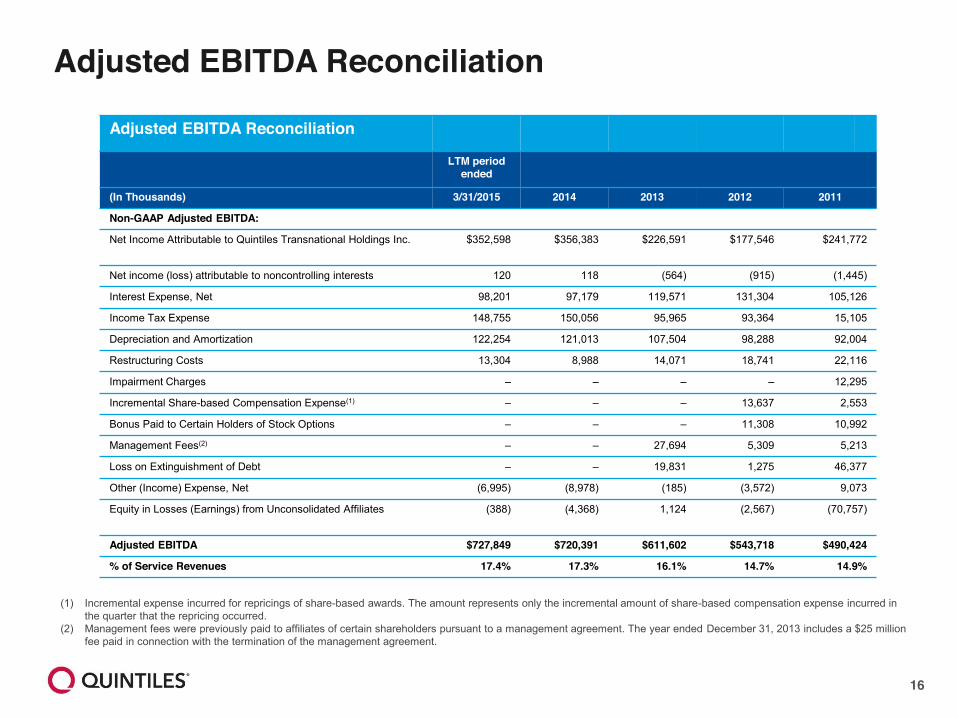
Adjusted EBITDA Reconciliation
Adjusted EBITDA Reconciliation
LTM period ended
(In Thousands) 3/31/2015 2014 2013 2012 2011
Non-GAAP Adjusted EBITDA:
Net Income Attributable to Quintiles Transnational Holdings Inc. $352,598 $356,383 $226,591 $177,546 $241,772
Net income (loss) attributable to noncontrolling interests 120 118 (564) (915) (1,445)
Interest Expense, Net 98,201 97,179 119,571 131,304 105,126
Income Tax Expense 148,755 150,056 95,965 93,364 15,105
Depreciation and Amortization 122,254 121,013 107,504 98,288 92,004
Restructuring Costs 13,304 8,988 14,071 18,741 22,116
Impairment Charges – – – – 12,295
Incremental Share-based Compensation Expense(1) – – – 13,637 2,553
Bonus Paid to Certain Holders of Stock Options – – – 11,308 10,992
Management Fees(2) – – 27,694 5,309 5,213
Loss on Extinguishment of Debt – – 19,831 1,275 46,377
Other (Income) Expense, Net (6,995) (8,978) (185) (3,572) 9,073
Equity in Losses (Earnings) from Unconsolidated Affiliates (388) (4,368) 1,124 (2,567) (70,757)
Adjusted EBITDA $727,849 $720,391 $611,602 $543,718 $490,424
% of Service Revenues 17.4% 17.3% 16.1% 14.7% 14.9%
(1) Incremental expense incurred for repricings of share-based awards. The amount represents only the incremental amount of share-based compensation expense incurred in the quarter that the repricing occurred.
(2) Management fees were previously paid to affiliates of certain shareholders pursuant to a management agreement. The year ended December 31, 2013 includes a $25 million fee paid in connection with the termination of the management agreement.
17
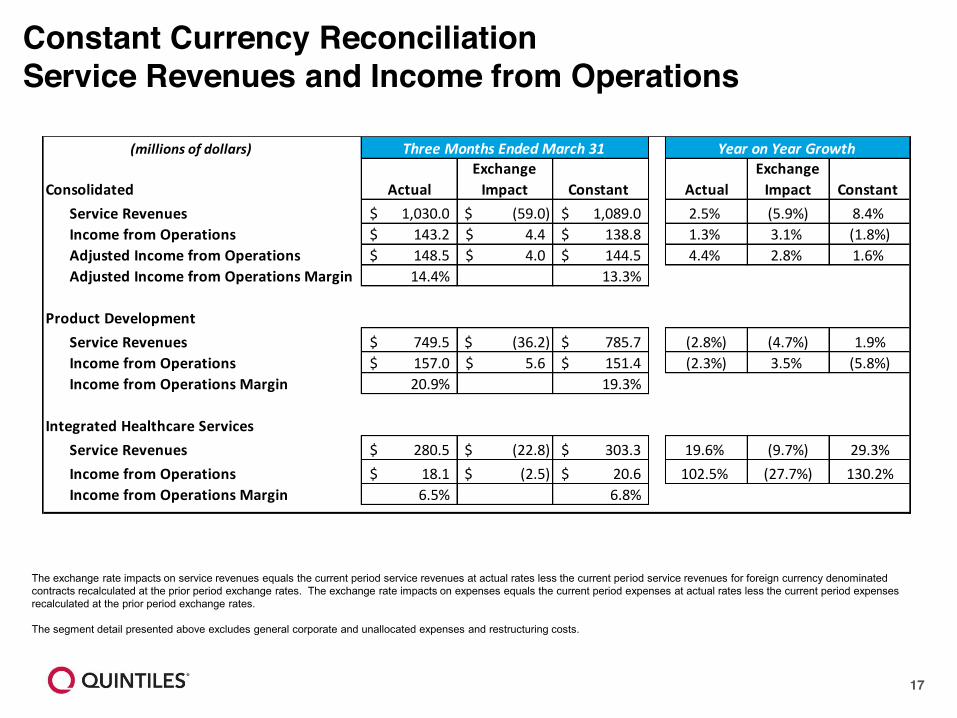
Constant Currency ReconciliationService Revenues and Income from Operations
The exchange rate impacts on service revenues equals the current period service revenues at actual rates less the current period service revenues for foreign currency denominated contracts recalculated at the prior period exchange rates. The exchange rate impacts on expenses equals the current period expenses at actual rates less the current period expenses recalculated at the prior period exchange rates.
The segment detail presented above excludes general corporate and unallocated expenses and restructuring costs.
(millions of dollars)
Consolidated ActualExchange
Impact Constant ActualExchange
Impact Constant Service Revenues 1,030.0$ (59.0)$ 1,089.0$ 2.5% (5.9%) 8.4%Income from Operations 143.2$ 4.4$ 138.8$ 1.3% 3.1% (1.8%)Adjusted Income from Operations 148.5$ 4.0$ 144.5$ 4.4% 2.8% 1.6%Adjusted Income from Operations Margin 14.4% 13.3%
Product DevelopmentService Revenues 749.5$ (36.2)$ 785.7$ (2.8%) (4.7%) 1.9%Income from Operations 157.0$ 5.6$ 151.4$ (2.3%) 3.5% (5.8%)Income from Operations Margin 20.9% 19.3%
Integrated Healthcare ServicesService Revenues 280.5$ (22.8)$ 303.3$ 19.6% (9.7%) 29.3%Income from Operations 18.1$ (2.5)$ 20.6$ 102.5% (27.7%) 130.2%Income from Operations Margin 6.5% 6.8%
Three Months Ended March 31 Year on Year Growth
18
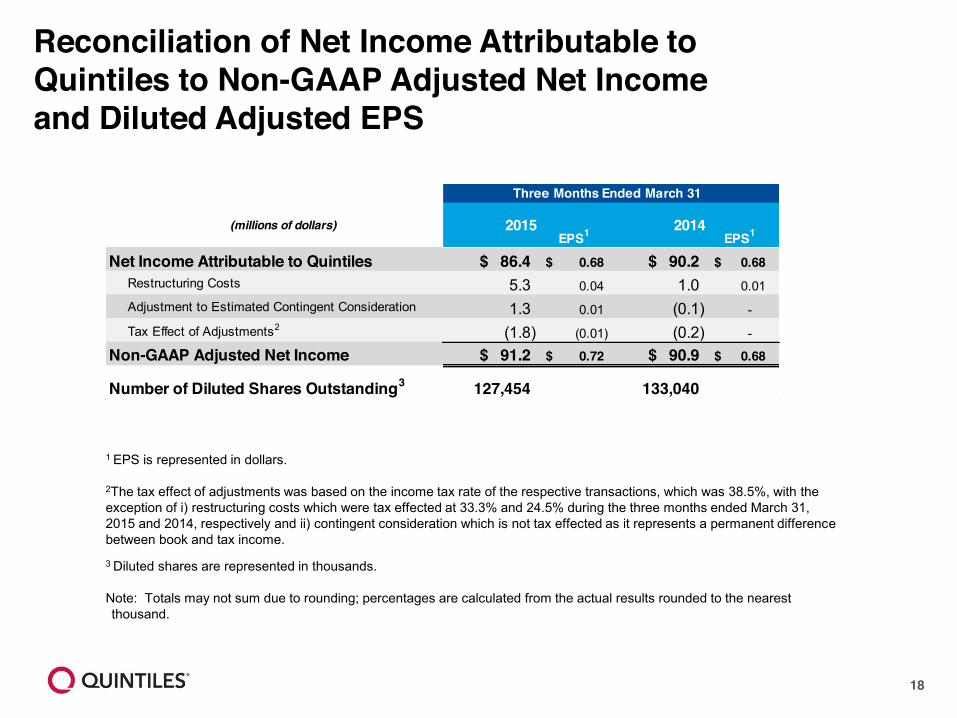
Reconciliation of Net Income Attributable to Quintiles to Non-GAAP Adjusted Net Income and Diluted Adjusted EPS
1 EPS is represented in dollars.
2The tax effect of adjustments was based on the income tax rate of the respective transactions, which was 38.5%, with the exception of i) restructuring costs which were tax effected at 33.3% and 24.5% during the three months ended March 31, 2015 and 2014, respectively and ii) contingent consideration which is not tax effected as it represents a permanent difference between book and tax income.
3 Diluted shares are represented in thousands.
Note: Totals may not sum due to rounding; percentages are calculated from the actual results rounded to the nearest thousand.
(millions of dollars) 2015EPS1 2014
EPS1
Net Income Attributable to Quintiles $ 86.4 0.68$ $ 90.2 0.68$ Restructuring Costs 5.3 0.04 1.0 0.01 Adjustment to Estimated Contingent Consideration 1.3 0.01 (0.1) -
Tax Effect of Adjustments2 (1.8) (0.01) (0.2) -
Non-GAAP Adjusted Net Income $ 91.2 0.72$ $ 90.9 0.68$
Number of Diluted Shares Outstanding3 127,454 133,040
Three Months Ended March 31