Embed Size (px)
Citation preview
Massachusetts Race to the Top College and Career Readiness Initiatives
Evaluation Annual Report, September 2014 Prepared for the Massachusetts Department of Elementary and Secondary Education
RTTT C&CR Evaluation Annual Report, September 2014
UMass Donahue Institute Applied Research and Program Evaluation
i
Acknowledgments The UMass Donahue Institute extends its sincere appreciation to the many people who supported and collaborated with us on this evaluation. In particular, we want to thank personnel from the Massachusetts Department of Elementary and Secondary Education and from the schools, districts, partners, and vendors associated with the Massachusetts Pre-AP, STEM Early College High School, and MassCore initiatives.
Massachusetts Race to the Top College and Career Readiness Initiatives Evaluation Annual Report, September 2014 Project Staff
Eliot Levine, Senior Research Manager, Project Manager Jeremiah Johnson, Research Manager Beth-Ann Tek, Research Manager Abigail Egan, Research Analyst Steven Ellis, Director, Applied Research and Program Evaluation Report Information
This report was prepared by the UMass Donahue Institute, the project evaluator, under contract with the Massachusetts Department of Elementary and Secondary Education. The contents of this report were developed under a grant from the U.S. Department of Education. However, those contents do not necessarily represent the policy of the U.S. Department of Education, and you should not assume endorsement by the Federal Government. About the Donahue Institute The University of Massachusetts Donahue Institute is the public service, outreach, and economic development unit of the University of Massachusetts President’s Office. Established in 1971, the Institute strives to connect the Commonwealth with the resources of the University through services that combine theory and innovation with public and private sector applications. UMDI’s Applied Research and Program Evaluation group specializes in applied social science research, including program evaluation, survey research, policy research, and needs assessment. The group has designed and implemented research and evaluation projects for diverse programs and clients in the areas of education, human services, economic development, and organizational development. University of Massachusetts Donahue Institute 413-587-2400 (phone) Applied Research and Program Evaluation Group 413-587-2410 (fax) 100 Venture Way Suite 5 www.donahue.umassp.edu Hadley, MA 01035-9462
RTTT C&CR Evaluation Annual Report, September 2014
UMass Donahue Institute Applied Research and Program Evaluation
ii
Table of Contents Acknowledgments ........................................................................................................................................ i
Executive Summary ................................................................................................................................... iii
Introduction ................................................................................................................................................. 1
Pre-AP Teacher Training ........................................................................................................................... 3
STEM-focused Early College High Schools ............................................................................................ 48
MassCore Policy and Implementation .................................................................................................... 90
Appendices ............................................................................................................................................... 101
Appendix A: Pre-AP Administrator Interview ............................................................................ 102
Appendix B: Pre-AP Teacher and Lead Teacher Interview......................................................... 104
Appendix C: Pre-AP Classroom Observation Protocol ............................................................... 107
Appendix D: Pre-AP Vertical Team Meeting Observation Protocol ........................................... 112
Appendix E: Pre-AP Teacher Survey .......................................................................................... 113
Appendix F: Pre-AP Training Attendance ................................................................................... 122
Appendix G: STEM ECHS Administrator Interview .................................................................. 125
Appendix H: STEM ECHS IHE Partner Interview ..................................................................... 129
Appendix I: STEM ECHS Vendor Interview .............................................................................. 132
Appendix J: STEM ECHS Personnel Survey .............................................................................. 134
Appendix K: MassCore Data Administrator Interview ............................................................... 139
Appendix L: MassCore Completion Rate Trends by District ...................................................... 142
RTTT C&CR Evaluation Annual Report, September 2014
UMass Donahue Institute Applied Research and Program Evaluation
iii
Executive Summary The Massachusetts Department of Elementary and Secondary Education (ESE) was awarded a federal Race to the Top (RTTT) grant for the years 2010–2014. The college and career readiness (C&CR) components of the grant were designed to help students develop “knowledge and skills necessary for success in postsecondary education and economically viable career pathways.” The RTTT initiatives are intended to provide students with opportunities to participate in quality, upper-level high school coursework and new approaches to assist them with high school completion and transition to higher education and the workforce. These programs are part of a broader effort, as specified in the Delivery Plan of ESE's College and Career Readiness group, to increase the Massachusetts 5-year high school graduation rate to 88.3% and the number of students who complete the MassCore program of study to 85% statewide. The UMass Donahue Institute is conducting an evaluation of three of the C&CR components of the Massachusetts RTTT efforts—the Pre-AP Teacher Training program, the STEM-focused Early College High Schools (ECHS), and the MassCore Policy and Implementation initiative. For each of these three programs, this executive summary provides a brief program description, evaluation findings for the year ending September 30, 2014 (referred to as Year 4), and strategic considerations. Pre-AP Teacher Training The aims of the Pre-AP Teacher Training program are to increase the number of low income and minority students prepared to participate and succeed in mathematics, science, and English language arts (ELA) Advanced Placement courses and credit-bearing college-level coursework; to provide teachers in grades 6–12 with high-quality professional development to assist them in developing curricula, instruction, and assessments that prepare students for AP coursework; and to provide an opportunity for teachers to collaborate in horizontal and vertical teams and to network with other teachers in their region for the purpose of improving curriculum and instruction. Technical assistance for the project has been provided by Mass Insight Education and the National Math and Science Initiative (NMSI). Districts are participating in the program in multiple configurations. RTTT Project 4D districts committed to sending the same teachers for four-day trainings in three consecutive summers and to create discipline-specific vertical teams, led by trained lead teachers, that meet quarterly to share and deepen their Pre-AP practices. Districts that are using Goal 4A or non-RTTT funds have created several variations of the basic training configuration, and the percentage of all teachers in a given school and district who are being trained varies widely. Districts also selected different disciplines or combinations of disciplines among the mathematics, science, and English language arts (ELA) trainings offered. The Year 4 evaluation of the Pre-AP initiative included the following activities: site visits or phone interviews with two Project 4D schools which included six interviews with teachers and administrators, one classroom observation, and one vertical team meeting observations; a survey of teachers and lead teachers; regular communications and an in-person interview with ESE program managers; two phone interviews with the project vendors; and collection of vertical team meeting attendance from Project 4D districts. Additional data sources included vendor training registration and attendance databases, ESE documents and databases, and project documents. Vendor transition. The Pre-AP program encountered a significant challenge late in the 2012–13 school year, when circumstances arose that prevented Mass Insight Education (MIE), the program vendor
RTTT C&CR Evaluation Annual Report, September 2014
UMass Donahue Institute Applied Research and Program Evaluation
iv
until that time, from utilizing the LTF materials and trainings that had been the basis for their Pre-AP work with RTTT districts. ESE subsequently cancelled MIE’s contract, because the vendor was no longer able to provide the LTF program, and issued a new request for proposals from prospective vendors. Both MIE and the National Math and Science Initiative (NMSI) submitted proposals, with NMSI proposing to use the LTF materials (which they own), and MIE proposing to design a new program. Both MIE and NMSI were approved as Pre-AP vendors in March 2014. Districts were given the choice of which vendor to select, or they could select different vendors for different disciplines. During summer 2014, MIE and NMSI trained teachers from 40 and 39 districts, respectively. ESE reported that the timing of the vendor transition appears to have reduced total program participation, and that the program lost momentum in districts that had low internal capacity to support it, which ESE attributed in part to the lack of vendor support during most of the school year. In emails and an interview with UMDI, ESE program managers expressed substantial dissatisfaction with one of the two vendor’s performance in relation to the summer 2014 trainings and the support materials made available to teachers. UMDI is not currently able to provide systematic feedback relevant to the summer 2014 performance of either vendor, because the trainings occurred after the end of planned data collection activities for the RTTT C&CR evaluation. However, if ESE wished to undertake such an inquiry, components could include review of ESE’s notes from observations of the summer 2014 trainings, review of the vendors’ activities and resources in relation to the work that was vetted through their vendor proposals, and conducting surveys and/or interviews with program participants. Teachers trained. Through summer 2014, training of cohort 1 and cohort 2 teachers in each of the three parts (i.e., years) of training has included:
• ELA – 677 in part 1, 379 in part 2, and 193 in part 3.
• Mathematics – 674 in part 1, 326 in part 2, and 202 in part 3.
• Science – 382 in part 1, 158 in part 2, and 49 in part 3.
In addition, districts that began their training in summer 2013 or later account for an additional 120 completed “teacher years” of training. This totals 3160 teacher years of training. While a small percentage of these (still to be determined, at ESE’s discretion) were supported by non-RTTT funds, the total number supported by RTTT funds far exceeds ESE’s goal of at least 1000 teacher years of training. Vertical teaming. According to the program’s guidelines, each 4D district will create discipline-specific vertical teams of Pre-AP trained and other teachers, led by a Pre-AP trained lead teacher, that will meet quarterly to share and deepen their Pre-AP practices. The number of vertical team meetings is one indicator of a district’s level of Pre-AP implementation. During Year 4, 29 out of 40 Project 4D districts (68%) submitted vertical team meeting attendance logs for at least one discipline. Of these 29 districts, 51 discipline teams in ELA, mathematics, and science submitted data for at least one vertical team meeting. Of the 51 discipline teams, 51 percent submitted data for 4 meetings, 37 percent for 3 meetings, and 12 percent for 2 meetings. All teachers and administrators reported advantages and successes of vertical team meetings. Similar to last year’s teachers and administrators, they appreciated the opportunity to spend time with their colleagues, meet colleagues from other schools, share resources, and strategize about how to implement LTF activities effectively. Making connections between middle and high school teachers was mentioned by all interviewees as a benefit of vertical team meetings, particularly the benefits of understanding each
RTTT C&CR Evaluation Annual Report, September 2014
UMass Donahue Institute Applied Research and Program Evaluation
v
other’s responsibilities and challenges. The meetings facilitated efforts at vertical alignment, as teachers gained increased knowledge of each other’s required curricular content. Reported challenges of vertical team meetings included scheduling and content. Two teachers, one from each district that was the focus of Year 4 interviews and site visits, reported repetition of content as a challenge related to vertical team meetings. One teacher reported that lessons discussed in vertical team meetings may subsequently be implemented by teachers in multiple grade levels, so students may encounter the same LTF lesson in multiple school years. The other teacher reported that the vertical team meetings themselves had become repetitive. Classroom implementation. The Pre-AP Teacher Survey reached 1,684 teachers, with a response rate of 40% (N=675; 535 4D and 140 non-4D). In the 4D group, 70% or more of teachers agreed that, as a result of the Pre-AP training, they now teach more Pre-AP content (73%), use more Pre-AP pedagogical strategies in the classroom (74%), have improved their content knowledge in their primary discipline (70%), and have greater awareness of the importance of using Pre-AP strategies (81%). A smaller but still substantial number agreed that they now use more Pre-AP assessment strategies (54%), that they have changed their teaching philosophy to be more consistent with the Pre-AP program (55%), and that implementing LTF lessons and assessments represents a substantial change to their teaching practice (53%). Interviewed teachers reported having conducted from 4–15 LTF lessons per year. Similar to last year’s findings, multiple interviewees in one district emphasized that their district is utilizing Pre-AP strategies extensively, even in activities that are not LTF lessons. Teachers reported utilizing LTF assessments much less often than LTF lessons, and none of the teachers have used an LTF assessment in its entirety. Both mathematics teachers and one ELA teacher said that they have changed their teaching practices substantially as a result of the training, particularly by taking a more student-centered approach. All teachers interviewed reported that they implement LTF strategies with students at all course levels, not just in honors-level courses. AP course and exam participation and success. Based on ESE’s definition of “high-needs” (HN) students, non-high-needs (NHN) students take and pass AP courses at three to four times the rate of high-needs (HN) students statewide. However, this ratio is substantially lower in Project 4D districts for mathematics (2.5 versus 3.3) but not for ELA (2.8 versus 2.6) or science (3.6 versus 3.7). The highest percentage of HN students taking and passing AP courses can be found in Project 4D districts that also have AP programs present. Compared to last year’s findings, ratios in most subgroups and disciplines were lower, suggesting an improvement in the gap between HN and NHN students. Furthermore, the ratios are substantially lower in all three disciplines for the districts that began the Pre-AP program in the first cohort and have had longer exposure to the program. NHN students take AP exams in ELA, math, and science on average at three to four times the rate of HN students. Again, the Pre-AP program appears to be related to trends in AP exam success, as these ratios are substantially lower in Project 4D districts for mathematics (3.6 versus 2.7) and science (3.9 versus 2.7) but not for ELA (2.9 versus 3.0). For both course and exam participation and success, possible alternative explanations of the findings and next analytic steps are discussed. Training and technical assistance. Several survey items address perceptions of the quality and availability of program materials and technical assistance. With regard to program quality, 86% of teachers believe that the LTF lessons and assessments are examples of high-quality pedagogical practices, and 84% of teachers believe that the LTF curriculum is well aligned with the Common Core State
RTTT C&CR Evaluation Annual Report, September 2014
UMass Donahue Institute Applied Research and Program Evaluation
vi
Standards. Interviews with teachers and administrators complement these survey findings, as most interviewees spoke highly of the summer trainings. (These survey and interview data were in reference to the 2013 teacher trainings.) Sustainability. The creation of the Pre-AP program was made possible by the large infusion of resources from the RTTT award. ESE and vendors described multiple possible routes for the program and its impacts to continue beyond the RTTT period. First, both MIE and NMSI plan to continue offering their Pre-AP training and materials to Massachusetts districts who identify internal or external resources to pay for those services. ESE and NMSI reported that some districts have already taken this step. Second, some districts have incorporated specific LTF activities into their curricula. Third, some districts have implemented train-the-trainer models that enable trained teachers within the district to disseminate Pre-AP strategies at lower cost than if provided by an external vendor. Fourth, ESE and the vendors believe that exposure to the Pre-AP program has shifted some teachers’ pedagogical approaches in ways that will continue beyond RTTT. Nonetheless, all informants have also emphasized that sustainability will likely be challenging in some districts, due to insufficient resources to support additional training as well as the effort required to shift toward Pre-AP pedagogical approaches.
Strategic considerations. (Each is explained in greater detail in the full report.)
• Formal review or evaluation of the new Pre-AP vendors and the process by which they were selected could address ongoing questions and concerns.
• Avoiding repetition of Pre-AP activities should be one target of vertical alignment.
• Soliciting teacher input could increase buy-in and productivity related to vertical team meetings.
STEM-focused Early College High Schools In its RTTT proposal, ESE proposed to open six STEM early college high schools to reduce achievement gaps, provide an accelerated pathway to postsecondary education for underrepresented students, and prepare students for productive STEM careers by partnering with colleges and providing opportunities to earn up to two years of college credit while still in high school. Six districts were chosen in a competitive process and received RTTT Goal 4E funds for this purpose. Eight additional STEM ECHS sites received support from discretionary RTTT funds. At ESE’s request, UMDI’s evaluation efforts focused on the six sites that received Goal 4E funds. Evaluation activities during Year 4 included interviews with ESE program managers, the technical assistance vendor, STEM ECHS program administrators, and IHE partners; a survey of school personnel; one site visit; and analysis of relevant documents and databases. The six STEM ECHS sites were in various phases of project development and implementation. Interviewees reported the following main successes:
• All six of the STEM ECHS sites are operational.
• STEM ECHS students are engaging with STEM content and are confident in their abilities.
• Students at five sites participated in one or more college courses.
• School and district leaders provided strong support.
• Partnerships between districts and IHEs continued to deepen.
• Some sites strengthened connections with feeder middle schools.
RTTT C&CR Evaluation Annual Report, September 2014
UMass Donahue Institute Applied Research and Program Evaluation
vii
• Marlborough was viewed as a standout success.
• ESE reported increased levels of communication and collaboration among various early college high school stakeholders from across Massachusetts.
Interviewees also reported several challenges. All site administrators and IHE partners who were interviewed said that securing the financial resources to sustain the STEM ECHS programs was their primary concern. Several interviewees said that it would be extremely difficult for their STEM ECHS to offer college experiences for students without outside financial support, and that college course offerings would be eliminated or significantly reduced after the RTTT grant expired. ESE said that the burden for sustaining the STEM ECHS programs falls largely on the districts. ESE also noted that, at the state level, it is difficult to form a broad coalition of support to sustain STEM ECHS programs. Just as in Year 3, each implementing site reported logistical challenges that included course location, scheduling, and timing; different numbers of students across cohorts; transportation; staffing; and assessment. Administrators at each implementing site said that their leadership teams were working closely to address these logistical concerns, many of which had been difficult to anticipate. During Year 4, five of six STEM ECHS sites experienced one or more significant transitions in district, school, program, and/or IHE partner leadership. Three districts reported difficulty maintaining the continuity of their planning team, which disrupted work that was in progress. The findings from the STEM ECHS personnel survey indicate that:
• A majority of survey respondents believe that their district has a plan for and is committed to developing and supporting the STEM ECHS.
• Most survey respondents believe that their STEM ECHS will contribute to a reduction in achievement gaps between high- and low-performing students in their school/district.
• More than half of all survey respondents believe that their district will not have sufficient funds to support their STEM ECHS after the RTTT funding period is over.
• Most survey respondents believe that students in their district have a strong interest in participating in STEM ECHS activities.
As reported in previous years, feedback from awardees about collaboration with ESE has been uniformly positive. Technical assistance to STEM ECHS sites decreased during Year 4. JFF and ESE did not host STEM ECHS technical assistance meetings as in previous years, but did invite the six sites to participate in two relevant technical assistance gatherings. ESE and JFF agreed that the focus of JFF’s technical assistance during Year 4 would shift from providing “on-the-ground support” to supporting districts’ efforts to explore, develop, and implement plans for sustainability. To facilitate this shift, the JFF consultant who had served as the primary technical assistance contact for districts was replaced by a new consultant who worked with sites to explore options for sustainability. Administrators from several sites said that they had not been aware that the level of technical assistance would be reduced during Year 4, and that the purpose and timing of the consultant transition could have been communicated more clearly. ESE said that JFF was a valued partner. ESE also said that they did not believe that the technical assistance provided by JFF was sustainable over the long term, and that in retrospect it may have been appropriate to combine JFF’s policy expertise with a second technical assistance vendor to provide on-the-ground support.
RTTT C&CR Evaluation Annual Report, September 2014
UMass Donahue Institute Applied Research and Program Evaluation
viii
Strategic Considerations (Each is explained in greater detail in the full report.)
• Establishing and sustaining early college models would benefit from improved articulation and funding agreements between high schools and institutions of higher education.
• ESE could build on the successes of the STEM ECHS initiative by continuing their efforts to connect STEM ECHSs with other early college initiatives across Massachusetts.
• Identifying, communicating, and establishing accountability for project milestones could provide ESE with more leverage when making important funding decisions.
MassCore Policy and Implementation The Massachusetts High School Program of Studies (MassCore) recommends a set of courses and other learning opportunities that Massachusetts students should complete before graduating from high school, in order to arrive at college or the workplace well-prepared and without the need for remedial coursework. The 155 districts that selected the RTTT college and career readiness goal committed to implementing strategies to increase the percentage of their students who complete the MassCore curriculum. The state’s RTTT goal is to increase the statewide MassCore completion rate from its baseline of 70% of the class of 2010 graduates to 85% of the class of 2014 graduates. The state has created a goal for each district, using a formula based on the district’s reported 2010 MassCore completion rate (calculated from the MassCore element of the state’s SIMS database), the district’s number of 2010 graduates, and the total number of graduates statewide needed to bridge the gap between the 70% baseline and the 85% goal. Each district was also expected to determine areas in which courses or supports needed to be expanded in order to meet the 2014 targets, and to create and implement a plan to improve the accuracy of their reporting of MassCore completion levels. Evaluation activities during Year 4 included interviews with MassCore administrators from five districts, interview (and various communications) with ESE project manager and research project manager, and a review of information retrieved from ESE’s School/District Profiles and SIMS databases.
MassCore completion rates. UMDI calculated state and district MassCore completion percentages and found that the statewide MassCore completion rate has increased slightly, from 69.6% for 2009–10 graduates (the year before RTTT began) to 69.9% for 2012–13 graduates. While this degree of change is not well aligned with the state’s goals, additional investigation is required to determine whether the change reflects reporting error rather than a change in MassCore completion rates. This is because, as reported by UMDI previously, there is strong evidence of substantial inaccuracy in district reporting of MassCore completion rates. To understand how district reporting might influence the observed decline in statewide MassCore completion rates, UMDI examined MassCore completion rates and trends for each district over a five-year period (from 2008–09 to 2012–13). These data suggest that some districts have adjusted their MassCore reporting practices over time, and that these changes could be obscuring actual increases or decreases in the state’s overall MassCore completion rate. Several groupings of districts are highlighted that could be useful in identifying districts that could serve as models, as well as districts that may require particular types of technical assistance with regard to increasing MassCore completion rates. District administrator interviews. The five districts that participated in district administrator interviews were selected based on having adopted the MassCore program of studies as part of their high
RTTT C&CR Evaluation Annual Report, September 2014
UMass Donahue Institute Applied Research and Program Evaluation
ix
school graduation requirements. ESE selected the five districts, reflecting a range of district accountability and assistance levels, school year 2013–14 MassCore completion rates, and urbanicity levels. All districts reported that changes in courses, scheduling, and personnel were needed in order to accommodate their adoption of MassCore as a graduation requirement. The areas that required additional course offerings were mathematics, lab sciences, foreign language, wellness, and arts. In some cases changes to facilities were also required to accommodate additional lab sciences and art courses. Hiring personnel and offering professional development were also required, particularly in relation to offering a fourth year of mathematics. Scheduling changes were also required to ensure that students could take these courses. A scheduling challenge reported by multiple schools was ensuring that all students could participate in wellness activities during all four years of high school. Implementing some of the new courses required curriculum development. A challenge in raising MassCore completion rates reported by one district was that some students are exempted from meeting certain MassCore requirements, such as exemptions from physical education courses for medical reasons, or exemption from foreign language courses for some English language learners (ELLs) and special education students (as a provision of their individualized education plans). This district reported that such exemptions applied to about 15 percent of their students, accounting for the district’s 85 percent MassCore completion rate despite having MassCore completion as a graduation requirement. Another challenge is presented by students who transfer from a district that does not require MassCore completion to a district that does require it. One district reported that students who transfer into the district as seniors from districts that don’t require MassCore are seldom able to graduate in June.
ESE interviews. One success described by ESE managers is that the MassCore initiative created a discussion in districts with regard to what might constitute a “floor on rigor” for student coursework. The greatest reported challenge was that MassCore completion did not become a statewide graduation requirement, so many districts prioritized other initiatives. In order to promote the initiative, ESE has therefore needed to utilize strategies that are more labor-intensive and apparently less effective in achieving higher completion rates. Many districts have adopted all or part of MassCore during the RTTT funding period, so ESE anticipates that MassCore completion rates will increase in upcoming years.
Strategic considerations (Each is explained in greater detail in the full report.)
• The lack of substantial change observed in statewide MassCore completion rates during the RTTT period might reflect implementation gains being offset by increased accuracy in district reporting, thereby masking actual progress.
• Accuracy of the MassCore indicator would be increased by enabling districts to report alternative ways that students have fulfilled MassCore requirements.
• ESE could leverage its limited MassCore advocacy and support resources by:
o Providing additional online materials that share strategies utilized and lessons learned by districts that have adopted MassCore as a graduation requirement.
o Establishing an official contact in each district who is most knowledgeable about the district’s status, history, and plans related to MassCore implementation.
• Current tracking of school and district progress toward MassCore adoption could be improved, while reducing burden on ESE, via a very brief annual survey of Massachusetts high schools.
RTTT C&CR Evaluation Annual Report, September 2014
UMass Donahue Institute Applied Research and Program Evaluation
x
• Adding one or more codes to the SIMS MassCore element could enable tracking of valid exemptions from MassCore completion.
• In efforts to persuade districts to require MassCore completion, one argument—particularly for high-mobility districts—is that students who transfer into MassCore districts struggle to meet the more stringent requirements and graduate on time.
RTTT C&CR Evaluation Annual Report, September 2014
UMass Donahue Institute Applied Research and Program Evaluation
1
Introduction The Massachusetts Department of Elementary and Secondary Education (ESE) was awarded a federal Race to the Top (RTTT) grant for the years 2010–2014. The college and career readiness (C&CR) components of the grant were designed to help students develop “knowledge and skills necessary for success in postsecondary education and economically viable career pathways.” The RTTT initiatives are intended to provide students with opportunities to participate in quality, upper-level high school coursework and new approaches to assist them with high school completion and transition to higher education and the workforce. These programs are part of a broader effort, as specified in the Delivery Plan of ESE's College and Career Readiness group, to increase the Massachusetts 5-year high school graduation rate to 88.3% and the number of students who complete the MassCore program of study to 85% statewide. The UMass Donahue Institute is conducting an evaluation of three of the C&CR components of the Massachusetts RTTT efforts—the Pre-AP Teacher Training program, the STEM-focused Early College High Schools (ECHS), and the MassCore Policy and Implementation initiative. For each of these three programs, this report provides evaluation findings for the year ending September 30, 2014. This annual report was written as an internal ESE document. Evaluation Questions Evaluation of the RTTT college and career readiness programs encompasses data collection and analysis to facilitate both process and outcome evaluations. The programs are being evaluated both individually and collectively, and the project-wide evaluation questions listed below are tailored to both the individual and collective evaluations. Process Evaluation Questions
P1. In what ways have grantees implemented the program components? What are the major challenges to and facilitators of successful program implementation encountered by grantees? What midcourse corrections and attempts to overcome challenges have been undertaken? What additional steps are planned?
P2. In what ways has ESE implemented the program components described in their grant application? What are the major challenges to and facilitators of program support and facilitation encountered by ESE? How have challenges been overcome and midcourse corrections undertaken? What additional steps are planned?
P3. How do key project stakeholders rate and explain the quality, relevance, and effectiveness of major program components and services?
P4. What infrastructure, systems, and processes were put in place to aid program sustainability during and beyond the grant period? What are the greatest challenges and barriers to creating sustainability?
Outcome Evaluation Questions
O1. What progress is being made toward the two top-priority goals of ESE's CCR Delivery Plan – increasing the 5-year high school graduation rate to 88.3 percent, and increasing the number of students who complete the MassCore program of study to 85.0 percent?
RTTT C&CR Evaluation Annual Report, September 2014
UMass Donahue Institute Applied Research and Program Evaluation
2
O2. To what extent are students in RTTT-funded programs achieving improved outcomes in college and career readiness indicators including graduation, measures of academic achievement (e.g., MCAS, SAT, and AP), participation and success in AP courses and exams, accumulation of high school and college credits, and MassCore completion?
O3. At the school and district levels, do observed changes differ across student characteristics such as gender, race/ethnicity, free/reduced lunch status, ELL status, and special education status? Is there evidence that gaps are narrowing? Are program services reaching students who are at the greatest risk?
O4. To what extent are observed changes in student outcomes attributable to program activities (including combinations of program activities) versus contextual variables or non-RTTT interventions?
O5. What differences in program features, implementation, and contextual variables can be identified across programs whose levels of improvement differ substantially?
O6. What is the relationship between level of program implementation and achievement of targeted student outcomes?
RTTT C&CR Evaluation Annual Report, September 2014
UMass Donahue Institute Applied Research and Program Evaluation
3
Pre-AP Teacher Training Background The aims of the Pre-AP Teacher Training program are to increase the number of low income and minority students prepared to participate and succeed in mathematics, science, and English Advanced Placement courses and credit-bearing college-level coursework; to provide teachers in grades 6–12 with high-quality professional development to assist them in developing curricula, instruction, and assessments that prepare students for AP coursework; and to provide an opportunity for teachers to collaborate in horizontal and vertical teams and to network with other teachers in their region for the purpose of improving curriculum and instruction. Project 4D districts are those that paid for their Pre-AP training and support using RTTT Project 4D funds and who have agreed to send the same teachers for four-day trainings in three consecutive summers, to create vertical teams of teachers, to hold quarterly vertical team meetings, and to have “lead teachers” who organize and run the vertical team meetings and attend an additional training day for lead teachers. Other districts are using RTTT Goal 4A or non-RTTT funds to enroll teachers (hereafter referred to as “non-4D teachers”) in the Pre-AP program, but those districts are not required to commit to vertical teaming and sending teams for multiple years of training. Cohort 1 districts are those that completed their first year of Pre-AP training during the summer of 2011, and cohort 2 districts are those that completed their first year of training during the subsequent school year or summer. The state’s RTTT scope of work indicates that the performance goal for Pre-AP is 1000 teachers trained at the end of the 2011–12, 2012–13, and 2013–14 school years. ESE has clarified that ‘1000’ refers to the total number of summer training participants, whether Project 4D or other, and whether participating for multiple years or just one. So, for example, the goal could be met by 200 teachers who each attend for three summers, plus 400 teachers who only attend for a single summer. The evaluation questions specific to the Pre-AP evaluation are listed below. Process Evaluation Questions P1. In what ways have grantees implemented the Pre-AP program components? What are the major
challenges to and facilitators of successful program implementation encountered by grantees? What mid-course corrections and attempts to overcome challenges have been undertaken? What additional steps are planned?
P2. In what ways has ESE implemented the Pre-AP program components described in their RTTT grant application? What are the major challenges to and facilitators of program support and facilitation encountered by ESE? How have challenges been overcome and mid-course corrections undertaken? What additional steps are planned?
P3. How do Pre-AP program teachers and administrators rate and explain the quality, relevance, and effectiveness of major program components and services?
P4. What infrastructure, systems, and processes were put in place to aid Pre-AP program sustainability during and beyond the grant period? What are the greatest challenges and barriers to creating sustainability?
RTTT C&CR Evaluation Annual Report, September 2014
UMass Donahue Institute Applied Research and Program Evaluation
4
Outcome Evaluation Questions O1. To what extent are students served by the Pre-AP program achieving improved outcomes in college
and career readiness indicators including graduation, participation and success in AP courses and exams, measures of academic achievement (e.g., MCAS, SAT), and MassCore completion?
O2. At the school and district levels, do observed changes in students served by the Pre-AP program differ across student characteristics such as gender, race/ethnicity, free/reduced lunch status, ELL status, and special education status? Is there evidence that gaps are narrowing? Are program services reaching students who are at the greatest risk?
O3. To what extent are observed changes in student outcomes attributable to Pre-AP program activities versus other RTTT program activities and/or measurable contextual variables?
O4. What differences in program features, implementation, and contextual variables can be identified across programs whose levels of improvement differ substantially?
O5. What is the relationship between level of program implementation and achievement of targeted student outcomes?
Methods This report includes information collected from the following data sources:
• Interviews of teachers and administrators. In each of two Project 4D districts, interviews were conducted with the Pre-AP administrator, a Pre-AP lead teacher, and a Pre-AP trained high school teacher (see interview protocols in Appendix A and B). The interviews were conducted on site with one district and by phone with the other district.
• Classroom observations. During the site visit, one of the interviewed teachers was also observed conducting an activity based on the Laying the Foundation (LTF) curriculum materials. Observation notes were based on the “Observable Indicators of Effective LTF Teaching” protocol, adapted by LTF from the UTOP Classroom Observation Protocol (see Appendix C).
• Observations of vertical team meetings. During the site visit, a vertical team meeting was observed (see Appendix D).
• Survey of Pre-AP teachers. An online survey was sent in May 2014 to all Pre-AP teachers who had completed at least one day of training (see Appendix E).
• Vertical team meeting attendance database. UMDI created a form for districts to report attendance and sent them monthly reminders to submit data updates as additional vertical team meetings were conducted.
• Training registration and attendance database. The Pre-AP vendors developed and populated a database that tracked teacher registration for and attendance at Pre-AP training.
• Communications (email, phone, and interview) with the ESE program manager and project director and the technical assistance vendors.
• ESE documents and databases. ESE provided the state’s Student Information Management System (SIMS), Education Personnel Information Management System (EPIMS), Massachusetts Comprehensive Assessment System (MCAS), and Advanced Placement (AP) databases. ESE also provided a list of which districts to designate as Project 4D participants.
RTTT C&CR Evaluation Annual Report, September 2014
UMass Donahue Institute Applied Research and Program Evaluation
5
Categorization of Project 4D Districts Districts are participating in Pre-AP training and implementation in multiple configurations. The configuration proposed by RTTT Project 4D was that districts would create discipline-specific vertical teams of middle school and high school teachers, send those teachers for four-day Pre-AP trainings in three consecutive summers, and assign lead teachers who would receive additional training and lead quarterly meetings of their vertical teams to share and deepen the district’s Pre-AP practices. ESE’s designation of each district’s Project 4D status was used for all analyses regarding the 4D districts. This includes 42 districts, 40 using RTTT Project 4D funds and two using district funds to pay for their Pre-AP training and support. Not all districts designated as Project 4D are following the program configuration described above. UMDI collected data on training duration and the extent of vertical teaming, to enable impact analyses for districts with differing levels of implementation. This will enable UMDI to describe the diverse types of implementation across 4D districts, as well as to investigate levels of program impact in districts with differing levels of implementation. Site Visit Selection and Instruments
Two site visit districts were selected based on criteria of highest priority to ESE: specifically, small Project 4D districts in their second year of implementation with a large number of trained teachers and a high percentage of at-risk or high-need students. Selection criteria also included having submitted vertical team meeting attendance logs for SY14, as one indicator that the district was actively involved with Pre-AP implementation. Conducting site visits to small districts during the 2013–14 school year was intended to enable UMDI to compare findings with the site visits during the previous school year, which were conducted with large Project 4D districts. Data collection focused on two of the three disciplines in which Pre-AP training is offered, mathematics and ELA. The ELA site visit included interviews with an administrator, the lead teacher, and one classroom teacher in ELA, as well as observations of a vertical team meeting and a teacher delivering an LTF lesson. This site visit took place in May 2014. The mathematics site visit was also intended to take place in May 2014; however, by the time the district responded to UMDI’s calls and emails, all of the year’s vertical team meetings had been completed, and the Pre-AP administrator did not think that we would be able to observe a teacher delivering an LTF lesson. The inability to conduct observations would have made an on-site visit less productive, so UMDI conducted the interviews with the administrator, lead teacher, and classroom teacher by phone in June 2014. AP Course and Exam Participation and Success Two of the evaluation questions for the Pre-AP program are:
1. What percentage of “high-needs” students are currently enrolled in AP courses statewide and in each district, by content area?
2. What percentage of “high-needs” students currently score a 3 or better on an AP exam statewide and in each district, by content area?
Consistent with ESE’s definition, “high-needs” students were defined as those who in the current year are limited English proficiency, low income, and/or special education students, or who in the two years prior to the current year were limited English proficiency students (i.e., former English language learners, or FELLs).
RTTT C&CR Evaluation Annual Report, September 2014
UMass Donahue Institute Applied Research and Program Evaluation
6
For the first question, the datasets used were the Student Course Schedule (SCS; 2013) and SIMS (October 2013, plus the two additional two years of SIMS datasets needed to determine student FELL status). The number of unique ELA, mathematics, and science AP course sections offered in each district was identified based on a combination of the SCS course location, course code, and section number. Sections offered at colleges or online were excluded from section counts, but students who completed an AP course online or through a college were included in participant counts. For the second question, the AP (2013) dataset was used in addition to the datasets used for the first question. Only students who had completed an ELA, mathematics, or science AP exam were selected.
Findings Feedback from ESE and Vendors
Vendor transition. UMDI interviewed program managers from ESE and the two Pre-AP program vendors in September 2014. As reported in last year’s annual evaluation report, the Pre-AP program encountered a significant challenge late in the 2012–13 school year, when circumstances arose that prevented Mass Insight Education (MIE), the program vendor until that time, from utilizing the LTF materials and trainings that had been the basis for their Pre-AP work with RTTT districts.1 ESE subsequently cancelled MIE’s contract, because the vendor was no longer able to provide the LTF program, and issued a new request for proposals from prospective vendors. Both MIE and the National Math and Science Initiative (NMSI) submitted proposals, with NMSI proposing to use the LTF materials (which they own), and MIE proposing to design a new program. Both MIE and NMSI were approved as Pre-AP vendors in March 2014 and contacted districts the following month. Districts were given the choice of which vendor to select, or they could select different vendors for different disciplines (e.g., MIE for mathematics, NMSI for science). During summer 2014, NMSI trained teachers from 33 cohort 1 and 2 districts as well as teachers from 6 districts that began Pre-AP training in summer 2013 (N=2) or 2014 (N=4). MIE trained teachers from 25 cohort 1 and 2 districts as well as teachers from 15 districts that began Pre-AP training in summer 2013 (N=3) or 2014 (N=12). ESE reported that the timing of the vendor transition appears to have reduced total program participation, because some districts had already finalized their summer 2014 professional development schedules before the new vendors and summer 2014 training dates were announced. ESE also reported that the program lost momentum in districts that had low internal capacity to support it, which ESE attributed in part to the lack of vendor support during most of the school year. Limited information is available regarding how districts chose whether to work with MIE, NMSI, or both. ESE and the two vendors provided some information on this, based both on their opinions and on information they had heard from program participants. Primary reasons that they offered for districts’ vendor selection included: (a) wanting to stay with LTF—which required switching to NMSI as a
1 In previous RTTT C&CR evaluation reports, MIE has been referred to as “MMSI,” an acronym for the Massachusetts Mathematics + Science Initiative. When describing its work with the Pre-AP program, MMSI now refers to itself as Mass Insight Education (MIE), the name of its parent organization—perhaps to reduce the likelihood of confusion with NMSI, the name of the other vendor. In this report, “MIE” is used when discussing work that MIE conducted subsequent to the events described in the “Vendor Transition” section below, and “MMSI” is used to refer to their work prior to the transition.
RTTT C&CR Evaluation Annual Report, September 2014
UMass Donahue Institute Applied Research and Program Evaluation
7
vendor—because they had liked previous years’ trainings and wanted continued access to LTF materials and supports; (b) selecting MIE because the district was already participating in other MIE initiatives, such as the Advancing STEM AP program; (c) capitalizing on incentives offered by MIE, such as free trainings seats; (d) surveying their teachers and proceeding based on teacher preferences; and (e) confusion about their options and/or the choice they were making. The possible confusion had multiple sources, according to ESE and the vendors. First, districts that wanted to stay with LTF may not have understood that doing so meant switching vendors. Second, ESE reported that the changes in administrative roles in some districts meant that those making the vendor selection decision may have been unfamiliar with the Pre-AP program. Third, the short time period between ESE’s vetting of the two vendors in April and districts’ deadlines for finalizing summer training may have meant that districts were unable to explore their options fully. In emails and an interview with UMDI, ESE program managers expressed substantial dissatisfaction with one of the two vendors’ performance in relation to the summer 2014 trainings and the support materials made available to teachers. UMDI is not currently able to provide systematic feedback relevant to the summer 2014 performance of either vendor, because the trainings occurred after the end of planned data collection activities for the RTTT C&CR evaluation. However, if ESE wished to undertake such an inquiry, components could include:
• Review of ESE’s notes from observations of the summer 2014 trainings.
• Review of the vendors’ activities and resources in relation to the work that was vetted through their vendor proposals.
• Conducting surveys and/or interviews with program participants. Many teachers who attended MIE’s summer 2014 trainings had also attended the LTF-based trainings in previous summers, and could serve as an informative target sample.
Sustainability. The creation of the Pre-AP program was made possible by the large infusion of resources from the RTTT award. ESE and vendors described multiple possible routes for the program and its impacts to continue beyond the RTTT period. First, both MIE and NMSI plan to continue offering their Pre-AP training and materials to Massachusetts districts who identify internal or external resources to pay for those services. Second, some districts have incorporated specific LTF activities into their curricula. Third, ESE and the vendors believe that exposure to the Pre-AP program has shifted some teachers’ pedagogical approaches in ways that will continue beyond RTTT. In some districts, sustainability will likely be challenging, due to insufficient resources to support additional training, as well as the effort required to shift toward Pre-AP pedagogical approaches. MIE’s Pre-AP program manager said:
A lot of districts may have a hard time with what we’ve asked them to do [in terms of customizing their curriculum]. We have some schools that it’s just too much work and takes too much of teachers’ time….so the teachers are [not following through with what we promoted in Pre-AP training]. So we are trying to figure out how to support that follow-up, make things easier to digest, and give those concrete next steps to help it take off. Steps would be providing technical assistance and providing a tool kit that could help facilitate conversations with other teachers.
RTTT C&CR Evaluation Annual Report, September 2014
UMass Donahue Institute Applied Research and Program Evaluation
8
NMSI’s Pre-AP program manager said that some districts have sought other funding, such as from the district, state, or Title I, and also that NMSI is trying to develop ways to make the program more affordable for districts. She reported that the separation from MIE helped NMSI lower costs, because they no longer had to pay MIE as a “middle man” in delivering the LTF trainings and curriculum materials. Finally, ESE reported that some districts are using a train-the-trainer model, in which teachers who received LTF training will train other teachers in the district to implement LTF activities. Teacher and Administrator Interviews Interviews were conducted with administrators and high school Pre-AP trained teachers and lead teachers in two districts. They are referred to below as the “mathematics district” and the “ELA district.” Implementation of LTF activities and assessments. The four teachers interviewed were asked how many LTF activities and assessments they had used during the 2013–14 school year. They reported having conducted from 4–15 LTF lessons. These numbers should not be considered representative of all Pre-AP teachers, because the interviews were conducted with non-randomly selected teachers. However, they do give a sense of implementation for this small sample. One teacher reported that she had conducted 10–15 LTF lessons, some of which were adapted or partial lessons. Another ELA teacher said that she uses LTF strategies 3–4 times per week and adapts them based on the course level. Completion of LTF lessons varied based on the type of LTF lesson, with some lessons described as more worksheet-based and requiring less time to complete, and others described as more product- or project-based and requiring more time to complete. In addition, some lessons were assigned as homework so they did not utilize class time. The two administrators also commented on the number of lessons implemented. The ELA site administrator said that while district documents do not require a specific number of LTF activities to be completed, teachers set goals in the vertical team meetings for how many activities to complete. The mathematics site administrator explained that middle school mathematics has incorporated LTF activities into the curriculum, and that those activities are expected to be implemented by both Pre-AP-trained and untrained teachers. However, the administration does not have accountability measures to track or ensure implementation of these activities. In addition, although LTF activities are not explicitly written into the high school mathematic curriculum, the administrator believes that teachers implement at least one LTF activity per unit, which would be eight LTF activities per year. Similar to last year’s findings, multiple interviewees in the ELA district emphasized that their district is utilizing Pre-AP strategies extensively, even in activities that are not LTF lessons. For example, they have incorporated text annotation and dialectic journals as tools for increasing the depth of students’ knowledge, and they ask students to apply these strategies across grade levels and with a wide range of texts (e.g., fiction, non-fiction, and poetry). Nonetheless, these ELA teachers also reported conducting specific LTF lessons. Teachers reported utilizing LTF assessments much less often than LTF lessons, and none of the teachers have used an LTF assessment in its entirety. However, three of the four teachers have used LTF strategies or certain questions from the LTF assessments in their classroom tests and quizzes. One teacher said, “I try to structure assessments to be like MCAS, so I have multiple choice, short answer, and open responses. I might pull questions from the LTF assessments and piece together questions to create my own assessments.” Another teacher said that she incorporates LTF strategies into her own assessments,
RTTT C&CR Evaluation Annual Report, September 2014
UMass Donahue Institute Applied Research and Program Evaluation
9
such as by presenting students with both factual and investigative questions. She also grades all LTF activities that students complete in class or at home.
Changes to classroom practice. Teachers were asked if they had made changes to their teaching and assessment practices as a result of the Pre-AP training. Both mathematics teachers and one ELA teacher said that they have changed their teaching practices substantially as a result of the training, particularly by taking a more student-centered approach. The three teachers reported that rather than lecturing students, they have students work together and take a more investigative approach. The ELA teacher said that she changed the layout of her classroom from rows to tables of four so that students can work together more effectively. She has also changed the way she assesses her students: “I assess students more on their ability to respond to and complete LTF activities than simply completing a reading quiz. Now, instead of answering factual questions based on what happened in a reading, I’ll ask for explanations, thematic questions, and stylistic questions.”
One mathematics teacher said, “I have definitely made the class more student-centered. I lecture less than I used to and am more hands-on. We are doing more investigations, so the students are coming up with the material on their own, which I learned in the summer training.” The other mathematics teacher said,
I have changed my whole teaching method dramatically. I do a lot of teaching through investigation, so at the beginning of every lesson the students do an exploration or investigation in which they’re making observations and conclusions and developing the concept themselves… After I took the summer training, I decided to change my whole teaching philosophy to a student-centered philosophy. It has really opened my eyes to the higher-level, in-depth types of thinking that students should be doing. We as teachers shouldn’t just be feeding them information.
This mathematics teacher also explained that now, instead of giving the student individual mathematics problems, she gives them a set of questions that require various types of thinking as a means to address one complex mathematics problem. The LTF training taught her different ways to scaffold questions and integrate mathematics methods. She believes that this helps the students gain a deeper understanding of the concepts. Similarly, the ELA teacher reported that LTF training led her to assign more short pieces of writing than before and to use strategies that led students to analyze texts more deeply. The fourth teacher, who did not report having changed her classroom practices, was a seasoned lead teacher and said that she has not made changes other than implementing the LTF lessons. However, she has observed that LTF training has led teachers to collaborate more in preparing lessons. She added that the LTF training has “provided opportunity for collegiality and sharing ideas between teachers, both trained and untrained, which has also been helpful.” All teachers reported that they implement LTF strategies with students at all course levels, not just in honors-level courses. This is similar to findings from last year’s teacher interviews. The primary difference across students of different academic ability levels was the amount of scaffolding and modification of materials necessary, with teachers asking some students or classes to complete a greater number or greater difficulty of items than others, or to do so more independently. One teacher said,
I believe that all classes can benefit from this type of learning; I just differentiate it for different classes. For instance, with my high-level classes I might give them an activity and have them do it on their own. With my lower-level classes, I might scaffold the questions, give more in-depth instructions, or walk the students through it.
RTTT C&CR Evaluation Annual Report, September 2014
UMass Donahue Institute Applied Research and Program Evaluation
10
One ELA teacher, one mathematics teacher, and one administrator reported increases in use of technology (e.g., calculators, probes, spreadsheets) as a result of Pre-AP training. The mathematics teacher reported an increased use of calculators due to the LTF activities and training:
I have increased my use of the TI calculators as a result of the Pre-AP training, because the calculators facilitate a student-centered investigation type of learning. I do calculator labs a lot. When I was doing exponential equations, the students could do so much more with the calculators than without them. Also, the LTF training made me more comfortable with some activities on the calculator that I didn’t know how to do.
The ELA teacher said, “I use my projector much more. I sometimes take LTF activities and project them or project the student’s work so we can all review it together. It allows the class to work better as a group.” The mathematics administrator said that while the district had already used technology extensively in its mathematics courses, the LTF activities increased that further. Of the two teachers and one administrator who did not report an increase in technology use, the ELA teacher and administrator said that their district already used technology extensively prior to the Pre-AP training. The mathematics teacher said that she had already been using a smartboard, and that obtaining a set of graphing calculators would enable her to increase her technology use substantially. The Pre-AP teachers interviewed during the 2012–13 school year also reported access to graphing calculators and other types of technology as a challenge. Structures for promoting implementation. Site visit schools and districts used diverse strategies, ranging from supports to requirements, to promote implementation of Pre-AP activities. While the ELA district has not officially integrated LTF activities into its district curriculum documents, the district administrator said that at vertical team meetings teachers identify 3–5 LTF lessons that they plan to implement, so that the group can review the lessons and discuss their strengths and weaknesses. Implementing the 3–5 lessons is a goal, however, not an explicit requirement. The lead ELA teacher said, “I think if we were required to complete a specific number of LTF lessons, it would cause pushback. Allowing people to have the training and be able to share lessons and try different things allows for flexibility that people seem to enjoy.” This district’s middle school has incorporated LTF lesson implementation into the SMART goals of teachers who have completed Pre-AP training. The mathematics district has a similar structure. One mathematics teacher said, “[The administration] asks us to do LTF activities in class, but it is not enforced. The district does not require teachers to implement a certain number of activities. The Algebra I teachers did include a certain number of LTF activities into their SMART goals, but it is not checked up on.” The other mathematics teacher said,
“In the past couple years, the district has put some activities and LTF lessons in curriculum maps. Some teachers take advantage of it and others don’t. The purpose of putting the lessons into the curriculum map is not to enforce implementation but to provide better access to the activities for all teachers and to create an open learning environment.”
The district administrator said that the middle school has put LTF lessons into the curriculum that both trained and untrained teachers are expected to implement, but implementation is not enforced. Both site visit districts created forums—including vertical team meetings, curriculum meetings, or common planning periods—for teachers to discuss LTF activities they had conducted and share student
RTTT C&CR Evaluation Annual Report, September 2014
UMass Donahue Institute Applied Research and Program Evaluation
11
products from those activities. Successful and unsuccessful activities were both discussed, to help teachers decide which ones to utilize and to help administrators identify activities for possible inclusion in SMART goals. Vertical teams. All teachers and administrators reported advantages and successes of vertical team meetings. Similar to last year’s teachers and administrators, they appreciated the opportunity to spend time with their colleagues, meet colleagues from other schools, share resources, and strategize about how to implement LTF activities effectively. One interviewee said, “Anytime we bring teachers together to discuss curriculum is a positive. The conversations are so rich and a whole new respect between teachers grows.” Another said, “I think vertical team meetings are one of the most valuable pieces of the program. I think the lessons are great for the kids but if the teachers are not talking to each other and looking at the student work that results from it, I think the program itself could dwindle.” Making connections between middle and high school teachers was mentioned by all four teachers and both administrators as a benefit of vertical team meetings, particularly the benefits of understanding each other’s responsibilities and challenges. The meetings facilitated efforts at vertical alignment, as teachers gained increased knowledge of each other’s required curricular content. One teacher said, “It’s nice to speak to teachers in the middle school and discuss the progress of certain students with their previous teachers. It helps us know where the student was when they came to high school and where they should be.” Another teacher said she thinks that freshman have had a stronger start to high school since the vertical team meetings began, because the middle school and high school teachers are now speaking a common language. Other strategies reported as successful included reviewing LTF lessons with both trained and untrained teachers, as well as scheduling time to bring in resources to support LTF work. Both districts invite trained and untrained teachers to the vertical team meetings. Trained teachers share successes and challenges with specific LTF activities and walk other teachers through the activity. The mathematics district also used the vertical team meeting time to bring in a sales representative from Texas Instruments who trained teachers how to use TI graphing calculators and probes. Reported challenges of vertical team meetings included scheduling and content. An administrator and the lead teacher from the ELA district and one teacher from the mathematics district both reported difficulty in scheduling time for vertical team meetings. One lead teacher said, “Usually, everyone who can come does come, but some people have other commitments. If it is an after-school meeting, there are issues with childcare and some people just physically can’t make it.” Another teacher said, “They have to make time for us to meet, which can be difficult, and it becomes a department meeting too—not just a vertical team meeting—because we don’t have time for those during the school year.” Two teachers, one from each district, reported repetition of content as a challenge related to vertical team meetings. One teacher reported that lessons discussed in vertical team meetings may subsequently be implemented by teachers in multiple grade levels, so students may encounter the same LTF lesson in multiple school years. The other teacher reported that the vertical team meetings themselves had become repetitive:
At first it was good to go over the activities, but now it’s like, “We just taught math class for seven hours during the day. We know how to do the math problems. Why are we sitting here doing the math problems again and again and again?” I think it would be
RTTT C&CR Evaluation Annual Report, September 2014
UMass Donahue Institute Applied Research and Program Evaluation
12
better if we spent time creating a calendar for when to implement the lessons, or developing strategies on how to incorporate the lessons into our classrooms.
Lead teachers have primary responsibility for planning and implementing vertical team meetings. One lead teacher said it was her first year as lead teacher and the role was “a bit undefined”. She explained,
We have been doing vertical team meetings for three years, so initially the LTF resources helped plan vertical team meetings by going through the philosophy and the materials. But after the first year, teachers didn’t want to come and do more problems. They wanted to do something different. Now we see LTF as more of a philosophy, and it doesn’t necessarily have to be a problem right from the LTF website. We can take a problem out of the Algebra 2 book and structure it in an LTF manner, so now we don’t know where to go with the vertical team meetings.
This same teacher said she would like to have a MMSI2 representative come to a vertical team meeting and discuss possible next steps, but the district has not been able to make that happen. The lead teacher from the ELA district spoke positively of her experience as a lead teacher. She explained that she enjoys coordinating the meetings, interacting with the middle school, and facilitating deep, rich conversations. During the ELA site visit, UMDI observed a vertical team meeting that was attended by most Pre-AP trained teachers in the district. It was scheduled on a day when students were dismissed early so that teachers could participate in professional development. Teachers shared middle school and high school activities that had been implemented successfully, and almost all teachers appeared to be fully engaged. After about a half hour of this, the lead teacher transitioned the meeting away from Pre-AP and into more general issues related to the English department. Training and technical assistance. Administrators were very pleased with MMSI’s training. One administrator said, “I’ve said many times that this is one of the most valuable PD opportunities our teachers have ever had. They feel great about the lessons, trainings, and have all had positive experiences.” The only challenge this administrator reported about the summer trainings was that they are often in a different part of the state and can be difficult to travel to. The other administrator said that she had attended an administrator training that gave her “a really impressive view of what [MMSI] is actually doing with kids.” The only challenge the ELA administrator reported was that many teachers felt during the first summer of Pre-AP training that they were “read to out of a book that they could have read themselves.” The administrator reported this challenge to MMSI and believes that the issue improved during the second summer of training. The mathematics district administrator was unable to think of any additional resources or training that would increase the school’s level of Pre-AP implementation or effectiveness. The ELA district administrator said,
They always offer the opportunity for administrators to go to some sessions, and I know some of our principals have attended in the summer. It might be beneficial for someone to come and meet with the administrators separately within the district and get them excited, because they’re so busy…I think we could boost their engagement in the program. Maybe they already offer this and I’m not aware of it.
2 As explained earlier, the acronym “MMSI” is used here because the remainder of the Pre-AP section is describing work that was conducted by Mass Insight Education prior to the vendor transition, while they were still using the LTF training and curriculum materials. Work done by MIE subsequent to the vendor transition (i.e., during summer and early fall 2014) and utilizing their new Pre-AP program materials, was not formally evaluated by UMDI.
RTTT C&CR Evaluation Annual Report, September 2014
UMass Donahue Institute Applied Research and Program Evaluation
13
All four teachers also spoke positively of the MMSI summer training, particularly with regard to learning new activities. One teacher said, “I think actually doing the problems [during training] is helpful, because it helps me troubleshoot before doing anything in my class, especially the labs. It helps works out the kinks.” Another teacher said,
It’s nice going through the material over the summer, because I know which activities need to be modified, which are ready to go, and which I’ll actually use. It’s an easy time to sit and do the work, and it’s nice that before implementing the material in class, I am able to actually do the activities.
One teacher also appreciated that the LTF content has evolved to incorporate multimedia elements, saying, “As the modules progressed, the LTF people started using media, music, and video clips. That’s the wave of the teaching future…when you’re looking at someone using music, you think ‘Aw, this is really cool—I want to do it!’” Two teachers reported that the summer training is a positive experience overall and provides useful mutual learning opportunities. One teacher said, “The staff is very welcoming. There is always enough to eat or drink. It’s a nice experience for the teachers.” Another teacher said, “It’s nice to hear what [other teachers] have to say about which activities they use, how they implement them, successes, challenges, and just to share stories.” Teachers differed with regard to the pros and cons of holding Pre-AP trainings in the summer. One teacher preferred summer, because it provided time that would not have been available during the school year to focus on the activities and address any challenges with them. Two other teachers would have preferred for the trainings to be offered during the school year. One of these teachers explained,
If the training was available in the fall, then you’re in the middle of teaching and you have all these new lessons to draw from that you’re excited about. Whereas if you go to training in the summer, you can’t use it, you forget some things, you try to jot down what was good and what page it was on, but I think it’d be much more useful if it was during the year.
Two teachers also found the training days to be too long, while another teacher reported enjoying the full days for a full week, because “you get to really dive into the work.” In addition, two teachers reported challenges with the content of the summer trainings. One teacher said she would like to “spend more of the training time to align LTF activities to the Common Core.” Another teacher believed that the trainings are not as useful for seasoned teachers:
I think facilitators should share the lesson and talk about how to approach it, rather than actually teaching the lessons to the teachers. I find that kind of off-putting…The first summer was terrible, because instead of saying, “Here are some lessons available, and here is how you can do it,” they actually taught it. If you have experienced teachers in the room, share ideas, talk about how they can implement them…They’re good lessons, but if you teach lessons to teachers who already know the material, it’s awful. For some of the younger teachers who haven’t finished their masters, it’s great. They’re excited and are learning a lot. Maybe have a different training for experienced teachers that moves along a little faster.
Two teachers reported that the LTF website is difficult to navigate. One said, “The website is not quick or easy. When searching something, too many options show up and I don’t have enough time to look through them.” In addition, three of the four teachers reported that the availability of LTF activities only
RTTT C&CR Evaluation Annual Report, September 2014
UMass Donahue Institute Applied Research and Program Evaluation
14
as PDFs rather than as Word documents made it difficult to modify and differentiate them for different groups of students.
Vendor. Both districts were asked which of the two vendors they planned to select for their Pre-AP training during summer 2014 and beyond. The ELA district planned to allow teachers to choose which vendor’s training to attend, and she thought that teachers would base their decision primarily on the location of the trainings. The mathematics district explained that they had become a “MMSI district,” which meant that they would be able to participate in both MMSI’s Pre-AP and AP programs, and that additional benefits would include some free seats for Pre-AP training and technical support, AP student workshops, and support in recruiting students to participate in AP courses. The mathematics district administrator said, “When the Race to the Top funds went away and the Pre-AP program became a district-funded program, we didn’t have the funding, and MMSI had the solution for us. The infrastructure and support is there with MMSI.” The district administrator’s understanding was that MIE’s new Pre-AP curriculum would be similar to LTF, but not the same.3 Additional successes. Similar to last year’s findings, all interviewed teachers and administrators had favorable to very favorable feedback about the successes of the Pre-AP program. They felt that it was rigorous, raised expectations for both teachers and students, helped teachers understand how to teach Pre-AP material effectively, led students to deeper thinking and engagement by using high-quality curriculum materials, and raised some students’ confidence level because of the complexity of the material presented. Three of the four teachers said that they would like to see the Pre-AP program expand in their school. All teachers and administrators believed that the Pre-AP program has been successful in increasing students’ readiness for success in AP courses and exams, as well as general college readiness. They reported that LTF activities had provided scaffolding for them to introduce advanced topics and strategies that would be beneficial to students whether or not the students actually took AP courses and exams. One teacher said, “The students learn from day 1 how to think and problem-solve, as opposed to memorizing a formula, which are the skills needed to succeed in an AP course.” Another teacher said, “It makes students look at material in a different way, and has real life applications… It challenges students to explain their work, which will definitely be beneficial later on.” In addition, administrators in both districts reported an increase in AP course enrollment. The ELA administrator said that AP exam scores have improved each year, and the mathematics administrator said, “The numbers will soon show the impact, and I believe there will be a sharp improvement in scores.” Challenges. In addition to the Pre-AP program challenges embedded in the sections above, interviewees reported two additional challenges and strategies currently being used to address them. One reported challenge was district curriculum requirements (e.g., strict curriculum maps and preparation for the MCAS exam) that reduce the time available for LTF activities. One teacher reported that teachers are required to prioritize the curriculum map, and explained, “we fit in LTF activities where we can, but it is difficult.” A second reported challenge was that many students lack mathematics skills that are assumed for many LTF activities. Teachers address this challenge by differentiating instruction, providing additional class time for each lesson, and reviewing foundational skills needed for LTF lessons. The two teachers from the ELA district did not report student academic skills levels as a problem, but they noted that they provide scaffolding and differentiation as needed.
3 This turned out not to be the case, as MIE’s offerings are very different from LTF.
RTTT C&CR Evaluation Annual Report, September 2014
UMass Donahue Institute Applied Research and Program Evaluation
15
Sustainability. Previous sections have described steps that districts have taken toward sustaining the Pre-AP program beyond the RTTT funding period by incorporating LTF activities into curriculum meetings and district curriculum frameworks, having experienced LTF teachers share their knowledge with colleagues, and considering LTF implementation in teacher evaluations. Many of these activities can be implemented at limited expense. A greater challenge will be the expense for districts who want to provide the full three years of Pre-AP training to teachers who did not participate in the RTTT training cohorts. The mathematics district administrator explained,
Funding is always an issue. We’ve got the staffing in place. We have common planning in place. The materials are pretty good, but could be better. It is difficult to find the money for the science teachers because we don’t have Race to the Top funding for their third year of training.
With regard to the aspects of the program that will remain in place, the administrator said,
Hopefully we’ll be able to find additional funds. We have no district funds to commit to the program, but I don’t see any of the program going away. The teachers that have been trained will still use the lessons and try to expand it. I can absolutely assure you the program will not go away just because teachers aren’t being trained anymore. The vertical team meetings may be difficult to maintain. They aren’t fund driven, but I’m not sure the understanding to attend them and keep them going will be in place without the training.
The ELA district administrator was not concerned about finding additional funding to maintain the Pre-AP program, because the current Pre-AP program is already supported by district funds as well as RTTT funds, and district funds had already been allocated for the 2014–15 school year. The administrator said,
I’m responsible for creating the professional development budget, so I have embedded money in there. We know science is only in their second year of training, and we are going to want them to attend a third year, so I just calculate that out and include that in the budget. We would also like some 5th-grade teachers and some special education teachers to participate, so I account for that in the budget, and it has been approved so far.
The ELA administrator also believed that vertical team meetings would continue beyond Race to the Top funding, because she said it is one of the most valuable pieces of the program. Classroom Observation At the ELA site visit, UMDI observed a teacher implementing an LTF lesson and organized the observation by utilizing LTF’s “Observable Indicators of Effective LTF Teaching” protocol. The instrument provides for rating teachers on twelve dimensions in four domains on a 1–5 scale from “Not observed at all/Not demonstrated at all” to “Observed to a great extent/Demonstrated to a great extent.” While the twelve dimensions and four domains were useful for structuring the observation, the scale scores seemed less valid due to the lack of standardizing examples based on instrument norms or wider range of observations. Therefore, the findings are organized according to the four domains: teaching environment, presentation structure, implementation, and subject-specific content and strategies. These findings provide useful information about the implementation of LTF activities, but it is important to keep in mind that they are based on one day in one classroom in one district, and therefore do not
RTTT C&CR Evaluation Annual Report, September 2014
UMass Donahue Institute Applied Research and Program Evaluation
16
represent a sample that is broad or necessarily representative of the many possible subgroupings of teachers and students. In addition, the observed lesson was one day in a multi-day activity, and so not all parts of the teacher’s activities related to the lesson were observable. Last, it was not possible to observe the impacts of the Pre-AP program on teachers’ pedagogical strategies, as teachers were not observed before training occurred. The teacher interviews and surveys conducted in Years 2, 3 and 4 provide more specific information relevant to that question. The English lesson required students to read and annotate a passage taken from Chapter 10 of the book Beloved, by Toni Morrison, and discuss rhetorical strategies, diction patterns, big ideas, and the author’s purpose. The lesson was planned for one full class period, but the class was shortened to accommodate a shortened school day for professional development. As a result, the lesson was rushed and did not allow for deep discussion or exploration. When the bell rang, the teacher seemed surprised and assigned the rest of the lesson for homework. The limitations of the teacher’s pedagogical strategies noted below should be interpreted within the context of the shortened class period.
Teaching environment. The three dimensions of this domain are “Encouraged students to generate ideas, questions, conjectures, and/or propositions that reflected engagement or exploration with important, subject-related topics,” “Teacher behavior fostered interactions that reflected collaborative working relationships among students,” and “Through conversations, interactions with the teacher, and/or work samples, students showed they were intellectually engaged with ideas relevant to the focus of the lesson.” These dimensions were evident in the classroom, but only to a limited extent. The teacher provided an activity that covered several relevant topic areas and used LTF strategies, such as annotating and exploratory questioning. Students were engaged in the activity, but there was limited opportunity to demonstrate this other than through very brief conversations with the teacher and short answers written on a handout. The teacher asked students questions, but the questions and responses brief and did not lead to much discussion. Students sat in groups of four at tables, which facilitated group work. The teacher encouraged students to work together, but the activity was not structured in a way that led to substantive interaction between students.
Presentation structure. The three dimensions of this domain are “The presentation of the material was well-organized and structured,” “The presentation included an inquiry-based approach to important concepts in the subject area and enabled students to construct their own learning,” and “The teacher obtained and implemented resources appropriate for the lesson and displayed an appropriate level of preparedness for teaching.” These dimensions were evident in the classroom. The teacher provided a brief but demanding reading passage and a corresponding worksheet. The worksheet included two clear activities on identifying and understanding diction and rhetorical strategies in an essay, with the essay provided on the front page of the packet. Highlighters were provided for text annotation, a strategy that LTF advocates. The following learning objectives were written on the board for students to see as they entered the classroom: “Objectives: Toni Morrison’s Diction – Mood; Understanding a difficult text.” The worksheet and class discussion included brief investigation of why the author was using a particular word, as well as the word’s impact on the reader.
Implementation. The three dimensions of this domain are “The teacher’s questioning strategies
developed student conceptual understanding of important subject area content,” “The teacher effectively
RTTT C&CR Evaluation Annual Report, September 2014
UMass Donahue Institute Applied Research and Program Evaluation
17
monitored the progress of all students,” and “The teacher’s actions and words reveal flexibility, high levels of energy, self-confidence, and application of LTF’s Belief Statements.” This domain was evident at a moderate level. The English teacher appeared confident and upbeat, and had moderate energy, but did not circulate much to engage with students while they were working. When she did circulate, interactions were minimal. Although she clearly conveyed admiration of the book and the author, her style was only moderately engaging. Many students were not facing her, and did not appear to be drawn into or engaged with the conversation. The teacher’s questioning techniques were limited. When students answered questions, the teacher gave immediate praise or made a simple correction and moved on, without challenging the students to dive deeper. Stronger implementation would have been possible if the activity had been less ambitious for a single class period, and if the activity had been structured in a way that allowed students to work together more collaboratively for 5–10 minutes on parts of the activity. With the shortened class period, there was little time for the teacher to do this effectively.
Subject-specific content and strategies. The three dimensions of this final domain are “Teacher explained to students the reason the content and strategies were important to learn,” “Content communicated by direct and non-direct instruction by the teacher was consistent, with a deep knowledge of and fluency with the subject area concepts of the lesson,” and “Appropriate and meaningful connections were made within the discipline or to other disciplines.” These dimensions were the most difficult to assess in the context of observing only a single class period of each teacher’s instruction, and only one day of a multi-day lesson. While the teacher clearly knew the book and relevant ELA concepts well, the discussion was shallow, possibly due to the shortened class period. Developing meaningful connections across disciplines was not a feature of the lesson, but this may have been implemented as a continued part of the lesson on a different day. The teacher did communicate the reasoning behind the lesson to the students. She explained that if the students are going to take the SAT and AP exams, they will need to read short passages and answer essays based on them, and that the lesson’s goal was to help them develop those skills. Pre-AP Teacher Survey The Pre-AP Teacher Survey (Appendix E) was sent to the 1,770 teachers (1,441 4D and 329 non-4D) who had attended at least one day of Pre-AP training. Email addresses for 63 were non-deliverable, and 23 had opted out of the survey software on previous surveys, so the survey reached 1,684 teachers, with a response rate of 40% (N=675; 535 4D and 140 non-4D).
Teacher background. Respondents were asked to provide their number of years as a certified teacher, and the average was 13 years (range 0 to 40). They were also asked their number of years as a certified teacher in their current school, and the average was 9 years (range 0 to 34). Their primary teaching assignments were: mathematics (39%), English language arts (34%), biology (8%), chemistry (4%), physics (2%), elementary (3%), and other (11%). The majority of teachers reported teaching at multiple grade levels, as shown in the table below, with the largest group of teachers being in the high school grades. For both academic disciplines and grade levels, the total exceeds 100%, because some teachers responded in multiple categories.
RTTT C&CR Evaluation Annual Report, September 2014
UMass Donahue Institute Applied Research and Program Evaluation
18
The grade level of your primary teaching assignment
Survey Item N (%) 4th Grade 4 1
5th Grade 16 2
6th Grade 124 19
7th Grade 136 20
8th Grade 130 19
9th Grade 167 25
10th Grade 213 32
11th Grade 184 28
12th Grade 183 27 Special Education 44 7 Classroom Aide 1 1 ESL Specialist 11 2 Other 22 3
The remaining tables report the responses of 4D and non-4D teachers separately. The narrative part of the text will focus on the 4D responses.
Teacher training. The table below suggests that most survey respondents have been trained for one or two years, based on the definition that being “trained” requires completing at least three days of a given’s year’s training (i.e., part 1, part 2, or part 3). Assuming that those who have completed 3 or 4 days of training have completed part 1, those who have completed 7 or 8 days of training have completed part 2, and those who have completed 11 or 12 days of training have completed part 3, then 75% of Project 4D respondents have completed 1, 2, or 3 years of training.
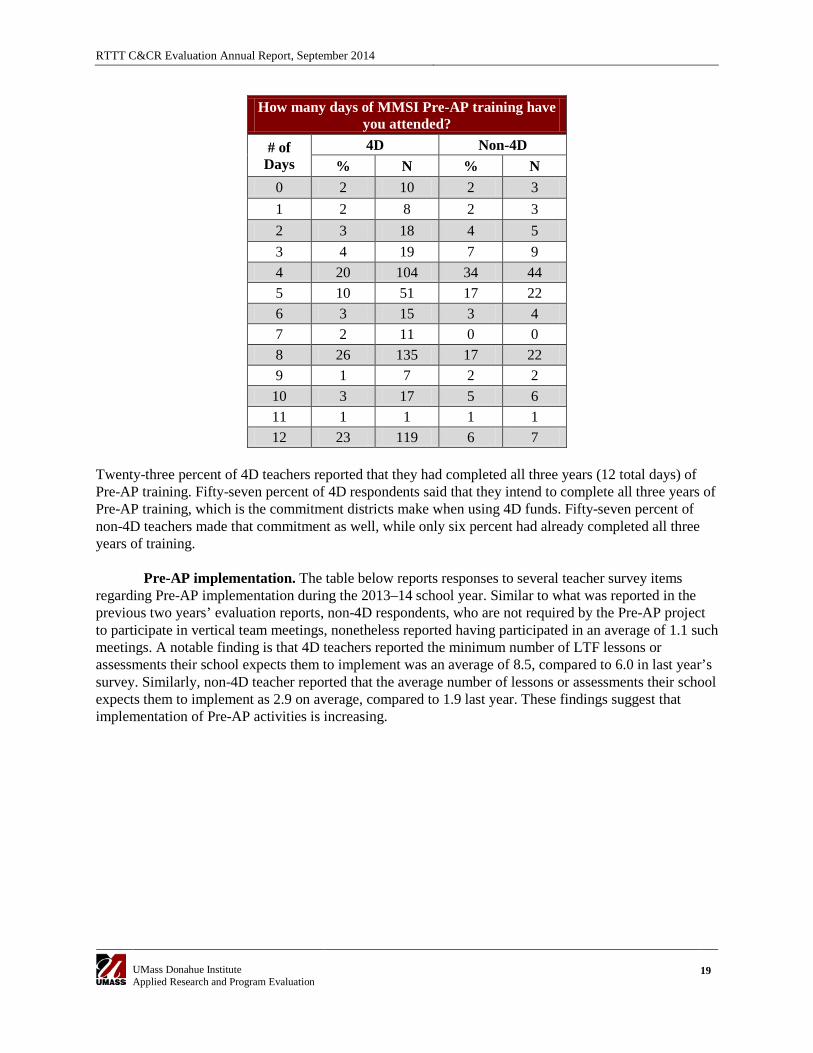
RTTT C&CR Evaluation Annual Report, September 2014
UMass Donahue Institute Applied Research and Program Evaluation
19
How many days of MMSI Pre-AP training have you attended?
# of Days
4D Non-4D % N % N
0 2 10 2 3 1 2 8 2 3 2 3 18 4 5 3 4 19 7 9 4 20 104 34 44 5 10 51 17 22 6 3 15 3 4 7 2 11 0 0 8 26 135 17 22 9 1 7 2 2
10 3 17 5 6 11 1 1 1 1 12 23 119 6 7
Twenty-three percent of 4D teachers reported that they had completed all three years (12 total days) of Pre-AP training. Fifty-seven percent of 4D respondents said that they intend to complete all three years of Pre-AP training, which is the commitment districts make when using 4D funds. Fifty-seven percent of non-4D teachers made that commitment as well, while only six percent had already completed all three years of training.
Pre-AP implementation. The table below reports responses to several teacher survey items regarding Pre-AP implementation during the 2013–14 school year. Similar to what was reported in the previous two years’ evaluation reports, non-4D respondents, who are not required by the Pre-AP project to participate in vertical team meetings, nonetheless reported having participated in an average of 1.1 such meetings. A notable finding is that 4D teachers reported the minimum number of LTF lessons or assessments their school expects them to implement was an average of 8.5, compared to 6.0 in last year’s survey. Similarly, non-4D teacher reported that the average number of lessons or assessments their school expects them to implement as 2.9 on average, compared to 1.9 last year. These findings suggest that implementation of Pre-AP activities is increasing.
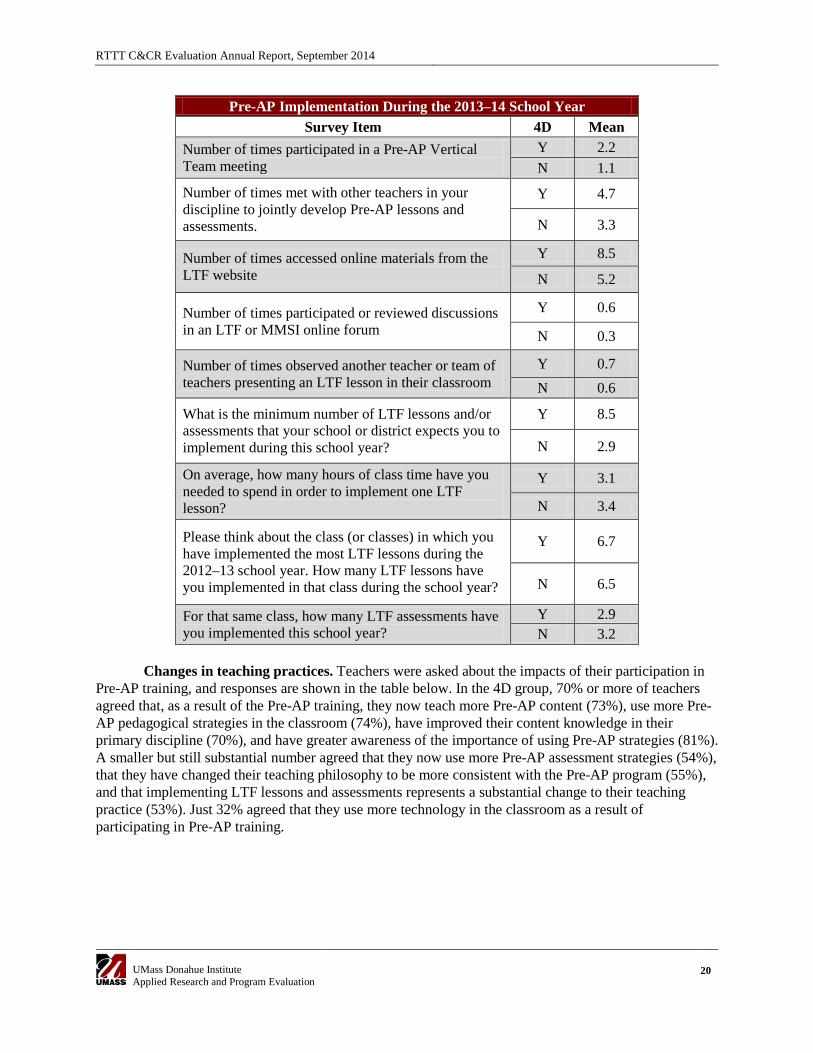
RTTT C&CR Evaluation Annual Report, September 2014
UMass Donahue Institute Applied Research and Program Evaluation
20
Pre-AP Implementation During the 2013–14 School Year Survey Item 4D Mean
Number of times participated in a Pre-AP Vertical Team meeting
Y 2.2 N 1.1
Number of times met with other teachers in your discipline to jointly develop Pre-AP lessons and assessments.
Y 4.7
N 3.3
Number of times accessed online materials from the LTF website
Y 8.5
N 5.2
Number of times participated or reviewed discussions in an LTF or MMSI online forum
Y 0.6
N 0.3
Number of times observed another teacher or team of teachers presenting an LTF lesson in their classroom
Y 0.7 N 0.6
What is the minimum number of LTF lessons and/or assessments that your school or district expects you to implement during this school year?
Y 8.5
N 2.9
On average, how many hours of class time have you needed to spend in order to implement one LTF lesson?
Y 3.1
N 3.4
Please think about the class (or classes) in which you have implemented the most LTF lessons during the 2012–13 school year. How many LTF lessons have you implemented in that class during the school year?
Y 6.7
N 6.5
For that same class, how many LTF assessments have you implemented this school year?
Y 2.9 N 3.2
Changes in teaching practices. Teachers were asked about the impacts of their participation in
Pre-AP training, and responses are shown in the table below. In the 4D group, 70% or more of teachers agreed that, as a result of the Pre-AP training, they now teach more Pre-AP content (73%), use more Pre-AP pedagogical strategies in the classroom (74%), have improved their content knowledge in their primary discipline (70%), and have greater awareness of the importance of using Pre-AP strategies (81%). A smaller but still substantial number agreed that they now use more Pre-AP assessment strategies (54%), that they have changed their teaching philosophy to be more consistent with the Pre-AP program (55%), and that implementing LTF lessons and assessments represents a substantial change to their teaching practice (53%). Just 32% agreed that they use more technology in the classroom as a result of participating in Pre-AP training.
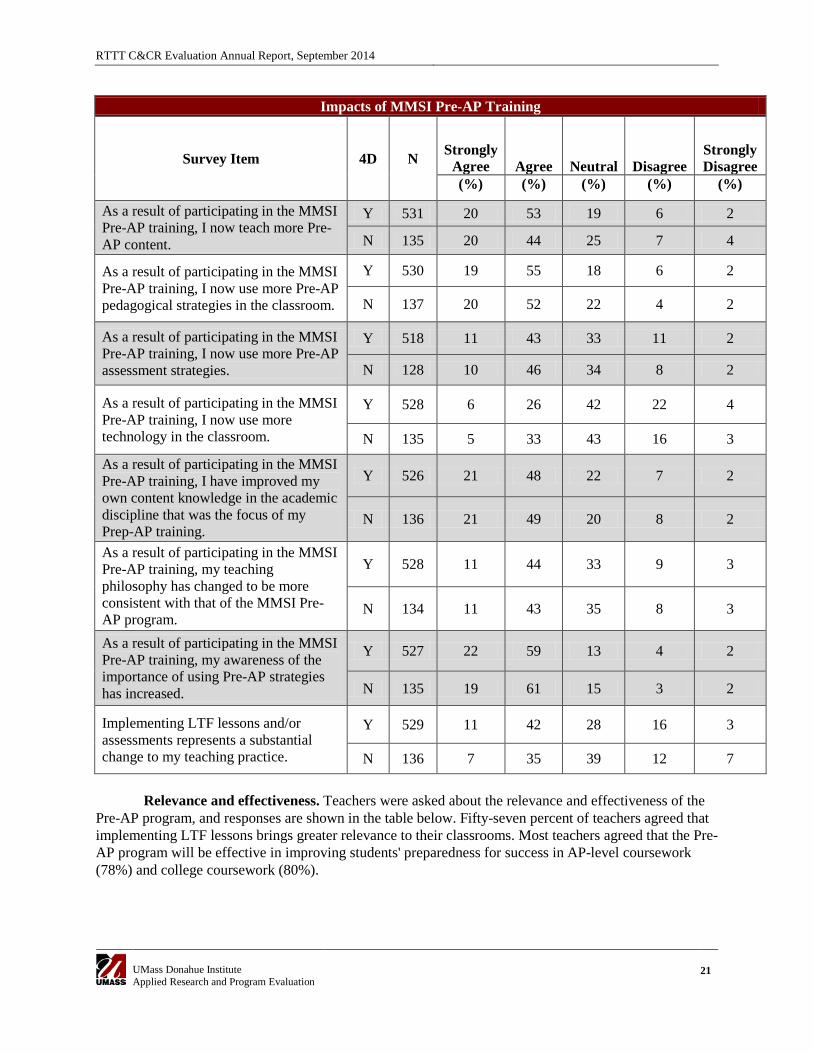
RTTT C&CR Evaluation Annual Report, September 2014
UMass Donahue Institute Applied Research and Program Evaluation
21
Impacts of MMSI Pre-AP Training
Survey Item 4D N Strongly Agree Agree Neutral Disagree
Strongly Disagree
(%) (%) (%) (%) (%)
As a result of participating in the MMSI Pre-AP training, I now teach more Pre-AP content.
Y 531 20 53 19 6 2
N 135 20 44 25 7 4
As a result of participating in the MMSI Pre-AP training, I now use more Pre-AP pedagogical strategies in the classroom.
Y 530 19 55 18 6 2
N 137 20 52 22 4 2
As a result of participating in the MMSI Pre-AP training, I now use more Pre-AP assessment strategies.
Y 518 11 43 33 11 2
N 128 10 46 34 8 2
As a result of participating in the MMSI Pre-AP training, I now use more technology in the classroom.
Y 528 6 26 42 22 4
N 135 5 33 43 16 3
As a result of participating in the MMSI Pre-AP training, I have improved my own content knowledge in the academic discipline that was the focus of my Prep-AP training.
Y 526 21 48 22 7 2
N 136 21 49 20 8 2
As a result of participating in the MMSI Pre-AP training, my teaching philosophy has changed to be more consistent with that of the MMSI Pre-AP program.
Y 528 11 44 33 9 3
N 134 11 43 35 8 3
As a result of participating in the MMSI Pre-AP training, my awareness of the importance of using Pre-AP strategies has increased.
Y 527 22 59 13 4 2
N 135 19 61 15 3 2
Implementing LTF lessons and/or assessments represents a substantial change to my teaching practice.
Y 529 11 42 28 16 3
N 136 7 35 39 12 7
Relevance and effectiveness. Teachers were asked about the relevance and effectiveness of the
Pre-AP program, and responses are shown in the table below. Fifty-seven percent of teachers agreed that implementing LTF lessons brings greater relevance to their classrooms. Most teachers agreed that the Pre-AP program will be effective in improving students' preparedness for success in AP-level coursework (78%) and college coursework (80%).
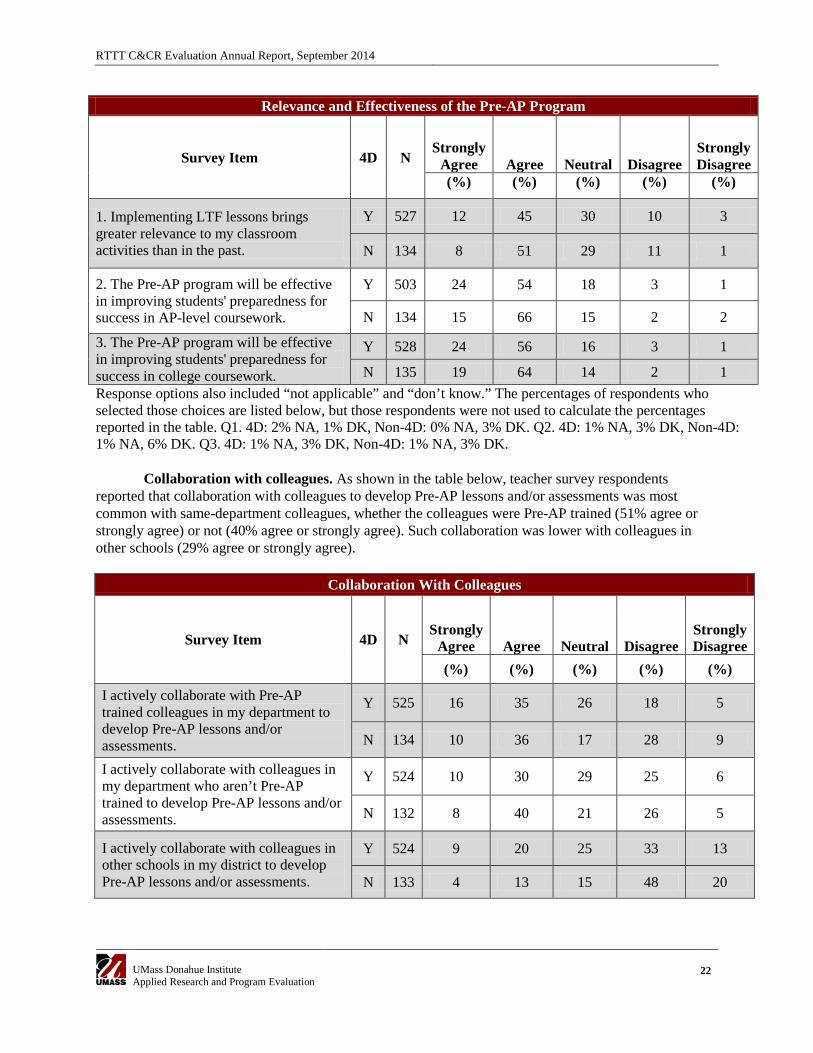
RTTT C&CR Evaluation Annual Report, September 2014
UMass Donahue Institute Applied Research and Program Evaluation
22
Relevance and Effectiveness of the Pre-AP Program
Survey Item 4D N Strongly
Agree Agree Neutral Disagree Strongly Disagree
(%) (%) (%) (%) (%)
1. Implementing LTF lessons brings greater relevance to my classroom activities than in the past.
Y 527 12 45 30 10 3
N 134 8 51 29 11 1
2. The Pre-AP program will be effective in improving students' preparedness for success in AP-level coursework.
Y 503 24 54 18 3 1
N 134 15 66 15 2 2
3. The Pre-AP program will be effective in improving students' preparedness for success in college coursework.
Y 528 24 56 16 3 1
N 135 19 64 14 2 1 Response options also included “not applicable” and “don’t know.” The percentages of respondents who selected those choices are listed below, but those respondents were not used to calculate the percentages reported in the table. Q1. 4D: 2% NA, 1% DK, Non-4D: 0% NA, 3% DK. Q2. 4D: 1% NA, 3% DK, Non-4D: 1% NA, 6% DK. Q3. 4D: 1% NA, 3% DK, Non-4D: 1% NA, 3% DK.
Collaboration with colleagues. As shown in the table below, teacher survey respondents
reported that collaboration with colleagues to develop Pre-AP lessons and/or assessments was most common with same-department colleagues, whether the colleagues were Pre-AP trained (51% agree or strongly agree) or not (40% agree or strongly agree). Such collaboration was lower with colleagues in other schools (29% agree or strongly agree).
Collaboration With Colleagues
Survey Item 4D N Strongly
Agree Agree Neutral Disagree Strongly Disagree
(%) (%) (%) (%) (%)
I actively collaborate with Pre-AP trained colleagues in my department to develop Pre-AP lessons and/or assessments.
Y 525 16 35 26 18 5
N 134 10 36 17 28 9
I actively collaborate with colleagues in my department who aren’t Pre-AP trained to develop Pre-AP lessons and/or assessments.
Y 524 10 30 29 25 6
N 132 8 40 21 26 5
I actively collaborate with colleagues in other schools in my district to develop Pre-AP lessons and/or assessments.
Y 524 9 20 25 33 13
N 133 4 13 15 48 20
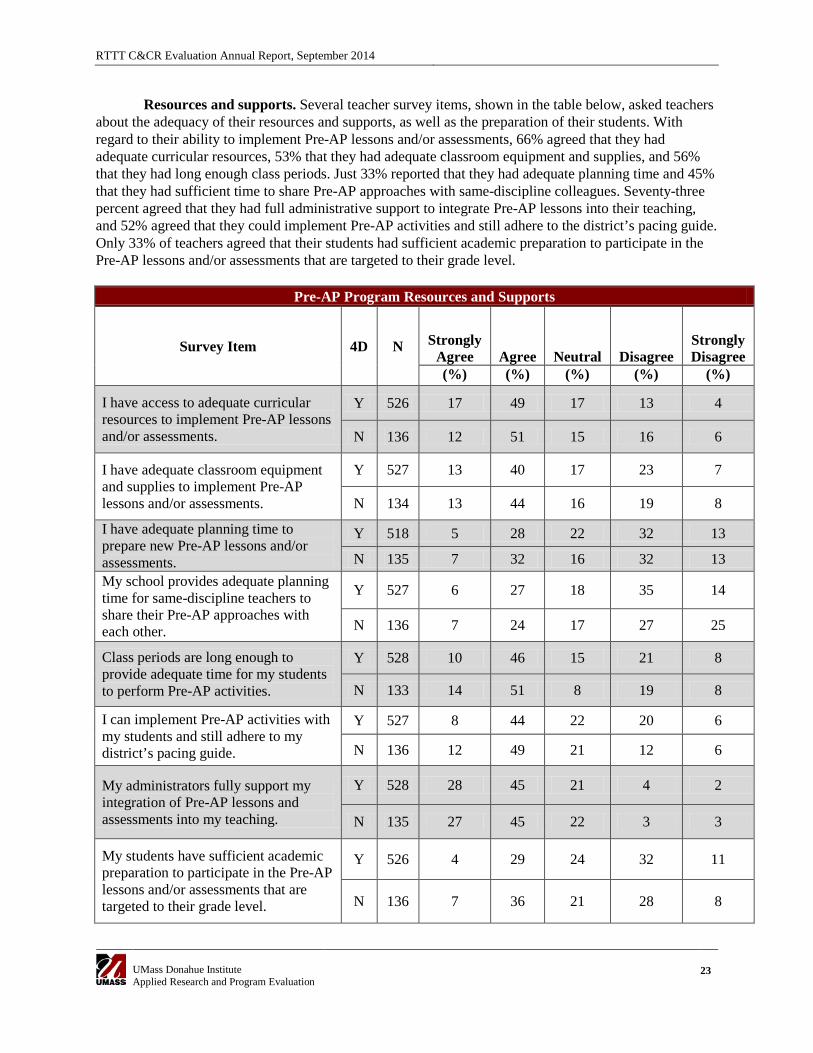
RTTT C&CR Evaluation Annual Report, September 2014
UMass Donahue Institute Applied Research and Program Evaluation
23
Resources and supports. Several teacher survey items, shown in the table below, asked teachers about the adequacy of their resources and supports, as well as the preparation of their students. With regard to their ability to implement Pre-AP lessons and/or assessments, 66% agreed that they had adequate curricular resources, 53% that they had adequate classroom equipment and supplies, and 56% that they had long enough class periods. Just 33% reported that they had adequate planning time and 45% that they had sufficient time to share Pre-AP approaches with same-discipline colleagues. Seventy-three percent agreed that they had full administrative support to integrate Pre-AP lessons into their teaching, and 52% agreed that they could implement Pre-AP activities and still adhere to the district’s pacing guide. Only 33% of teachers agreed that their students had sufficient academic preparation to participate in the Pre-AP lessons and/or assessments that are targeted to their grade level.
Pre-AP Program Resources and Supports
Survey Item 4D N Strongly Agree Agree Neutral Disagree
Strongly Disagree
(%) (%) (%) (%) (%)
I have access to adequate curricular resources to implement Pre-AP lessons and/or assessments.
Y 526 17 49 17 13 4
N 136 12 51 15 16 6
I have adequate classroom equipment and supplies to implement Pre-AP lessons and/or assessments.
Y 527 13 40 17 23 7
N 134 13 44 16 19 8
I have adequate planning time to prepare new Pre-AP lessons and/or assessments.
Y 518 5 28 22 32 13
N 135 7 32 16 32 13 My school provides adequate planning time for same-discipline teachers to share their Pre-AP approaches with each other.
Y 527 6 27 18 35 14
N 136 7 24 17 27 25
Class periods are long enough to provide adequate time for my students to perform Pre-AP activities.
Y 528 10 46 15 21 8
N 133 14 51 8 19 8
I can implement Pre-AP activities with my students and still adhere to my district’s pacing guide.
Y 527 8 44 22 20 6
N 136 12 49 21 12 6
My administrators fully support my integration of Pre-AP lessons and assessments into my teaching.
Y 528 28 45 21 4 2
N 135 27 45 22 3 3
My students have sufficient academic preparation to participate in the Pre-AP lessons and/or assessments that are targeted to their grade level.
Y 526 4 29 24 32 11
N 136 7 36 21 28 8
RTTT C&CR Evaluation Annual Report, September 2014
UMass Donahue Institute Applied Research and Program Evaluation
24
Challenges to Implementation. Participants were asked to identify challenges to implementing the Pre-AP lessons and assessments. Thirty-one percent of participants responded (N=207). The most common challenges were student readiness (N=58) and time (N=52). Challenges with student readiness were related to language barriers, ability to focus, mastery of foundational skills, and behavioral issues. Specific responses include:
• The majority of my students do not read at a 6th-grade level, which makes implementation of pre-AP labs exceedingly difficult. The LTF labs that I have implemented without modification have been true struggles due to reading issues, procedure following issues, and difficulty understanding the conclusion questions. I have modified other labs to significantly reduce the reading burden, but this defeats the purpose of Pre-AP curriculum, right?
• The diverse needs of the student population make it difficult in a classroom that is not leveled. Also most of these lessons incorporate multiple standards, when students have not received adequate pre-teaching of only one standard.
• My students have significant behavioral challenges and in many cases a lack of the maturity required to complete these tasks without small group instructional support.
• Most of the regular level students lack the attention, background, and concentration required to complete an activity in a reasonable amount of time.
Planning time and class length are also significant challenges to implementing LTF lessons and activities. One respondent simply said, “I only have my students for 42 minutes a day.” Other responses include:
• Most of my students are not ‘Pre-AP,’ and the lessons are too difficult. A few are okay, but doing the amount that is suggested causes us to miss other important parts of the curriculum due to lack of time.
• Time is the biggest constraint. Common Core is much more aggressive and rigorous—it's difficult to cover the material—would love a little more time to include Pre-AP. Is there a guide of key pieces to implement each year?
• The preparation for Pre-AP depends on the class. Sometimes the lessons must be modified to the point where too much is lost. I try to implement any Pre-AP lessons in ALL of my classes, but it is sometimes incredibly difficult and much more time consuming that one would think. Scaffolding these lessons can be very time consuming.
Lack of resources, particularly technology resources, is also a challenge for teachers. Several teachers mentioned a lack of equipment (e.g., LCD projector, document camera, calculators), poor Internet access, and too few computers. One teacher said,
Many of the labs require labquests, graphing calculators, carts, tracks, and motion sensors, which I don't have. My school also doesn't have the budget right now to purchase all this expensive equipment for a whole class, and I don't think that doing a demo and having them take data is necessarily as valuable to the students. I'd rather do less technology-dependent labs that they can do themselves instead, because it's more meaningful and memorable for them.
With regard to the LTF online platform, one teacher said, “Having only PDF versions of the activities is a barrier. Documents should be editable. Teacher versions and student versions should be separate
RTTT C&CR Evaluation Annual Report, September 2014
UMass Donahue Institute Applied Research and Program Evaluation
25
documents. Hyperlinks often don't work or are out of date.” Last, with regard to vendor support as a resource, one participant said,
The support for administrators and team leaders from MMSI was minimal at best. The trainings for team leaders were not well presented. Though there are a number of paper and online resources available for teachers, the guidance regarding and examples of work to be done, especially training for Pre-AP team leaders, was not adequate. There was little to no follow up from the trainings. Basically leaders were left adrift. My pre-AP teachers have implemented a number of relevant activities but found that the assessments were weak (short, minimal) and not always relevant to the Common Core standards and unit plans we need to follow.
Other challenges reported include: adapting lessons was time-consuming and inconvenient, especially with only PDF versions (N=21); difficult to implement LTF lessons with a tight curriculum map (N=16); difficult to implement LTF lessons when the focus is on standardized testing (N=5); ineffective training from the vendor (N=9); and weak teacher buy-in (N=14).
Alignment, scaffolding, and differentiation. As seen on the table on the following page, 84
percent of teachers agreed that the LTF curriculum is well aligned with the Common Core standards, 82 percent of teachers agreed that the connections between the LTF curriculum and the Common Core are well specified, and 86 percent of teachers agreed that the LTF lessons and assessments are examples of high-quality pedagogical practices in their content area. With regard to scaffolding, 78 percent of teachers agreed that they needed to create supplemental activities to introduce or otherwise scaffold aspects of LTF lessons, and 57 percent agreed that the discussion of scaffolding during summer training supported their implementation of LTF lessons and assessments. More than half of the teachers (57 percent) agreed that the LTF lessons and assessments provide appropriate supports for differentiation for students across a wide range of skill levels.
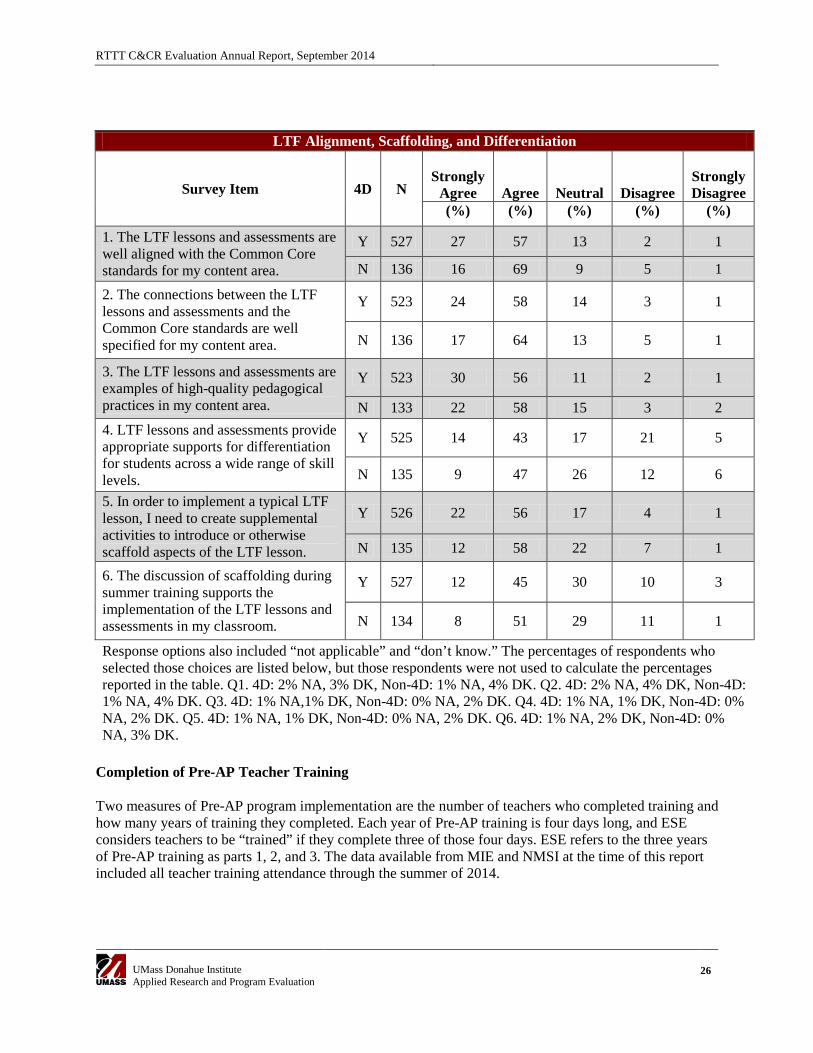
RTTT C&CR Evaluation Annual Report, September 2014
UMass Donahue Institute Applied Research and Program Evaluation
26
LTF Alignment, Scaffolding, and Differentiation
Survey Item 4D N Strongly
Agree Agree Neutral Disagree Strongly Disagree
(%) (%) (%) (%) (%)
1. The LTF lessons and assessments are well aligned with the Common Core standards for my content area.
Y 527 27 57 13 2 1
N 136 16 69 9 5 1
2. The connections between the LTF lessons and assessments and the Common Core standards are well specified for my content area.
Y 523 24 58 14 3 1
N 136 17 64 13 5 1
3. The LTF lessons and assessments are examples of high-quality pedagogical practices in my content area.
Y 523 30 56 11 2 1
N 133 22 58 15 3 2 4. LTF lessons and assessments provide appropriate supports for differentiation for students across a wide range of skill levels.
Y 525 14 43 17 21 5
N 135 9 47 26 12 6
5. In order to implement a typical LTF lesson, I need to create supplemental activities to introduce or otherwise scaffold aspects of the LTF lesson.
Y 526 22 56 17 4 1
N 135 12 58 22 7 1
6. The discussion of scaffolding during summer training supports the implementation of the LTF lessons and assessments in my classroom.
Y 527 12 45 30 10 3
N 134 8 51 29 11 1
Response options also included “not applicable” and “don’t know.” The percentages of respondents who selected those choices are listed below, but those respondents were not used to calculate the percentages reported in the table. Q1. 4D: 2% NA, 3% DK, Non-4D: 1% NA, 4% DK. Q2. 4D: 2% NA, 4% DK, Non-4D: 1% NA, 4% DK. Q3. 4D: 1% NA,1% DK, Non-4D: 0% NA, 2% DK. Q4. 4D: 1% NA, 1% DK, Non-4D: 0% NA, 2% DK. Q5. 4D: 1% NA, 1% DK, Non-4D: 0% NA, 2% DK. Q6. 4D: 1% NA, 2% DK, Non-4D: 0% NA, 3% DK.
Completion of Pre-AP Teacher Training Two measures of Pre-AP program implementation are the number of teachers who completed training and how many years of training they completed. Each year of Pre-AP training is four days long, and ESE considers teachers to be “trained” if they complete three of those four days. ESE refers to the three years of Pre-AP training as parts 1, 2, and 3. The data available from MIE and NMSI at the time of this report included all teacher training attendance through the summer of 2014.
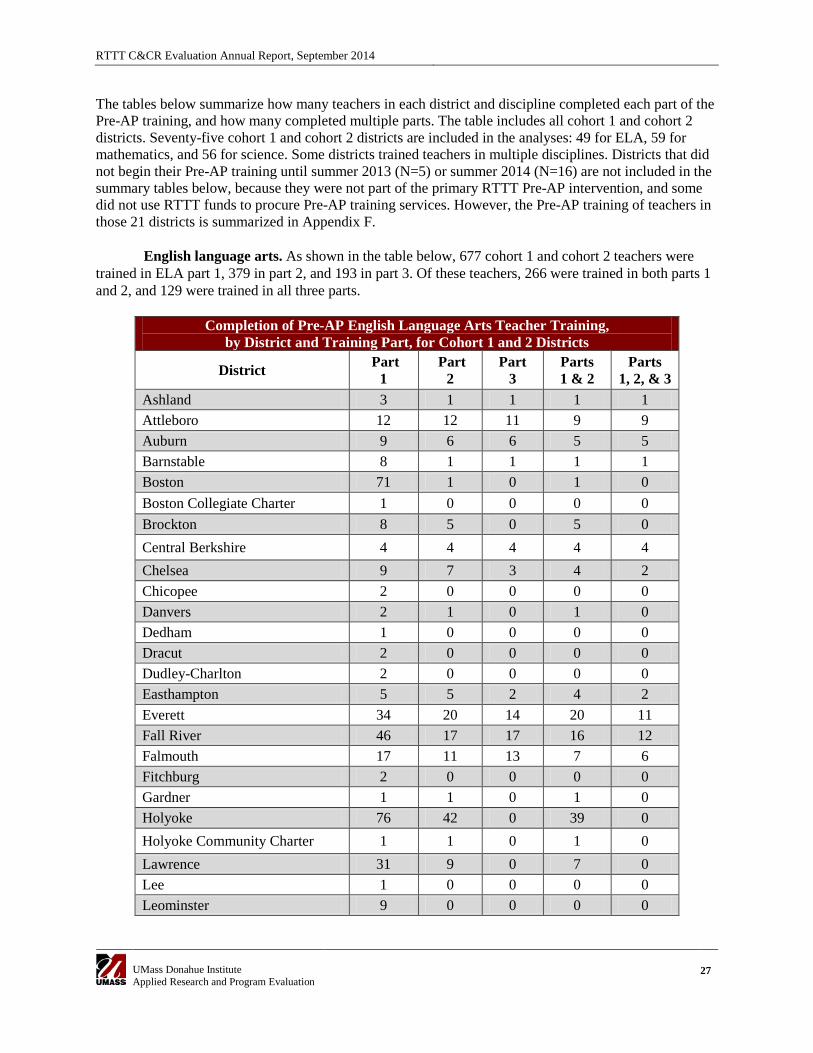
RTTT C&CR Evaluation Annual Report, September 2014
UMass Donahue Institute Applied Research and Program Evaluation
27
The tables below summarize how many teachers in each district and discipline completed each part of the Pre-AP training, and how many completed multiple parts. The table includes all cohort 1 and cohort 2 districts. Seventy-five cohort 1 and cohort 2 districts are included in the analyses: 49 for ELA, 59 for mathematics, and 56 for science. Some districts trained teachers in multiple disciplines. Districts that did not begin their Pre-AP training until summer 2013 (N=5) or summer 2014 (N=16) are not included in the summary tables below, because they were not part of the primary RTTT Pre-AP intervention, and some did not use RTTT funds to procure Pre-AP training services. However, the Pre-AP training of teachers in those 21 districts is summarized in Appendix F. English language arts. As shown in the table below, 677 cohort 1 and cohort 2 teachers were trained in ELA part 1, 379 in part 2, and 193 in part 3. Of these teachers, 266 were trained in both parts 1 and 2, and 129 were trained in all three parts.
Completion of Pre-AP English Language Arts Teacher Training, by District and Training Part, for Cohort 1 and 2 Districts
District Part 1
Part 2
Part 3
Parts 1 & 2
Parts 1, 2, & 3
Ashland 3 1 1 1 1 Attleboro 12 12 11 9 9 Auburn 9 6 6 5 5 Barnstable 8 1 1 1 1 Boston 71 1 0 1 0 Boston Collegiate Charter 1 0 0 0 0 Brockton 8 5 0 5 0 Central Berkshire 4 4 4 4 4 Chelsea 9 7 3 4 2 Chicopee 2 0 0 0 0 Danvers 2 1 0 1 0 Dedham 1 0 0 0 0 Dracut 2 0 0 0 0 Dudley-Charlton 2 0 0 0 0 Easthampton 5 5 2 4 2 Everett 34 20 14 20 11 Fall River 46 17 17 16 12 Falmouth 17 11 13 7 6 Fitchburg 2 0 0 0 0 Gardner 1 1 0 1 0 Holyoke 76 42 0 39 0 Holyoke Community Charter 1 1 0 1 0 Lawrence 31 9 0 7 0 Lee 1 0 0 0 0 Leominster 9 0 0 0 0
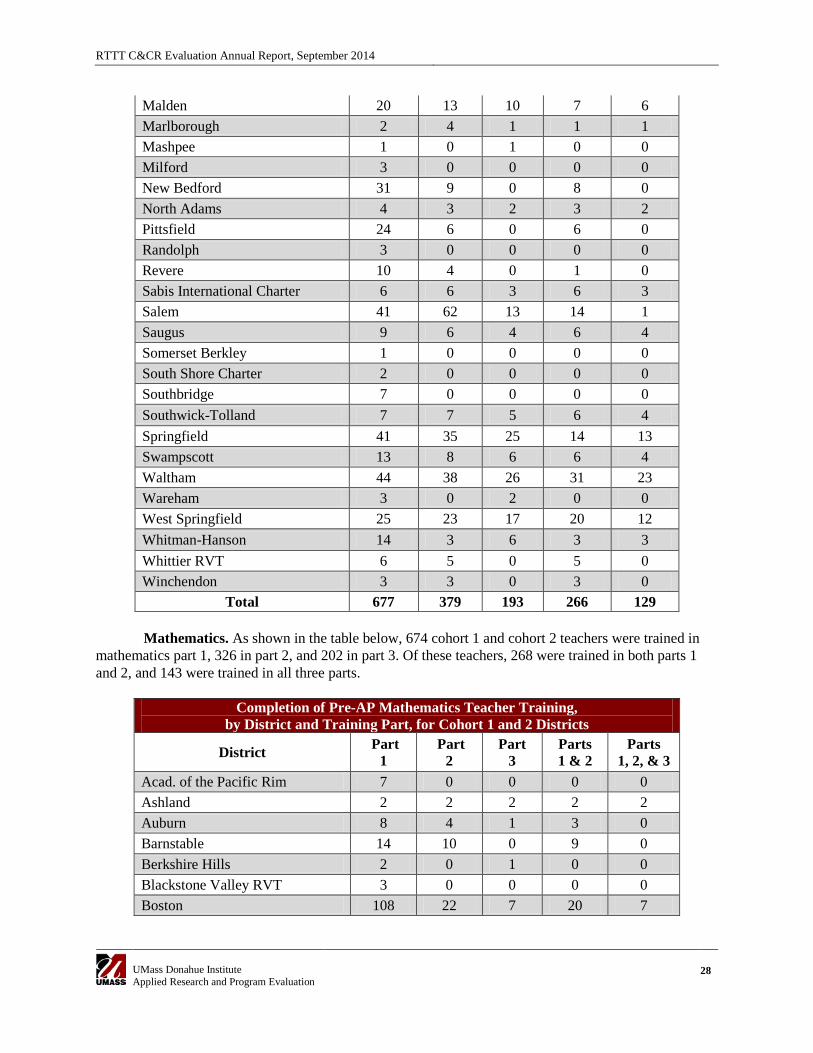
RTTT C&CR Evaluation Annual Report, September 2014
UMass Donahue Institute Applied Research and Program Evaluation
28
Malden 20 13 10 7 6 Marlborough 2 4 1 1 1 Mashpee 1 0 1 0 0 Milford 3 0 0 0 0 New Bedford 31 9 0 8 0 North Adams 4 3 2 3 2 Pittsfield 24 6 0 6 0 Randolph 3 0 0 0 0 Revere 10 4 0 1 0 Sabis International Charter 6 6 3 6 3 Salem 41 62 13 14 1 Saugus 9 6 4 6 4 Somerset Berkley 1 0 0 0 0 South Shore Charter 2 0 0 0 0 Southbridge 7 0 0 0 0 Southwick-Tolland 7 7 5 6 4 Springfield 41 35 25 14 13 Swampscott 13 8 6 6 4 Waltham 44 38 26 31 23 Wareham 3 0 2 0 0 West Springfield 25 23 17 20 12 Whitman-Hanson 14 3 6 3 3 Whittier RVT 6 5 0 5 0 Winchendon 3 3 0 3 0
Total 677 379 193 266 129
Mathematics. As shown in the table below, 674 cohort 1 and cohort 2 teachers were trained in mathematics part 1, 326 in part 2, and 202 in part 3. Of these teachers, 268 were trained in both parts 1 and 2, and 143 were trained in all three parts.
Completion of Pre-AP Mathematics Teacher Training, by District and Training Part, for Cohort 1 and 2 Districts
District Part 1
Part 2
Part 3
Parts 1 & 2
Parts 1, 2, & 3
Acad. of the Pacific Rim 7 0 0 0 0 Ashland 2 2 2 2 2 Auburn 8 4 1 3 0 Barnstable 14 10 0 9 0 Berkshire Hills 2 0 1 0 0 Blackstone Valley RVT 3 0 0 0 0 Boston 108 22 7 20 7
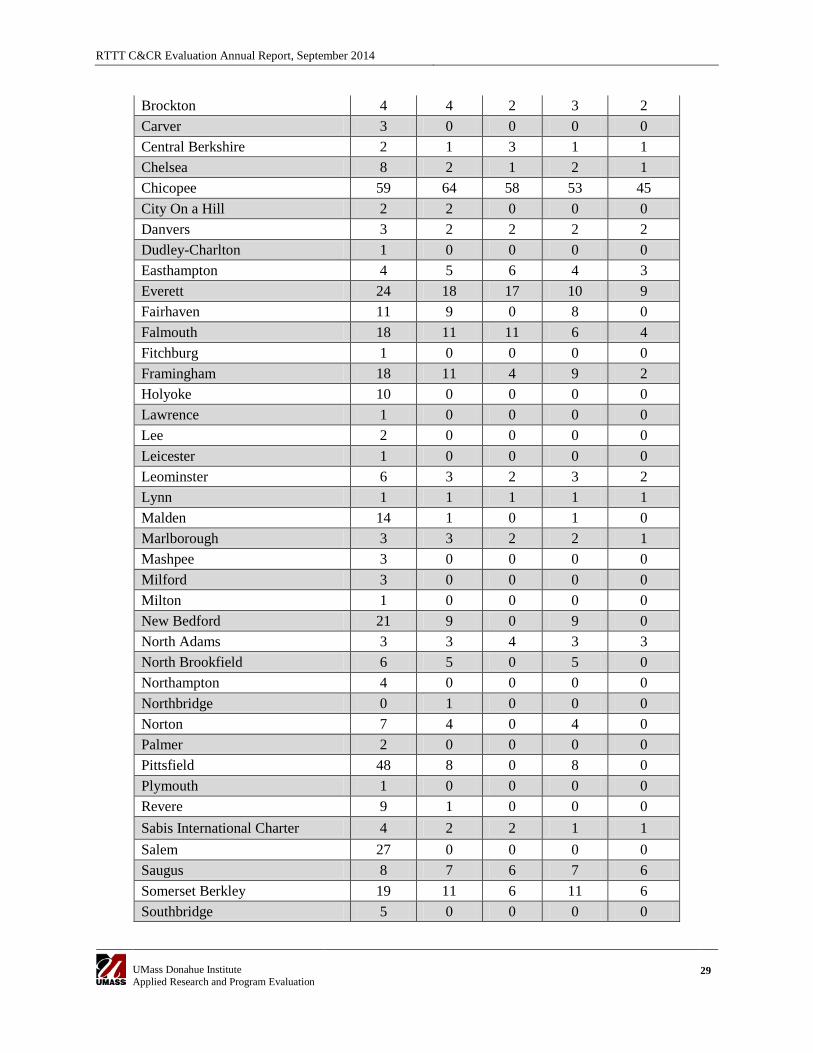
RTTT C&CR Evaluation Annual Report, September 2014
UMass Donahue Institute Applied Research and Program Evaluation
29
Brockton 4 4 2 3 2 Carver 3 0 0 0 0 Central Berkshire 2 1 3 1 1 Chelsea 8 2 1 2 1 Chicopee 59 64 58 53 45 City On a Hill 2 2 0 0 0 Danvers 3 2 2 2 2 Dudley-Charlton 1 0 0 0 0 Easthampton 4 5 6 4 3 Everett 24 18 17 10 9 Fairhaven 11 9 0 8 0 Falmouth 18 11 11 6 4 Fitchburg 1 0 0 0 0 Framingham 18 11 4 9 2 Holyoke 10 0 0 0 0 Lawrence 1 0 0 0 0 Lee 2 0 0 0 0 Leicester 1 0 0 0 0 Leominster 6 3 2 3 2 Lynn 1 1 1 1 1 Malden 14 1 0 1 0 Marlborough 3 3 2 2 1 Mashpee 3 0 0 0 0 Milford 3 0 0 0 0 Milton 1 0 0 0 0 New Bedford 21 9 0 9 0 North Adams 3 3 4 3 3 North Brookfield 6 5 0 5 0 Northampton 4 0 0 0 0 Northbridge 0 1 0 0 0 Norton 7 4 0 4 0 Palmer 2 0 0 0 0 Pittsfield 48 8 0 8 0 Plymouth 1 0 0 0 0 Revere 9 1 0 0 0 Sabis International Charter 4 2 2 1 1 Salem 27 0 0 0 0 Saugus 8 7 6 7 6 Somerset Berkley 19 11 6 11 6 Southbridge 5 0 0 0 0
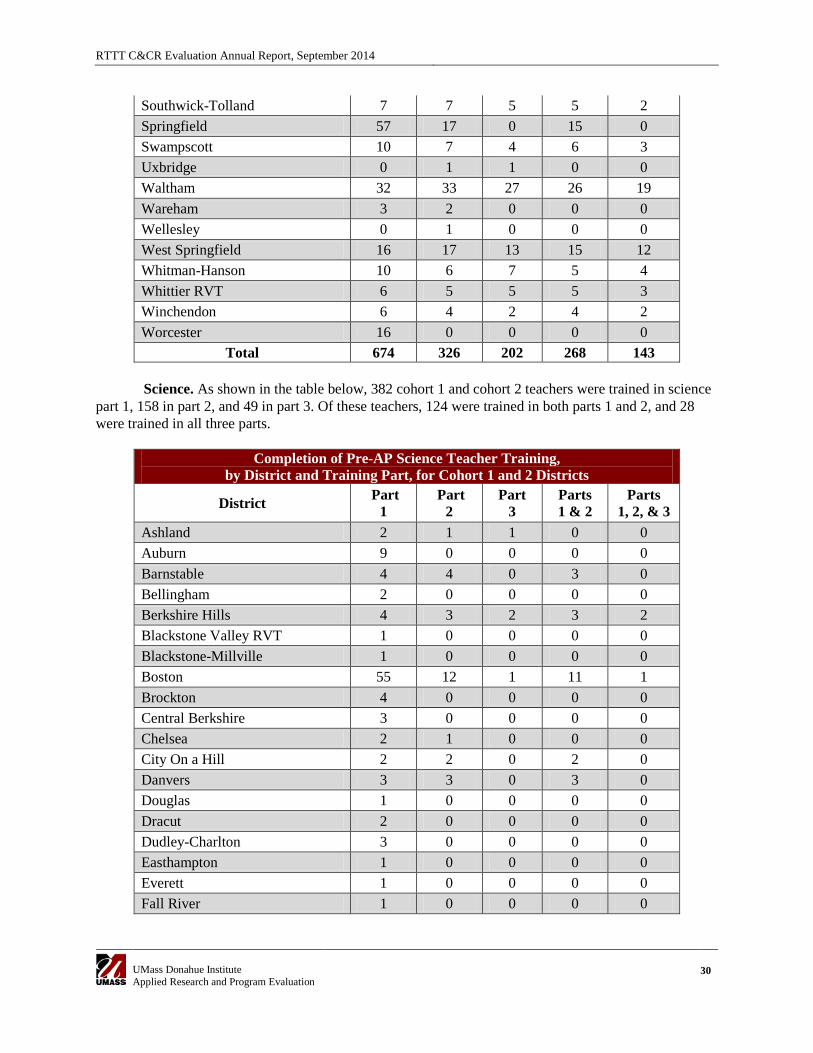
RTTT C&CR Evaluation Annual Report, September 2014
UMass Donahue Institute Applied Research and Program Evaluation
30
Southwick-Tolland 7 7 5 5 2 Springfield 57 17 0 15 0 Swampscott 10 7 4 6 3 Uxbridge 0 1 1 0 0 Waltham 32 33 27 26 19 Wareham 3 2 0 0 0 Wellesley 0 1 0 0 0 West Springfield 16 17 13 15 12 Whitman-Hanson 10 6 7 5 4 Whittier RVT 6 5 5 5 3 Winchendon 6 4 2 4 2 Worcester 16 0 0 0 0
Total 674 326 202 268 143
Science. As shown in the table below, 382 cohort 1 and cohort 2 teachers were trained in science part 1, 158 in part 2, and 49 in part 3. Of these teachers, 124 were trained in both parts 1 and 2, and 28 were trained in all three parts.
Completion of Pre-AP Science Teacher Training, by District and Training Part, for Cohort 1 and 2 Districts
District Part 1
Part 2
Part 3
Parts 1 & 2
Parts 1, 2, & 3
Ashland 2 1 1 0 0 Auburn 9 0 0 0 0 Barnstable 4 4 0 3 0 Bellingham 2 0 0 0 0 Berkshire Hills 4 3 2 3 2 Blackstone Valley RVT 1 0 0 0 0 Blackstone-Millville 1 0 0 0 0 Boston 55 12 1 11 1 Brockton 4 0 0 0 0 Central Berkshire 3 0 0 0 0 Chelsea 2 1 0 0 0 City On a Hill 2 2 0 2 0 Danvers 3 3 0 3 0 Douglas 1 0 0 0 0 Dracut 2 0 0 0 0 Dudley-Charlton 3 0 0 0 0 Easthampton 1 0 0 0 0 Everett 1 0 0 0 0 Fall River 1 0 0 0 0
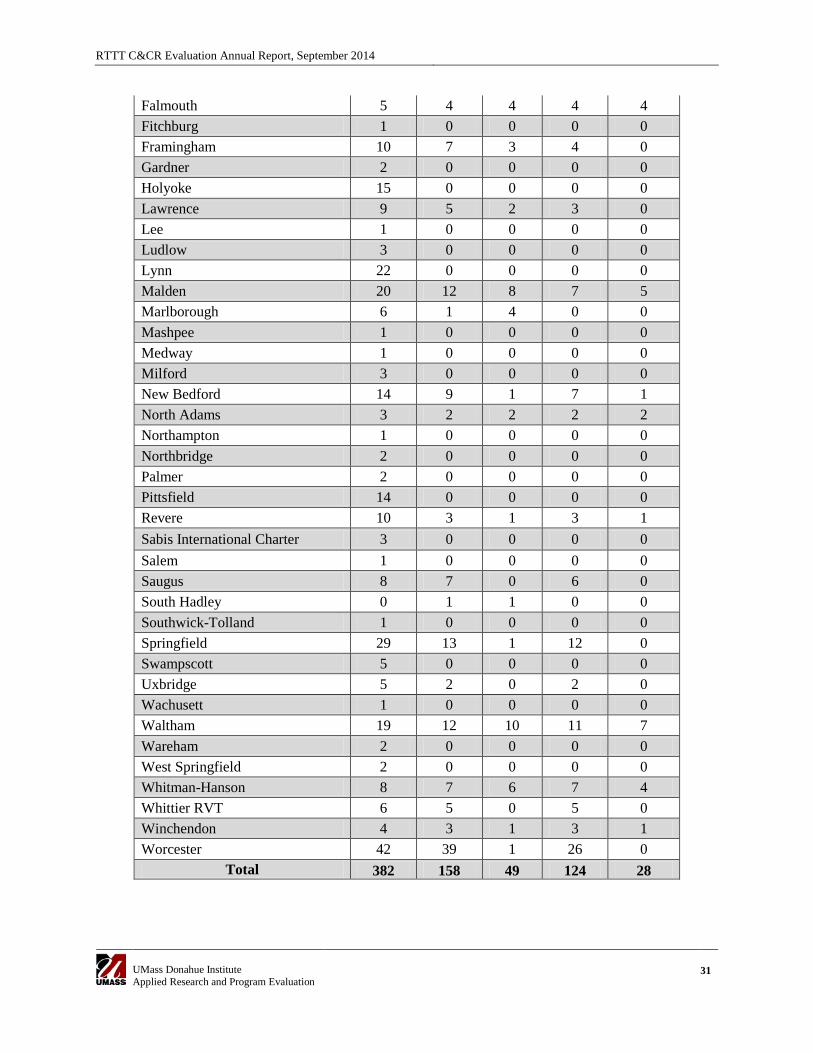
RTTT C&CR Evaluation Annual Report, September 2014
UMass Donahue Institute Applied Research and Program Evaluation
31
Falmouth 5 4 4 4 4 Fitchburg 1 0 0 0 0 Framingham 10 7 3 4 0 Gardner 2 0 0 0 0 Holyoke 15 0 0 0 0 Lawrence 9 5 2 3 0 Lee 1 0 0 0 0 Ludlow 3 0 0 0 0 Lynn 22 0 0 0 0 Malden 20 12 8 7 5 Marlborough 6 1 4 0 0 Mashpee 1 0 0 0 0 Medway 1 0 0 0 0 Milford 3 0 0 0 0 New Bedford 14 9 1 7 1 North Adams 3 2 2 2 2 Northampton 1 0 0 0 0 Northbridge 2 0 0 0 0 Palmer 2 0 0 0 0 Pittsfield 14 0 0 0 0 Revere 10 3 1 3 1 Sabis International Charter 3 0 0 0 0 Salem 1 0 0 0 0 Saugus 8 7 0 6 0 South Hadley 0 1 1 0 0 Southwick-Tolland 1 0 0 0 0 Springfield 29 13 1 12 0 Swampscott 5 0 0 0 0 Uxbridge 5 2 0 2 0 Wachusett 1 0 0 0 0 Waltham 19 12 10 11 7 Wareham 2 0 0 0 0 West Springfield 2 0 0 0 0 Whitman-Hanson 8 7 6 7 4 Whittier RVT 6 5 0 5 0 Winchendon 4 3 1 3 1 Worcester 42 39 1 26 0
Total 382 158 49 124 28
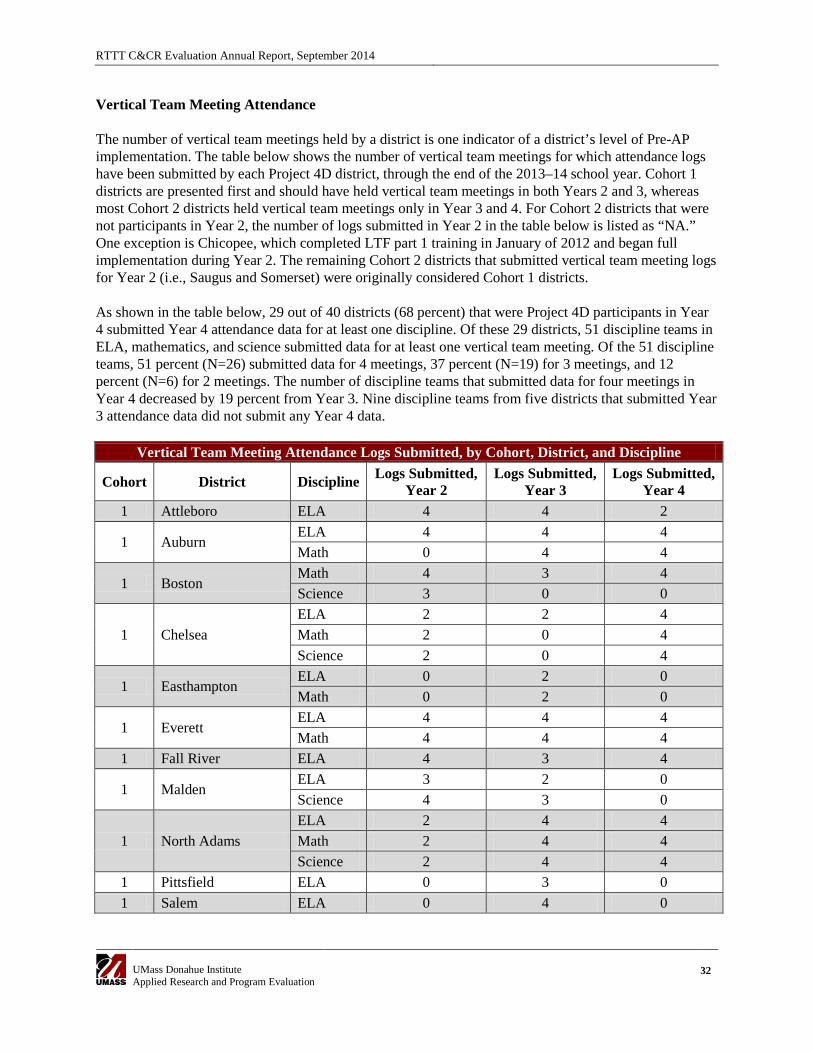
RTTT C&CR Evaluation Annual Report, September 2014
UMass Donahue Institute Applied Research and Program Evaluation
32
Vertical Team Meeting Attendance The number of vertical team meetings held by a district is one indicator of a district’s level of Pre-AP implementation. The table below shows the number of vertical team meetings for which attendance logs have been submitted by each Project 4D district, through the end of the 2013–14 school year. Cohort 1 districts are presented first and should have held vertical team meetings in both Years 2 and 3, whereas most Cohort 2 districts held vertical team meetings only in Year 3 and 4. For Cohort 2 districts that were not participants in Year 2, the number of logs submitted in Year 2 in the table below is listed as “NA.” One exception is Chicopee, which completed LTF part 1 training in January of 2012 and began full implementation during Year 2. The remaining Cohort 2 districts that submitted vertical team meeting logs for Year 2 (i.e., Saugus and Somerset) were originally considered Cohort 1 districts. As shown in the table below, 29 out of 40 districts (68 percent) that were Project 4D participants in Year 4 submitted Year 4 attendance data for at least one discipline. Of these 29 districts, 51 discipline teams in ELA, mathematics, and science submitted data for at least one vertical team meeting. Of the 51 discipline teams, 51 percent (N=26) submitted data for 4 meetings, 37 percent (N=19) for 3 meetings, and 12 percent (N=6) for 2 meetings. The number of discipline teams that submitted data for four meetings in Year 4 decreased by 19 percent from Year 3. Nine discipline teams from five districts that submitted Year 3 attendance data did not submit any Year 4 data.
Vertical Team Meeting Attendance Logs Submitted, by Cohort, District, and Discipline
Cohort District Discipline Logs Submitted, Year 2
Logs Submitted, Year 3
Logs Submitted, Year 4
1 Attleboro ELA 4 4 2
1 Auburn ELA 4 4 4 Math 0 4 4
1 Boston Math 4 3 4 Science 3 0 0
1 Chelsea ELA 2 2 4 Math 2 0 4 Science 2 0 4
1 Easthampton ELA 0 2 0 Math 0 2 0
1 Everett ELA 4 4 4 Math 4 4 4
1 Fall River ELA 4 3 4
1 Malden ELA 3 2 0 Science 4 3 0
1 North Adams ELA 2 4 4 Math 2 4 4 Science 2 4 4
1 Pittsfield ELA 0 3 0 1 Salem ELA 0 4 0
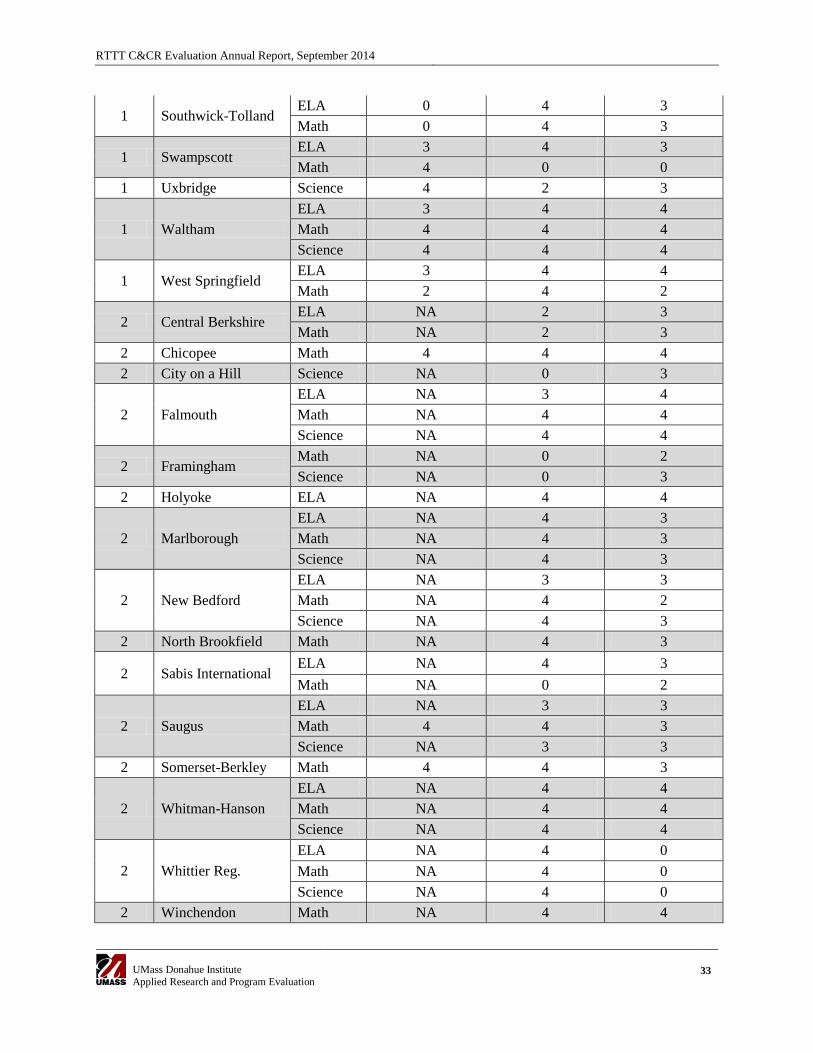
RTTT C&CR Evaluation Annual Report, September 2014
UMass Donahue Institute Applied Research and Program Evaluation
33
1 Southwick-Tolland ELA 0 4 3 Math 0 4 3
1 Swampscott ELA 3 4 3 Math 4 0 0
1 Uxbridge Science 4 2 3
1 Waltham ELA 3 4 4 Math 4 4 4 Science 4 4 4
1 West Springfield ELA 3 4 4 Math 2 4 2
2 Central Berkshire ELA NA 2 3 Math NA 2 3
2 Chicopee Math 4 4 4 2 City on a Hill Science NA 0 3
2 Falmouth ELA NA 3 4 Math NA 4 4 Science NA 4 4
2 Framingham Math NA 0 2 Science NA 0 3
2 Holyoke ELA NA 4 4
2 Marlborough ELA NA 4 3 Math NA 4 3 Science NA 4 3
2 New Bedford ELA NA 3 3 Math NA 4 2 Science NA 4 3
2 North Brookfield Math NA 4 3
2 Sabis International ELA NA 4 3 Math NA 0 2
2 Saugus ELA NA 3 3 Math 4 4 3 Science NA 3 3
2 Somerset-Berkley Math 4 4 3
2 Whitman-Hanson ELA NA 4 4 Math NA 4 4 Science NA 4 4
2 Whittier Reg. ELA NA 4 0 Math NA 4 0 Science NA 4 0
2 Winchendon Math NA 4 4
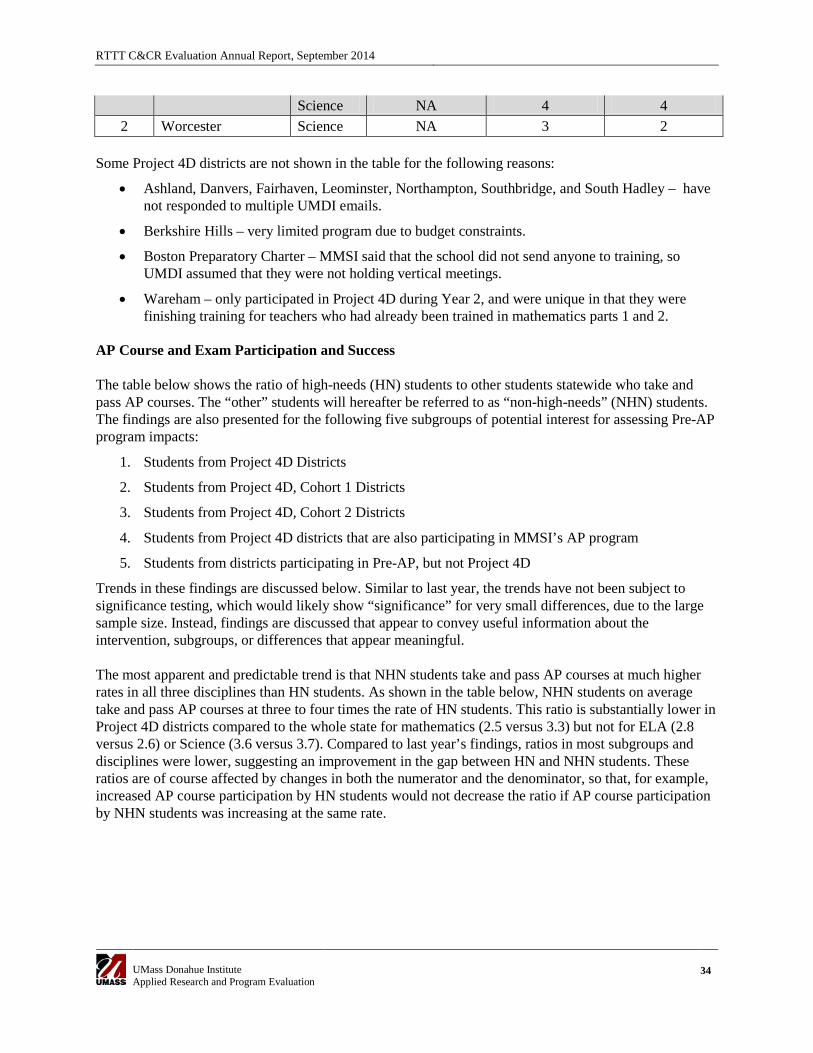
RTTT C&CR Evaluation Annual Report, September 2014
UMass Donahue Institute Applied Research and Program Evaluation
34
Science NA 4 4 2 Worcester Science NA 3 2
Some Project 4D districts are not shown in the table for the following reasons:
• Ashland, Danvers, Fairhaven, Leominster, Northampton, Southbridge, and South Hadley – have not responded to multiple UMDI emails.
• Berkshire Hills – very limited program due to budget constraints.
• Boston Preparatory Charter – MMSI said that the school did not send anyone to training, so UMDI assumed that they were not holding vertical meetings.
• Wareham – only participated in Project 4D during Year 2, and were unique in that they were finishing training for teachers who had already been trained in mathematics parts 1 and 2.
AP Course and Exam Participation and Success The table below shows the ratio of high-needs (HN) students to other students statewide who take and pass AP courses. The “other” students will hereafter be referred to as “non-high-needs” (NHN) students. The findings are also presented for the following five subgroups of potential interest for assessing Pre-AP program impacts:
1. Students from Project 4D Districts
2. Students from Project 4D, Cohort 1 Districts
3. Students from Project 4D, Cohort 2 Districts
4. Students from Project 4D districts that are also participating in MMSI’s AP program
5. Students from districts participating in Pre-AP, but not Project 4D
Trends in these findings are discussed below. Similar to last year, the trends have not been subject to significance testing, which would likely show “significance” for very small differences, due to the large sample size. Instead, findings are discussed that appear to convey useful information about the intervention, subgroups, or differences that appear meaningful. The most apparent and predictable trend is that NHN students take and pass AP courses at much higher rates in all three disciplines than HN students. As shown in the table below, NHN students on average take and pass AP courses at three to four times the rate of HN students. This ratio is substantially lower in Project 4D districts compared to the whole state for mathematics (2.5 versus 3.3) but not for ELA (2.8 versus 2.6) or Science (3.6 versus 3.7). Compared to last year’s findings, ratios in most subgroups and disciplines were lower, suggesting an improvement in the gap between HN and NHN students. These ratios are of course affected by changes in both the numerator and the denominator, so that, for example, increased AP course participation by HN students would not decrease the ratio if AP course participation by NHN students was increasing at the same rate.
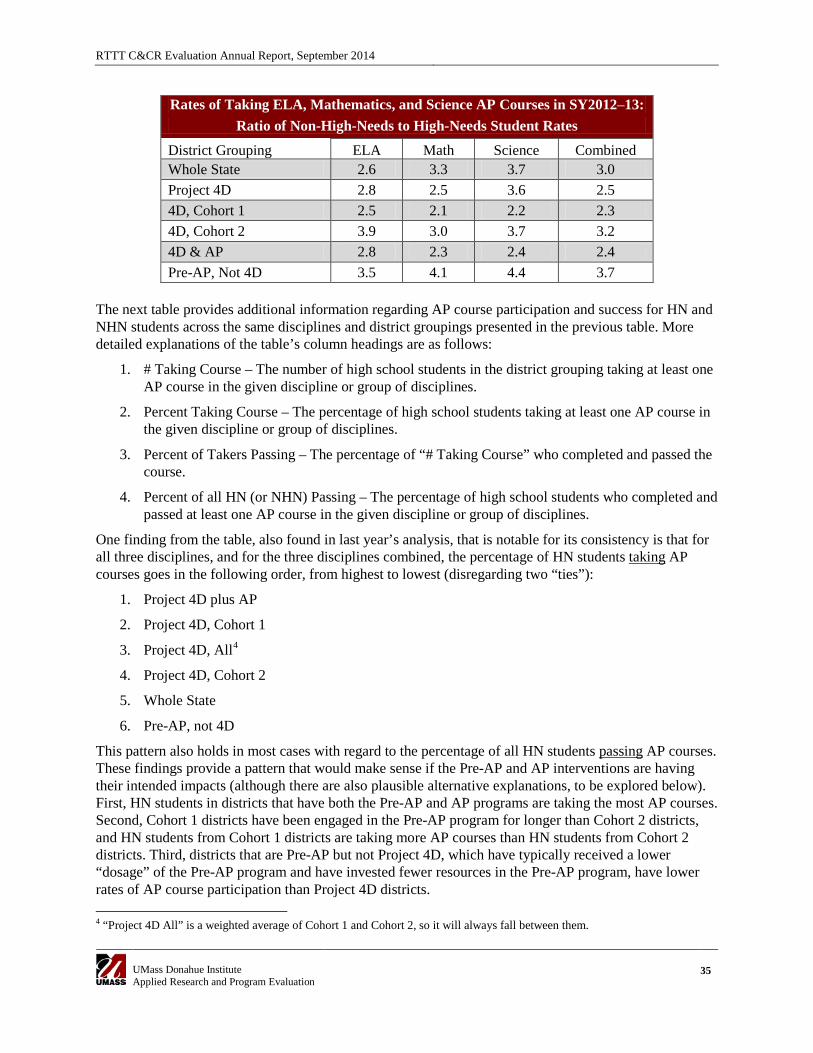
RTTT C&CR Evaluation Annual Report, September 2014
UMass Donahue Institute Applied Research and Program Evaluation
35
Rates of Taking ELA, Mathematics, and Science AP Courses in SY2012–13: Ratio of Non-High-Needs to High-Needs Student Rates
District Grouping ELA Math Science Combined Whole State 2.6 3.3 3.7 3.0 Project 4D 2.8 2.5 3.6 2.5 4D, Cohort 1 2.5 2.1 2.2 2.3 4D, Cohort 2 3.9 3.0 3.7 3.2 4D & AP 2.8 2.3 2.4 2.4 Pre-AP, Not 4D 3.5 4.1 4.4 3.7
The next table provides additional information regarding AP course participation and success for HN and NHN students across the same disciplines and district groupings presented in the previous table. More detailed explanations of the table’s column headings are as follows:
1. # Taking Course – The number of high school students in the district grouping taking at least one AP course in the given discipline or group of disciplines.
2. Percent Taking Course – The percentage of high school students taking at least one AP course in the given discipline or group of disciplines.
3. Percent of Takers Passing – The percentage of “# Taking Course” who completed and passed the course.
4. Percent of all HN (or NHN) Passing – The percentage of high school students who completed and passed at least one AP course in the given discipline or group of disciplines.
One finding from the table, also found in last year’s analysis, that is notable for its consistency is that for all three disciplines, and for the three disciplines combined, the percentage of HN students taking AP courses goes in the following order, from highest to lowest (disregarding two “ties”):
1. Project 4D plus AP
2. Project 4D, Cohort 1
3. Project 4D, All4
4. Project 4D, Cohort 2
5. Whole State
6. Pre-AP, not 4D
This pattern also holds in most cases with regard to the percentage of all HN students passing AP courses. These findings provide a pattern that would make sense if the Pre-AP and AP interventions are having their intended impacts (although there are also plausible alternative explanations, to be explored below). First, HN students in districts that have both the Pre-AP and AP programs are taking the most AP courses. Second, Cohort 1 districts have been engaged in the Pre-AP program for longer than Cohort 2 districts, and HN students from Cohort 1 districts are taking more AP courses than HN students from Cohort 2 districts. Third, districts that are Pre-AP but not Project 4D, which have typically received a lower “dosage” of the Pre-AP program and have invested fewer resources in the Pre-AP program, have lower rates of AP course participation than Project 4D districts. 4 “Project 4D All” is a weighted average of Cohort 1 and Cohort 2, so it will always fall between them.
RTTT C&CR Evaluation Annual Report, September 2014
UMass Donahue Institute Applied Research and Program Evaluation
36
The pattern described above does not apply to the percentage of AP course-takers that pass their courses, likely in part because there is substantially less variation in pass rates than in course participation rates. Two findings that stand out with regard to the percentage of HN course-takers passing are: (1) passing rates are five percentage points higher for Cohort 1 than for Cohort 2 mathematics students; and (2) passing rates for Pre-AP, non-4D students are four percentage points below the state average. While aspects of the findings presented are consistent with the effectiveness of the Pre-AP program, plausible alternative explanations make additional data collection and analysis necessary. First, the AP program may account for any impacts that are observed in districts that are participating in both the Pre-AP and AP programs. Second, the reported differences in AP course participation rates in Cohort 1, Cohort 2, and Pre-AP non-4D districts may reflect differences that existed prior to the Pre-AP program, both in terms of actual AP course participation and in terms of the districts’ commitment to increasing AP course participation. During the evaluation’s final year, UMDI will focus on conducting analyses that provide the strongest answers to these questions that the data and evaluation resources can provide.
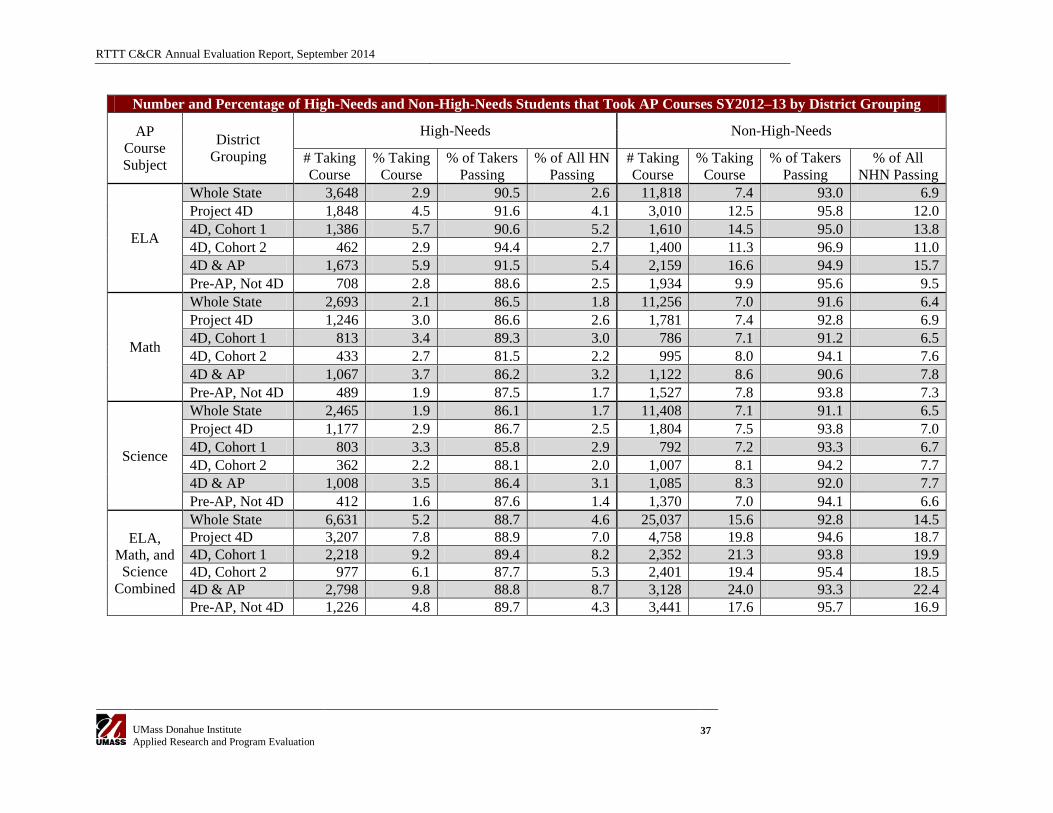
RTTT C&CR Annual Evaluation Report, September 2014
UMass Donahue Institute Applied Research and Program Evaluation
37
Number and Percentage of High-Needs and Non-High-Needs Students that Took AP Courses SY2012–13 by District Grouping
AP Course Subject
District Grouping
High-Needs Non-High-Needs
# Taking Course
% Taking Course
% of Takers Passing
% of All HN Passing
# Taking Course
% Taking Course
% of Takers Passing
% of All NHN Passing
ELA
Whole State 3,648 2.9 90.5 2.6 11,818 7.4 93.0 6.9 Project 4D 1,848 4.5 91.6 4.1 3,010 12.5 95.8 12.0 4D, Cohort 1 1,386 5.7 90.6 5.2 1,610 14.5 95.0 13.8 4D, Cohort 2 462 2.9 94.4 2.7 1,400 11.3 96.9 11.0 4D & AP 1,673 5.9 91.5 5.4 2,159 16.6 94.9 15.7 Pre-AP, Not 4D 708 2.8 88.6 2.5 1,934 9.9 95.6 9.5
Math
Whole State 2,693 2.1 86.5 1.8 11,256 7.0 91.6 6.4 Project 4D 1,246 3.0 86.6 2.6 1,781 7.4 92.8 6.9 4D, Cohort 1 813 3.4 89.3 3.0 786 7.1 91.2 6.5 4D, Cohort 2 433 2.7 81.5 2.2 995 8.0 94.1 7.6 4D & AP 1,067 3.7 86.2 3.2 1,122 8.6 90.6 7.8 Pre-AP, Not 4D 489 1.9 87.5 1.7 1,527 7.8 93.8 7.3
Science
Whole State 2,465 1.9 86.1 1.7 11,408 7.1 91.1 6.5 Project 4D 1,177 2.9 86.7 2.5 1,804 7.5 93.8 7.0 4D, Cohort 1 803 3.3 85.8 2.9 792 7.2 93.3 6.7 4D, Cohort 2 362 2.2 88.1 2.0 1,007 8.1 94.2 7.7 4D & AP 1,008 3.5 86.4 3.1 1,085 8.3 92.0 7.7 Pre-AP, Not 4D 412 1.6 87.6 1.4 1,370 7.0 94.1 6.6
ELA, Math, and Science
Combined
Whole State 6,631 5.2 88.7 4.6 25,037 15.6 92.8 14.5 Project 4D 3,207 7.8 88.9 7.0 4,758 19.8 94.6 18.7 4D, Cohort 1 2,218 9.2 89.4 8.2 2,352 21.3 93.8 19.9 4D, Cohort 2 977 6.1 87.7 5.3 2,401 19.4 95.4 18.5 4D & AP 2,798 9.8 88.8 8.7 3,128 24.0 93.3 22.4 Pre-AP, Not 4D 1,226 4.8 89.7 4.3 3,441 17.6 95.7 16.9
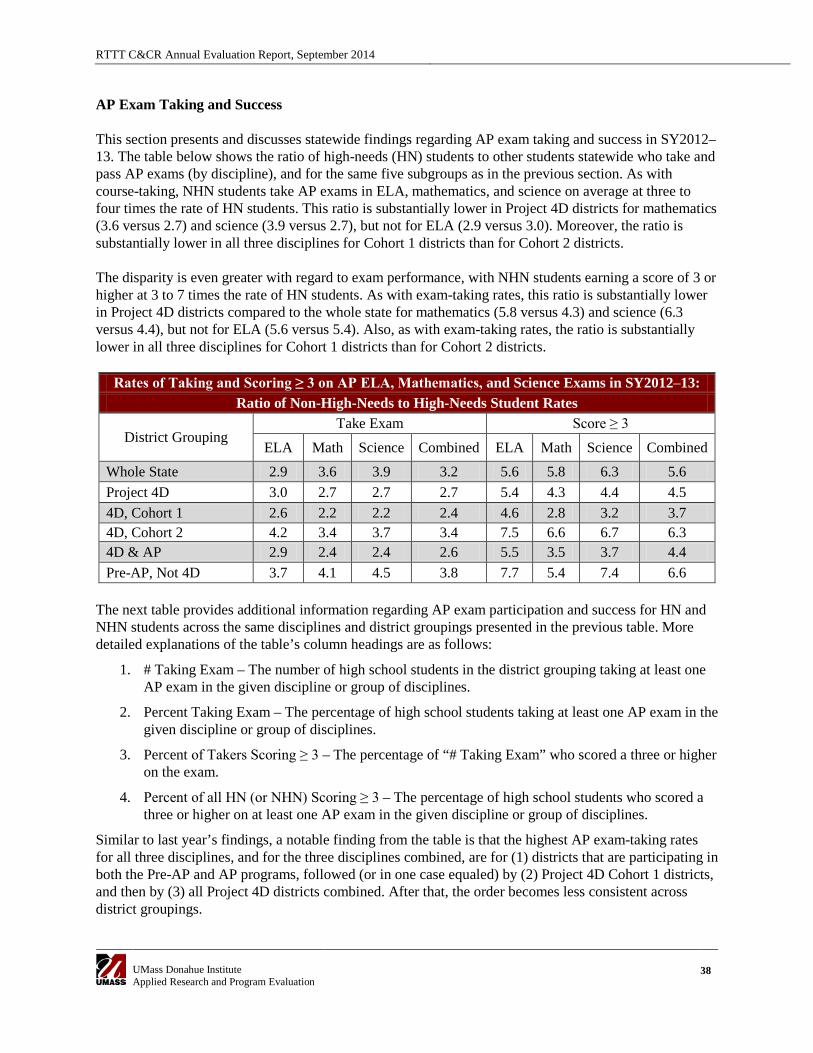
RTTT C&CR Annual Evaluation Report, September 2014
UMass Donahue Institute Applied Research and Program Evaluation
38
AP Exam Taking and Success This section presents and discusses statewide findings regarding AP exam taking and success in SY2012–13. The table below shows the ratio of high-needs (HN) students to other students statewide who take and pass AP exams (by discipline), and for the same five subgroups as in the previous section. As with course-taking, NHN students take AP exams in ELA, mathematics, and science on average at three to four times the rate of HN students. This ratio is substantially lower in Project 4D districts for mathematics (3.6 versus 2.7) and science (3.9 versus 2.7), but not for ELA (2.9 versus 3.0). Moreover, the ratio is substantially lower in all three disciplines for Cohort 1 districts than for Cohort 2 districts. The disparity is even greater with regard to exam performance, with NHN students earning a score of 3 or higher at 3 to 7 times the rate of HN students. As with exam-taking rates, this ratio is substantially lower in Project 4D districts compared to the whole state for mathematics (5.8 versus 4.3) and science (6.3 versus 4.4), but not for ELA (5.6 versus 5.4). Also, as with exam-taking rates, the ratio is substantially lower in all three disciplines for Cohort 1 districts than for Cohort 2 districts.
Rates of Taking and Scoring ≥ 3 on AP ELA, Mathematics, and Science Exams in SY2012–13: Ratio of Non-High-Needs to High-Needs Student Rates
District Grouping Take Exam Score ≥ 3
ELA Math Science Combined ELA Math Science Combined Whole State 2.9 3.6 3.9 3.2 5.6 5.8 6.3 5.6 Project 4D 3.0 2.7 2.7 2.7 5.4 4.3 4.4 4.5 4D, Cohort 1 2.6 2.2 2.2 2.4 4.6 2.8 3.2 3.7 4D, Cohort 2 4.2 3.4 3.7 3.4 7.5 6.6 6.7 6.3 4D & AP 2.9 2.4 2.4 2.6 5.5 3.5 3.7 4.4 Pre-AP, Not 4D 3.7 4.1 4.5 3.8 7.7 5.4 7.4 6.6
The next table provides additional information regarding AP exam participation and success for HN and NHN students across the same disciplines and district groupings presented in the previous table. More detailed explanations of the table’s column headings are as follows:
1. # Taking Exam – The number of high school students in the district grouping taking at least one AP exam in the given discipline or group of disciplines.
2. Percent Taking Exam – The percentage of high school students taking at least one AP exam in the given discipline or group of disciplines.
3. Percent of Takers Scoring ≥ 3 – The percentage of “# Taking Exam” who scored a three or higher on the exam.
4. Percent of all HN (or NHN) Scoring ≥ 3 – The percentage of high school students who scored a three or higher on at least one AP exam in the given discipline or group of disciplines.
Similar to last year’s findings, a notable finding from the table is that the highest AP exam-taking rates for all three disciplines, and for the three disciplines combined, are for (1) districts that are participating in both the Pre-AP and AP programs, followed (or in one case equaled) by (2) Project 4D Cohort 1 districts, and then by (3) all Project 4D districts combined. After that, the order becomes less consistent across district groupings.
RTTT C&CR Annual Evaluation Report, September 2014
UMass Donahue Institute Applied Research and Program Evaluation
39
With regard to the percentage of HN test takers scoring greater than or equal to a three, two notable findings are that (1) for all three disciplines, the whole state is higher than any of the district subgroups; and (2) the districts with both AP and pre-AP are lowest or second lowest in mathematics, English, and all three disciplines combined, but not in science. This finding can be interpreted in the context of a comment made by a MMSI personnel member during an interview for UMDI’s evaluation of the AP (not Pre-AP) program. He said that the AP program attempts to substantially increase participation in AP courses and exams, and to maximize the number rather than the percentage of students scoring a three or higher. His comments suggested that many districts have barriers to participation in AP courses and exams that narrow participation to students who have completed and/or earned high grades in challenging prerequisite courses. Those strategies—which reduce participation but maximize the qualifications of participants—could yield the pattern of data presented here, where the statewide rate is higher than the Pre-AP and AP rates. With regard to the percentage of all HN students (i.e., not just HN test takers) scoring a three or higher, the two highest groupings for all three disciplines are again the Cohort 1 districts and the districts that participate in both the AP and Pre-AP programs. This pattern was also found last year and would be consistent with the scenario just described, where the goal is to maximize the number rather than the percentage of high scorers.
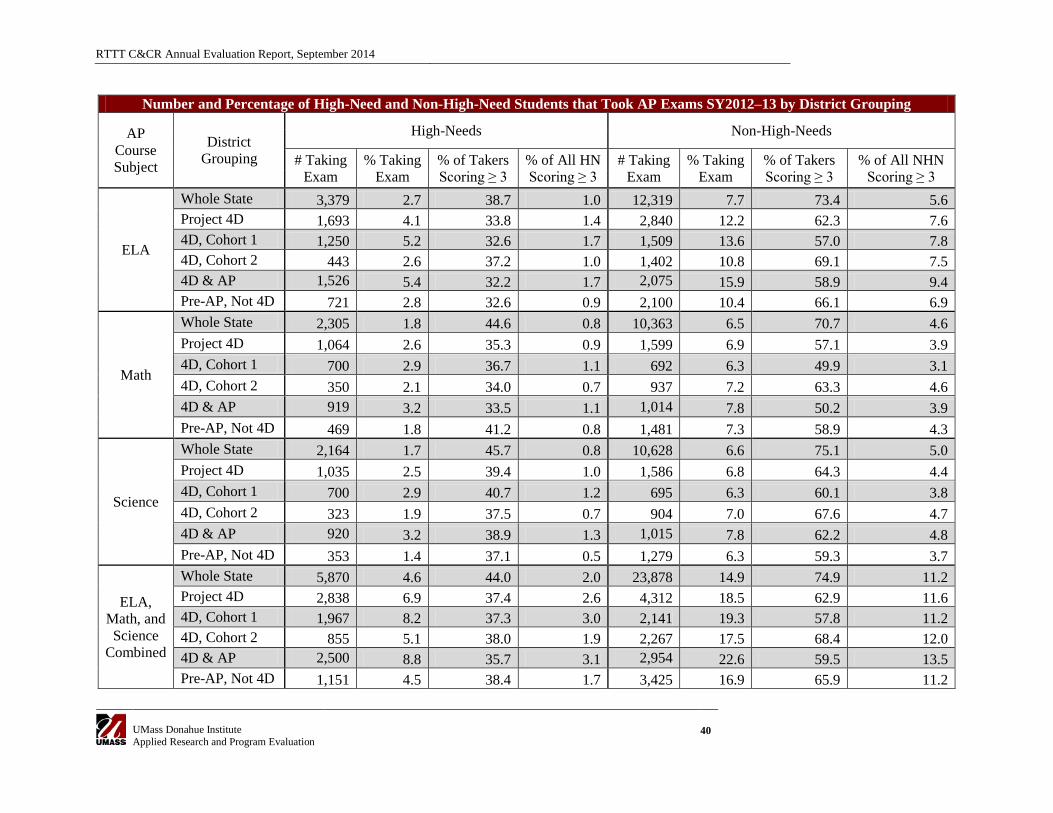
RTTT C&CR Annual Evaluation Report, September 2014
UMass Donahue Institute Applied Research and Program Evaluation
40
Number and Percentage of High-Need and Non-High-Need Students that Took AP Exams SY2012–13 by District Grouping
AP Course Subject
District Grouping
High-Needs Non-High-Needs
# Taking Exam
% Taking Exam
% of Takers Scoring ≥ 3
% of All HN Scoring ≥ 3
# Taking Exam
% Taking Exam
% of Takers Scoring ≥ 3
% of All NHN Scoring ≥ 3
ELA
Whole State 3,379 2.7 38.7 1.0 12,319 7.7 73.4 5.6 Project 4D 1,693 4.1 33.8 1.4 2,840 12.2 62.3 7.6 4D, Cohort 1 1,250 5.2 32.6 1.7 1,509 13.6 57.0 7.8 4D, Cohort 2 443 2.6 37.2 1.0 1,402 10.8 69.1 7.5 4D & AP 1,526 5.4 32.2 1.7 2,075 15.9 58.9 9.4 Pre-AP, Not 4D 721 2.8 32.6 0.9 2,100 10.4 66.1 6.9
Math
Whole State 2,305 1.8 44.6 0.8 10,363 6.5 70.7 4.6 Project 4D 1,064 2.6 35.3 0.9 1,599 6.9 57.1 3.9 4D, Cohort 1 700 2.9 36.7 1.1 692 6.3 49.9 3.1 4D, Cohort 2 350 2.1 34.0 0.7 937 7.2 63.3 4.6 4D & AP 919 3.2 33.5 1.1 1,014 7.8 50.2 3.9 Pre-AP, Not 4D 469 1.8 41.2 0.8 1,481 7.3 58.9 4.3
Science
Whole State 2,164 1.7 45.7 0.8 10,628 6.6 75.1 5.0 Project 4D 1,035 2.5 39.4 1.0 1,586 6.8 64.3 4.4 4D, Cohort 1 700 2.9 40.7 1.2 695 6.3 60.1 3.8 4D, Cohort 2 323 1.9 37.5 0.7 904 7.0 67.6 4.7 4D & AP 920 3.2 38.9 1.3 1,015 7.8 62.2 4.8 Pre-AP, Not 4D 353 1.4 37.1 0.5 1,279 6.3 59.3 3.7
ELA, Math, and Science
Combined
Whole State 5,870 4.6 44.0 2.0 23,878 14.9 74.9 11.2 Project 4D 2,838 6.9 37.4 2.6 4,312 18.5 62.9 11.6 4D, Cohort 1 1,967 8.2 37.3 3.0 2,141 19.3 57.8 11.2 4D, Cohort 2 855 5.1 38.0 1.9 2,267 17.5 68.4 12.0 4D & AP 2,500 8.8 35.7 3.1 2,954 22.6 59.5 13.5 Pre-AP, Not 4D 1,151 4.5 38.4 1.7 3,425 16.9 65.9 11.2
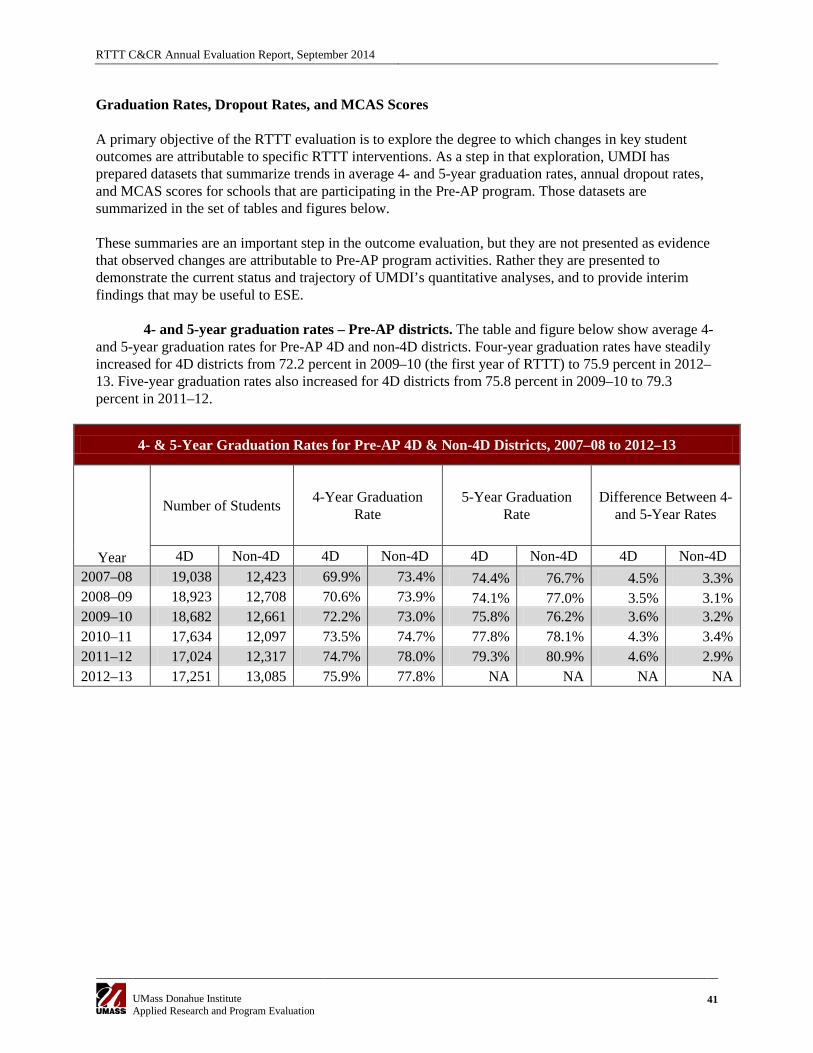
RTTT C&CR Annual Evaluation Report, September 2014
UMass Donahue Institute Applied Research and Program Evaluation
41
Graduation Rates, Dropout Rates, and MCAS Scores A primary objective of the RTTT evaluation is to explore the degree to which changes in key student outcomes are attributable to specific RTTT interventions. As a step in that exploration, UMDI has prepared datasets that summarize trends in average 4- and 5-year graduation rates, annual dropout rates, and MCAS scores for schools that are participating in the Pre-AP program. Those datasets are summarized in the set of tables and figures below. These summaries are an important step in the outcome evaluation, but they are not presented as evidence that observed changes are attributable to Pre-AP program activities. Rather they are presented to demonstrate the current status and trajectory of UMDI’s quantitative analyses, and to provide interim findings that may be useful to ESE.
4- and 5-year graduation rates – Pre-AP districts. The table and figure below show average 4- and 5-year graduation rates for Pre-AP 4D and non-4D districts. Four-year graduation rates have steadily increased for 4D districts from 72.2 percent in 2009–10 (the first year of RTTT) to 75.9 percent in 2012–13. Five-year graduation rates also increased for 4D districts from 75.8 percent in 2009–10 to 79.3 percent in 2011–12.
4- & 5-Year Graduation Rates for Pre-AP 4D & Non-4D Districts, 2007–08 to 2012–13
Year
Number of Students 4-Year Graduation Rate
5-Year Graduation Rate
Difference Between 4- and 5-Year Rates
4D Non-4D 4D Non-4D 4D Non-4D 4D Non-4D 2007–08 19,038 12,423 69.9% 73.4% 74.4% 76.7% 4.5% 3.3% 2008–09 18,923 12,708 70.6% 73.9% 74.1% 77.0% 3.5% 3.1% 2009–10 18,682 12,661 72.2% 73.0% 75.8% 76.2% 3.6% 3.2% 2010–11 17,634 12,097 73.5% 74.7% 77.8% 78.1% 4.3% 3.4% 2011–12 17,024 12,317 74.7% 78.0% 79.3% 80.9% 4.6% 2.9% 2012–13 17,251 13,085 75.9% 77.8% NA NA NA NA
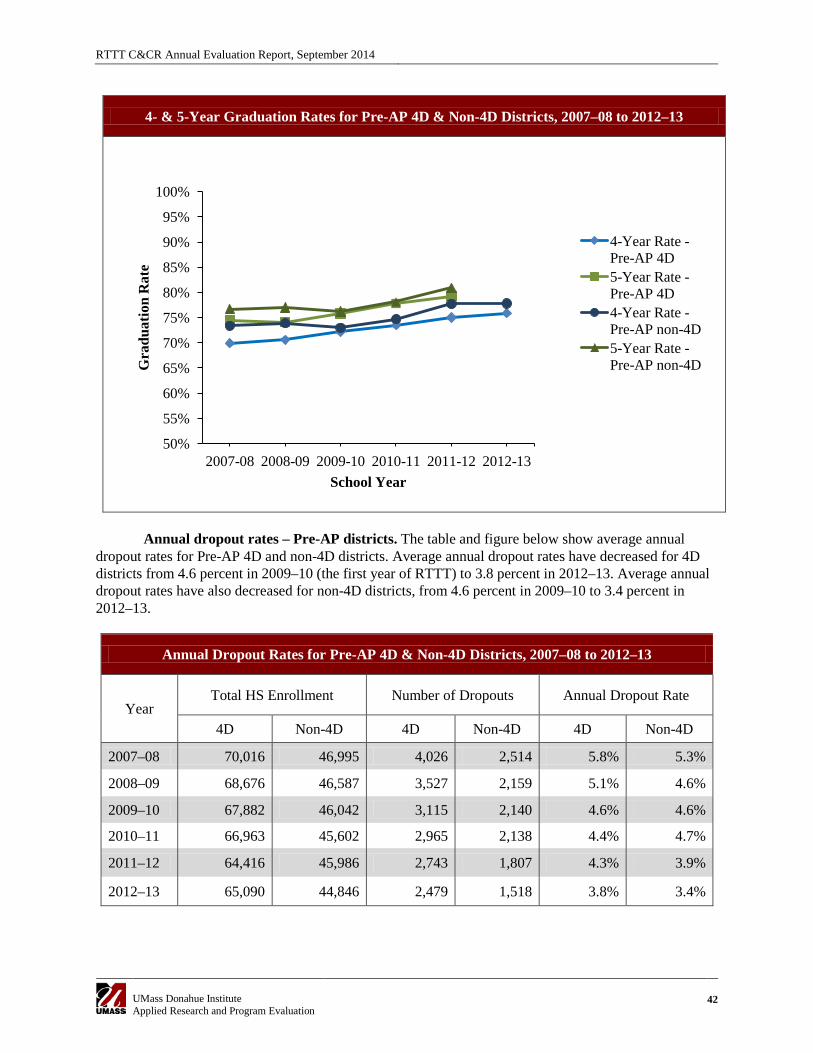
RTTT C&CR Annual Evaluation Report, September 2014
UMass Donahue Institute Applied Research and Program Evaluation
42
4- & 5-Year Graduation Rates for Pre-AP 4D & Non-4D Districts, 2007–08 to 2012–13
Annual dropout rates – Pre-AP districts. The table and figure below show average annual
dropout rates for Pre-AP 4D and non-4D districts. Average annual dropout rates have decreased for 4D districts from 4.6 percent in 2009–10 (the first year of RTTT) to 3.8 percent in 2012–13. Average annual dropout rates have also decreased for non-4D districts, from 4.6 percent in 2009–10 to 3.4 percent in 2012–13.
Annual Dropout Rates for Pre-AP 4D & Non-4D Districts, 2007–08 to 2012–13
Year Total HS Enrollment Number of Dropouts Annual Dropout Rate
4D Non-4D 4D Non-4D 4D Non-4D
2007–08 70,016 46,995 4,026 2,514 5.8% 5.3%
2008–09 68,676 46,587 3,527 2,159 5.1% 4.6%
2009–10 67,882 46,042 3,115 2,140 4.6% 4.6%
2010–11 66,963 45,602 2,965 2,138 4.4% 4.7%
2011–12 64,416 45,986 2,743 1,807 4.3% 3.9%
2012–13 65,090 44,846 2,479 1,518 3.8% 3.4%
50%
55%
60%
65%
70%
75%
80%
85%
90%
95%
100%
2007-08 2008-09 2009-10 2010-11 2011-12 2012-13
Gra
duat
ion
Rat
e
School Year
4-Year Rate - Pre-AP 4D 5-Year Rate - Pre-AP 4D 4-Year Rate - Pre-AP non-4D 5-Year Rate - Pre-AP non-4D
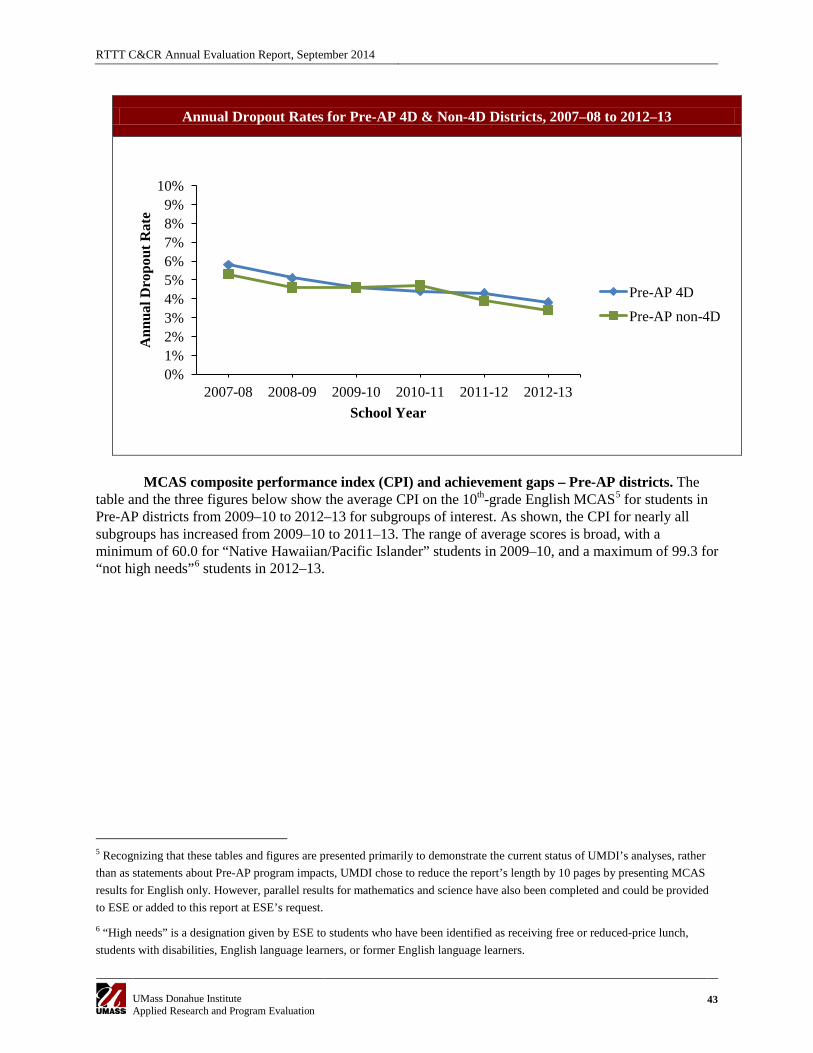
RTTT C&CR Annual Evaluation Report, September 2014
UMass Donahue Institute Applied Research and Program Evaluation
43
Annual Dropout Rates for Pre-AP 4D & Non-4D Districts, 2007–08 to 2012–13
MCAS composite performance index (CPI) and achievement gaps – Pre-AP districts. The
table and the three figures below show the average CPI on the 10th-grade English MCAS5 for students in Pre-AP districts from 2009–10 to 2012–13 for subgroups of interest. As shown, the CPI for nearly all subgroups has increased from 2009–10 to 2011–13. The range of average scores is broad, with a minimum of 60.0 for “Native Hawaiian/Pacific Islander” students in 2009–10, and a maximum of 99.3 for “not high needs”6 students in 2012–13.
5 Recognizing that these tables and figures are presented primarily to demonstrate the current status of UMDI’s analyses, rather than as statements about Pre-AP program impacts, UMDI chose to reduce the report’s length by 10 pages by presenting MCAS results for English only. However, parallel results for mathematics and science have also been completed and could be provided to ESE or added to this report at ESE’s request.
6 “High needs” is a designation given by ESE to students who have been identified as receiving free or reduced-price lunch, students with disabilities, English language learners, or former English language learners.
0% 1% 2% 3% 4% 5% 6% 7% 8% 9%
10%
2007-08 2008-09 2009-10 2010-11 2011-12 2012-13
Ann
ual D
ropo
ut R
ate
School Year
Pre-AP 4D Pre-AP non-4D
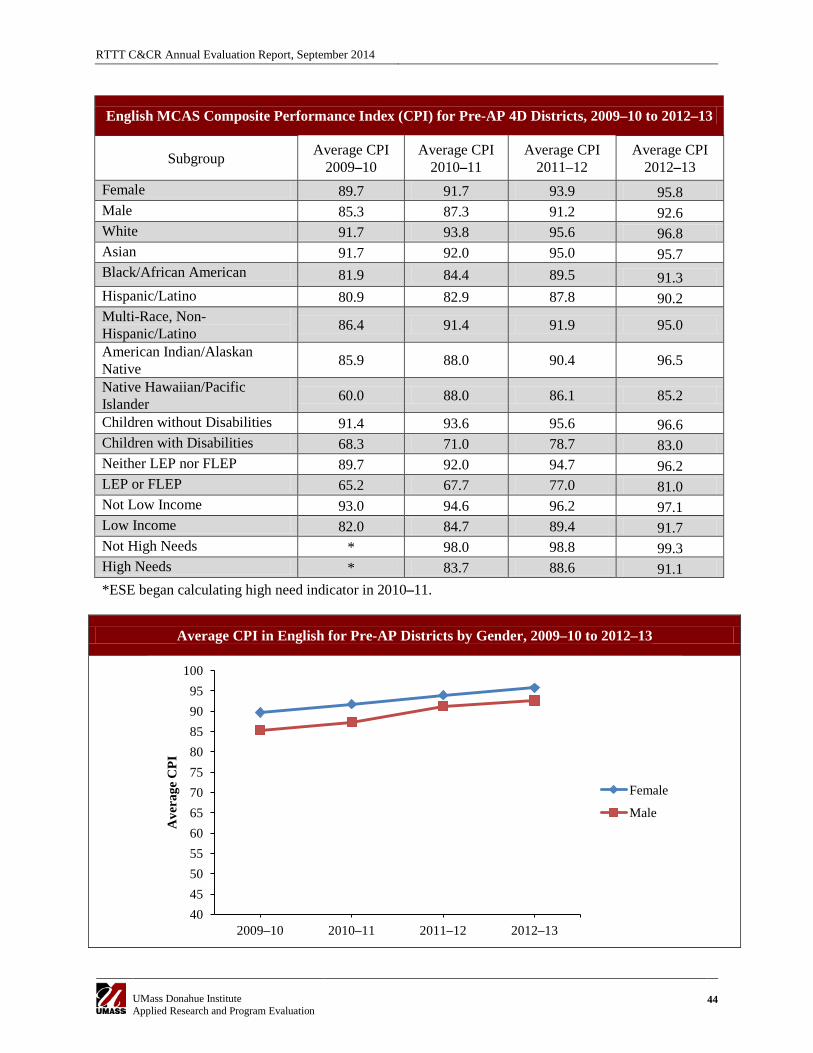
RTTT C&CR Annual Evaluation Report, September 2014
UMass Donahue Institute Applied Research and Program Evaluation
44
English MCAS Composite Performance Index (CPI) for Pre-AP 4D Districts, 2009–10 to 2012–13
Subgroup Average CPI 2009–10
Average CPI 2010–11
Average CPI 2011–12
Average CPI 2012–13
Female 89.7 91.7 93.9 95.8 Male 85.3 87.3 91.2 92.6 White 91.7 93.8 95.6 96.8 Asian 91.7 92.0 95.0 95.7 Black/African American 81.9 84.4 89.5 91.3 Hispanic/Latino 80.9 82.9 87.8 90.2 Multi-Race, Non-Hispanic/Latino 86.4 91.4 91.9 95.0
American Indian/Alaskan Native 85.9 88.0 90.4 96.5
Native Hawaiian/Pacific Islander 60.0 88.0 86.1 85.2
Children without Disabilities 91.4 93.6 95.6 96.6 Children with Disabilities 68.3 71.0 78.7 83.0 Neither LEP nor FLEP 89.7 92.0 94.7 96.2 LEP or FLEP 65.2 67.7 77.0 81.0 Not Low Income 93.0 94.6 96.2 97.1 Low Income 82.0 84.7 89.4 91.7 Not High Needs * 98.0 98.8 99.3 High Needs * 83.7 88.6 91.1 *ESE began calculating high need indicator in 2010–11.
Average CPI in English for Pre-AP Districts by Gender, 2009–10 to 2012–13
40 45 50 55 60 65 70 75 80 85 90 95
100
2009–10 2010–11 2011–12 2012–13
Ave
rage
CPI
Female
Male
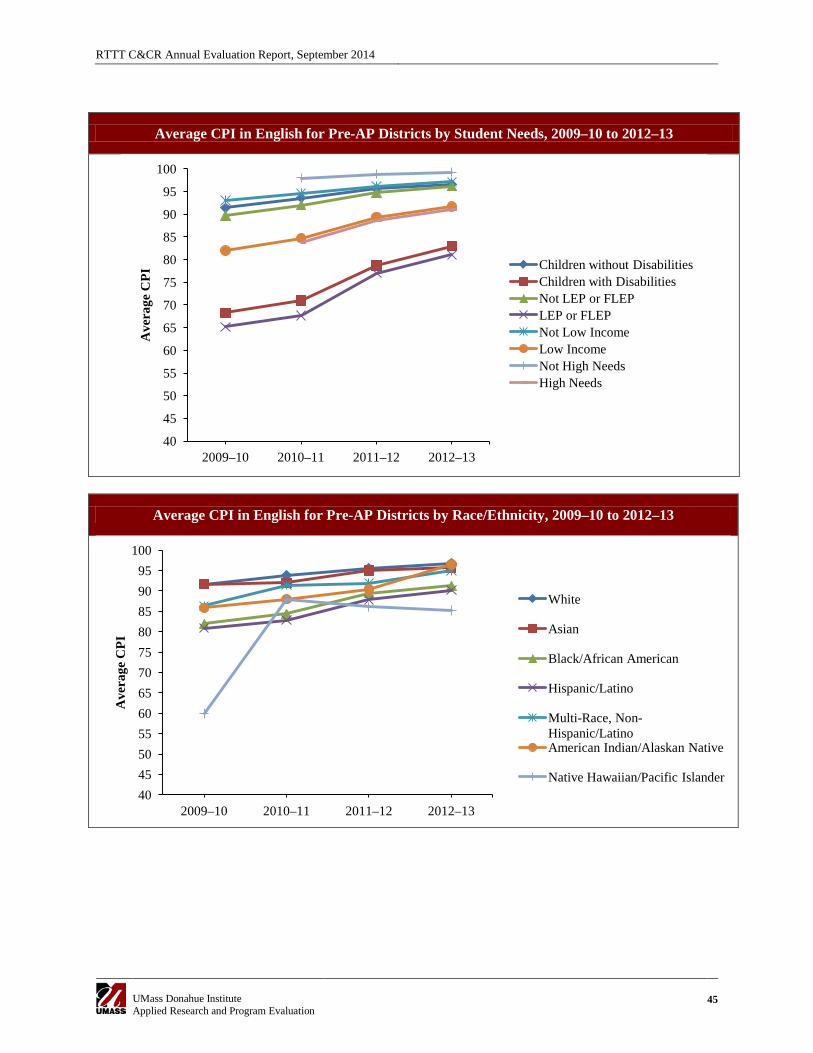
RTTT C&CR Annual Evaluation Report, September 2014
UMass Donahue Institute Applied Research and Program Evaluation
45
Average CPI in English for Pre-AP Districts by Student Needs, 2009–10 to 2012–13
40
45
50
55
60
65
70
75
80
85
90
95
100
2009–10 2010–11 2011–12 2012–13
Ave
rage
CPI
Children without Disabilities Children with Disabilities Not LEP or FLEP LEP or FLEP Not Low Income Low Income Not High Needs High Needs
Average CPI in English for Pre-AP Districts by Race/Ethnicity, 2009–10 to 2012–13
40 45 50 55 60 65 70 75 80 85 90 95
100
2009–10 2010–11 2011–12 2012–13
Ave
rage
CPI
White
Asian
Black/African American
Hispanic/Latino
Multi-Race, Non-Hispanic/Latino American Indian/Alaskan Native
Native Hawaiian/Pacific Islander
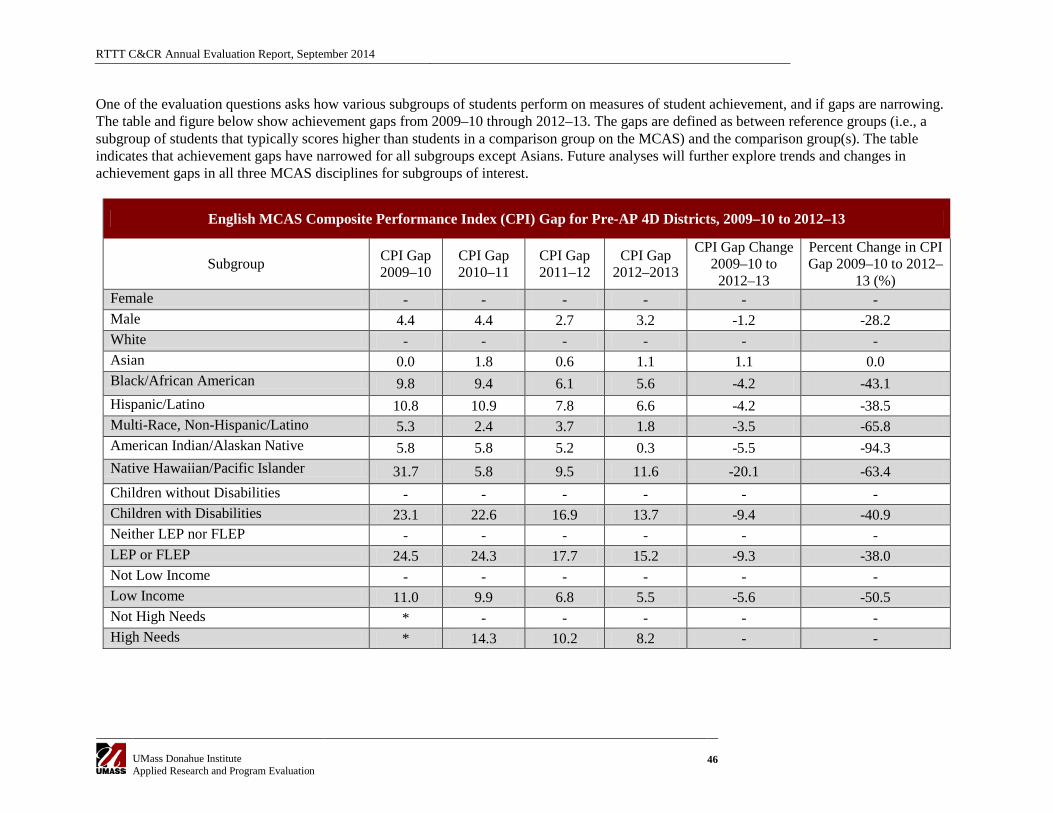
RTTT C&CR Annual Evaluation Report, September 2014
UMass Donahue Institute Applied Research and Program Evaluation
46
One of the evaluation questions asks how various subgroups of students perform on measures of student achievement, and if gaps are narrowing. The table and figure below show achievement gaps from 2009–10 through 2012–13. The gaps are defined as between reference groups (i.e., a subgroup of students that typically scores higher than students in a comparison group on the MCAS) and the comparison group(s). The table indicates that achievement gaps have narrowed for all subgroups except Asians. Future analyses will further explore trends and changes in achievement gaps in all three MCAS disciplines for subgroups of interest.
English MCAS Composite Performance Index (CPI) Gap for Pre-AP 4D Districts, 2009–10 to 2012–13
Subgroup CPI Gap 2009–10
CPI Gap 2010–11
CPI Gap 2011–12
CPI Gap 2012–2013
CPI Gap Change 2009–10 to
2012–13
Percent Change in CPI Gap 2009–10 to 2012–
13 (%) Female - - - - - - Male 4.4 4.4 2.7 3.2 -1.2 -28.2 White - - - - - - Asian 0.0 1.8 0.6 1.1 1.1 0.0 Black/African American 9.8 9.4 6.1 5.6 -4.2 -43.1 Hispanic/Latino 10.8 10.9 7.8 6.6 -4.2 -38.5 Multi-Race, Non-Hispanic/Latino 5.3 2.4 3.7 1.8 -3.5 -65.8 American Indian/Alaskan Native 5.8 5.8 5.2 0.3 -5.5 -94.3 Native Hawaiian/Pacific Islander 31.7 5.8 9.5 11.6 -20.1 -63.4 Children without Disabilities - - - - - - Children with Disabilities 23.1 22.6 16.9 13.7 -9.4 -40.9 Neither LEP nor FLEP - - - - - - LEP or FLEP 24.5 24.3 17.7 15.2 -9.3 -38.0 Not Low Income - - - - - - Low Income 11.0 9.9 6.8 5.5 -5.6 -50.5 Not High Needs * - - - - - High Needs * 14.3 10.2 8.2 - -
RTTT C&CR Annual Evaluation Report, September 2014
UMass Donahue Institute Applied Research and Program Evaluation
47
Strategic Considerations
• Formal review or evaluation of the new Pre-AP vendors and the process by which they were selected could address ongoing questions and concerns. ESE expressed dissatisfaction with the performance of one of the vendors, but also explained that ESE’s role in the relationship between districts and the vendors is limited now that the RTTT funding period is ending. To the extent that further evaluation or review is warranted, some suggestions for this process are presented in the report. ESE also expressed some questions about the process by which the vendors were selected, which may warrant further review.
• Avoiding repetition of Pre-AP activities should be one target of vertical alignment. One teacher reported that popular LTF activities are sometimes adopted by teachers at multiple grade levels. An advantage of district- or school-level collaboration in curriculum mapping is to decrease the likelihood of such repetition.
• Soliciting teacher input could increase buy-in and productivity related to vertical team meetings. While LTF’s vertical team meeting support materials reportedly emphasize working through and discussing specific LTF activities, some teachers have expressed interest in using the time differently, such as scheduling times to implement lessons or developing strategies regarding how to incorporate the lessons into their classrooms. Asking teachers how this time could best be used might increase the quality and quantity of implementation of Pre-AP activities.
RTTT C&CR Annual Evaluation Report, September 2014
UMass Donahue Institute Applied Research and Program Evaluation
48
STEM-focused Early College High Schools Background Six districts were chosen in a competitive process to receive RTTT Goal 4E funds to open STEM early college high schools. Eight additional STEM ECHS sites received support from discretionary RTTT funds. At ESE’s request, UMDI’s evaluation efforts focused on the six sites that received Goal 4E funds. The evaluation questions specific to the STEM ECHS evaluation are listed below. Process Evaluation Questions P1. In what ways have grantees developed and implemented STEM ECHS components? What are the
major challenges to and facilitators of successful program implementation encountered by grantees? What midcourse corrections and attempts to overcome challenges have been undertaken? What additional steps are planned?
P2. In what ways has ESE implemented the STEM ECHS program components described in their RTTT grant application? What are the major challenges to and facilitators of program support and facilitation encountered by ESE? How have challenges been overcome and midcourse corrections undertaken? What additional steps are planned?
P3. How do STEM ECHS teachers and administrators rate and explain the quality, relevance, and effectiveness of major program components and services?
P4. What infrastructure, systems, and processes were put in place to aid STEM ECHS sustainability during and beyond the grant period? What are the greatest challenges and barriers to creating sustainability?
Outcome Evaluation Questions O1. To what extent are STEM ECHS students achieving improved outcomes in college and career
readiness indicators including measures of academic achievement (e.g., MCAS), graduation, and accumulation of high school and college credits?
O2. Do observed changes in STEM ECHS students differ across student characteristics such as gender, race/ethnicity, free/reduced lunch status, ELL status, and special education status? Is there evidence that gaps are narrowing? Are program services reaching students who are at the greatest risk?
O3. To what extent are observed changes in student outcomes attributable to STEM ECHS activities versus other RTTT program activities and/or measurable contextual variables?
O4. What are the major differences in STEM ECHS implementation and contextual variables across schools whose levels of improvement on student outcomes differ substantially?
O5. What is the relationship between level of STEM ECHS program implementation and achievement of targeted student outcomes?
Methods This report includes information collected from the following data sources:
RTTT C&CR Annual Evaluation Report, September 2014
UMass Donahue Institute Applied Research and Program Evaluation
49
• Interviews with STEM ECHS administrators and Institute of Higher Education (IHE) partners, ESE, and Jobs for the Future (JFF).
o Phone interviews (60 minutes) were conducted with administrators from five of the six sites in January and February 2014 (see interview protocol in Appendix G). One in-person interview was conducted with an administrator from the sixth Goal 4E site in February 2014.
o Phone interviews (60 minutes) were conducted with representatives from the IHE partners of each of the six sites in April 2014 (see protocol in Appendix H).
o A phone interview (60 minutes) was conducted with a representative from Jobs for the Future in April 2014 (JFF; see protocol in Appendix I).
o An interview (25 minutes) was conducted with ESE’s project director and STEM ECHS program manager in May 2014.
• Personnel Survey. An online survey was sent in March 2014 to all STEM ECHS personnel identified by STEM ECHS administrators (see protocol in Appendix J).
• Supplemental student data request. Supplemental data requests were prepared for STEM ECHS sites, asking them to indicate which students are receiving services, and to provide attendance and credit accumulation data that are not included in state databases but are needed for answering evaluation questions. Supplemental data were submitted by all sites in September 2013 and by four of the six sites in June 2014.
• Document review. UMDI reviewed Year 4 Continuation Reports that were submitted by each STEM ECHS site.
• ESE databases and documents. SIMS and MCAS data from 2012, 2013, and 2014 were used to compile demographic, attendance, and performance data for STEM ECHS participants, and for students from the schools from which the STEM ECHS participants were selected.
Findings Findings are presented in relation to the process and outcome evaluation questions. Process questions P1 and P3 are addressed in the successes, challenges, and survey results sections. Questions P2 and P4 are addressed in the sections on challenges, next steps, and feedback for ESE. The outcome questions are addressed with the presentation of quantitative summaries for each of the STEM ECHSs. Successes Many of the successes reported during Year 4 by sites and their IHE partners were similar to those reported during previous years, and a brief summary of reported successes is presented below.
All six of the STEM ECHS sites are operational. All six sites reported that STEM ECHS courses and activities were running smoothly. Similar to previous years, several sites noted that they made significant changes to their original plans for STEM ECHS programming in order to accommodate challenges such as logistics and personnel matters, as described in the challenges section below.
STEM ECHS students are engaging with STEM content and are confident in their abilities.
Interviewees at all sites reported that STEM ECHS students were engaging with STEM content, and that most students were meeting or exceeding expectations for academic development and performance.
RTTT C&CR Annual Evaluation Report, September 2014
UMass Donahue Institute Applied Research and Program Evaluation
50
College experiences for students. Students at five sites enrolled in one or more credit-bearing,
college-level courses. During Year 3, administrators at these sites reported a preference for students taking college courses at college campuses, but during Year 4 all but one of these sites stated that logistical and budgetary constraints made it preferable to locate college courses at the high school building. The IHE partner of the fifth site was pushing to have STEM ECHS courses moved off campus, preferably to an online format, in order to reduce costs. Even when attending courses on college campuses was not feasible, administrators agreed that participation in college courses has been a very important part of students’ STEM ECHS experience.
Strong support from school and district leaders. Most STEM ECHS administrators said that
they continued to receive strong support from district-level administrators during Year 4, and that the program was well received by district leadership and staff. Interviewees stated that continued support and commitment from district leadership was critical to the continued success of the STEM ECHS. Several sites also reported that they have received continued support from their district to promote the STEM ECHS to students, parents, community members, and the business community.
Partnerships between districts and IHEs continued to deepen. Most sites indicated that their
relationship with their IHE partner(s) has become clearer, and that their IHE partner had been positive and supportive. Regular meetings between STEM ECHS personnel and IHE partners had been instituted at four of six sites. One interviewee said, “Our partnership is going well—no problems …. There is a monthly meeting with [our IHE partner], the program director, the head guidance counselor, the head of the school internship program, and two of the instructors who taught college.” Similarly, most IHE partners indicated that their partnership with the STEM ECHS continued to move in a positive direction. As previously noted, service and course delivery have shifted at several sites (e.g., on-campus classes have been shifted to high schools, selection of course offerings has been revised).
All sites with students enrolled in college courses continued to work with their IHE partner(s) to maximize the likelihood that the program could be sustained over time. For example, one IHE partner continued the work of institutionalizing the administrative and personnel structures needed to support the STEM ECHS (i.e., identifying and organizing resources to support program operation). This site views their STEM ECHS partnership as an opportunity to have a lasting impact on the local school system and community. This year two additional IHE partners hired community engagement liaisons who were responsible for managing relationships with local high schools, including STEM ECHS partnerships. Making connections between middle schools and high schools. The Year 3 evaluation reported that three sites were attempting to integrate middle and high school learning experiences into a comprehensive STEM ECHS experience, and that none of the sites had clearly articulated a plan for bridging the two school levels. During Year 4 two of these sites reported that they had made significant progress in connecting their middle school and high school STEM ECHS activities. One site reported that their district had created a new district-level administrative position, in part, to ensure that a cohesive vision for STEM activities was being implemented across the middle and high school programs.
Marlborough a standout success. Several sites, ESE, and JFF identified Marlborough as a standout success. One interviewee said, “Marlborough, by anyone’s definition, is successful.” During the RTTT funding period, Marlborough was able to realize several key elements of its vision for a grades 6–12 STEM ECHS program. Key indicators of Marlborough’s success include: (1) adding STEM programming at one grade level at each of the middle school and high school buildings during each year of the grant, (2) developing and implementing key components of a STEM-centric curriculum (e.g.,
RTTT C&CR Annual Evaluation Report, September 2014
UMass Donahue Institute Applied Research and Program Evaluation
51
project-based learning, cross-curricular activities, one-to-one laptops for all participants), (3) developing a system of supports for students and teachers engaged with STEM ECHS activities (e.g., reduced class size, STEM team meeting period), and (4) successfully enrolling a cohort of STEM ECHS students in one college-level course. Marlborough partnered with JFF to submit a grant application to the Department of Labor, and in 2014 they were awarded $1.8 million to continue and expand their STEM ECHS activities.
Collaboration across Massachusetts. ESE and JFF reported that efforts to coordinate early college activities that are taking place across Massachusetts were gaining momentum. When asked to describe the successes of the STEM ECHS initiative, ESE said,
The victories we have had with this $720K investment over four years are not only the individual successes we saw at these “laboratories,” but also that we are starting to get a little bit of traction around early college design pathways. We are trying to figure out how to incorporate [various dual-enrollment programs and efforts] from across the Commonwealth. The victory statewide is that we are starting to get some traction on what this might look like. I think [ESE] is starting to provide some leadership, along with some of our [Department of Higher Education] friends.
Challenges
Sustainability. All site administrators and IHE partners who were interviewed said that securing the financial resources to sustain the STEM ECHS programs was their primary concern. Several reported that members of their planning and leadership committees were acutely aware of anticipated budgetary shortfalls, and most sites were planning to reduce or eliminate key program services if alternative funding sources were not secured. For example, several interviewees said that without outside financial support it would be extremely difficult for their STEM ECHS to offer college experiences for students, and that college course offerings would be eliminated or significantly reduced after the RTTT grant expired. Several interviewees expressed disappointment that ESE had no apparent plans to continue funding the STEM ECHS sites after the RTTT grant period. During Year 3 most interviewees indicated that they had made efforts to reach out to local and regional businesses for support, and all reported that this was a difficult task. Only two sites reported that they had reached out to local or regional businesses for support during Year 4. One site reported during Year 3 that they had obtained 501(c)(3) status, but during Year 4 UMDI learned that their 501(c)(3) status had not been formally approved. This required administrators at the site to postpone plans to reach out to possible corporate sponsors. ESE emphasized that the state “did not put enough investment into any of these schools for them to be wholly successful,” and that the financial burden for sustaining the STEM ECHS programs also falls largely on the districts. ESE also noted that, at the state level, it is difficult to form a broad coalition of support to sustain STEM ECHS programs. ESE said, “There really isn’t a constituency to advocate for this, to lobby for it, and no one was really grabbing onto this as much as they should.” Logistics. Just as in Year 3, all sites reported significant logistical challenges that included course location, scheduling, and timing; different numbers of students across cohorts; transportation; staffing; and assessments. Administrators at each implementing site said that their leadership teams were working closely to address these logistical concerns, many of which had been difficult to anticipate. Continuity. During Year 4, five of the six STEM ECHS sites experienced one or more significant transitions in district, school, program, and/or IHE partner leadership. Three districts reported
RTTT C&CR Annual Evaluation Report, September 2014
UMass Donahue Institute Applied Research and Program Evaluation
52
difficulty maintaining the continuity of their planning team, which disrupted work that was in progress. Several IHE partners said that it had been somewhat difficult to work with the STEM ECHS because there had been turnover in district, school, and/or program personnel. Limited staffing capacity. Two sites reported that a lack of staffing capacity had been a challenge during Years 3 and 4. Administrators from these sites reported that engaging individuals within their district for support had been difficult, because everyone was already working at capacity. One interviewee said that his school lacked sufficient personnel to realize their original vision for a STEM ECHS, and that this realization had dampened the enthusiasm of several individuals who had invested significant personal and professional energy into the program. Formalizing agreements with IHE partners. All districts continued to work with their IHE partner(s) to formalize or refine plans for integrating college courses into students’ STEM ECHS experiences. Two sites reported significant shifts in the content or structure of students’ college experiences (i.e., changes in courses offered, location of courses, and/or number of students served). Just as in Year 3, one STEM ECHS administrator at a site where students are currently enrolled in college courses said that their district had not yet finalized an MOU with their IHE partner, but that the lack of an MOU had not slowed the work. Levels of student preparedness. Most sites and IHE partners reported that they had continued concerns about students’ level of academic preparedness for the planned STEM coursework at both the high school and college levels. Two sites noted that students had some difficulty transitioning from middle school to high school curricula. One administrator said, “Students are making a big jump from 8th-grade science curriculum to honors-level science curriculum. Getting the students to stay after school to receive support is a challenge. The kids who need it the most are the kids who are not staying after.”
Diversity. All of the STEM ECHS sites set out to serve students from underrepresented, high needs, and/or at-risk populations, and during Year 3 half of the sites explicitly focused on recruiting and selecting students from these populations. During Year 4, however, the number of STEM ECHS applicants dipped at four of the six sites, which resulted in program administrators accepting all applicants in order to serve a full cohort of students. The targeted populations were not well-represented among these applicants, so the population of students served at those sites during Year 4 was less diverse than it had been in previous years.
Reduced level of technical assistance. Several sites indicated that they had received less support
from JFF, and that JFF had assigned a new consultant to the project. Both of these changes were perceived as challenges. One interviewee said, “This year less support was offered. The transition from Janice Davis to a new consultant was not well communicated. Sites did not understand that there was going to be a reduced level of service and support.” Participation and Outcomes by Site The following site profiles highlight participation and outcomes for five of the six STEM ECHS sites. A profile is not presented for Dearborn because that site did not submit their participation data. At the time this report was prepared, Randolph had also not submitted data for the 2013–2014 school year. Program design and participation varied widely by site, and the outcome measures included in this report for each site vary because some outcome measures are not relevant at some sites (e.g., no graduation rate information is included for Marlborough, because none of their STEM ECHS participants reached 12th grade during the grant period).
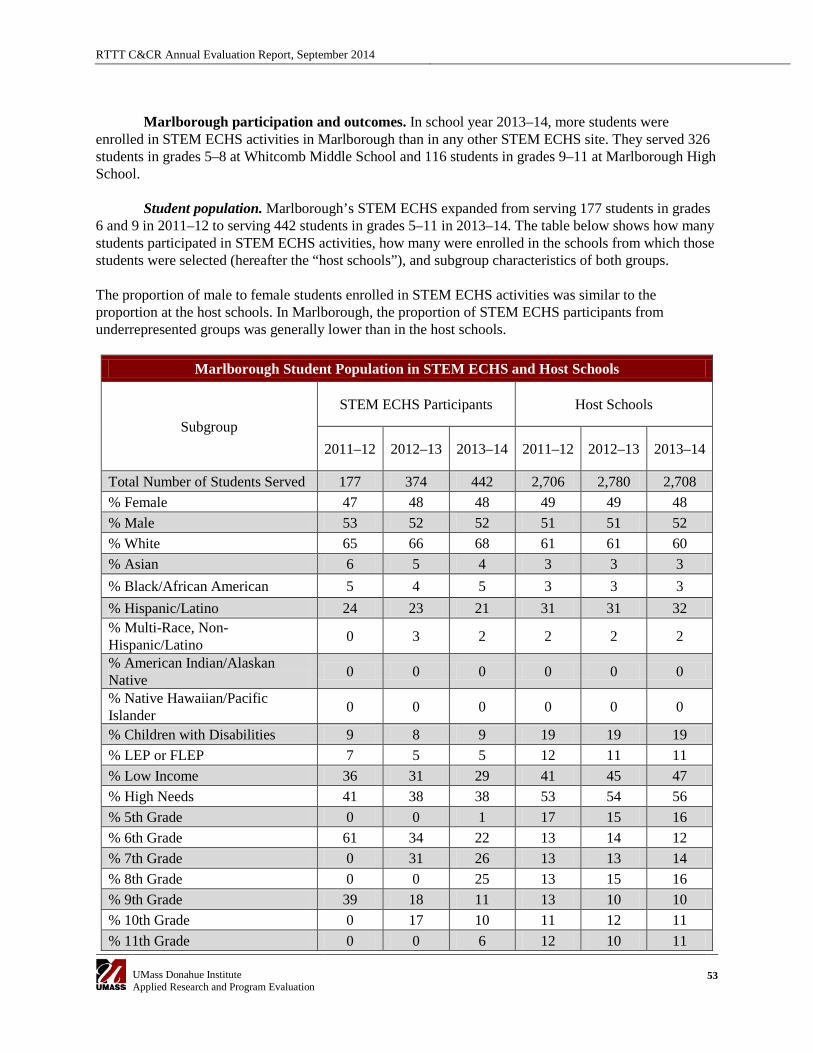
RTTT C&CR Annual Evaluation Report, September 2014
UMass Donahue Institute Applied Research and Program Evaluation
53
Marlborough participation and outcomes. In school year 2013–14, more students were
enrolled in STEM ECHS activities in Marlborough than in any other STEM ECHS site. They served 326 students in grades 5–8 at Whitcomb Middle School and 116 students in grades 9–11 at Marlborough High School.
Student population. Marlborough’s STEM ECHS expanded from serving 177 students in grades 6 and 9 in 2011–12 to serving 442 students in grades 5–11 in 2013–14. The table below shows how many students participated in STEM ECHS activities, how many were enrolled in the schools from which those students were selected (hereafter the “host schools”), and subgroup characteristics of both groups. The proportion of male to female students enrolled in STEM ECHS activities was similar to the proportion at the host schools. In Marlborough, the proportion of STEM ECHS participants from underrepresented groups was generally lower than in the host schools.
Marlborough Student Population in STEM ECHS and Host Schools
Subgroup STEM ECHS Participants Host Schools
2011–12 2012–13 2013–14 2011–12 2012–13 2013–14
Total Number of Students Served 177 374 442 2,706 2,780 2,708 % Female 47 48 48 49 49 48 % Male 53 52 52 51 51 52 % White 65 66 68 61 61 60 % Asian 6 5 4 3 3 3 % Black/African American 5 4 5 3 3 3 % Hispanic/Latino 24 23 21 31 31 32 % Multi-Race, Non-Hispanic/Latino 0 3 2 2 2 2
% American Indian/Alaskan Native 0 0 0 0 0 0
% Native Hawaiian/Pacific Islander 0 0 0 0 0 0
% Children with Disabilities 9 8 9 19 19 19 % LEP or FLEP 7 5 5 12 11 11 % Low Income 36 31 29 41 45 47 % High Needs 41 38 38 53 54 56 % 5th Grade 0 0 1 17 15 16 % 6th Grade 61 34 22 13 14 12 % 7th Grade 0 31 26 13 13 14 % 8th Grade 0 0 25 13 15 16 % 9th Grade 39 18 11 13 10 10 % 10th Grade 0 17 10 11 12 11 % 11th Grade 0 0 6 12 10 11
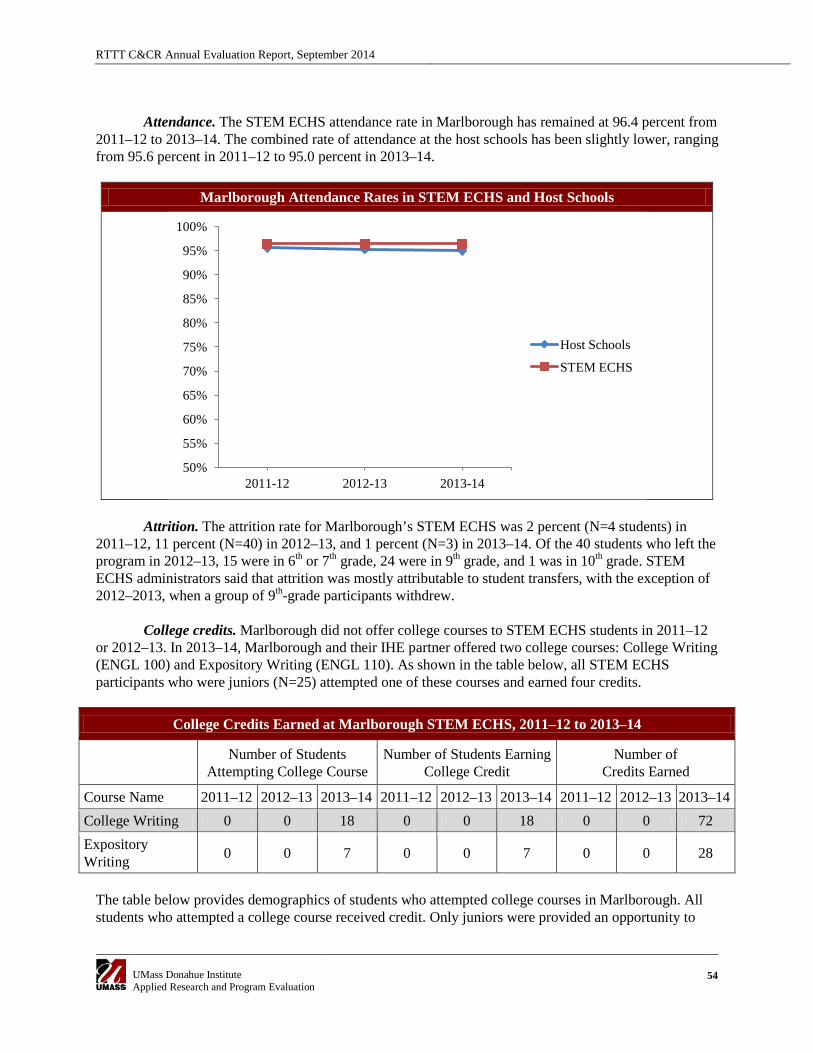
RTTT C&CR Annual Evaluation Report, September 2014
UMass Donahue Institute Applied Research and Program Evaluation
54
Attendance. The STEM ECHS attendance rate in Marlborough has remained at 96.4 percent from
2011–12 to 2013–14. The combined rate of attendance at the host schools has been slightly lower, ranging from 95.6 percent in 2011–12 to 95.0 percent in 2013–14.
Marlborough Attendance Rates in STEM ECHS and Host Schools
Attrition. The attrition rate for Marlborough’s STEM ECHS was 2 percent (N=4 students) in
2011–12, 11 percent (N=40) in 2012–13, and 1 percent (N=3) in 2013–14. Of the 40 students who left the program in 2012–13, 15 were in 6th or 7th grade, 24 were in 9th grade, and 1 was in 10th grade. STEM ECHS administrators said that attrition was mostly attributable to student transfers, with the exception of 2012–2013, when a group of 9th-grade participants withdrew.
College credits. Marlborough did not offer college courses to STEM ECHS students in 2011–12
or 2012–13. In 2013–14, Marlborough and their IHE partner offered two college courses: College Writing (ENGL 100) and Expository Writing (ENGL 110). As shown in the table below, all STEM ECHS participants who were juniors (N=25) attempted one of these courses and earned four credits.
College Credits Earned at Marlborough STEM ECHS, 2011–12 to 2013–14
Number of Students Attempting College Course
Number of Students Earning College Credit
Number of Credits Earned
Course Name 2011–12 2012–13 2013–14 2011–12 2012–13 2013–14 2011–12 2012–13 2013–14 College Writing 0 0 18 0 0 18 0 0 72 Expository Writing 0 0 7 0 0 7 0 0 28
The table below provides demographics of students who attempted college courses in Marlborough. All students who attempted a college course received credit. Only juniors were provided an opportunity to
50%
55%
60%
65%
70%
75%
80%
85%
90%
95%
100%
2011-12 2012-13 2013-14
Host Schools
STEM ECHS
RTTT C&CR Annual Evaluation Report, September 2014
UMass Donahue Institute Applied Research and Program Evaluation
55
participate in college courses in Marlborough, and only those who qualified to participate in a college course were counted as STEM ECHS participants.
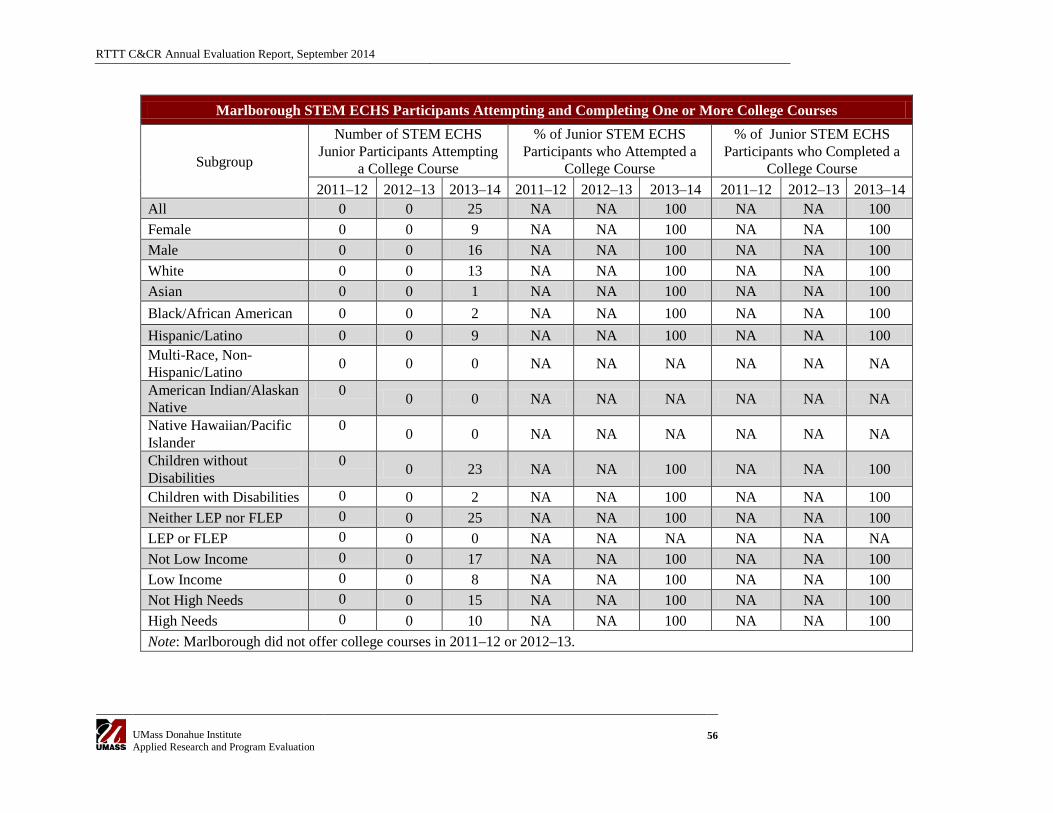
RTTT C&CR Annual Evaluation Report, September 2014
UMass Donahue Institute Applied Research and Program Evaluation
56
Marlborough STEM ECHS Participants Attempting and Completing One or More College Courses
Subgroup
Number of STEM ECHS Junior Participants Attempting
a College Course
% of Junior STEM ECHS Participants who Attempted a
College Course
% of Junior STEM ECHS Participants who Completed a
College Course 2011–12 2012–13 2013–14 2011–12 2012–13 2013–14 2011–12 2012–13 2013–14
All 0 0 25 NA NA 100 NA NA 100 Female 0 0 9 NA NA 100 NA NA 100 Male 0 0 16 NA NA 100 NA NA 100 White 0 0 13 NA NA 100 NA NA 100 Asian 0 0 1 NA NA 100 NA NA 100 Black/African American 0 0 2 NA NA 100 NA NA 100 Hispanic/Latino 0 0 9 NA NA 100 NA NA 100 Multi-Race, Non-Hispanic/Latino 0 0 0 NA NA NA NA NA NA
American Indian/Alaskan Native
0 0 0 NA NA NA NA NA NA
Native Hawaiian/Pacific Islander
0 0 0 NA NA NA NA NA NA
Children without Disabilities
0 0 23 NA NA 100 NA NA 100
Children with Disabilities 0 0 2 NA NA 100 NA NA 100 Neither LEP nor FLEP 0 0 25 NA NA 100 NA NA 100 LEP or FLEP 0 0 0 NA NA NA NA NA NA Not Low Income 0 0 17 NA NA 100 NA NA 100 Low Income 0 0 8 NA NA 100 NA NA 100 Not High Needs 0 0 15 NA NA 100 NA NA 100 High Needs 0 0 10 NA NA 100 NA NA 100 Note: Marlborough did not offer college courses in 2011–12 or 2012–13.
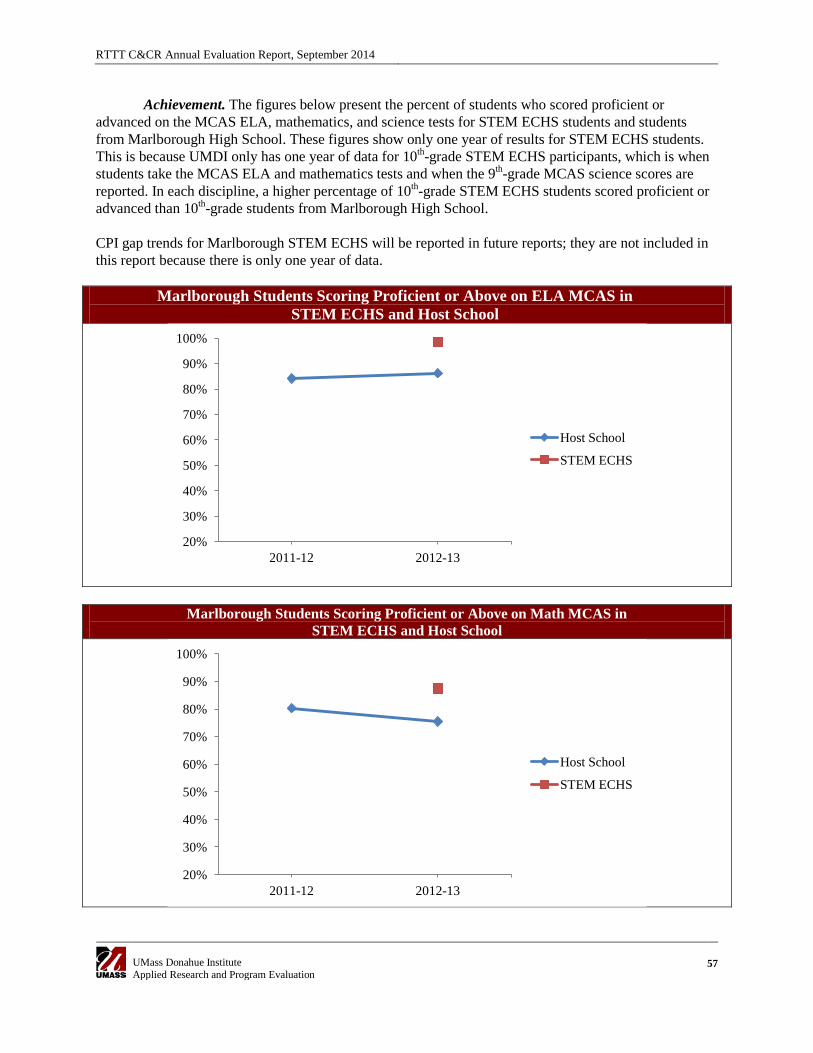
RTTT C&CR Annual Evaluation Report, September 2014
UMass Donahue Institute Applied Research and Program Evaluation
57
Achievement. The figures below present the percent of students who scored proficient or advanced on the MCAS ELA, mathematics, and science tests for STEM ECHS students and students from Marlborough High School. These figures show only one year of results for STEM ECHS students. This is because UMDI only has one year of data for 10th-grade STEM ECHS participants, which is when students take the MCAS ELA and mathematics tests and when the 9th-grade MCAS science scores are reported. In each discipline, a higher percentage of 10th-grade STEM ECHS students scored proficient or advanced than 10th-grade students from Marlborough High School.
CPI gap trends for Marlborough STEM ECHS will be reported in future reports; they are not included in this report because there is only one year of data.
Marlborough Students Scoring Proficient or Above on ELA MCAS in STEM ECHS and Host School
Marlborough Students Scoring Proficient or Above on Math MCAS in
STEM ECHS and Host School
20%
30%
40%
50%
60%
70%
80%
90%
100%
2011-12 2012-13
Host School
STEM ECHS
20%
30%
40%
50%
60%
70%
80%
90%
100%
2011-12 2012-13
Host School
STEM ECHS
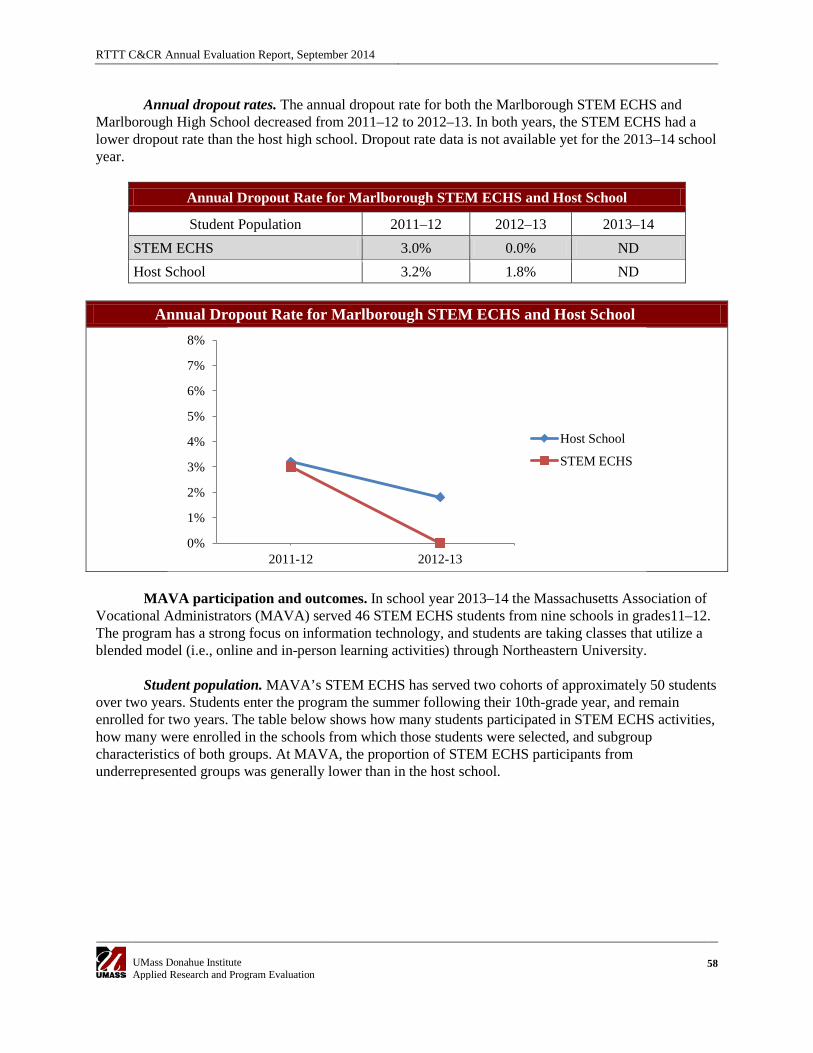
RTTT C&CR Annual Evaluation Report, September 2014
UMass Donahue Institute Applied Research and Program Evaluation
58
Annual dropout rates. The annual dropout rate for both the Marlborough STEM ECHS and Marlborough High School decreased from 2011–12 to 2012–13. In both years, the STEM ECHS had a lower dropout rate than the host high school. Dropout rate data is not available yet for the 2013–14 school year.
Annual Dropout Rate for Marlborough STEM ECHS and Host School
Student Population 2011–12 2012–13 2013–14 STEM ECHS 3.0% 0.0% ND Host School 3.2% 1.8% ND
Annual Dropout Rate for Marlborough STEM ECHS and Host School
MAVA participation and outcomes. In school year 2013–14 the Massachusetts Association of Vocational Administrators (MAVA) served 46 STEM ECHS students from nine schools in grades11–12. The program has a strong focus on information technology, and students are taking classes that utilize a blended model (i.e., online and in-person learning activities) through Northeastern University.
Student population. MAVA’s STEM ECHS has served two cohorts of approximately 50 students over two years. Students enter the program the summer following their 10th-grade year, and remain enrolled for two years. The table below shows how many students participated in STEM ECHS activities, how many were enrolled in the schools from which those students were selected, and subgroup characteristics of both groups. At MAVA, the proportion of STEM ECHS participants from underrepresented groups was generally lower than in the host school.
0%
1%
2%
3%
4%
5%
6%
7%
8%
2011-12 2012-13
Host School
STEM ECHS
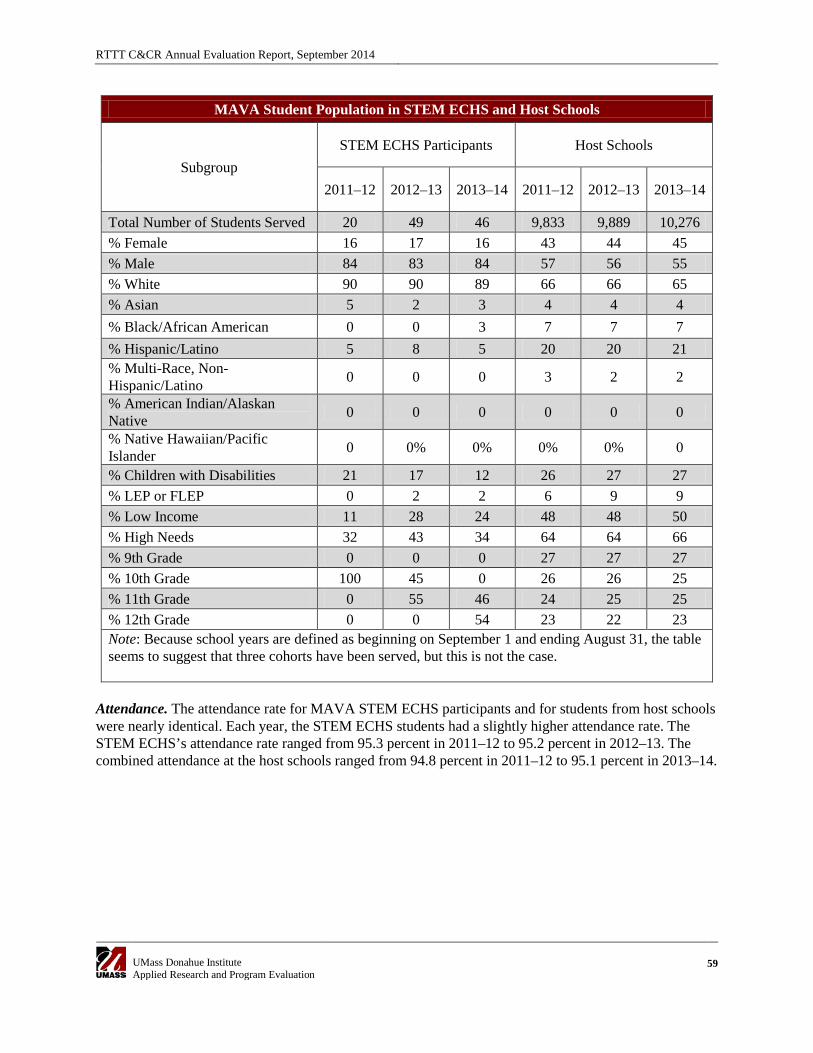
RTTT C&CR Annual Evaluation Report, September 2014
UMass Donahue Institute Applied Research and Program Evaluation
59
MAVA Student Population in STEM ECHS and Host Schools
Subgroup STEM ECHS Participants Host Schools
2011–12 2012–13 2013–14 2011–12 2012–13 2013–14
Total Number of Students Served 20 49 46 9,833 9,889 10,276 % Female 16 17 16 43 44 45 % Male 84 83 84 57 56 55 % White 90 90 89 66 66 65 % Asian 5 2 3 4 4 4 % Black/African American 0 0 3 7 7 7 % Hispanic/Latino 5 8 5 20 20 21 % Multi-Race, Non-Hispanic/Latino 0 0 0 3 2 2
% American Indian/Alaskan Native 0 0 0 0 0 0
% Native Hawaiian/Pacific Islander 0 0% 0% 0% 0% 0
% Children with Disabilities 21 17 12 26 27 27 % LEP or FLEP 0 2 2 6 9 9 % Low Income 11 28 24 48 48 50 % High Needs 32 43 34 64 64 66 % 9th Grade 0 0 0 27 27 27 % 10th Grade 100 45 0 26 26 25 % 11th Grade 0 55 46 24 25 25 % 12th Grade 0 0 54 23 22 23 Note: Because school years are defined as beginning on September 1 and ending August 31, the table seems to suggest that three cohorts have been served, but this is not the case.
Attendance. The attendance rate for MAVA STEM ECHS participants and for students from host schools were nearly identical. Each year, the STEM ECHS students had a slightly higher attendance rate. The STEM ECHS’s attendance rate ranged from 95.3 percent in 2011–12 to 95.2 percent in 2012–13. The combined attendance at the host schools ranged from 94.8 percent in 2011–12 to 95.1 percent in 2013–14.
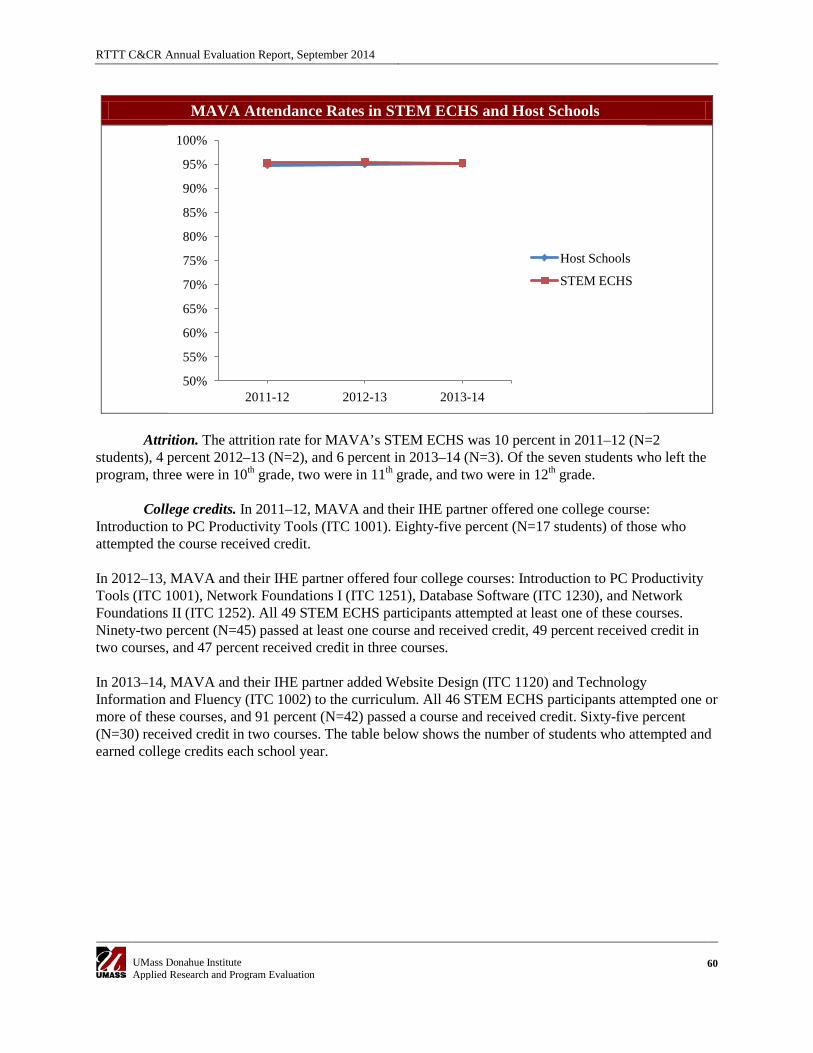
RTTT C&CR Annual Evaluation Report, September 2014
UMass Donahue Institute Applied Research and Program Evaluation
60
MAVA Attendance Rates in STEM ECHS and Host Schools
Attrition. The attrition rate for MAVA’s STEM ECHS was 10 percent in 2011–12 (N=2 students), 4 percent 2012–13 (N=2), and 6 percent in 2013–14 (N=3). Of the seven students who left the program, three were in 10th grade, two were in 11th grade, and two were in 12th grade.
College credits. In 2011–12, MAVA and their IHE partner offered one college course: Introduction to PC Productivity Tools (ITC 1001). Eighty-five percent (N=17 students) of those who attempted the course received credit. In 2012–13, MAVA and their IHE partner offered four college courses: Introduction to PC Productivity Tools (ITC 1001), Network Foundations I (ITC 1251), Database Software (ITC 1230), and Network Foundations II (ITC 1252). All 49 STEM ECHS participants attempted at least one of these courses. Ninety-two percent (N=45) passed at least one course and received credit, 49 percent received credit in two courses, and 47 percent received credit in three courses. In 2013–14, MAVA and their IHE partner added Website Design (ITC 1120) and Technology Information and Fluency (ITC 1002) to the curriculum. All 46 STEM ECHS participants attempted one or more of these courses, and 91 percent (N=42) passed a course and received credit. Sixty-five percent (N=30) received credit in two courses. The table below shows the number of students who attempted and earned college credits each school year.
50%
55%
60%
65%
70%
75%
80%
85%
90%
95%
100%
2011-12 2012-13 2013-14
Host Schools
STEM ECHS
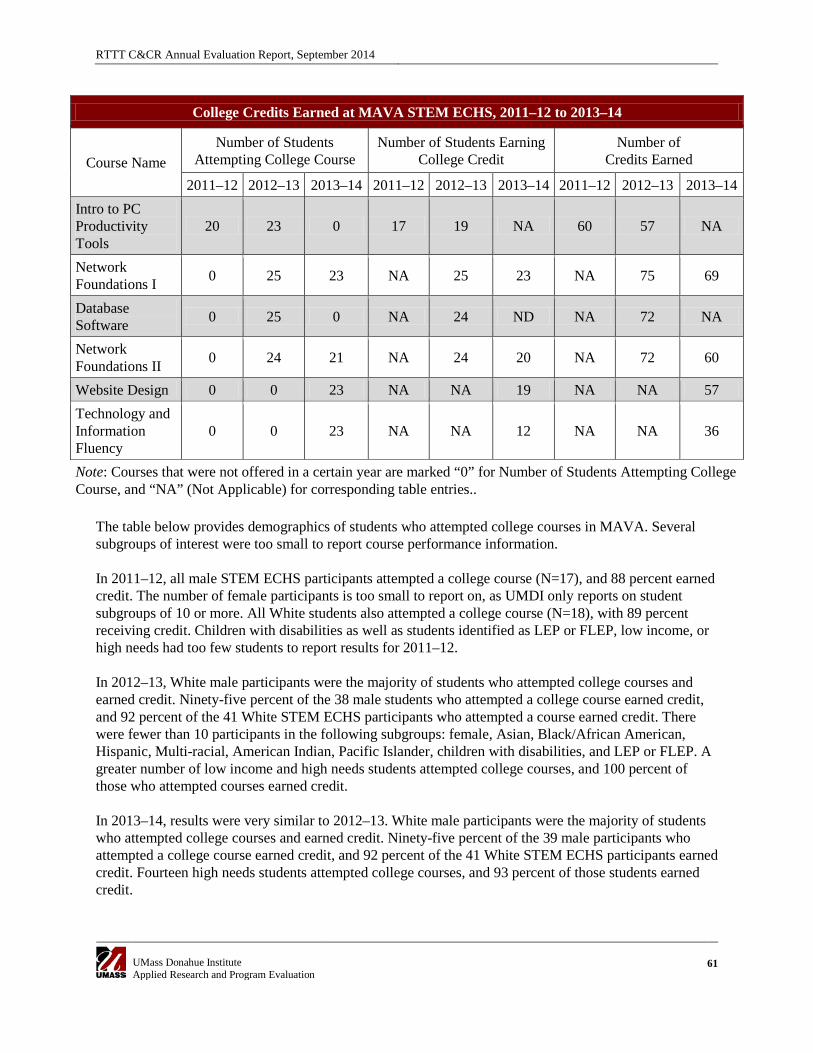
RTTT C&CR Annual Evaluation Report, September 2014
UMass Donahue Institute Applied Research and Program Evaluation
61
College Credits Earned at MAVA STEM ECHS, 2011–12 to 2013–14
Course Name Number of Students
Attempting College Course Number of Students Earning
College Credit Number of
Credits Earned
2011–12 2012–13 2013–14 2011–12 2012–13 2013–14 2011–12 2012–13 2013–14 Intro to PC Productivity Tools
20 23 0 17 19 NA 60 57 NA
Network Foundations I 0 25 23 NA 25 23 NA 75 69
Database Software 0 25 0 NA 24 ND NA 72 NA
Network Foundations II 0 24 21 NA 24 20 NA 72 60
Website Design 0 0 23 NA NA 19 NA NA 57 Technology and Information Fluency
0 0 23 NA NA 12 NA NA 36
Note: Courses that were not offered in a certain year are marked “0” for Number of Students Attempting College Course, and “NA” (Not Applicable) for corresponding table entries..
The table below provides demographics of students who attempted college courses in MAVA. Several subgroups of interest were too small to report course performance information. In 2011–12, all male STEM ECHS participants attempted a college course (N=17), and 88 percent earned credit. The number of female participants is too small to report on, as UMDI only reports on student subgroups of 10 or more. All White students also attempted a college course (N=18), with 89 percent receiving credit. Children with disabilities as well as students identified as LEP or FLEP, low income, or high needs had too few students to report results for 2011–12. In 2012–13, White male participants were the majority of students who attempted college courses and earned credit. Ninety-five percent of the 38 male students who attempted a college course earned credit, and 92 percent of the 41 White STEM ECHS participants who attempted a course earned credit. There were fewer than 10 participants in the following subgroups: female, Asian, Black/African American, Hispanic, Multi-racial, American Indian, Pacific Islander, children with disabilities, and LEP or FLEP. A greater number of low income and high needs students attempted college courses, and 100 percent of those who attempted courses earned credit. In 2013–14, results were very similar to 2012–13. White male participants were the majority of students who attempted college courses and earned credit. Ninety-five percent of the 39 male participants who attempted a college course earned credit, and 92 percent of the 41 White STEM ECHS participants earned credit. Fourteen high needs students attempted college courses, and 93 percent of those students earned credit.
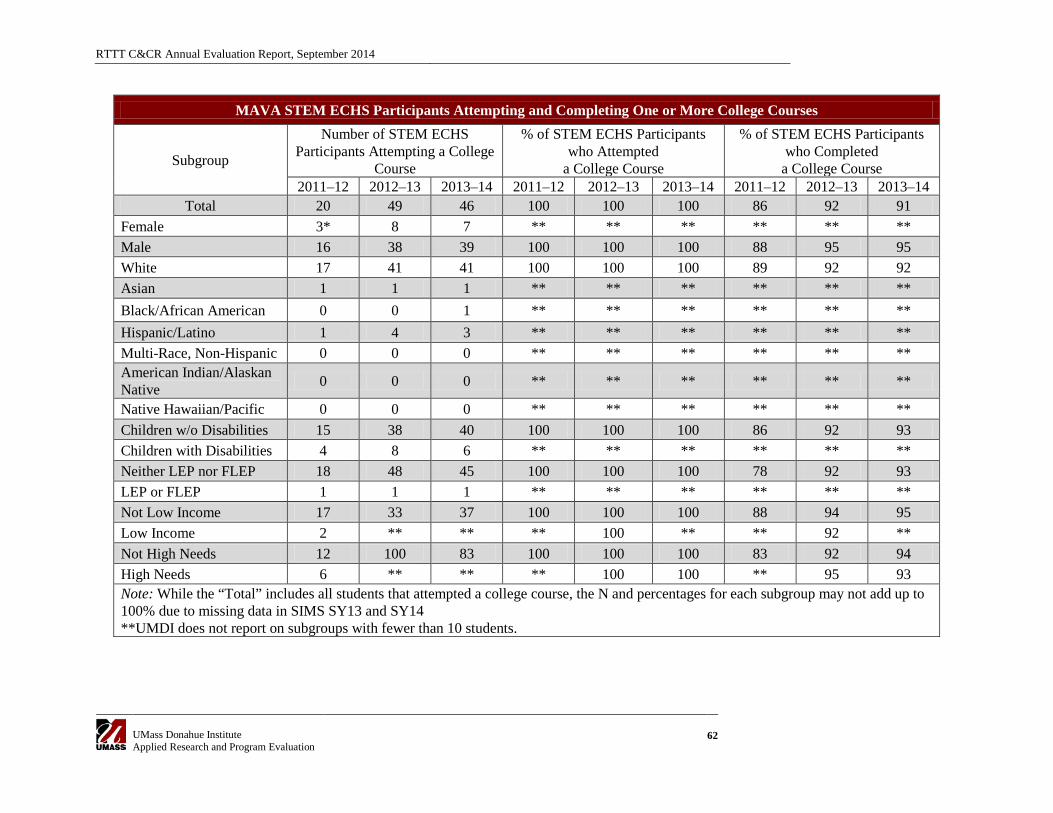
RTTT C&CR Annual Evaluation Report, September 2014
UMass Donahue Institute Applied Research and Program Evaluation
62
MAVA STEM ECHS Participants Attempting and Completing One or More College Courses
Subgroup
Number of STEM ECHS Participants Attempting a College
Course
% of STEM ECHS Participants who Attempted
a College Course
% of STEM ECHS Participants who Completed
a College Course 2011–12 2012–13 2013–14 2011–12 2012–13 2013–14 2011–12 2012–13 2013–14
Total 20 49 46 100 100 100 86 92 91 Female 3* 8 7 ** ** ** ** ** ** Male 16 38 39 100 100 100 88 95 95 White 17 41 41 100 100 100 89 92 92 Asian 1 1 1 ** ** ** ** ** ** Black/African American 0 0 1 ** ** ** ** ** ** Hispanic/Latino 1 4 3 ** ** ** ** ** ** Multi-Race, Non-Hispanic 0 0 0 ** ** ** ** ** ** American Indian/Alaskan Native 0 0 0 ** ** ** ** ** **
Native Hawaiian/Pacific 0 0 0 ** ** ** ** ** ** Children w/o Disabilities 15 38 40 100 100 100 86 92 93 Children with Disabilities 4 8 6 ** ** ** ** ** ** Neither LEP nor FLEP 18 48 45 100 100 100 78 92 93 LEP or FLEP 1 1 1 ** ** ** ** ** ** Not Low Income 17 33 37 100 100 100 88 94 95 Low Income 2 ** ** ** 100 ** ** 92 ** Not High Needs 12 100 83 100 100 100 83 92 94 High Needs 6 ** ** ** 100 100 ** 95 93 Note: While the “Total” includes all students that attempted a college course, the N and percentages for each subgroup may not add up to 100% due to missing data in SIMS SY13 and SY14 **UMDI does not report on subgroups with fewer than 10 students.
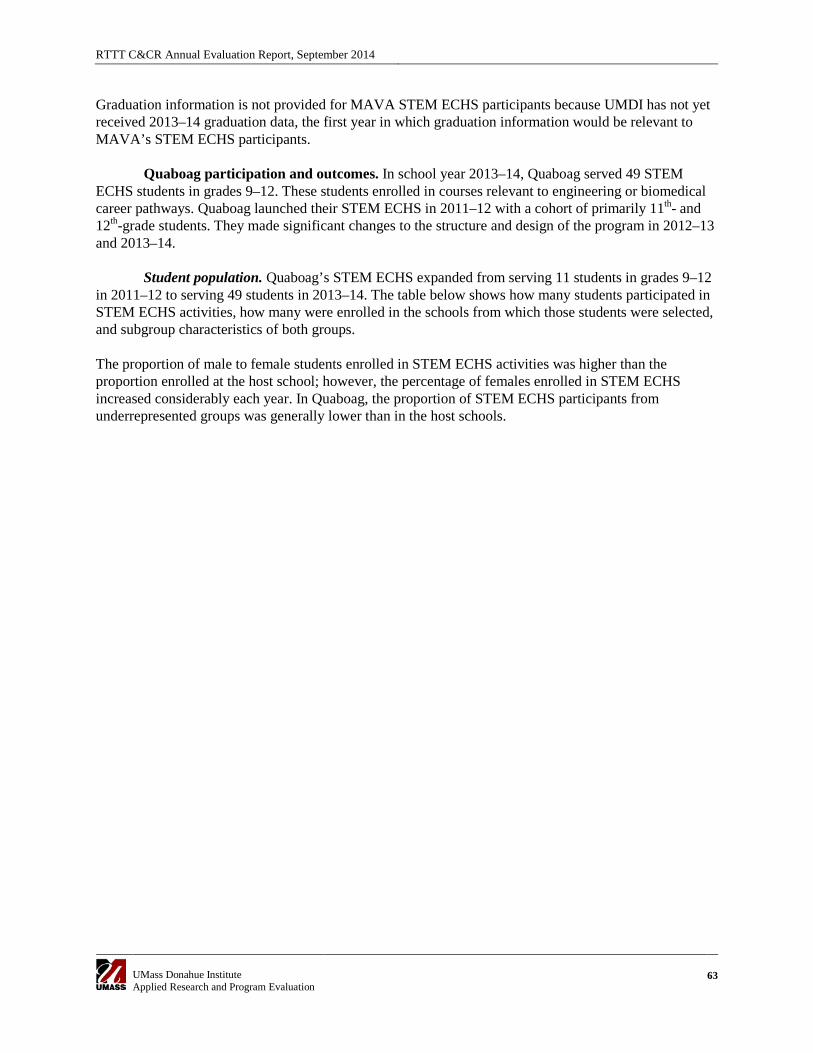
RTTT C&CR Annual Evaluation Report, September 2014
UMass Donahue Institute Applied Research and Program Evaluation
63
Graduation information is not provided for MAVA STEM ECHS participants because UMDI has not yet received 2013–14 graduation data, the first year in which graduation information would be relevant to MAVA’s STEM ECHS participants.
Quaboag participation and outcomes. In school year 2013–14, Quaboag served 49 STEM ECHS students in grades 9–12. These students enrolled in courses relevant to engineering or biomedical career pathways. Quaboag launched their STEM ECHS in 2011–12 with a cohort of primarily 11th- and 12th-grade students. They made significant changes to the structure and design of the program in 2012–13 and 2013–14.
Student population. Quaboag’s STEM ECHS expanded from serving 11 students in grades 9–12
in 2011–12 to serving 49 students in 2013–14. The table below shows how many students participated in STEM ECHS activities, how many were enrolled in the schools from which those students were selected, and subgroup characteristics of both groups.
The proportion of male to female students enrolled in STEM ECHS activities was higher than the proportion enrolled at the host school; however, the percentage of females enrolled in STEM ECHS increased considerably each year. In Quaboag, the proportion of STEM ECHS participants from underrepresented groups was generally lower than in the host schools.
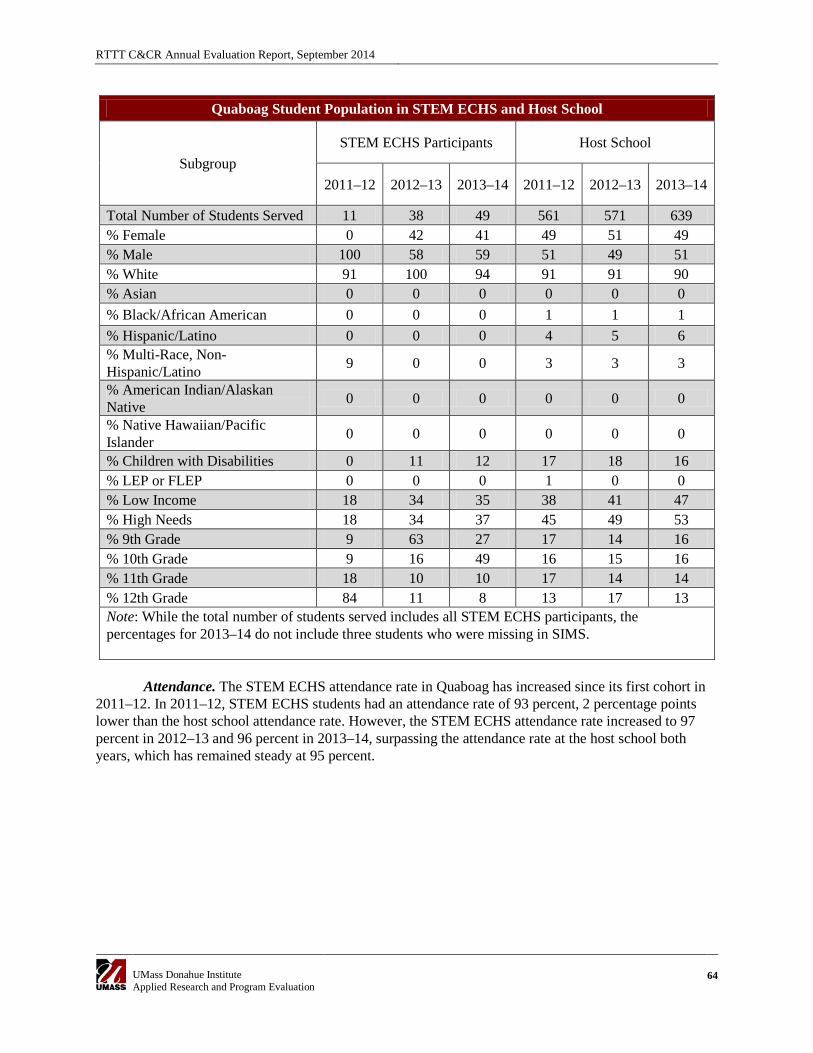
RTTT C&CR Annual Evaluation Report, September 2014
UMass Donahue Institute Applied Research and Program Evaluation
64
Quaboag Student Population in STEM ECHS and Host School
Subgroup STEM ECHS Participants Host School
2011–12 2012–13 2013–14 2011–12 2012–13 2013–14
Total Number of Students Served 11 38 49 561 571 639 % Female 0 42 41 49 51 49 % Male 100 58 59 51 49 51 % White 91 100 94 91 91 90 % Asian 0 0 0 0 0 0 % Black/African American 0 0 0 1 1 1 % Hispanic/Latino 0 0 0 4 5 6 % Multi-Race, Non-Hispanic/Latino 9 0 0 3 3 3
% American Indian/Alaskan Native 0 0 0 0 0 0
% Native Hawaiian/Pacific Islander 0 0 0 0 0 0
% Children with Disabilities 0 11 12 17 18 16 % LEP or FLEP 0 0 0 1 0 0 % Low Income 18 34 35 38 41 47 % High Needs 18 34 37 45 49 53 % 9th Grade 9 63 27 17 14 16 % 10th Grade 9 16 49 16 15 16 % 11th Grade 18 10 10 17 14 14 % 12th Grade 84 11 8 13 17 13 Note: While the total number of students served includes all STEM ECHS participants, the percentages for 2013–14 do not include three students who were missing in SIMS.
Attendance. The STEM ECHS attendance rate in Quaboag has increased since its first cohort in
2011–12. In 2011–12, STEM ECHS students had an attendance rate of 93 percent, 2 percentage points lower than the host school attendance rate. However, the STEM ECHS attendance rate increased to 97 percent in 2012–13 and 96 percent in 2013–14, surpassing the attendance rate at the host school both years, which has remained steady at 95 percent.
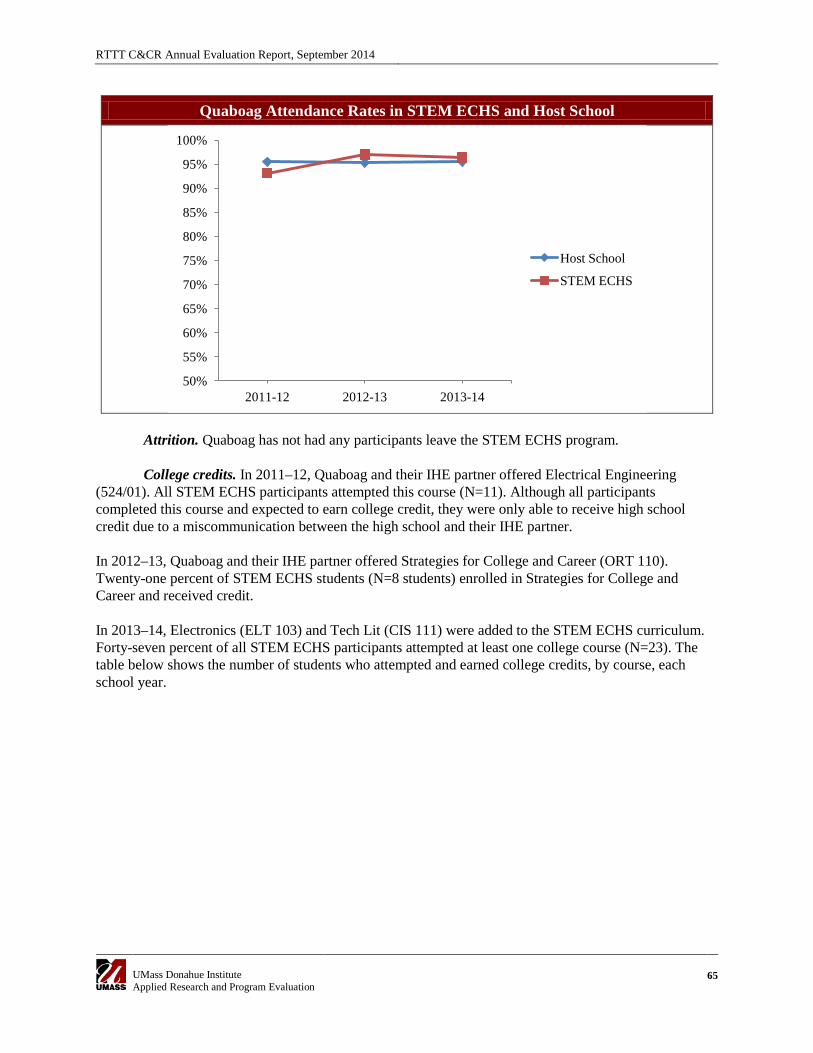
RTTT C&CR Annual Evaluation Report, September 2014
UMass Donahue Institute Applied Research and Program Evaluation
65
Quaboag Attendance Rates in STEM ECHS and Host School
Attrition. Quaboag has not had any participants leave the STEM ECHS program. College credits. In 2011–12, Quaboag and their IHE partner offered Electrical Engineering
(524/01). All STEM ECHS participants attempted this course (N=11). Although all participants completed this course and expected to earn college credit, they were only able to receive high school credit due to a miscommunication between the high school and their IHE partner. In 2012–13, Quaboag and their IHE partner offered Strategies for College and Career (ORT 110). Twenty-one percent of STEM ECHS students (N=8 students) enrolled in Strategies for College and Career and received credit. In 2013–14, Electronics (ELT 103) and Tech Lit (CIS 111) were added to the STEM ECHS curriculum. Forty-seven percent of all STEM ECHS participants attempted at least one college course (N=23). The table below shows the number of students who attempted and earned college credits, by course, each school year.
50%
55%
60%
65%
70%
75%
80%
85%
90%
95%
100%
2011-12 2012-13 2013-14
Host School
STEM ECHS
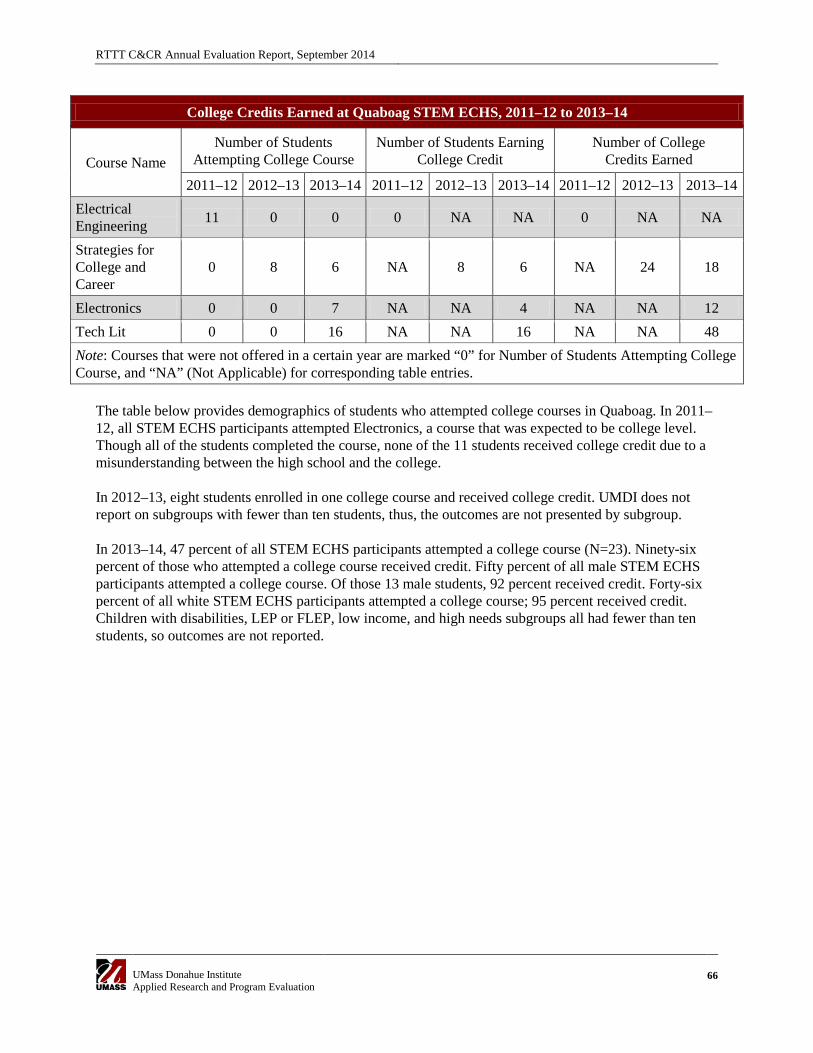
RTTT C&CR Annual Evaluation Report, September 2014
UMass Donahue Institute Applied Research and Program Evaluation
66
College Credits Earned at Quaboag STEM ECHS, 2011–12 to 2013–14
Course Name Number of Students
Attempting College Course Number of Students Earning
College Credit Number of College
Credits Earned
2011–12 2012–13 2013–14 2011–12 2012–13 2013–14 2011–12 2012–13 2013–14 Electrical Engineering 11 0 0 0 NA NA 0 NA NA
Strategies for College and Career
0 8 6 NA 8 6 NA 24 18
Electronics 0 0 7 NA NA 4 NA NA 12 Tech Lit 0 0 16 NA NA 16 NA NA 48 Note: Courses that were not offered in a certain year are marked “0” for Number of Students Attempting College Course, and “NA” (Not Applicable) for corresponding table entries.
The table below provides demographics of students who attempted college courses in Quaboag. In 2011–12, all STEM ECHS participants attempted Electronics, a course that was expected to be college level. Though all of the students completed the course, none of the 11 students received college credit due to a misunderstanding between the high school and the college. In 2012–13, eight students enrolled in one college course and received college credit. UMDI does not report on subgroups with fewer than ten students, thus, the outcomes are not presented by subgroup. In 2013–14, 47 percent of all STEM ECHS participants attempted a college course (N=23). Ninety-six percent of those who attempted a college course received credit. Fifty percent of all male STEM ECHS participants attempted a college course. Of those 13 male students, 92 percent received credit. Forty-six percent of all white STEM ECHS participants attempted a college course; 95 percent received credit. Children with disabilities, LEP or FLEP, low income, and high needs subgroups all had fewer than ten students, so outcomes are not reported.
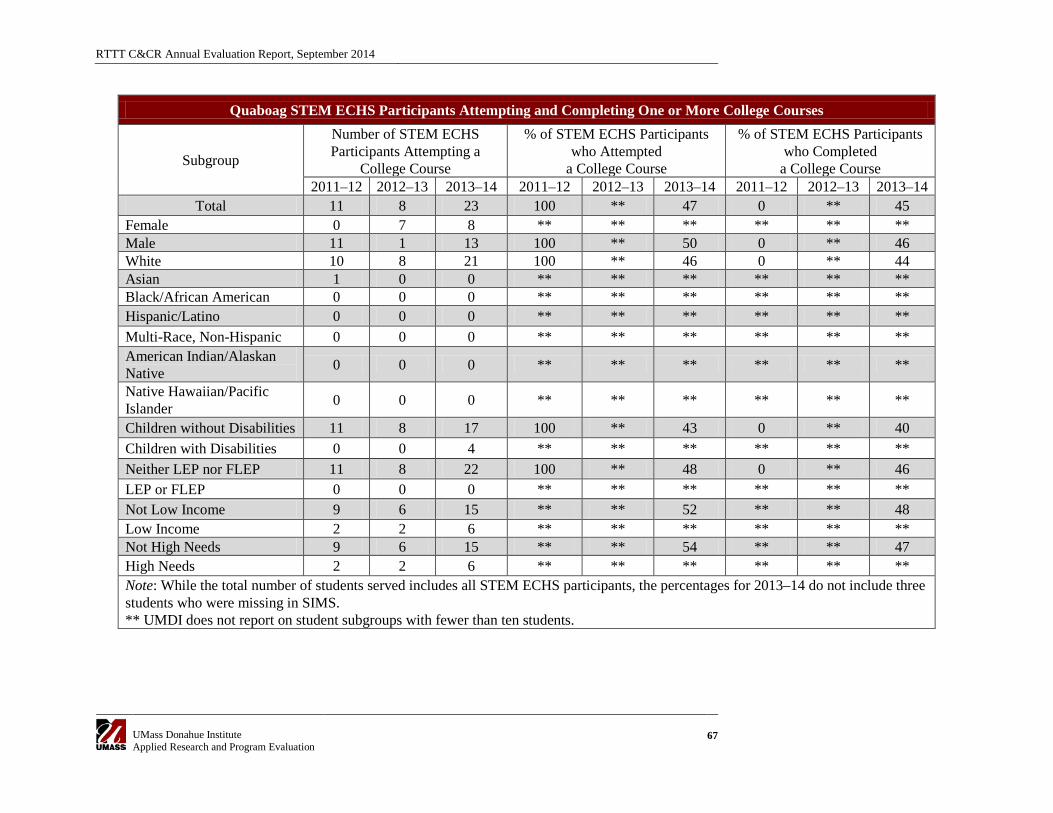
RTTT C&CR Annual Evaluation Report, September 2014
UMass Donahue Institute Applied Research and Program Evaluation
67
Quaboag STEM ECHS Participants Attempting and Completing One or More College Courses
Subgroup
Number of STEM ECHS Participants Attempting a
College Course
% of STEM ECHS Participants who Attempted
a College Course
% of STEM ECHS Participants who Completed
a College Course 2011–12 2012–13 2013–14 2011–12 2012–13 2013–14 2011–12 2012–13 2013–14
Total 11 8 23 100 ** 47 0 ** 45 Female 0 7 8 ** ** ** ** ** ** Male 11 1 13 100 ** 50 0 ** 46 White 10 8 21 100 ** 46 0 ** 44 Asian 1 0 0 ** ** ** ** ** ** Black/African American 0 0 0 ** ** ** ** ** ** Hispanic/Latino 0 0 0 ** ** ** ** ** ** Multi-Race, Non-Hispanic 0 0 0 ** ** ** ** ** ** American Indian/Alaskan Native 0 0 0 ** ** ** ** ** **
Native Hawaiian/Pacific Islander 0 0 0 ** ** ** ** ** **
Children without Disabilities 11 8 17 100 ** 43 0 ** 40 Children with Disabilities 0 0 4 ** ** ** ** ** ** Neither LEP nor FLEP 11 8 22 100 ** 48 0 ** 46 LEP or FLEP 0 0 0 ** ** ** ** ** ** Not Low Income 9 6 15 ** ** 52 ** ** 48 Low Income 2 2 6 ** ** ** ** ** ** Not High Needs 9 6 15 ** ** 54 ** ** 47 High Needs 2 2 6 ** ** ** ** ** ** Note: While the total number of students served includes all STEM ECHS participants, the percentages for 2013–14 do not include three students who were missing in SIMS. ** UMDI does not report on student subgroups with fewer than ten students.
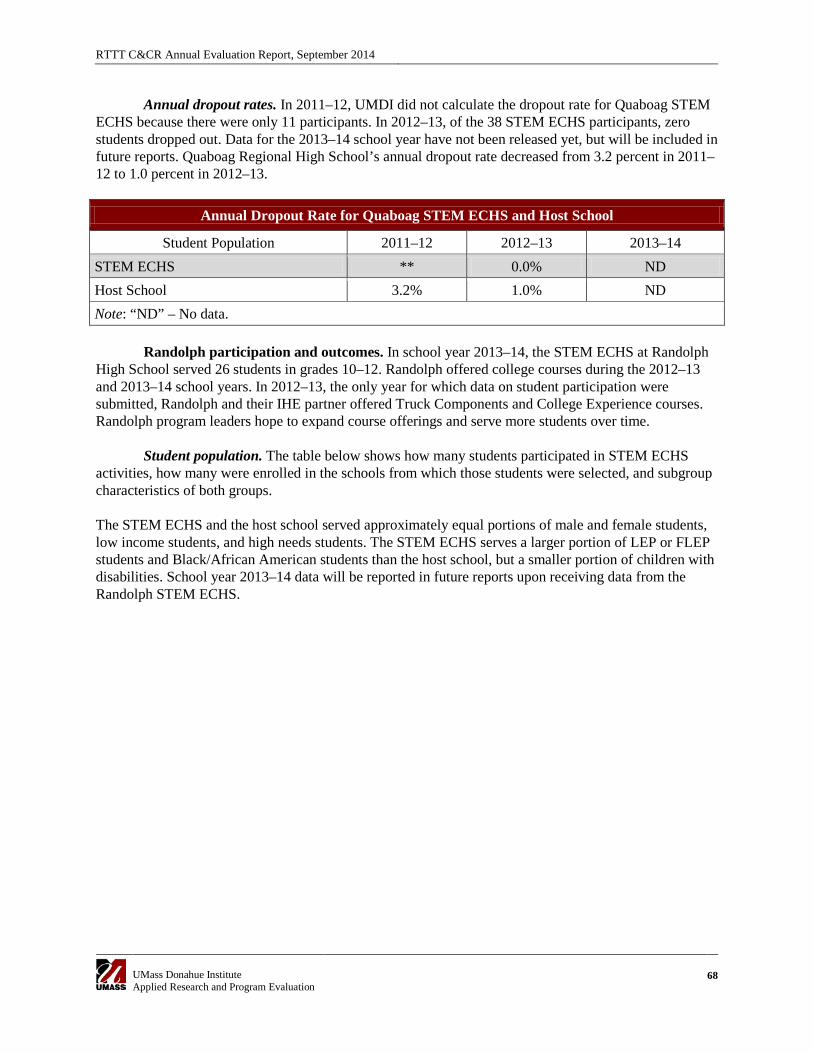
RTTT C&CR Annual Evaluation Report, September 2014
UMass Donahue Institute Applied Research and Program Evaluation
68
Annual dropout rates. In 2011–12, UMDI did not calculate the dropout rate for Quaboag STEM ECHS because there were only 11 participants. In 2012–13, of the 38 STEM ECHS participants, zero students dropped out. Data for the 2013–14 school year have not been released yet, but will be included in future reports. Quaboag Regional High School’s annual dropout rate decreased from 3.2 percent in 2011–12 to 1.0 percent in 2012–13.
Annual Dropout Rate for Quaboag STEM ECHS and Host School
Student Population 2011–12 2012–13 2013–14 STEM ECHS ** 0.0% ND Host School 3.2% 1.0% ND Note: “ND” – No data.
Randolph participation and outcomes. In school year 2013–14, the STEM ECHS at Randolph High School served 26 students in grades 10–12. Randolph offered college courses during the 2012–13 and 2013–14 school years. In 2012–13, the only year for which data on student participation were submitted, Randolph and their IHE partner offered Truck Components and College Experience courses. Randolph program leaders hope to expand course offerings and serve more students over time.
Student population. The table below shows how many students participated in STEM ECHS
activities, how many were enrolled in the schools from which those students were selected, and subgroup characteristics of both groups.
The STEM ECHS and the host school served approximately equal portions of male and female students, low income students, and high needs students. The STEM ECHS serves a larger portion of LEP or FLEP students and Black/African American students than the host school, but a smaller portion of children with disabilities. School year 2013–14 data will be reported in future reports upon receiving data from the Randolph STEM ECHS.
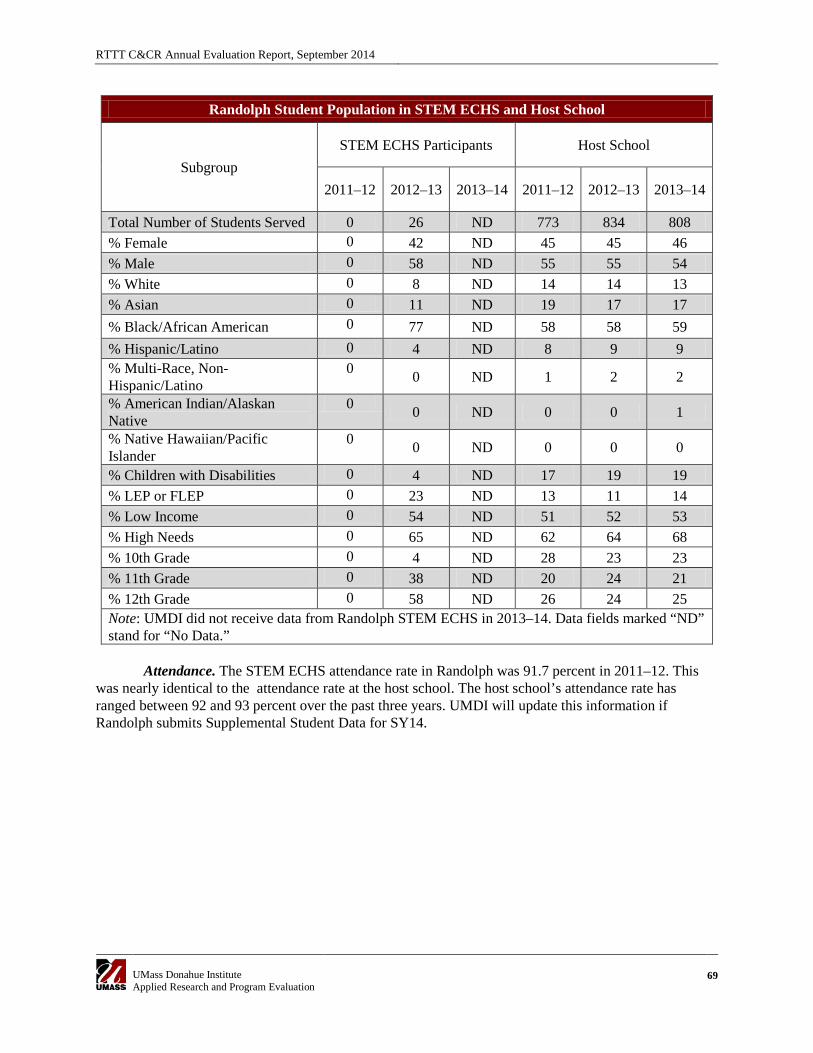
RTTT C&CR Annual Evaluation Report, September 2014
UMass Donahue Institute Applied Research and Program Evaluation
69
Randolph Student Population in STEM ECHS and Host School
Subgroup STEM ECHS Participants Host School
2011–12 2012–13 2013–14 2011–12 2012–13 2013–14
Total Number of Students Served 0 26 ND 773 834 808 % Female 0 42 ND 45 45 46 % Male 0 58 ND 55 55 54 % White 0 8 ND 14 14 13 % Asian 0 11 ND 19 17 17 % Black/African American 0 77 ND 58 58 59 % Hispanic/Latino 0 4 ND 8 9 9 % Multi-Race, Non-Hispanic/Latino
0 0 ND 1 2 2
% American Indian/Alaskan Native
0 0 ND 0 0 1
% Native Hawaiian/Pacific Islander
0 0 ND 0 0 0
% Children with Disabilities 0 4 ND 17 19 19 % LEP or FLEP 0 23 ND 13 11 14 % Low Income 0 54 ND 51 52 53 % High Needs 0 65 ND 62 64 68 % 10th Grade 0 4 ND 28 23 23 % 11th Grade 0 38 ND 20 24 21 % 12th Grade 0 58 ND 26 24 25 Note: UMDI did not receive data from Randolph STEM ECHS in 2013–14. Data fields marked “ND” stand for “No Data.”
Attendance. The STEM ECHS attendance rate in Randolph was 91.7 percent in 2011–12. This was nearly identical to the attendance rate at the host school. The host school’s attendance rate has ranged between 92 and 93 percent over the past three years. UMDI will update this information if Randolph submits Supplemental Student Data for SY14.
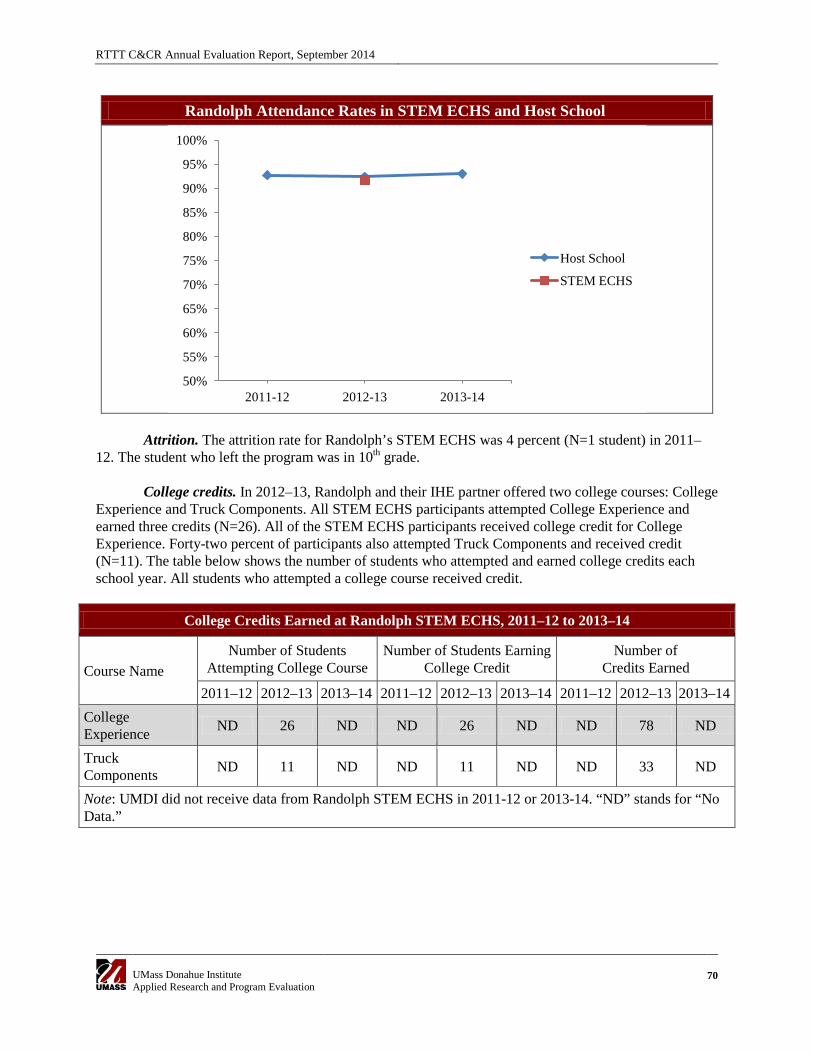
RTTT C&CR Annual Evaluation Report, September 2014
UMass Donahue Institute Applied Research and Program Evaluation
70
Randolph Attendance Rates in STEM ECHS and Host School
Attrition. The attrition rate for Randolph’s STEM ECHS was 4 percent (N=1 student) in 2011–
12. The student who left the program was in 10th grade. College credits. In 2012–13, Randolph and their IHE partner offered two college courses: College
Experience and Truck Components. All STEM ECHS participants attempted College Experience and earned three credits (N=26). All of the STEM ECHS participants received college credit for College Experience. Forty-two percent of participants also attempted Truck Components and received credit (N=11). The table below shows the number of students who attempted and earned college credits each school year. All students who attempted a college course received credit.
College Credits Earned at Randolph STEM ECHS, 2011–12 to 2013–14
Course Name Number of Students
Attempting College Course Number of Students Earning
College Credit Number of
Credits Earned
2011–12 2012–13 2013–14 2011–12 2012–13 2013–14 2011–12 2012–13 2013–14 College Experience ND 26 ND ND 26 ND ND 78 ND
Truck Components ND 11 ND ND 11 ND ND 33 ND
Note: UMDI did not receive data from Randolph STEM ECHS in 2011-12 or 2013-14. “ND” stands for “No Data.”
50%
55%
60%
65%
70%
75%
80%
85%
90%
95%
100%
2011-12 2012-13 2013-14
Host School
STEM ECHS
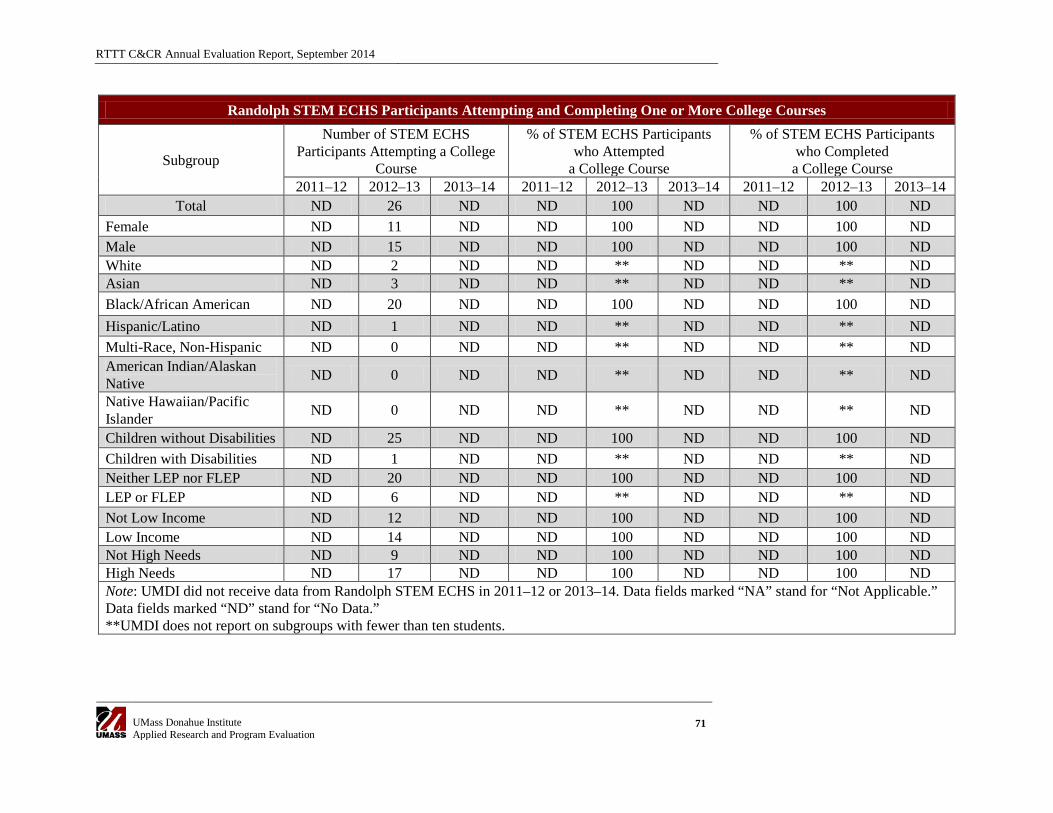
RTTT C&CR Annual Evaluation Report, September 2014
UMass Donahue Institute Applied Research and Program Evaluation
71
Randolph STEM ECHS Participants Attempting and Completing One or More College Courses
Subgroup
Number of STEM ECHS Participants Attempting a College
Course
% of STEM ECHS Participants who Attempted
a College Course
% of STEM ECHS Participants who Completed
a College Course 2011–12 2012–13 2013–14 2011–12 2012–13 2013–14 2011–12 2012–13 2013–14
Total ND 26 ND ND 100 ND ND 100 ND Female ND 11 ND ND 100 ND ND 100 ND Male ND 15 ND ND 100 ND ND 100 ND White ND 2 ND ND ** ND ND ** ND Asian ND 3 ND ND ** ND ND ** ND Black/African American ND 20 ND ND 100 ND ND 100 ND Hispanic/Latino ND 1 ND ND ** ND ND ** ND Multi-Race, Non-Hispanic ND 0 ND ND ** ND ND ** ND American Indian/Alaskan Native ND 0 ND ND ** ND ND ** ND
Native Hawaiian/Pacific Islander ND 0 ND ND ** ND ND ** ND
Children without Disabilities ND 25 ND ND 100 ND ND 100 ND Children with Disabilities ND 1 ND ND ** ND ND ** ND Neither LEP nor FLEP ND 20 ND ND 100 ND ND 100 ND LEP or FLEP ND 6 ND ND ** ND ND ** ND Not Low Income ND 12 ND ND 100 ND ND 100 ND Low Income ND 14 ND ND 100 ND ND 100 ND Not High Needs ND 9 ND ND 100 ND ND 100 ND High Needs ND 17 ND ND 100 ND ND 100 ND Note: UMDI did not receive data from Randolph STEM ECHS in 2011–12 or 2013–14. Data fields marked “NA” stand for “Not Applicable.” Data fields marked “ND” stand for “No Data.” **UMDI does not report on subgroups with fewer than ten students.
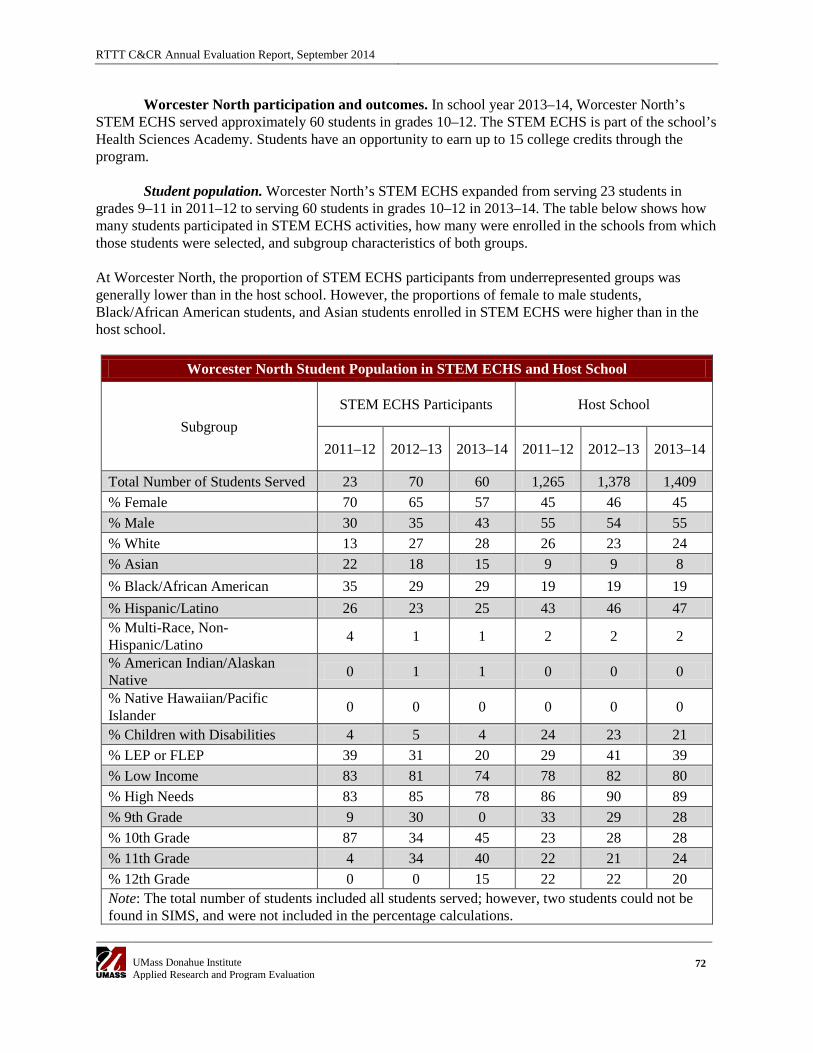
RTTT C&CR Annual Evaluation Report, September 2014
UMass Donahue Institute Applied Research and Program Evaluation
72
Worcester North participation and outcomes. In school year 2013–14, Worcester North’s STEM ECHS served approximately 60 students in grades 10–12. The STEM ECHS is part of the school’s Health Sciences Academy. Students have an opportunity to earn up to 15 college credits through the program.
Student population. Worcester North’s STEM ECHS expanded from serving 23 students in
grades 9–11 in 2011–12 to serving 60 students in grades 10–12 in 2013–14. The table below shows how many students participated in STEM ECHS activities, how many were enrolled in the schools from which those students were selected, and subgroup characteristics of both groups.
At Worcester North, the proportion of STEM ECHS participants from underrepresented groups was generally lower than in the host school. However, the proportions of female to male students, Black/African American students, and Asian students enrolled in STEM ECHS were higher than in the host school.
Worcester North Student Population in STEM ECHS and Host School
Subgroup STEM ECHS Participants Host School
2011–12 2012–13 2013–14 2011–12 2012–13 2013–14
Total Number of Students Served 23 70 60 1,265 1,378 1,409 % Female 70 65 57 45 46 45 % Male 30 35 43 55 54 55 % White 13 27 28 26 23 24 % Asian 22 18 15 9 9 8 % Black/African American 35 29 29 19 19 19 % Hispanic/Latino 26 23 25 43 46 47 % Multi-Race, Non-Hispanic/Latino 4 1 1 2 2 2
% American Indian/Alaskan Native 0 1 1 0 0 0
% Native Hawaiian/Pacific Islander 0 0 0 0 0 0
% Children with Disabilities 4 5 4 24 23 21 % LEP or FLEP 39 31 20 29 41 39 % Low Income 83 81 74 78 82 80 % High Needs 83 85 78 86 90 89 % 9th Grade 9 30 0 33 29 28 % 10th Grade 87 34 45 23 28 28 % 11th Grade 4 34 40 22 21 24 % 12th Grade 0 0 15 22 22 20 Note: The total number of students included all students served; however, two students could not be found in SIMS, and were not included in the percentage calculations.
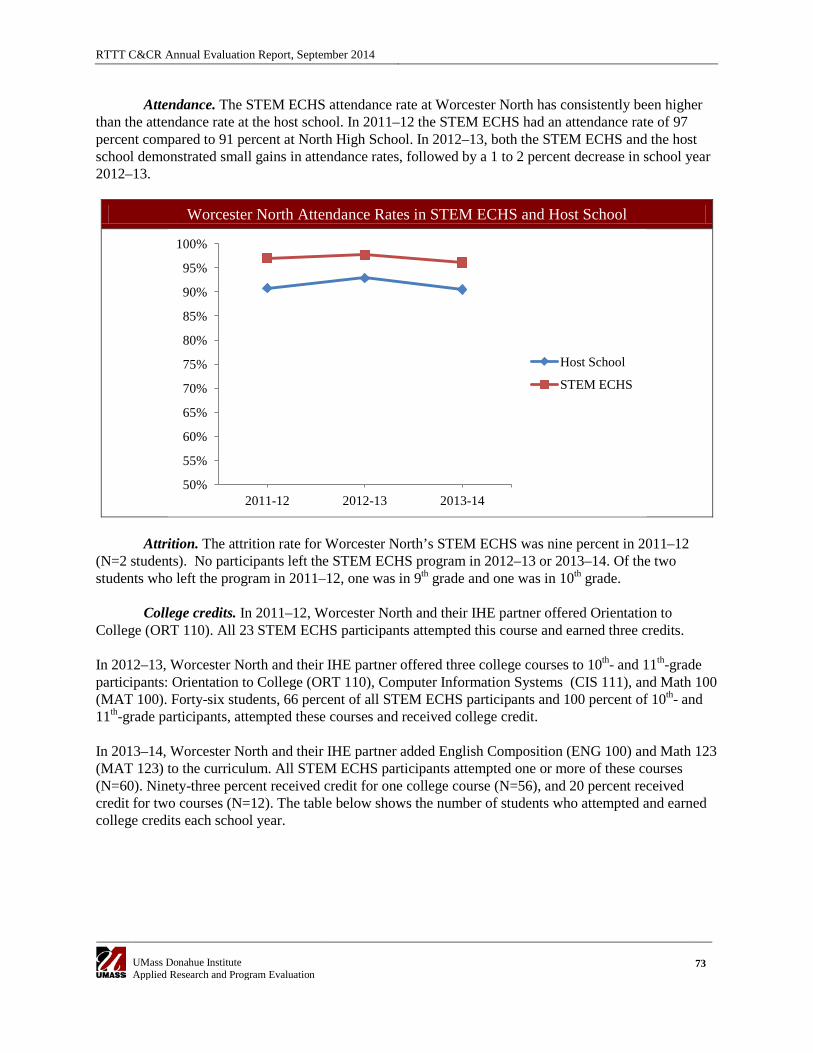
RTTT C&CR Annual Evaluation Report, September 2014
UMass Donahue Institute Applied Research and Program Evaluation
73
Attendance. The STEM ECHS attendance rate at Worcester North has consistently been higher than the attendance rate at the host school. In 2011–12 the STEM ECHS had an attendance rate of 97 percent compared to 91 percent at North High School. In 2012–13, both the STEM ECHS and the host school demonstrated small gains in attendance rates, followed by a 1 to 2 percent decrease in school year 2012–13.
Worcester North Attendance Rates in STEM ECHS and Host School
Attrition. The attrition rate for Worcester North’s STEM ECHS was nine percent in 2011–12 (N=2 students). No participants left the STEM ECHS program in 2012–13 or 2013–14. Of the two students who left the program in 2011–12, one was in 9th grade and one was in 10th grade.
College credits. In 2011–12, Worcester North and their IHE partner offered Orientation to
College (ORT 110). All 23 STEM ECHS participants attempted this course and earned three credits. In 2012–13, Worcester North and their IHE partner offered three college courses to 10th- and 11th-grade participants: Orientation to College (ORT 110), Computer Information Systems (CIS 111), and Math 100 (MAT 100). Forty-six students, 66 percent of all STEM ECHS participants and 100 percent of 10th- and 11th-grade participants, attempted these courses and received college credit. In 2013–14, Worcester North and their IHE partner added English Composition (ENG 100) and Math 123 (MAT 123) to the curriculum. All STEM ECHS participants attempted one or more of these courses (N=60). Ninety-three percent received credit for one college course (N=56), and 20 percent received credit for two courses (N=12). The table below shows the number of students who attempted and earned college credits each school year.
50%
55%
60%
65%
70%
75%
80%
85%
90%
95%
100%
2011-12 2012-13 2013-14
Host School
STEM ECHS
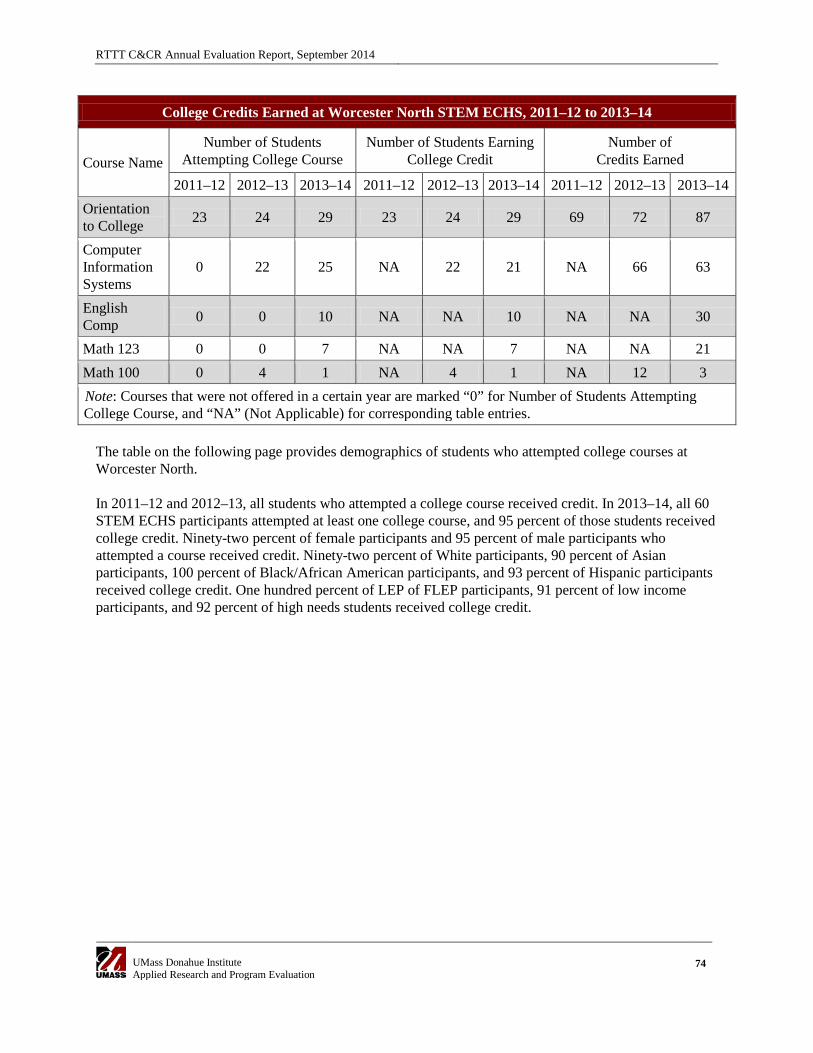
RTTT C&CR Annual Evaluation Report, September 2014
UMass Donahue Institute Applied Research and Program Evaluation
74
College Credits Earned at Worcester North STEM ECHS, 2011–12 to 2013–14
Course Name Number of Students
Attempting College Course Number of Students Earning
College Credit Number of
Credits Earned
2011–12 2012–13 2013–14 2011–12 2012–13 2013–14 2011–12 2012–13 2013–14 Orientation to College 23 24 29 23 24 29 69 72 87
Computer Information Systems
0 22 25 NA 22 21 NA 66 63
English Comp 0 0 10 NA NA 10 NA NA 30
Math 123 0 0 7 NA NA 7 NA NA 21 Math 100 0 4 1 NA 4 1 NA 12 3 Note: Courses that were not offered in a certain year are marked “0” for Number of Students Attempting College Course, and “NA” (Not Applicable) for corresponding table entries.
The table on the following page provides demographics of students who attempted college courses at Worcester North. In 2011–12 and 2012–13, all students who attempted a college course received credit. In 2013–14, all 60 STEM ECHS participants attempted at least one college course, and 95 percent of those students received college credit. Ninety-two percent of female participants and 95 percent of male participants who attempted a course received credit. Ninety-two percent of White participants, 90 percent of Asian participants, 100 percent of Black/African American participants, and 93 percent of Hispanic participants received college credit. One hundred percent of LEP of FLEP participants, 91 percent of low income participants, and 92 percent of high needs students received college credit.

RTTT C&CR Annual Evaluation Report, September 2014
UMass Donahue Institute Applied Research and Program Evaluation
75
Worcester North STEM ECHS Participants Attempting and Completing One or More College Courses
Subgroup
Number of STEM ECHS Participants Attempting a
College Course
% of STEM ECHS Participants who Attempted
a College Course
% of STEM ECHS Participants who Completed
a College Course 2011–12 2012–13 2013–14 2011–12 2012–13 2013–14 2011–12 2012–13 2013–14
Total 23 46* 60 100 67 100 100 67 95 Female 8 27 37 100 55 100 100 55 92 Male 15 18 22 100 90 100 100 90 95 White 3 10 12 100 71 100 100 71 92 Asian 5 7 10 100 ** 100 100 ** 90 Black/African American 8 13 20 100 93 100 100 93 100 Hispanic/Latino 6 13 15 100 81 100 100 81 93 Multi-Race, Non-Hispanic 1 1 1 100 ** ** 100 ** ** American Indian/Alaskan Native 0 1 1 NA ** ** ** ** **
Native Hawaiian/Pacific Islander 0 0 0 NA ** ** ** ** **
Children without Disabilities 22 44 57 100 67 100 100 67 93 Children with Disabilities 1 1 2 100 ** ** 100 ** ** Neither LEP nor FLEP 14 30 47 100 64 100 100 64 91 LEP or FLEP 9 16 13 100 70 100 100 70 100 Not Low Income 4 5 12 100 ** 100 100 ** 100 Low Income 19 40 47 100 68 100 100 68 91 Not High Needs 4 4 10 100 ** 100 100 ** 100 High Needs 19 41 49 100 66 100 100 66 92 *While the “Total” includes all students who attempted a college course, the N and percentages for each subgroup may not add up to 100% due to missing data in SIMS in 2012–13 and 2013–14. **UMDI does not report on subgroups with fewer than 10 students.
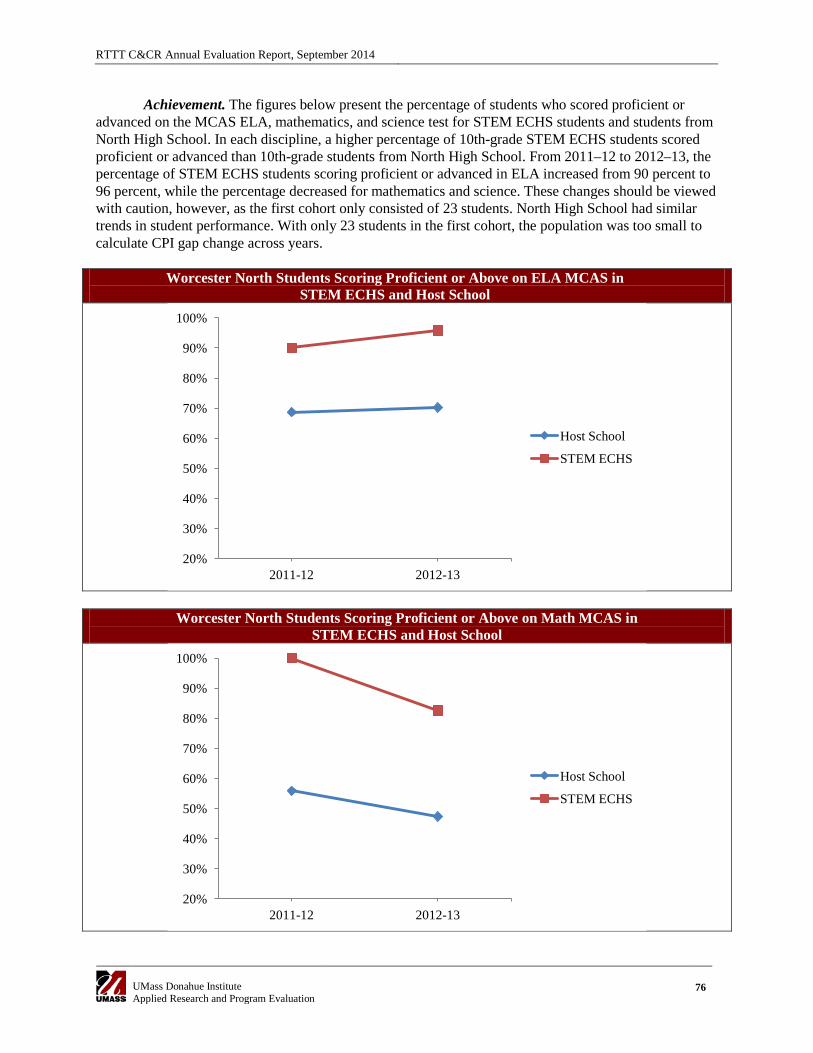
RTTT C&CR Annual Evaluation Report, September 2014
UMass Donahue Institute Applied Research and Program Evaluation
76
Achievement. The figures below present the percentage of students who scored proficient or advanced on the MCAS ELA, mathematics, and science test for STEM ECHS students and students from North High School. In each discipline, a higher percentage of 10th-grade STEM ECHS students scored proficient or advanced than 10th-grade students from North High School. From 2011–12 to 2012–13, the percentage of STEM ECHS students scoring proficient or advanced in ELA increased from 90 percent to 96 percent, while the percentage decreased for mathematics and science. These changes should be viewed with caution, however, as the first cohort only consisted of 23 students. North High School had similar trends in student performance. With only 23 students in the first cohort, the population was too small to calculate CPI gap change across years.
Worcester North Students Scoring Proficient or Above on ELA MCAS in
STEM ECHS and Host School
Worcester North Students Scoring Proficient or Above on Math MCAS in STEM ECHS and Host School
20%
30%
40%
50%
60%
70%
80%
90%
100%
2011-12 2012-13
Host School
STEM ECHS
20%
30%
40%
50%
60%
70%
80%
90%
100%
2011-12 2012-13
Host School
STEM ECHS
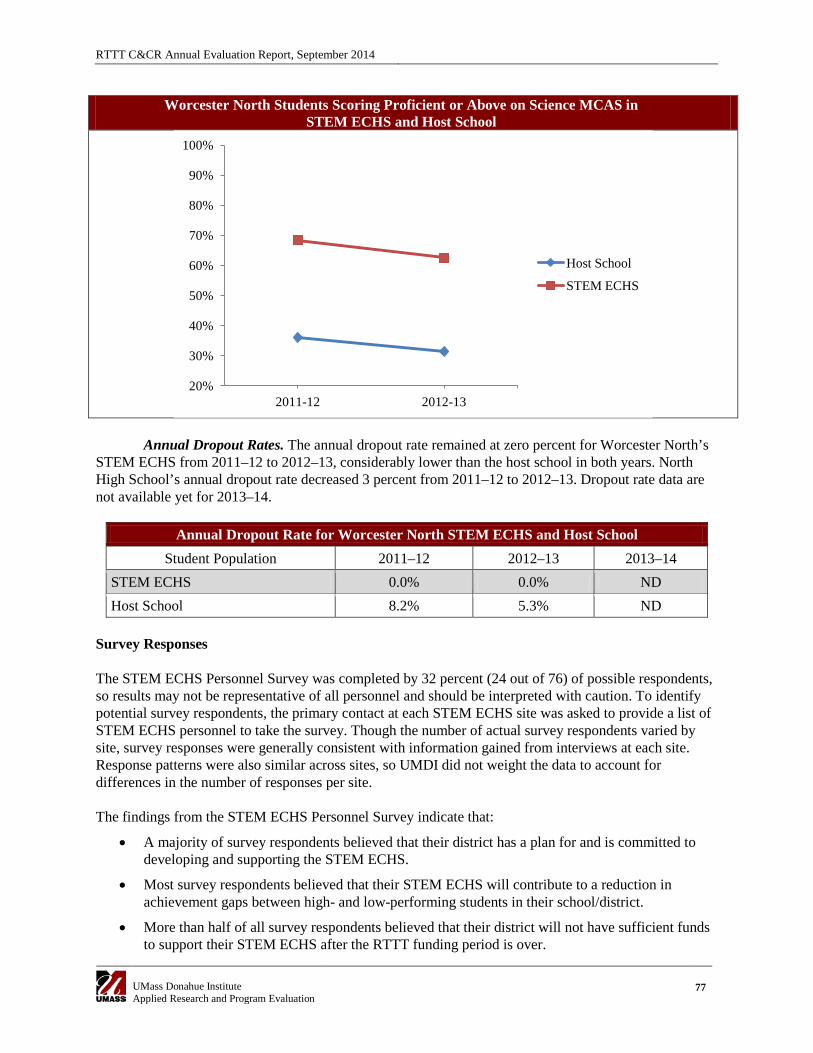
RTTT C&CR Annual Evaluation Report, September 2014
UMass Donahue Institute Applied Research and Program Evaluation
77
Worcester North Students Scoring Proficient or Above on Science MCAS in STEM ECHS and Host School
Annual Dropout Rates. The annual dropout rate remained at zero percent for Worcester North’s
STEM ECHS from 2011–12 to 2012–13, considerably lower than the host school in both years. North High School’s annual dropout rate decreased 3 percent from 2011–12 to 2012–13. Dropout rate data are not available yet for 2013–14.
Annual Dropout Rate for Worcester North STEM ECHS and Host School Student Population 2011–12 2012–13 2013–14
STEM ECHS 0.0% 0.0% ND Host School 8.2% 5.3% ND
Survey Responses The STEM ECHS Personnel Survey was completed by 32 percent (24 out of 76) of possible respondents, so results may not be representative of all personnel and should be interpreted with caution. To identify potential survey respondents, the primary contact at each STEM ECHS site was asked to provide a list of STEM ECHS personnel to take the survey. Though the number of actual survey respondents varied by site, survey responses were generally consistent with information gained from interviews at each site. Response patterns were also similar across sites, so UMDI did not weight the data to account for differences in the number of responses per site. The findings from the STEM ECHS Personnel Survey indicate that:
• A majority of survey respondents believed that their district has a plan for and is committed to developing and supporting the STEM ECHS.
• Most survey respondents believed that their STEM ECHS will contribute to a reduction in achievement gaps between high- and low-performing students in their school/district.
• More than half of all survey respondents believed that their district will not have sufficient funds to support their STEM ECHS after the RTTT funding period is over.
20%
30%
40%
50%
60%
70%
80%
90%
100%
2011-12 2012-13
Host School
STEM ECHS
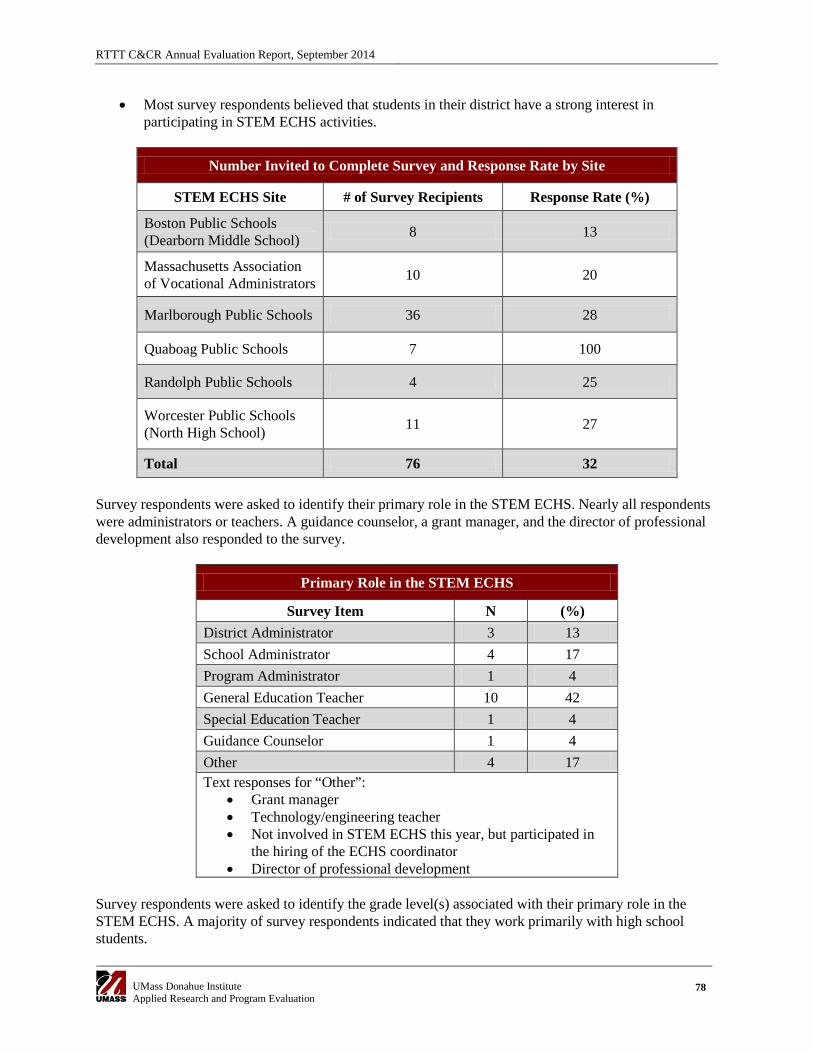
RTTT C&CR Annual Evaluation Report, September 2014
UMass Donahue Institute Applied Research and Program Evaluation
78
• Most survey respondents believed that students in their district have a strong interest in participating in STEM ECHS activities.
Number Invited to Complete Survey and Response Rate by Site
STEM ECHS Site # of Survey Recipients Response Rate (%)
Boston Public Schools (Dearborn Middle School) 8 13
Massachusetts Association of Vocational Administrators 10 20
Marlborough Public Schools 36 28
Quaboag Public Schools 7 100
Randolph Public Schools 4 25
Worcester Public Schools (North High School) 11 27
Total 76 32
Survey respondents were asked to identify their primary role in the STEM ECHS. Nearly all respondents were administrators or teachers. A guidance counselor, a grant manager, and the director of professional development also responded to the survey.
Primary Role in the STEM ECHS
Survey Item N (%) District Administrator 3 13 School Administrator 4 17 Program Administrator 1 4 General Education Teacher 10 42 Special Education Teacher 1 4 Guidance Counselor 1 4 Other 4 17 Text responses for “Other”:
• Grant manager • Technology/engineering teacher • Not involved in STEM ECHS this year, but participated in
the hiring of the ECHS coordinator • Director of professional development
Survey respondents were asked to identify the grade level(s) associated with their primary role in the STEM ECHS. A majority of survey respondents indicated that they work primarily with high school students.
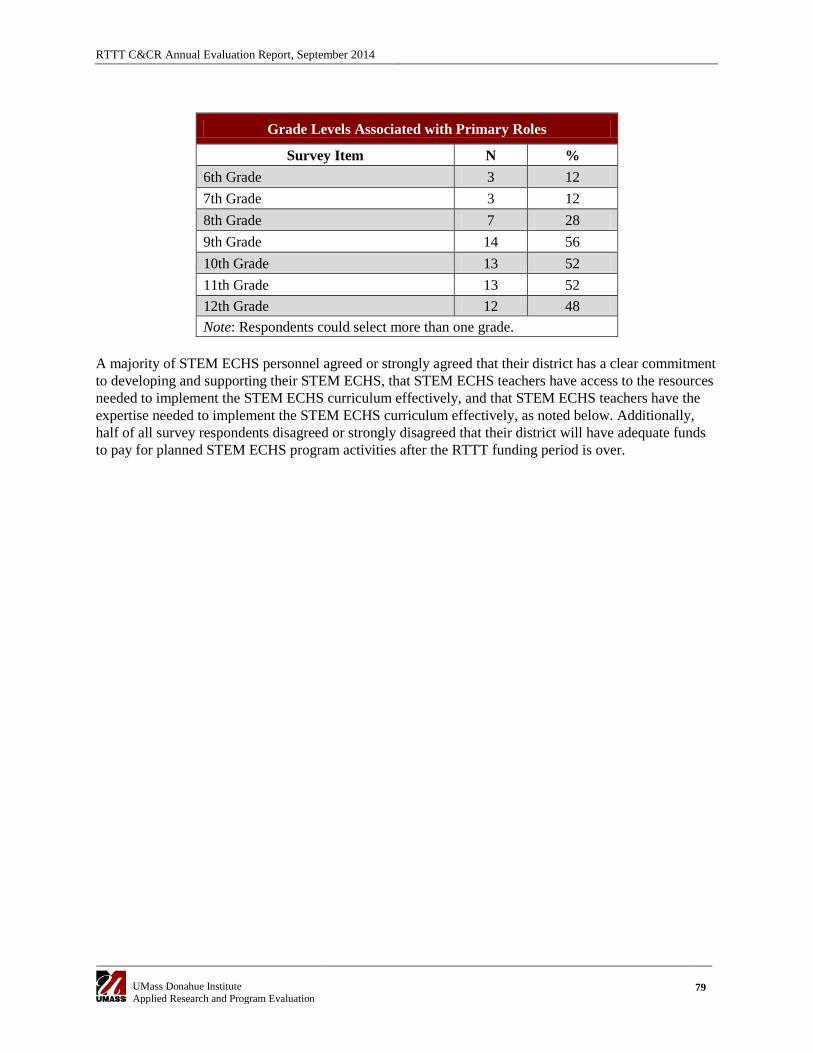
RTTT C&CR Annual Evaluation Report, September 2014
UMass Donahue Institute Applied Research and Program Evaluation
79
Grade Levels Associated with Primary Roles
Survey Item N % 6th Grade 3 12 7th Grade 3 12 8th Grade 7 28 9th Grade 14 56 10th Grade 13 52 11th Grade 13 52 12th Grade 12 48 Note: Respondents could select more than one grade.
A majority of STEM ECHS personnel agreed or strongly agreed that their district has a clear commitment to developing and supporting their STEM ECHS, that STEM ECHS teachers have access to the resources needed to implement the STEM ECHS curriculum effectively, and that STEM ECHS teachers have the expertise needed to implement the STEM ECHS curriculum effectively, as noted below. Additionally, half of all survey respondents disagreed or strongly disagreed that their district will have adequate funds to pay for planned STEM ECHS program activities after the RTTT funding period is over.
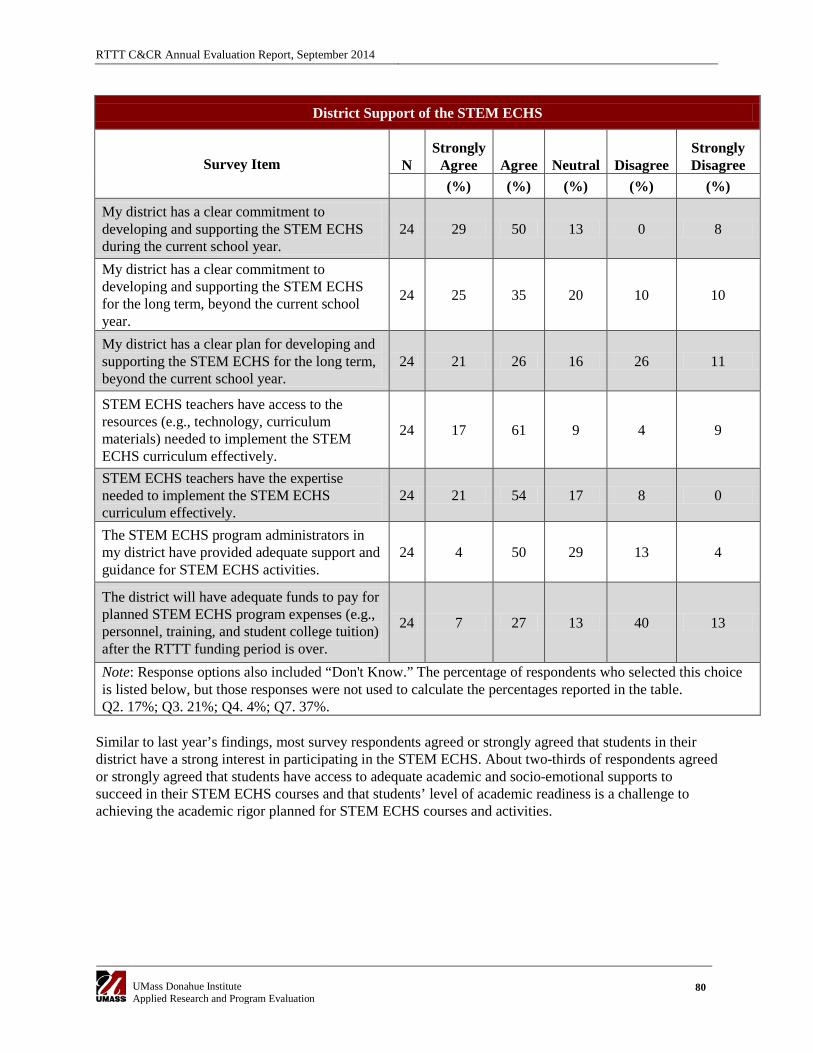
RTTT C&CR Annual Evaluation Report, September 2014
UMass Donahue Institute Applied Research and Program Evaluation
80
District Support of the STEM ECHS
Survey Item N Strongly
Agree Agree Neutral Disagree Strongly Disagree
(%) (%) (%) (%) (%)
My district has a clear commitment to developing and supporting the STEM ECHS during the current school year.
24 29 50 13 0 8
My district has a clear commitment to developing and supporting the STEM ECHS for the long term, beyond the current school year.
24 25 35 20 10 10
My district has a clear plan for developing and supporting the STEM ECHS for the long term, beyond the current school year.
24 21 26 16 26 11
STEM ECHS teachers have access to the resources (e.g., technology, curriculum materials) needed to implement the STEM ECHS curriculum effectively.
24 17 61 9 4 9
STEM ECHS teachers have the expertise needed to implement the STEM ECHS curriculum effectively.
24 21 54 17 8 0
The STEM ECHS program administrators in my district have provided adequate support and guidance for STEM ECHS activities.
24 4 50 29 13 4
The district will have adequate funds to pay for planned STEM ECHS program expenses (e.g., personnel, training, and student college tuition) after the RTTT funding period is over.
24 7 27 13 40 13
Note: Response options also included “Don't Know.” The percentage of respondents who selected this choice is listed below, but those responses were not used to calculate the percentages reported in the table. Q2. 17%; Q3. 21%; Q4. 4%; Q7. 37%.
Similar to last year’s findings, most survey respondents agreed or strongly agreed that students in their district have a strong interest in participating in the STEM ECHS. About two-thirds of respondents agreed or strongly agreed that students have access to adequate academic and socio-emotional supports to succeed in their STEM ECHS courses and that students’ level of academic readiness is a challenge to achieving the academic rigor planned for STEM ECHS courses and activities.
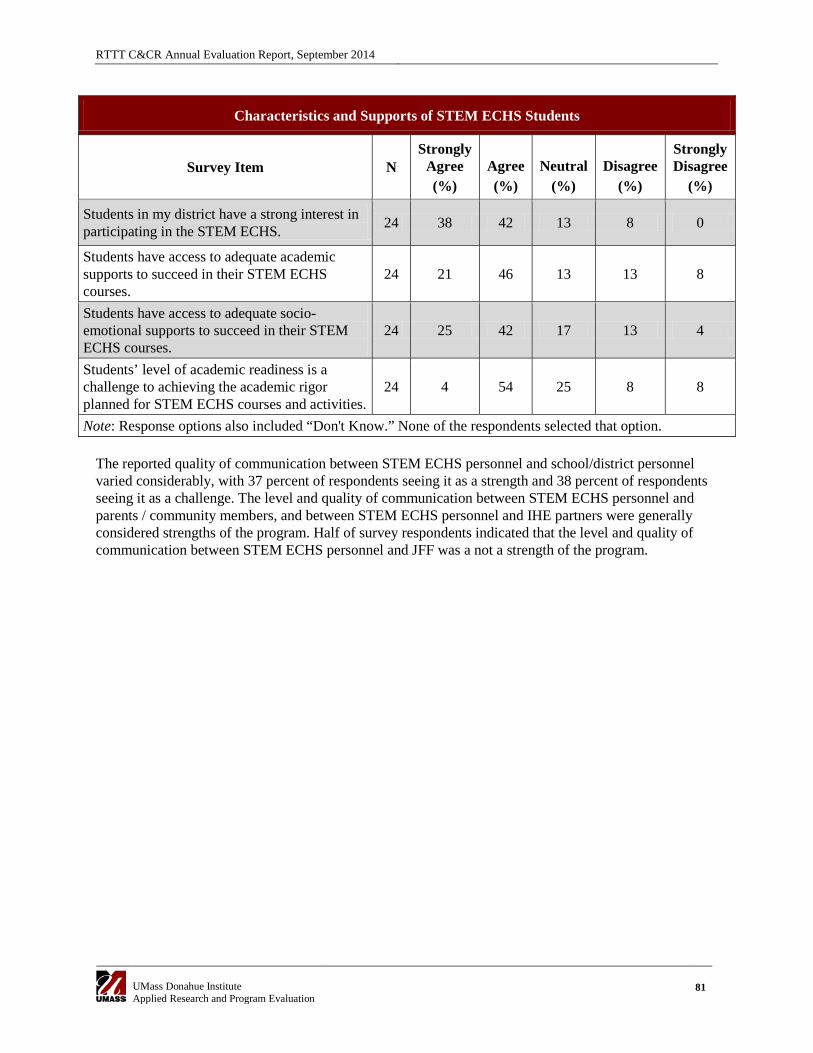
RTTT C&CR Annual Evaluation Report, September 2014
UMass Donahue Institute Applied Research and Program Evaluation
81
Characteristics and Supports of STEM ECHS Students
Survey Item N Strongly
Agree (%)
Agree (%)
Neutral (%)
Disagree (%)
Strongly Disagree
(%)
Students in my district have a strong interest in participating in the STEM ECHS. 24 38 42 13 8 0
Students have access to adequate academic supports to succeed in their STEM ECHS courses.
24 21 46 13 13 8
Students have access to adequate socio-emotional supports to succeed in their STEM ECHS courses.
24 25 42 17 13 4
Students’ level of academic readiness is a challenge to achieving the academic rigor planned for STEM ECHS courses and activities.
24 4 54 25 8 8
Note: Response options also included “Don't Know.” None of the respondents selected that option. The reported quality of communication between STEM ECHS personnel and school/district personnel varied considerably, with 37 percent of respondents seeing it as a strength and 38 percent of respondents seeing it as a challenge. The level and quality of communication between STEM ECHS personnel and parents / community members, and between STEM ECHS personnel and IHE partners were generally considered strengths of the program. Half of survey respondents indicated that the level and quality of communication between STEM ECHS personnel and JFF was a not a strength of the program.
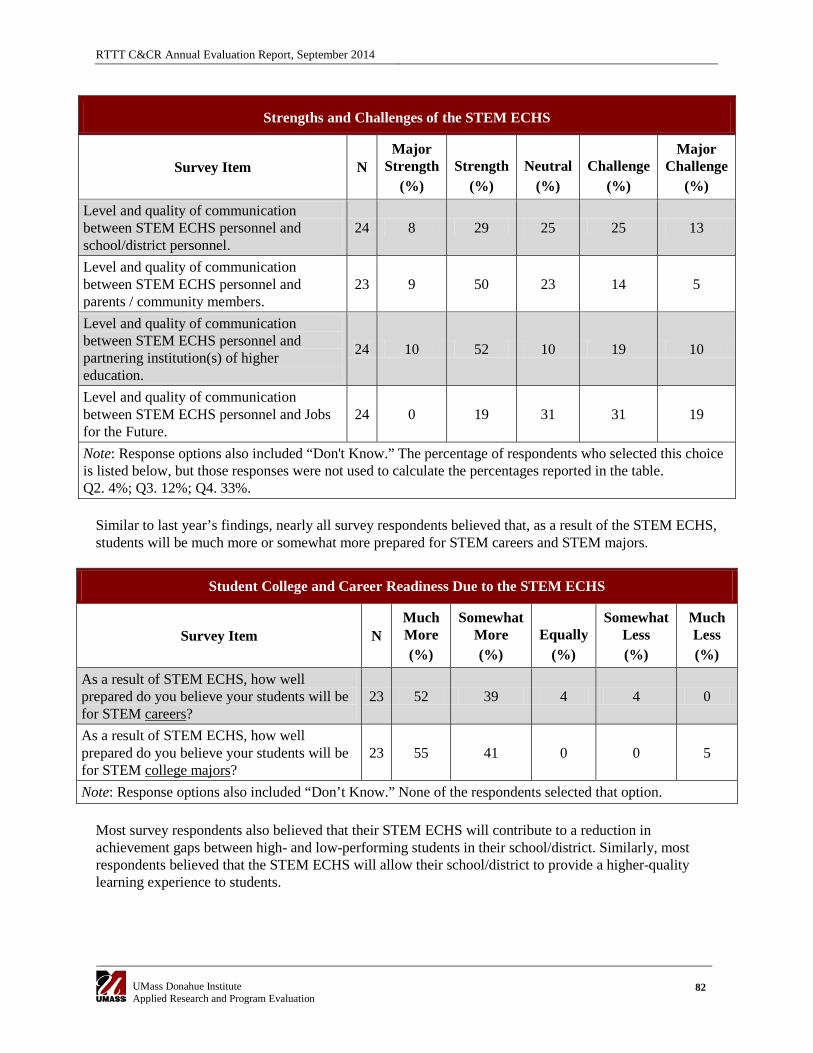
RTTT C&CR Annual Evaluation Report, September 2014
UMass Donahue Institute Applied Research and Program Evaluation
82
Strengths and Challenges of the STEM ECHS
Survey Item N Major
Strength (%)
Strength (%)
Neutral (%)
Challenge (%)
Major Challenge
(%)
Level and quality of communication between STEM ECHS personnel and school/district personnel.
24 8 29 25 25 13
Level and quality of communication between STEM ECHS personnel and parents / community members.
23 9 50 23 14 5
Level and quality of communication between STEM ECHS personnel and partnering institution(s) of higher education.
24 10 52 10 19 10
Level and quality of communication between STEM ECHS personnel and Jobs for the Future.
24 0 19 31 31 19
Note: Response options also included “Don't Know.” The percentage of respondents who selected this choice is listed below, but those responses were not used to calculate the percentages reported in the table. Q2. 4%; Q3. 12%; Q4. 33%.
Similar to last year’s findings, nearly all survey respondents believed that, as a result of the STEM ECHS, students will be much more or somewhat more prepared for STEM careers and STEM majors.
Student College and Career Readiness Due to the STEM ECHS
Survey Item N Much More (%)
Somewhat More (%)
Equally (%)
Somewhat Less (%)
Much Less (%)
As a result of STEM ECHS, how well prepared do you believe your students will be for STEM careers?
23 52 39 4 4 0
As a result of STEM ECHS, how well prepared do you believe your students will be for STEM college majors?
23 55 41 0 0 5
Note: Response options also included “Don’t Know.” None of the respondents selected that option. Most survey respondents also believed that their STEM ECHS will contribute to a reduction in achievement gaps between high- and low-performing students in their school/district. Similarly, most respondents believed that the STEM ECHS will allow their school/district to provide a higher-quality learning experience to students.
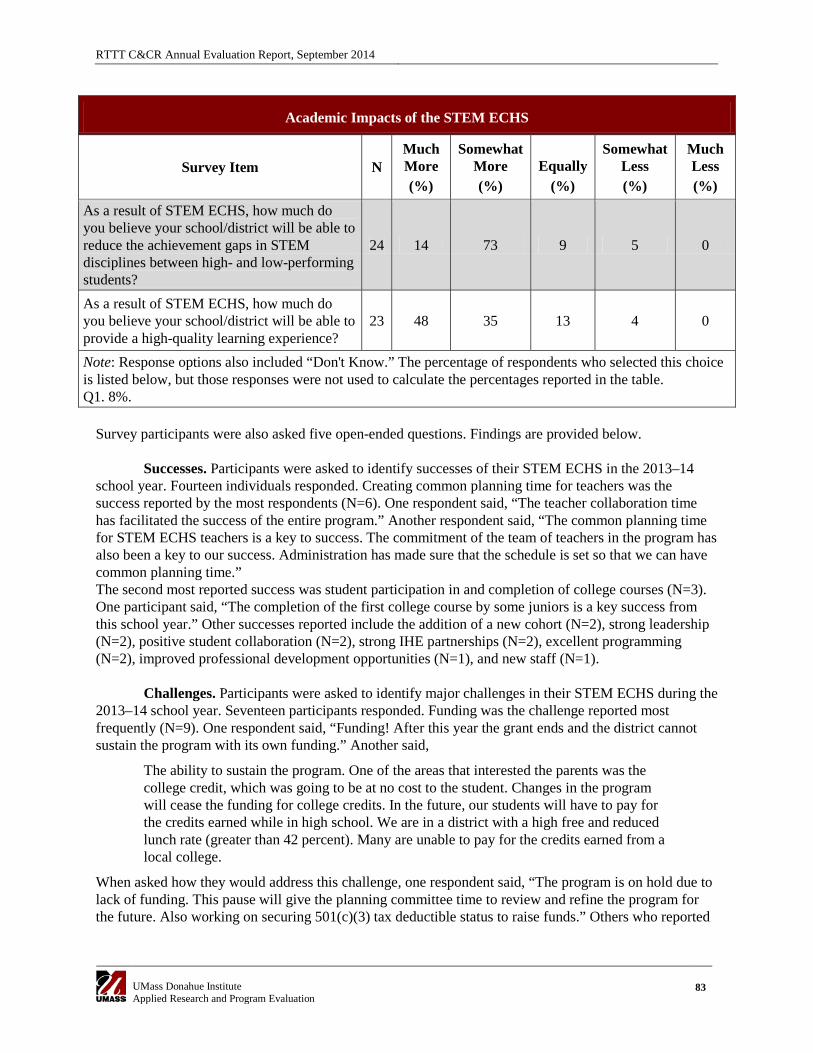
RTTT C&CR Annual Evaluation Report, September 2014
UMass Donahue Institute Applied Research and Program Evaluation
83
Academic Impacts of the STEM ECHS
Survey Item N Much More (%)
Somewhat More (%)
Equally (%)
Somewhat Less (%)
Much Less (%)
As a result of STEM ECHS, how much do you believe your school/district will be able to reduce the achievement gaps in STEM disciplines between high- and low-performing students?
24 14 73 9 5 0
As a result of STEM ECHS, how much do you believe your school/district will be able to provide a high-quality learning experience?
23 48 35 13 4 0
Note: Response options also included “Don't Know.” The percentage of respondents who selected this choice is listed below, but those responses were not used to calculate the percentages reported in the table. Q1. 8%.
Survey participants were also asked five open-ended questions. Findings are provided below. Successes. Participants were asked to identify successes of their STEM ECHS in the 2013–14 school year. Fourteen individuals responded. Creating common planning time for teachers was the success reported by the most respondents (N=6). One respondent said, “The teacher collaboration time has facilitated the success of the entire program.” Another respondent said, “The common planning time for STEM ECHS teachers is a key to success. The commitment of the team of teachers in the program has also been a key to our success. Administration has made sure that the schedule is set so that we can have common planning time.” The second most reported success was student participation in and completion of college courses (N=3). One participant said, “The completion of the first college course by some juniors is a key success from this school year.” Other successes reported include the addition of a new cohort (N=2), strong leadership (N=2), positive student collaboration (N=2), strong IHE partnerships (N=2), excellent programming (N=2), improved professional development opportunities (N=1), and new staff (N=1). Challenges. Participants were asked to identify major challenges in their STEM ECHS during the 2013–14 school year. Seventeen participants responded. Funding was the challenge reported most frequently (N=9). One respondent said, “Funding! After this year the grant ends and the district cannot sustain the program with its own funding.” Another said,
The ability to sustain the program. One of the areas that interested the parents was the college credit, which was going to be at no cost to the student. Changes in the program will cease the funding for college credits. In the future, our students will have to pay for the credits earned while in high school. We are in a district with a high free and reduced lunch rate (greater than 42 percent). Many are unable to pay for the credits earned from a local college.
When asked how they would address this challenge, one respondent said, “The program is on hold due to lack of funding. This pause will give the planning committee time to review and refine the program for the future. Also working on securing 501(c)(3) tax deductible status to raise funds.” Others who reported
RTTT C&CR Annual Evaluation Report, September 2014
UMass Donahue Institute Applied Research and Program Evaluation
84
funding challenges did not provide solutions. District communication, planning time, and scaling the program were the second most reported challenges, with three responses each. Technical Assistance. Survey participants were asked what technical assistance and training needs exist in their districts. Twelve participants responded, five of which said they did not know or had no suggestions for technical assistance. Three respondents said they would benefit from training in project-based learning and integration of technology. Two other responses were, “Help tracking students’ long-term success in college and beyond,” and “Help obtaining a 501(c)(3).” Advice for Other Districts. Survey respondents were asked to provide advice for other districts that are attempting to establish a STEM ECHS. Seventeen participants responded. The two pieces of advice offered most frequently were to schedule appropriate planning time (N=4) and to develop a clear plan before implementation (N=4). One respondent said, “Spend a serious amount of time in the planning stage of the ECHS instead of diving right in and trying to figure it out later.” Another said, “Try to start by establishing a clear vision of what you'd like to achieve. Develop this vision by observing what others are doing and developing an understanding of your district's strengths and weaknesses with a group of stakeholders.” The pieces of advice offered second most frequently were to develop strong partnerships (N=3), create a sustainability plan (N=3), and establish staff buy-in (N=3). One respondent said, “Partnerships need to be developed with business and industry as well as with post-secondary institutions.” Another added that partnerships are important for sustainability. Three respondents emphasized having a sustainability plan before implementation. Regarding staff buy-in, one respondent said, “Do not force teachers to become part of the program. Be sure that teachers have supports and common planning time. If the teachers are interested and willing to do the work, the program will be successful.” Other suggestions were to engage in external training (N=2), obtain support from the central office (N=2), observe successful districts (N=1), ensure solid leadership (N=1), and have access to necessary technology (N=1). Lessons Learned STEM ECHS administrators and IHE partners were asked to summarize lessons learned from Year 4 of program implementation. Their feedback is summarized below.
• Focus on sustainability from day one. Have discussions with multiple people who have been through the process of developing a STEM ECHS before launching into the planning process. Use these conversations to identify the supports and the resources that are in place to support the STEM ECHS.
• Identify a point person or leadership team. It is a good idea to have a group of people involved with and informed about the process, and to hold a single individual responsible for getting things done (while offering appropriate levels of support and oversight).
• Build a program that matches the available capacity and need. Do not build a program that requires staffing capacity that is greater than the capacity available in your building or district.
• Make a strong effort to engage and garner support from multiple stakeholders (e.g., students, teachers, school and district leaders, parents, IHE partners, local and regional businesses). Use this period of engagement to establish a uniform vision for STEM curriculum, and then build a coalition of support around that vision.
RTTT C&CR Annual Evaluation Report, September 2014
UMass Donahue Institute Applied Research and Program Evaluation
85
• Identify an IHE partner who is well aligned with (and willing and able to support) the programmatic and philosophical approach of the STEM ECHS leadership team.
ESE also reflected on lessons learned. ESE said that it would have been beneficial to complete more of the state-level “early college design work” before the initiative was launched. They also learned that cities and towns did not provide as much financial support as ESE had anticipated. ESE explained, “It was like we were giving them 20 percent of the funding it would take to do what they were going to do, but none of the sites came close to getting 80 percent matches [from their districts or other funding sources].” Last, ESE said that having alternate sites and/or the ability to end funding to under-performing sites would have been helpful. The way that the STEM ECHS funding was structured left ESE with very little control over the sites once the funds were released. When asked to comment on lessons learned during Year 4, JFF said,
One of the solid takeaways from the grant is that there is a clear role for ESE and DHE in organizing some of these connecting activities so that they make sense to both sides of the equation, for the colleges and for the high schools …. If the Commonwealth sees a benefit from sustainable ECHS programs across the board, obviously with district choice, then the Commonwealth has a role in helping them figure out how to do that in a way that makes sense. This is also a district problem, and a college problem, and those people need to be in the room having a conversation about this, and it’s not rocket science. I think it would be really exciting.
Next Steps STEM ECHS program administrators, ESE, and JFF provided a brief overview of their intended next steps, as summarized below: Next Steps for Dearborn. Dearborn plans to continue developing their STEM ECHS after the RTTT funding period ends. Students at Dearborn will be moved to a temporary location for three years while the building is being renovated, but plans remain in place to add a second cohort of STEM ECHS students during the 2014–15 school year. Additionally, program administrators plan to continue working with the district and the teachers to strengthen the curriculum for STEM ECHS participants. As the curriculum takes shape, STEM ECHS administrators plan to develop a focus around a small number of STEM topics, and to identify external partners who can support the development of appropriate STEM pipelines. Dearborn said that a STEM partnership coordinator has been hired and will begin working during the 2014–15 school year. This person will be charged with establishing solid partnerships with STEM corporations as well as establishing internships, externships, summer opportunities, and other field opportunities for students. Dearborn’s STEM administrators said that they are committed to developing a comprehensive STEM ECHS at their site and are working to overcome the school’s many current challenges in order to provide students with high-quality opportunities in STEM education. Next Steps for Marlborough. At the time of the interview, Marlborough had not yet received confirmation that they (and their partners, including JFF) had been awarded a grant from the Department of Labor. This award that will provide Marlborough with significant opportunities to bolster their STEM ECHS programming—above and beyond what is reported below from the interview. Program administrators said that most expenses associated with the STEM ECHS had been built into the district budget for the years after RTTT funding ends, including $50,000 for the 2014–15 school year.
RTTT C&CR Annual Evaluation Report, September 2014
UMass Donahue Institute Applied Research and Program Evaluation
86
Most of those funds ($40,000) had been dedicated to expenses for students who are taking college courses. Marlborough plans to expand their STEM ECHS program to include all middle school students. Essential components include: (1) one-to-one computers; (2) participation in an engineering elective course; and (3) required engagement in several interdisciplinary, project-based learning activities. At the high school level, Marlborough planned to expand STEM ECHS enrollment slowly, and they were working with community partners to develop “a true career pathways dual-enrollment program.” They were also identifying courses aligned with the industry sectors of advanced manufacturing, health sciences, and computer science / information technology. Marlborough said that they were working with Framingham State University and Quinsigamond Community College so that students could receive college credit for completing some college courses at the high school. Next Steps for MAVA. At the time of interview, MAVA had not secured funding to continue their STEM ECHS programming after the RTTT funding period. A program administrator said that MAVA was committed to finding the resources necessary to allow their second cohort of students to complete a second year of courses at Northeastern University, as they had been promised. Without additional funds, they were not planning to enroll new students for the 2014–15 school year. Instead, they planned to take a year to try to raise the funds necessary to run the program, and then try to enroll a new cohort the following year. Other sustainability options were also being considered (e.g., changing the program structure to lower costs), but the highest priority was securing funding so that the second cohort could complete their second year of courses.
MAVA was frustrated that tuition costs at Northeastern during Year 4 had been higher than anticipated, and that one course had been moved off of the main campus to a downtown location. One next step was to continue working with Northeastern to ensure that future costs and expectations for service delivery were clear to all stakeholders. Next Steps for Randolph. At the time of the interview, Randolph had not secured funding to continue their STEM ECHS programming after the RTTT funding period. The interviewee did not know if the program would be sustained and was not aware of any efforts to seek external funding. The district anticipated sustaining their partnership with Massasoit Community College. Administrative turnover at the high school was also an expected challenge. Randolph indicated that the ALEKS online math course, which had been run by Massasoit at the High School with STEM ECHS support, would likely continue without involvement from Massasoit, because it is cheaper for the district to purchase ALEKS licenses and assign one of their own teachers to lead the course. Next Steps for Quaboag. At the time of interview, Quaboag had not secured funding to continue their STEM ECHS programming after the RTTT funding period. Quaboag said that the courses and articulation agreements developed during the STEM ECHS funding period would remain, but the program would lose the support of the RTTT-funded coordinator, and the school would no longer be able to pay for college courses. Quaboag planned to revive a committee that was originally assembled during the planning phase of the project to advise administrators on how to move forward most successfully. They also hoped to use school choice funding for STEM ECHS programming in future years, but they were unsure how much funding would be collected through this strategy. Next Steps for Worcester North. At the time of the interview, Worcester North had not secured funding that could replace RTTT funding, and they said that funding was a major obstacle to moving
RTTT C&CR Annual Evaluation Report, September 2014
UMass Donahue Institute Applied Research and Program Evaluation
87
forward. Programming at Worcester North would continue, however, because Worcester’s STEM ECHS was not entirely dependent on RTTT funds. Worcester North indicated that they are working to develop career opportunities for students, and to better define and develop goals and pathways so that students know what they are working toward. They also planned to develop strategies for documenting and articulating student successes (e.g., college acceptance) so that those success stories could be visible to potential funders, the community, and other students in the school.
Next Steps for ESE. ESE anticipated that most sites would continue some form of STEM ECHS programming in the short term. ESE had no funds available to continue supporting these sites, but expected that their relationships with the sites would continue. The sites would likely become “legacy programs” that receive occasional technical assistance from the state.
ESE noted that the STEM ECHS initiative is one of many CCR initiatives of which they were asking, “How are we moving forward with this?” One way is by continuing the work of “bringing in all of [the] early college design partners” to discuss best practices. ESE said, “Kids taking rigorous coursework while they are still in high school, whether it be AP, IB, dual enrollment, or early college is going to continue to be a priority of ours, and of schools. It is just figuring out how it works.” ESE said that as part of this work, JFF prepared a document which describes strategies for sustaining STEM ECHSs and acknowledged that “there is no system across the Commonwealth for [structuring financial agreements relevant to dual enrollment].” ESE reported that some efforts were being made to better understand the landscape of early college programming in Massachusetts and said, “There is still a huge gap between K–12 and higher education, not to mention individual campuses, around what these articulation agreements look like.” ESE also said that there was no standard or generic academic content articulation agreement from which K–12 and IHE partners could begin their work, and that ESE was exploring the development of such agreements to support ongoing and future early college design efforts. Next Steps for JFF. JFF said that they did not foresee working with the STEM ECHS sites (with the exception of Marlborough) beyond the end of their RTTT contract. Technical Assistance and Sustainability Technical assistance to STEM ECHS sites decreased during Year 4. JFF and ESE did not host STEM ECHS technical assistance meetings as in previous years, but did invite the six sites to participate in two relevant technical assistance gatherings—one with JFF’s Pathways to Prosperity network in December 2013, and one with ESE’s Connecting Activities work-based learning program in May 2014. ESE and JFF agreed that the focus of JFF’s technical assistance during Year 4 would shift from providing “on-the-ground support” to supporting districts’ efforts to explore, develop, and implement plans for sustainability. To facilitate this shift, the JFF consultant (Janice Davis) who had served as the primary technical assistance contact for districts was replaced by a new consultant (Sue Grolnic) who worked with sites to explore options for sustainability. Administrators from most STEM sites confirmed that they received less support during Year 4. Several administrators said that they were not aware that the level of technical assistance would be reduced, and that the purpose and timing of the consultant transition could have been communicated more clearly. Sue reported that she acted as an advisor, meeting with sites during their last year of RTTT funding to see what their plans were for future years. As sites shared their plans with Sue, she “connected them to various people at the state level, suggested funding possibilities, and discussed other ways of enhancing their plans for sustainability.” Sue said that JFF asked her to meet with four of the six sites (Dearborn and
RTTT C&CR Annual Evaluation Report, September 2014
UMass Donahue Institute Applied Research and Program Evaluation
88
Quaboag being the exceptions). Each visit lasted from 1.5 to 2 hours, and one site was visited twice, at the request of the program administrator. Sue noted that her leverage with the sites had been limited, in part because their relationship had not been well established. In addition to meeting with sites to provide technical assistance, JFF subcontracted with Dave Jack, the former acting business director of the Marlborough Public Schools, to write a report highlighting approaches to funding ECHS programs. At the time of our interview, the report had been submitted to JFF but had not been shared with ESE or the STEM ECHS sites. JFF also conducted a survey of dual-enrollment sites across the state. Eight community colleges and two universities participated. Findings indicated that cost structures and funding strategies for early college programs varied widely from site to site. Reflecting on this finding, a JFF representative said, “One of the things that clearly needs to be done is some collective development of how programs like this should get funded, how much [colleges] should charge, and what role the state has in supporting that.” JFF reported that all STEM ECHS sites’ top concern was funding, and that Marlborough was the only site with a clear plan for sustainability. “Some sites had some ideas for sustainability, but they had no plan B … [we were] taken aback …. What was the case in every location except Marlborough was ‘No RTTT funding, no program.’ … This is a sad example of what happens when operational funding runs out.” JFF said that it may have been possible to restructure some of the programs to have colleges, districts, and parents pay a portion of the expense, but that most sites chose not to pursue such options. Feedback on ESE As reported previously, feedback from grantees about collaboration with ESE has been uniformly positive. Recent comments from interviewees included the following:
• ESE has an effective relationship with the sites. Communication is easy. I know where they are coming from. I think they know where I am coming from. We support each other. I know what they need to do. I think they know what I am trying to do. So that working relationship is a success from my view.
• We went to an ESE conference earlier in the year, did some networking. These meetings are good for brainstorming ideas.
• We’ve had few contacts with ESE this year, but networking opportunities have been helpful.
Strategic Considerations
• Establishing and sustaining early college models would benefit from improved articulation and funding agreements between high schools and institutions of higher education. ESE, JFF, representatives from the sites, and their partnering institutions of higher education all acknowledged that ESE has an important role to play in directing this conversation and collaborating with IHEs and other partners to standardize and systematize these agreements.
• ESE could build on the successes of the STEM ECHS initiative by continuing their efforts to connect STEM ECHSs with other early college initiatives across Massachusetts. ESE said that they were already making some efforts to support and connect various initiatives that aim to help high school students engage with rigorous and often college-level curriculum.
RTTT C&CR Annual Evaluation Report, September 2014
UMass Donahue Institute Applied Research and Program Evaluation
89
• Identifying, communicating, and establishing accountability for project milestones could provide ESE with more leverage when making important funding decisions. ESE reported that it may have been advantageous to have more leverage in making annual STEM ECHS funding decisions and flexibility in moving funds from low-performing to high-performing sites. Such milestones could be established based on STEM ECHS evaluation findings as well as literature on early college models.

RTTT C&CR Annual Evaluation Report, September 2014
UMass Donahue Institute Applied Research and Program Evaluation
90
MassCore Policy and Implementation The Massachusetts High School Program of Studies (MassCore) recommends a set of courses and other learning opportunities that Massachusetts students should complete before graduating from high school in order to arrive at college or the workplace well prepared and without need for remedial coursework. The 155 districts that selected the RTTT college and career readiness goal committed to implementing strategies to increase the percentage of their students who complete the MassCore curriculum. The state’s RTTT goal is to increase the statewide MassCore completion rate from its baseline of 70 percent of the class of 2010 graduates to 85 percent of the class of 2014 graduates. The state has created a goal for each district, using a formula based on the district’s reported 2010 MassCore completion rate (calculated from the MassCore element of the state’s SIMS database), the district’s number of 2010 graduates, and the total number of graduates statewide needed to bridge the gap between the 70 percent baseline and the 85 percent goal. Each district was also expected to determine areas in which courses or supports needed to be expanded in order to meet the 2014 targets, and to create and implement a plan to improve the accuracy of their reporting of MassCore completion levels. The evaluation questions specific to the MassCore evaluation are listed below. Process Evaluation Questions P1. What steps have districts taken to facilitate MassCore completion by students? What are the major
challenges to and facilitators of district implementation and student completion of a rigorous course of study in general, and the MassCore curriculum in particular? What midcourse corrections and attempts to overcome challenges have been undertaken? What additional steps are planned?
P2. In what ways has ESE taken the steps to increase MassCore completion as described in their RTTT grant application? What are the major challenges to and facilitators of district support encountered by ESE? How have challenges been overcome and midcourse corrections undertaken? What additional steps are planned?
P3. How do district stakeholders explain the relevance of MassCore completion to their efforts at promoting student college and career readiness, as well as the effectiveness of their efforts toward fostering greater MassCore completion?
P4. What infrastructure, systems, and processes were put in place to aid sustainability of improvements in MassCore completion during and beyond the grant period? What supports could ESE or other partners provide to districts to increase levels of MassCore completion? What are the greatest challenges and barriers to creating sustainability?
Outcome Evaluation Questions O1. To what extent are high school graduates achieving increased MassCore completion?
O2. At the school and district levels, do observed changes in MassCore completion differ across student characteristics such as gender, race/ethnicity, free/reduced lunch status, ELL status, and special education status? Is there evidence that gaps are narrowing?
O3. To what extent are changes in student MassCore completion attributable to state and district efforts in service of this goal versus other RTTT program activities and/or measurable contextual variables?
RTTT C&CR Annual Evaluation Report, September 2014
UMass Donahue Institute Applied Research and Program Evaluation
91
O4. What are the major differences in MassCore completion and contextual variables across schools and districts whose levels of improvement on student outcomes differ substantially?
Methods This report includes information collected from the following data sources:
• Interviews with district MassCore administrators. UMDI conducted interviews with administrators from five districts that have implemented MassCore as a default program of study. Interviewees were identified by their districts as “a district administrator who has in-depth knowledge of your district’s positions, actions, and plans related to MassCore.” The interview protocol (see Appendix K) was developed in collaboration with ESE. The ESE program manager for MassCore made the initial email contact with district representatives, and all five districts provided appropriate representatives to be interviewed.
• ESE databases. The state’s SIMS database was used to calculate MassCore completion rates by district.
• Communications. UMDI communicated by email and phone as needed with the ESE program manager and the ESE research project manager for MassCore. UMDI also conducted an in-person interview focused on MassCore in May 2014.
Findings Findings are presented in relation to the process and outcome evaluation questions listed above. First the outcome questions are addressed with the presentation of MassCore completion rates at the state level, followed by district-level trends.7 Then the process questions are addressed in relation to the interviews with MassCore administrators and ESE managers. MassCore Completion Rates One of ESE’s RTTT delivery goals is to increase the statewide MassCore completion rate from its baseline of 70 percent for the class of 2010 graduates to 85 percent of the Class of 2014 graduates. To assess progress toward this goal, UMDI calculated the overall MassCore completion percentage for the state, as well as the percentage of graduates in each district who completed MassCore. The table below shows that rates of MassCore completion for the state have increased slightly, from 69.6 percent for 2009–10 graduates (the year before RTTT began) to 69.9 percent for 2012–13 graduates. MassCore completion rates declined by less than one percentage point in 2010–11 and 2011–12, and then increased by 1.6 percent in 2012–13.
7 Another important source of findings relevant to MassCore trends is a study conducted in 2014 by ESE, led by Nyal Fuentes. Its main findings are presented in a PowerPoint presentation entitled “Graduation requirements for the class of 2015 and MassCore: A survey of Massachusetts high schools” and a related ESE report entitled “MassCore Progress Report” (September 2014).
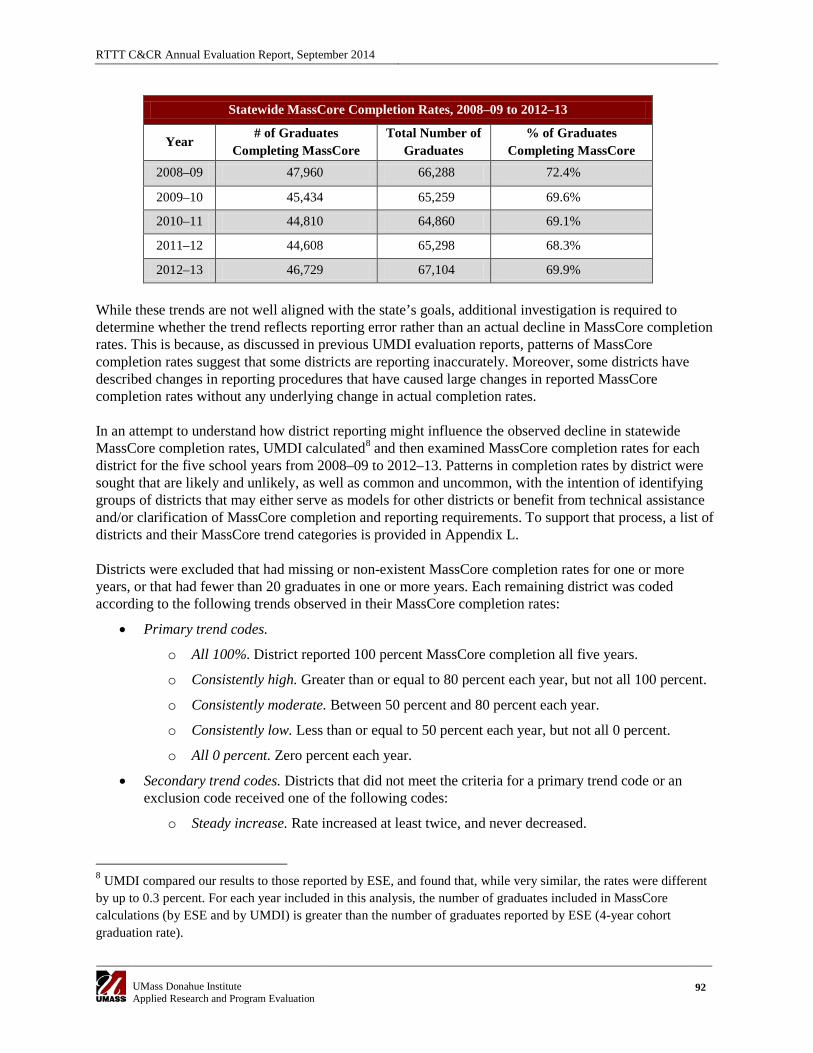
RTTT C&CR Annual Evaluation Report, September 2014
UMass Donahue Institute Applied Research and Program Evaluation
92
Statewide MassCore Completion Rates, 2008–09 to 2012–13
Year # of Graduates
Completing MassCore Total Number of
Graduates % of Graduates
Completing MassCore 2008–09 47,960 66,288 72.4%
2009–10 45,434 65,259 69.6%
2010–11 44,810 64,860 69.1%
2011–12 44,608 65,298 68.3%
2012–13 46,729 67,104 69.9%
While these trends are not well aligned with the state’s goals, additional investigation is required to determine whether the trend reflects reporting error rather than an actual decline in MassCore completion rates. This is because, as discussed in previous UMDI evaluation reports, patterns of MassCore completion rates suggest that some districts are reporting inaccurately. Moreover, some districts have described changes in reporting procedures that have caused large changes in reported MassCore completion rates without any underlying change in actual completion rates. In an attempt to understand how district reporting might influence the observed decline in statewide MassCore completion rates, UMDI calculated8 and then examined MassCore completion rates for each district for the five school years from 2008–09 to 2012–13. Patterns in completion rates by district were sought that are likely and unlikely, as well as common and uncommon, with the intention of identifying groups of districts that may either serve as models for other districts or benefit from technical assistance and/or clarification of MassCore completion and reporting requirements. To support that process, a list of districts and their MassCore trend categories is provided in Appendix L. Districts were excluded that had missing or non-existent MassCore completion rates for one or more years, or that had fewer than 20 graduates in one or more years. Each remaining district was coded according to the following trends observed in their MassCore completion rates:
• Primary trend codes.
o All 100%. District reported 100 percent MassCore completion all five years.
o Consistently high. Greater than or equal to 80 percent each year, but not all 100 percent.
o Consistently moderate. Between 50 percent and 80 percent each year.
o Consistently low. Less than or equal to 50 percent each year, but not all 0 percent.
o All 0 percent. Zero percent each year.
• Secondary trend codes. Districts that did not meet the criteria for a primary trend code or an exclusion code received one of the following codes:
o Steady increase. Rate increased at least twice, and never decreased.
8 UMDI compared our results to those reported by ESE, and found that, while very similar, the rates were different by up to 0.3 percent. For each year included in this analysis, the number of graduates included in MassCore calculations (by ESE and by UMDI) is greater than the number of graduates reported by ESE (4-year cohort graduation rate).
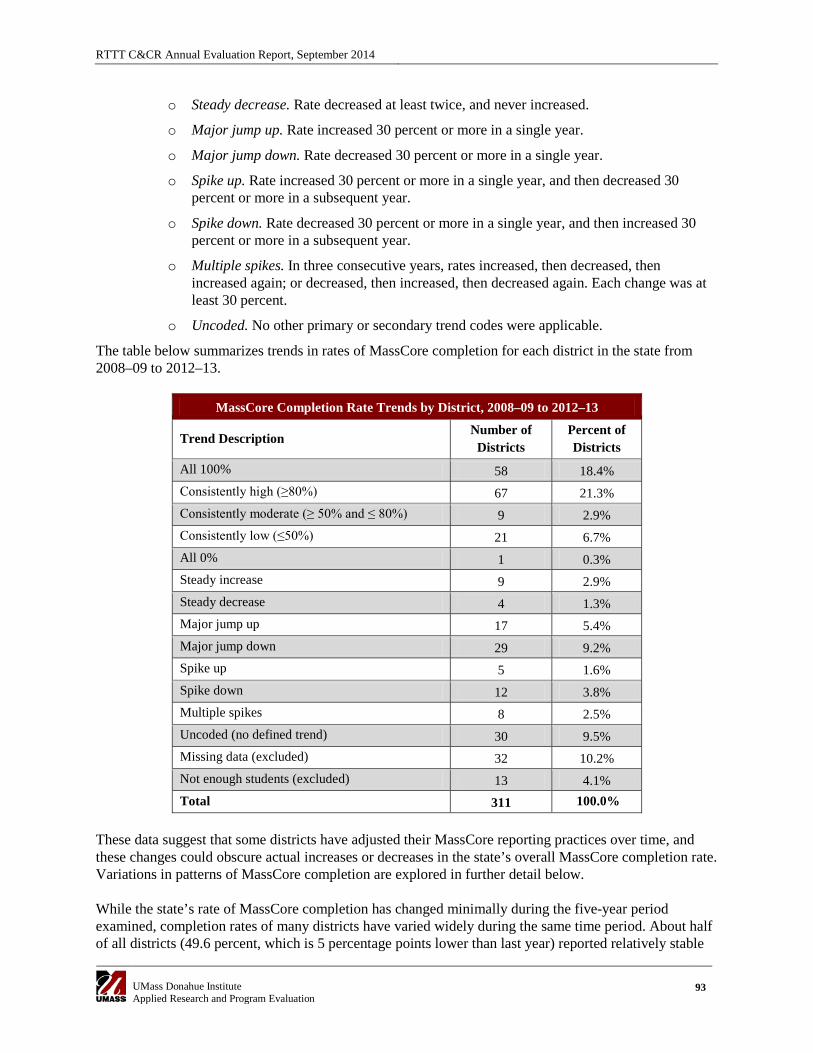
RTTT C&CR Annual Evaluation Report, September 2014
UMass Donahue Institute Applied Research and Program Evaluation
93
o Steady decrease. Rate decreased at least twice, and never increased.
o Major jump up. Rate increased 30 percent or more in a single year.
o Major jump down. Rate decreased 30 percent or more in a single year.
o Spike up. Rate increased 30 percent or more in a single year, and then decreased 30 percent or more in a subsequent year.
o Spike down. Rate decreased 30 percent or more in a single year, and then increased 30 percent or more in a subsequent year.
o Multiple spikes. In three consecutive years, rates increased, then decreased, then increased again; or decreased, then increased, then decreased again. Each change was at least 30 percent.
o Uncoded. No other primary or secondary trend codes were applicable.
The table below summarizes trends in rates of MassCore completion for each district in the state from 2008–09 to 2012–13.
MassCore Completion Rate Trends by District, 2008–09 to 2012–13
Trend Description Number of
Districts Percent of Districts
All 100% 58 18.4% Consistently high (≥80%) 67 21.3% Consistently moderate (≥ 50% and ≤ 80%) 9 2.9% Consistently low (≤50%) 21 6.7% All 0% 1 0.3% Steady increase 9 2.9% Steady decrease 4 1.3% Major jump up 17 5.4% Major jump down 29 9.2% Spike up 5 1.6% Spike down 12 3.8% Multiple spikes 8 2.5% Uncoded (no defined trend) 30 9.5% Missing data (excluded) 32 10.2% Not enough students (excluded) 13 4.1% Total 311 100.0%
These data suggest that some districts have adjusted their MassCore reporting practices over time, and these changes could obscure actual increases or decreases in the state’s overall MassCore completion rate. Variations in patterns of MassCore completion are explored in further detail below. While the state’s rate of MassCore completion has changed minimally during the five-year period examined, completion rates of many districts have varied widely during the same time period. About half of all districts (49.6 percent, which is 5 percentage points lower than last year) reported relatively stable
RTTT C&CR Annual Evaluation Report, September 2014
UMass Donahue Institute Applied Research and Program Evaluation
94
levels of MassCore completion (i.e., those coded as Consistently High, Consistently Moderate, Consistently Low, All 100%, or All 0%). However, about one out of five districts (22.5 percent) reported highly variable rates (i.e., those coded as Major Jump Up, Major Jump Down, Spike Up, Spike Down, or Multiple Spikes). Almost twice as many districts had a major jump down (9.2 percent) as those that had a major jump up (5.4 percent). Major jumps may signal substantial changes in MassCore-related policies and/or reporting practices in these districts, or possibly in a subset of schools within these districts. Learning more about MassCore policies, reporting practices, and relevant contextual factors in these districts would be important for developing a better understanding of changes in the statewide MassCore completion rate. The number of districts reporting major spikes (up, down, or multiple) was relatively small (7.9 percent). As with major jumps, these trends may reflect significant shifts in MassCore-related policies and/or reporting practices in these districts. Districts that have reported one or more spikes may benefit from technical assistance regarding MassCore reporting. Nine districts (2.9 percent), which is three fewer than last year, had a steady increase. Moreover, six additional districts (1.9 percent) whose primary trend code was Consistently High, Consistently Moderate, or Consistently Low could also have been coded as Steadily Increasing. These represent a core of potentially model districts that are taking actions that result in gradual improvement. Conversely, four districts (1.6 percent) had a steady decrease, and one additional district whose primary trend code was Consistently Moderate could also have been coded as Steadily Decreasing. This group may benefit from technical assistance to reverse their steady decline. Fifty-eight districts (18.4 percent) reported that 100 percent of their graduates completed MassCore for each of the five years included in this analysis, and an additional 67 districts (21.3 percent) reported consistently high rates of MassCore completion. In ESE’s efforts to promote improved MassCore reporting practices and higher rates of MassCore completion, this group of districts may serve as one source of models. For example, districts that consistently report 100 percent completion may share common policies, such as graduation requirements that meet or exceed MassCore requirements. A clear understanding of the policy environment that exists in these districts could inform the broader conversation about MassCore. Finally, 21 districts (6.7 percent) reported consistently low rates of MassCore completion, and only 1 district (0.3 percent) reported 0 percent MassCore completion for all years included in this analysis. These districts apparently have not adopted MassCore as a graduation requirement. If ESE wanted to know more about policy, reporting, and logistical challenges related to incorporating MassCore as a standard graduation requirement, these districts may offer valuable insights. District Administrator Interviews The five districts that participated in district administrator interviews were selected based on having adopted the MassCore program of studies as part of their high school graduation requirements. The MassCore program manager at ESE selected the five districts, reflecting a range of district accountability and assistance levels (from Level 1 to Level 4), school year 2013–14 MassCore completion rates (from 5 percent to 98 percent), and urbanicity levels (three large urban districts and two suburban districts). The sample included four comprehensive high schools and one career and technical high school. MassCore had been introduced as a graduation requirement at different times, so the first year of students to whom the new requirements apply were the classes of 2013 (N=2), 2015 (N=1), and 2018 (N=2). In the 2012–
RTTT C&CR Annual Evaluation Report, September 2014
UMass Donahue Institute Applied Research and Program Evaluation
95
2013 school year, as would be expected, the three earlier adopters had much higher MassCore completion rates than the later adopters (20 percent and 5 percent, respectively). The primary motivation expressed for adopting MassCore was to increase students’ college and career readiness. One school adopted MassCore as part of their school redesign plan that was required due to their Level 4 accountability status. All districts said that once MassCore was adopted, advancing its implementation was the responsibility of all relevant administrative, instructional, and support personnel, rather than selected individuals. In one district, initial implementation was supported by a district leadership team and some of the district’s principals. Another district has a team of three RTTT-funded MassCore facilitators who serve as case managers for at-risk high school students. The facilitators ensure that the students are receiving interventions needed to support their efforts to complete MassCore and graduate. Changes in course offerings, scheduling, and personnel. All districts reported that changes in courses, scheduling, and personnel were needed in order to accommodate their adoption of MassCore as a graduation requirement. The areas that required additional course offerings were mathematics, lab sciences, foreign language, wellness, and arts. In some cases changes to facilities were also required to accommodate additional lab sciences and art courses. Hiring personnel and offering professional development were also required, particularly in relation to offering a fourth year of mathematics. One district reportedly needed to make difficult hiring decisions in relation to adopting MassCore; they needed to reduce their teaching staff district-wide, so they elected not to rehire some elementary school personnel in order to have enough high school teachers to meet the MassCore requirements. One district needed to convert its 9th-grade science course to a lab course. Another district reported that it expanded its evening and summer school offerings to provide “safety nets” for students who had not made adequate progress toward completing MassCore requirements. For a similar purpose, one district developed online courses through Apex Learning that are offered in a computer lab at school with a facilitating teacher present. The online course platform includes a diagnostic tool to determine the student’s specific learning needs in relation to the course and creates a targeted remediation course. The district reported that 12 students were able to graduate based on these courses who otherwise would have had to repeat a grade. One district invested RTTT funds in working with the National Academy Foundation to develop an engineering academy. Fulfilling MassCore requirements was part of the motivation for this effort, as it provided an opportunity for additional lab science courses. The initial cohort is 65 students, and the academy is scheduled to grow to include about 200 students. The school is currently working toward a similar academy of health and life sciences, which would also provide more lab science opportunities. Scheduling changes were also required to ensure that students could take these courses. A scheduling challenge reported by multiple schools was ensuring that all students could participate in wellness activities during all four years of high school. One district took their previous two-year wellness sequence and stretched the same content to be offered over a four-year period. This school also accepted other athletic activities to meet the wellness requirement, such as playing on a school-sponsored athletic team or activities outside of the school that lasted at least 15 consecutive weeks per semester and met at least twice per week for at least one hour. To receive wellness credit for activities taking place outside the school, students were required to submit a documentation form signed by their parent or guardian. Implementing some of the new courses required curriculum development. To meet the wellness requirement with a high level of relevance to their students, the CTE school reported developing
RTTT C&CR Annual Evaluation Report, September 2014
UMass Donahue Institute Applied Research and Program Evaluation
96
“occupational physical education courses” that covered issues such as workplace injury prevention customized to each of the CTE areas. Topics included how to lift heavy objects, how to avoid carpal tunnel syndrome related to metal-cutting tools, and workstation ergonomics for students in office-based CTE shops. The wellness classes at the CTE school also included more traditional physical education and athletics. The CTE school also explained that it requires all students to take two years of the same foreign language, even though that MassCore requirement does not apply to CTE students statewide. This school believed that meeting this requirement is essential for students to be ready for applying to college, which many of their students do. Challenges. Districts reported that successful MassCore implementation involves challenges in addition to the curriculum, scheduling, and personnel issues discussed above. One district reported that some students are exempted from meeting certain MassCore requirements, such as exemptions from physical education courses for medical reasons, or exemption from foreign language courses for some English language learners (ELLs) and special education students (as a provision of their individualized education plans). This district reported that such exemptions applied to about 15 percent of their students, accounting for the district’s 85 percent MassCore completion rate despite having MassCore completion as a graduation requirement. One issue was that ELL-related support classes made it impossible to schedule ELL students into enough of the classes that are required for MassCore completion. The district has recently changed their ELL pathway to resolve this scheduling issue and anticipates that more ELL students will therefore be able to complete MassCore requirements in the future. One district reported that, as part of their efforts to increase lab science offerings, they had offered courses that are not typical in high schools, but were of high interest to students, such as forensics, marine science, and anatomy and physiology. After the initial years of these offerings, the district discovered that many colleges looked at such courses as science electives, not core lab science courses, and the colleges viewed these course choices as shortcomings in the students’ academic preparation. One specific example was that students were required to have taken a lab chemistry course to apply for nursing programs, and the anatomy and physiology course was not considered an asset for these students if they had not also taken lab chemistry. Since this was a CTE school, whose schedule constraints make it difficult or impossible for students to take extra elective courses, the school reverted to the traditional lab science courses of biology, chemistry, and physics, and stopped offering their innovative alternatives. Another challenge is presented by students who transfer from a district that does not require MassCore completion to a district that does require it. One district reported that they provide supports for such students—such as online, evening, and summer classes—but do not alter graduation requirements for them. Many students and parents have been surprised and upset by this problem. This district reported that students who transfer into the district as seniors from districts that don’t require MassCore are seldom able to graduate in June. Next steps for successful MassCore implementation. Interviewees were asked what main steps they felt still need to be taken for MassCore to be adopted and implemented successfully by their district. One interviewee wanted the district to increase activities with students in grades 7–10 related to identifying their career interests and learning the educational requirements for pursuing those careers. Two districts advocated for increased communication and coordination between the high school and the elementary and middle schools to increase rigor at the lower grades so that students enter high school prepared to take courses that fulfill MassCore requirements. One district wanted to increase the number of courses available to CTE students that could fulfill MassCore requirements. (This was not the CTE school in the interview sample.)
RTTT C&CR Annual Evaluation Report, September 2014
UMass Donahue Institute Applied Research and Program Evaluation
97
Relationship between MassCore and the Common Core. Interviewees were asked to describe ways that their district’s efforts to align their curriculum with the Common Core connected with their efforts to increase MassCore completion rates. A common sentiment among interviewees was that the two initiatives are synergistic or “going in the same direction.” One interviewee explained that the Common Core requirements align more closely with the MassCore requirements than previous curriculum frameworks did, so the district’s efforts to prepare teachers to implement the Common Core also support MassCore implementation. RTTT funds and MassCore implementation. Interviewees were asked about what role, if any, RTTT funds have played in the actions their district has taken toward implementing MassCore. Several of their responses were about ways that they have attempted to increase implementation of the Common Core, particularly through curriculum development and professional development, with the implication that this also supported students’ completion of the MassCore program of studies. One school referred to their collaboration with the National Academy Foundation, their creation of the MassCore facilitator role, and their online courses through Apex Learning, all of which are discussed above. This school also discussed their participation in the RTTT-funded Pre-AP initiative (as well as their MassGrad-funded Gateway to College early college high school program), which they believed supported students in MassCore completion. The CTE school explained that much of their RTTT funding designated for curriculum development has been used in researching textbooks that have online components and in adopting course components that can be accessed through technology platforms such as Moodle. This has enabled students to make more progress on their academic courses during their CTE shop weeks, which has been necessary because of the faster pace and broader content of courses—particularly mathematics courses, according to this interviewee—that are designed to fulfill the Common Core standards. Technical assistance. Two districts reported that they had neither requested nor received technical assistance in implementing MassCore. One district reported that it had discussed issues related to MassCore implementation with other CTE schools associated with the Massachusetts Association of Vocational Administrators. The remaining two districts reported seeking MassCore technical assistance from Nyal Fuentes and Rob O’Donnell at ESE, who connected them with resources (e.g., schools who were working with the National Academy Foundation or implementing Apex Learning online courses) or helped them interpret MassCore requirements (e.g., exceptions and/or exemptions for ELL and special education students). Both districts reported that ESE was very helpful and responsive. When asked what additional resources might be useful, most interviewees mentioned funding related to supporting various parts of their curricular offerings, but none requested additional technical assistance related to MassCore implementation. ESE Interview
Successes. One success described by ESE managers is that the MassCore initiative created a discussion in districts with regard to what might constitute a “floor on rigor” for student coursework. In other words, schools can promote and students can seek a different level of rigor than prescribed by the MassCore program of studies, but the state has recommend a minimum standard for graduation. It is clear that many districts are using MassCore as a reference point during conversations regarding their graduation requirements. Another success they described is that many districts now anticipate that MassCore will eventually become a state-mandated program of studies (even though ESE apparently does not anticipate this

RTTT C&CR Annual Evaluation Report, September 2014
UMass Donahue Institute Applied Research and Program Evaluation
98
happening), which has increased their motivation to work toward implementing it. They pointed out the findings of a study conducted by ESE which found that many districts adopted MassCore or parts of MassCore as graduation requirements during the RTTT period. These included several large districts that have previously had very low MassCore completion rates. Districts have applied the new requirements to incoming 9th graders, but not to older students, because completing MassCore typically requires four years. As a result, these requirements may not apply to graduates before the class of 2017 or 2018, but after that time ESE anticipates a substantial increase in state-level MassCore completion rates.
Challenges. The greatest reported challenge was that MassCore completion did not become a statewide graduation requirement, so many districts prioritized other initiatives. In order to promote the initiative, ESE has therefore needed to utilize strategies that are more labor-intensive (e.g., attempting to persuade schools of MassCore’s advantages) and apparently less effective in achieving higher completion rates. ESE also described the following challenges:
• Recent revisions to the course requirements for entering Massachusetts 4-year public colleges make a strong argument in favor of districts requiring MassCore, but were finalized too late to have much impact on school actions or MassCore completion rates during the RTTT period.
• Although districts spent their discretionary RTTT college and career readiness funds on many worthwhile initiatives that ESE believes will have a positive impact on college and career readiness, many of those impacts will not be immediate or necessarily increase MassCore completion rates.
• The state’s rising graduation rates are likely to include more students than in the past who have accommodations related to special education and/or ELL status. Compared to their school’s overall student body, a higher percentage of these students will be exempt from certain MassCore requirements. Only graduates count toward MassCore completion rates, so if these students graduate at higher rates, their school’s MassCore completion rate might decrease.
• The state currently requires schools to report each student’s MassCore completion status in their annual SIMS data submissions. However, the state anticipates changing to an approach in which MassCore completion is calculated based on each student’s courses as reported by schools in the SCS database. While this change will address some validity concerns relevant to the SIMS method, it will introduce new problems, such as the current inability of SCS to indicate when students fulfill MassCore requirements through activities other than courses (e.g., fulfilling physical education requirements by playing on sports teams or participating in independent athletic activities).
Prospects and Strategies. As described above, ESE anticipates that MassCore completion rates
will increase in upcoming years. However, they also emphasize that ESE’s strategies to reinforce that trend are limited by the fact that MassCore is not a state mandate and that ESE has minimal staffing devoted to this initiative. Therefore, their primary forums for persuading and supporting districts in relation to MassCore are gatherings of educators that ESE has convened for other purposes, and conversations with districts that contact ESE for MassCore implementation support. Some of the specific supports and arguments that ESE shares in these situations, and intends to continue sharing are:
• Identifying gaps in course-taking and ways to develop needed courses.
• Discussing the need to align curriculum vertically so that elementary and middle school coursework supports eventual MassCore completion.
RTTT C&CR Annual Evaluation Report, September 2014
UMass Donahue Institute Applied Research and Program Evaluation
99
• Raising awareness of the interconnectedness of MassCore with high priority district initiatives such as implementation of the Common Core standards, PARCC assessments, and Massachusetts Framework for Educator Evaluation.
Strategic Considerations
• The lack of substantial change observed in statewide MassCore completion rates during the RTTT period might reflect implementation gains being offset by increased accuracy in district reporting, thereby masking actual progress. While there is evidence (e.g., from ESE’s 2014 survey of district graduation requirements) that many districts are moving toward increased MassCore implementation, there is also evidence (e.g., from UMDI’s evaluation) that changes in some districts’ approaches to MassCore reporting have decreased their reported completion rates.
• Accuracy of the MassCore indicator would be increased by enabling districts to report alternative ways that students have fulfilled MassCore requirements. Regardless of whether ESE continues to determine MassCore completion from the SIMS database or transitions to utilizing the SCS database, schools would benefit from support in creating policies to recognize alternatives (e.g., athletic team participation for meeting physical education requirements) and record those alternatives in information management systems. If ESE transitions to calculating MassCore completion from SCS, that database might require new data elements and/or codes to recognize alternatives to traditional courses.
• ESE could leverage its limited MassCore advocacy and support resources by:
o Providing additional online materials that share strategies utilized and lessons learned by districts that have adopted MassCore as a graduation requirement.
o Establishing an official contact in each district who is most knowledgeable about the district’s status, history, and plans related to MassCore implementation. Having this information would facilitate dissemination of advocacy and support resources as well as research and evaluation. For the RTTT evaluation, the district’s RTTT Goal 4 contact was utilized, but this person was often not the most knowledgeable about or invested in MassCore implementation. An interim approach could be to establish an official contact in only those districts that have already adopted MassCore as a graduation requirement.
• Current tracking of school and district progress toward MassCore adoption could be improved, while reducing burden on ESE, via a very brief annual survey of Massachusetts high schools. ESE has conducted a survey of high school graduation requirements five times in the past ten years, most recently by reviewing requirements that schools posted on their websites. Particularly if a statewide survey of any school-level information is already conducted, several questions could be added asking whether schools require each of the MassCore elements (e.g., four years of English, four years of mathematics). Such a survey would be a very small burden on districts, substantially decrease the burden on ESE, enable this information to be collected annually, and increase the likelihood that some of the schools not included in the most recent survey would participate in future surveys. ESE would still have the option of reviewing online materials of schools that did not respond. Such a survey might also incorporate brief questions about other school-level issues of high priority to ESE that are currently unavailable, or only available through labor-intensive means.
• Adding one or more codes to the SIMS MassCore element could enable tracking of valid exemptions from MassCore completion. In the MassCore administrator survey, one district reported that a substantial percentage of students were considered exempt from completing
RTTT C&CR Annual Evaluation Report, September 2014
UMass Donahue Institute Applied Research and Program Evaluation
100
MassCore requirements due to IEPs and medical conditions. To the extent that ESE considers certain types of exemptions valid, enabling districts to report on those exemptions could yield a more accurate calculation of MassCore completion by non-exempt students. Using the current approach to MassCore reporting, this could include adding one or more “exemption codes” to the MassCore data element in SIMS. If calculation of MassCore completion transitions to SCS, one way to track exemptions would be to repurpose the SIMS code so that it was used solely for reporting whether a student was exempt from MassCore completion. Tracking exemptions would also require ESE to educate districts about what exemptions the state considers valid.
RTTT C&CR Annual Evaluation Report, September 2014
UMass Donahue Institute Applied Research and Program Evaluation
101
Appendices