Embed Size (px)
Citation preview
1 © Nokia Siemens Networks
Radio Evolution Beyond LTE
University of Ljubljana25th October 2011Harri Holma – NSN Fellow , Radio System Performance
2 © Nokia Siemens Networks
Agenda
• Industry trends• LTE live networks• LTE Advanced• Beyond 4G radio• Liquid radio vision• Limits of radio network capacity
3 © Nokia Siemens Networks
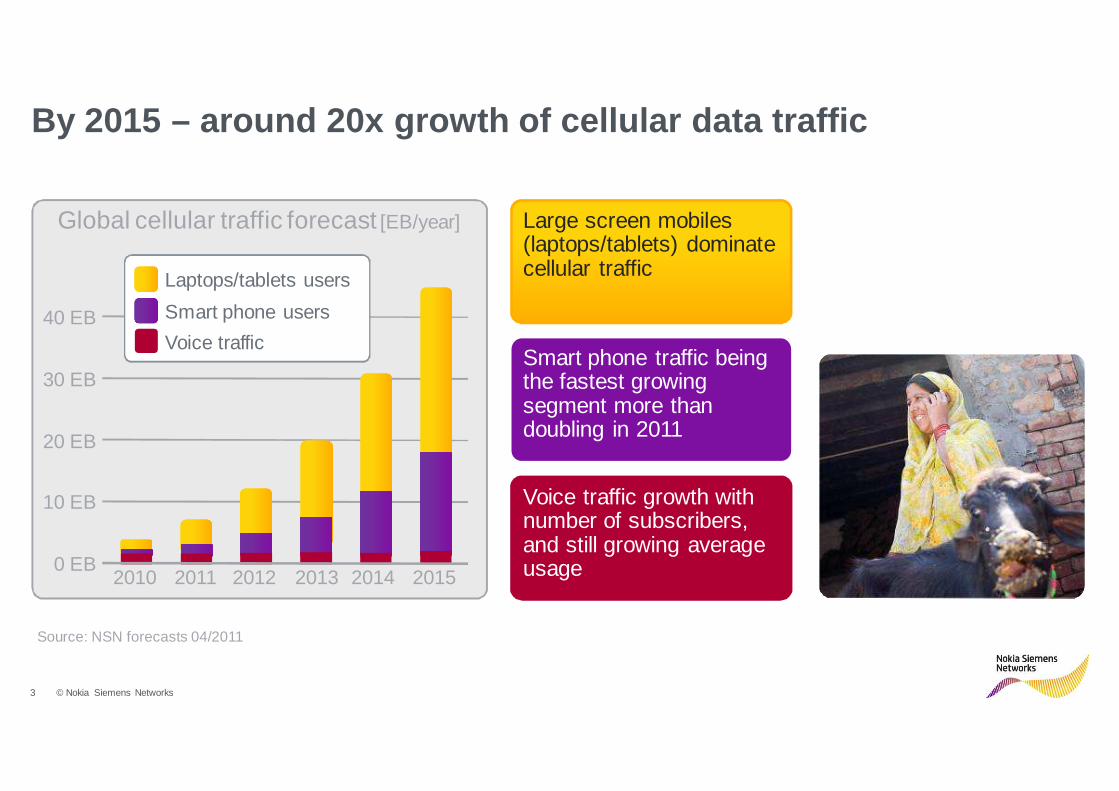
Global cellular traffic forecast [EB/year]
By 2015 – around 20x growth of cellular data traffic
Source: NSN forecasts 04/2011
2010 2011 2012 2013 2014 20150 EB
10 EB
20 EB
30 EB
40 EB Smart phone users
Voice traffic
Laptops/tablets users
Large screen mobiles (laptops/tablets) dominate cellular traffic
Smart phone traffic being the fastest growing segment more than doubling in 2011
Voice traffic growth with number of subscribers, and still growing average usage
4 © Nokia Siemens Networks
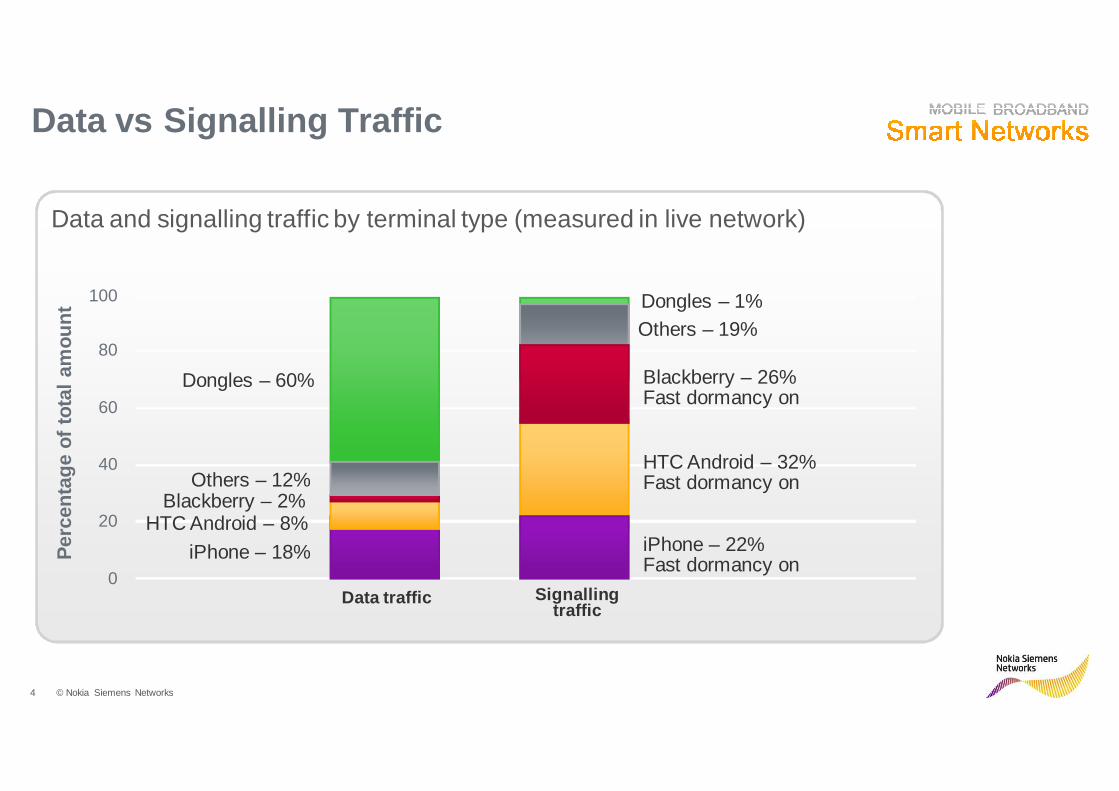
Data vs Signalling Traffic
0
20
40
60
80
100
Data traffic
Data and signalling traffic by terminal type (measured in live network)
Per
cent
age
of to
tal a
mou
nt
iPhone – 18%
HTC Android – 8%Blackberry – 2%
Others – 12%
Dongles – 60%
Signalling traffic
Blackberry – 26%Fast dormancy on
Others – 19%Dongles – 1%
HTC Android – 32%Fast dormancy on
iPhone – 22%Fast dormancy on
5 © Nokia Siemens Networks
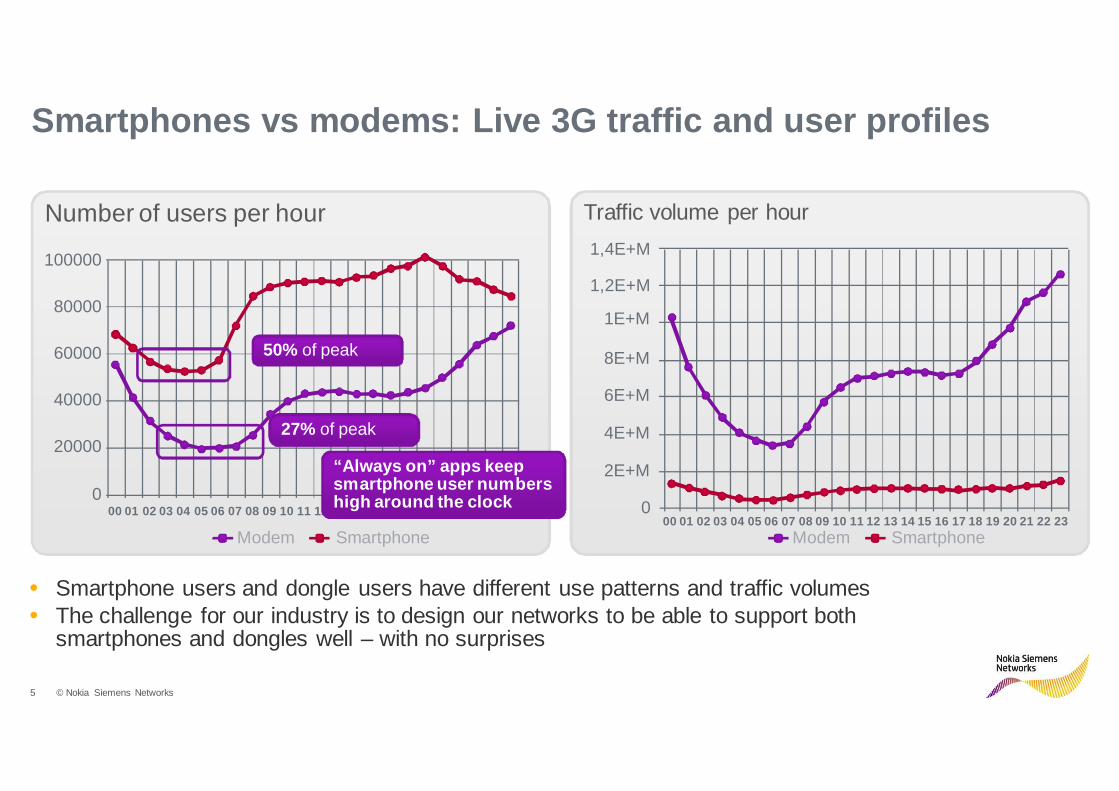
Traffic volume per hourNumber of users per hour
100000
80000
60000
40000
20000
000 01 02 03 04 05 06 07 08 09 10 11 12 13 14 15 16 17 18 19 20 21 22 23
Modem Smartphone
1,4E+M
1,2E+M
6E+M
4E+M
2E+M
000 01 02 03 04 05 06 07 08 09 10 11 12 13 14 15 16 17 18 19 20 21 22 23
Modem Smartphone
8E+M
1E+M
• Smartphone users and dongle users have different use patterns and traffic volumes• The challenge for our industry is to design our networks to be able to support both
smartphones and dongles well – with no surprises
Smartphones vs modems: Live 3G traffic and user profi les
“Always on” apps keep smartphone user numbers high around the clock
50% of peak
27% of peak
6 © Nokia Siemens Networks 20116 © Nokia Siemens Networks6 © Nokia Siemens Networks 2011
LTE Technology in Live Networks
7 © Nokia Siemens Networks
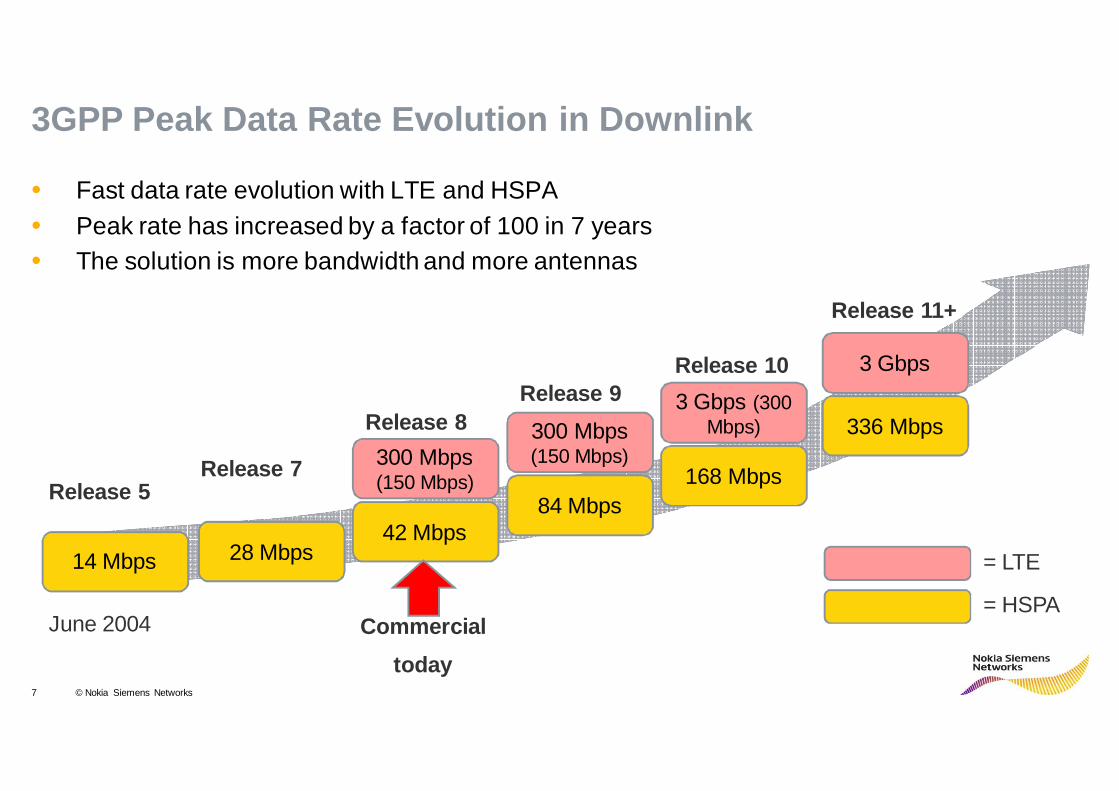
3GPP Peak Data Rate Evolution in Downlink
• Fast data rate evolution with LTE and HSPA• Peak rate has increased by a factor of 100 in 7 years• The solution is more bandwidth and more antennas
Release 5Release 7 300 Mbps
(150 Mbps)
Release 8 300 Mbps (150 Mbps)
Release 9 3 Gbps (300 Mbps)
Release 10 3 Gbps
Release 11+
14 Mbps 28 Mbps42 Mbps
84 Mbps168 Mbps
336 Mbps
= LTE
= HSPAJune 2004 Commercial
today
8 © Nokia Siemens Networks
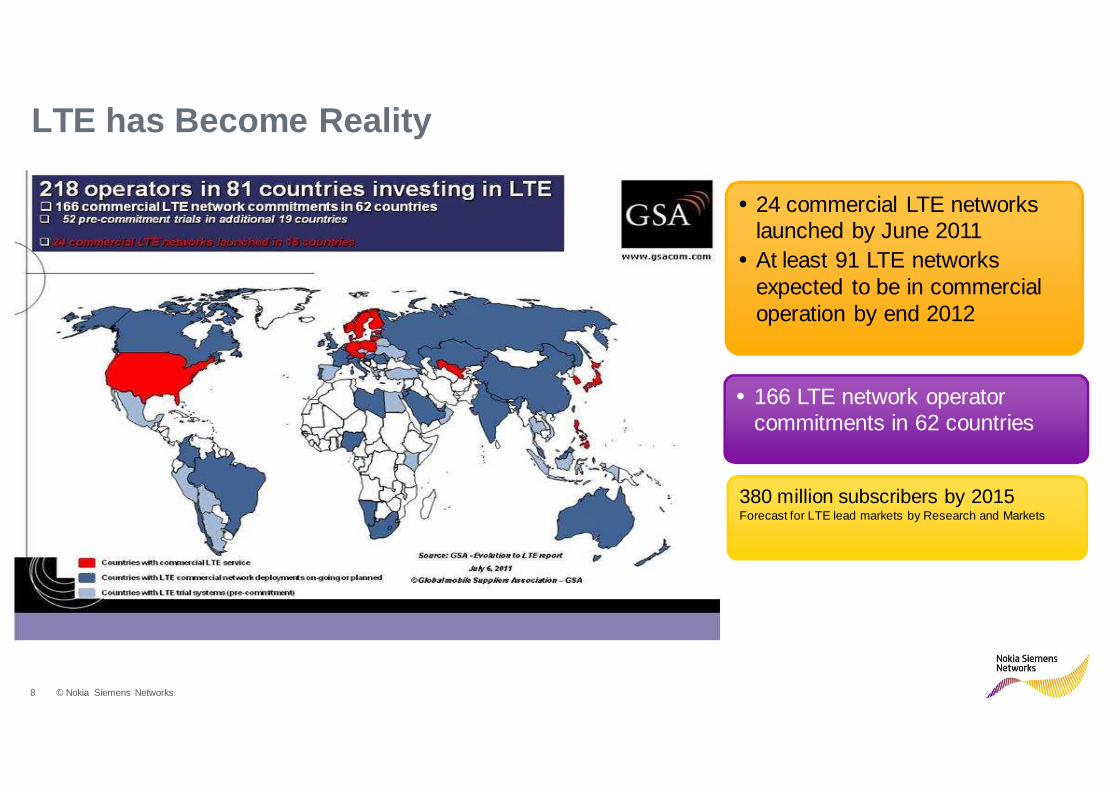
LTE has Become Reality
• 166 LTE network operator commitments in 62 countries
380 million subscribers by 2015 Forecast for LTE lead markets by Research and Markets
• 24 commercial LTE networks launched by June 2011
• At least 91 LTE networks expected to be in commercial operation by end 2012
9 © Nokia Siemens Networks
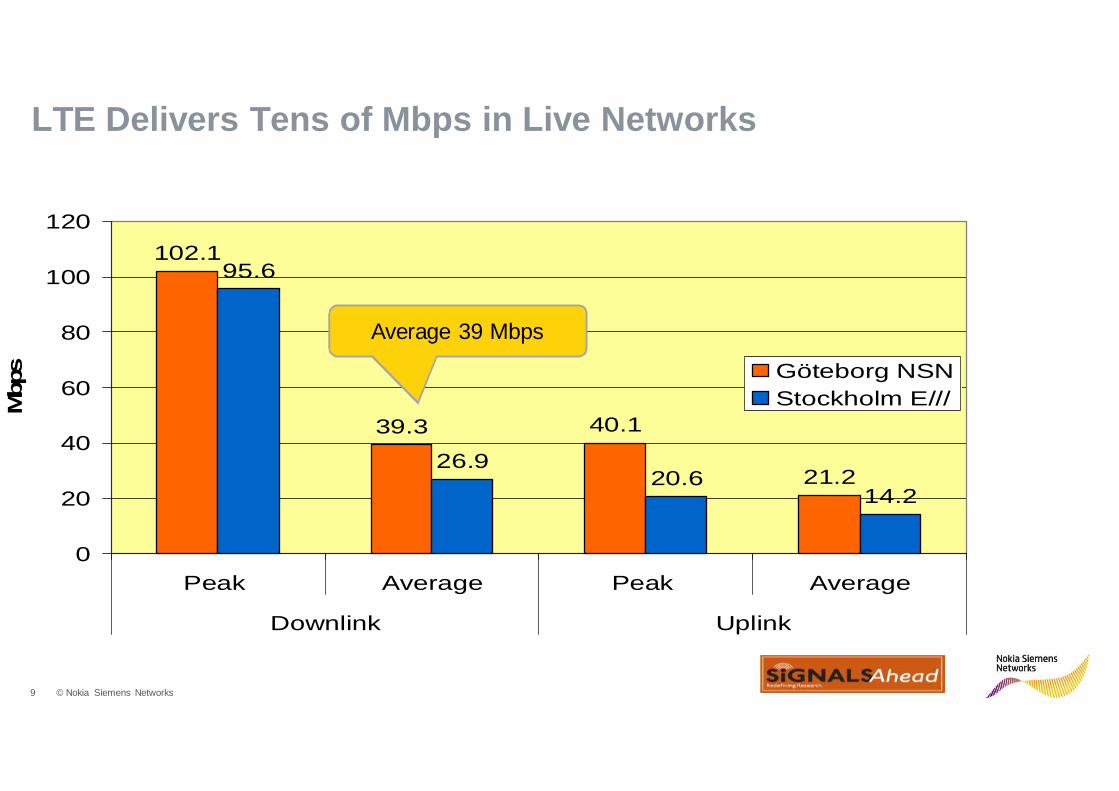
102.1
39.3 40.1
21.2
95.6
26.920.6
14.2
0
20
40
60
80
100
120
Peak Average Peak Average
Downlink Uplink
Mbp
s Göteborg NSNStockholm E///
LTE Delivers Tens of Mbps in Live Networks
Average 39 Mbps
10 © Nokia Siemens Networks
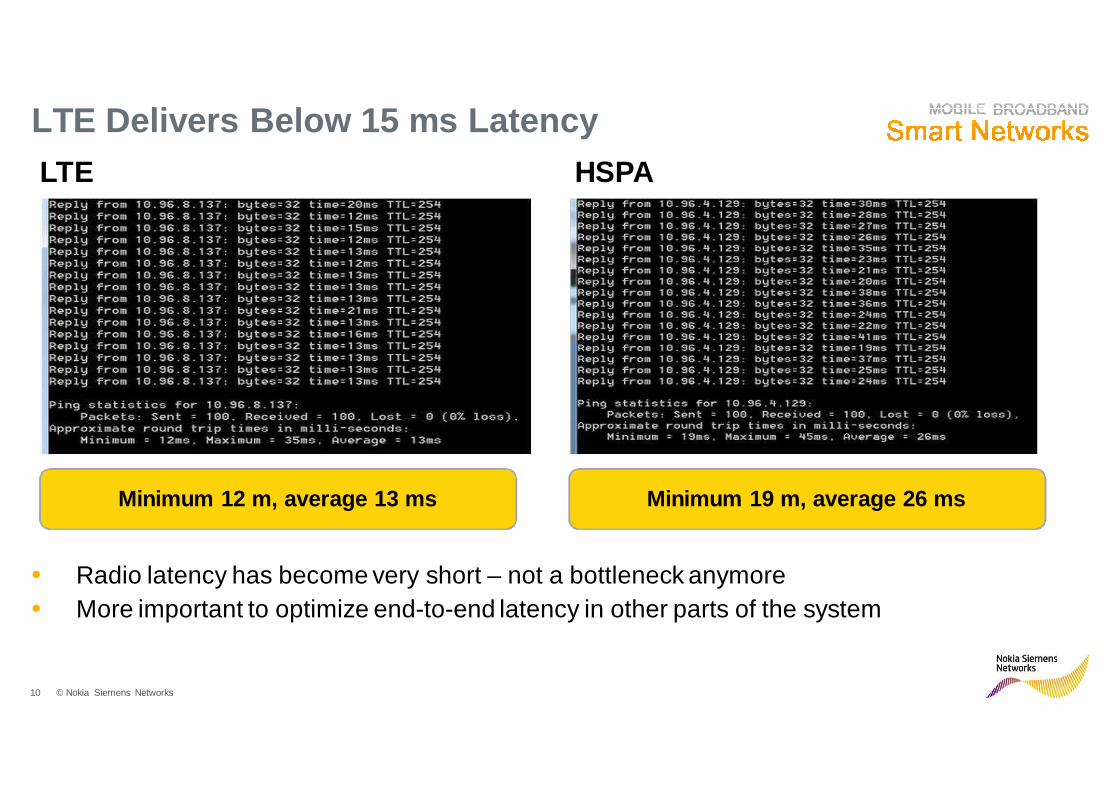
LTE Delivers Below 15 ms Latency
• Radio latency has become very short – not a bottleneck anymore• More important to optimize end-to-end latency in other parts of the system
LTE HSPA
Minimum 12 m, average 13 ms Minimum 19 m, average 26 ms

11 © Nokia Siemens Networks
LTE-Advanced

12 © Nokia Siemens Networks
LTE Timing in 3GPP and in Networks
March 2010March 20093GPP spec ready
June 2011
2H/20112H/2010Networks + first CPEs
End-2012
“Basic LTE” “Small enhancements including VoIP, femto
handovers, MBMS and positioning”
“LTE-Advanced”
Peak rate
Average rate
150 Mbps with 20 MHz1
35 Mbps with 20 MHz1
Release 8 Release 9
150 Mbps with 20 MHz1
35 Mbps with 20 MHz1
1 Gbps with 40 MHz3
140 Mbps with 40 MHz2
Release 10
1With 2x2 antennas2With 4x4 antennas3With 8x8 antennas

LTE-Advanced: Toolbox of Features
Bandwidth Extension
MIMO
Cooperative Systems
Relaying
8x 4x
100 MHz
Smooth Migrationto LTE-A
Backward compatible
to LTE
Mobility
+Heterogeneous Networks
More bandwidth
More antennas
More sites
Relaying
Cooperation

14 © Nokia Siemens Networks
Beyond 4G

15 © Nokia Siemens Networks
What will the world want from wireless by 2020?
Support up to 1000 times more traffic
Rock solid, ubiquitous connectivity
Gbps peak speeds
Millisecond latency for true “local feel”
Super HD
HD
Ultra HD3D HD
3D SDTV
100Mbps 200Mbps 3000Mbps
Apps bandwidth demand
Mobile data traffic
2010 20151 EB
1000x1000 EB
2020
©2011 Intuitive Surgical, Inc.

16 © Nokia Siemens Networks
By 2020 – radio can reduce latency 10x
The main benefit is realized when content is close. 1 ms limits fiber length to 100 km.
Radio latency can be pushed to 1 ms by 2020 by using a shorter frame length
Enable low-latency M2M solutions
0 ms
5 ms
10 ms
15 ms
20 ms
Latency in radio networks
HSPA LTE “B4G“
Air interfaceBase station UE

17 © Nokia Siemens Networks
By 2020 - radio can improve in spectral efficiency 1 0x
Efficiency is not limited by Shannon law but by inter-cell interference.
Spectral efficiency can be improved by managing inter-cell interference.
Cell edge data rates improve twice as much
0
2
4
6
8
LTE2x2
LTEAdvanced
4x4
+ CoMP + UEinterferencecancelation
+ furtherinnovations
Spectral efficiency [bps/Hz/cell]
HSPA today

18 © Nokia Siemens Networks
By 2020 - there can be 10x more spectrum available
10 times more spectrum can be made available if we drive for it.
Cognitive radio enables optimized spectrum usage over multiple operators
Evolution of available radio spectrum
Unlic 5GHzUnlic 2.4GHz3700 MHz3400 MHz2600 MHz2300 MHz
2100 MHz1800 MHz900 MHz800 MHz700 MHz450 MHz
2010 2012 2015 2020
500MHz
1000MHz
1500MHz
2100 MHz TDD

19 © Nokia Siemens Networks
Up to 1000 times more capacity
10xPerformance
10x Spectrum
10x Base stations
1000xcapacity

20 © Nokia Siemens Networks
What will a macro site look like?
RF module is integrated with the antenna
Bulky shelters have disappeared - base stations installed on mast tops
New antenna form factors emerge: panels, arrays, irregular shapes
Baseband processing is integrated with the antenna, or pooled at central site

21 © Nokia Siemens Networks
What will a small base station look like?
Pico/Micro size is dictated by required antenna performance
Femto module shrinks to finger tip size

22 © Nokia Siemens Networks
How can we deploy, commission and maintain all the radios, frequency bands and layers?
All cells and frequency layers automatically managed by advanced SON
All spectrum under unified RRM for instant capacity and coverage optimization
Cognitive networks will reduce errors, improve quality and lower operation and energy costs
Virtually one ubiquitous connectivity

23 © Nokia Siemens Networks
Liquid Radio Concept

24 © Nokia Siemens Networks
Liquid Radio – Key elements
Baseband pooling Active Antenna Systems Unified & SON enabledHeterogeneous Networks
Beamforming, CoMP
RRH6-sectorsites
3-sectorRF model
ActiveAntenna
Over 10 Gbpsbaseband
LTE
TD-LTE
HSPA+
HSPA+Femto
LTEFemto
WiFi
High load Low load

25 © Nokia Siemens Networks
Active antenna with vertical beamformingActive antenna with vertical beamformingTraditional RRH with classic radiation patternTraditional RRH with classic radiation pattern
Active Antenna Solution with Beamforming
Up to 65% increased capacity with Active antenna
RRH
Flexi Multiradio Antenna System

26 © Nokia Siemens Networks
Heterogeneous Networks
Flexi Lite base station

27 © Nokia Siemens Networks
Maximum Capacity – Case Study Slovenia

28 © Nokia Siemens Networks
How Much Traffic per Subscriber can be Supported?
20 MHz HSPA
1M subscribers
20 MHz HSPA + 50 MHz LTE
100 MHz LTE + pico cells
+ 6 sectors or beamforming in
macro cells
100 MHz LTE in macro cells
5 different casesstudied
Assumptions
The next slide shows network level dimensioning byassuming typical traffic patters from existing mobile broadband networks.
Busy hour load 50%Sites carrying 50% of traffic 15%Voice share 0%Sectors 3Busy hour share 7%HSPA cell throughput 6.0LTE 20 MHz cell throughput 35.0Traffic per sub per month [GB] 5.0Number of base stations 7006-sector capacity gain 50%Pico cell capacity gain 250%

29 © Nokia Siemens Networks
1.56.8
10.215.9
55.8
0
10
20
30
40
50
60
70
80
90
100
20 MHz HSPA 20 MHz HSPA +
50 MHz LTE
20 MHz HSPA +
50 MHz LTE +
Sectorization
100 MHz LTE 100 MHz LTE +
pico cells
GB/sub/month
How Much Traffic per Subscriber can be Supported?
1.5 GB/sub with HSPA
6-10 GB/sub with HSPA + LTE
15 GB/sub with future macro cell
LTE
50 GB/sub with small cells
For reference: HD IP-TV 2 hoursper day equals 270 GB /month

30 © Nokia Siemens Networks
Thank you!Thank you!
www.nokiasiemensnetworks.comNokia Siemens NetworksLinnoitustie 6FI-02600 ESPOOFinland
Harri HolmaNSN Fellow – Radio System PerformanceNokia Siemens Networks [email protected] +358 40 523 2609