Embed Size (px)
Citation preview
2015-16 School Accountability Report Card for Rancho del Rey Middle Page 1 of 13
Rancho del Rey Middle
School Accountability Report Card
Reported Using Data from the 2015-16 School Year
Published During 2016-17
By February 1 of each year, every school in California is required by state law to publish a School Accountability Report Card (SARC). The SARC contains information about the condition and performance of each California public school. Under the Local Control Funding Formula (LCFF) all local educational agencies (LEAs) are required to prepare a Local Control and Accountability Plan (LCAP), which describes how they intend to meet annual school-specific goals for all pupils, with specific activities to address state and local priorities. Additionally, data reported in an LCAP is to be consistent with data reported in the SARC. • For more information about SARC requirements, see the California Department of Education (CDE) SARC Web page at
http://www.cde.ca.gov/ta/ac/sa/. • For more information about the LCFF or LCAP, see the CDE LCFF Web page at http://www.cde.ca.gov/fg/aa/lc/. • For additional information about the school, parents/guardians and community members should contact the school principal or
the district office. DataQuest DataQuest is an online data tool located on the CDE DataQuest Web page at http://dq.cde.ca.gov/dataquest/ that contains additional information about this school and comparisons of the school to the district and the county. Specifically, DataQuest is a dynamic system that provides reports for accountability (e.g., test data, enrollment, high school graduates, dropouts, course enrollments, staffing, and data regarding English learners). Internet Access Internet access is available at public libraries and other locations that are publicly accessible (e.g., the California State Library). Access to the Internet at libraries and public locations is generally provided on a first-come, first-served basis. Other use restrictions may include the hours of operation, the length of time that a workstation may be used (depending on availability), the types of software programs available on a workstation, and the ability to print documents.
About This School Contact Information (School Year 2016-17)
School Contact Information
School Name------- Rancho del Rey Middle
Street------- 1174 East J St.
City, State, Zip------- Chula Vista, Ca, 91910-7040
Phone Number------- 619-397-2515
Principal------- Ms. Anna Pedroza, Principal
E-mail Address------- [email protected]
Web Site------- www .sweetwaterschools.org
CDS Code 37684116114276
2015-16 School Accountability Report Card for Rancho del Rey Middle Page 2 of 13
District Contact Information
District Name------- Sweetwater Union High
Phone Number------- (619) 691-5555
Superintendent-------
Karen Janney, Ed.D.
E-mail Address------- [email protected]
Web Site------- www.sweetwaterschools.org/
School Description and Mission Statement (School Year 2016-17)
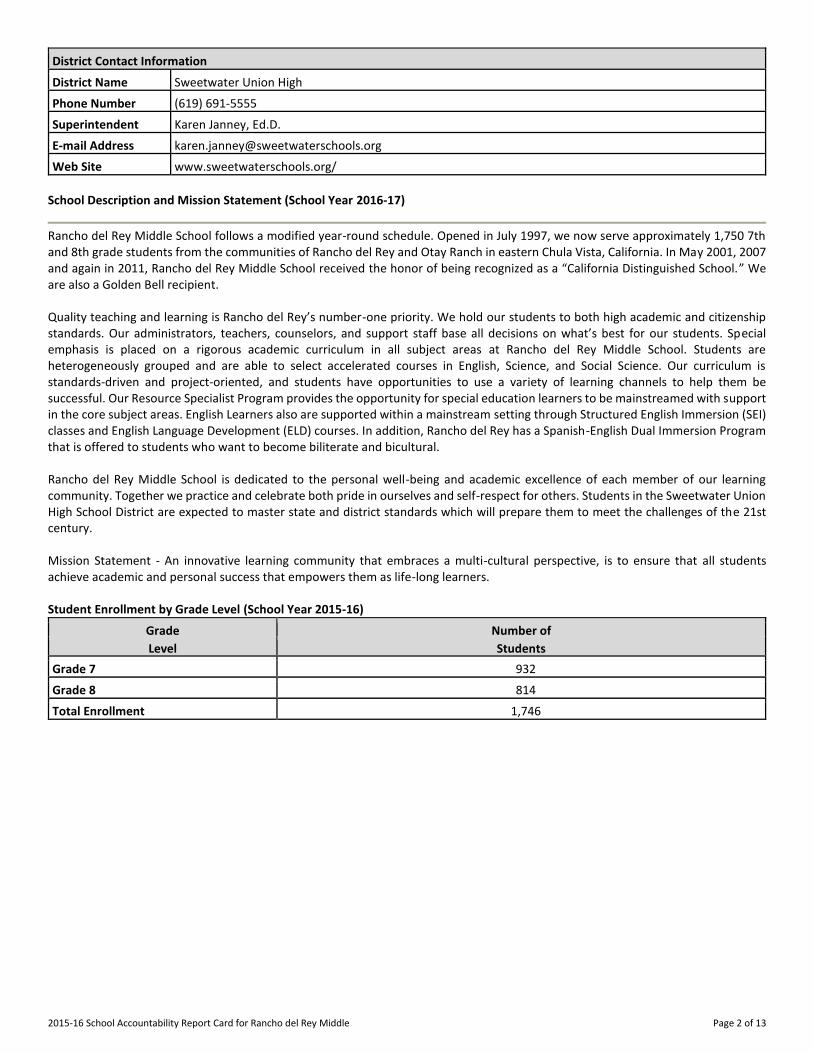
Rancho del Rey Middle School follows a modified year-round schedule. Opened in July 1997, we now serve approximately 1,750 7th and 8th grade students from the communities of Rancho del Rey and Otay Ranch in eastern Chula Vista, California. In May 2001, 2007 and again in 2011, Rancho del Rey Middle School received the honor of being recognized as a “California Distinguished School.” We are also a Golden Bell recipient. Quality teaching and learning is Rancho del Rey’s number-one priority. We hold our students to both high academic and citizenship standards. Our administrators, teachers, counselors, and support staff base all decisions on what’s best for our students. Special emphasis is placed on a rigorous academic curriculum in all subject areas at Rancho del Rey Middle School. Students are heterogeneously grouped and are able to select accelerated courses in English, Science, and Social Science. Our curriculum is standards-driven and project-oriented, and students have opportunities to use a variety of learning channels to help them be successful. Our Resource Specialist Program provides the opportunity for special education learners to be mainstreamed with support in the core subject areas. English Learners also are supported within a mainstream setting through Structured English Immersion (SEI) classes and English Language Development (ELD) courses. In addition, Rancho del Rey has a Spanish-English Dual Immersion Program that is offered to students who want to become biliterate and bicultural. Rancho del Rey Middle School is dedicated to the personal well-being and academic excellence of each member of our learning community. Together we practice and celebrate both pride in ourselves and self-respect for others. Students in the Sweetwater Union High School District are expected to master state and district standards which will prepare them to meet the challenges of the 21st century. Mission Statement - An innovative learning community that embraces a multi-cultural perspective, is to ensure that all students achieve academic and personal success that empowers them as life-long learners. Student Enrollment by Grade Level (School Year 2015-16)
Grade Number of
Level Students
Grade 7 932
Grade 8 814
Total Enrollment 1,746
2015-16 School Accountability Report Card for Rancho del Rey Middle Page 3 of 13
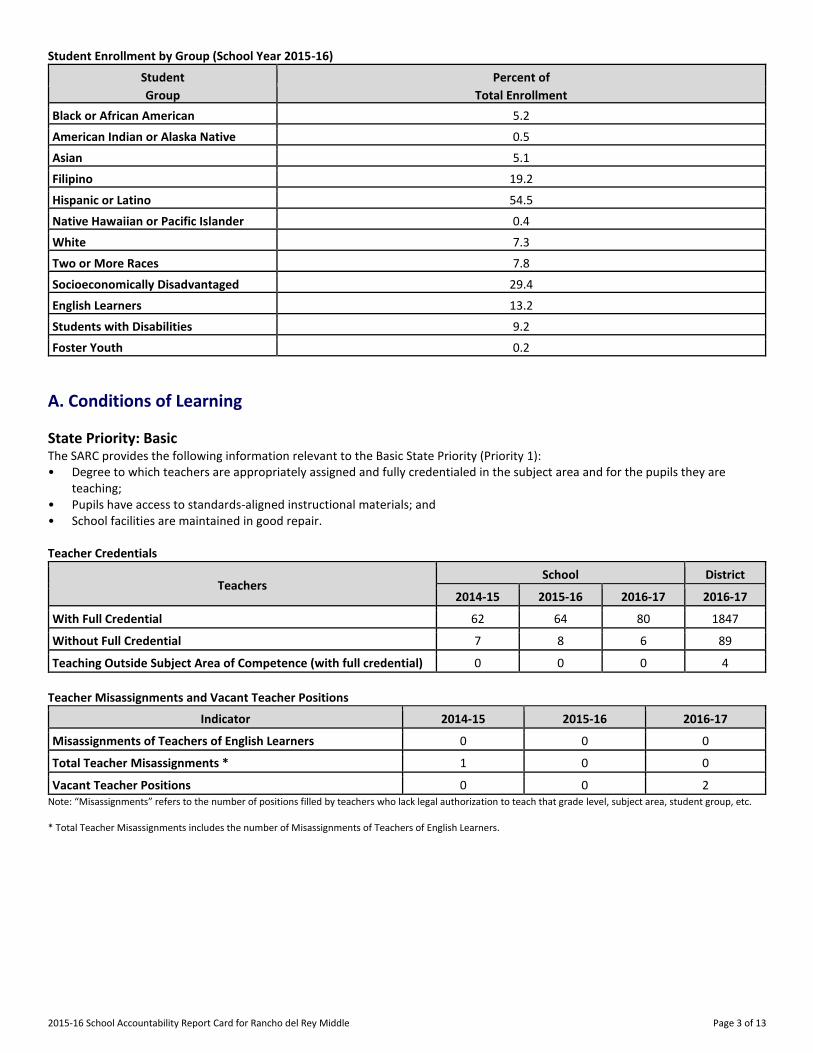
Student Enrollment by Group (School Year 2015-16)
Student Percent of
Group Total Enrollment
Black or African American 5.2
American Indian or Alaska Native 0.5
Asian 5.1
Filipino 19.2
Hispanic or Latino 54.5
Native Hawaiian or Pacific Islander 0.4
White 7.3
Two or More Races 7.8
Socioeconomically Disadvantaged 29.4
English Learners 13.2
Students with Disabilities 9.2
Foster Youth 0.2
A. Conditions of Learning
State Priority: Basic The SARC provides the following information relevant to the Basic State Priority (Priority 1): • Degree to which teachers are appropriately assigned and fully credentialed in the subject area and for the pupils they are
teaching; • Pupils have access to standards-aligned instructional materials; and • School facilities are maintained in good repair. Teacher Credentials
Teachers School District
2014-15 2015-16 2016-17 2016-17
With Full Credential 62 64 80 1847
Without Full Credential 7 8 6 89
Teaching Outside Subject Area of Competence (with full credential) 0 0 0 4
Teacher Misassignments and Vacant Teacher Positions
Indicator 2014-15 2015-16 2016-17
Misassignments of Teachers of English Learners 0 0 0
Total Teacher Misassignments * 1 0 0
Vacant Teacher Positions 0 0 2 Note: “Misassignments” refers to the number of positions filled by teachers who lack legal authorization to teach that grade level, subject area, student group, etc. * Total Teacher Misassignments includes the number of Misassignments of Teachers of English Learners.
2015-16 School Accountability Report Card for Rancho del Rey Middle Page 4 of 13
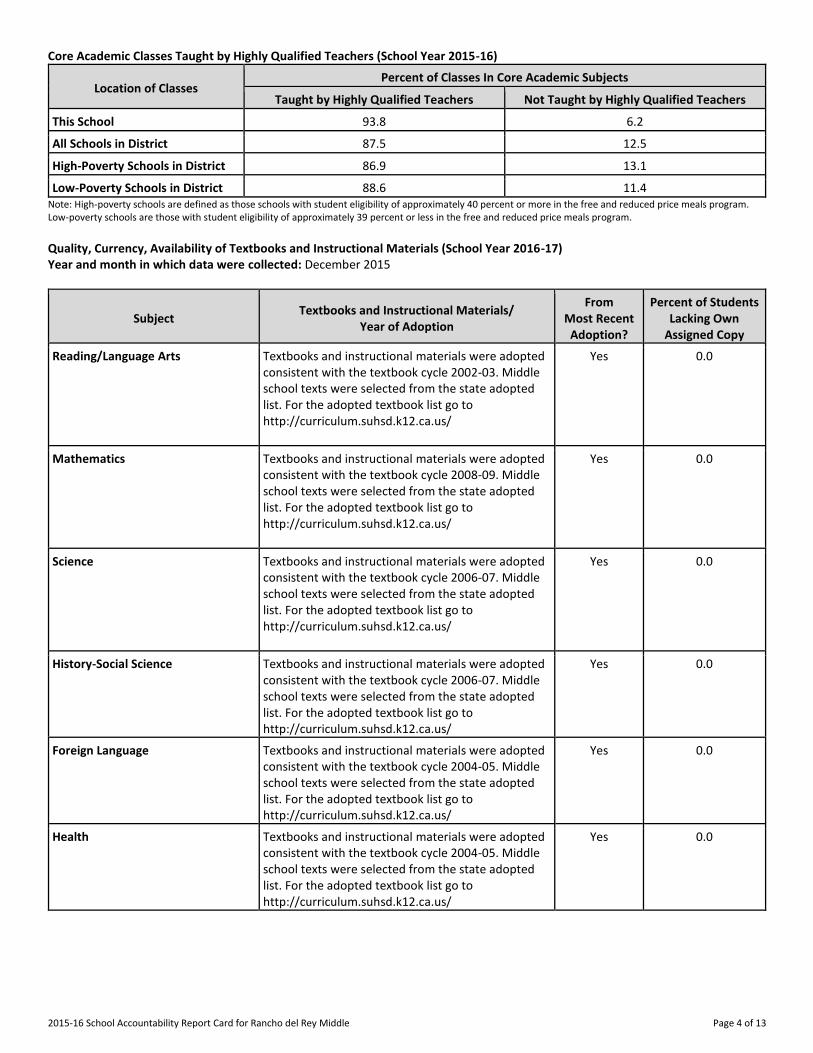
Core Academic Classes Taught by Highly Qualified Teachers (School Year 2015-16)
Location of Classes Percent of Classes In Core Academic Subjects
Taught by Highly Qualified Teachers Not Taught by Highly Qualified Teachers
This School 93.8 6.2
All Schools in District 87.5 12.5
High-Poverty Schools in District 86.9 13.1
Low-Poverty Schools in District 88.6 11.4 Note: High-poverty schools are defined as those schools with student eligibility of approximately 40 percent or more in the free and reduced price meals program. Low-poverty schools are those with student eligibility of approximately 39 percent or less in the free and reduced price meals program. Quality, Currency, Availability of Textbooks and Instructional Materials (School Year 2016-17) Year and month in which data were collected: December 2015
Subject Textbooks and Instructional Materials/
Year of Adoption
From Most Recent
Adoption?
Percent of Students Lacking Own
Assigned Copy
Reading/Language Arts Textbooks and instructional materials were adopted consistent with the textbook cycle 2002-03. Middle
school texts were selected from the state adopted list. For the adopted textbook list go to
http://curriculum.suhsd.k12.ca.us/
Yes 0.0
Mathematics Textbooks and instructional materials were adopted consistent with the textbook cycle 2008-09. Middle school texts were selected from the state adopted list. For the adopted textbook list go to
http://curriculum.suhsd.k12.ca.us/
Yes 0.0
Science Textbooks and instructional materials were adopted consistent with the textbook cycle 2006-07. Middle school texts were selected from the state adopted list. For the adopted textbook list go to
http://curriculum.suhsd.k12.ca.us/
Yes 0.0
History-Social Science Textbooks and instructional materials were adopted consistent with the textbook cycle 2006-07. Middle school texts were selected from the state adopted list. For the adopted textbook list go to http://curriculum.suhsd.k12.ca.us/
Yes 0.0
Foreign Language Textbooks and instructional materials were adopted consistent with the textbook cycle 2004-05. Middle school texts were selected from the state adopted list. For the adopted textbook list go to http://curriculum.suhsd.k12.ca.us/
Yes 0.0
Health Textbooks and instructional materials were adopted consistent with the textbook cycle 2004-05. Middle school texts were selected from the state adopted list. For the adopted textbook list go to http://curriculum.suhsd.k12.ca.us/
Yes 0.0
2015-16 School Accountability Report Card for Rancho del Rey Middle Page 5 of 13
Subject Textbooks and Instructional Materials/
Year of Adoption
From Most Recent
Adoption?
Percent of Students Lacking Own
Assigned Copy
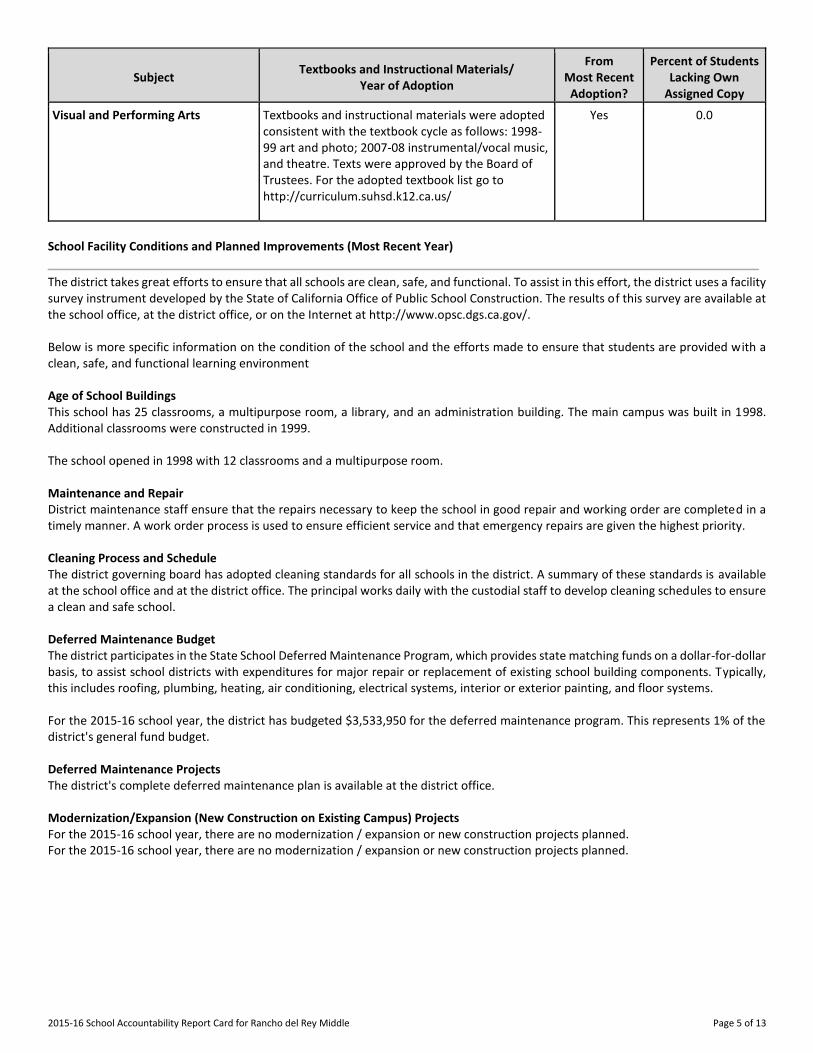
Visual and Performing Arts Textbooks and instructional materials were adopted consistent with the textbook cycle as follows: 1998-99 art and photo; 2007-08 instrumental/vocal music, and theatre. Texts were approved by the Board of
Trustees. For the adopted textbook list go to http://curriculum.suhsd.k12.ca.us/
Yes 0.0
School Facility Conditions and Planned Improvements (Most Recent Year)
The district takes great efforts to ensure that all schools are clean, safe, and functional. To assist in this effort, the district uses a facility survey instrument developed by the State of California Office of Public School Construction. The results of this survey are available at the school office, at the district office, or on the Internet at http://www.opsc.dgs.ca.gov/. Below is more specific information on the condition of the school and the efforts made to ensure that students are provided with a clean, safe, and functional learning environment Age of School Buildings This school has 25 classrooms, a multipurpose room, a library, and an administration building. The main campus was built in 1998. Additional classrooms were constructed in 1999. The school opened in 1998 with 12 classrooms and a multipurpose room. Maintenance and Repair District maintenance staff ensure that the repairs necessary to keep the school in good repair and working order are completed in a timely manner. A work order process is used to ensure efficient service and that emergency repairs are given the highest priority. Cleaning Process and Schedule The district governing board has adopted cleaning standards for all schools in the district. A summary of these standards is available at the school office and at the district office. The principal works daily with the custodial staff to develop cleaning schedules to ensure a clean and safe school. Deferred Maintenance Budget The district participates in the State School Deferred Maintenance Program, which provides state matching funds on a dollar-for-dollar basis, to assist school districts with expenditures for major repair or replacement of existing school building components. Typically, this includes roofing, plumbing, heating, air conditioning, electrical systems, interior or exterior painting, and floor systems. For the 2015-16 school year, the district has budgeted $3,533,950 for the deferred maintenance program. This represents 1% of the district's general fund budget. Deferred Maintenance Projects The district's complete deferred maintenance plan is available at the district office. Modernization/Expansion (New Construction on Existing Campus) Projects For the 2015-16 school year, there are no modernization / expansion or new construction projects planned. For the 2015-16 school year, there are no modernization / expansion or new construction projects planned.
2015-16 School Accountability Report Card for Rancho del Rey Middle Page 6 of 13
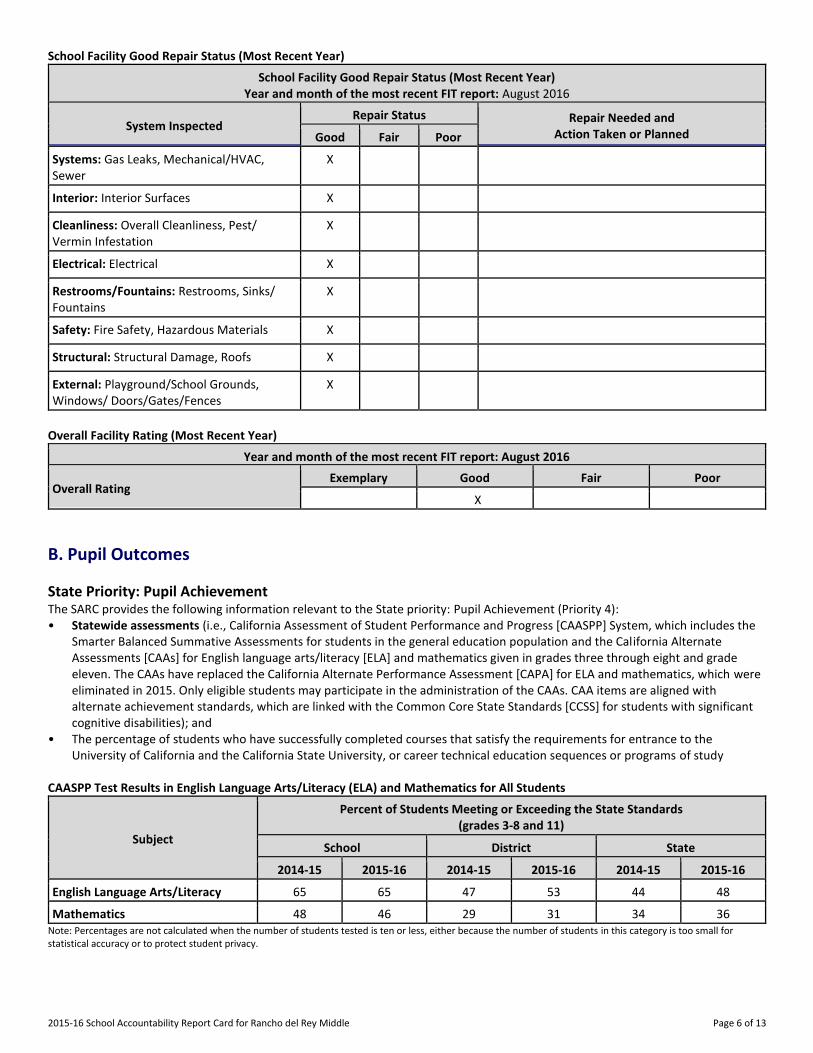
School Facility Good Repair Status (Most Recent Year)
School Facility Good Repair Status (Most Recent Year) Year and month of the most recent FIT report: August 2016
System Inspected Repair Status Repair Needed and
Action Taken or Planned Good Fair Poor
Systems: Gas Leaks, Mechanical/HVAC, Sewer
X
Interior: Interior Surfaces X
Cleanliness: Overall Cleanliness, Pest/ Vermin Infestation
X
Electrical: Electrical X
Restrooms/Fountains: Restrooms, Sinks/ Fountains
X
Safety: Fire Safety, Hazardous Materials X
Structural: Structural Damage, Roofs X
External: Playground/School Grounds, Windows/ Doors/Gates/Fences
X
Overall Facility Rating (Most Recent Year)
Year and month of the most recent FIT report: August 2016
Overall Rating Exemplary Good Fair Poor
X
B. Pupil Outcomes
State Priority: Pupil Achievement The SARC provides the following information relevant to the State priority: Pupil Achievement (Priority 4): • Statewide assessments (i.e., California Assessment of Student Performance and Progress [CAASPP] System, which includes the
Smarter Balanced Summative Assessments for students in the general education population and the California Alternate Assessments [CAAs] for English language arts/literacy [ELA] and mathematics given in grades three through eight and grade eleven. The CAAs have replaced the California Alternate Performance Assessment [CAPA] for ELA and mathematics, which were eliminated in 2015. Only eligible students may participate in the administration of the CAAs. CAA items are aligned with alternate achievement standards, which are linked with the Common Core State Standards [CCSS] for students with significant cognitive disabilities); and
• The percentage of students who have successfully completed courses that satisfy the requirements for entrance to the University of California and the California State University, or career technical education sequences or programs of study
CAASPP Test Results in English Language Arts/Literacy (ELA) and Mathematics for All Students
Subject
Percent of Students Meeting or Exceeding the State Standards (grades 3-8 and 11)
School District State
2014-15 2015-16 2014-15 2015-16 2014-15 2015-16
English Language Arts/Literacy 65 65 47 53 44 48
Mathematics 48 46 29 31 34 36 Note: Percentages are not calculated when the number of students tested is ten or less, either because the number of students in this category is too small for statistical accuracy or to protect student privacy.
2015-16 School Accountability Report Card for Rancho del Rey Middle Page 7 of 13
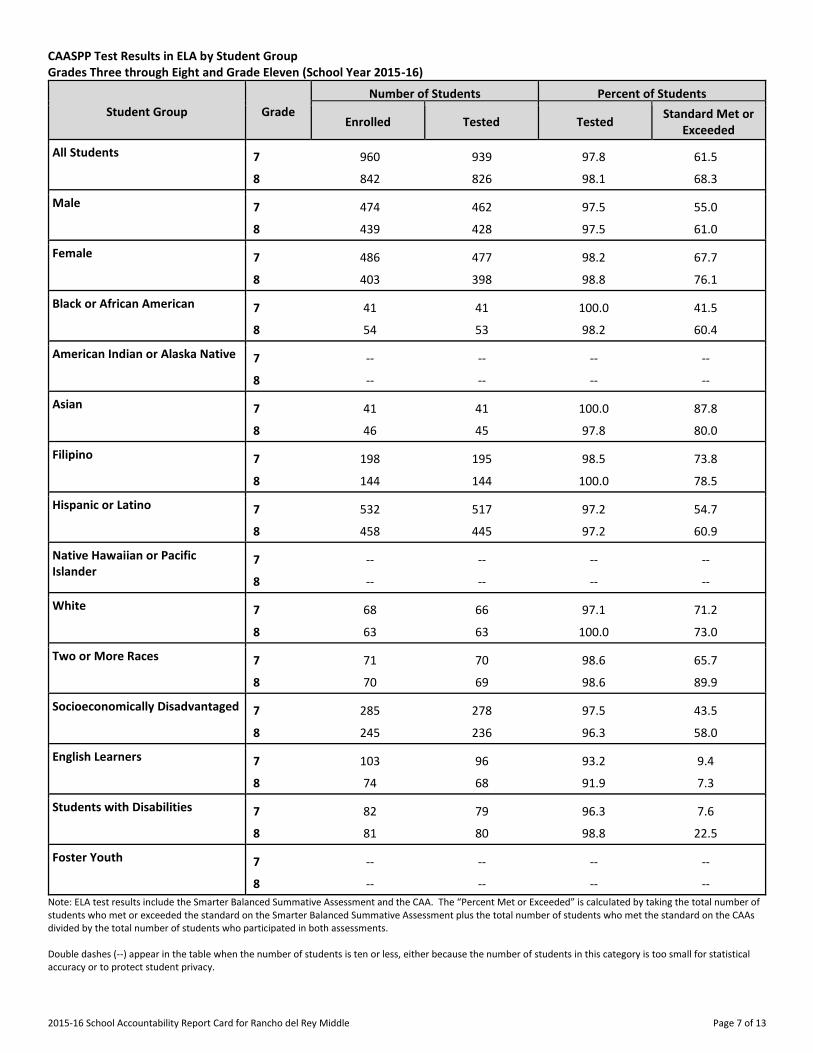
CAASPP Test Results in ELA by Student Group Grades Three through Eight and Grade Eleven (School Year 2015-16)
Student Group Grade
Number of Students Percent of Students
Enrolled Tested Tested Standard Met or
Exceeded
All Students 7 960 939 97.8 61.5
8 842 826 98.1 68.3
Male 7 474 462 97.5 55.0
8 439 428 97.5 61.0
Female 7 486 477 98.2 67.7
8 403 398 98.8 76.1
Black or African American 7 41 41 100.0 41.5
8 54 53 98.2 60.4
American Indian or Alaska Native 7 -- -- -- --
8 -- -- -- --
Asian 7 41 41 100.0 87.8
8 46 45 97.8 80.0
Filipino 7 198 195 98.5 73.8
8 144 144 100.0 78.5
Hispanic or Latino 7 532 517 97.2 54.7
8 458 445 97.2 60.9
Native Hawaiian or Pacific Islander
7 -- -- -- --
8 -- -- -- --
White 7 68 66 97.1 71.2
8 63 63 100.0 73.0
Two or More Races 7 71 70 98.6 65.7
8 70 69 98.6 89.9
Socioeconomically Disadvantaged 7 285 278 97.5 43.5
8 245 236 96.3 58.0
English Learners 7 103 96 93.2 9.4
8 74 68 91.9 7.3
Students with Disabilities 7 82 79 96.3 7.6
8 81 80 98.8 22.5
Foster Youth 7 -- -- -- --
8 -- -- -- --
Note: ELA test results include the Smarter Balanced Summative Assessment and the CAA. The “Percent Met or Exceeded” is calculated by taking the total number of students who met or exceeded the standard on the Smarter Balanced Summative Assessment plus the total number of students who met the standard on the CAAs divided by the total number of students who participated in both assessments. Double dashes (--) appear in the table when the number of students is ten or less, either because the number of students in this category is too small for statistical accuracy or to protect student privacy.
2015-16 School Accountability Report Card for Rancho del Rey Middle Page 8 of 13
Note: The number of students tested includes all students who participated in the test whether they received a score or not; however, the number of students tested is not the number that was used to calculate the achievement level percentages. The achievement level percentages are calculated using only students who received scores.
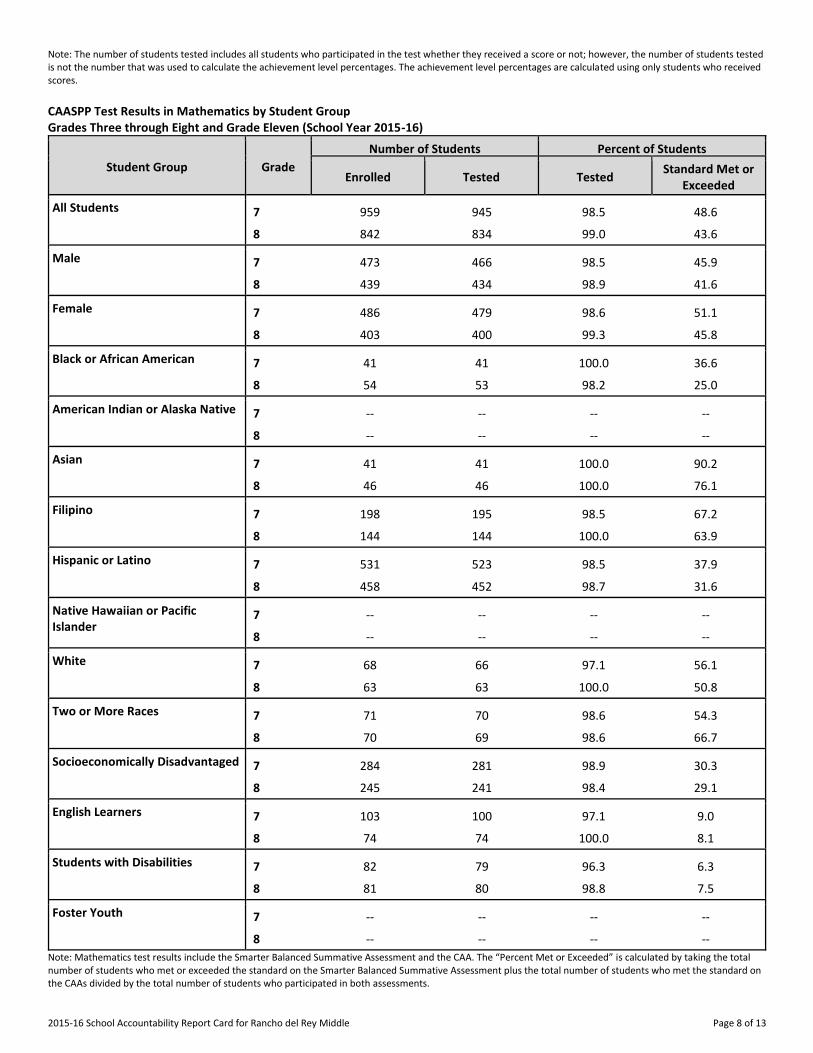
CAASPP Test Results in Mathematics by Student Group Grades Three through Eight and Grade Eleven (School Year 2015-16)
Student Group Grade
Number of Students Percent of Students
Enrolled Tested Tested Standard Met or
Exceeded
All Students 7 959 945 98.5 48.6
8 842 834 99.0 43.6
Male 7 473 466 98.5 45.9
8 439 434 98.9 41.6
Female 7 486 479 98.6 51.1
8 403 400 99.3 45.8
Black or African American 7 41 41 100.0 36.6
8 54 53 98.2 25.0
American Indian or Alaska Native 7 -- -- -- --
8 -- -- -- --
Asian 7 41 41 100.0 90.2
8 46 46 100.0 76.1
Filipino 7 198 195 98.5 67.2
8 144 144 100.0 63.9
Hispanic or Latino 7 531 523 98.5 37.9
8 458 452 98.7 31.6
Native Hawaiian or Pacific Islander
7 -- -- -- --
8 -- -- -- --
White 7 68 66 97.1 56.1
8 63 63 100.0 50.8
Two or More Races 7 71 70 98.6 54.3
8 70 69 98.6 66.7
Socioeconomically Disadvantaged 7 284 281 98.9 30.3
8 245 241 98.4 29.1
English Learners 7 103 100 97.1 9.0
8 74 74 100.0 8.1
Students with Disabilities 7 82 79 96.3 6.3
8 81 80 98.8 7.5
Foster Youth 7 -- -- -- --
8 -- -- -- --
Note: Mathematics test results include the Smarter Balanced Summative Assessment and the CAA. The “Percent Met or Exceeded” is calculated by taking the total number of students who met or exceeded the standard on the Smarter Balanced Summative Assessment plus the total number of students who met the standard on the CAAs divided by the total number of students who participated in both assessments.
2015-16 School Accountability Report Card for Rancho del Rey Middle Page 9 of 13
Double dashes (--) appear in the table when the number of students is ten or less, either because the number of students in this category is too small for statistical accuracy or to protect student privacy. Note: The number of students tested includes all students who participated in the test whether they received a score or not; however, the number of students tested is not the number that was used to calculate the achievement level percentages. The achievement level percentages are calculated using only students who received scores.
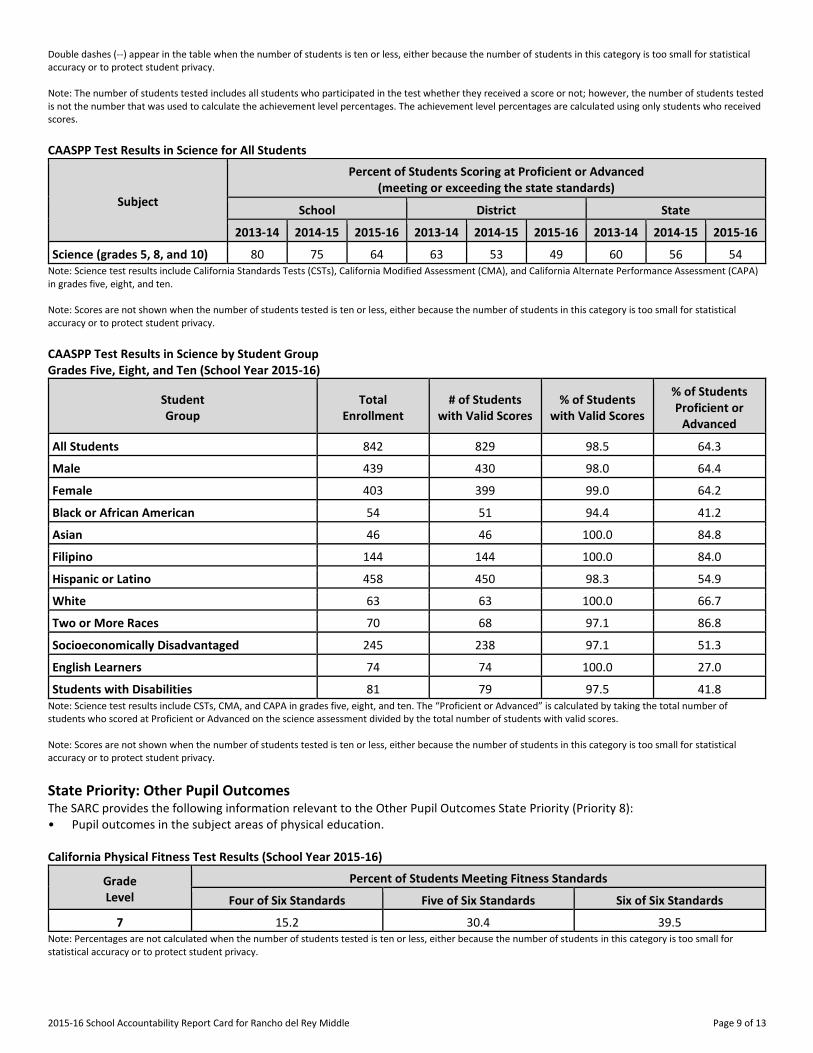
CAASPP Test Results in Science for All Students
Subject
Percent of Students Scoring at Proficient or Advanced (meeting or exceeding the state standards)
School District State
2013-14 2014-15 2015-16 2013-14 2014-15 2015-16 2013-14 2014-15 2015-16
Science (grades 5, 8, and 10) 80 75 64 63 53 49 60 56 54 Note: Science test results include California Standards Tests (CSTs), California Modified Assessment (CMA), and California Alternate Performance Assessment (CAPA) in grades five, eight, and ten. Note: Scores are not shown when the number of students tested is ten or less, either because the number of students in this category is too small for statistical accuracy or to protect student privacy.
CAASPP Test Results in Science by Student Group Grades Five, Eight, and Ten (School Year 2015-16)
Student Group
Total Enrollment
# of Students with Valid Scores
% of Students with Valid Scores
% of Students Proficient or
Advanced
All Students 842 829 98.5 64.3
Male 439 430 98.0 64.4
Female 403 399 99.0 64.2
Black or African American 54 51 94.4 41.2
Asian 46 46 100.0 84.8
Filipino 144 144 100.0 84.0
Hispanic or Latino 458 450 98.3 54.9
White 63 63 100.0 66.7
Two or More Races 70 68 97.1 86.8
Socioeconomically Disadvantaged 245 238 97.1 51.3
English Learners 74 74 100.0 27.0
Students with Disabilities 81 79 97.5 41.8 Note: Science test results include CSTs, CMA, and CAPA in grades five, eight, and ten. The “Proficient or Advanced” is calculated by taking the total number of students who scored at Proficient or Advanced on the science assessment divided by the total number of students with valid scores. Note: Scores are not shown when the number of students tested is ten or less, either because the number of students in this category is too small for statistical accuracy or to protect student privacy.
State Priority: Other Pupil Outcomes The SARC provides the following information relevant to the Other Pupil Outcomes State Priority (Priority 8): • Pupil outcomes in the subject areas of physical education. California Physical Fitness Test Results (School Year 2015-16)
Grade Level
Percent of Students Meeting Fitness Standards
Four of Six Standards Five of Six Standards Six of Six Standards
---7--- 15.2 30.4 39.5 Note: Percentages are not calculated when the number of students tested is ten or less, either because the number of students in this category is too small for statistical accuracy or to protect student privacy.
2015-16 School Accountability Report Card for Rancho del Rey Middle Page 10 of 13
C. Engagement
State Priority: Parental Involvement The SARC provides the following information relevant to the Parental Involvement State Priority (Priority 3): • Efforts the school district makes to seek parent input in making decisions for the school district and each schoolsite. Opportunities for Parental Involvement (School Year 2016-17)
Research shows a direct correlation between parent involvement and student academic success. Therefore, it is our belief at Rancho del Rey Middle School that parents must become partners in the education of their children. Here at Rancho del Rey we have made it our mission to equip parents with the tools they need in order to participate in the education of their children whether or not they can physically volunteer at school. At Rancho del Rey we have worked with our community and our parent groups to develop a Parent Involvement Policy and School-Family Compact that is reflective of our commitment to our students' academic success. In an effort to provide parents and our community with relevant school information, Rancho del Rey uses a variety of ways to connect and engage with our parents. Administration, teachers, counselors, and support staff communicate regularly with parents through automated and personal phone calls, email, correspondences, online grading programs, parent meetings and events, new student orientation, Open House, Back to School Night, Parent Walkthroughs, coffee with the principal, Twitter, our monthly Royal Newsletter, and through our school website. In addition, there are many organized opportunities for parents to become involved at Rancho del Rey. Our site has a very active PTSO which hosts a variety of events throughout the school year for parents. We have ELAC and Dual Immersion parent groups as well as band parent booster clubs which conduct a variety of fund raising activities during the year to enrich their respective programs. Parents serve on our school site council (SSC), English Language Advisory Council (ELAC), District Parent Advisory Council, (DPAC), and District English Language Advisory Council (DELAC). Parents are also encouraged to volunteer on site to work in the office and/or the library or to become a long term volunteer working with individual classroom teachers.
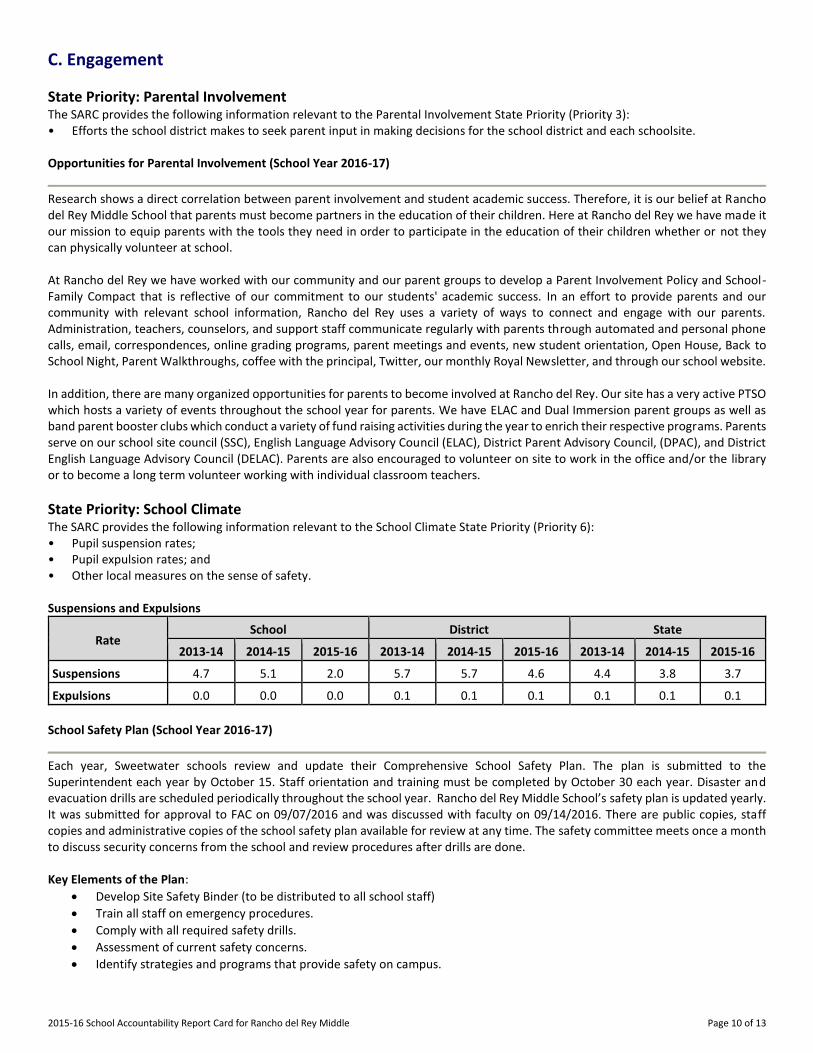
State Priority: School Climate The SARC provides the following information relevant to the School Climate State Priority (Priority 6): • Pupil suspension rates; • Pupil expulsion rates; and • Other local measures on the sense of safety. Suspensions and Expulsions
Rate School District State
2013-14 2014-15 2015-16 2013-14 2014-15 2015-16 2013-14 2014-15 2015-16
Suspensions------- 4.7 5.1 2.0 5.7 5.7 4.6 4.4 3.8 3.7
Expulsions------- 0.0 0.0 0.0 0.1 0.1 0.1 0.1 0.1 0.1
School Safety Plan (School Year 2016-17)
Each year, Sweetwater schools review and update their Comprehensive School Safety Plan. The plan is submitted to the Superintendent each year by October 15. Staff orientation and training must be completed by October 30 each year. Disaster and evacuation drills are scheduled periodically throughout the school year. Rancho del Rey Middle School’s safety plan is updated yearly. It was submitted for approval to FAC on 09/07/2016 and was discussed with faculty on 09/14/2016. There are public copies, staff copies and administrative copies of the school safety plan available for review at any time. The safety committee meets once a month to discuss security concerns from the school and review procedures after drills are done. Key Elements of the Plan:
Develop Site Safety Binder (to be distributed to all school staff)
Train all staff on emergency procedures.
Comply with all required safety drills.
Assessment of current safety concerns.
Identify strategies and programs that provide safety on campus.
2015-16 School Accountability Report Card for Rancho del Rey Middle Page 11 of 13
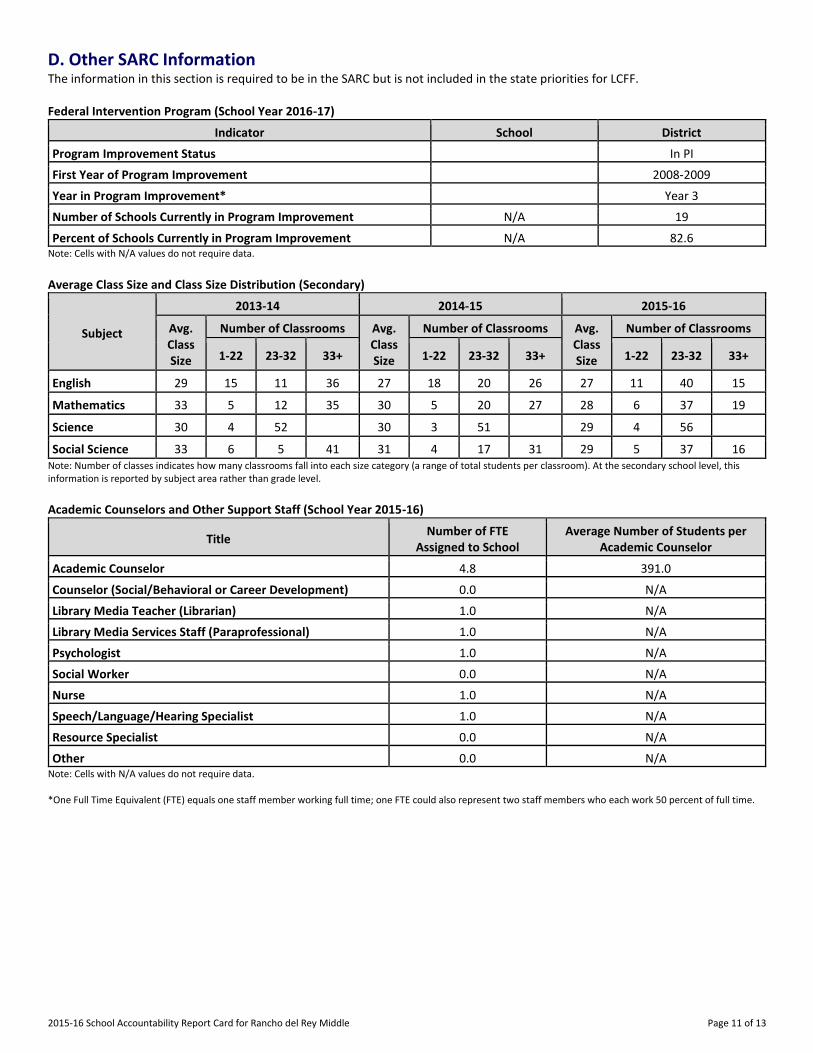
D. Other SARC Information The information in this section is required to be in the SARC but is not included in the state priorities for LCFF. Federal Intervention Program (School Year 2016-17)
Indicator School District
Program Improvement Status In PI
First Year of Program Improvement 2008-2009
Year in Program Improvement* Year 3
Number of Schools Currently in Program Improvement N/A 19
Percent of Schools Currently in Program Improvement N/A 82.6 Note: Cells with N/A values do not require data.
Average Class Size and Class Size Distribution (Secondary)
Subject
2013-14 2014-15 2015-16
Avg. Class Size
Number of Classrooms Avg. Class Size
Number of Classrooms Avg. Class Size
Number of Classrooms
1-22 23-32 33+ 1-22 23-32 33+ 1-22 23-32 33+
English------- ----------
29 15 11 36 27 18 20 26 27 11 40 15
Mathematics ----------
33 5 12 35 30 5 20 27 28 6 37 19
Science------- ----------
30 4 52 30 3 51 29 4 56
Social Science ----------
33 6 5 41 31 4 17 31 29 5 37 16 Note: Number of classes indicates how many classrooms fall into each size category (a range of total students per classroom). At the secondary school level, this information is reported by subject area rather than grade level. Academic Counselors and Other Support Staff (School Year 2015-16)
Title Number of FTE
Assigned to School Average Number of Students per
Academic Counselor
Academic Counselor------- 4.8 391.0
Counselor (Social/Behavioral or Career Development) 0.0 N/A
Library Media Teacher (Librarian) 1.0 N/A
Library Media Services Staff (Paraprofessional) 1.0 N/A
Psychologist------- 1.0 N/A
Social Worker------- 0.0 N/A
Nurse------- 1.0 N/A
Speech/Language/Hearing Specialist 1.0 N/A
Resource Specialist------- 0.0 N/A
Other------- 0.0 N/A Note: Cells with N/A values do not require data. *One Full Time Equivalent (FTE) equals one staff member working full time; one FTE could also represent two staff members who each work 50 percent of full time.
2015-16 School Accountability Report Card for Rancho del Rey Middle Page 12 of 13
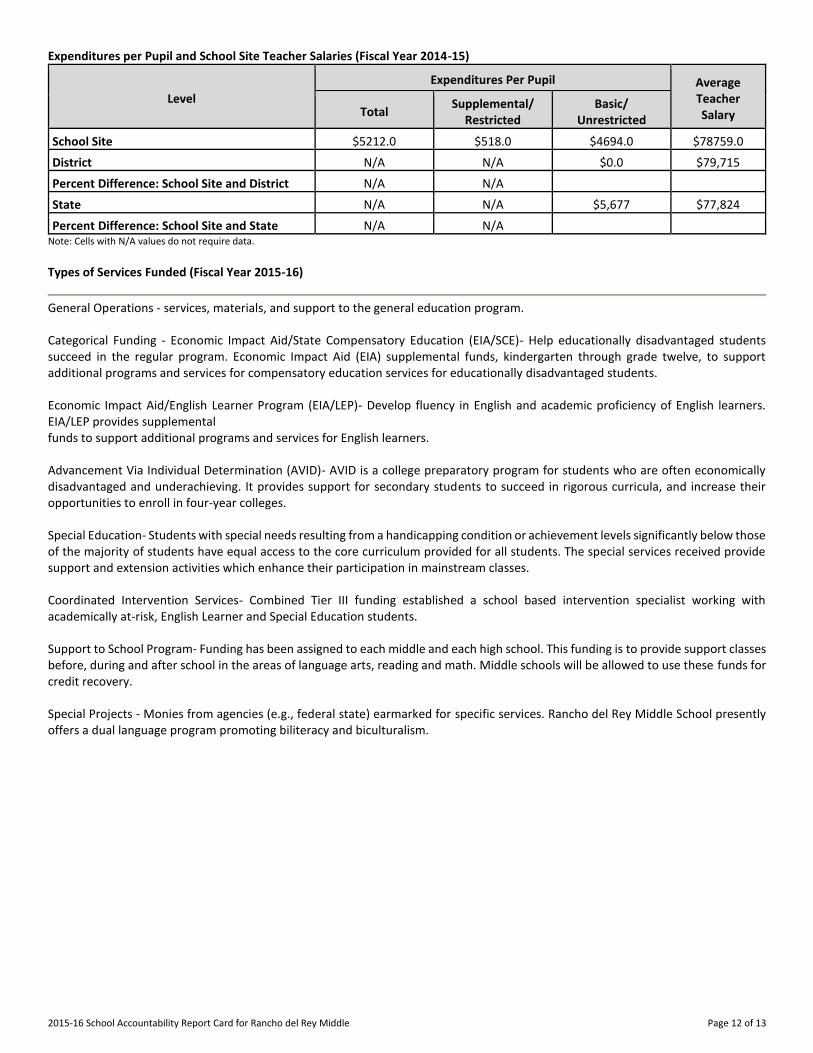
Expenditures per Pupil and School Site Teacher Salaries (Fiscal Year 2014-15)
Level
Expenditures Per Pupil Average Teacher Salary Total
Supplemental/ Restricted
Basic/ Unrestricted
School Site------- $5212.0 $518.0 $4694.0 $78759.0
District------- N/A N/A $0.0 $79,715
Percent Difference: School Site and District N/A N/A
State------- N/A N/A $5,677 $77,824
Percent Difference: School Site and State N/A N/A Note: Cells with N/A values do not require data.
Types of Services Funded (Fiscal Year 2015-16)
General Operations - services, materials, and support to the general education program. Categorical Funding - Economic Impact Aid/State Compensatory Education (EIA/SCE)- Help educationally disadvantaged students succeed in the regular program. Economic Impact Aid (EIA) supplemental funds, kindergarten through grade twelve, to support additional programs and services for compensatory education services for educationally disadvantaged students. Economic Impact Aid/English Learner Program (EIA/LEP)- Develop fluency in English and academic proficiency of English learners. EIA/LEP provides supplemental funds to support additional programs and services for English learners. Advancement Via Individual Determination (AVID)- AVID is a college preparatory program for students who are often economically disadvantaged and underachieving. It provides support for secondary students to succeed in rigorous curricula, and increase their opportunities to enroll in four-year colleges. Special Education- Students with special needs resulting from a handicapping condition or achievement levels significantly below those of the majority of students have equal access to the core curriculum provided for all students. The special services received provide support and extension activities which enhance their participation in mainstream classes. Coordinated Intervention Services- Combined Tier III funding established a school based intervention specialist working with academically at-risk, English Learner and Special Education students. Support to School Program- Funding has been assigned to each middle and each high school. This funding is to provide support classes before, during and after school in the areas of language arts, reading and math. Middle schools will be allowed to use these funds for credit recovery. Special Projects - Monies from agencies (e.g., federal state) earmarked for specific services. Rancho del Rey Middle School presently offers a dual language program promoting biliteracy and biculturalism.

2015-16 School Accountability Report Card for Rancho del Rey Middle Page 13 of 13
Teacher and Administrative Salaries (Fiscal Year 2014-15)
Category District Amount State Average for Districts In Same Category
Beginning Teacher Salary $42,986 $46,184
Mid-Range Teacher Salary $73,692 $75,179
Highest Teacher Salary $96,471 $96,169
Average Principal Salary (Elementary)
Average Principal Salary (Middle) $138,060 $124,243
Average Principal Salary (High) $151,325 $137,939
Superintendent Salary $235,000 $217,637
Percent of Budget for Teacher Salaries 38% 35%
Percent of Budget for Administrative Salaries 4% 5% For detailed information on salaries, see the CDE Certificated Salaries & Benefits Web page at http://www.cde.ca.gov/ds/fd/cs/. Professional Development (Most Recent Three Years)
For the 2011-12 and 2012-13 school years, Rancho del Rey Middle School staff participated in all SUHSD supported Curriculum, Instruction, and Assessment (CIA) meetings and participated in writing curriculum, learning best instructional practices approaches, and analyzed assessment data from a district-wide perspective. Additionally, two teachers attended the AVID Summer Institute. Each Friday, staff members meet for two hours in Professional Learning Community meetings of subject-area teachers to further refine learning through the Plan, Teach, Assess cycle model. For the 2013-14 school year, Rancho del Rey Middle staff participate in various tech trainings as related to the iPad Initiative. In addition, two teachers are attending the district sponsored “Apple Institute” to receive more specialized training on select iPad applications. They will become the site experts for their fellow teachers. Also, two teachers from each of our core subject areas attend quarterly “Cohort” trainings that focus on the transition to the Common Core State Standards and assessment. In addition, teacher representatives participate in vertical alignment meetings with staff from our destination high schools. Finally, our teachers continue to meet in PLCs on Friday afternoons. For the 2014-15 school year, Rancho del Rey Middle School incorporated the use of school site curriculum specialist in each of the four core subject areas. The curriculum specialist helped support our professional development at our site through PLC’s and three cohort trainings through-out the school year. During cohort trainings, teachers focus on proper implementation of the common core state standards and NGSS. In weekly Friday PLC’s, the curriculum specialist work with departments on creating formative assessments, incorporating technology with the use of iPads, sharing best practices, creating lessons aligned to the common core, and using data to inform instruction. Teachers participated in department pull out days and lesson studies in order to refine and learn new teaching strategies that they can incorporate into their classrooms. A variety of conferences and trainings were attended by our staff that included: AVID summer institute, College Preparatory Mathematics, Common Core and the Holocaust/Civil Rights Movement, iPad Summit San Diego, CABE, Para-Educator Conference, Biliteracy Symposium, and Social Science Promising Practices in the Common Core World. For the 2015-1016 school year, Rancho del Rey Middle School incorporated the use of school site curriculum specialist in each of the four core subject areas. The curriculum specialists help support our professional development at our site through Professional Learning Communities (PLC's) and three cohort trainings throughout the school year. During cohort trainings, teachers focus on proper implementation of the Common Core State Standards and Next Generation Science Standards. In weekly Friday PLC’s, the curriculum specialist work with departments on creating formative assessments, incorporating technology with the use of iPads, sharing best practices, creating lessons aligned to the common core, and using data to inform instruction. Teachers participate in department pull out days and lesson studies in order to refine and learn new teaching strategies that they can incorporate into their classrooms. Two days of Sheltered English Immersion (SEI) training is provided to teachers who teach SEI classes in order to support our English Learners. A variety of conferences and trainings will be attended by our staff that include: AVID summer institute, Institute for Conservation Research, Youth Mental Health First Aid, Google Tools and Apps, CABE, Biliteracy Symposium, and Social Science Promising Practices in the Common Core World.