Embed Size (px)
Citation preview
ANNALS O F CLINICAL AND LABORATORY SCIEN CE, Vol. 16, No. 3 Copyright © 1986, Institu te for Clinical Science, Inc.
Rapid Analysis of Nickel in Urine by Electrotherm al Atomic Absorption Spectrophotometry*F. W ILLIAM SUNDERMAN J r . , M .D .,f i SIDNEYM . H O PFER, Ph .D .,* M. CRISTINA CRISOSTOMO; B .S.,$ and MARKUS STOEPPLER, Ph .D .§
tDepartments o f Laboratory Medicine and Pharmacology, University of Connecticut School of Medicine,
Farmington, CT 06032 and
§lnstitute of Applied Physical Chemistry, Nuclear Research Center (KFA),
D-5170 Juelich, Federal Republic of Germany
ABSTRACTA m ethod is described for analysis of nickel in urine, which involves
dilution of urine with dilute nitric acid and direct quantitation of nickel by electrotherm al atomic absorption spectrophotom etry with Zeeman background correction. The detection limit for nickel is 0.5 fJLg per L of urine; the coefficient of variation of replicate determ inations is 4 to 5 percent (within-run) and 6 percent (run-to-run). Recovery of nickel added to urine (20 |xg p er L) averages 99 ± 5 percent (mean ± SD). Analytical results agree closely with m easurem ents by the International Union of Pure and Applied Chem istry (IUPAC) reference procedure (correlation coefficient = 0.99). Nickel concentrations in urine specimens from 34 non-exposed, healthy, adult persons living in Connecticut average 2.0 ± 1.5 jxg per L (range = 0.5 to 6.0 (jug per L). Urine nickel concentrations are directly correlated with urine creatinine concentrations and specific gravity m easurem ents. E levated concentrations of nickel are observed in urine specim ens from nickel-exposed w orkers, including nickel electrop lating workers (mean = 27 \xg per L, range = 3.1 to 82 |xg per L, N = 19) and nickel battery workers (mean = 32 |xg p er L, range = 2.8 to 103 |xg per L, N = 7). This m ethod is more rapid and convenient than previous techniques and is suitable for routine use in clinical and industrial laboratories.
* Supported by U.S. Departm ent of Energy Grant EV-03140 and National Institute of Environmental Health Sciences Grant ES-01337.
t To whom reprint requests should be addressed at University of Connecticut Health Center, 263 Farmington Avenue, Farmington, CT 06032.
IntroductionS to e p p le r e t a l24 a n d N o m o to 18
described rapid, sensitive procedures for analysis of trace m etals in se ru m or
2 1 90091-7370/86/0500-0219 $01.80 © Institute for Clinical Science, Inc.
2 2 0 SUNDERMAN, HOPFER, CRISOSTOMO, AND STOEPPLER
whole blood, involving deproteinization with nitric acid, with or w ithout heating, follow ed by d ire c t m easu rem en ts by electrotherm al atomic absorption spectrophotom etry (EAAS). This approach has been applied to analyses of alum inum in se ru m ,5,6 m anganese in plasm a,18,25 cadmium in whole blood,18 lead in whole blood,24 chrom ium in serum ,11 and nickel in serum , whole blood, and tissue hom ogenates.30,31 Extensions of these techn iques to analyses of trace metals in urine have been problematical, o w in g to m a t r ix i n t e r f e r e n c e . 30 Stoeppler23 has recently identified opera tin g p a ra m e te rs th a t o v erco m e th e m atrix in terference, perm itting direct analyses o f n ick e l c o n c e n tra tio n s in acidified u rine by EAAS w ith Zeem an background correction. The validity of this technique for m easurem ent of urine nickel concentra tions has b een e stab lished by the p resent study. Owing to its versatility, sensitivity, precision, accuracy, and rapidity, this technique should satisfy the requirem ents of clinical and industrial laboratories for a routine procedure to m onitor hum an exposures to nickel from occupational, environm ental, or iatrogenic sources. For reviews of the analytical and clinical biochem istry of nickel, readers may consult recen t reviews,20,22,26,27,28 and m onographs.8,29
M ethodP r in c ip l e
Urine is mixed with dilute nitric acid and sedim ent or precipitated protein is rem oved by cen trifu g a tio n ; n ickel is analyzed in the acidified urine by electro th e rm a l a tom ic a b so rp tio n sp e c tro p h o to m e try (EAAS) w ith Z eem an background correction, as described by S underm an e t a l.30,31 A liquots of th e urine specimen are also analyzed for creatinine concentration and specific gravity, so that the urine nickel concentra
tions can be expressed as fxg per L, |xg p e r g c r e a t in in e , a n d /o r (xg p e r L adjusted to 1.024 specific gravity.R e a g e n t s
N itric A cid , C oncentra ted , u ltra- pure (650 g p er kg; 910 g p er L; sp. gr. 1.40).*
Nitric Acid, Dilute, for acidification of urine specim ens and preparation of standard samples. Into a polypropylene volum etric flask (500 m L capacity) are placed 3.2 ml of concentrated nitric acid. The contents are dilu ted to volume with ultra-pure water, and stored in a screw- cap p ed p o ly e th y le n e b o ttle . (N ote: ultra-pure w ater is p repared by successive use of deionization and double distillation from a quartz still. The target nickel concentration in the ultra-pure w ater is < 0 .05 |JLg per L, as determ ined by evaporation of 20 m L samples to dry- n e ss a n d a n a ly s is b y th e p r e s e n t method.)
Nickel Stock Standard Solution (100 mg Ni p er L). Into a tared, borosilicate g lass b e a k e r (25 m L c a p a c ity ) a re weighed 50 mg of nickel pow der (99.99 percent pu re).f U ltra-pure w ater (5 mL) and ultra-pure, concentrated nitric acid (5 mL) are added; the nickel pow der is d issolved by cau tiously w arm ing th e beaker. T he solution is cooled, transferred quantitatively to a polypropylene volumetric flask (500 m L capacity), and diluted to volume w ith ultra-pure water. This solution, stored in a screw-capped polyethylene bottle, is stable for at least one year.
Nickel Interm ediate S tandard Solution (0.4 mg Ni/L). Into a polypropylene volumetric flask (500 m L capacity), are pipetted two m L of nickel stock stan
* “Ultrex” grade, J. T. Baker Chemical Co., Phil- lipsburg, NJ, or “Supra-Pur” grade, E. Merck Co., Darmstadt, FRG.
t Alpha Inorganics Division, Ventrón, Corp., Beverly, MA.
URINE NICKEL ANALYSIS 2 2 1
dard solution and two m L of ultra-pure, concentra ted n itric acid. The contents are d ilu ted to volum e with u ltra-pure water and transferred to a screw-capped polyethylene bottle. This solution is p re pared every th ree months.
N ic k e l W o rk in g S ta n d a r d S o lu tions. Into seven polypropylene volum e tric flask s (100 m L capacity) a re pipetted, respectively, 0 (blank), and 1,2, 5, 10, 15, and 20 mL of nickel in term ediate standard solution, and 20 mL of dilute nitric acid solution. The contents are d ilu ted to volum e w ith u ltra-pure water. T hese solutions contain 0, 4, 8, 20, 40, 60, and 80 (jug Ni per L, respectively ; th e y are p re p a re d every two weeks.
S p e c ia l S u p p l ie s a n d A p pa r a t u s
U rine C o llec tio n B o ttles, w id e- mouth polyethylene bottles with screw- caps (1.5 L capacity for 24-hour specim en s; 250 m L ca p a c ity fo r ra n d o m specimens).
Piston-Displacement Pipettor, to dispense 1 m L, constructed so that only plastic surfaces are exposed and fitted with acid-washed, polyethylene p ipettor tips 4
C en trifu g e T ubes, con ical, c lea r p o ly s ty re n e (4.5 m L capacity) w ith caps.§
Samples C ups, c lea r p o ly sty ren e , (1.5 mL capacity) with caps.If
Washing o f Plasticware. Before each use, polypropylene syringes, polyethylene tubes, bottles, flasks, p ipettor tips, centrifuge tubes, and sam ple cups are sc ru b b ed in h o t d e te rg e n t so lu tio n ,11
£ "F inn-P ipets”, Vangard International Corp., Neptune, N].
§ Catalog no. 477 with caps no. 809, Walter Sarstedt, Inc., Princeton, NJ.
H Catalog no. 641 with caps no. 649, Walter Sarstedt, Inc.
11 “7-X Cleaning Solution,” Limbro Chemical Co., New Haven, CT.
diluted 30-fold with hot tap water. The plasticware are placed in polyethylene canisters (2 L capacity) and rin sed in batch fashion by filling and decanting three times with tap water and six times with deionized water, w ithout contact of the contents w ith the analyst’s hands. After the last rinse with deionized water, concentrated ultra-pure HC1 (50 mL) is poured into the canister. The canister is capped tightly, shaken, and allowed to stand at room tem perature for one hour. The canister is then filled with deionized water, shaken, and allowed to stand for 20 min. T he con ten ts are rin sed five tim es w ith deionized w ater and twice with u ltra-pure water. The canister is placed with lid ajar in an oven at 110°C until the contents are dry.
Vortex-Mixing Apparatus, variable speed ,** en cased in p o ly e th y len e to prevent nickel contamination.
E lectrotherm al A tom ic A bsorp tion Spectrophotom eter, m odel 5000, t t with the following accessories: (a) automatic sampling system, model AS-40; (b) Zeeman background correction system; (c) h e a te d g rap h ite atom izer, m odel H G A -500; (d ) s t r ip -c h a r t r e c o rd e r , m o d el 56; (e) d ig ita l p r in te r , m o d el PRS-10, and (f) py rocoa ted g rap h ite tubes.
Argon, ultra-pure (99.99 percent). $$
P r o c e d u r e
Urine Collection and Storage. Urine is voided directly into an acid-w ashed polyethylene bo ttle w ith care to avoid contamination from feces or dust on the clothing. In factories, collection of urine specim ens should take place in a noncontam inated area, such as a dispensary,
** “Vortex-Genie”, F isher Scientific Co., P ittsburgh, PA.
t t Perkin-Elmer Corp., Norwalk, CT. i t Linde Division, Union Carbide C orp., New
York, NY.
2 2 2 SUNDERMAN, HOPFER, CRISOSTOMO, AND STOEPPLER
u n d e r th e su p e rv is io n o f c lin ica lly - trained personnel. W hen the urine specimen is received in the laboratory, concentrated nitric acid (ultra-pure) is added (one mL of acid p e r 100 m L of urine) to the aliquot for nickel analysis; separate aliquots are taken for m easurem ents of specific gravity and creatin ine concentration. The acidified urine specim en is refrigerated at 4°C for up to one week, or frozen at — 20°C for longer storage prior to analysis.
P r e p a r a t io n o f th e A n a ly t i c a l Run. Into the requisite num ber of centrifuge tubes are pipetted , respectively, one m L of the seven blank and nickel working standard solutions and one mL of each urine specim en. U rine quality c o n tro l a n d r e c o v e r y s a m p le s a re in c lu d e d in each a n a ly tic a l ru n , as described subsequently u n d er “Procedural Notes”. D ilute nitric acid (one mL) is added to each sample; the tubes are capped, and the contents are mixed with a vortex mixer. If an acidified urine sample is tu rb id or contains a p recip itate, the tube is centrifuged at 900 X g for 10 min. The samples are decanted into sample cups and capped until immediately p rio r to asp ira tion in to th e g rap h ite cuvette, in order to avoid contamination and evaporation.
EAAS Analysis. The electrotherm al atomic absorption spectrophotom eter is ad justed to th e following settings: (a) sample volume: 2 0 jjlI; (b) wave length:232.0 nm; (c) spectral band-w idth, 0.2 nm ; (d) N i lam p c u rre n t: 25 mA; (e) time-constant: 0.3 sec; (f) chart speed: 8 cm per min; (g) recorder range: 0 . 2 or 0.5 A (full-scale). The following tem perature program is used: (a) one sec ramp
from 25°C to 100°C; (b) hold tem perature at 100°C for one sec; (c) 60 sec ramp from 100°C to 140°C; (d) hold tem perature at 140°C for 10 sec; (e) 30 sec ramp
from 140°C to 190°C; (f) hold tem perature at 190°C for 5 sec; (g) 80 sec ramp from 190°C to 1200°C; (h) hold tem peratu re at 1200°C for 50 sec; (i) atomize at 2600°C for five sec; (j) one sec ramp from 2600°C to 2700°C, and (k) hold tem perature at 2700°C for th ree sec. The atomization tem p e ra tu re o f 2600°C is calibrated daily by optical pyrometry. The argon flow is se t a t 300 m L p e r min throughout the tem p era tu re program , excepting the last five sec of step h and five sec of step i. D u rin g this 10 sec interval, the argon flow is reduced to 30 mL p e r m in. T he autom atic baseline adjustm ent is program m ed to occur six sec prior to atomization; the spectrophotom eter is program m ed to integrate the Zeem an-corrected atomic absorption signal during th e five sec of atomization. W h en u r in e n ic k e l c o n c e n tra t io n s exceed the highest standard solution (80 (Jig p e r L), th e analyses are rep ea ted after the urine samples have been appropriately diluted.
C o m p u t a t io n s
The calibration ch art o f absorbance peak-areas versus nickel concentrations is linear through the range from 0 to 80 |xg Ni p e r L. N ickel concentrations in urine samples are calculated by proportionality to the standards. For biological m onitoring of nickel exposures, u rine nickel concentrations are reported as (jug per L, w ith optional provision of supplem ental values factored on the basis of urine creatinine and/or specific gravity. Factoring on the basis of specific gravity is perform ed according to the following equation:
Urine Ni (ixg/L)___________ ' x 0 024(Urine sp. gr. — 1.000)P r o c e d u r a l N o t e s
To control nickel contam ination, the analyses should be perform ed in a scru
Urine Ni concentration (factored to 1.024 sp. gr.) =
URINE NICKEL ANALYSIS 2 2 3
pulously clean laboratory room that is solely devoted to determ ination of trace elem ents. C igarette smoking should be p ro h ib ite d . P ip e ttin g shou ld be p e r formed in a laminar-flow hood to m inimize nickel contam ination from dust. To achieve the requisite analytical sensitivity, the atom ic absorption spectrophoto m e te r m u s t b e in p e rfe c t o p tica l, mechanical, and electronic adjustm ent; a tte n tiv e p re v e n tiv e m ain ten an ce is essential. Each pyrocoated graphite tube sh o u ld b e c o n d itio n e d by six cycles through the tem peratu re program before the first assay. Although the digital output of the absorbance integrator is used to com pute nickel concentrations, the strip-chart recorder tracing is required to m onitor the baseline noise level and to en su re th a t th e atom ic ab so rp tion peaks have the expected conformation.
F or quality assurance, an acidified, 24-hour urine specim en (containing 10 to 20 [jug Ni p er L) is d istributed in five mL aliquots in screw-capped polypropylene tubes, which are stored at — 20°C. To m onitor the recovery of nickel, 10 mL of nickel interm ediate standard solution are p laced in a vo lum etric flask (250 m L capacity) and the contents are diluted to volum e w ith th e sam e acidified u rine specimen. The “spiked” urine sample is distributed in five m L aliquots in polyp ropy lene tu b es, w hich are sto red at — 20°C. Tubes that contain the quality control and recovery samples are thawed for inclusion in each analytical run. The nickel concentration obtained by analysis of the “unspiked” urine sample is subtracted from that of the “spiked” sam ple; the difference obtained is divided by the ne t concentration of added nickel (16 |xg Ni per L); the dividend is m ultiplied by 100 to yield the percent recovery of nickel.
Nickel contamination during specimen collection, transport, storage, and p ro cessing is m onitored by obtaining urine from at least one non-exposed, healthy, control person, w henever u rine speci
mens for nickel analysis are collected in a factory or workplace. U rine specim ens are rou tine ly d ilu ted and analyzed in duplicate, to m onitor w ithin-run precision and to detect sporadic nickel contamination in the laboratory.
A n c il l a r y M e t h o d s
In this study, urine creatinine concentrations w ere analyzed by the m ethod of H einegard and T iderstrom 10 and urine specific g rav ity was d e te rm in e d by refractometry, according to Rock e t a l.19 S ta tis tica l te s ts (standard d ev ia tions, paired and non-paired t-tests, Pearson’s product m om ent correlation coefficient, and reg ressio n analysis by th e least- sq u a re s te c h n iq u e ) w ere p e rfo rm e d according to Snedecor and C ochran.21
ResultsS e n s it iv it y a n d R e p e a t a b il it y
T h e d e te c t io n l im it fo r n ic k e l , expressed as th ree tim es th e standard deviation of the blank, is 0.45 pg per L. In 10 consecutive runs, the nickel standard solution containing 20 |JLg Ni p er L yielded a m ean recorder peak of 0.072 ± 0.003 absorbance un its (coefficient of variation, CV = 4.4 percent) and mean peak area of 0.082 ± 0.003 P-E integrator units (CV = 2.8 percent). The slope of the calibration line in 10 consecutive runs averaged 0.507 ± 0.017 (CV = 3.3 percent). Based upon 70 pairs of duplicate analyses of urine specim ens from non-exposed subjects (mean Ni concentration = 2.0 (Jig per L, range = 0.5 to6.0 |JLg per L), the w ithin-run CV was 4.7 percent; based upon 52 pairs of duplicate analyses of urine specimens containing6.1 to 65 (xg Ni per L (mean Ni concentration = 33.2 (Jig per L), the w ithin-run CV was 4.1 percent. The run-to-run CV was 5.8 percent, based upon analyses of a single urine specim en (mean Ni con-
2 2 4 SUNDERMAN, HOPFER, CRISOSTOMO, AND STOEPPLER
centration = 15.9 |xg p e r L) in 10 consecutive analytical runs.
R e c o v e r y St u d i e s
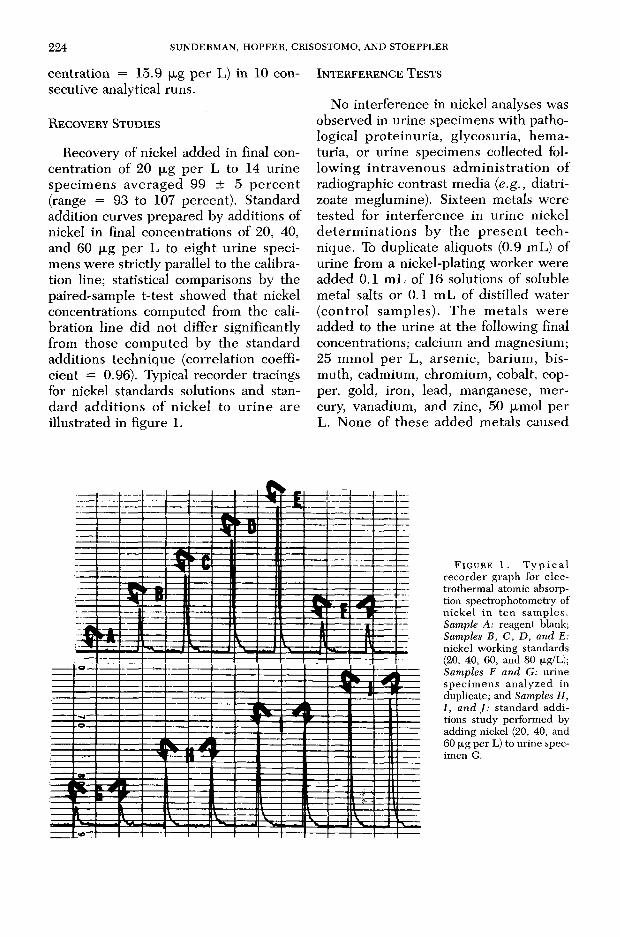
Recovery of nickel added in final concentration of 20 jxg p e r L to 14 urine specim ens averaged 99 ± 5 p e rc e n t (range = 93 to 107 percent). Standard addition curves prepared by additions of nickel in final concentrations of 20, 40, and 60 |xg p e r L to e igh t u rine specimens w ere strictly parallel to the calibration line; statistical comparisons by the paired-sample t-test showed that nickel concentrations com puted from the calibration line did not differ significantly from those com puted by the standard additions technique (correlation coefficient = 0.96). Typical recorder tracings for nickel standards solutions and standard add itions o f n ickel to u rin e are illustrated in figure 1.
I n t e r f e r e n c e T e s t s
No interference in nickel analyses was observed in urine specim ens w ith pathological p ro te in u ria , glycosuria, hem aturia, or urine specim ens collected follow ing in trav en o u s ad m in is tra tio n of radiographic contrast m edia (e.g., diatri- zoate meglumine). Sixteen metals w ere tested for in terference in urine nickel d e te rm in a tio n s by th e p re se n t te c h nique. To duplicate aliquots (0.9 mL) of urine from a nickel-plating worker were added 0.1 m L of 16 solutions of soluble metal salts or 0.1 mL of distilled water (con tro l sam ples). T he m eta ls w ere added to the urine at the following final concentrations; calcium and magnesium;25 m m ol p e r L, arsen ic, barium , b ismuth, cadmium, chrom ium , cobalt, copper, gold, iron, lead, manganese, m ercury, vanadium, and zinc, 50 fxmol per L. None of these added m etals caused
F i g u r e 1 . T y p i c a l r e c o r d e r g r a p h f o r e l e c t r o t h e r m a l a t o m i c a b s o r p t i o n s p e c t r o p h o t o m e t r y o f n i c k e l i n t e n s a m p l e s . Sample A: r e a g e n t b l a n k ; Samples B, C, D, and E: n i c k e l w o r k i n g s t a n d a r d s (2 0 , 4 0 , 6 0 , a n d 8 0 (J-g/L); Samples F and G: u r i n e s p e c i m e n s a n a l y z e d i n d u p l i c a t e ; a n d Samples H,I, and J: s t a n d a r d a d d i t i o n s s t u d y p e r f o r m e d b y a d d i n g n i c k e l (2 0 , 4 0 , a n d 6 0 f i g p e r L ) t o u r i n e s p e c i m e n G .
URINE NICKEL ANALYSIS 2 2 5
significant change in the area or conformation of the nickel peak.
C o m p a r is o n s w it h R e f e r e n c e M e t h o d
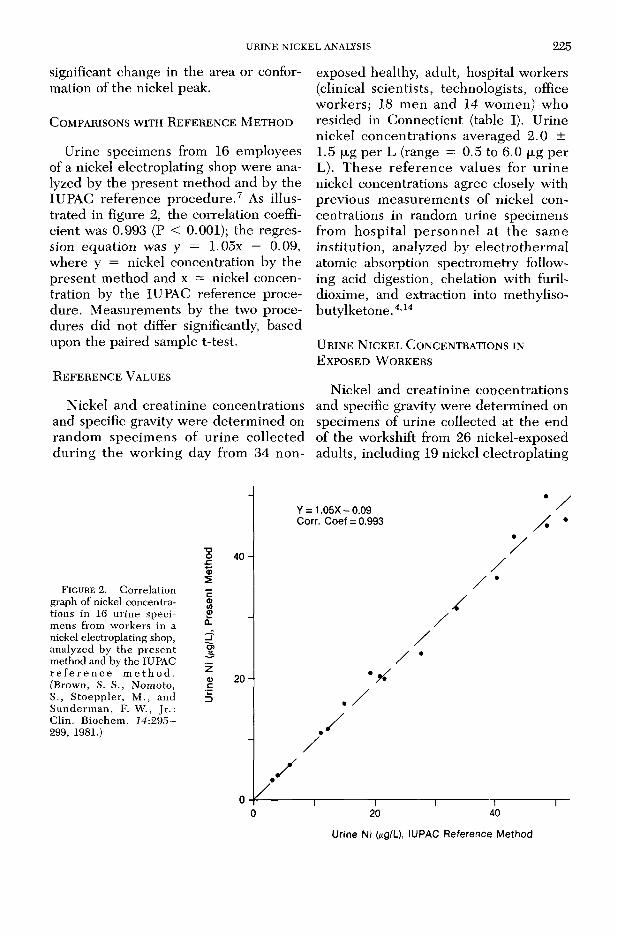
U rine specimens from 16 employees of a nickel electroplating shop w ere analyzed by the p resen t m ethod and by the IUPAC reference p ro ced u re .7 As illustrated in figure 2, the correlation coefficient was 0.993 (P < 0.001); the regression equation was y = 1.05x — 0.09, w here y = nickel concentration by the present m ethod and x = nickel concentration by the IUPAC reference procedure. M easurem ents by the two procedures did not differ significantly, based upon the paired sample t-test.
R e f e r e n c e V a l u e s
Nickel and creatin ine concentrations and specific gravity w ere determ ined on random specim ens of u rin e collected d u ring th e w orking day from 34 n on
exposed healthy, adult, hospital workers (clinical scientists, technologists, office w orkers; 18 m en and 14 wom en) who resided in Connecticut (table I). U rine nickel concen tra tions averaged 2 .0 ± 1.5 |JLg per L (range = 0.5 to 6.0 | J i g per L). T h ese re fe ren c e values for u rin e nickel concentrations agree closely with previous m easurem ents of nickel concentrations in random urine specimens from hosp ita l p e rso n n e l a t th e sam e institu tion, analyzed by electro therm al atomic absorption spectrom etry following acid digestion, chelation with furil- dioxime, and extraction into methyliso- buty Ike tone.4,14
U r in e N ic k e l C o n c e n t r a t io n s in E x p o s e d W o r k e r s
Nickel and creatin ine concentrations and specific gravity w ere determ ined on specimens of urine collected at the end of the workshift from 26 nickel-exposed adults, including 19 nickel electroplating
F i g u r e 2. Correlation graph of nickel concentrations in 16 urine specimens from workers in a nickel electroplating shop, analyzed by the p resen t method and by the IUPAC r e f e r e n c e m e t h o d . (Brown, S. S., Nomoto,S., S toeppler, M ., and S underm an , F. W ., Jr.: Clin. Biochem . 14:295- 299, 1981.)
■ooc.a>540-
20-
Y = 1.05X - 0.09 Corr. Coef = 0.993
/
—r~ 20I40
Urine Ni (¿ig/L), IUPAC Reference Method

2 2 6 SUNDERMAN, HOPFER, CRISOSTOMO, AND STOEPPLERTABLE I
Nickel Concentrations in Urine Specimens from Non-exposed, Healthy, Adult Residents of Connecticut*
Men Women A l l S u b j e c t sP a r a m e t e r s a n d U n i t s (N - 18 ) (N - 16 ) (N - 34 )
Age (years) 40 + 10 40 + 10 40 + 11(24 - 59 (22 - 57) (22 - 59)
Urine creatinineconcentrations (g/L) 1.27 + 0.56 0.87 + 0.33f 1.08 + 0.50
(0.45 - 2.10) (0.39 - 1.53) (0.39 - 2.10)
Urine specific gravity 1.019 + 0.006 1.018 + 0.006 1.019 + 0.006(1.008 - 1.028) (1.008 - 1.025) (1.008 - 1.028)
Urine nickel concentrations, uncorrected (yg/L) 1.63 + 1.48 2.30 + 1.43 2.00 + 1.47$
(0.5 - 6.0) (0.5 - 5.5) (0.5 - 6.0)Urine nickel concentrations,
(Ug/g creatinine) 1.49 + 1.34 2.60 + 1.38t 2.01 + 1.45$(0.4 - 5.8) (0.5 - 6.0) (0.4 - 6.0)
Urine nickel concentrations, (Mg/L, sp. gr. 1.024) 2.31 + 2.06 3.29 + 1.63 2.77 + 1.91
(0.5 - 8.8) (0.5 - 5.5) (0.5 - 8.8)
*Mean ± SD/ with range in parantheses.fp < 0.05 versus corresponding values in men.$For comparison, previous measurements of nickel concentrations in urine specimens from a comparable
group of non-exposed, healthy, adult residents of Connecticut (15 men, 4 women) averaged 2.7 ±1.6 pg per L (range = 0.4 to 5.1) and 2.5 ± 1.3 yg per g creatinine (range 0.7 to 5.7).4'^
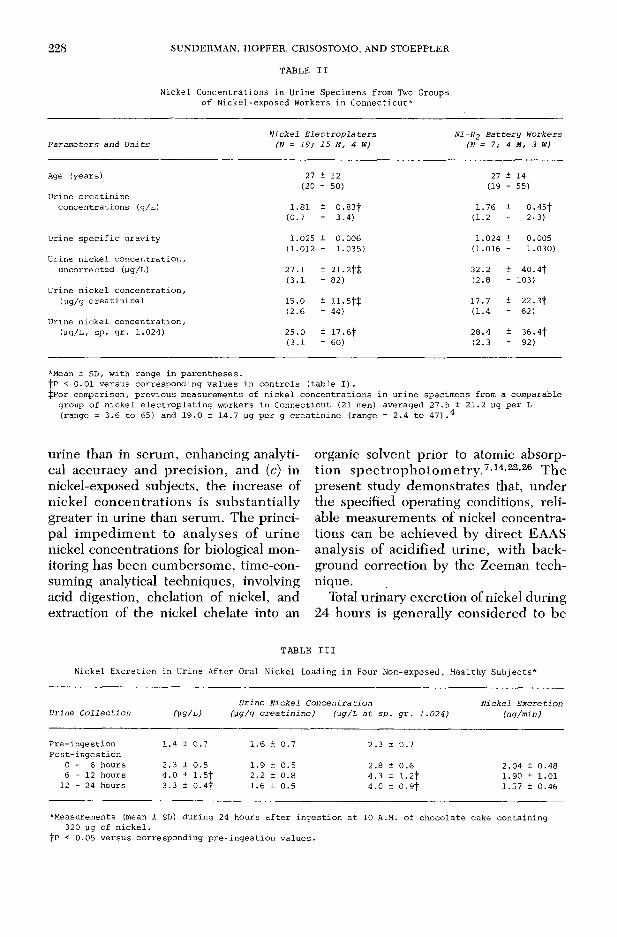
workers and seven em ployees at a Ni-H2 battery factory in C onnecticut (table II). U rin e n ick e l c o n c e n tra tio n s in b o th groups of nickel-exposed workers were significantly higher than in non-exposed controls (P < 0.01), even after factoring on the basis of urine creatinine or specific gravity. As indicated in a footnote to table II, nickel concen tra tions in the urine specimens from the nickel electroplating workers agree closely with p re vious m easurem ents of nickel concentrat io n s in u r in e s p e c im e n s fro m a co m p arab le g ro u p of n ick e l e le c tro p la te rs , an a ly zed by e le c tro th e rm a l atomic absorption spectrom etry following acid digestion, chelation with furil- dioxime, and extraction into methyliso- butylketone.4
U r in e N i c k e l , C r e a t in in e , a n d S p e c i f ic G rav ity C o r r e l a t io n s
Five non-exposed, healthy, male volunteers collected each voiding of urine
during 24 hours (five to seven specimens per subject) for m easurem ents of nickel, creatinine, specific gravity, and volume. In each of the subjects, urine nickel concen tra tions was co rre la ted w ith u rine c rea tin in e c o n cen tra tio n and specific gravity, with correlation coefficients from 0.75 to 0.96 (P < 0.01; figure 3). Nickel concentrations in the 31 specimens from the five subjects averaged 2.55 ± 1.16 (xg p e r L, c re a tin in e co n cen tra tio n s averaged 1.48 ± 70 g p er L, and specific gravity m easurem ents averaged 1.021 ± 0.007. The overall correlation coefficient for urine nickel versus creatin ine concen tra tio n s was 0 .742 (N = 31; P < 0.001); th e corre la tion coefficient for urine nickel concentration versus specific gravity was 0.595 (N = 31; P < 0.001). Expressed on a p e r diem basis, urinary excretions of nickel in the five subjects averaged 2.5 ± 0.6 (jLg per day (range = 2.0 to 3.3); creatin ine excretions averaged 1.45 ± 0.50 g p er day (range = 0.89 to 2.07), and urine vol

URINE NICKEL ANALYSIS 2 2 7
Urine Specific GravityF ig u r e 3. Correlation graphs of nickel concentrations in urine specimens from five non-exposed, healthy,
adult men, (A to E, respectively), versus urine creatinine concentrations and urine specific gravity m easurements.
umes averaged 0.965 L per day (range = 0.734 to 1.279).
U r in e N ic k e l C o n c e n t r a t io n s a f t e r O r a l N ic k e l L o a d in g
To test w hether or not consumption of food rich in nickel (e.g., cocoa, dark chocolate9,17) increases urinary excretion of nickel, urine specim ens w ere obtained from four male volunteers immediately before and during 24 hours after they ate a large portion of chocolate cake. The cake was p repared with cocoa powder* that contained 10.1 ± 0.2 (jug Ni per g, as determ ined by EAAS analysis. Each volunteer consum ed 180 g of cake, containing 320 |xg of nickel, which is twice the average daily intake of nickel (150 to 165 |JL g p e r day15,17). Ingestion of the cake slightly increased the mean nickel
* Hershey Foods Corp., Hershey, PA.
concentrations in u rine specim ens collected during the subsequent 24 hours, bu t none of the urine nickel concentrations ex ceed ed th e re fe ren ce ranges (table III).
DiscussionU rine and serum are the specim ens
w ith w idest applicability and g rea test practicality for monitoring occupational, environm ental, or iatrogenic exposures to n ickel and its co m p o u n d s.22,23,27,28 A lthough u r in e sp ec im en s have th e drawback of fluctuating specific gravity and matrix variability, urine is generally preferable to serum , since (a) collection of urine is non-invasive, while collection of blood for nickel analysis requires venep u n c tu re w ith a p las tic in tra v e n o u s cannula to avoid nickel contam ination from needles, (b) in non-exposed controls, nickel concentrations are h igher in
2 2 8 S U N D E R M A N , H O P F E R , C R IS O S T O M O , A N D S T O E P P L E R
TABLE II
Nickel Concentrations in Urine Specimens from Two Groups of Nickel-exposed Workers in Connecticut*
N i c k e l E l e c t r o p l a t e r s N Ì-H 2 B a t t e r y W o r k e rsP a r a m e te r s a n d U n i t s (N = 1 9 ; 15 M, 4 W) (N = 7/ 4 M, 3 W)
Age (years) 27 ± 12 27 ± 14(20 - 50) (19 - 55)
Urine creatinineconcentrations (g/L) 1.81 ± 0.83t 1.76 ± 0.45f
(0.7 - 3.4) (1.2 - 2-3)
Urine specific gravity 1.025 ± 0.006 1.024 + 0.005(1.012 - 1.035) (1.016 - 1.030)
Urine nickel concentration, uncorrected (yg/L) 27.1 ± 21.2f$ 32.2 + 40.4f
(3.1 - 82) (2.8 - 103)Urine nickel concentration,
(yg/g creatinine) 15.0 ± 11.5f$ 17.7 + 22. 3f(2.6 - 44) (1-4 - 62)
Urine nickel concentration,(yg/L, sp. gr. 1.024) 25.0 ± 17.6f 28.4 + 36.4f
(3.1 - 60) (2.3 - 92)
*Mean ± SD, with range in parentheses.fp < 0.01 versus corresponding values in controls (table I).$For comparison, previous measurements of nickel concentrations in urine specimens from a comparable group of nickel electroplating workers in Connecticut (21 men) averaged 27.5 ± 21.2 yg per L (range = 3.6 to 65) and 19.0 ± 14.7 yg per g creatinine (range = 2.4 to 47).^
urine than in serum , enhancing analytical accuracy and precision , and (c) in nickel-exposed subjects, the increase of n ickel co n cen tra tio n s is su b stan tia lly greater in urine than serum . The principal im p ed im en t to analyses of u rin e nickel concentrations for biological monitoring has been cum bersom e, tim e-consuming analytical techniques, involving acid digestion, chelation of nickel, and extraction of the nickel chelate into an
organic solvent prior to atomic absorption sp e c tro p h o to m e try .7,14,22,26 T he present study dem onstrates that, under the specified operating conditions, reliable m easurem ents of nickel concentrations can be achieved by d irec t EAAS analysis of acidified u rine , w ith background correction by the Zeeman technique.
Total urinary excretion of nickel during 24 hours is generally considered to be
TABLE III
Nickel Excretion in Urine After Oral Nickel Loading in Four Non-exposed> Healthy Subjects*
U r in e C o l l e c t i o n ( v g /L )U r in e N i c k e l C o n c e n t r a t i o n
(\xg /g c r e a t i n i n e ) (] ig /L a t s p . g r . 1 .0 2 4 )N i c k e l E x c r e t i o n
( n g /m in )
Pre-ingestion 1 . 4 + 0 . 7 1.6 ± 0.7 2.3 ± 0.7Post-ingestion
0 - 6 hours 2 . 3 + 0 . 5 1.9 + 0.5 2.8 ± 0.6 2.04 ± 0.486 - 1 2 hours 4.0 ± 1.5f 2.2 + 0.8 4.3 ± 1 . 2 f 1.90 ± 1.0112 - 24 hours 3.3 ± 0.4f 1.6 ± 0.5 4.0 + 0.9f 1.57 ± 0.46
*Measurements (mean ± SD) during 24 hours after ingestion at 10 A.M. of chocolate cake containing 320 yg of nickel,
fp < 0.05 versus corresponding pre-ingestion values.
U R IN E N IC K E L A N ALY SIS 2 2 9
the best indicator of nickel exposure.2 27 W henever tim ed urine collections are practical (e.g., in hospital patien ts and for research purposes), nickel excretion in u rin e should be rep o rte d on a per diem basis. Accurate 24-hour collections of urine are seldom feasible for routine biological m onitoring of occupational or environm ental exposures.2,3,12 To correct for variable u rine dilution, nickel concentrations in random urine specimens are often norm alized by factoring the re su lts p e r gram of c re a tin in e or by adjustm ent to a nominal specific gravity of 1.024.1,3,16,32 W hile the renal excretion of creatinine is relatively unaffected by changes in urine volume, renal excretion of nickel resem bles th a t of urea, tending to increase with increasing urine flow rates.13
Therefore, factoring based on urine creatinine concentrations may overestim ate n ickel co n cen tra tio n s in d ilu te urine specim ens. A djustm ent of urine nickel concentrations based on urea concentrations would be preferable to creatinine adjustm ent on theoretical grounds, bu t has not been evaluated in practice. T h e sp e c if ic g ra v ity a d ju s tm e n t is influenced by fluctuations of salt intake and yields erroneous results in the presence of glucosuria or proteinuria. The p resen t study indicates that these two normalization techniques have approximately equal validity for nickel elim ination in urine, based upon the observed correlations betw een nickel concentrations and c rea tin ine concen tra tion or specific gravity of urine specim ens from healthy individuals. Analyses perform ed on d ilu te u rine specim ens (creatin ine concentration < 0 .3 g p er L or specific gravity <1.010) should, w henever possible, be repeated on a d ifferent specim en .12 The present authors recom m end that results of nickel analyses of random urine specimens should be reported as unadjusted nickel concentrations, w ith o p tio n a l p ro v is io n o f s u p p le m e n ta l
values factored on the basis of creatinine and/or specific gravity, according to the preference of the responsible physician. A ugum ented d ie tary intake of nickel- rich foods, such as chocolate, evidently does not increase urine nickel concentratio n s a b o v e th e r e f e r e n c e v a lu e s observed in non-exposed, healthy subjects.
AcknowledgmentsThe authors are grateful to Tor Norseth, M .D. and
Joseph Knight, M.D. for helpful advice and to Marilyn C. Plowman, D eloritiae R. W eatherby, and Linda Abrahamson for technical assistance.
References1. Adams, D. B.: The routine determ ination of
nickel and creatinine in urine. Nickel Toxicology, Brown, S. S. and Sunderm an, F. W. Jr., eds. London, Academic Press, 1980, pp. 99-102.
2. A i t io , A. and J a r v is a l o , J . : Biological monitoring of occupational exposure to toxic chemicals: Collection, processing and storage of specim ens. Ann. Clin. Lab. Sci. J5:121-139, 1985.
3. A l e s s io , L., B e r l i n , A., D e l l ’O r t o , A., T o f f o - LETTO, F., and G h e z z i , I.: Reliability of urine creatinine as a param eter used to adjust values of urinary biological indicators. In te rn . Arch. Occup. Environ. Health 55:99-106, 1985.
4. B e r n a c k i , E. J . , P a r s o n s , G. E ., R o y , B . R . , M ik a c - D e v ic , M . , K e n n e d y , C. D . , and S u n d e r m a n , F. W., J r .: Urine nickel concentrations in nickel-exposed workers. Ann. Clin. Lab. Sci. 8:184-189, 1978.
5. B r a d l e y , C., L e u n g , F. Y., S l a v i n , W., and H e n d e r s o n , A. R.: D irect-calibration m ethod for determination of aluminum in serum is comparable w ith th e pro te in -p recip ita tion tech nique. Clin. Chem. 3i:1882-1884, 1985.
6. B r o w n , S . , B e r t h o l f , R . L., W il l s , M . R . , and S a v o ry , J. : E lectrotherm al atomic absorption spectrom etric determ ination of alum inum in serum with a new technique for protein precipitation. Clin. Chem. 30:1216-1218, 1984.
7 . B r o w n , S . S . , N o m o t o , S . , S t o e p p l e r , M . , and S u n d e r m a n , F. W. J r . : IUPAC reference method for analysis of nickel in serum and urine by electrothermal atomic absorption spectrophotometry. Clin. Biochem. 14:295-299, 1981.
8. B r o w n , S . S . and S u n d e r m a n , F. W., J r . , e d s .; Progress in Nickel Toxicology. Oxford, Black- well, Ltd., 1985, pp. 1-250.
9. E l l e n , G., v a n d e n B o s c h -T i b r e s m a , G., a n d D o u m a , F. F. : N ic k e l c o n t e n t s o f v a r i o u s D u t c h f o o d s t u f f s . Z . L e b e n m . U n t e r s . F o r s c h . 766:145-147, 1978.
230 S U N D E R M A N , H O P F E R , C R IS O S T O M O , A N D S T O E P P L E R
10. H e i n e g a r d , D. and T i d e r s t r o m , G.: Determ ination of serum creatinine by a direct colorimetric method. Clin. Chim. Acta 43:305—310, 1973.
11. HO PFER, S . M. and S u n d e r m a n , F. W., J r . : Measurements of trace metals in serum by electrothermal atomic absorption spectrophotometry. Laboratory Diagnosis of Cardiovascular D isorders. Sunderm an, F. W ., ed. Philadelphia I n s t i tu te for C lin ica l S cience , 1985, pp . 169-181.
12. L a u w e r y s , R. L . : Industrial Chemical Exposure: Guidelines for Biological Monitoring. Davis,C. A., B iom edical Pub lications, 1985, pp. 1-150.
1 3 . M e r t z , D . P ., K o s c h n i c k , R., and W i l k , G .: Renal excretion of nickel by humans. Z. Klin. Chem. Klin. Biochem. 8 : 3 8 7 —3 9 0 , 1 9 7 0 .
14. M ik a c - D e v ic , D . , S u n d e r m a n , F. W., J r ., and NOMOTO, S . : Furildioxime m ethod for nickel analysis in serum and urine by electrothermal atomic absorption spectrom etry. Clin. Chem. 23:948-956, 1977.
15. M y r o n , D. R., Z im m e r m a n , T. J., S h u l e r , T. R., K l e v a y , L . M . , L e e , D. E., and N i e l s e n , F. H.: Intake of nickel and vanadium of humans. A survey of selec ted diets. Amer. J. Clin. Nutr. 37:527- 531, 1978.
16. N i e b o e r , E., Ya s s i, A., J u s y s , A. A., and M u ir ,D. C. F.: Technical Feasibility and Usefulness of Biological Monitoring in the Nickel Producing Industry. Toronto, Nickel Producers’ Environmental Research Association (NiPERA), 1984, pp. 1-285.
17. N i e l s e n , G. D. and F l y v h o l m , M.: Risks of high nickel intake with diet. Nickel in the Human Diet. Sunderman, F. W ., Jr., ed.-in-chief, Lyon, Intern. Agency Res. Cancer, 1984, pp. 333-338.
18. N o m o t o , S.: Sample preparation for analysis of trace metals in biological materials with electrothermal atomic absorption spectrophotometry and its detection limits. Proceedings of the XI International Congress of Clinical Chemistry. Kaiser, E., Gabl, G., Muller, M. M., and Bayer, M., eds., Berlin, Walter de Gruyter and Co.,1982, pp. 1097-1105.
19. R o c k , R . C ., W a l k e r , W . G., and J e n n i n g s ,C. D.: Nitrogen metabolites and renal function. Textbook of Clinical Chemistry. Tietz, N. W . , ed ., Philadelphia, Saunders C o., 1986, pp. 1254-1316.
20. S c h a l l e r , K. H., S t o e p p l e r , M., and R a it h e l ,H. J .: The analytical determination of nickel in biological m atrices. A sum m ary of p re sen t
knowledge and experience. Staub. Reinhalt, Luft. 42:137-180, 1982.
21. S n e d e c o r , G. W. and C o c h r a n , W. G.: Statistical Methods, 6th ed. Ames, Iowa State University Press, 1968, pp. 1-592.
22. S t o e p p l e r , M .: Analysis of nickel in biological m aterials and natural w aters. Nickel in the Human Environment. Nriagu, J. O., ed. New York, John Wiley and Sons, 1980, pp. 661—822.
23. S t o e p p l e r , M.: Recent improvements for nickle analysis in biological materials. Trace Element Analytical Chemistry in Medicine and Biology, vol. 3. Brattner, P., and Schramel, P., eds. Berlin, W alter de G ruv ter and C o., 1984, pp. 539-557.
24. St o e p p l e r , M., B r a n d t , K., and R a in s , T. C.: Contributions to automated trace analysis. Part II. Rapid method for the automated determ ination of lead in whole blood by electrothermal atomic absorption spectrophotometry. Analyst 703:714-722, 1978.
25. S u b r a m a n ia n , K. S . and M e r a n g e r , J. C .: Graphite furnace atomic absorption spectrom etry with nitric acid deproteinization for determ ination of manganese in hum an plasma. Anal. Chem. 57:2478 - 2481, 1985.
26. S u n d e r m a n , F. W., J r .: Analytical biochemistry of nickel. Pure Appl. Chem. 52:529-544, 1980.
27. S u n d e r m a n , F. W ., J r . : Nickel. D isorders of M ineral Metabolism, vol. 1. Bronner, F. and Coburn, J. W., eds. New York, Academic Press,1981, p p . 201-230.
28. S u n d e r m a n , F. W ., J r . : N ickel. H azardous Metals in Human Toxicology. Vercruysse, A., ed. Amsterdam, Elsevier Press, 1984, pp. 279-306.
29. S u n d e r m a n , F. W., J r . , ed.-in-chief: Nickel in the Human Environment, Lyon, Intern. Agency Res. Cancer, 1984, pp. 1—530.
30. S u n d e r m a n , F. W., J r . , C r i s o s t o m o , M. C . , R e i d , M. C . , H o p f e r , S. M., and N o m o t o , S .: Rapid analysis of nickel in serum and whole blood by electrothermal atomic absorption spectrophotom etry. Ann. Clin. Lab. Sci. 14:232- 241, 1984.
31. S u n d e r m a n , F. W ., J r . , M a r z o u k , A., C r is o s t o m o , C . , and WEATHERBY, D. R.: Electrothermal atomic absorption spectrophotom etry of nickel in tissue homogenates. Ann. Clin. Lab. Sci. 75:299-307, 1985.
32. T o l a , S., KlLPIO , J., and VlRTAMO, M.: Urinary and plasma concentrations of nickel as indicators of exposure to nickel in an electroplating shop. J. Occup. Med. 27:184-188, 1979.