Embed Size (px)
Citation preview
1
RAPID: Documentation of Tornado Track of Mayflower
Tornado in Hilly Terrain
By
R. Panneer Selvam
Nawfal Ahmed
Matthew N. Strasser
Majdi Yousef
Scott Ragan
Alvaro Costa
Department of Civil Engineering
University of Arkansas
Fayetteville, AR 72701
Email: [email protected]
Ph: 479-575-5356
May 2015
2
Table of Contents
Table of Contents ............................................................................................................................ 2
Disclaimer ....................................................................................................................................... 3
Summary ......................................................................................................................................... 4
Chapter 1: Introduction ................................................................................................................... 5
Chapter 2: Site 1 – South-West of Arkansas River & Lake Maumelle Area ............................... 10
2.1 House on the northeast of Brush Mountain ........................................................................ 12
2.2 House Close to Kanis Road ................................................................................................ 13
Chapter 3: Site 2 – Plantation Drive Area .................................................................................... 15
Chapter 4: Site 3 – HWY I-40 Crossing (Mayflower Area) ......................................................... 18
4.1 Damage to POI .................................................................................................................... 19
4.2 Evaluation of Terrain Influence on Damage ....................................................................... 26
Chapter 5: Site 4 – Lake Conway Area ........................................................................................ 30
Chapter 6: Site 5 – Tower Road Area ........................................................................................... 34
Chapter 7: Site 6 – Williams Lake & Vilonia Area ...................................................................... 38
Chapter 8: Analysis of Hilly Terrain Influence on Tornado Path & Damage .............................. 40
8.1 Introduction ......................................................................................................................... 40
8.2 Influence of Hilly Terrain on Tornado Damage ................................................................. 40
8.3 Influence of Hilly Terrain on Tornado Ground-Level Path ................................................ 41
8.4 Damage Sheltering from Tornados by Hills ....................................................................... 45
Chapter 9: Conclusions ................................................................................................................. 53
Acknowledgments......................................................................................................................... 54
References ..................................................................................................................................... 55
3
Disclaimer
The opinions and views expressed by the authors in this report are theirs alone and do not
represent the view of any funding agencies. All information in this report is believed by the authors
to be factually correct, but readers should use any information contained herein at their own risk.
4
Summary
A deadly tornado occurred in Central Arkansas on April 27, 2014 (Subsequently referenced
as “Mayflower” tornado) claiming the lives of 15 people. Design of structures to better-sustain
tornado wind loadings as well as better forecasting of tornado paths for issuing timely warnings
necessitates better understating of near-ground tornado behavior. Interaction with complex, hilly
terrain influences both the path and ground-level intensity of tornados. However, tornado damage
in hilly terrain is not well documented because hilly terrain is typically less populated and less
accessible. The topography along the damage track of the Mayflower tornado varies substantially,
providing a unique opportunity to study how interaction with hilly terrain influences the ground-
level strength and path of tornados.
The present study utilizes in-field investigation from the University of Arkansas (UA) and
National Weather Service (NWS) teams to document the ground-level path of the Mayflower
tornado through hilly terrain. Aerial photography from the Civil Air Patrol (CAP) and satellite
images from NASA and Google Earth are also used to document the tornado path through less
accessible terrain. This study focusses on identifying how interaction with hilly terrain influences
the damage produced by the tornado as well as the ground level tornado path. Specific case studies
are used to illustrate how hills and other elevated topography are able to shelter surrounding
regions from high-velocity tornado winds.
Generally speaking, hilly terrain disrupts the near-ground tornado vortex, hence it causes
less damage in hilly terrain than in flat terrain. Furthermore, the tornadic flow follows the path of
least resistance, hence it seeks to travel from high to low elevations. Findings supporting these
general statements are summarized within the body of this report.
5
Chapter 1: Introduction
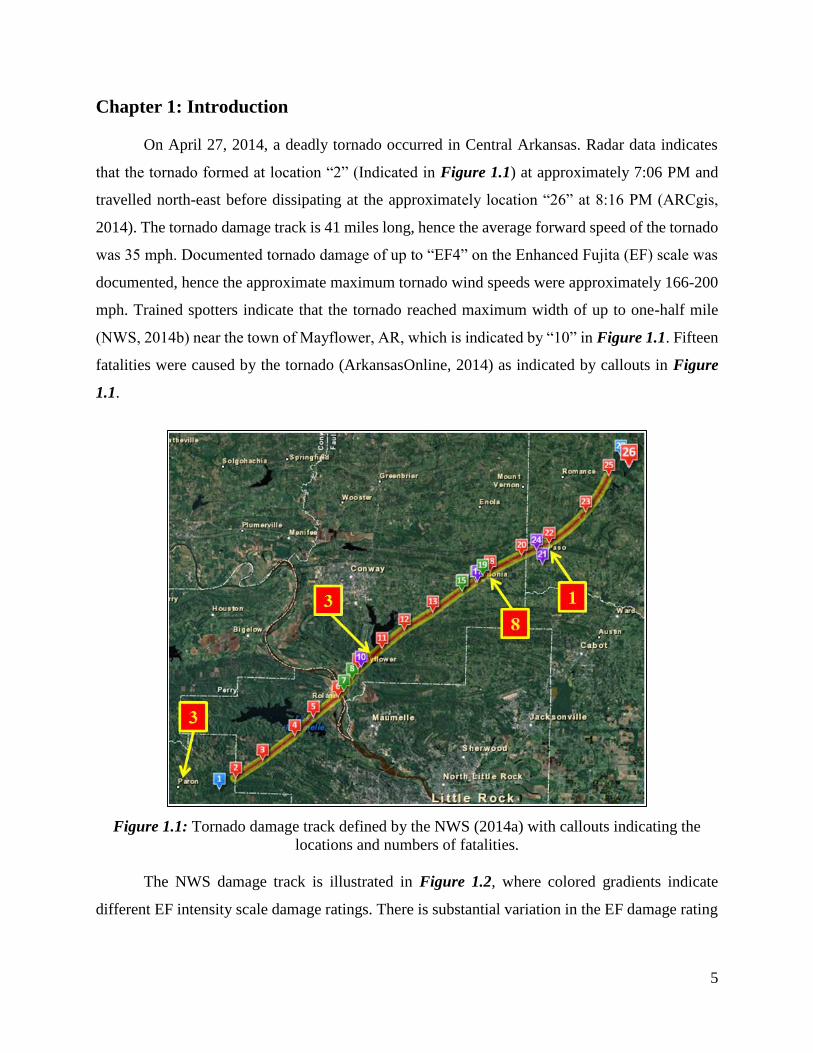
On April 27, 2014, a deadly tornado occurred in Central Arkansas. Radar data indicates
that the tornado formed at location “2” (Indicated in Figure 1.1) at approximately 7:06 PM and
travelled north-east before dissipating at the approximately location “26” at 8:16 PM (ARCgis,
2014). The tornado damage track is 41 miles long, hence the average forward speed of the tornado
was 35 mph. Documented tornado damage of up to “EF4” on the Enhanced Fujita (EF) scale was
documented, hence the approximate maximum tornado wind speeds were approximately 166-200
mph. Trained spotters indicate that the tornado reached maximum width of up to one-half mile
(NWS, 2014b) near the town of Mayflower, AR, which is indicated by “10” in Figure 1.1. Fifteen
fatalities were caused by the tornado (ArkansasOnline, 2014) as indicated by callouts in Figure
1.1.
Figure 1.1: Tornado damage track defined by the NWS (2014a) with callouts indicating the
locations and numbers of fatalities.
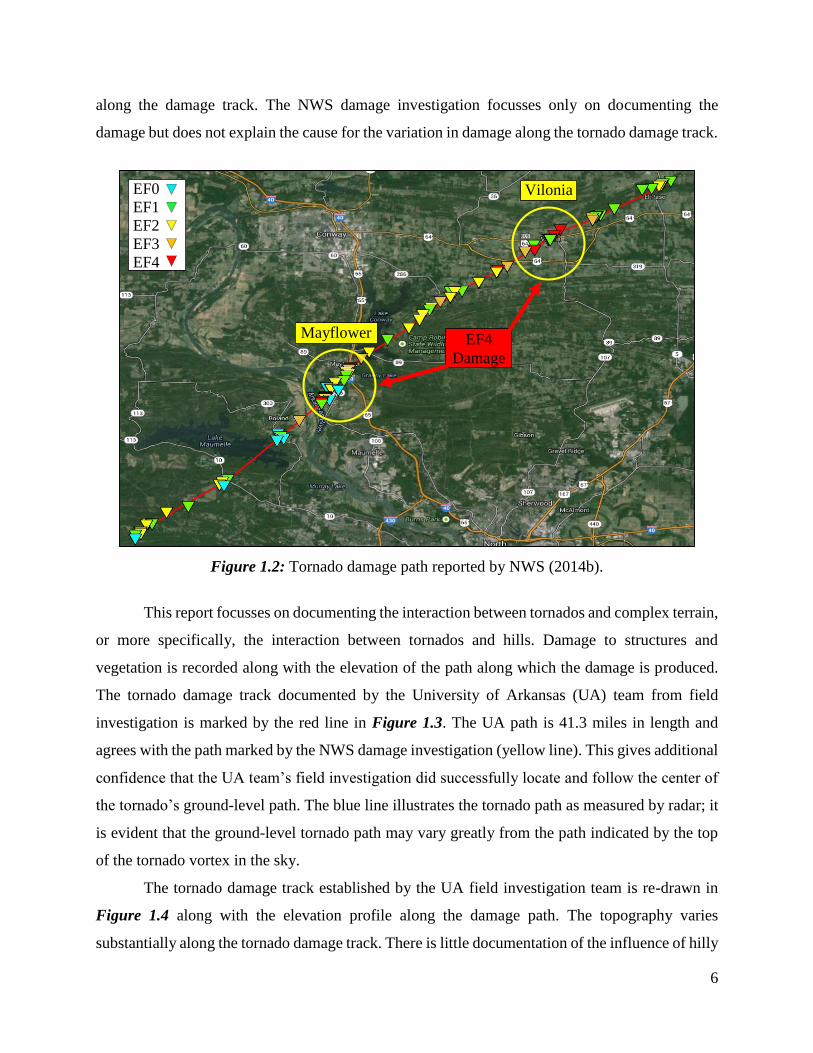
The NWS damage track is illustrated in Figure 1.2, where colored gradients indicate
different EF intensity scale damage ratings. There is substantial variation in the EF damage rating
6
along the damage track. The NWS damage investigation focusses only on documenting the
damage but does not explain the cause for the variation in damage along the tornado damage track.
Figure 1.2: Tornado damage path reported by NWS (2014b).
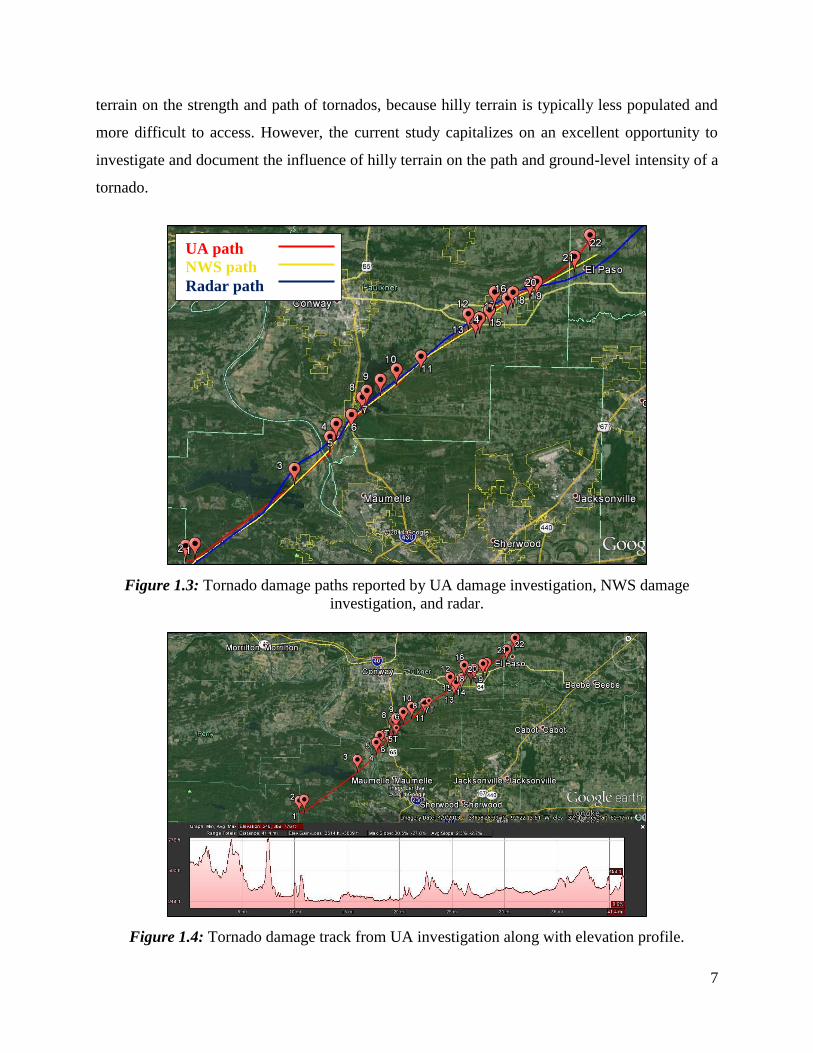
This report focusses on documenting the interaction between tornados and complex terrain,
or more specifically, the interaction between tornados and hills. Damage to structures and
vegetation is recorded along with the elevation of the path along which the damage is produced.
The tornado damage track documented by the University of Arkansas (UA) team from field
investigation is marked by the red line in Figure 1.3. The UA path is 41.3 miles in length and
agrees with the path marked by the NWS damage investigation (yellow line). This gives additional
confidence that the UA team’s field investigation did successfully locate and follow the center of
the tornado’s ground-level path. The blue line illustrates the tornado path as measured by radar; it
is evident that the ground-level tornado path may vary greatly from the path indicated by the top
of the tornado vortex in the sky.
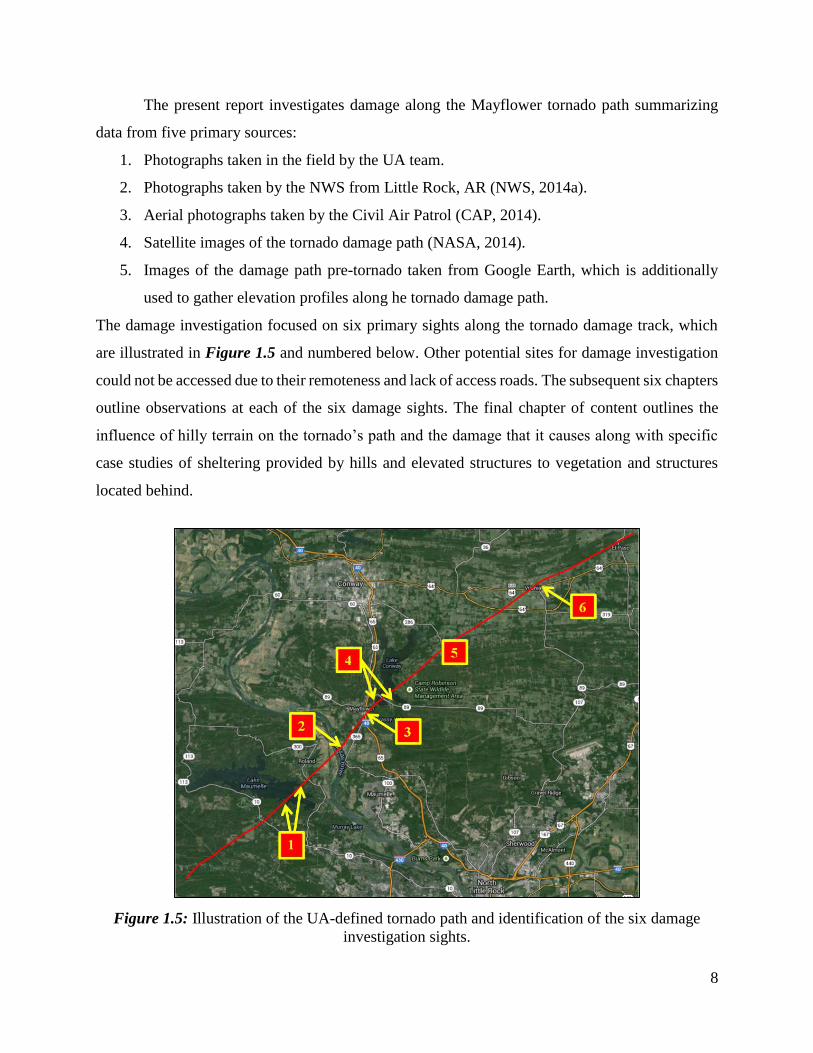
The tornado damage track established by the UA field investigation team is re-drawn in
Figure 1.4 along with the elevation profile along the damage path. The topography varies
substantially along the tornado damage track. There is little documentation of the influence of hilly
EF0
EF1
EF2
EF3
EF4
Mayflower
Vilonia
EF4
Damage
7
terrain on the strength and path of tornados, because hilly terrain is typically less populated and
more difficult to access. However, the current study capitalizes on an excellent opportunity to
investigate and document the influence of hilly terrain on the path and ground-level intensity of a
tornado.
Figure 1.3: Tornado damage paths reported by UA damage investigation, NWS damage
investigation, and radar.
Figure 1.4: Tornado damage track from UA investigation along with elevation profile.
UA path
NWS path
Radar path
8
The present report investigates damage along the Mayflower tornado path summarizing
data from five primary sources:
1. Photographs taken in the field by the UA team.
2. Photographs taken by the NWS from Little Rock, AR (NWS, 2014a).
3. Aerial photographs taken by the Civil Air Patrol (CAP, 2014).
4. Satellite images of the tornado damage path (NASA, 2014).
5. Images of the damage path pre-tornado taken from Google Earth, which is additionally
used to gather elevation profiles along he tornado damage path.
The damage investigation focused on six primary sights along the tornado damage track, which
are illustrated in Figure 1.5 and numbered below. Other potential sites for damage investigation
could not be accessed due to their remoteness and lack of access roads. The subsequent six chapters
outline observations at each of the six damage sights. The final chapter of content outlines the
influence of hilly terrain on the tornado’s path and the damage that it causes along with specific
case studies of sheltering provided by hills and elevated structures to vegetation and structures
located behind.
Figure 1.5: Illustration of the UA-defined tornado path and identification of the six damage
investigation sights.
9
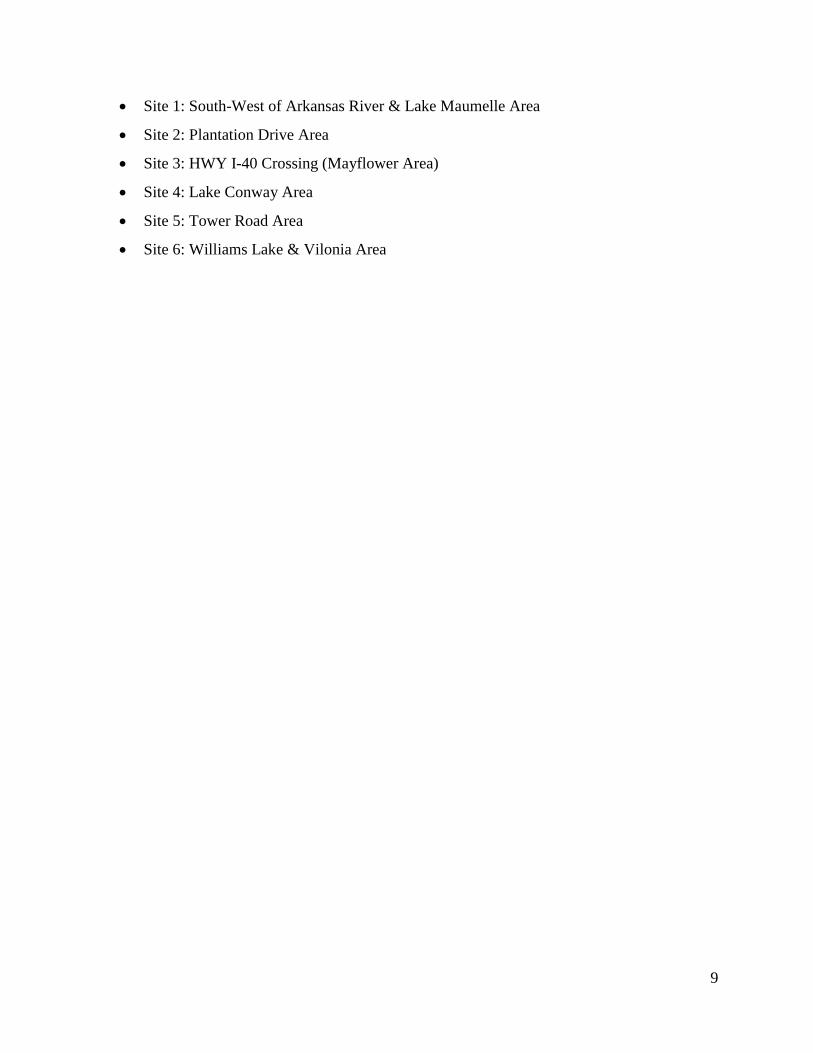
Site 1: South-West of Arkansas River & Lake Maumelle Area
Site 2: Plantation Drive Area
Site 3: HWY I-40 Crossing (Mayflower Area)
Site 4: Lake Conway Area
Site 5: Tower Road Area
Site 6: Williams Lake & Vilonia Area
10
Chapter 2: Site 1 – South-West of Arkansas River & Lake Maumelle Area
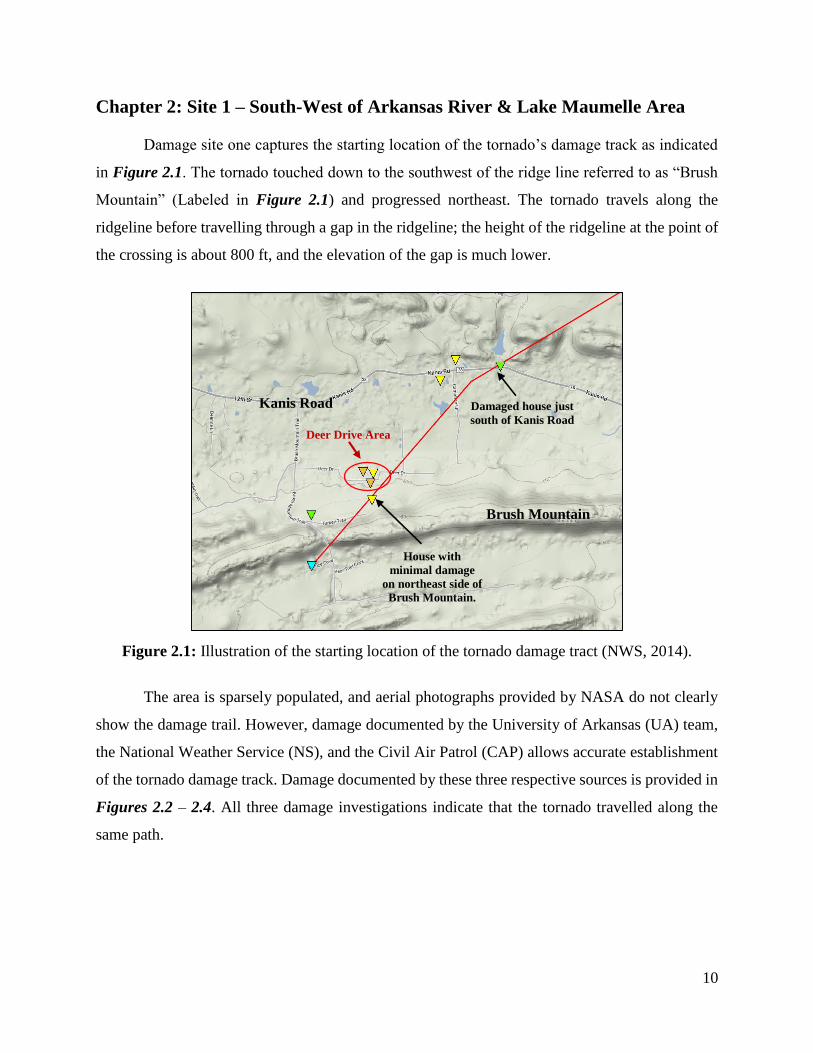
Damage site one captures the starting location of the tornado’s damage track as indicated
in Figure 2.1. The tornado touched down to the southwest of the ridge line referred to as “Brush
Mountain” (Labeled in Figure 2.1) and progressed northeast. The tornado travels along the
ridgeline before travelling through a gap in the ridgeline; the height of the ridgeline at the point of
the crossing is about 800 ft, and the elevation of the gap is much lower.
Figure 2.1: Illustration of the starting location of the tornado damage tract (NWS, 2014).
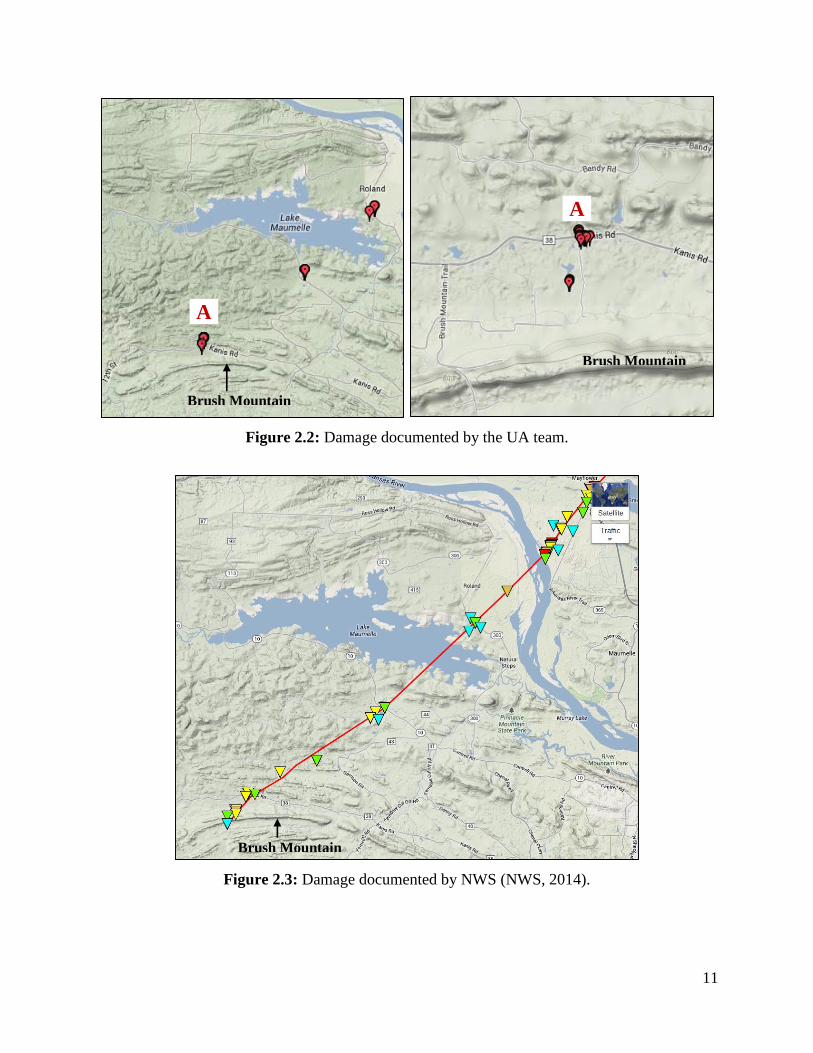
The area is sparsely populated, and aerial photographs provided by NASA do not clearly
show the damage trail. However, damage documented by the University of Arkansas (UA) team,
the National Weather Service (NS), and the Civil Air Patrol (CAP) allows accurate establishment
of the tornado damage track. Damage documented by these three respective sources is provided in
Figures 2.2 – 2.4. All three damage investigations indicate that the tornado travelled along the
same path.
Brush Mountain
Deer Drive Area
House with
minimal damage
on northeast side of
Brush Mountain.
Kanis Road Damaged house just
south of Kanis Road
11
Figure 2.2: Damage documented by the UA team.
Figure 2.3: Damage documented by NWS (NWS, 2014).
Brush Mountain
Brush Mountain
A
A
Brush Mountain
12
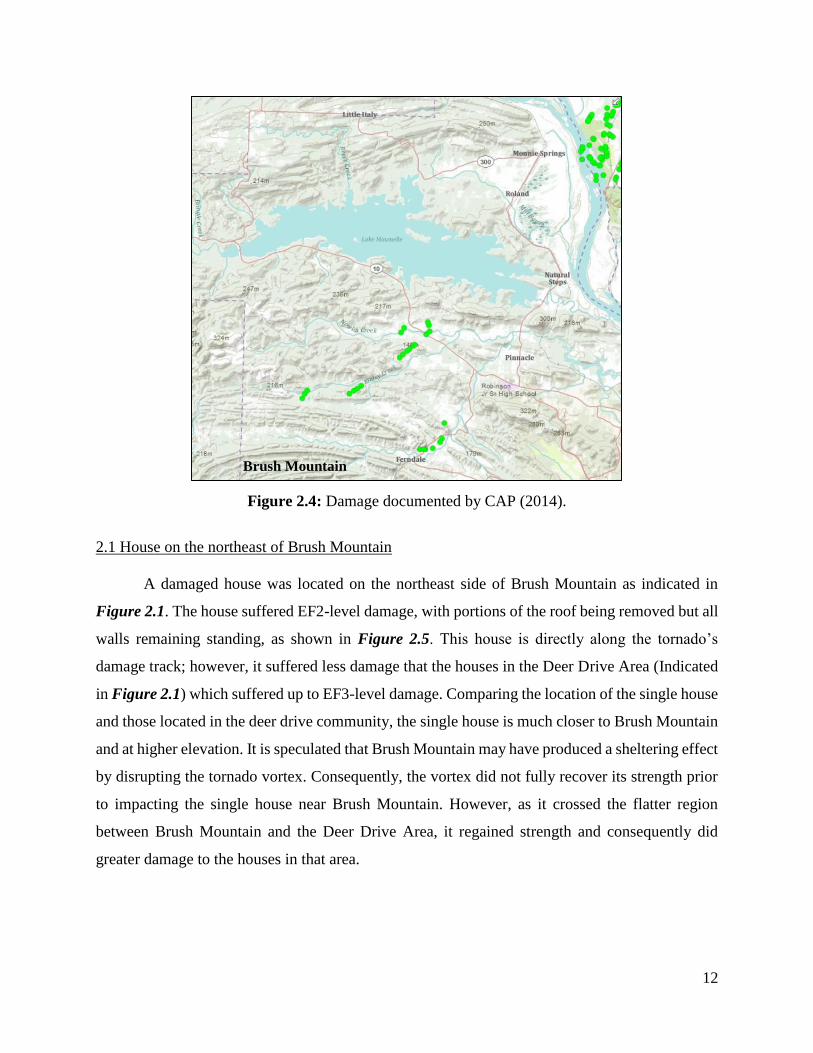
Figure 2.4: Damage documented by CAP (2014).
2.1 House on the northeast of Brush Mountain
A damaged house was located on the northeast side of Brush Mountain as indicated in
Figure 2.1. The house suffered EF2-level damage, with portions of the roof being removed but all
walls remaining standing, as shown in Figure 2.5. This house is directly along the tornado’s
damage track; however, it suffered less damage that the houses in the Deer Drive Area (Indicated
in Figure 2.1) which suffered up to EF3-level damage. Comparing the location of the single house
and those located in the deer drive community, the single house is much closer to Brush Mountain
and at higher elevation. It is speculated that Brush Mountain may have produced a sheltering effect
by disrupting the tornado vortex. Consequently, the vortex did not fully recover its strength prior
to impacting the single house near Brush Mountain. However, as it crossed the flatter region
between Brush Mountain and the Deer Drive Area, it regained strength and consequently did
greater damage to the houses in that area.
Brush Mountain
13
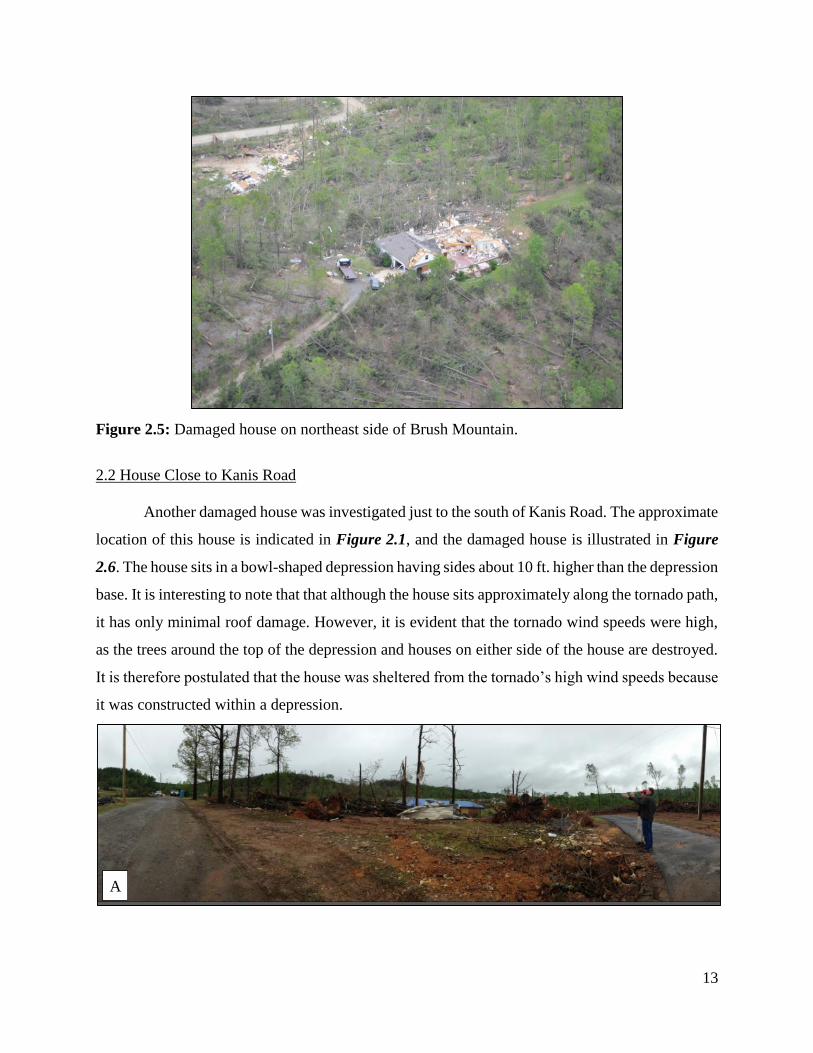
Figure 2.5: Damaged house on northeast side of Brush Mountain.
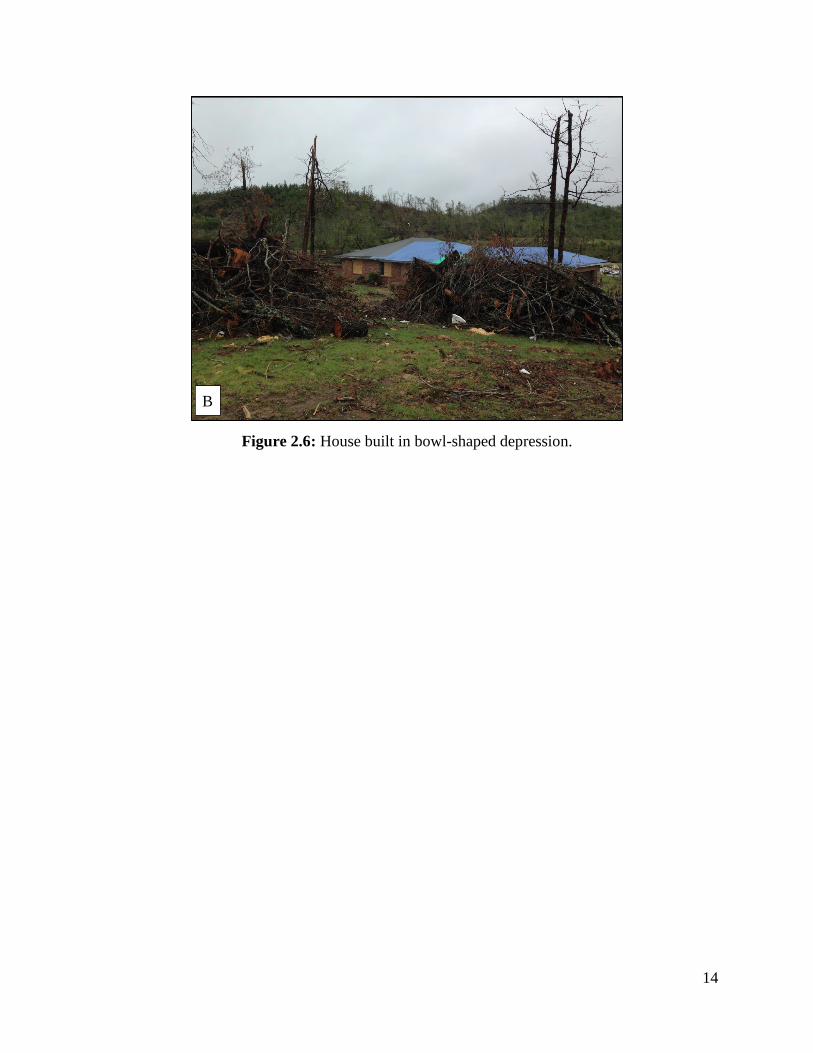
2.2 House Close to Kanis Road
Another damaged house was investigated just to the south of Kanis Road. The approximate
location of this house is indicated in Figure 2.1, and the damaged house is illustrated in Figure
2.6. The house sits in a bowl-shaped depression having sides about 10 ft. higher than the depression
base. It is interesting to note that that although the house sits approximately along the tornado path,
it has only minimal roof damage. However, it is evident that the tornado wind speeds were high,
as the trees around the top of the depression and houses on either side of the house are destroyed.
It is therefore postulated that the house was sheltered from the tornado’s high wind speeds because
it was constructed within a depression.
A
14
Figure 2.6: House built in bowl-shaped depression.
B
15
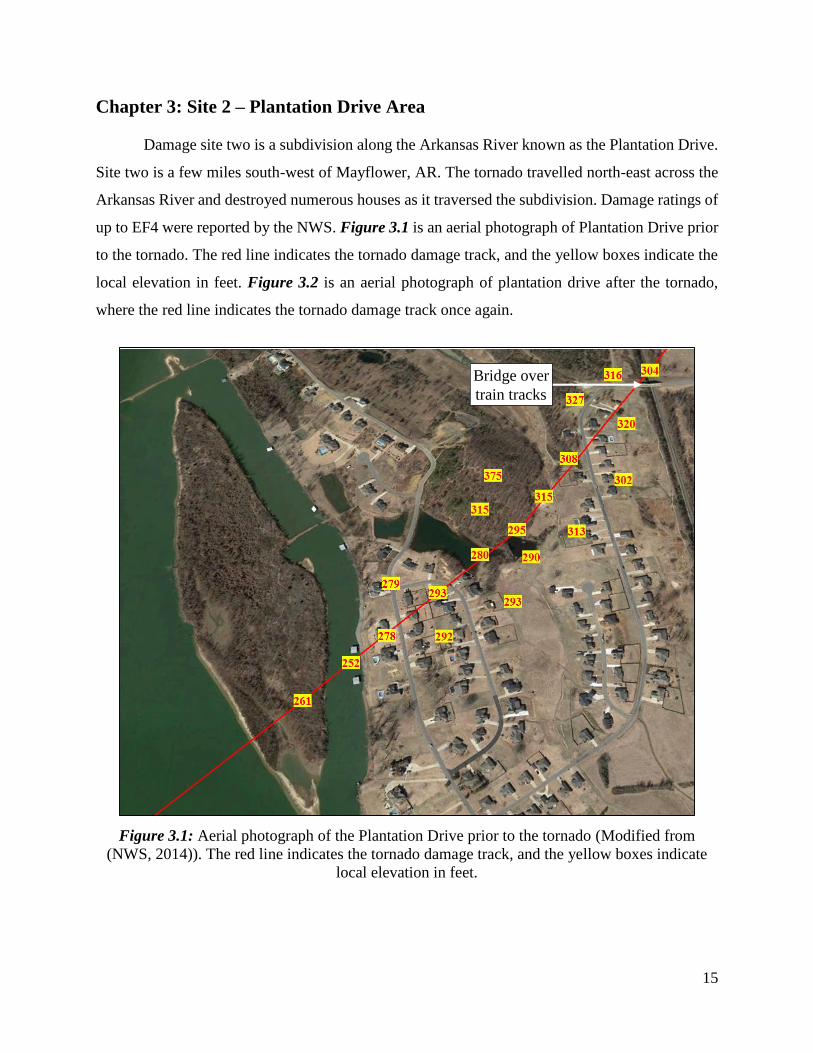
Chapter 3: Site 2 – Plantation Drive Area
Damage site two is a subdivision along the Arkansas River known as the Plantation Drive.
Site two is a few miles south-west of Mayflower, AR. The tornado travelled north-east across the
Arkansas River and destroyed numerous houses as it traversed the subdivision. Damage ratings of
up to EF4 were reported by the NWS. Figure 3.1 is an aerial photograph of Plantation Drive prior
to the tornado. The red line indicates the tornado damage track, and the yellow boxes indicate the
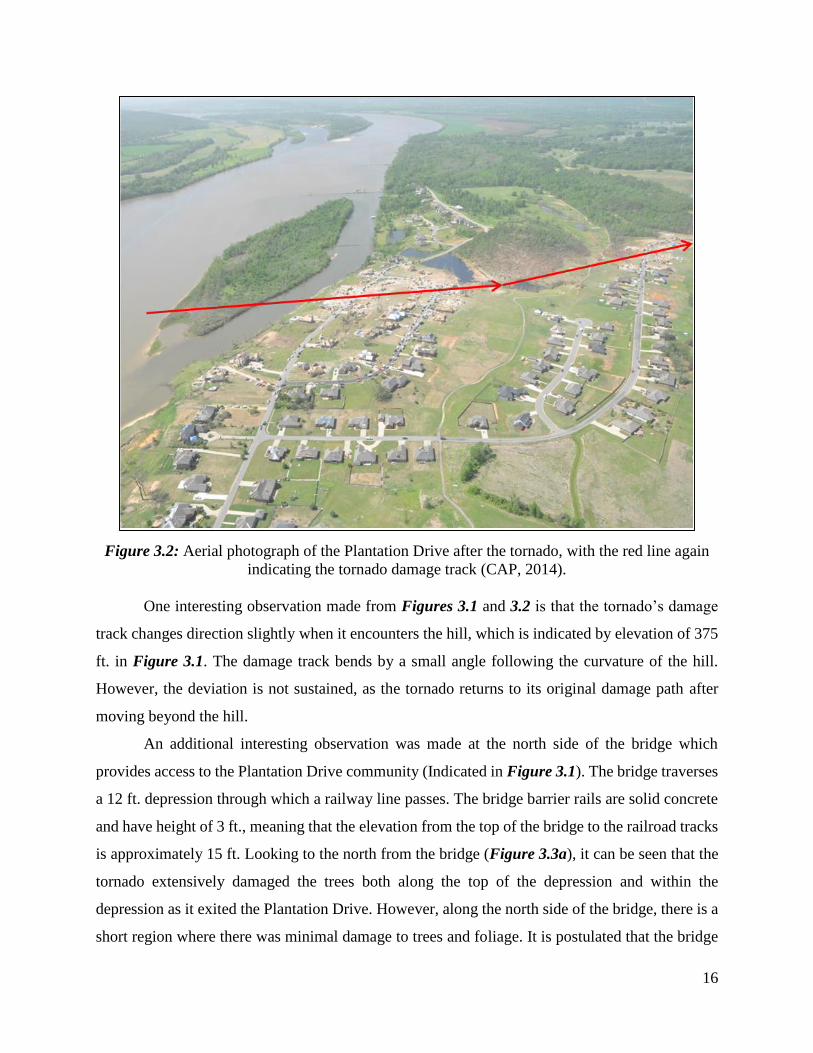
local elevation in feet. Figure 3.2 is an aerial photograph of plantation drive after the tornado,
where the red line indicates the tornado damage track once again.
Figure 3.1: Aerial photograph of the Plantation Drive prior to the tornado (Modified from
(NWS, 2014)). The red line indicates the tornado damage track, and the yellow boxes indicate
local elevation in feet.
Bridge over
train tracks
16
Figure 3.2: Aerial photograph of the Plantation Drive after the tornado, with the red line again
indicating the tornado damage track (CAP, 2014).
One interesting observation made from Figures 3.1 and 3.2 is that the tornado’s damage
track changes direction slightly when it encounters the hill, which is indicated by elevation of 375
ft. in Figure 3.1. The damage track bends by a small angle following the curvature of the hill.
However, the deviation is not sustained, as the tornado returns to its original damage path after
moving beyond the hill.
An additional interesting observation was made at the north side of the bridge which
provides access to the Plantation Drive community (Indicated in Figure 3.1). The bridge traverses
a 12 ft. depression through which a railway line passes. The bridge barrier rails are solid concrete
and have height of 3 ft., meaning that the elevation from the top of the bridge to the railroad tracks
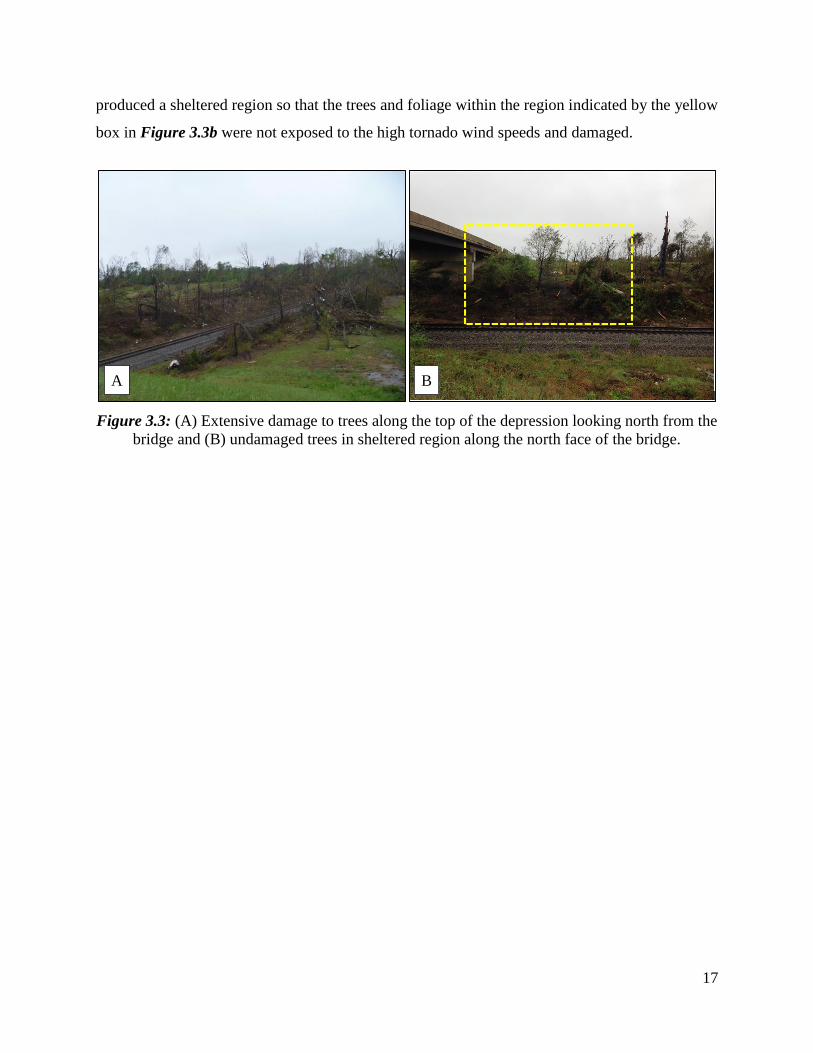
is approximately 15 ft. Looking to the north from the bridge (Figure 3.3a), it can be seen that the
tornado extensively damaged the trees both along the top of the depression and within the
depression as it exited the Plantation Drive. However, along the north side of the bridge, there is a
short region where there was minimal damage to trees and foliage. It is postulated that the bridge
17
produced a sheltered region so that the trees and foliage within the region indicated by the yellow
box in Figure 3.3b were not exposed to the high tornado wind speeds and damaged.
Figure 3.3: (A) Extensive damage to trees along the top of the depression looking north from the
bridge and (B) undamaged trees in sheltered region along the north face of the bridge.
A B
18
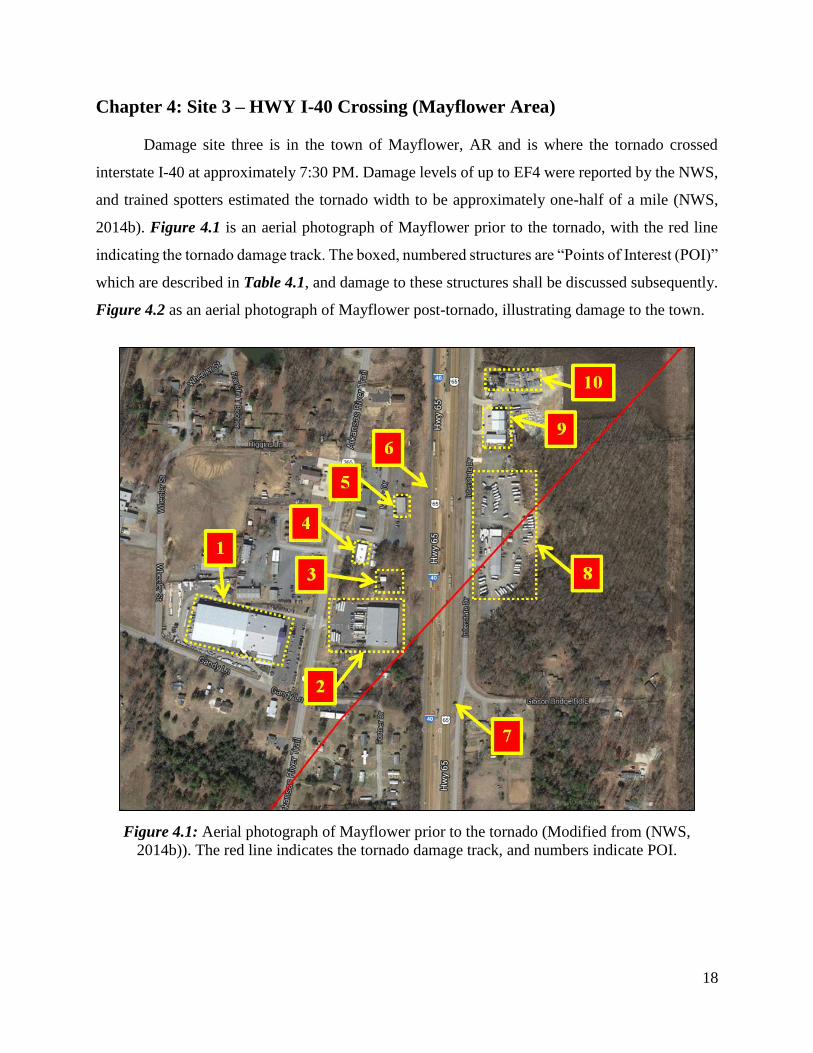
Chapter 4: Site 3 – HWY I-40 Crossing (Mayflower Area)
Damage site three is in the town of Mayflower, AR and is where the tornado crossed
interstate I-40 at approximately 7:30 PM. Damage levels of up to EF4 were reported by the NWS,
and trained spotters estimated the tornado width to be approximately one-half of a mile (NWS,
2014b). Figure 4.1 is an aerial photograph of Mayflower prior to the tornado, with the red line
indicating the tornado damage track. The boxed, numbered structures are “Points of Interest (POI)”
which are described in Table 4.1, and damage to these structures shall be discussed subsequently.
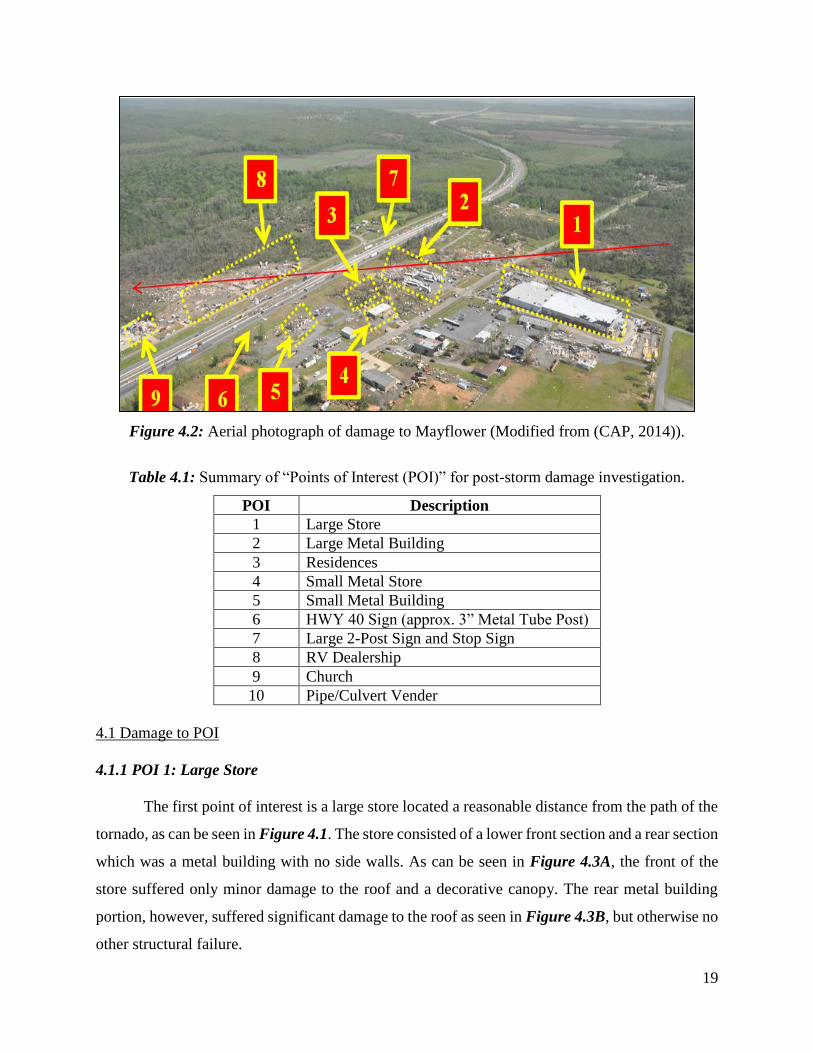
Figure 4.2 as an aerial photograph of Mayflower post-tornado, illustrating damage to the town.
Figure 4.1: Aerial photograph of Mayflower prior to the tornado (Modified from (NWS,
2014b)). The red line indicates the tornado damage track, and numbers indicate POI.
19
Figure 4.2: Aerial photograph of damage to Mayflower (Modified from (CAP, 2014)).
Table 4.1: Summary of “Points of Interest (POI)” for post-storm damage investigation.
POI Description
1 Large Store
2 Large Metal Building
3 Residences
4 Small Metal Store
5 Small Metal Building
6 HWY 40 Sign (approx. 3” Metal Tube Post)
7 Large 2-Post Sign and Stop Sign
8 RV Dealership
9 Church
10 Pipe/Culvert Vender
4.1 Damage to POI
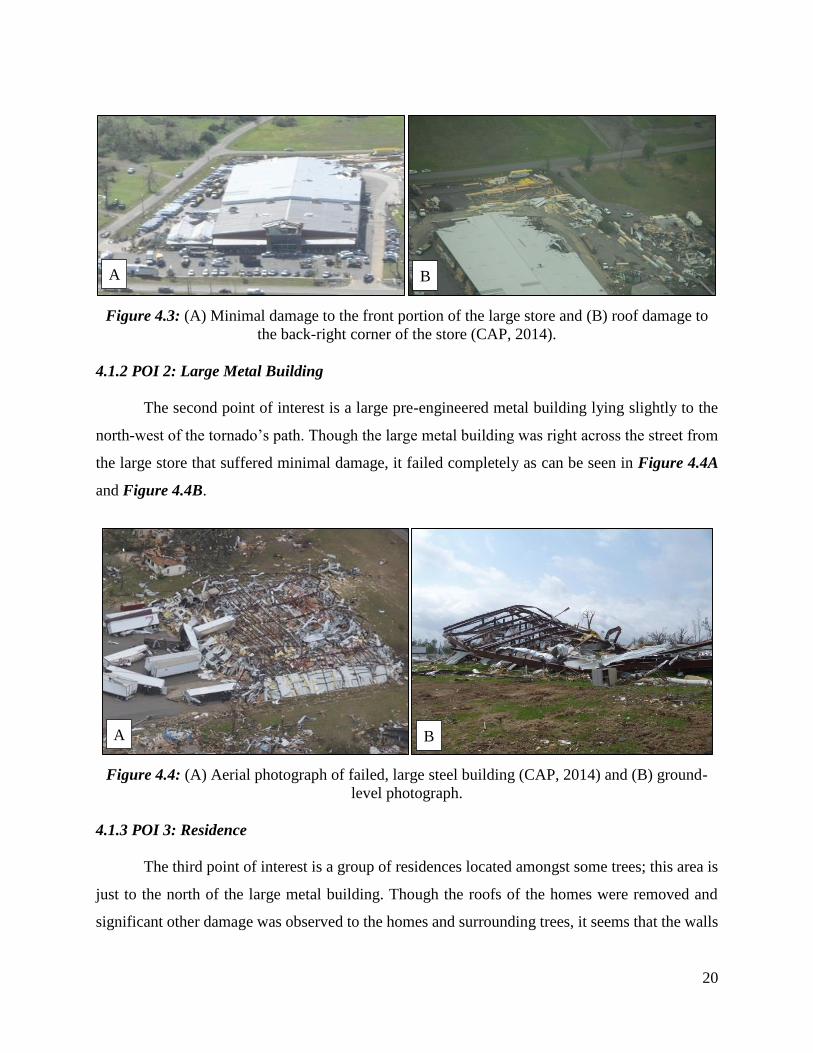
4.1.1 POI 1: Large Store
The first point of interest is a large store located a reasonable distance from the path of the
tornado, as can be seen in Figure 4.1. The store consisted of a lower front section and a rear section
which was a metal building with no side walls. As can be seen in Figure 4.3A, the front of the
store suffered only minor damage to the roof and a decorative canopy. The rear metal building
portion, however, suffered significant damage to the roof as seen in Figure 4.3B, but otherwise no
other structural failure.
20
Figure 4.3: (A) Minimal damage to the front portion of the large store and (B) roof damage to
the back-right corner of the store (CAP, 2014).
4.1.2 POI 2: Large Metal Building
The second point of interest is a large pre-engineered metal building lying slightly to the
north-west of the tornado’s path. Though the large metal building was right across the street from
the large store that suffered minimal damage, it failed completely as can be seen in Figure 4.4A
and Figure 4.4B.
Figure 4.4: (A) Aerial photograph of failed, large steel building (CAP, 2014) and (B) ground-
level photograph.
4.1.3 POI 3: Residence
The third point of interest is a group of residences located amongst some trees; this area is
just to the north of the large metal building. Though the roofs of the homes were removed and
significant other damage was observed to the homes and surrounding trees, it seems that the walls
A B
A B
21
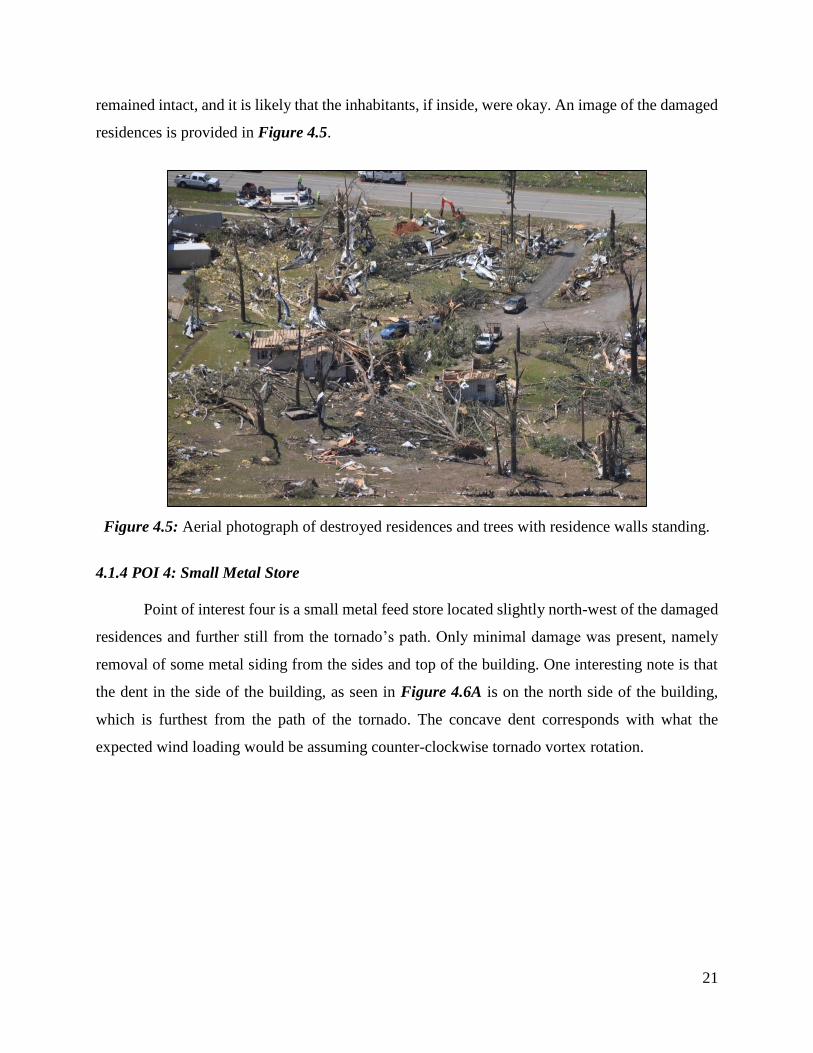
remained intact, and it is likely that the inhabitants, if inside, were okay. An image of the damaged
residences is provided in Figure 4.5.
Figure 4.5: Aerial photograph of destroyed residences and trees with residence walls standing.
4.1.4 POI 4: Small Metal Store
Point of interest four is a small metal feed store located slightly north-west of the damaged
residences and further still from the tornado’s path. Only minimal damage was present, namely
removal of some metal siding from the sides and top of the building. One interesting note is that
the dent in the side of the building, as seen in Figure 4.6A is on the north side of the building,
which is furthest from the path of the tornado. The concave dent corresponds with what the
expected wind loading would be assuming counter-clockwise tornado vortex rotation.
22
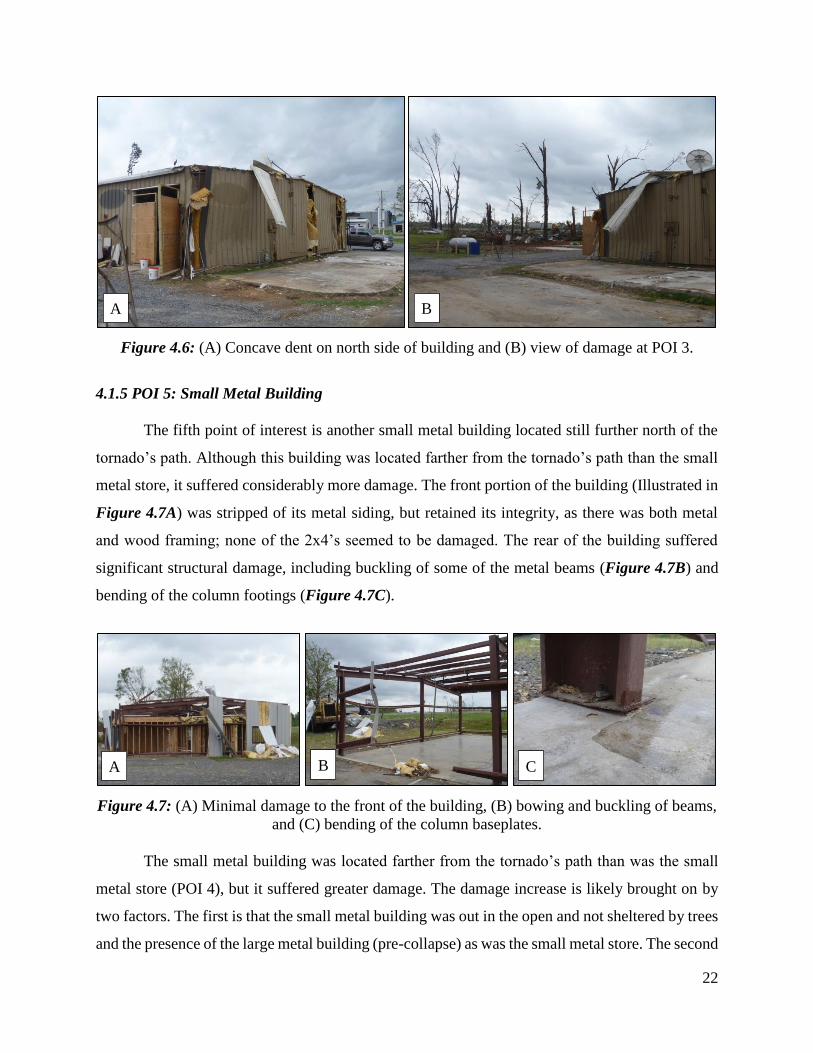
Figure 4.6: (A) Concave dent on north side of building and (B) view of damage at POI 3.
4.1.5 POI 5: Small Metal Building
The fifth point of interest is another small metal building located still further north of the
tornado’s path. Although this building was located farther from the tornado’s path than the small
metal store, it suffered considerably more damage. The front portion of the building (Illustrated in
Figure 4.7A) was stripped of its metal siding, but retained its integrity, as there was both metal
and wood framing; none of the 2x4’s seemed to be damaged. The rear of the building suffered
significant structural damage, including buckling of some of the metal beams (Figure 4.7B) and
bending of the column footings (Figure 4.7C).
Figure 4.7: (A) Minimal damage to the front of the building, (B) bowing and buckling of beams,
and (C) bending of the column baseplates.
The small metal building was located farther from the tornado’s path than was the small
metal store (POI 4), but it suffered greater damage. The damage increase is likely brought on by
two factors. The first is that the small metal building was out in the open and not sheltered by trees
and the presence of the large metal building (pre-collapse) as was the small metal store. The second
A B
A B C
23
reason is that the rear of the small metal building had two large roll-up garage doors that were
obviously the initial point of failure. Once the doors were gone, excess flow passed into the shop
creating increased pressure and lift, which is evidenced by bending of the column base plates.
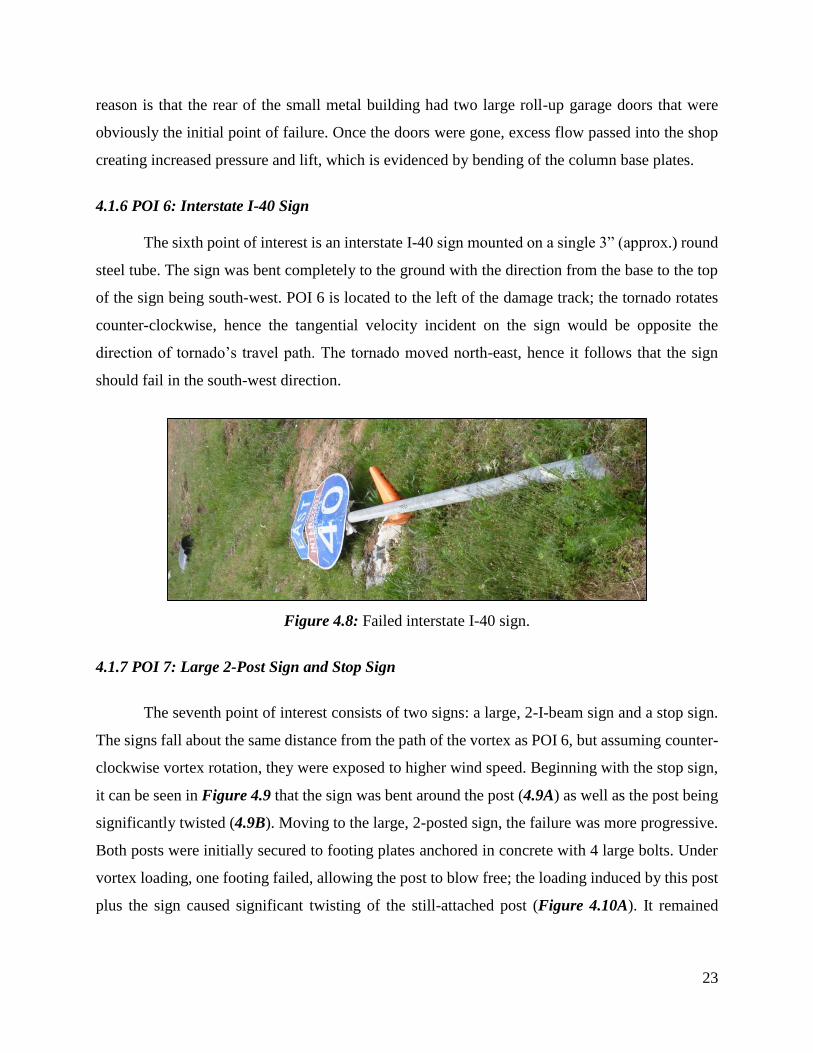
4.1.6 POI 6: Interstate I-40 Sign
The sixth point of interest is an interstate I-40 sign mounted on a single 3” (approx.) round
steel tube. The sign was bent completely to the ground with the direction from the base to the top
of the sign being south-west. POI 6 is located to the left of the damage track; the tornado rotates
counter-clockwise, hence the tangential velocity incident on the sign would be opposite the
direction of tornado’s travel path. The tornado moved north-east, hence it follows that the sign
should fail in the south-west direction.
Figure 4.8: Failed interstate I-40 sign.
4.1.7 POI 7: Large 2-Post Sign and Stop Sign
The seventh point of interest consists of two signs: a large, 2-I-beam sign and a stop sign.
The signs fall about the same distance from the path of the vortex as POI 6, but assuming counter-
clockwise vortex rotation, they were exposed to higher wind speed. Beginning with the stop sign,
it can be seen in Figure 4.9 that the sign was bent around the post (4.9A) as well as the post being
significantly twisted (4.9B). Moving to the large, 2-posted sign, the failure was more progressive.
Both posts were initially secured to footing plates anchored in concrete with 4 large bolts. Under
vortex loading, one footing failed, allowing the post to blow free; the loading induced by this post
plus the sign caused significant twisting of the still-attached post (Figure 4.10A). It remained
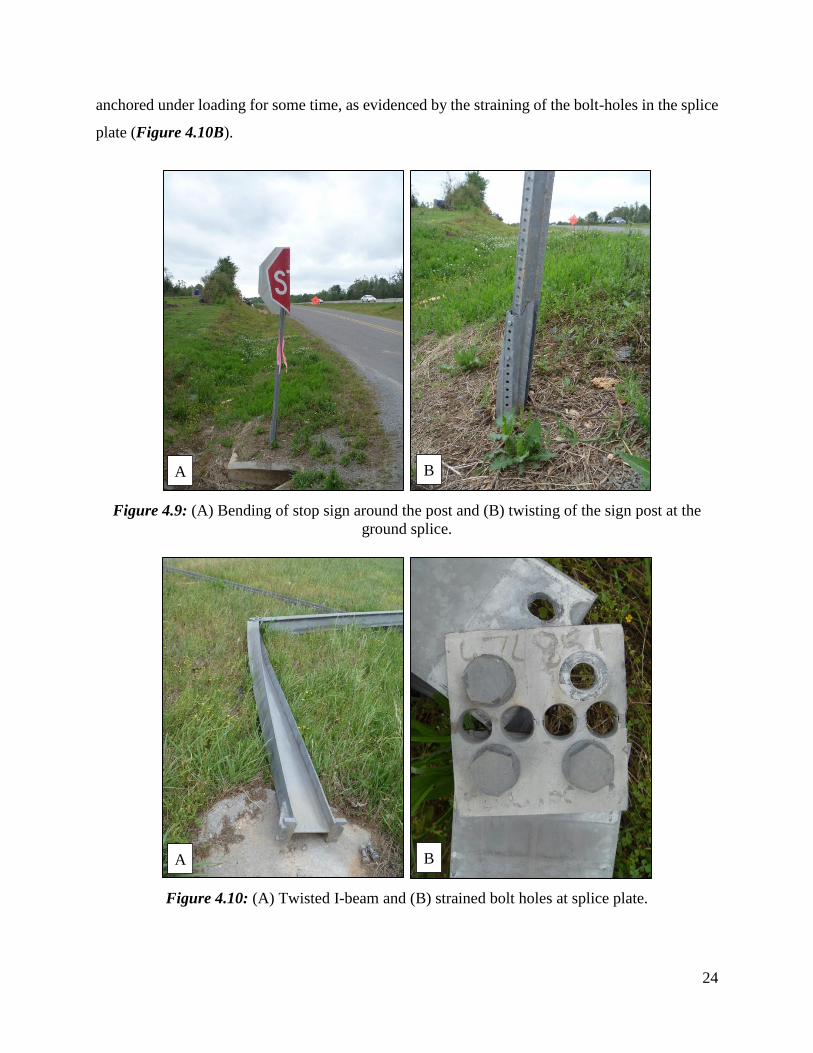
24
anchored under loading for some time, as evidenced by the straining of the bolt-holes in the splice
plate (Figure 4.10B).
Figure 4.9: (A) Bending of stop sign around the post and (B) twisting of the sign post at the
ground splice.
Figure 4.10: (A) Twisted I-beam and (B) strained bolt holes at splice plate.
A B
A B
25
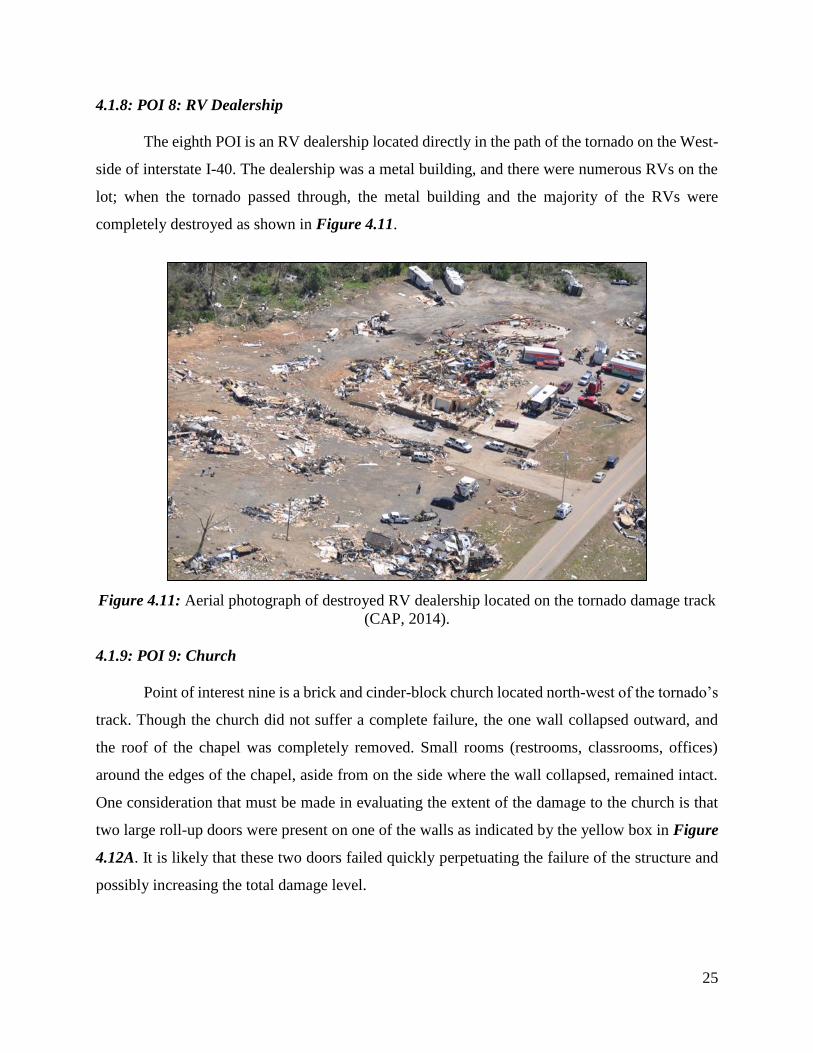
4.1.8: POI 8: RV Dealership
The eighth POI is an RV dealership located directly in the path of the tornado on the West-
side of interstate I-40. The dealership was a metal building, and there were numerous RVs on the
lot; when the tornado passed through, the metal building and the majority of the RVs were
completely destroyed as shown in Figure 4.11.
Figure 4.11: Aerial photograph of destroyed RV dealership located on the tornado damage track
(CAP, 2014).
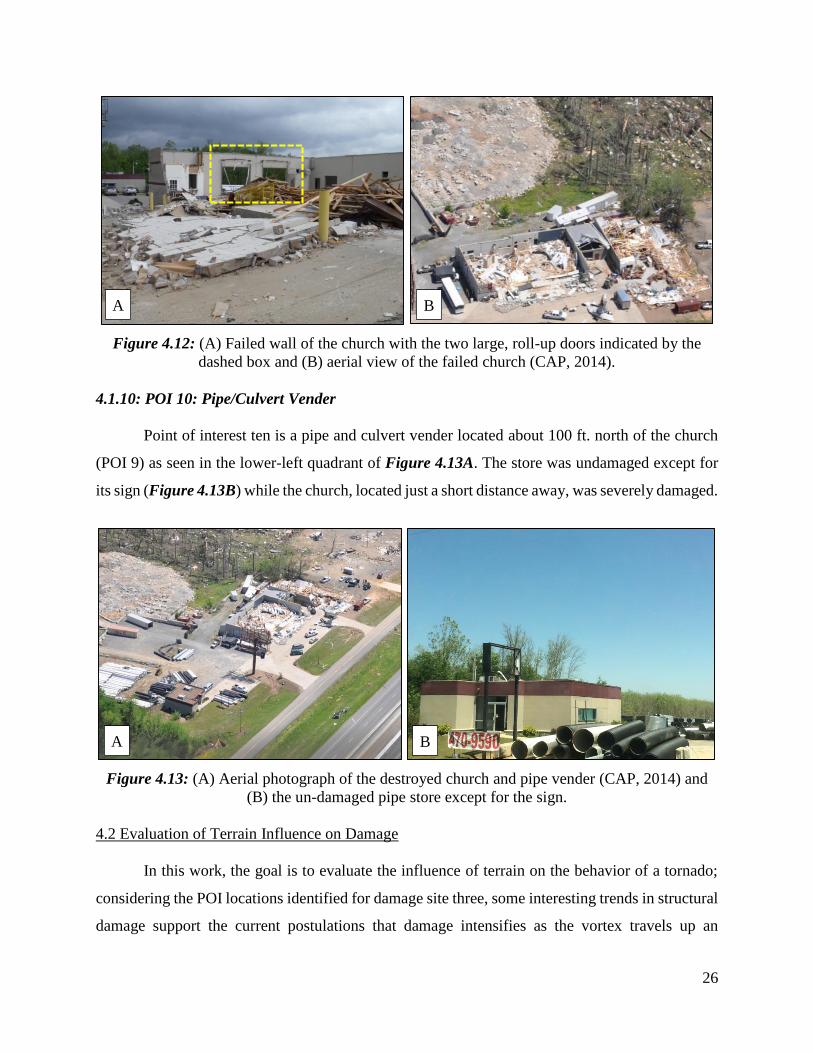
4.1.9: POI 9: Church
Point of interest nine is a brick and cinder-block church located north-west of the tornado’s
track. Though the church did not suffer a complete failure, the one wall collapsed outward, and
the roof of the chapel was completely removed. Small rooms (restrooms, classrooms, offices)
around the edges of the chapel, aside from on the side where the wall collapsed, remained intact.
One consideration that must be made in evaluating the extent of the damage to the church is that
two large roll-up doors were present on one of the walls as indicated by the yellow box in Figure
4.12A. It is likely that these two doors failed quickly perpetuating the failure of the structure and
possibly increasing the total damage level.
26
Figure 4.12: (A) Failed wall of the church with the two large, roll-up doors indicated by the
dashed box and (B) aerial view of the failed church (CAP, 2014).
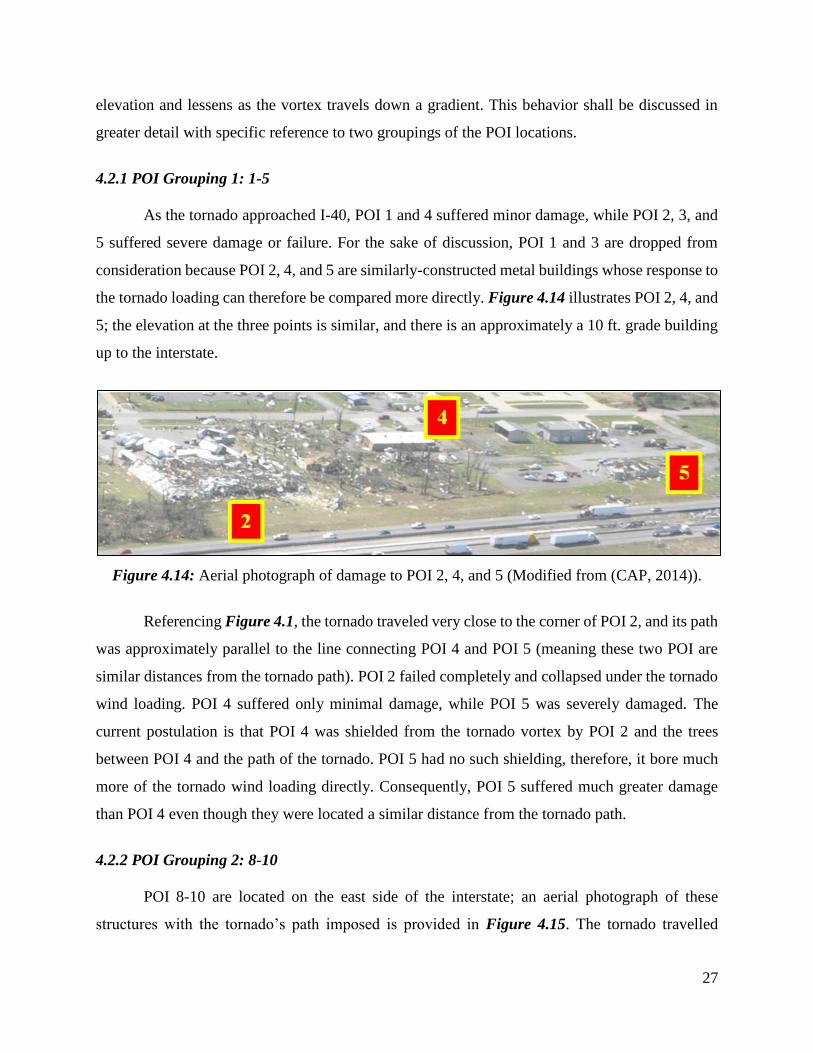
4.1.10: POI 10: Pipe/Culvert Vender
Point of interest ten is a pipe and culvert vender located about 100 ft. north of the church
(POI 9) as seen in the lower-left quadrant of Figure 4.13A. The store was undamaged except for
its sign (Figure 4.13B) while the church, located just a short distance away, was severely damaged.
Figure 4.13: (A) Aerial photograph of the destroyed church and pipe vender (CAP, 2014) and
(B) the un-damaged pipe store except for the sign.
4.2 Evaluation of Terrain Influence on Damage
In this work, the goal is to evaluate the influence of terrain on the behavior of a tornado;
considering the POI locations identified for damage site three, some interesting trends in structural
damage support the current postulations that damage intensifies as the vortex travels up an
A B
A B
27
elevation and lessens as the vortex travels down a gradient. This behavior shall be discussed in
greater detail with specific reference to two groupings of the POI locations.
4.2.1 POI Grouping 1: 1-5
As the tornado approached I-40, POI 1 and 4 suffered minor damage, while POI 2, 3, and
5 suffered severe damage or failure. For the sake of discussion, POI 1 and 3 are dropped from
consideration because POI 2, 4, and 5 are similarly-constructed metal buildings whose response to
the tornado loading can therefore be compared more directly. Figure 4.14 illustrates POI 2, 4, and
5; the elevation at the three points is similar, and there is an approximately a 10 ft. grade building
up to the interstate.
Figure 4.14: Aerial photograph of damage to POI 2, 4, and 5 (Modified from (CAP, 2014)).
Referencing Figure 4.1, the tornado traveled very close to the corner of POI 2, and its path
was approximately parallel to the line connecting POI 4 and POI 5 (meaning these two POI are
similar distances from the tornado path). POI 2 failed completely and collapsed under the tornado
wind loading. POI 4 suffered only minimal damage, while POI 5 was severely damaged. The
current postulation is that POI 4 was shielded from the tornado vortex by POI 2 and the trees
between POI 4 and the path of the tornado. POI 5 had no such shielding, therefore, it bore much
more of the tornado wind loading directly. Consequently, POI 5 suffered much greater damage
than POI 4 even though they were located a similar distance from the tornado path.
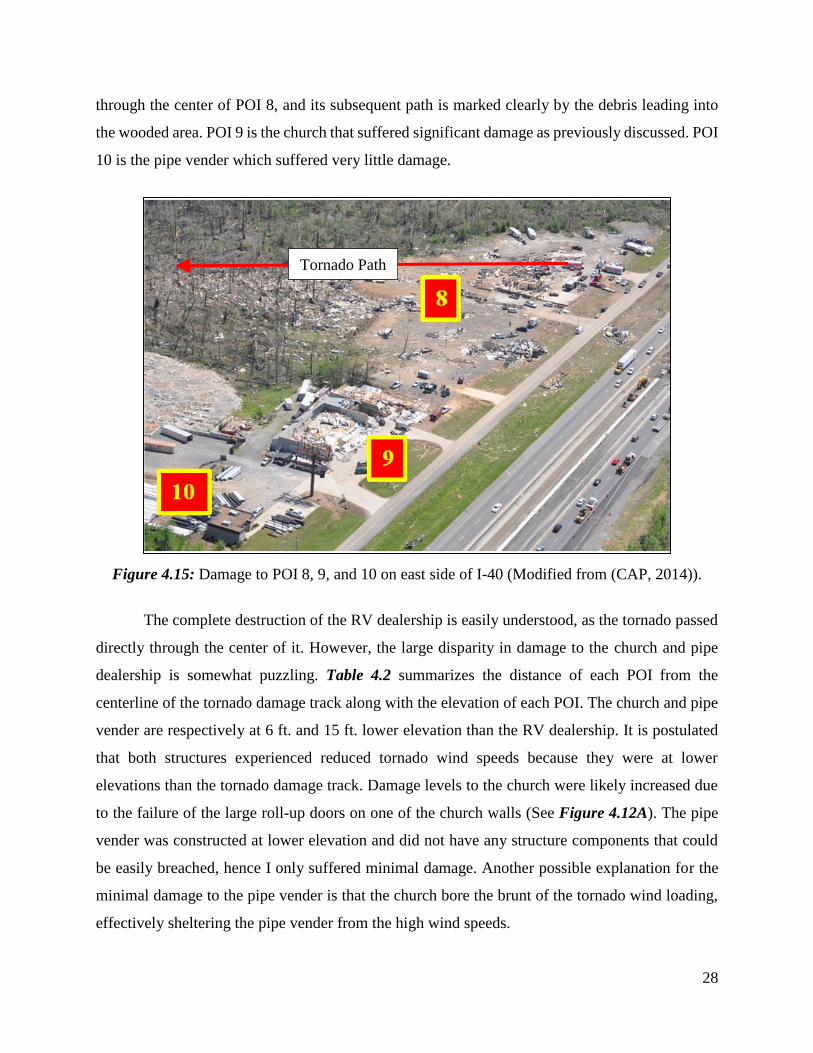
4.2.2 POI Grouping 2: 8-10
POI 8-10 are located on the east side of the interstate; an aerial photograph of these
structures with the tornado’s path imposed is provided in Figure 4.15. The tornado travelled
28
through the center of POI 8, and its subsequent path is marked clearly by the debris leading into
the wooded area. POI 9 is the church that suffered significant damage as previously discussed. POI
10 is the pipe vender which suffered very little damage.
Figure 4.15: Damage to POI 8, 9, and 10 on east side of I-40 (Modified from (CAP, 2014)).
The complete destruction of the RV dealership is easily understood, as the tornado passed
directly through the center of it. However, the large disparity in damage to the church and pipe
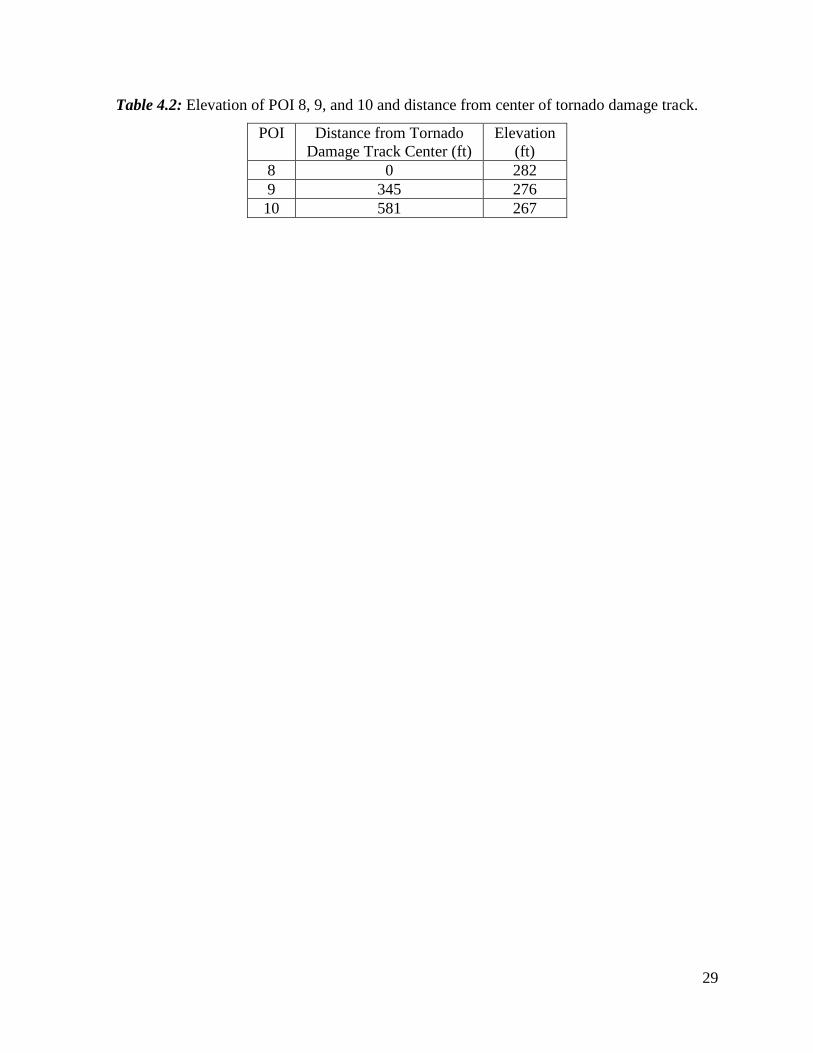
dealership is somewhat puzzling. Table 4.2 summarizes the distance of each POI from the
centerline of the tornado damage track along with the elevation of each POI. The church and pipe
vender are respectively at 6 ft. and 15 ft. lower elevation than the RV dealership. It is postulated
that both structures experienced reduced tornado wind speeds because they were at lower
elevations than the tornado damage track. Damage levels to the church were likely increased due
to the failure of the large roll-up doors on one of the church walls (See Figure 4.12A). The pipe
vender was constructed at lower elevation and did not have any structure components that could
be easily breached, hence I only suffered minimal damage. Another possible explanation for the
minimal damage to the pipe vender is that the church bore the brunt of the tornado wind loading,
effectively sheltering the pipe vender from the high wind speeds.
Tornado Path
29
Table 4.2: Elevation of POI 8, 9, and 10 and distance from center of tornado damage track.
POI
Distance from Tornado
Damage Track Center (ft)
Elevation
(ft)
8 0 282
9 345 276
10 581 267
30
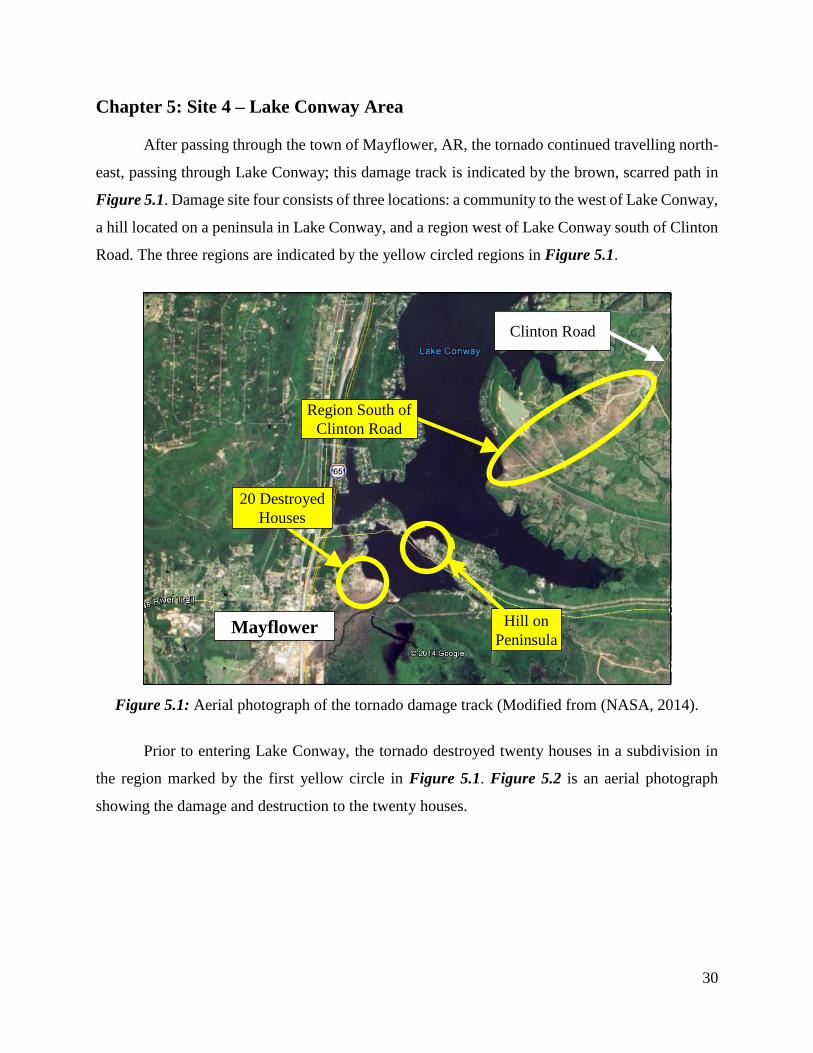
Chapter 5: Site 4 – Lake Conway Area
After passing through the town of Mayflower, AR, the tornado continued travelling north-
east, passing through Lake Conway; this damage track is indicated by the brown, scarred path in
Figure 5.1. Damage site four consists of three locations: a community to the west of Lake Conway,
a hill located on a peninsula in Lake Conway, and a region west of Lake Conway south of Clinton
Road. The three regions are indicated by the yellow circled regions in Figure 5.1.
Figure 5.1: Aerial photograph of the tornado damage track (Modified from (NASA, 2014).
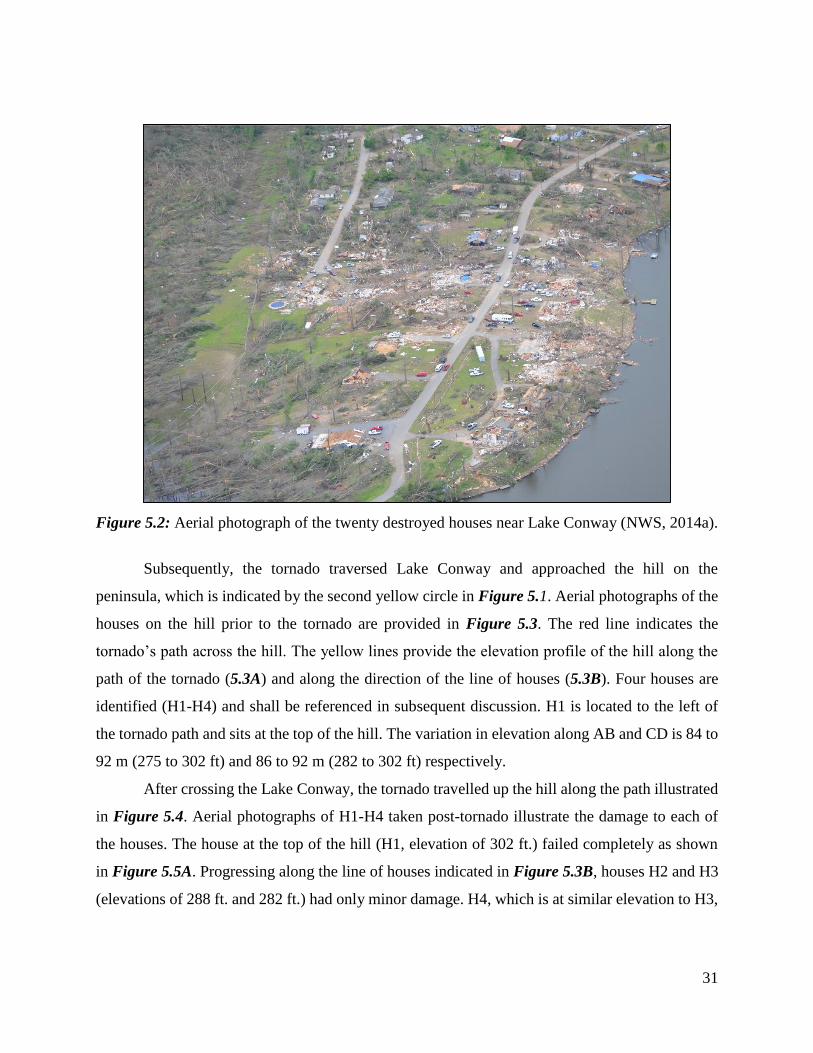
Prior to entering Lake Conway, the tornado destroyed twenty houses in a subdivision in
the region marked by the first yellow circle in Figure 5.1. Figure 5.2 is an aerial photograph
showing the damage and destruction to the twenty houses.
Site 4 Hill on
Peninsula
20 Destroyed
Houses
Mayflower
Region South of
Clinton Road
Clinton Road
31
Figure 5.2: Aerial photograph of the twenty destroyed houses near Lake Conway (NWS, 2014a).
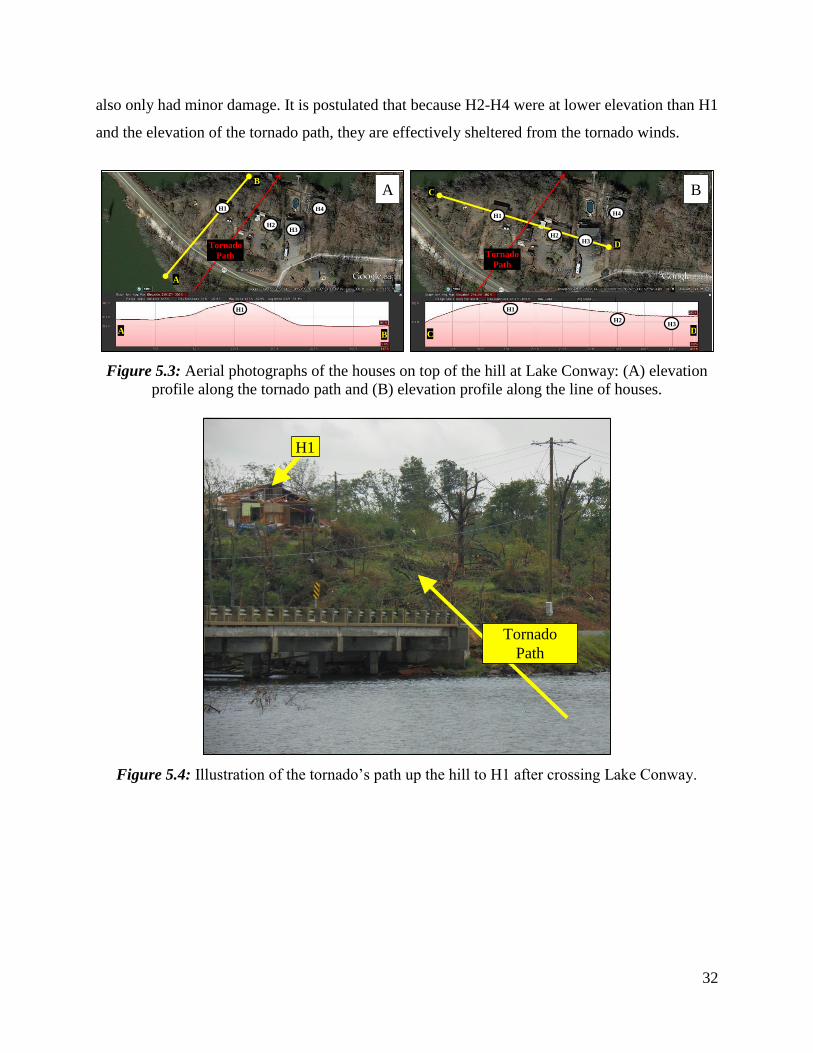
Subsequently, the tornado traversed Lake Conway and approached the hill on the
peninsula, which is indicated by the second yellow circle in Figure 5.1. Aerial photographs of the
houses on the hill prior to the tornado are provided in Figure 5.3. The red line indicates the
tornado’s path across the hill. The yellow lines provide the elevation profile of the hill along the
path of the tornado (5.3A) and along the direction of the line of houses (5.3B). Four houses are
identified (H1-H4) and shall be referenced in subsequent discussion. H1 is located to the left of
the tornado path and sits at the top of the hill. The variation in elevation along AB and CD is 84 to
92 m (275 to 302 ft) and 86 to 92 m (282 to 302 ft) respectively.
After crossing the Lake Conway, the tornado travelled up the hill along the path illustrated
in Figure 5.4. Aerial photographs of H1-H4 taken post-tornado illustrate the damage to each of
the houses. The house at the top of the hill (H1, elevation of 302 ft.) failed completely as shown
in Figure 5.5A. Progressing along the line of houses indicated in Figure 5.3B, houses H2 and H3
(elevations of 288 ft. and 282 ft.) had only minor damage. H4, which is at similar elevation to H3,
32
also only had minor damage. It is postulated that because H2-H4 were at lower elevation than H1
and the elevation of the tornado path, they are effectively sheltered from the tornado winds.
Figure 5.3: Aerial photographs of the houses on top of the hill at Lake Conway: (A) elevation
profile along the tornado path and (B) elevation profile along the line of houses.
Figure 5.4: Illustration of the tornado’s path up the hill to H1 after crossing Lake Conway.
Figure 2.4.4 Close up Google Earth view of the hill with buildings before damage.
Figure 2.4.5 Elevation profile for the hill along tornado travel direction.
B
A
A B
Tornado
Path
H4
H3 H2
H1
H1
Figure 2.4.5 Elevation profile for the hill along tornado travel direction.
Figure 2.4.6 Elevation variation along line CD normal to tornado travel direction
D
C
Tornado
Path
H1
H2 H3
H4
C D
H1
H2 H3
H1
Tornado Travel
Direction
A B
H1
Tornado
Path
33
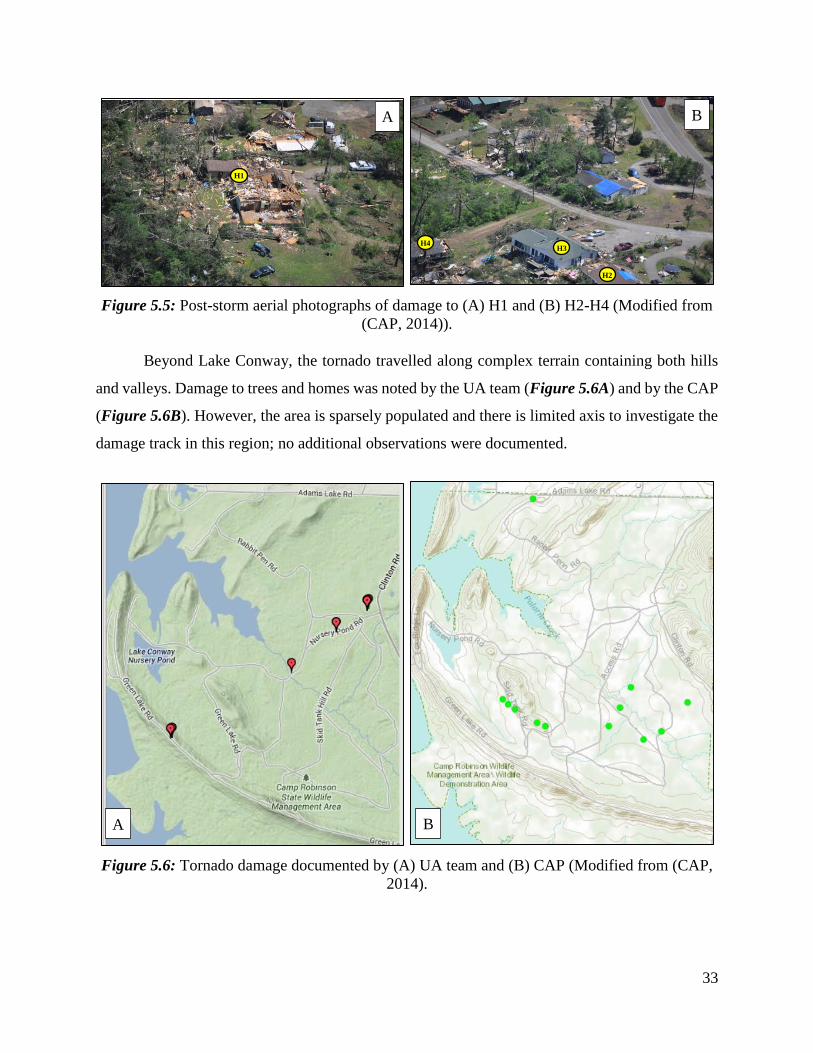
Figure 5.5: Post-storm aerial photographs of damage to (A) H1 and (B) H2-H4 (Modified from
(CAP, 2014)).
Beyond Lake Conway, the tornado travelled along complex terrain containing both hills
and valleys. Damage to trees and homes was noted by the UA team (Figure 5.6A) and by the CAP
(Figure 5.6B). However, the area is sparsely populated and there is limited axis to investigate the
damage track in this region; no additional observations were documented.
Figure 5.6: Tornado damage documented by (A) UA team and (B) CAP (Modified from (CAP,
2014).
H1
Figure 2.4.9 Arial for house (H3) 0n the leeward side (low elevation)
H2
H3 H4
B A
B A
34
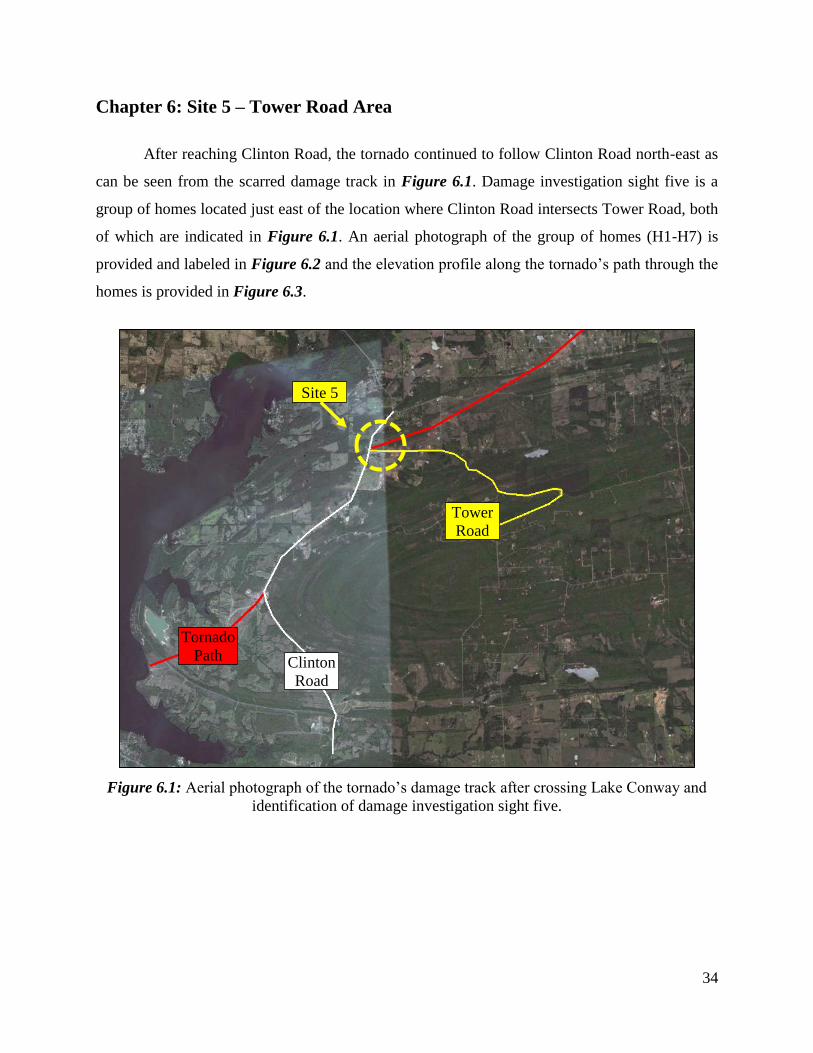
Chapter 6: Site 5 – Tower Road Area
After reaching Clinton Road, the tornado continued to follow Clinton Road north-east as
can be seen from the scarred damage track in Figure 6.1. Damage investigation sight five is a
group of homes located just east of the location where Clinton Road intersects Tower Road, both
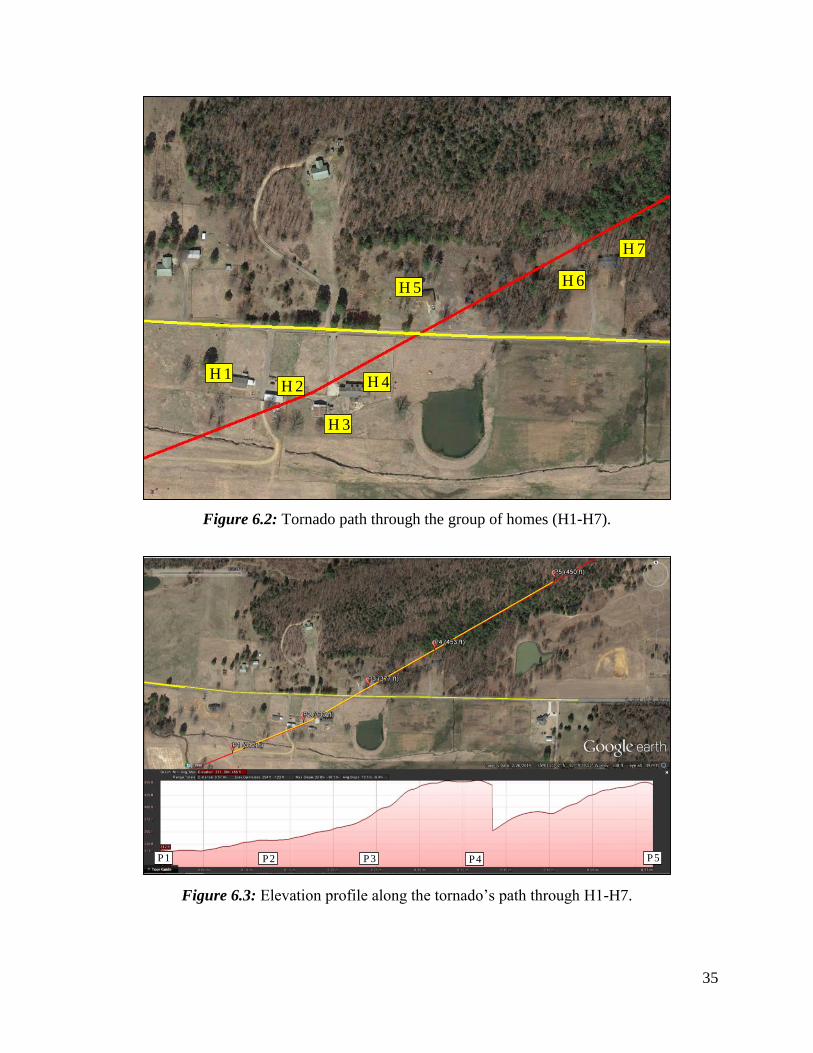
of which are indicated in Figure 6.1. An aerial photograph of the group of homes (H1-H7) is
provided and labeled in Figure 6.2 and the elevation profile along the tornado’s path through the
homes is provided in Figure 6.3.
Figure 6.1: Aerial photograph of the tornado’s damage track after crossing Lake Conway and
identification of damage investigation sight five.
Clinton
Road
Tower
Road
Tornado
Path
Site 5
35
Figure 6.2: Tornado path through the group of homes (H1-H7).
Figure 6.3: Elevation profile along the tornado’s path through H1-H7.
H 5 H 6
H 7
H 4
H 3
H 2 H 1
P 5 P 4 P 3 P 2 P 1
36
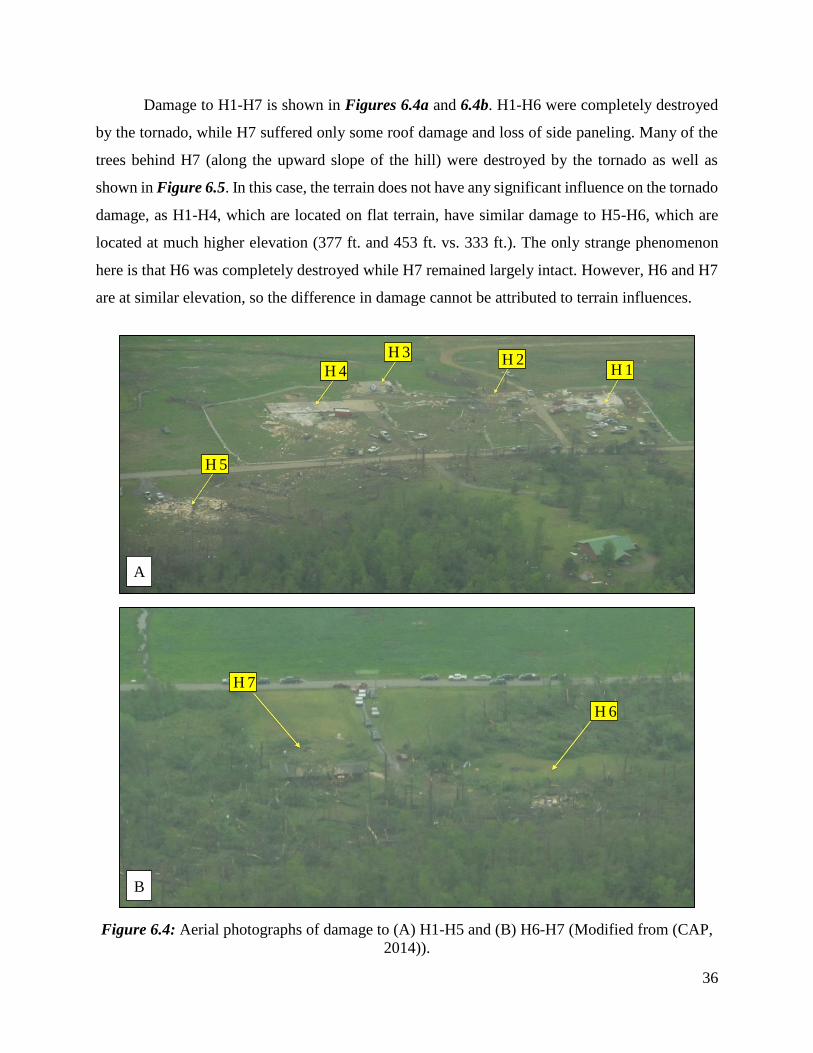
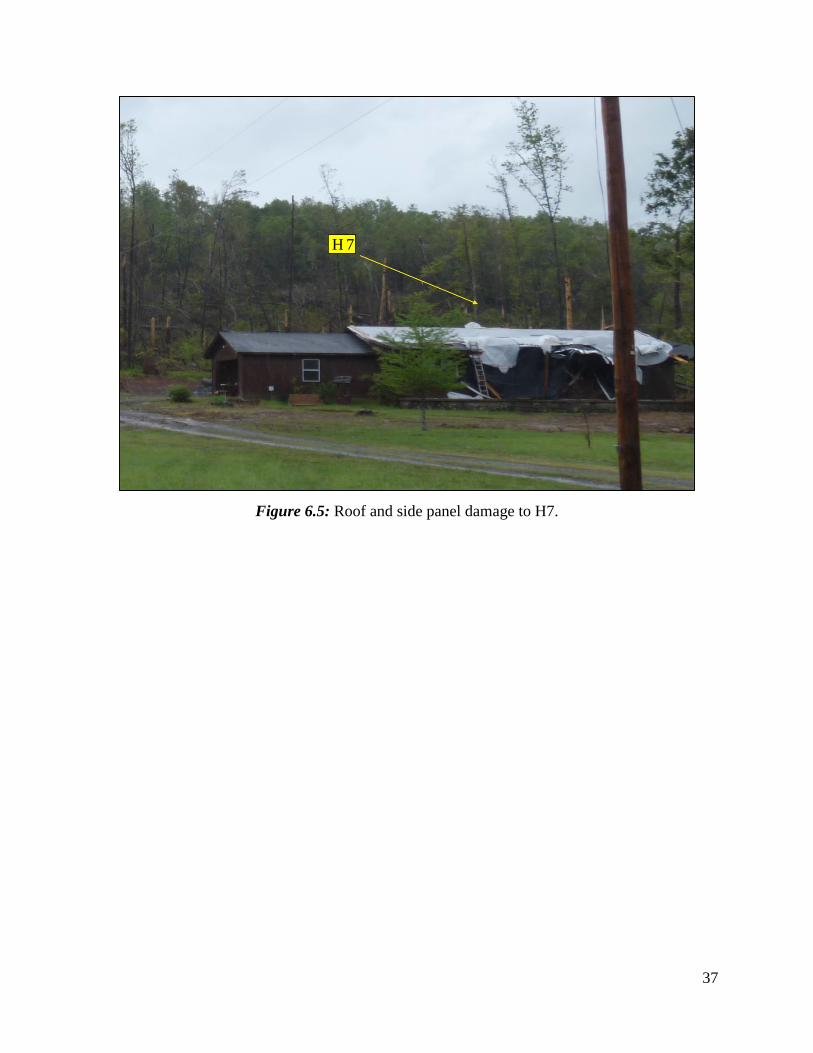
Damage to H1-H7 is shown in Figures 6.4a and 6.4b. H1-H6 were completely destroyed
by the tornado, while H7 suffered only some roof damage and loss of side paneling. Many of the
trees behind H7 (along the upward slope of the hill) were destroyed by the tornado as well as
shown in Figure 6.5. In this case, the terrain does not have any significant influence on the tornado
damage, as H1-H4, which are located on flat terrain, have similar damage to H5-H6, which are
located at much higher elevation (377 ft. and 453 ft. vs. 333 ft.). The only strange phenomenon
here is that H6 was completely destroyed while H7 remained largely intact. However, H6 and H7
are at similar elevation, so the difference in damage cannot be attributed to terrain influences.
Figure 6.4: Aerial photographs of damage to (A) H1-H5 and (B) H6-H7 (Modified from (CAP,
2014)).
H 1
H 5
H 4
H 3 H 2
H 7
H 6
A
B
37
Figure 6.5: Roof and side panel damage to H7.
H 7
38
Chapter 7: Site 6 – Williams Lake & Vilonia Area
The final damage investigation site is in the vicinity of Williams Lake, which is located to
the north-east of Vilonia, AR as indicated in Figure 7.1. Though some residences were damaged
in the vicinity of damage site six, this segment of the damage investigation focuses on the influence
of the topography on the ground-level tornado path.
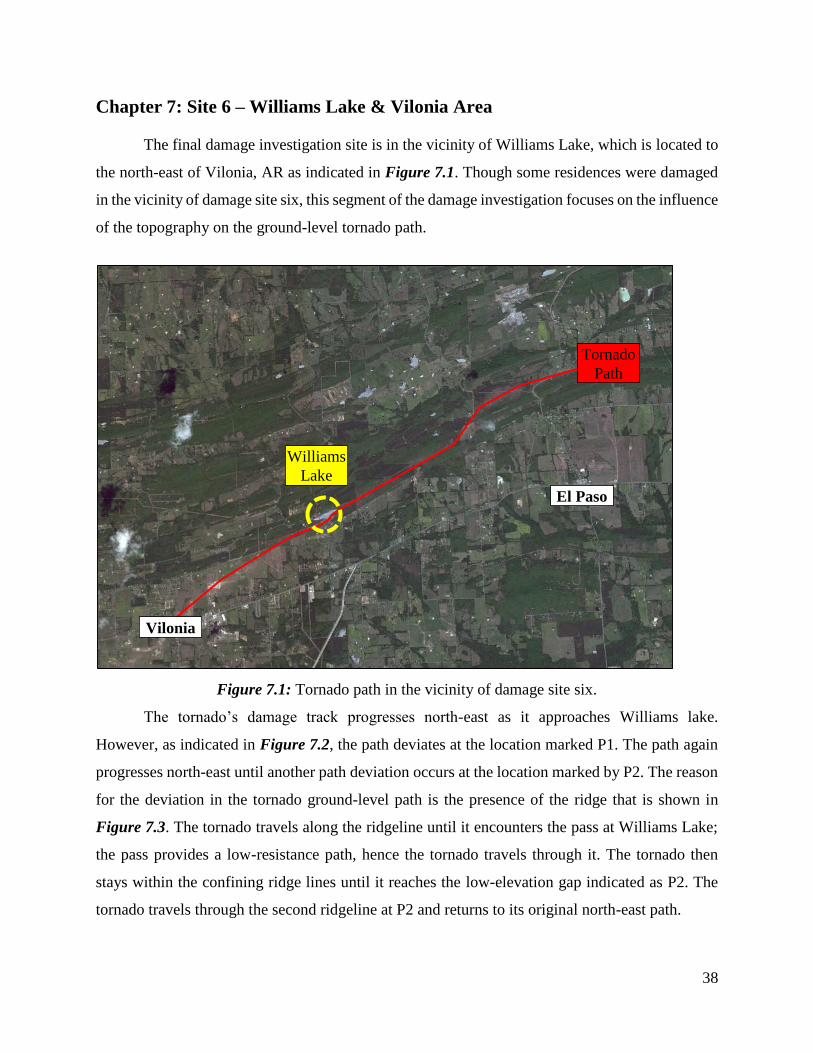
Figure 7.1: Tornado path in the vicinity of damage site six.
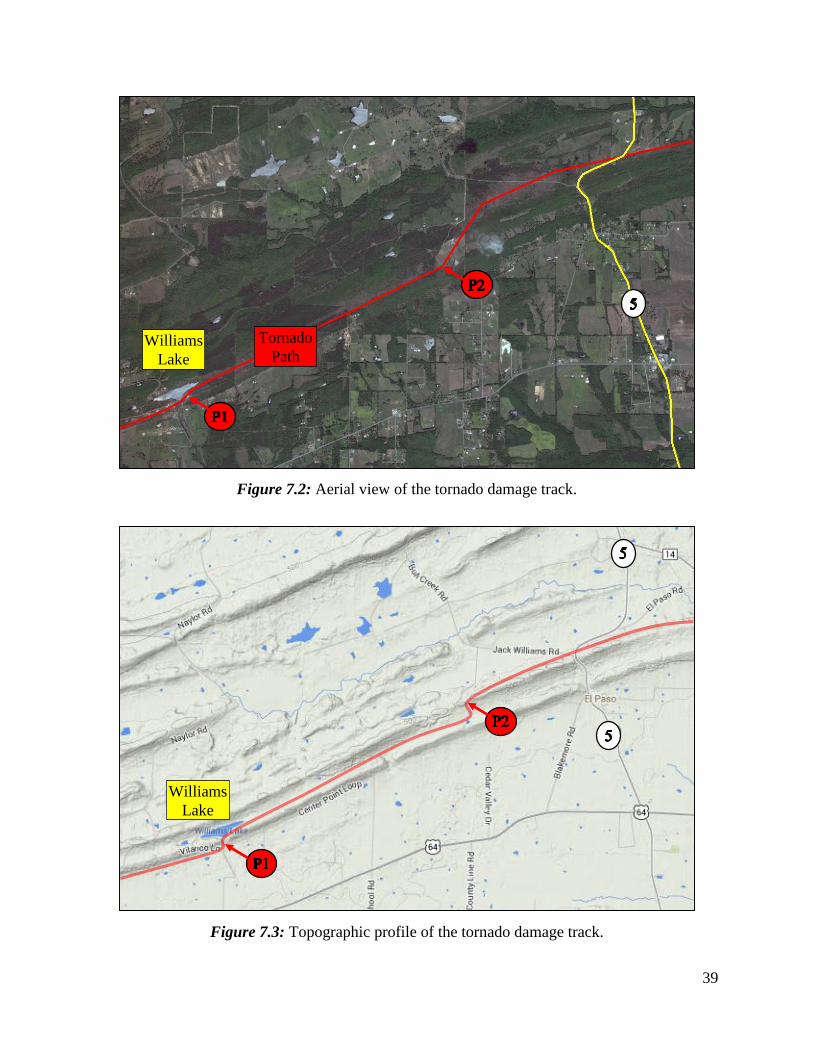
The tornado’s damage track progresses north-east as it approaches Williams lake.
However, as indicated in Figure 7.2, the path deviates at the location marked P1. The path again
progresses north-east until another path deviation occurs at the location marked by P2. The reason
for the deviation in the tornado ground-level path is the presence of the ridge that is shown in
Figure 7.3. The tornado travels along the ridgeline until it encounters the pass at Williams Lake;
the pass provides a low-resistance path, hence the tornado travels through it. The tornado then
stays within the confining ridge lines until it reaches the low-elevation gap indicated as P2. The
tornado travels through the second ridgeline at P2 and returns to its original north-east path.
Vilonia
El Paso
Williams
Lake
Tornado
Path
39
Figure 7.2: Aerial view of the tornado damage track.
Figure 7.3: Topographic profile of the tornado damage track.
Tornado
Path Williams
Lake
Williams
Lake
40
Chapter 8: Analysis of Hilly Terrain Influence on Tornado Path & Damage
8.1 Introduction
The terrain in mayflower region is a mix of hilly terrain, water surface and flat terrain so it
provided the best environment to study terrain influence on tornado behavior near the ground,
terrain effects on tornado path near the ground and terrain effects on tornado damage. Several
observations have been reported in the previous chapters by the UA investigation team, and in this
chapter more comprehensive analysis for terrain effects of tornado damage and path is provided.
8.2 Influence of Hilly Terrain on Tornado Damage
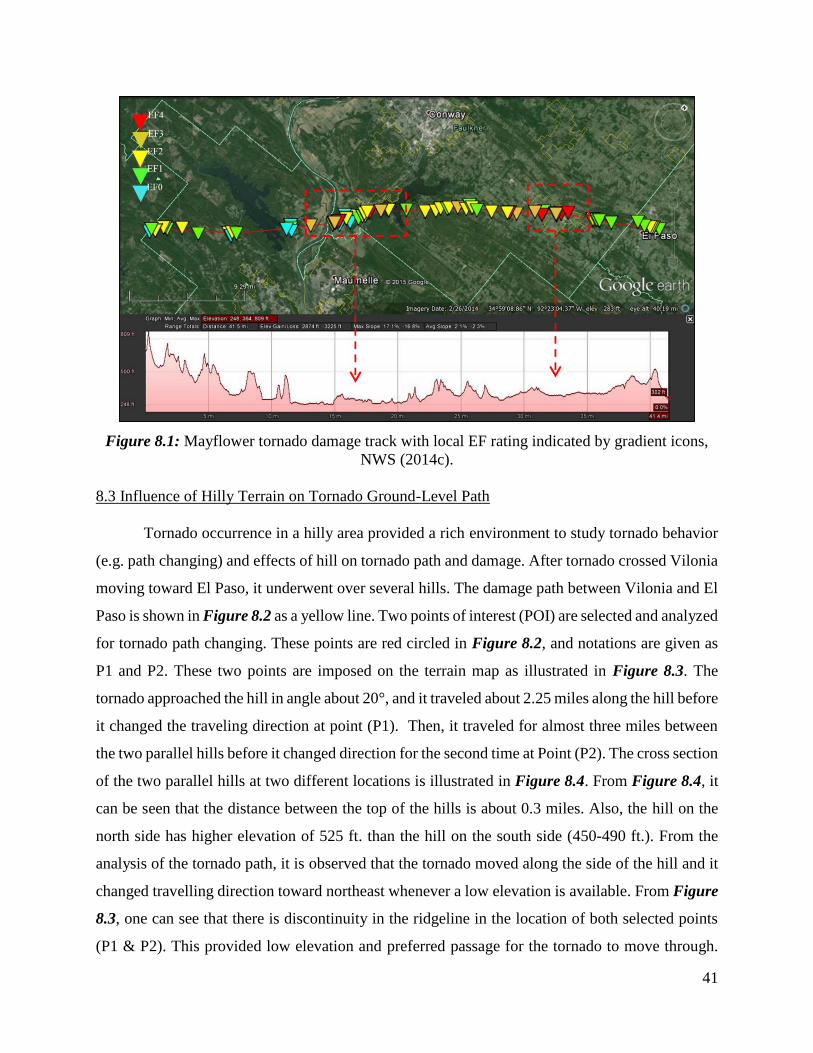
Mayflower tornado path reported by (NWS, 2014c) is shown in Figure 8.1. The tornado
moved from southwest toward northeast. In Figure 8.1, the tornado path and the damage ratings
assigned to different points on the path is rotated to be aligned to the elevation profile of the tornado
travel path. The local EF ratings assigned by the NWS are indicated by gradients. From Figure
8.1, one can see that elevation profile shows great diversity in the terrain along the tornado
traveling path. The EF ratings legend is shown also on the side of the presented Figures. From
Figure 8.1, one can see that the terrain and the tornado EF ratings are varied a lot along the tornado
path. A connection is observed between the tornado intensity (EF rating) and the terrain. The
Damage intensity is observed to be less when the vortex travels over hilly terrain. Damage intensity
is increased when tornado travels over flat terrain or water surfaces. For more details, one can see
Ahmed and Selvam (2015).
41
Figure 8.1: Mayflower tornado damage track with local EF rating indicated by gradient icons,
NWS (2014c).
8.3 Influence of Hilly Terrain on Tornado Ground-Level Path
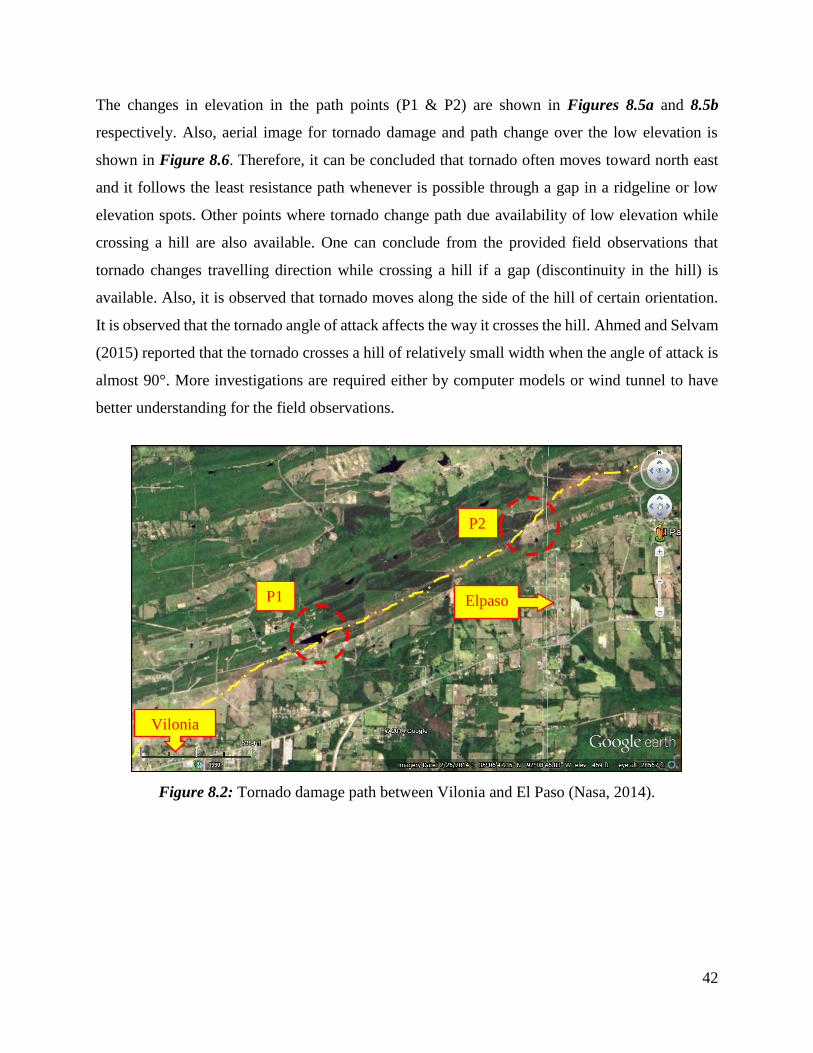
Tornado occurrence in a hilly area provided a rich environment to study tornado behavior
(e.g. path changing) and effects of hill on tornado path and damage. After tornado crossed Vilonia
moving toward El Paso, it underwent over several hills. The damage path between Vilonia and El
Paso is shown in Figure 8.2 as a yellow line. Two points of interest (POI) are selected and analyzed
for tornado path changing. These points are red circled in Figure 8.2, and notations are given as
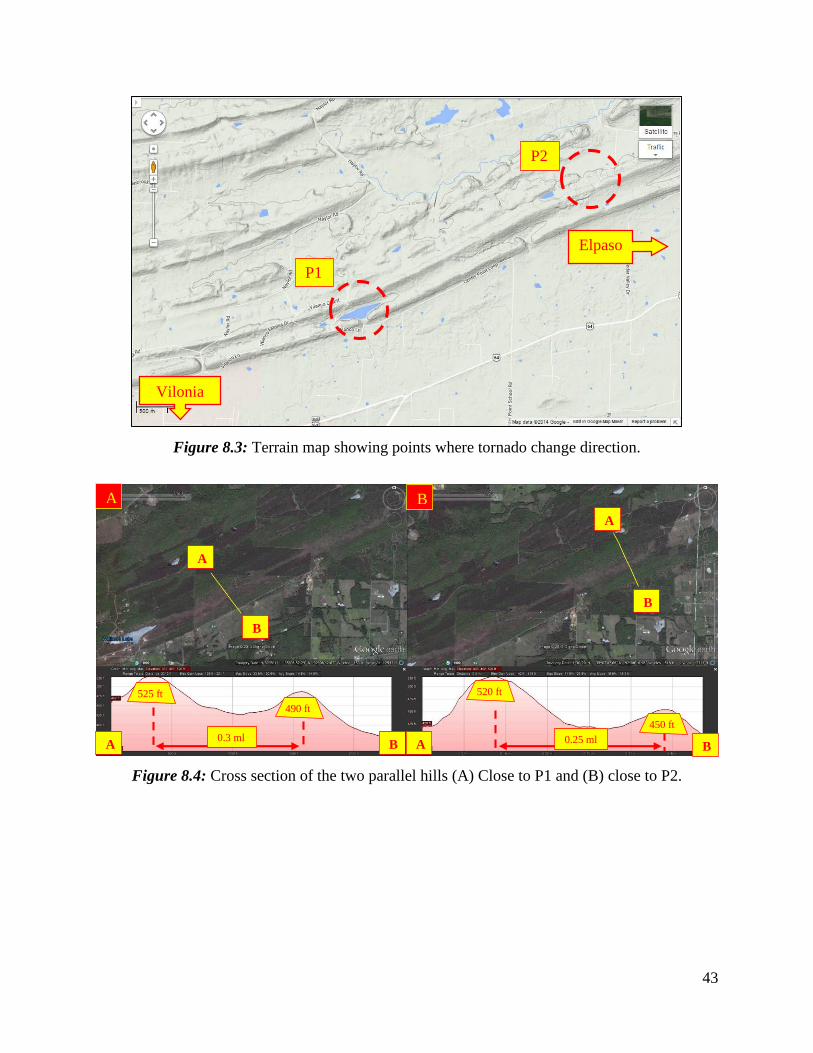
P1 and P2. These two points are imposed on the terrain map as illustrated in Figure 8.3. The
tornado approached the hill in angle about 20°, and it traveled about 2.25 miles along the hill before
it changed the traveling direction at point (P1). Then, it traveled for almost three miles between
the two parallel hills before it changed direction for the second time at Point (P2). The cross section
of the two parallel hills at two different locations is illustrated in Figure 8.4. From Figure 8.4, it
can be seen that the distance between the top of the hills is about 0.3 miles. Also, the hill on the
north side has higher elevation of 525 ft. than the hill on the south side (450-490 ft.). From the
analysis of the tornado path, it is observed that the tornado moved along the side of the hill and it
changed travelling direction toward northeast whenever a low elevation is available. From Figure
8.3, one can see that there is discontinuity in the ridgeline in the location of both selected points
(P1 & P2). This provided low elevation and preferred passage for the tornado to move through.
42
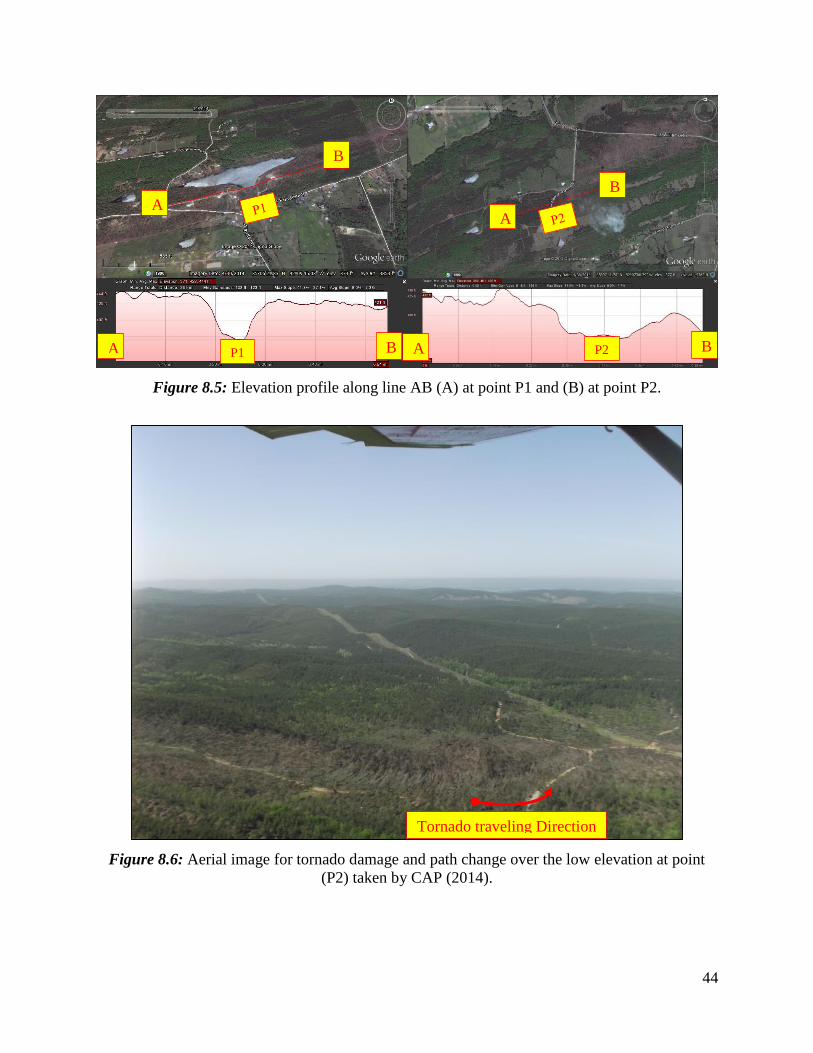
The changes in elevation in the path points (P1 & P2) are shown in Figures 8.5a and 8.5b
respectively. Also, aerial image for tornado damage and path change over the low elevation is
shown in Figure 8.6. Therefore, it can be concluded that tornado often moves toward north east
and it follows the least resistance path whenever is possible through a gap in a ridgeline or low
elevation spots. Other points where tornado change path due availability of low elevation while
crossing a hill are also available. One can conclude from the provided field observations that
tornado changes travelling direction while crossing a hill if a gap (discontinuity in the hill) is
available. Also, it is observed that tornado moves along the side of the hill of certain orientation.
It is observed that the tornado angle of attack affects the way it crosses the hill. Ahmed and Selvam
(2015) reported that the tornado crosses a hill of relatively small width when the angle of attack is
almost 90°. More investigations are required either by computer models or wind tunnel to have
better understanding for the field observations.
Figure 8.2: Tornado damage path between Vilonia and El Paso (Nasa, 2014).
Vilonia
Elpaso P1
P2
43
Figure 8.3: Terrain map showing points where tornado change direction.
Figure 8.4: Cross section of the two parallel hills (A) Close to P1 and (B) close to P2.
P1
P2
Vilonia
Elpaso
A
B
A
B
A B
B A 0.3 ml 0.25 ml
525 ft
490 ft
520 ft
450 ft
A B
44
Figure 8.5: Elevation profile along line AB (A) at point P1 and (B) at point P2.
Figure 8.6: Aerial image for tornado damage and path change over the low elevation at point
(P2) taken by CAP (2014).
A
B
A
B
A B A B P1 P2
Tornado traveling Direction
45
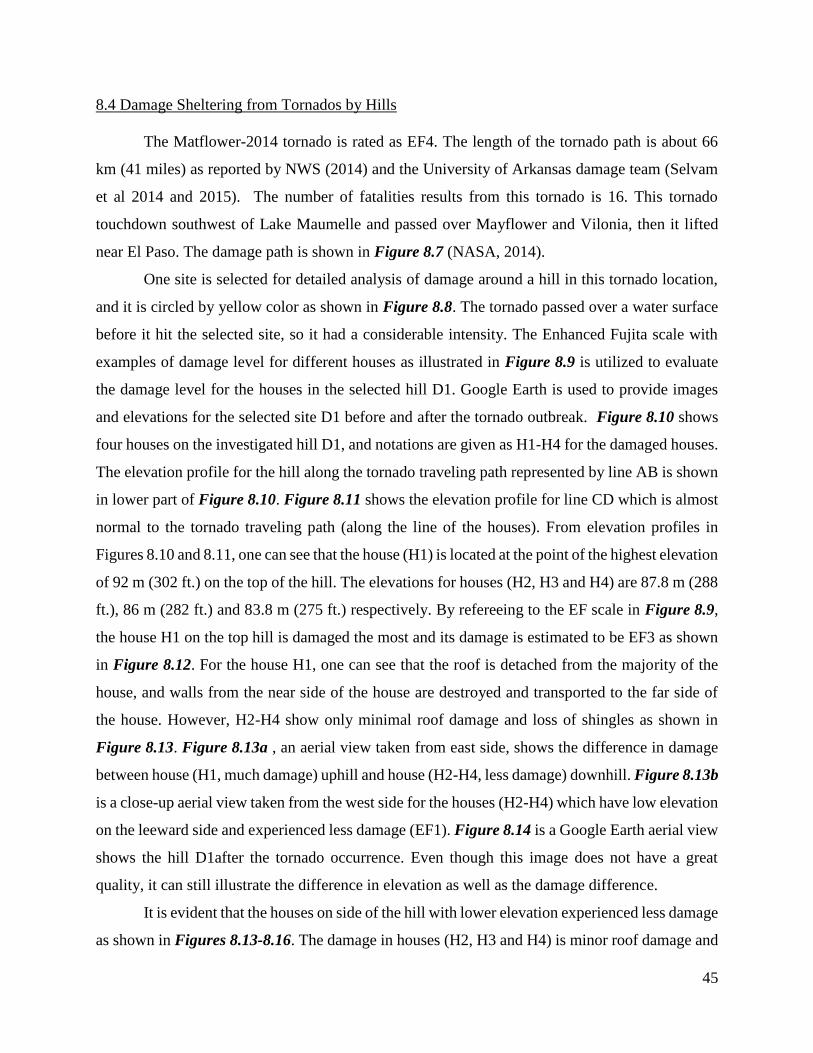
8.4 Damage Sheltering from Tornados by Hills
The Matflower-2014 tornado is rated as EF4. The length of the tornado path is about 66
km (41 miles) as reported by NWS (2014) and the University of Arkansas damage team (Selvam
et al 2014 and 2015). The number of fatalities results from this tornado is 16. This tornado
touchdown southwest of Lake Maumelle and passed over Mayflower and Vilonia, then it lifted
near El Paso. The damage path is shown in Figure 8.7 (NASA, 2014).
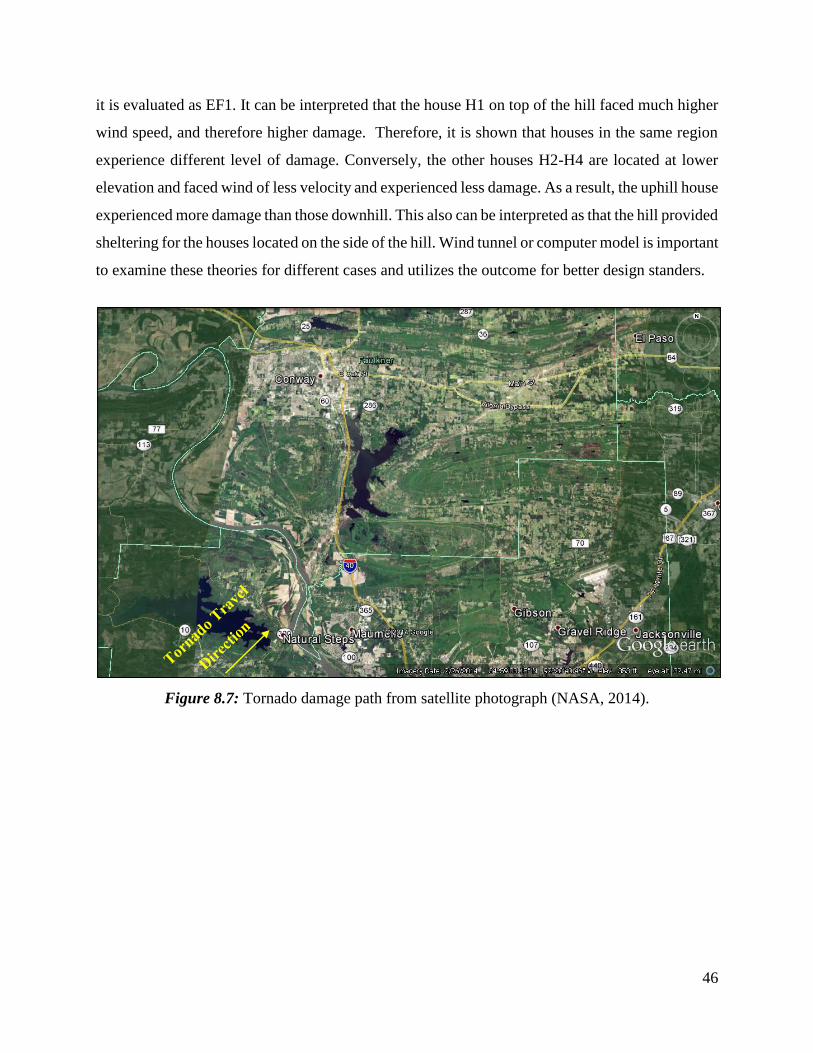
One site is selected for detailed analysis of damage around a hill in this tornado location,
and it is circled by yellow color as shown in Figure 8.8. The tornado passed over a water surface
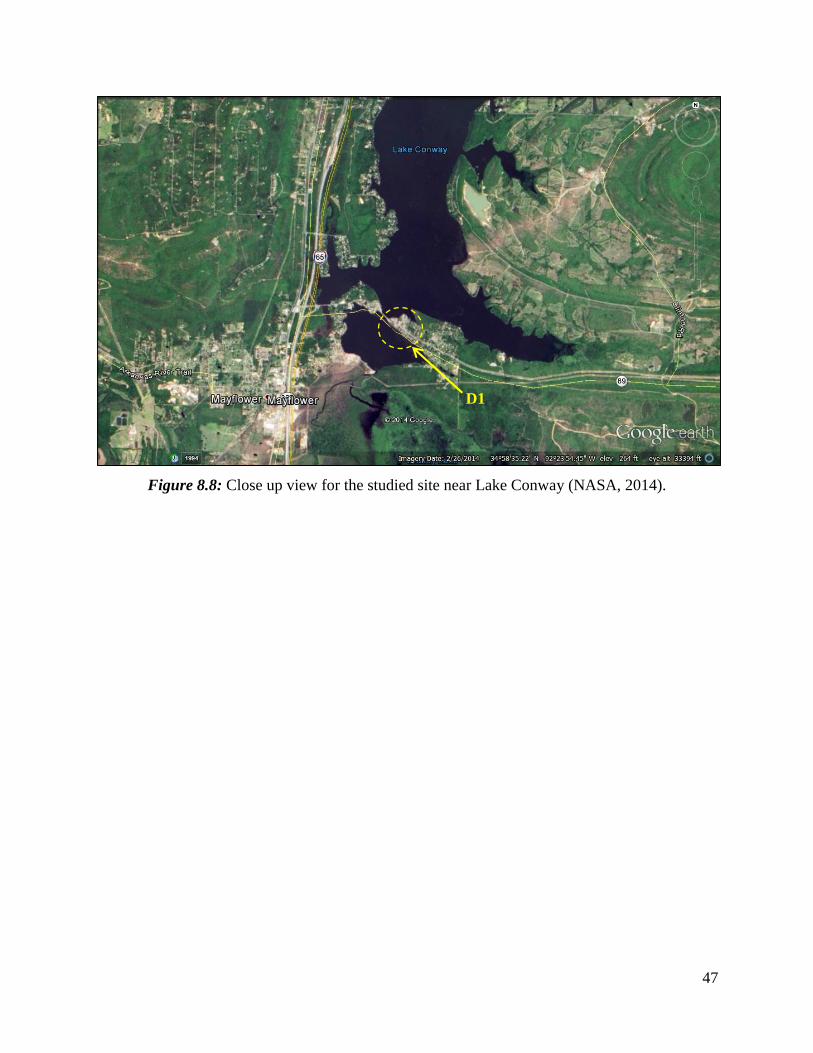
before it hit the selected site, so it had a considerable intensity. The Enhanced Fujita scale with
examples of damage level for different houses as illustrated in Figure 8.9 is utilized to evaluate
the damage level for the houses in the selected hill D1. Google Earth is used to provide images
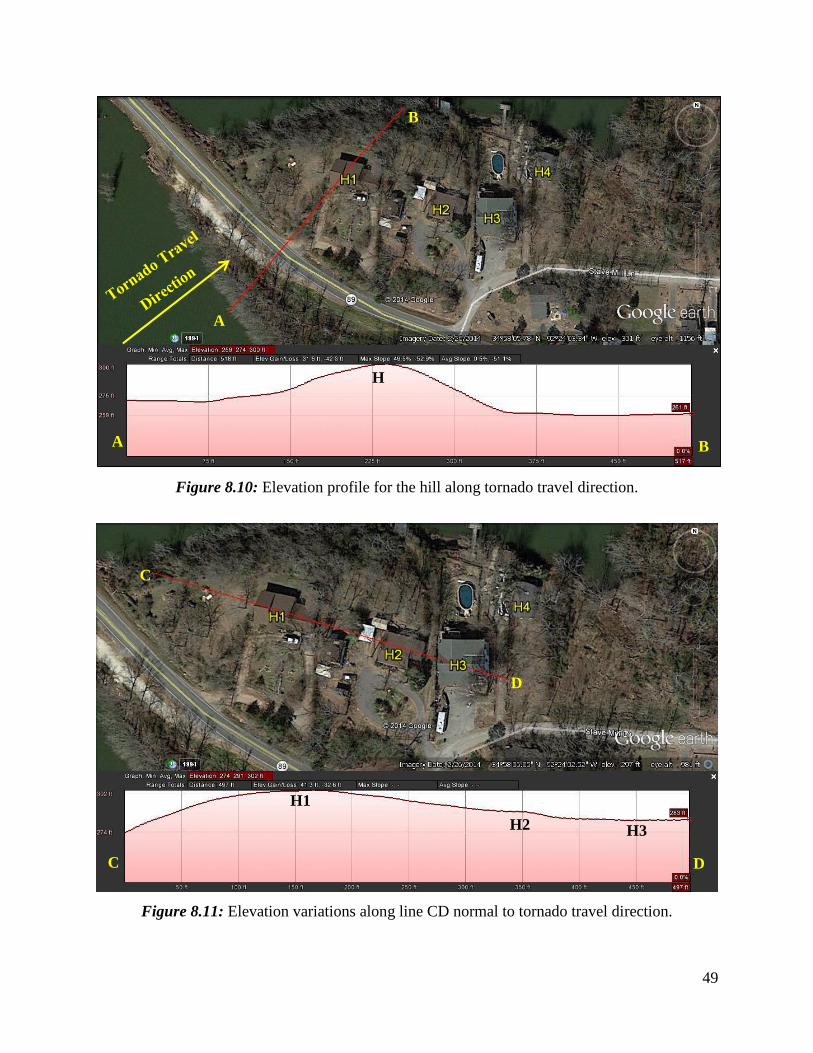
and elevations for the selected site D1 before and after the tornado outbreak. Figure 8.10 shows
four houses on the investigated hill D1, and notations are given as H1-H4 for the damaged houses.
The elevation profile for the hill along the tornado traveling path represented by line AB is shown
in lower part of Figure 8.10. Figure 8.11 shows the elevation profile for line CD which is almost
normal to the tornado traveling path (along the line of the houses). From elevation profiles in
Figures 8.10 and 8.11, one can see that the house (H1) is located at the point of the highest elevation
of 92 m (302 ft.) on the top of the hill. The elevations for houses (H2, H3 and H4) are 87.8 m (288
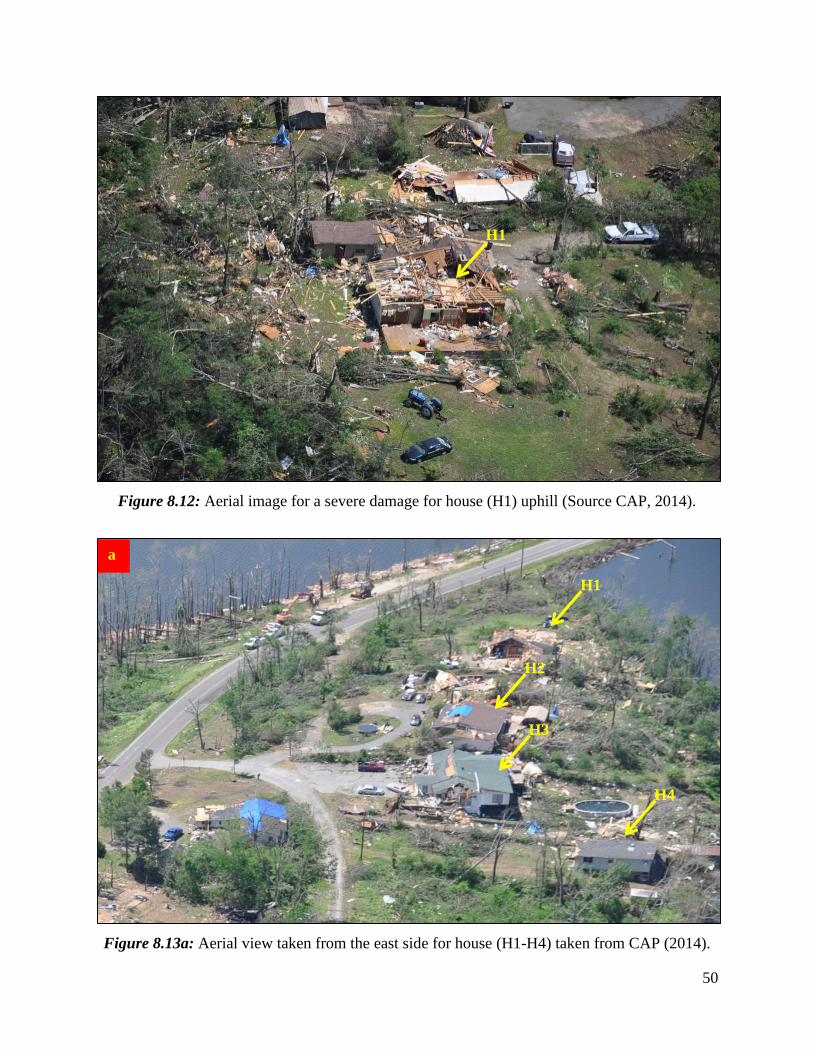
ft.), 86 m (282 ft.) and 83.8 m (275 ft.) respectively. By refereeing to the EF scale in Figure 8.9,
the house H1 on the top hill is damaged the most and its damage is estimated to be EF3 as shown
in Figure 8.12. For the house H1, one can see that the roof is detached from the majority of the
house, and walls from the near side of the house are destroyed and transported to the far side of
the house. However, H2-H4 show only minimal roof damage and loss of shingles as shown in
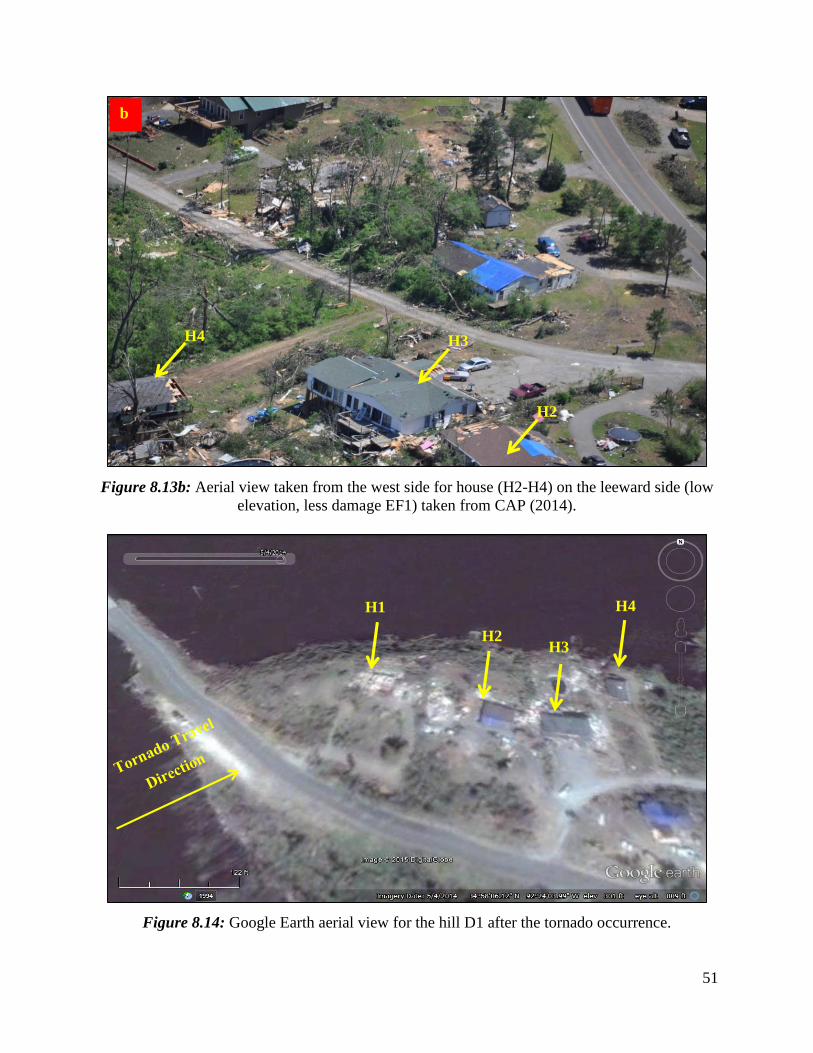
Figure 8.13. Figure 8.13a , an aerial view taken from east side, shows the difference in damage
between house (H1, much damage) uphill and house (H2-H4, less damage) downhill. Figure 8.13b
is a close-up aerial view taken from the west side for the houses (H2-H4) which have low elevation
on the leeward side and experienced less damage (EF1). Figure 8.14 is a Google Earth aerial view
shows the hill D1after the tornado occurrence. Even though this image does not have a great
quality, it can still illustrate the difference in elevation as well as the damage difference.
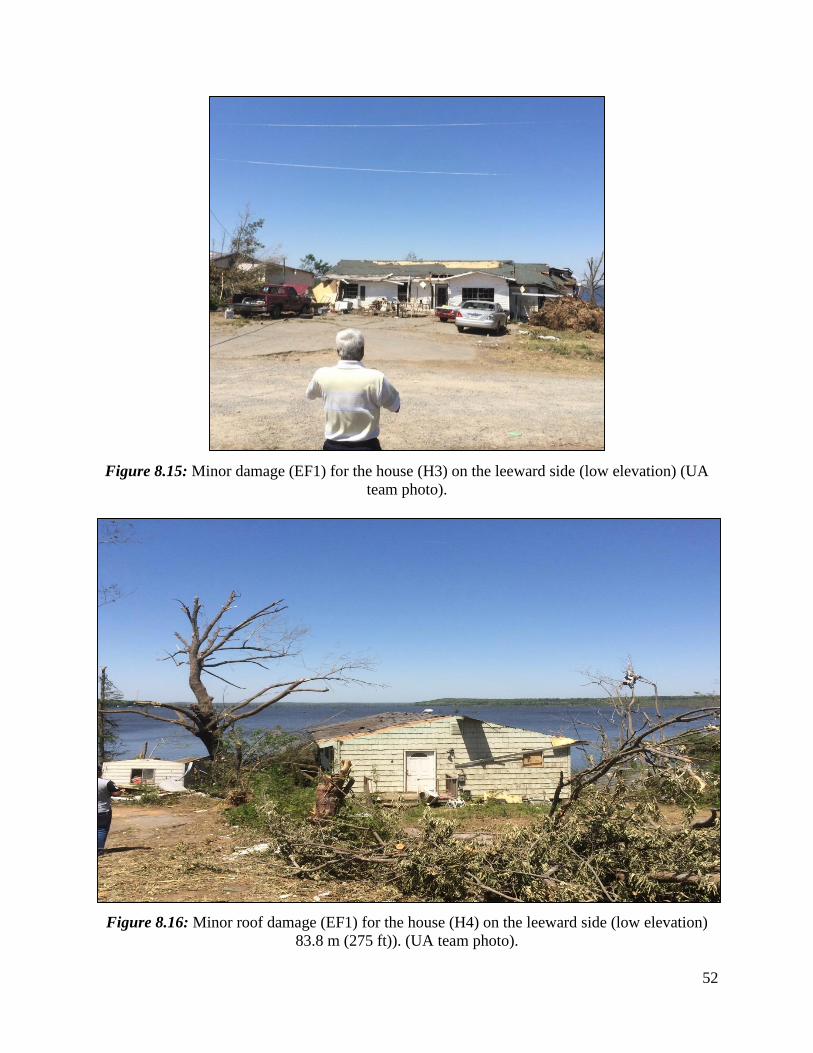
It is evident that the houses on side of the hill with lower elevation experienced less damage
as shown in Figures 8.13-8.16. The damage in houses (H2, H3 and H4) is minor roof damage and
46
it is evaluated as EF1. It can be interpreted that the house H1 on top of the hill faced much higher
wind speed, and therefore higher damage. Therefore, it is shown that houses in the same region
experience different level of damage. Conversely, the other houses H2-H4 are located at lower
elevation and faced wind of less velocity and experienced less damage. As a result, the uphill house
experienced more damage than those downhill. This also can be interpreted as that the hill provided
sheltering for the houses located on the side of the hill. Wind tunnel or computer model is important
to examine these theories for different cases and utilizes the outcome for better design standers.
Figure 8.7: Tornado damage path from satellite photograph (NASA, 2014).
47
Figure 8.8: Close up view for the studied site near Lake Conway (NASA, 2014).
D1
48
Figure 8.9: The Enhanced Fujita (EF) scale damage examples (Taken from Safeguard, 2009).
49
Figure 8.10: Elevation profile for the hill along tornado travel direction.
Figure 8.11: Elevation variations along line CD normal to tornado travel direction.
A B
B
A
H
H1
H2 H3
C D
C
D
50
Figure 8.12: Aerial image for a severe damage for house (H1) uphill (Source CAP, 2014).
Figure 8.13a: Aerial view taken from the east side for house (H1-H4) taken from CAP (2014).
H1
a
H1
H2
H3
H4
51
Figure 8.13b: Aerial view taken from the west side for house (H2-H4) on the leeward side (low
elevation, less damage EF1) taken from CAP (2014).
Figure 8.14: Google Earth aerial view for the hill D1 after the tornado occurrence.
b
H3 H4
H2
H4
H3 H2
H1
52
Figure 8.15: Minor damage (EF1) for the house (H3) on the leeward side (low elevation) (UA
team photo).
Figure 8.16: Minor roof damage (EF1) for the house (H4) on the leeward side (low elevation)
83.8 m (275 ft)). (UA team photo).
53
Chapter 9: Conclusions
Damage investigation of the tornado in Mayflower, AR in April 2014, is conducted.
Ground and aerial investigation data is gathered and analyzed. Computer software are utilized for
data synchronization, and the following conclusions are arrived:
• There is substantial influence of terrain on tornado damage.
• The Damage rating is observed to be less when the tornado travels over hilly terrain.
The average damage rating over a hilly terrain is estimated less than EF2, while it is
almost EF4 where the terrain is flat.
• Damage intensity is increased when tornado travels over flat terrain or water surfaces.
• When tornado travels over flat terrain or water surfaces, it maintains high devastating
power and produces huge ruin (EF4).
• Tornado traveling path is greatly affected by the presence of the hilly terrain, and it
leads to alter the tornado path in certain circumstances.
• It is detected from the observations that when tornado approaches a hill with angle of
attack less than 30° , it is more likely that the tornado travels on the side of the hill,
along the hill, rather than crossing it.
• When travelling over hilly terrain, Tornados tend to find a gap and travel through it
following the least resistance path.
• There is significant effect of hills on tornado damage, and much damage is observed
on windward side of a hill comparing to its leeward side.
• When a tornado crosses a hill, the hill provides sheltered zone on its leeward side
• The tornado damage observed uphill is higher than the damage observed downhill for
the same region hit by a tornado.
54
Acknowledgments
The authors would like to acknowledge the National Science Foundation for their support through
their RAPID grants program under #CMMI 1445676. The content of this report solely reflects the
views of the authors and not the National Science Foundation.
The authors acknowledge the information (aerial photographs, videos, etc.) provided by Mr. John
Lewis, National Weather Service, Little Rock, AR and Ms. Sheila Annable, Arkansas Department
of Emergency Management.
The authors also acknowledge the radar images provided by Mr. Dan Skoff, Chief Meteorologist,
KNWA (NBC) & KFTA (FOX 24), Fayetteville.
55
References
Ahmed, N., & Selvam, R.P., (2015). Hilly Terrain Effects on Tornado Damage and Path, In
Review with J. Wind & Structures.
ARCgis (2014), Damage Track and Timeline:
https://disastermapping.maps.arcgis.com/apps/MapTour/index.html?appid=78c5a5ed38204aac
92e0ef2a2b8f1288&webmap=d9bdb352021147e3b5256d0ab42c33bf.
ArkansasOnline (2014), Death Locations:
http://www.arkansasonline.com/news/2014/apr/28/names-arkansas-tornado-victims-released/.
CAP (2014), Civil Air Patrol, Aerial Photos:
http://dev.femadata.com/CAPUploadHandler/Files/37/d70e97da-f0f9-46f7-b9da-
3e3218aaa068.jpg.
NASA (2014), Damage Track: http://earthobservatory.nasa.gov/IOTD/view.php?id=83612.
NWS (2014a), Damage Track (Google Earth): http://www.srh.noaa.gov/lzk/?n=svr0414c.htm.
NWS (2014b), Tornado Information (Size, Rating, Wind-speed, etc.):
http://www.srh.noaa.gov/images/lzk/gis/April_27_2014c.km.
NWS (2014c), Damage sites investigated by NWS, LR, from:
http://www.srh.noaa.gov/images/lzk/gis/tor042714a.kml.
Safeguard (2009). Safeguard Storm Shelters - Fujita Scale. Safeguard Storm Shelters - Fujita
Scale. Retrieved October 21, 2014, from
http://www.safeguardshelters.com/fujitascale.php.