Embed Size (px)
Citation preview
The Cryosphere, 11, 2691–2710, 2017https://doi.org/10.5194/tc-11-2691-2017© Author(s) 2017. This work is distributed underthe Creative Commons Attribution 3.0 License.
Rapidly changing subglacial hydrological pathways at a tidewaterglacier revealed through simultaneous observations of waterpressure, supraglacial lakes, meltwater plumes and surface velocitiesPenelope How1,2, Douglas I. Benn3, Nicholas R. J. Hulton1,2, Bryn Hubbard4, Adrian Luckman5,6, Heïdi Sevestre3,Ward J. J. van Pelt7, Katrin Lindbäck8, Jack Kohler8, and Wim Boot9
1Institute of Geography, School of GeoSciences, University of Edinburgh, Edinburgh, UK2Department of Arctic Geology, University Centre in Svalbard, Longyearbyen, Norway3School of Geography and Sustainable Development, University of St. Andrews, Fife, UK4Centre for Glaciology, Department of Geography and Earth Sciences, Aberystwyth University, Aberystwyth, UK5Department of Geography, College of Science, Swansea University, Swansea, UK6Department of Arctic Geophysics, University Centre in Svalbard, Longyearbyen, Norway7Department of Earth Sciences, Uppsala University, Uppsala, Sweden8Norwegian Polar Institute, Tromsø, Norway9Institute of Marine and Atmospheric Research, Utrecht University, Utrecht, the Netherlands
Correspondence to: Penelope How ([email protected])
Received: 22 April 2017 – Discussion started: 11 May 2017Revised: 6 October 2017 – Accepted: 15 October 2017 – Published: 21 November 2017
Abstract. Subglacial hydrological processes at tidewaterglaciers remain poorly understood due to the difficulty inobtaining direct measurements and lack of empirical veri-fication for modelling approaches. Here, we investigate thesubglacial hydrology of Kronebreen, a fast-flowing tidewaterglacier in Svalbard during the 2014 melt season. We combineobservations of borehole water pressure, supraglacial lakedrainage, surface velocities and plume activity with modelledrun-off and water routing to develop a conceptual model thatthoroughly encapsulates subglacial drainage at a tidewaterglacier. Simultaneous measurements suggest that an early-season episode of subglacial flushing took place during ourobservation period, and a stable efficient drainage system ef-fectively transported subglacial water through the northernregion of the glacier tongue. Drainage pathways through thecentral and southern regions of the glacier tongue were dis-rupted throughout the following melt season. Periodic plumeactivity at the terminus appears to be a signal for modulatedsubglacial pulsing, i.e. an internally driven storage and re-lease of subglacial meltwater that operates independently ofmarine influences. This storage is a key control on ice flowin the 2014 melt season. Evidence from this work and previ-ous studies strongly suggests that long-term changes in ice
flow at Kronebreen are controlled by the location of effi-cient/inefficient drainage and the position of regions wherewater is stored and released.
1 Introduction
Subglacial hydrological processes at tidewater glaciers re-main poorly understood due to the difficulty in obtaining di-rect measurements. Borehole data provide spatially limitedinformation and are often problematic in terms of relatingdiscrete findings to glacier-wide processes. Modelling ap-proaches can approximate the hydrological inputs and rout-ing of subglacial meltwater beneath the glacier but com-monly lack empirical verification. In recent years, studieshave focused on indirect measurements to advance under-standing of these processes, most prominently in terms ofinvestigating supraglacial lake levels and the surface expres-sions of submarine meltwater plumes (e.g. Everett et al.,2016; Slater et al., 2017). However, simultaneous measure-ments of all these manifestations of the subglacial system arerare (e.g. Kamb et al., 1994; Sugiyama et al., 2011).
Published by Copernicus Publications on behalf of the European Geosciences Union.
2692 P. How et al.: Subglacial hydrology at a tidewater glacier
In this paper we adopt four complementary approaches toreconstruct the subglacial hydrology of Kronebreen, a fast-flowing tidewater glacier in Svalbard, over the summer meltseason of 2014: (i) borehole data to document subglacialwater-pressure changes, (ii) time-lapse photogrammetry torecord supraglacial water storage and drainage and meltwa-ter plume activity at high temporal resolution, (iii) modelledsurface melt, run-off and subglacial hydraulic potential to in-vestigate meltwater generation and routing and (iv) surfacevelocities from analysis of satellite image pairs to examinesubglacial hydrology in relation to glacier dynamics.
2 Background
The presence of subglacial meltwater is understood to gov-ern the basal water pressure at the bed of a glacier (Meier etal., 1994; Bartholomew et al., 2010). Measurements of waterpressure via boreholes and moulins reflect complex changesin bed dynamics over time (e.g. Kavanaugh, 2009). Simi-larities and differences between borehole pairs have previ-ously been used to diagnose and characterise local bed envi-ronments (e.g. Hubbard et al., 1995; Lefeuvre et al., 2015).Temporal variations, such as diurnal oscillations and rapidchanges (i.e. changes between 0 and 12 h), have been linkedto changes in subglacial hydrology, such as conduit growth,reorganisation of meltwater pathways and pulsing relatedto episodic ice motion (e.g. Murray and Clarke, 1995; Ka-vanaugh and Clarke, 2001; Schoof et al., 2014). Consistentlyhigh basal water pressures have also been observed over longperiods of the melt season (e.g. Meier and Post, 1987; Jans-son, 1995). It has been suggested that this is associated withmeltwater storage in distributed regions of the subglacialzone. It has also been attributed to basal hydraulic systemsthat do not operate at atmospheric pressure, such as at lake-terminating and tidewater glaciers, where there is an ineffi-cient evacuation of meltwater, because the hydraulic gradientis small (e.g. Sugiyama et al., 2011).
Changes in basal water pressures have been linked toenhanced basal sliding and surface velocities at land-terminating Greenland outlets and valley glaciers. Veloci-ties typically increase at the beginning of the melt season,which is associated with an influx of surface meltwater to thesubglacial environment (Nienow et al., 1998; Howat et al.,2005). Ice velocities stabilise or fall later in the melt season inresponse to subglacial drainage re-organisation (i.e. changesin the network of channelised and distributed drainage path-ways at the beginning and end of the melt season) and the es-tablishment of efficient channels that reduce water pressureat the bed (Iken and Truffer, 1997; Hewitt, 2013). Precipita-tion can disrupt drainage due to the high influx of water overa short period of time, in some cases causing it to speed updue to the timing of high-rainfall events in relation to a meltseason (e.g. Doyle et al., 2015). However, first-hand investi-gations of the role of subglacial hydrology at the terminus re-
gion of tidewater glaciers remain virtually absent (e.g. Kambet al., 1994; Doyle et al., 2017).
In recent years, modelling approaches have been adoptedto simulate bed dynamics at tidewater glaciers. Ice veloc-ity and basal water pressure are typically calculated sepa-rately before linking them together to create a unifying model(e.g. Schoof, 2010; Pimentel and Flowers, 2011). This workshows promise in representing the evolution of the subglacialhydro-dynamic environment. However, implementations ofthis approach are still imperfect as outputs do not alwaysmatch real-world ice velocities (e.g. Werder et al., 2013).Difficulties lie in simulating water pressure in response tochanging water transport and storage and in simulating theconnection between water pressure and basal sliding (Buelerand van Pelt, 2015).
As outlined above, meltwater typically enters the sub-glacial environment from the glacier surface via surfacemelt production. Melt can collect as supraglacial lakes onthe glacier surface in topographically low areas where thereare few or no drainage pathways. These lakes drain whenthey become connected to the bed by mechanical processessuch as hydro-fracturing (Van der Veen, 2007), providingan abrupt injection of meltwater to the subglacial environ-ment. Water in supraglacial lakes can also be sourced fromthe subglacial zone when water pressure at the bed exceedsice overburden, effectively squeezing subglacial water up tothe glacier surface. This water often contains entrained sub-glacial sediment, giving the lake a turbid appearance. Wheresuch connections exist, the water level can be used as a mea-sure of basal water pressure (Danielson and Sharp, 2013).
The pattern of supraglacial lake drainage is linked to basalwater pressure and ice velocity. Supraglacial lakes in the in-terior regions of south-western Greenland typically drain atprogressively higher altitudes over the melt season (e.g. Sun-dal et al., 2009; Clason et al., 2015). Conversely, lakes havealso been observed to drain in a down-glacier progression,although such instances are less common (e.g. Everett et al.,2016). However, many of these observations are based ontemporally intermittent records (e.g. low repeat-pass satelliteimagery). Improved observations (i.e. at a higher temporalresolution) of supraglacial lake drainage events are neededto better understand the differences between near-terminusand inland lake drainage patterns and gain greater insightinto their influence on the subglacial environment in tidewa-ter glacier settings.
The hydraulic routing and residency time of subglacialmeltwater largely depends on the properties of the bed (Hub-bard and Nienow, 1997). In near-terminus settings, a rapidinput of meltwater has been observed to increase the effi-ciency of a channelised system by enlarging channels to ac-commodate the extra meltwater (Andrews et al., 2014). Ifmelt volumes increase due to a warming climate, this canlead to a reduction in ice velocity over decadal timescales aspressure falls in an efficient channelised configuration (Ted-stone et al., 2015). Below thick ice in the interior of an ice
The Cryosphere, 11, 2691–2710, 2017 www.the-cryosphere.net/11/2691/2017/
P. How et al.: Subglacial hydrology at a tidewater glacier 2693
sheet, channels cannot grow as rapidly or sensitively to pointinputs, and water evacuation is less efficient. Although di-rectly observing it is challenging, studies have suggested thatwater is stored at the bed for longer periods of time in thesesettings, causing localised areas of ice to uplift from the bedfor up to 48 h (e.g. Stevens et al., 2013).
Meltwater typically leaves the glacier via large subglacialchannels that exit at the glacier terminus. At land-terminatingglaciers, this meltwater flows through proglacial streams. Inocean-terminating settings, meltwater commonly exits as afresh (and therefore buoyant) turbulent plume, the dynamicsof which are driven by the density contrasts between thecold, fresh glacial water and warmer, saline seawater.A plume can reach neutral buoyancy at depth or rise tothe ocean surface depending on the discharge rate, fjordgeometry and the density of the adjacent sea water column(Slater et al., 2015). Plumes promote submarine meltingat the terminus as they increase the transfer of heat fromthe ocean to the submarine part of the ice front, drawing inwarm water from the fjord (Straneo et al., 2010; Cowtonet al., 2015). Submarine melting and changes in boundaryconditions at the calving terminus have been linked to iceacceleration (e.g. Nick et al., 2009) and periods of enhancedglacier retreat (e.g. Luckman et al., 2015; Vallot et al., 2017).
The surface expression of plumes has previously beenused as an indication of discharge rate and to infer thesubglacial drainage network configuration in the near-terminus zone. Surfacing plumes have largely been ob-served from satellite (e.g. Darlington, 2015; Bartholomauset al., 2016) and/or time-lapse imagery (e.g. Schild et al.,2016; Slater et al., 2017). However, there are few mea-surements of the size, number and locations of plume-related channels (Fried et al., 2015). It is also challeng-ing to acquire a sufficiently high temporal frequency ofimages to capture typical rates of change in plume be-haviour. It is therefore likely that plumes are change-able and much more dynamic than previously considered.
3 Study area
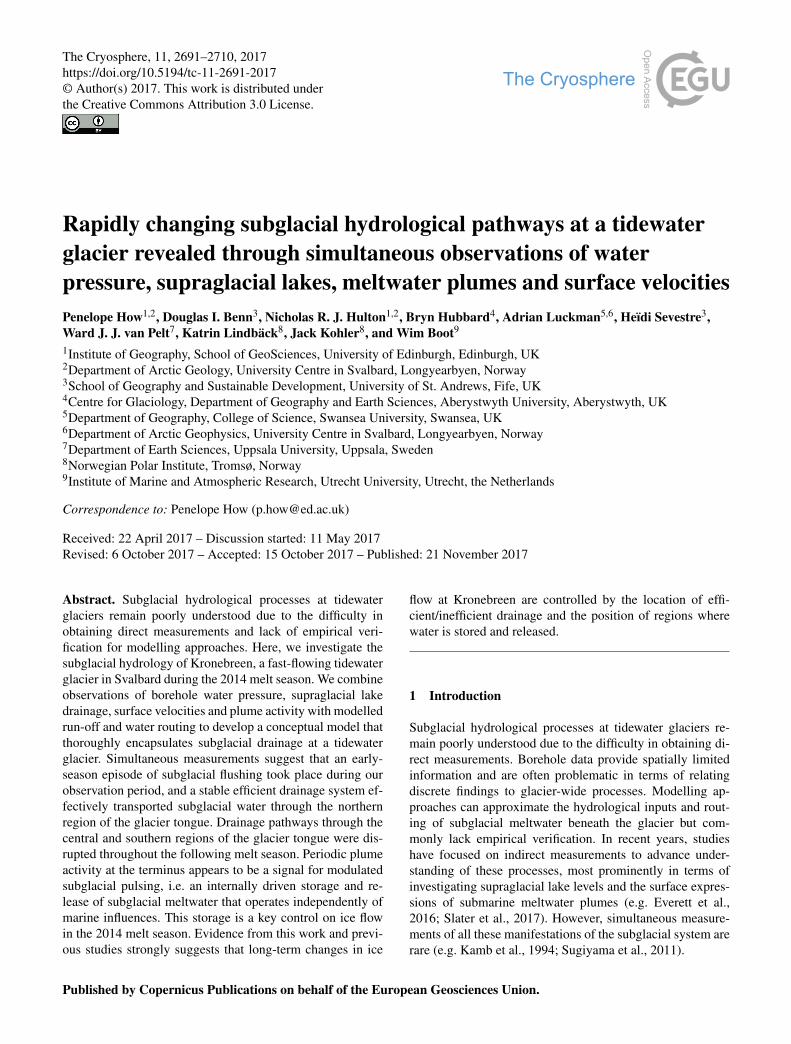
Kronebreen is a fast-flowing, tidewater glacier on the westcoast of Spitsbergen, Svalbard (78.8◦ N, 12.7◦ E) (Fig. 1).The glacier consists of a heavily crevassed tongue fed by twoice fields: Holtedahlfonna and Infantfonna. The total area ofthe glacier catchment is 295.5 km2, with a maximum lengthof 49.25 km that spans an elevation range of 1345 m (Kargelet al., 2014). The glacier tongue exhibits consistently highsurface velocities, making it the fastest non-surging glacierin Svalbard. Velocities near the terminus are typically 1.5–2 m d−1 during the winter season and peak at 3–4 m d−1 inthe summer (Kääb et al., 2005; Eiken and Sund, 2012; Luck-man et al., 2015). The seasonal speed-up propagates from the
Figure 1. Kronebreen, a tidewater glacier situated in Kongsfjorden,Svalbard. The glacier consists of an 8 km-long tongue fed by two icefields, Holtedahlfonna and Infantfonna. Numbered locations refer tothe 2014 time-lapse camera sites, the star marks the location of theborehole drill site, and the coloured boxes refer to the three lakeclusters visible from camera sites 3 and 5. Landsat imagery takenon 11 June 2014.
front of the glacier, which is argued to be largely driven bybasal lubrication (Schellenberger et al., 2015; Vallot et al.,2017). There is a clear contrast in surface velocity betweenthe lower section of the tongue and its upper section, con-trolled by a high-point in the bed topography approximately4 km from the terminus (Vallot et al., 2017).
Kronebreen discharges into Kongsfjorden, an Arctic fjordaffected by the West Spitsbergen Current (WSC). The WSCdrives warm, saline Atlantic water into the interior Arctic, al-lowing a large influx of warm ocean water into Kongsfjorden.Calving activity persists throughout the year due to the pres-ence of warm subsurface ocean water, even in the winter sea-son, although there are large seasonal variations (Luckmanet al., 2015). The mean annual calving rate has increased inrecent years to 0.20± 0.05 km3 yr−1 (1905–2007), coincid-ing with increasingly negative surface mass balance (Köh-ler et al., 2012; Nuth et al., 2012). Kronebreen is currentlyin a period of rapid retreat, having receded ∼ 1 km between2011 and 2016. Strong correlation between bulk calving ratesand fjord water temperature indicates that this retreat pri-marily reflects melting of the glacier front beneath the wa-terline (Köhler et al., 2012; Luckman et al., 2015; Vallot etal., 2017).
www.the-cryosphere.net/11/2691/2017/ The Cryosphere, 11, 2691–2710, 2017
2694 P. How et al.: Subglacial hydrology at a tidewater glacier
4 Methods
4.1 Time-lapse photogrammetry
A network of time-lapse cameras was installed on two ridgesadjacent to Kronebreen (Colletthøgda and Garwoodtoppen)to gain full coverage over the glacier tongue (Fig. 1). Eachtime-lapse system consisted of a Canon 600D camera body,an EF-S 18–55 mm f/3.5–5.6 IS II zoom lens and a Har-bortronics Digisnap 2700 intervalometer, which was pow-ered by a 12 V DC battery and a 10 W solar panel. Eachsystem captured images every 30 min from 30 April to30 September 2014. Of the five cameras that successfullyacquired images throughout the season, one trained on theterminus obtained coverage of surfacing meltwater plumes(Site 1, Fig. 1) and two positioned farther up-glacier capturedsurface lake filling and drainage events (sites 3 and 5, Fig. 1).
Photogrammetric processing was undertaken using PyTrx,a Python-based suite of photogrammetric tools specificallydesigned for obtaining measurements from time-lapse im-agery of glacial environments. PyTrx largely uses processingfunctions from the OpenCV computer vision toolbox (http://opencv.org/) and georectification tools based on those avail-able in ImGRAFT (http://imgraft.glaciology.net/) (Messerliand Grinsted, 2015). Primarily, the suite was used to ex-tract real-world areas and distances from sequential time-lapse imagery, with a particular focus on the extraction ofhigh-frequency interval measurements. This is achieved byprojecting features observed in the 2-D camera image ontotheir equivalent real-world positions based on camera posi-tion and pose, camera lens characteristics and a digital ele-vation model (DEM) of the observed scene. It is intended tomake PyTrx publicly available at a later date.
Several additional data sets were collected to translatemeasurements from the image plane to three-dimensionalspace. Camera locations were measured using a TrimbleGeoXR GPS rover linked to a SPS855 base station locatedat Ny Ålesund. Positions were differentially post-processedin a kinematic mode over a∼ 15 km baseline using the Trim-ble Business Centre software to obtain an average horizontalpositional accuracy of 1.15 m and an average vertical accu-racy of 1.92 m. Ground control points (GCPs) were derivedfrom known XYZ locations in the camera field of view. ADEM was obtained from airborne photogrammetric survey-ing in 2008 by the Norwegian Geodetic Survey, with a 10 mresolution. This DEM was smoothed using a linear interpo-lation approach to reduce discrepancies between the glaciersurface in 2008 and in 2014. Data could thus be projectedonto a homogenous surface (i.e. flattened and without abruptchanges/artefacts). In the case of georectifying meltwaterplume extents, data were projected onto a horizontal DEM atsea level. Each camera (and focal length) was calibrated us-ing the camera calibration functions in the Matlab ComputerVision System Toolbox to obtain lens distortion parametersand intrinsic camera matrices.
4.1.1 Supraglacial lake levels
Three groups of supraglacial lakes were monitored by ourtime-lapse systems during the 2014 melt season at Krone-breen. Two of these groups were visible from Site 5 on Gar-woodtoppen, while the other was captured from Site 3 onColletthøgda (Fig. 1). Changes in lake surface area were usedas a proxy for water storage on the glacier surface and its re-lease into the englacial/subglacial environment. These lakeswere automatically detected from images based on the highcontrast in pixel intensity between the ice and water surface.This process involved multiple steps to reduce the change ofmisidentification: (i) the images were masked to reduce pro-cessing time, (ii) the images were enhanced to improve thedetection of “lake-like” objects, and (iii) these objects weremanually verified in PyTrx to filter out falsely detected lakessuch as shadows.
Each group of lakes was detected from images acquiredevery half-hour to (i) isolate the effects of changes in illumi-nation, which influence apparent lake surface area; (ii) matchthe temporal resolution in which other subglacial compo-nents are reconstructed in this study; and (iii) overcomethe limited temporal resolution associated with previoussatellite- and photography-based analysis in monitoring lakeextent. The lakes were easiest to detect when the contrastbetween the ice surface and water was largest; hence it wasdifficult to detect the lakes at the beginning and end of themelt season when the lake surfaces were snow-covered orfrozen. In such instances, lake recognition was based on op-erator identification, specifically lake surface colour, homo-geneity and texture.
4.1.2 Visible meltwater plume extent
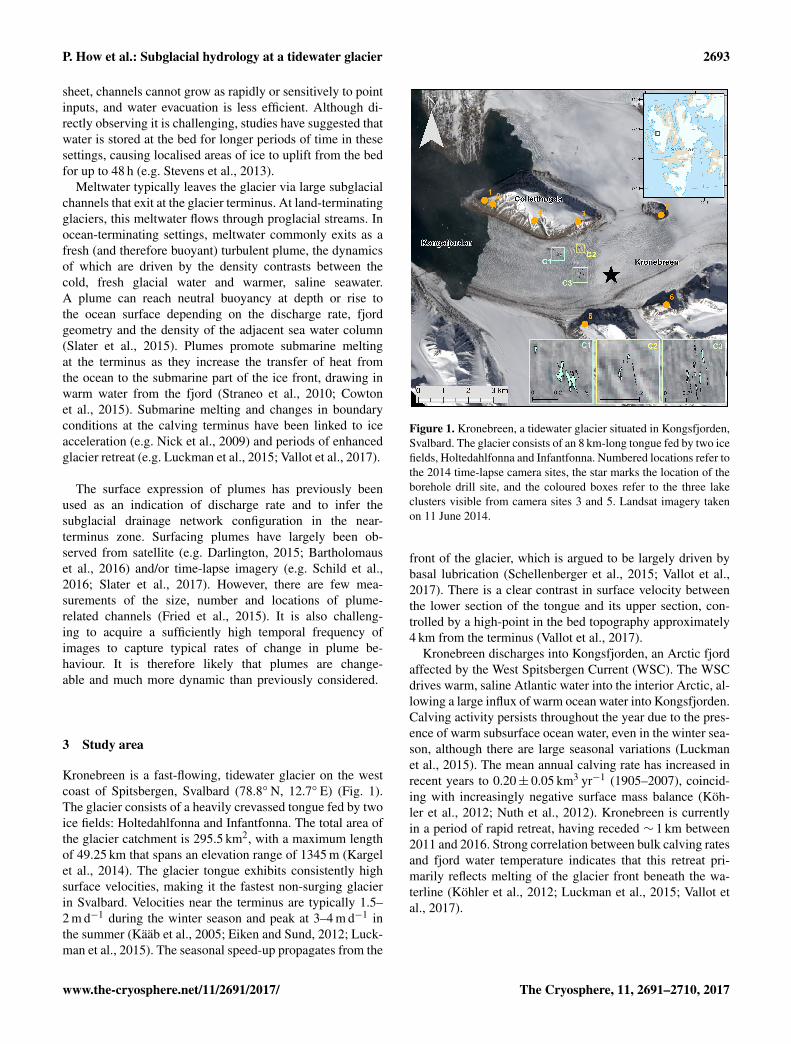
Activity from four surfacing plumes was captured from thetime-lapse camera located at Site 1 (Fig. 1), on the north-ern side of the terminus of Kronebreen. Surface areas werecalculated for the three plumes on the northern side of theterminus. It is assumed that plume surface area is a mea-sure of meltwater discharge from the glacier. Although melt-water plumes can reach neutral buoyancy at depth, this isconsidered unlikely at Kronebreen due to its shallow depth(∼ 80 m), weak stratification and simple thermal salinity anddensity structure (Cottier et al., 2005).
Plumes were consistently identifiable based on a combi-nation of water colour, fjord water roughness, and the areafrom which icebergs have been cleared by divergent flow.These characteristics are difficult to define automatically dueto variation in illumination. Therefore the plume surface areawas defined manually within the plane of each image andthen georectified to obtain the surface area of each plume.Plume surface area was digitised from images every hour tocapture the commonly rapid variability of surfacing plumeextent. In some cases, plume extent was larger than the time-lapse image field of view. Such cases are noted in the sub-
The Cryosphere, 11, 2691–2710, 2017 www.the-cryosphere.net/11/2691/2017/
P. How et al.: Subglacial hydrology at a tidewater glacier 2695
sequent results. For the plume on the southern side of theterminus, it was hard to measure surface area accurately dueto its distance from the camera. Therefore we simply reportits presence or absence.
4.2 Tidal level
Tidal measurements were obtained from a tidal gauge in NyÅlesund, for which all data is hosted online by the Norwe-gian Mapping Authority (http://www.kartverket.no/). Mea-surements were made every 2 h, and a 12-step moving aver-age was calculated from this to evaluate longer-term trends.As the study area is within the same fjord as the tidal gaugeand located only 12 km away, it is assumed that these mea-surements adequately represent tidal level at the glacier ter-minus.
4.3 Melt modelling
A distributed energy balance model (based on Klok and Oer-lemans, 2002) coupled with a snow model (SOMARS, devel-oped by Greuell and Konzelmann, 1994) was used to com-pute melt production and run-off for the 2014 melt season.The distributed energy balance model calculates meltwaterproduction at the surface, which is then used as an inputfor the subsurface model. The subsurface model simulatesthe subsurface evolution of temperature, density and watercontent; all of which are strongly affected by the storageand refreezing of meltwater (van Pelt et al., 2012; Van Peltet al., 2016). Climate forcing at sea level is derived fromthe Ny Ålesund weather station (Norwegian MeteorologicalInstitute; http://www.met.no/). Lapse rates for precipitation(0.13 % m−1) and temperature (−0.0046 K m−1) are used,which provide the best match between the modelled and ob-served winter and summer balance since 2003 (Van Pelt andKohler, 2015). A 30-year model spin-up assured initialisedsubsurface conditions at the start of the simulation in April2014. Further details about the model, including model vali-dation and calibration, are outlined in detail in Van Pelt andKohler (2015).
The model calculates melt and run-off at an hourly resolu-tion. Here, melt is defined as melt production at the surfacewhereas run-off is melt production and precipitation at thesurface which subsequently enters the englacial system. Run-off is assumed to arrive at the glacier front without delay.Spatially averaged melt and run-off were calculated for theglacier tongue (i.e. not including Holtedahlfonna and the up-per part of the glacier catchment) based on elevation bands,with the glacier tongue defined as 0 to 500 m a.s.l. This wasundertaken in order to isolate the hydrology of the glaciertongue from hydrological influence in the upper catchmentarea (i.e. Holtedahlfonna) and better observe direct hydro-logical effects in the region of interest.
4.4 Surface velocities
Glacier surface velocities were calculated from 11-day re-peat, 2 m spatial resolution, TerraSAR-X Synthetic ApertureRadar (SAR) images. SAR images are advantageous over op-tical imagery, because they are unaffected by weather condi-tions (e.g. cloud cover), polar nights or differences in illumi-nation.
Feature tracking was applied to image pairs using a200× 200 pixel correlation window (400× 400 m). Thesedisplacements were then orthorectified, resulting in a pixelsize of 40 m. Uncertainties are estimated to be < 0.4 m perday, which results from a co-registration error (±0.2 pixels)and smoothing of the velocity field over the tracking window(Luckman et al., 2015). Velocity maps were producedfor sequential image pairs every 11 days, producing arecord of velocity patterns for the 2014 melt season. Pointvalues from these velocity maps were used to calculatespatially averaged velocities for the glacier centreline, thelocation of the supraglacial lakes and the borehole site.In addition, absolute velocity differences were determinedby tracking between subsequent images from 4 June2014, from which velocity change maps were produced.
4.5 Borehole measurements
Two wireless pressure sensors were placed at the glacier bedin the up-glacier section of the glacier tongue during Septem-ber 2013 (78.8719◦ N, 12.7957◦ E, location shown in Fig. 1).At this location, the bed elevation is−115 m a.s.l. and the icesurface elevation is 205 m a.s.l., giving an ice thickness of320 m (±15 m), which is inferred from the borehole lengthand surface elevation. The sensors were installed with hot-water drilling and both were placed in the same borehole, one0.2 m above the bed and the other ∼ 2.5 m above the first.The sensors were developed at IMAU (Institute for Marineand Atmospheric Research, Utrecht University) and loggedin situ pressure, temperature and tilt every 2 h, which was re-layed through a transmitter at the glacier surface for remoteaccess. More details about the specifications of these wirelesssensors are presented in Smeets et al. (2012).
A Topcon Net-G3A GPS unit was installed at the positionof the transmitter to track the approximate movement of thesensors. It was decided to use the surface velocities derivedfrom TerraSAR-X images rather than the GPS, because theGPS velocity record was incomplete and the higher temporalresolution of the GPS data did not add any further insights tothis study. The GPS data appeared noisy due to difficulties inprocessing the positions.
Subglacial water pressure was derived from the differ-ence between the sensor reading and atmospheric pressure,which was obtained from the Norwegian Meteorological In-stitute weather station at Ny Ålesund (data freely available athttp://www.met.no/). The sensor directly in contact with the
www.the-cryosphere.net/11/2691/2017/ The Cryosphere, 11, 2691–2710, 2017
2696 P. How et al.: Subglacial hydrology at a tidewater glacier
glacier bed collected data between 16 September 2013 and25 April 2014 before it stopped recording. The upper sensorcontinued beyond this date, collecting data for 14 months intotal (16 September 2013–3 December 2014). Both sensorsexhibited abnormal temperature and tilt readings before theywent offline, suggesting probe failure from gradual mechan-ical failure, inferred to be between the probe and the glacierbed over some days.
4.6 Hydraulic potential modelling
Routing of subglacial water was calculated based on the as-sumption that meltwater flow is governed by gradients in hy-draulic potential (Shreve, 1972). Subglacial hydraulic poten-tial (8) was calculated according to the approach previouslyused by Rippin et al. (2003) and Willis et al. (2012):
8= kρig(h− z)+ ρwgz, (1)
where k is the cryostatic pressure factor, ρi is the den-sity of ice (917 kg m−3), g is acceleration due to gravity(9.81 m s−2), h and z are the elevations of the ice surfaceand bed, respectively (with the difference between themdefining the ice thickness) and ρw is the density of water(1000 kg m−3). The cryostatic pressure factor is effectivelythe ratio of water pressure to ice overburden pressure (Pw/Pi)and accounts for the possibility that water exists in low-pressure channels (Evatt et al., 2006). Variations in the valueof k reflect the degree to which subglacial drainage is pres-surised, with k = 1 reflecting pressurised flow driven by theinfluence of gravity on both the overlying ice and the melt-water itself and k = 0 reflecting open channel flow drivenonly by the influence of gravity. Hydraulic potential gradi-ents change as a consequence of variations in k, leading tochanges in the simulated subglacial drainage configuration.This allows us to explore the range of drainage paths that canbe present.
Surface and bed topography digital elevation models wereobtained from a series of radar (low-frequency common-offset radio-echo sounding) surveys which were conductedin 2009–2010 and 2014–2016. The spatial resolution of thesetwo DEMs is 50× 50 m, with a vertical accuracy of ±15 m.The bed DEM was generated by interpolating the measuredice thickness and subtracting it from the surface DEM usingthe technique referred to in Lindbäck et al. (2014).
5 Results
5.1 Supraglacial lake area
Three clusters of supraglacial lakes were detected in thetime-lapse imagery (shown as C1, C2 and C3 in Fig. 1).Changes in lake surface area are shown in Fig. 2a. Clus-ter 1 is located close to the glacier’s northern margin(78.8785◦ N, 12.7063◦ E). Cluster 2 is located farther up-
glacier (78.8814◦ N, 12.7420◦ E), also near to the north-ern margin. Cluster 3 is adjacent to Cluster 2 (78.8715◦ N,12.7493◦ E) but nearer to the glacier’s central flow line. Allthree groups of lakes occupy crevasses. The lakes in Clus-ter 1 overspill and coalesce prior to drainage and occasion-ally become brown in colour. The lakes in clusters 2 and 3are much smaller as they remain confined to crevasses dur-ing the melt season and do not coalesce. Their drainage isgradual (with Cluster 2 draining from 5 July 2014 05:30 andCluster 3 draining from 16 July 2014 12:30) and they do notdrain entirely, with the remaining water gradually refreezingover time. The colour of these lakes remains blue throughoutthe melt season.
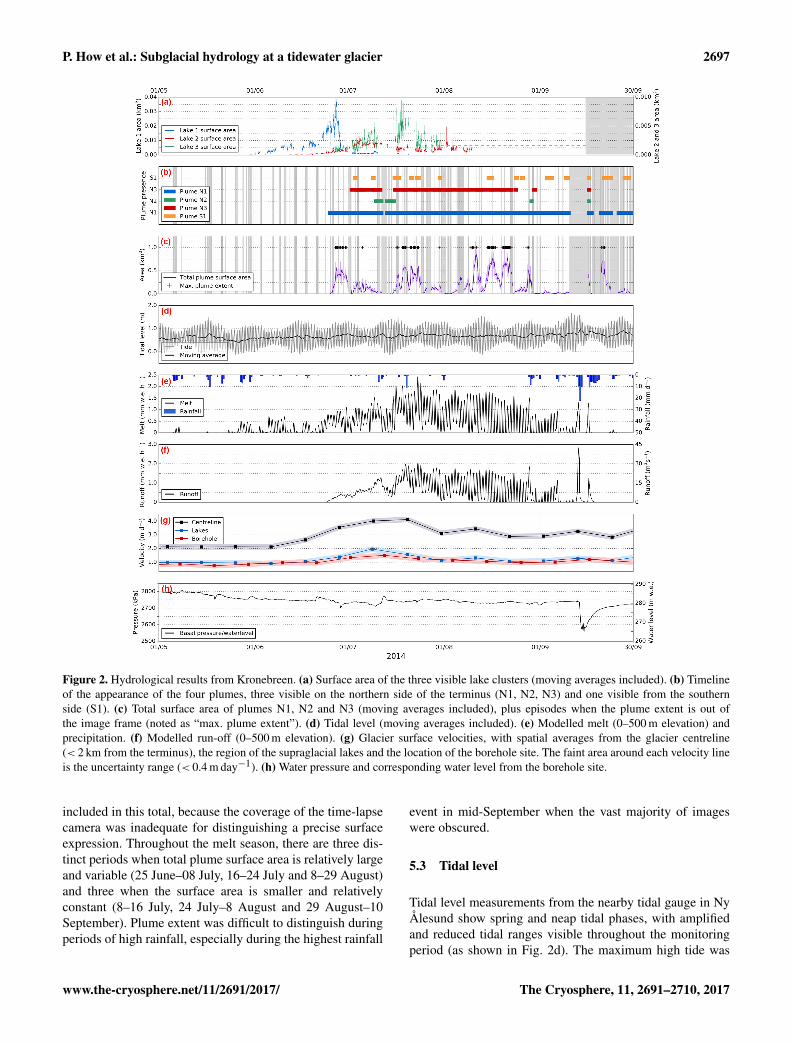
While the lake clusters appear to act independently, thelakes within Cluster 1 fill and drain almost simultaneously,indicating that they are hydrologically linked. A timelineof changes in lake surface area at Cluster 1 is shown inFig. 3. Cluster 1 fills up and drains first; it begins to fillfrom 1 June 2014 07:00 (Fig. 3a–d) and initially drains on27 June 2014 03:00 over 59 h (Fig. 3e–f), decreasing froma total surface area of 41 374 to 2477 m2 (see Lake 1 groupsurface area in Fig. 2a). The lakes gradually drain after this,leaving them empty by 21 July 2014 14:00 (Fig. 3g–j). Thedrainage of lakes within this group propagates up-glacier,with a 13 h lag between changes in the lower and upper lakes.This up-glacier-propagating drainage is also evident at theupper marginal lakes (Cluster 2) and the upper central lakes(Cluster 3).
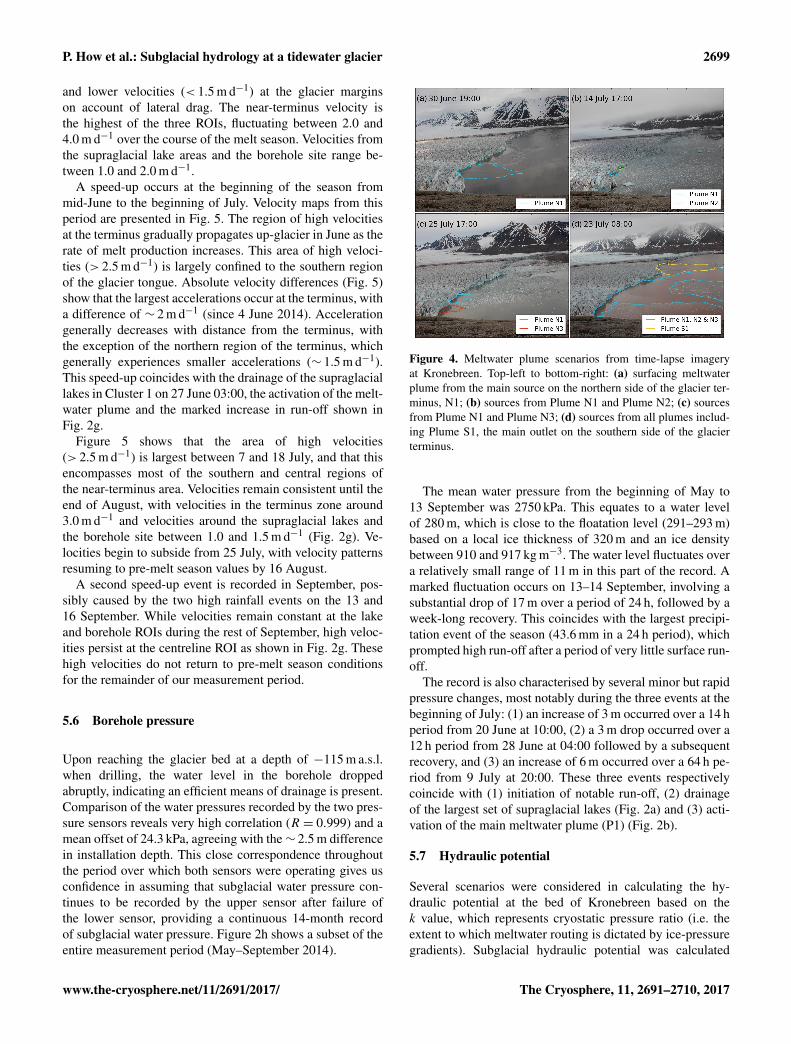
5.2 Meltwater plume extent
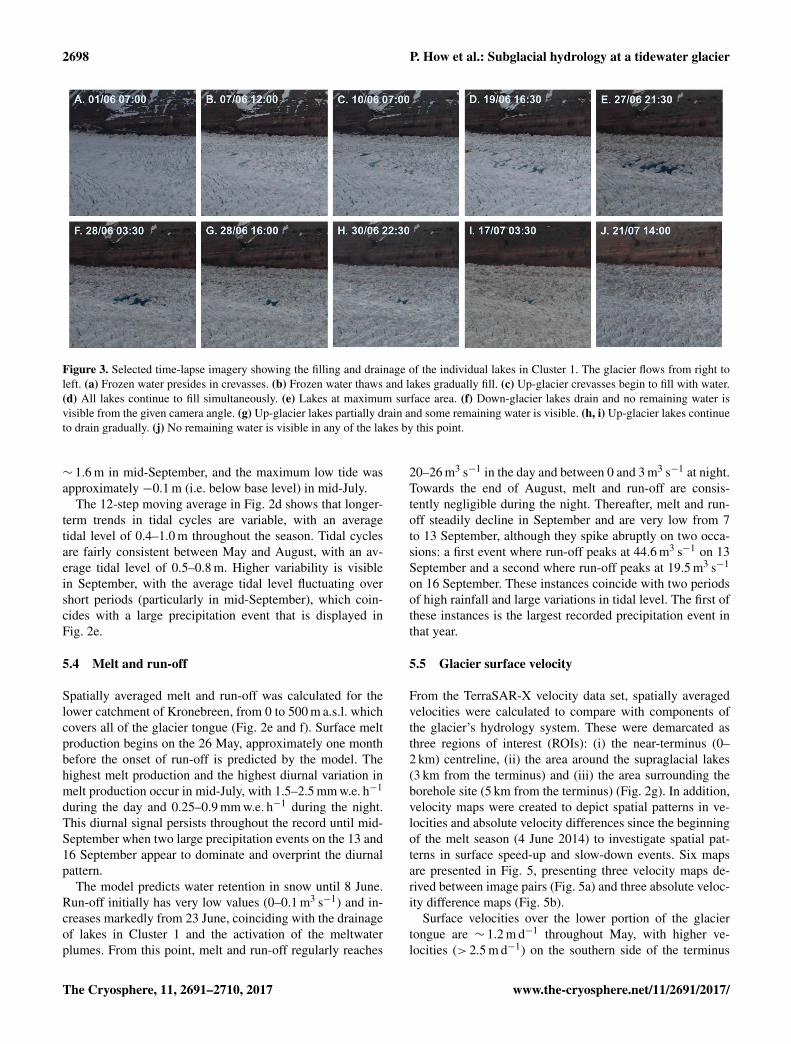
During the 2014 melt season, three surfacing plumes werevisible on the northern side of Kronebreen and one on thesouthern side (Fig. 4). The main, central plume in the north(N1) is the most persistent and largest. The two secondarynorthern plumes (N2 and N3) surface intermittently eitherside of N1, with N2 to the south and N3 near to the northernshoreline. The southern plume, S1, surfaces for brief periods.These four plumes were monitored throughout the melt sea-son (Fig. 2b). Plume N1 first surfaces at 02:00 on 25 June,approximately 36 h after the first run-off of the melt seasonbegins and 84 h before the lake in Cluster 1 is full enough thatwater is visible in the time-lapse imagery. Plume N3 activatesa week later (2 July at 03:00) and is active throughout themonitoring period except for three periods of reduced run-off. Plume N2 is more intermittent, only surfacing for threeshort periods (10 July at 00:00 – 15 July at 23:00, 29 Au-gust at 04:00–22:00 and 16 September at 15:00–17:00), allof which coincide with periods of high run-off and substan-tial precipitation. Plume S1 is visible on 13 separate occa-sions and is quick to appear and disappear throughout themelt season.
Plume surface area is calculated as the combined surfacearea of the three plumes on the northern side of the termi-nus when they are active (Fig. 2c). Plume S1 could not be
The Cryosphere, 11, 2691–2710, 2017 www.the-cryosphere.net/11/2691/2017/
P. How et al.: Subglacial hydrology at a tidewater glacier 2697
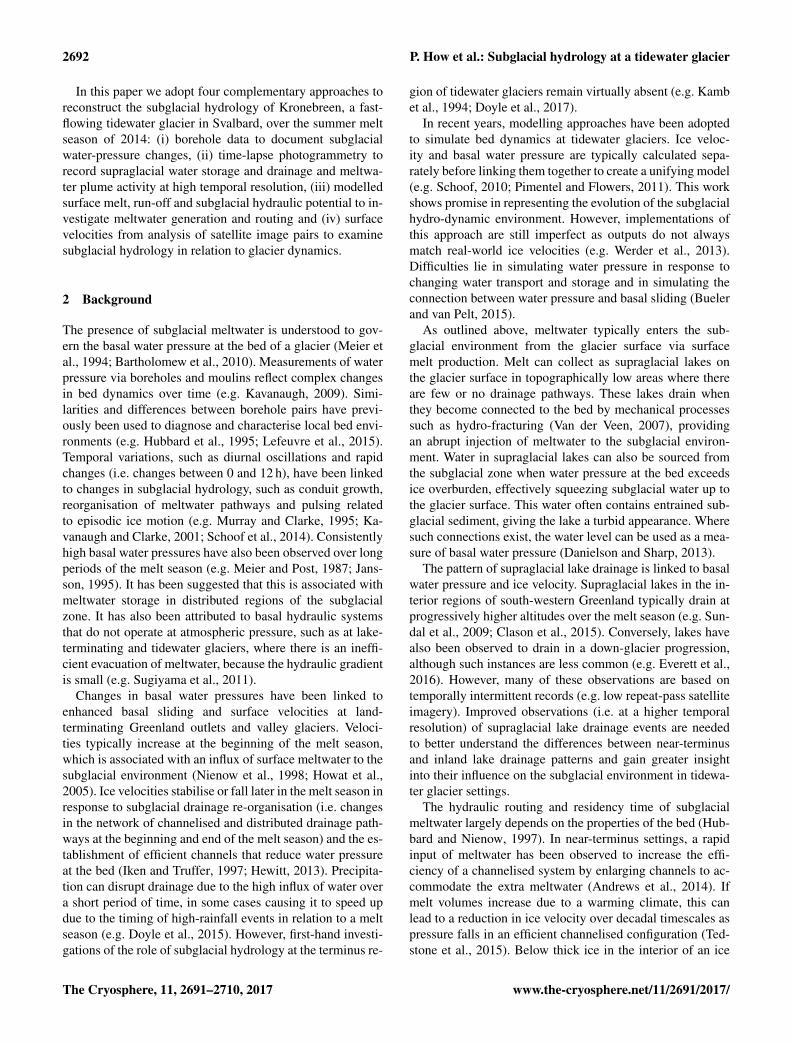
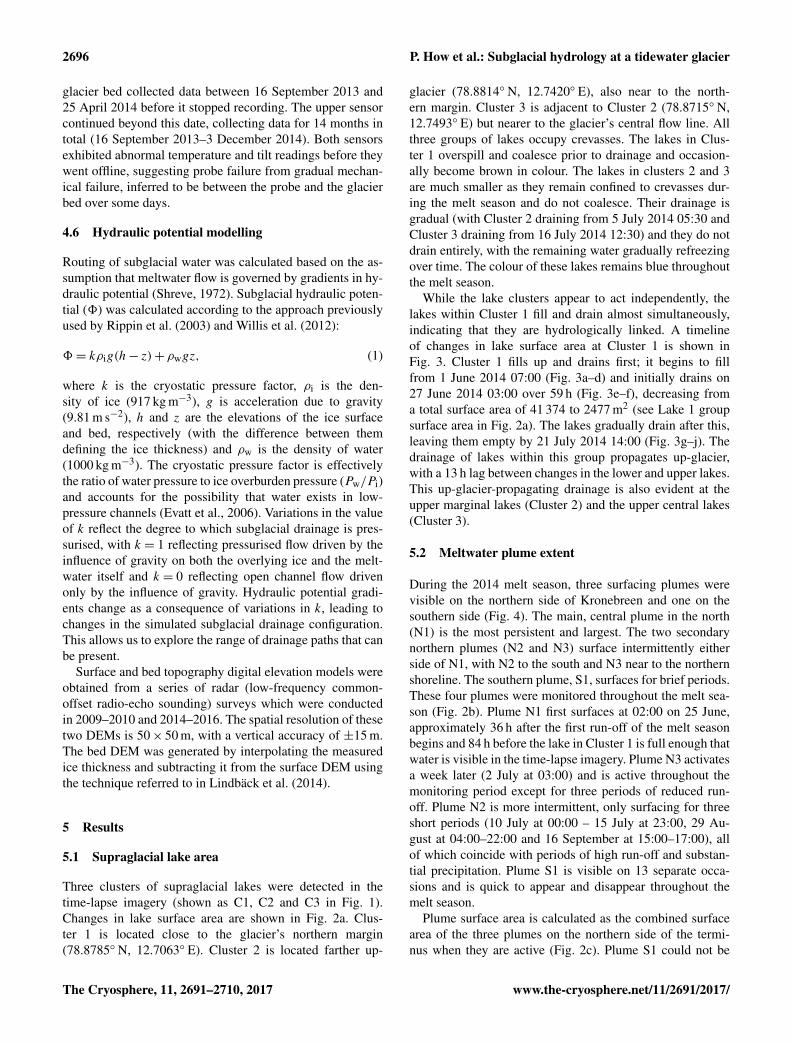
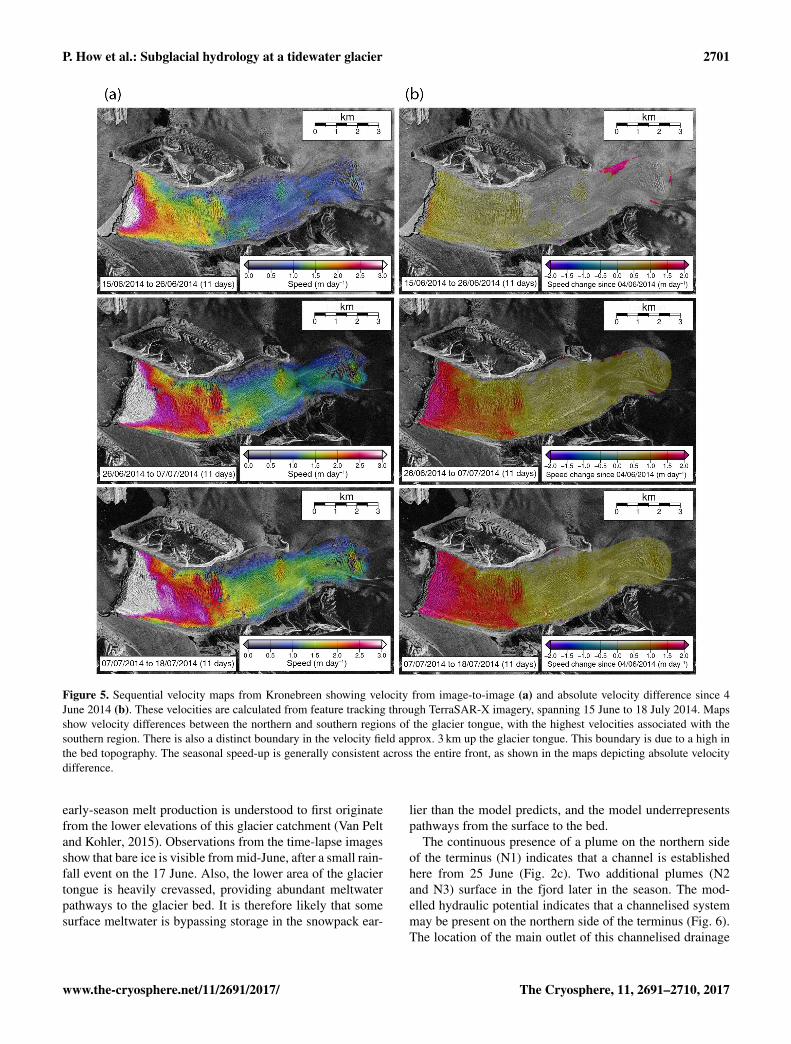
Figure 2. Hydrological results from Kronebreen. (a) Surface area of the three visible lake clusters (moving averages included). (b) Timelineof the appearance of the four plumes, three visible on the northern side of the terminus (N1, N2, N3) and one visible from the southernside (S1). (c) Total surface area of plumes N1, N2 and N3 (moving averages included), plus episodes when the plume extent is out ofthe image frame (noted as “max. plume extent”). (d) Tidal level (moving averages included). (e) Modelled melt (0–500 m elevation) andprecipitation. (f) Modelled run-off (0–500 m elevation). (g) Glacier surface velocities, with spatial averages from the glacier centreline(< 2 km from the terminus), the region of the supraglacial lakes and the location of the borehole site. The faint area around each velocity lineis the uncertainty range (< 0.4 m day−1). (h) Water pressure and corresponding water level from the borehole site.
included in this total, because the coverage of the time-lapsecamera was inadequate for distinguishing a precise surfaceexpression. Throughout the melt season, there are three dis-tinct periods when total plume surface area is relatively largeand variable (25 June–08 July, 16–24 July and 8–29 August)and three when the surface area is smaller and relativelyconstant (8–16 July, 24 July–8 August and 29 August–10September). Plume extent was difficult to distinguish duringperiods of high rainfall, especially during the highest rainfall
event in mid-September when the vast majority of imageswere obscured.
5.3 Tidal level
Tidal level measurements from the nearby tidal gauge in NyÅlesund show spring and neap tidal phases, with amplifiedand reduced tidal ranges visible throughout the monitoringperiod (as shown in Fig. 2d). The maximum high tide was
www.the-cryosphere.net/11/2691/2017/ The Cryosphere, 11, 2691–2710, 2017
2698 P. How et al.: Subglacial hydrology at a tidewater glacier
Figure 3. Selected time-lapse imagery showing the filling and drainage of the individual lakes in Cluster 1. The glacier flows from right toleft. (a) Frozen water presides in crevasses. (b) Frozen water thaws and lakes gradually fill. (c) Up-glacier crevasses begin to fill with water.(d) All lakes continue to fill simultaneously. (e) Lakes at maximum surface area. (f) Down-glacier lakes drain and no remaining water isvisible from the given camera angle. (g) Up-glacier lakes partially drain and some remaining water is visible. (h, i) Up-glacier lakes continueto drain gradually. (j) No remaining water is visible in any of the lakes by this point.
∼ 1.6 m in mid-September, and the maximum low tide wasapproximately −0.1 m (i.e. below base level) in mid-July.
The 12-step moving average in Fig. 2d shows that longer-term trends in tidal cycles are variable, with an averagetidal level of 0.4–1.0 m throughout the season. Tidal cyclesare fairly consistent between May and August, with an av-erage tidal level of 0.5–0.8 m. Higher variability is visiblein September, with the average tidal level fluctuating overshort periods (particularly in mid-September), which coin-cides with a large precipitation event that is displayed inFig. 2e.
5.4 Melt and run-off
Spatially averaged melt and run-off was calculated for thelower catchment of Kronebreen, from 0 to 500 m a.s.l. whichcovers all of the glacier tongue (Fig. 2e and f). Surface meltproduction begins on the 26 May, approximately one monthbefore the onset of run-off is predicted by the model. Thehighest melt production and the highest diurnal variation inmelt production occur in mid-July, with 1.5–2.5 mm w.e. h−1
during the day and 0.25–0.9 mm w.e. h−1 during the night.This diurnal signal persists throughout the record until mid-September when two large precipitation events on the 13 and16 September appear to dominate and overprint the diurnalpattern.
The model predicts water retention in snow until 8 June.Run-off initially has very low values (0–0.1 m3 s−1) and in-creases markedly from 23 June, coinciding with the drainageof lakes in Cluster 1 and the activation of the meltwaterplumes. From this point, melt and run-off regularly reaches
20–26 m3 s−1 in the day and between 0 and 3 m3 s−1 at night.Towards the end of August, melt and run-off are consis-tently negligible during the night. Thereafter, melt and run-off steadily decline in September and are very low from 7to 13 September, although they spike abruptly on two occa-sions: a first event where run-off peaks at 44.6 m3 s−1 on 13September and a second where run-off peaks at 19.5 m3 s−1
on 16 September. These instances coincide with two periodsof high rainfall and large variations in tidal level. The first ofthese instances is the largest recorded precipitation event inthat year.
5.5 Glacier surface velocity
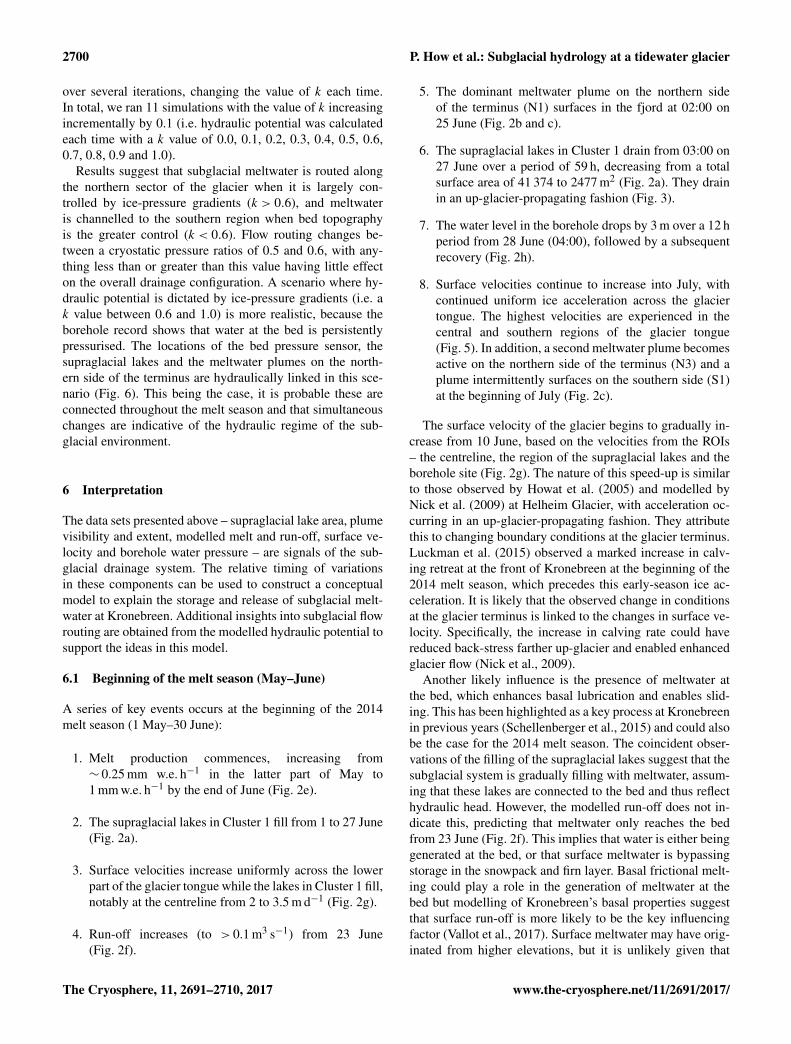
From the TerraSAR-X velocity data set, spatially averagedvelocities were calculated to compare with components ofthe glacier’s hydrology system. These were demarcated asthree regions of interest (ROIs): (i) the near-terminus (0–2 km) centreline, (ii) the area around the supraglacial lakes(3 km from the terminus) and (iii) the area surrounding theborehole site (5 km from the terminus) (Fig. 2g). In addition,velocity maps were created to depict spatial patterns in ve-locities and absolute velocity differences since the beginningof the melt season (4 June 2014) to investigate spatial pat-terns in surface speed-up and slow-down events. Six mapsare presented in Fig. 5, presenting three velocity maps de-rived between image pairs (Fig. 5a) and three absolute veloc-ity difference maps (Fig. 5b).
Surface velocities over the lower portion of the glaciertongue are ∼ 1.2 m d−1 throughout May, with higher ve-locities (> 2.5 m d−1) on the southern side of the terminus
The Cryosphere, 11, 2691–2710, 2017 www.the-cryosphere.net/11/2691/2017/
P. How et al.: Subglacial hydrology at a tidewater glacier 2699
and lower velocities (< 1.5 m d−1) at the glacier marginson account of lateral drag. The near-terminus velocity isthe highest of the three ROIs, fluctuating between 2.0 and4.0 m d−1 over the course of the melt season. Velocities fromthe supraglacial lake areas and the borehole site range be-tween 1.0 and 2.0 m d−1.
A speed-up occurs at the beginning of the season frommid-June to the beginning of July. Velocity maps from thisperiod are presented in Fig. 5. The region of high velocitiesat the terminus gradually propagates up-glacier in June as therate of melt production increases. This area of high veloci-ties (> 2.5 m d−1) is largely confined to the southern regionof the glacier tongue. Absolute velocity differences (Fig. 5)show that the largest accelerations occur at the terminus, witha difference of ∼ 2 m d−1 (since 4 June 2014). Accelerationgenerally decreases with distance from the terminus, withthe exception of the northern region of the terminus, whichgenerally experiences smaller accelerations (∼ 1.5 m d−1).This speed-up coincides with the drainage of the supraglaciallakes in Cluster 1 on 27 June 03:00, the activation of the melt-water plume and the marked increase in run-off shown inFig. 2g.
Figure 5 shows that the area of high velocities(> 2.5 m d−1) is largest between 7 and 18 July, and that thisencompasses most of the southern and central regions ofthe near-terminus area. Velocities remain consistent until theend of August, with velocities in the terminus zone around3.0 m d−1 and velocities around the supraglacial lakes andthe borehole site between 1.0 and 1.5 m d−1 (Fig. 2g). Ve-locities begin to subside from 25 July, with velocity patternsresuming to pre-melt season values by 16 August.
A second speed-up event is recorded in September, pos-sibly caused by the two high rainfall events on the 13 and16 September. While velocities remain constant at the lakeand borehole ROIs during the rest of September, high veloc-ities persist at the centreline ROI as shown in Fig. 2g. Thesehigh velocities do not return to pre-melt season conditionsfor the remainder of our measurement period.
5.6 Borehole pressure
Upon reaching the glacier bed at a depth of −115 m a.s.l.when drilling, the water level in the borehole droppedabruptly, indicating an efficient means of drainage is present.Comparison of the water pressures recorded by the two pres-sure sensors reveals very high correlation (R = 0.999) and amean offset of 24.3 kPa, agreeing with the∼ 2.5 m differencein installation depth. This close correspondence throughoutthe period over which both sensors were operating gives usconfidence in assuming that subglacial water pressure con-tinues to be recorded by the upper sensor after failure ofthe lower sensor, providing a continuous 14-month recordof subglacial water pressure. Figure 2h shows a subset of theentire measurement period (May–September 2014).
Figure 4. Meltwater plume scenarios from time-lapse imageryat Kronebreen. Top-left to bottom-right: (a) surfacing meltwaterplume from the main source on the northern side of the glacier ter-minus, N1; (b) sources from Plume N1 and Plume N2; (c) sourcesfrom Plume N1 and Plume N3; (d) sources from all plumes includ-ing Plume S1, the main outlet on the southern side of the glacierterminus.
The mean water pressure from the beginning of May to13 September was 2750 kPa. This equates to a water levelof 280 m, which is close to the floatation level (291–293 m)based on a local ice thickness of 320 m and an ice densitybetween 910 and 917 kg m−3. The water level fluctuates overa relatively small range of 11 m in this part of the record. Amarked fluctuation occurs on 13–14 September, involving asubstantial drop of 17 m over a period of 24 h, followed by aweek-long recovery. This coincides with the largest precipi-tation event of the season (43.6 mm in a 24 h period), whichprompted high run-off after a period of very little surface run-off.
The record is also characterised by several minor but rapidpressure changes, most notably during the three events at thebeginning of July: (1) an increase of 3 m occurred over a 14 hperiod from 20 June at 10:00, (2) a 3 m drop occurred over a12 h period from 28 June at 04:00 followed by a subsequentrecovery, and (3) an increase of 6 m occurred over a 64 h pe-riod from 9 July at 20:00. These three events respectivelycoincide with (1) initiation of notable run-off, (2) drainageof the largest set of supraglacial lakes (Fig. 2a) and (3) acti-vation of the main meltwater plume (P1) (Fig. 2b).
5.7 Hydraulic potential
Several scenarios were considered in calculating the hy-draulic potential at the bed of Kronebreen based on thek value, which represents cryostatic pressure ratio (i.e. theextent to which meltwater routing is dictated by ice-pressuregradients). Subglacial hydraulic potential was calculated
www.the-cryosphere.net/11/2691/2017/ The Cryosphere, 11, 2691–2710, 2017
2700 P. How et al.: Subglacial hydrology at a tidewater glacier
over several iterations, changing the value of k each time.In total, we ran 11 simulations with the value of k increasingincrementally by 0.1 (i.e. hydraulic potential was calculatedeach time with a k value of 0.0, 0.1, 0.2, 0.3, 0.4, 0.5, 0.6,0.7, 0.8, 0.9 and 1.0).
Results suggest that subglacial meltwater is routed alongthe northern sector of the glacier when it is largely con-trolled by ice-pressure gradients (k > 0.6), and meltwateris channelled to the southern region when bed topographyis the greater control (k < 0.6). Flow routing changes be-tween a cryostatic pressure ratios of 0.5 and 0.6, with any-thing less than or greater than this value having little effecton the overall drainage configuration. A scenario where hy-draulic potential is dictated by ice-pressure gradients (i.e. ak value between 0.6 and 1.0) is more realistic, because theborehole record shows that water at the bed is persistentlypressurised. The locations of the bed pressure sensor, thesupraglacial lakes and the meltwater plumes on the north-ern side of the terminus are hydraulically linked in this sce-nario (Fig. 6). This being the case, it is probable these areconnected throughout the melt season and that simultaneouschanges are indicative of the hydraulic regime of the sub-glacial environment.
6 Interpretation
The data sets presented above – supraglacial lake area, plumevisibility and extent, modelled melt and run-off, surface ve-locity and borehole water pressure – are signals of the sub-glacial drainage system. The relative timing of variationsin these components can be used to construct a conceptualmodel to explain the storage and release of subglacial melt-water at Kronebreen. Additional insights into subglacial flowrouting are obtained from the modelled hydraulic potential tosupport the ideas in this model.
6.1 Beginning of the melt season (May–June)
A series of key events occurs at the beginning of the 2014melt season (1 May–30 June):
1. Melt production commences, increasing from∼ 0.25 mm w.e. h−1 in the latter part of May to1 mm w.e. h−1 by the end of June (Fig. 2e).
2. The supraglacial lakes in Cluster 1 fill from 1 to 27 June(Fig. 2a).
3. Surface velocities increase uniformly across the lowerpart of the glacier tongue while the lakes in Cluster 1 fill,notably at the centreline from 2 to 3.5 m d−1 (Fig. 2g).
4. Run-off increases (to > 0.1 m3 s−1) from 23 June(Fig. 2f).
5. The dominant meltwater plume on the northern sideof the terminus (N1) surfaces in the fjord at 02:00 on25 June (Fig. 2b and c).
6. The supraglacial lakes in Cluster 1 drain from 03:00 on27 June over a period of 59 h, decreasing from a totalsurface area of 41 374 to 2477 m2 (Fig. 2a). They drainin an up-glacier-propagating fashion (Fig. 3).
7. The water level in the borehole drops by 3 m over a 12 hperiod from 28 June (04:00), followed by a subsequentrecovery (Fig. 2h).
8. Surface velocities continue to increase into July, withcontinued uniform ice acceleration across the glaciertongue. The highest velocities are experienced in thecentral and southern regions of the glacier tongue(Fig. 5). In addition, a second meltwater plume becomesactive on the northern side of the terminus (N3) and aplume intermittently surfaces on the southern side (S1)at the beginning of July (Fig. 2c).
The surface velocity of the glacier begins to gradually in-crease from 10 June, based on the velocities from the ROIs– the centreline, the region of the supraglacial lakes and theborehole site (Fig. 2g). The nature of this speed-up is similarto those observed by Howat et al. (2005) and modelled byNick et al. (2009) at Helheim Glacier, with acceleration oc-curring in an up-glacier-propagating fashion. They attributethis to changing boundary conditions at the glacier terminus.Luckman et al. (2015) observed a marked increase in calv-ing retreat at the front of Kronebreen at the beginning of the2014 melt season, which precedes this early-season ice ac-celeration. It is likely that the observed change in conditionsat the glacier terminus is linked to the changes in surface ve-locity. Specifically, the increase in calving rate could havereduced back-stress farther up-glacier and enabled enhancedglacier flow (Nick et al., 2009).
Another likely influence is the presence of meltwater atthe bed, which enhances basal lubrication and enables slid-ing. This has been highlighted as a key process at Kronebreenin previous years (Schellenberger et al., 2015) and could alsobe the case for the 2014 melt season. The coincident obser-vations of the filling of the supraglacial lakes suggest that thesubglacial system is gradually filling with meltwater, assum-ing that these lakes are connected to the bed and thus reflecthydraulic head. However, the modelled run-off does not in-dicate this, predicting that meltwater only reaches the bedfrom 23 June (Fig. 2f). This implies that water is either beinggenerated at the bed, or that surface meltwater is bypassingstorage in the snowpack and firn layer. Basal frictional melt-ing could play a role in the generation of meltwater at thebed but modelling of Kronebreen’s basal properties suggestthat surface run-off is more likely to be the key influencingfactor (Vallot et al., 2017). Surface meltwater may have orig-inated from higher elevations, but it is unlikely given that
The Cryosphere, 11, 2691–2710, 2017 www.the-cryosphere.net/11/2691/2017/
P. How et al.: Subglacial hydrology at a tidewater glacier 2701
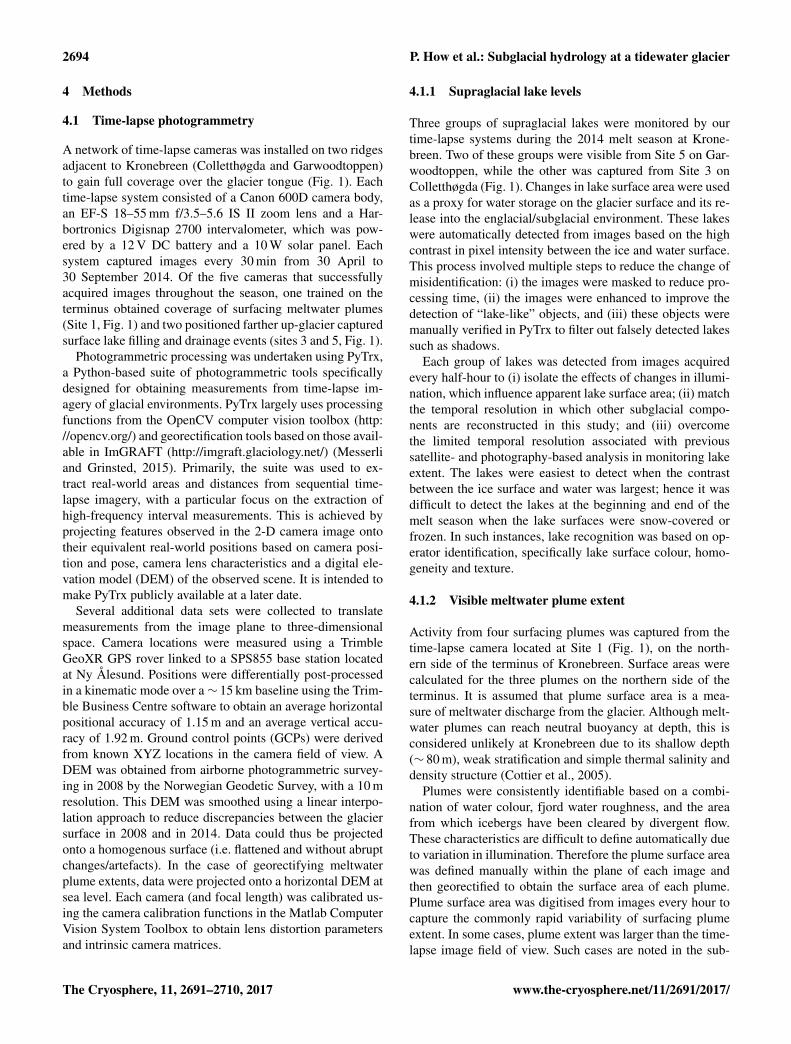
Figure 5. Sequential velocity maps from Kronebreen showing velocity from image-to-image (a) and absolute velocity difference since 4June 2014 (b). These velocities are calculated from feature tracking through TerraSAR-X imagery, spanning 15 June to 18 July 2014. Mapsshow velocity differences between the northern and southern regions of the glacier tongue, with the highest velocities associated with thesouthern region. There is also a distinct boundary in the velocity field approx. 3 km up the glacier tongue. This boundary is due to a high inthe bed topography. The seasonal speed-up is generally consistent across the entire front, as shown in the maps depicting absolute velocitydifference.
early-season melt production is understood to first originatefrom the lower elevations of this glacier catchment (Van Peltand Kohler, 2015). Observations from the time-lapse imagesshow that bare ice is visible from mid-June, after a small rain-fall event on the 17 June. Also, the lower area of the glaciertongue is heavily crevassed, providing abundant meltwaterpathways to the glacier bed. It is therefore likely that somesurface meltwater is bypassing storage in the snowpack ear-
lier than the model predicts, and the model underrepresentspathways from the surface to the bed.
The continuous presence of a plume on the northern sideof the terminus (N1) indicates that a channel is establishedhere from 25 June (Fig. 2c). Two additional plumes (N2and N3) surface in the fjord later in the season. The mod-elled hydraulic potential indicates that a channelised systemmay be present on the northern side of the terminus (Fig. 6).The location of the main outlet of this channelised drainage
www.the-cryosphere.net/11/2691/2017/ The Cryosphere, 11, 2691–2710, 2017
2702 P. How et al.: Subglacial hydrology at a tidewater glacier
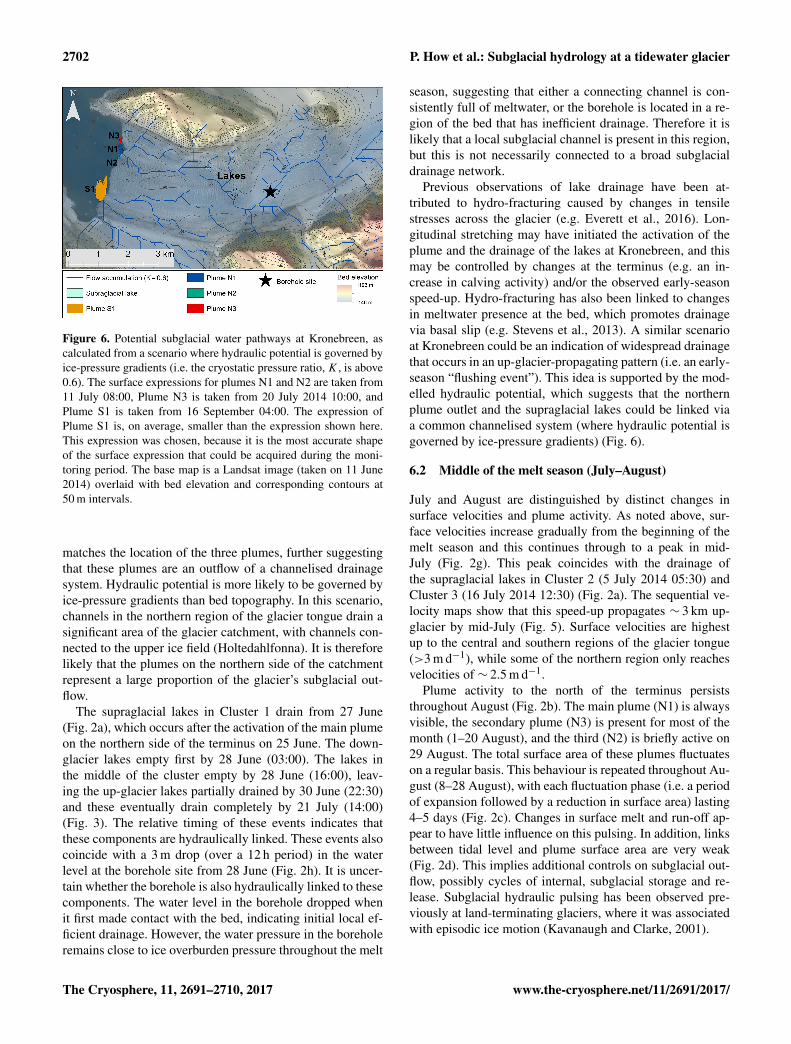
Figure 6. Potential subglacial water pathways at Kronebreen, ascalculated from a scenario where hydraulic potential is governed byice-pressure gradients (i.e. the cryostatic pressure ratio, K , is above0.6). The surface expressions for plumes N1 and N2 are taken from11 July 08:00, Plume N3 is taken from 20 July 2014 10:00, andPlume S1 is taken from 16 September 04:00. The expression ofPlume S1 is, on average, smaller than the expression shown here.This expression was chosen, because it is the most accurate shapeof the surface expression that could be acquired during the moni-toring period. The base map is a Landsat image (taken on 11 June2014) overlaid with bed elevation and corresponding contours at50 m intervals.
matches the location of the three plumes, further suggestingthat these plumes are an outflow of a channelised drainagesystem. Hydraulic potential is more likely to be governed byice-pressure gradients than bed topography. In this scenario,channels in the northern region of the glacier tongue drain asignificant area of the glacier catchment, with channels con-nected to the upper ice field (Holtedahlfonna). It is thereforelikely that the plumes on the northern side of the catchmentrepresent a large proportion of the glacier’s subglacial out-flow.
The supraglacial lakes in Cluster 1 drain from 27 June(Fig. 2a), which occurs after the activation of the main plumeon the northern side of the terminus on 25 June. The down-glacier lakes empty first by 28 June (03:00). The lakes inthe middle of the cluster empty by 28 June (16:00), leav-ing the up-glacier lakes partially drained by 30 June (22:30)and these eventually drain completely by 21 July (14:00)(Fig. 3). The relative timing of these events indicates thatthese components are hydraulically linked. These events alsocoincide with a 3 m drop (over a 12 h period) in the waterlevel at the borehole site from 28 June (Fig. 2h). It is uncer-tain whether the borehole is also hydraulically linked to thesecomponents. The water level in the borehole dropped whenit first made contact with the bed, indicating initial local ef-ficient drainage. However, the water pressure in the boreholeremains close to ice overburden pressure throughout the melt
season, suggesting that either a connecting channel is con-sistently full of meltwater, or the borehole is located in a re-gion of the bed that has inefficient drainage. Therefore it islikely that a local subglacial channel is present in this region,but this is not necessarily connected to a broad subglacialdrainage network.
Previous observations of lake drainage have been at-tributed to hydro-fracturing caused by changes in tensilestresses across the glacier (e.g. Everett et al., 2016). Lon-gitudinal stretching may have initiated the activation of theplume and the drainage of the lakes at Kronebreen, and thismay be controlled by changes at the terminus (e.g. an in-crease in calving activity) and/or the observed early-seasonspeed-up. Hydro-fracturing has also been linked to changesin meltwater presence at the bed, which promotes drainagevia basal slip (e.g. Stevens et al., 2013). A similar scenarioat Kronebreen could be an indication of widespread drainagethat occurs in an up-glacier-propagating pattern (i.e. an early-season “flushing event”). This idea is supported by the mod-elled hydraulic potential, which suggests that the northernplume outlet and the supraglacial lakes could be linked viaa common channelised system (where hydraulic potential isgoverned by ice-pressure gradients) (Fig. 6).
6.2 Middle of the melt season (July–August)
July and August are distinguished by distinct changes insurface velocities and plume activity. As noted above, sur-face velocities increase gradually from the beginning of themelt season and this continues through to a peak in mid-July (Fig. 2g). This peak coincides with the drainage ofthe supraglacial lakes in Cluster 2 (5 July 2014 05:30) andCluster 3 (16 July 2014 12:30) (Fig. 2a). The sequential ve-locity maps show that this speed-up propagates ∼ 3 km up-glacier by mid-July (Fig. 5). Surface velocities are highestup to the central and southern regions of the glacier tongue(>3 m d−1), while some of the northern region only reachesvelocities of ∼ 2.5 m d−1.
Plume activity to the north of the terminus persiststhroughout August (Fig. 2b). The main plume (N1) is alwaysvisible, the secondary plume (N3) is present for most of themonth (1–20 August), and the third (N2) is briefly active on29 August. The total surface area of these plumes fluctuateson a regular basis. This behaviour is repeated throughout Au-gust (8–28 August), with each fluctuation phase (i.e. a periodof expansion followed by a reduction in surface area) lasting4–5 days (Fig. 2c). Changes in surface melt and run-off ap-pear to have little influence on this pulsing. In addition, linksbetween tidal level and plume surface area are very weak(Fig. 2d). This implies additional controls on subglacial out-flow, possibly cycles of internal, subglacial storage and re-lease. Subglacial hydraulic pulsing has been observed pre-viously at land-terminating glaciers, where it was associatedwith episodic ice motion (Kavanaugh and Clarke, 2001).
The Cryosphere, 11, 2691–2710, 2017 www.the-cryosphere.net/11/2691/2017/
P. How et al.: Subglacial hydrology at a tidewater glacier 2703
Activity from the plume on the southern side of the ter-minus (S1) is intermittent (Fig. 2b): the plume surfaces forshort phases (< 62 h) every 5 days on average. This releaseof water could either be internally driven or could indicatea dynamic drainage system, which can quickly transitionbetween efficient and distributed configurations. This dif-fers from the persistent plume activity in the northern re-gion and possibly reflects differences in drainage efficiencyacross the terminus. Modelled hydraulic potentials indicatethat it is likely for meltwater to be routed to the northernregion throughout the melt season (Fig. 6). This being thecase, meltwater is not efficiently evacuated from the centraland southern regions. Meltwater will be slow-flowing and/orstored at the bed and enhance basal lubrication, providing anexplanation for the spatial patterns in reconstructed velocities(Fig. 5).
6.3 End of the melt season (September)
The end of the 2014 melt season is characterised by five mainfeatures:
1. Modelled melt and run-off decrease by the beginning ofSeptember and continue to do so until mid-September(Fig. 2d and e). Additionally, plume extent is consis-tently small (Fig. 2c) and activity is visible from onlyone of the outlets (N1) on the northern side of the termi-nus (Fig. 2b). Intermittent activity is also evident fromthe plume on the southern side of the terminus (S1).
2. A large rainfall event occurs on 13 September, di-rectly influencing run-off and likely also enhancing melt(Fig. 2e and f). This rainfall event is the largest of theseason (43.6 mm in a 24 h period). This coincides withatypical fluctuations in tidal level (as shown by the mov-ing average in Fig. 2d) and a 17 m-drop in water levelat the borehole site over a period of 24 h (Fig. 2h). Thewater pressure at the bed recovers to previous values by20 September (i.e. a 7-day return time).
3. A second large rainfall event occurs on 16 September,promoting a second spike in melt and run-off (Fig. 2eand f). Recovery of the water pressure in the bore-hole remains gradual and consistent during this period(Fig. 2h).
4. Although there is limited visibility of the plumes duringthese rainfall events, clear conditions from 16 Septem-ber (15:00) show that all four plumes are active andwere possibly active during the storm (Fig. 2b). PlumesN2 and N3 stop surfacing by 19:00 on 16 September.The two main outlets on the northern and southern sidesof the terminus (N1 and S1) continue to surface for therest of the month (Fig. 2c).
5. High surface velocities continue in September, largelyconfined to the central and southern regions of theglacier tongue (∼ 3 m d−1 at the centreline, Fig. 5).
It is likely that the presence of meltwater in the subglacialsystem beneath the northern region of the glacier tonguehas diminished by the beginning of September. Less waterentered and left the system, as indicated by the decreasedmelt/run-off and the small plume extent on the northern sideof the terminus respectively (Fig. 2c, e and f). Surface ve-locities remain high in the central and southern regions ofthe glacier tongue though, as shown by the velocity recordfrom the centreline (∼ 3 m d−1, Fig. 2g). Plume activity onthe southern side of the terminus is intermittent. This sug-gests that meltwater is not being effectively evacuated fromthe subglacial environment under the central and southernregions of the glacier tongue. It is likely that this meltwateris slow-moving and/or being stored, which would enhancebasal lubrication and is a likely reason for high surface ve-locities in this region at this late stage in the melt season.
The substantial rainfall event on 13 September appears tore-activate melt and run-off which, in turn, are likely to causea rapid influx of water to the glacier bed (Fig. 2e and f). Theatypical fluctuations in tidal level further suggest that thisrainfall event is associated with a low-pressure weather frontand an associated storm surge (Fig. 2d). The coincident tim-ing of the large drop in water pressure at the borehole site in-dicates that rapid meltwater routing influences the upper areaof the glacier tongue (Fig. 2h). In addition, all four plumesources were active for at least part of the storm, suggestingthat channels were present at the glacier terminus (Fig. 2b).These observations support the idea that water was evacuatedthrough a glacier-wide efficient drainage system during thisperiod. This could be evacuated in a similar fashion to theflushing event observed at the beginning of the melt season.
However, high surface velocities persist through the re-maining part of September. These high velocities are largelyconfined to the central and southern regions of the glaciertongue, similarly to the velocity field observed in June–July(Fig. 5). This suggests that meltwater is being retained inthe subglacial environment despite the presence of an ef-ficient drainage system. It is likely that water is efficientlyevacuated from the northern region of the glacier tongue butnot from the southern and central regions. This hypothesismatches the hydraulic potential modelling, which indicatesthat the majority of subglacial meltwater is routed to thenorth of the glacier tongue, leaving the southern and cen-tral regions hydraulically isolated from the efficient drainagesystem (Fig. 6).
www.the-cryosphere.net/11/2691/2017/ The Cryosphere, 11, 2691–2710, 2017
2704 P. How et al.: Subglacial hydrology at a tidewater glacier
7 Discussion
7.1 Early-melt-season meltwater storage
Surface velocities gradually rise at the beginning of the meltseason, from mid-June onwards. As previously noted, it islikely that this early-season speed-up is linked to an increasein calving retreat at the terminus (Luckman et al., 2015).The presence of meltwater at the bed is also a key compo-nent of this speed-up. Early-season melt production is routedto the bed earlier than the run-off model predicts, as it by-passes storage in the snowpack and is routed to the bed viaabundant crevasses in the lower area of the glacier tongue(based on observations from the time-lapse images). Thisis likely to enhance basal lubrication and facilitates slidingand/or subglacial sediment deformation. This meltwater isbeing delivered to the bed and stored for a significant periodof time before it is efficiently evacuated from the subglacialsystem. The activation of the main plume on the northernside of the terminus (N1) suggests that either a sufficient vol-ume of meltwater is being discharged to the surface in thefjord, or an efficient system is established to evacuate melt-water on 25 June. We consider the second of these instancesto be more likely as the plume was observed to be surfacingfrom a single source (based on observations from the time-lapse imagery), signifying that it was channel-fed. This be-ing the case, meltwater is stored at the bed for ∼ 15 daysbefore it is evacuated, based on the timing of the onset of thespeed-up and the activation of Plume N1. It is likely that it isreleased either when sufficient pressure has accumulated toforce a channel to open or when subglacial water has suffi-ciently melted the cavity/conduit wall. Therefore the storageof water at the bed of the glacier could play a vital role inthe seasonal speed-up at Kronebreen during the 2014 meltseason.
7.2 Up-glacier-propagating supraglacial lake drainage
The three groups of supraglacial lakes observed over the2014 melt season exhibit different filling and draining pat-terns. The lakes in Cluster 1 overspill and coalesce and drainrapidly. Water is no longer visible from the view of the time-lapse camera, which suggests that this drainage completelyempties all stored water at the surface. The lakes in clus-ters 2 and 3 are constrained within individual crevasses assmall discontinuous ponds. Drainage of these lakes is rapid,but some water remains at the surface. Danielson and Sharp(2013) identified three types of lake drainage events, distin-guished by the rate at which the drainage occurs and the vol-ume of water that is drained: (1) crevasse pond drainage – aregion of unconnected lakes form within crevasses that drainasynchronously, suggesting that the crevasses empty from thebase; (2) slow lake drainage – supraglacial lakes that drain byoverflowing, which commonly leaves a remnant lake in thedeepest part of the basin; and (3) fast lake drainage – com-
plete, rapid drainage of a supraglacial lake via a crevasse ormoulin opening within the lake basin. The three lake clustersin this study exhibit the characteristics of two of these ty-pologies: Cluster 1 adheres to the characteristics of fast lakedrainage (type 3) and the lakes in clusters 2 and 3 are similarto the characteristics of crevasse pond drainage (type 1).
The lakes in Cluster 1 are of particular interest because ofthe coincidence of their drainage with changes in surface ve-locities, run-off and plume activation at the beginning of themelt season. Lake drainage is linked to longitudinal stretch-ing which occurs in response to a change in glacier dynamics(i.e. ice speed, calving activity) and changes in conditions atthe bed which promote enhanced basal sliding (Stevens etal., 2013; Everett et al., 2016). The drainage of the lakes atKronebreen are likely to be linked to both a change in glacierdynamics and an associated change in bed conditions, in thiscase an increase in the presence of meltwater. Longitudinalstretching and consequent crevasse opening occur as theglacier accelerates at the beginning of the season, creatingmore pathways for meltwater to be delivered to the bed.Supraglacial lakes either drain by hydro-fracturing whichis promoted by the speed-up, or when they become linkedto a common channelised system. Our hydraulic potentialmodelling supports this as it indicates that Cluster 1 may belocated close to a large channel/flow accumulation pathway.Their drainage indicates that this is an early-season flushingevent that occurs in an up-glacier progression, as reflected inthe timing of their connection to the subglacial environment.
7.3 Controls on meltwater plume activity
Three plumes are visible on the northern side of the termi-nus (N1, N2 and N3) during periods of high rainfall, sug-gesting that more channels become active when there is arapid input of meltwater to the bed. The location of theseplumes matches the location of a major channel outlet inthe hydraulic potential model, suggesting that these plumesare the outflow from an efficient drainage system under thenorthern region of the glacier tongue. Observations of in-creased plume activity during and/or shortly following high-rainfall events suggest that more channels become active onthe northern side of the terminus to accommodate an abnor-mally high rate of meltwater delivery to the bed. The rateat which these channels switch on and off (indicated by theshort lag between precipitation/run-off and plume activity)indicates that the subglacial environment is highly dynamicand able to adapt rapidly; either dormant channels becomeactive or new channels form to accommodate for high ratesof meltwater delivery.
In contrast, one plume is visible at the southern region ofthe terminus (S1). The activity of this plume is intermittentand it is unexpectedly absent during periods of high run-off,suggesting that the outflow of meltwater is not channelisedand is instead more distributed at the grounding line. The
The Cryosphere, 11, 2691–2710, 2017 www.the-cryosphere.net/11/2691/2017/
P. How et al.: Subglacial hydrology at a tidewater glacier 2705
modelled hydraulic potential indicates that only a small pro-portion of the total drainage is routed here. It is thereforeunlikely that a stable channelised drainage system exists inthis region, and a distributed system resides in periods oflow discharge. We propose that this plume activity is a sig-nal for subglacial hydraulic pulsing, which represents peri-odic meltwater flushing. This occurs when sufficient pressurehas accumulated to force a channel open, and/or when sub-glacial water has melted the cavity/conduit walls to allow anincrease in discharge.
Few links are observed between plume outflow and tidallevel, which suggests that this is an internally driven processwith limited tidal influence. Internally driven hydraulic puls-ing has previously been observed at land-terminating glaciersand associated with abrupt ice motion caused by the gradualfailure of “sticky spots” on the glacier bed (Kavanaugh andClarke, 2001; Kavanaugh, 2009). This progressive failuretransfers basal stress to hydraulically unconnected regions ofthe bed and effectively “squeezes” water through them. Thismay also be occurring at Kronebreen, although it is difficultto further examine here due to the coarse temporal resolu-tion of the velocity record. If this is the case, hydraulic puls-ing could be a major control on subglacial meltwater storage.For example, storage is evident at the beginning of the seasonwhen melt production has begun, supraglacial lakes begin tofill, and velocity gradually increases from ∼ 2 to ∼ 4 m d−1
(based on velocities from the centreline). The trigger for therelease of this water could be related to hydraulic pulsing viamechanical adjustments at the glacier bed.
Plume presence is commonly taken as an expression of thesubglacial drainage network near the terminus. For example,Slater et al. (2017) saw no surfacing plume activity in themiddle of the summer melt season at Kangiata Nunâta Ser-mia (KNS), Greenland, despite high run-off. They associatedthis with a distributed drainage system at the bed, producingmultiple outlets that did not surface in the fjord. The activ-ity of the plume at KNS is similar to that observed at PlumeS1 at Kronebreen, with plume extent disassociated from run-off. Slater et al. (2017) argued that this disassociation may beindicative of a system that is close to the threshold betweena distributed and efficient drainage system. This is likely toalso be the case at Kronebreen. It is further suggested herethat plume activity can be used as a signal for subglacial hy-draulic pulsing, specifically the internal storage and releaseof meltwater at marine-terminating glaciers.
Satellite imagery with long repeat-pass times is unlikely toadequately represent plume activity, even in long-term stud-ies. Plume extent is controlled by multiple processes actingon different timescales and associating them with glacier hy-drology and/or dynamics for a discrete point in time maybe misleading. Time-lapse photogrammetry has proved vi-tal here in providing high-frequency records of meltwaterplume activity. However, plume activity could not be mon-itored through storms and cloudy conditions using this tech-nique. Plume activity notably changes during storms and
valuable information can be extracted about plume dynamicsduring these periods. This is a limiting factor in time-lapsephotogrammetry and alternatives need to be implemented toovercome this pivotal limitation.
7.4 Subglacial drainage of Kronebreen
At the borehole site, there is little or no diurnal signal in thewater pressure record and the subglacial system is consis-tently close to ice overburden. The water pressure record atKronebreen reflects a high hydraulic base-level determinedby water depth at the terminus. This ensures that the sub-glacial environment is persistently pressurised where the bedis significantly below sea level. This permits fast flow, whichcould preclude the formation of persistent channels.
Few short-term pressure variations are observed in the wa-ter pressure record from May to September 2014, apart fromthe significant drop in pressure at the end of the melt season.Although the modelled hydraulic potential suggests that theborehole is located within an efficient drainage catchment, itis more likely that the borehole is actually indicative of a re-gion that is inefficiently drained for a large part of the meltseason.
Observations of intermittent plume activity on the south-ern side of the terminus suggest that a stable drainage systemcannot exist in this region. Meltwater discharge is insteaddriven by internal hydraulic storage and release. However,the persistent presence of plumes on the northern side of theterminus indicates that a channelised system could be activebelow this part of the glacier for the majority of the meltseason. In this area, a stable efficient drainage system is en-couraged both by the hydraulic gradient below the glacier,and the relatively low velocity of the ice due to lateral dragat the margin.
The chain of events we recorded at the beginning ofthe 2014 melt season indicates an up-glacier-propagatingdrainage of the subglacial hydraulic system, notably the ac-tivation of the surfacing meltwater plume followed by thedrainage of Cluster 1, which occurs within 3 days over thelower ∼ 3 km of the glacier tongue. This is initiated near theterminus as drainage efficiency increases. This is likely to beeither initiated via the onset of the speed-up which promoteslongitudinal stretching or by the formation of channels nearto the glacier front which propagate up-glacier and draw-down subglacial meltwater from the upper catchment area(i.e. a flushing event). A similar event is possibly also seenat the end of the 2014 melt season, with the significant dropin water pressure and re-activation of near-terminus channels(indicated by plume activity) in mid-September.
The observations from the borehole water pressure recordare strikingly different from borehole records in alpine set-tings. These usually exhibit a diurnal signal, which reflectschanges in delivery of meltwater to the bed and createstransverse hydraulic gradients that make meltwater pathwayshighly changeable (e.g. Meier et al., 1994; Hubbard et al.,
www.the-cryosphere.net/11/2691/2017/ The Cryosphere, 11, 2691–2710, 2017
2706 P. How et al.: Subglacial hydrology at a tidewater glacier
1995). Consistently high basal water pressures have beenassociated with glaciers where the evacuation of meltwa-ter from the subglacial environment is inefficient or wherethe drainage system is unstable (e.g. Sugiyama et al., 2011).The borehole record from Kronebreen supports this ideaand further suggests that consistently high basal water pres-sure may be exclusively associated with lake-terminatingglaciers, tidewater glaciers and glaciers undergoing surging.Similar observations were concluded by Doyle et al. (2017),with boreholes drilled to the bed at Store Glacier, Green-land showing consistently high water levels. Rapid drainageevents have also been observed at other marine-terminatingglaciers (e.g. Danielson and Sharp, 2013). The observed up-glacier progression of drainage at Kronebreen, however, doesnot fit the proposed hypothesis that down-glacier progressionof drainage may be primarily associated with dynamic tide-water glaciers such as Helheim Glacier (Everett et al., 2016).
It has previously been argued that changes in dischargeat tidewater glaciers are accommodated through changes inconduit size rather than changes in the hydrological network.This idea largely stems from modelling and indirect measure-ments from large outlet glaciers in Greenland and Alaska (Pi-mental et al., 2010; Gimbert et al., 2016). Here, we proposethat Kronebreen is able to accommodate fluctuations in dis-charge through changes in the subglacial hydrological net-work. This is based on the observation of additional plumeactivity during periods of rapid meltwater inputs to the bed,which are indicative of active channels. It is likely that thesubglacial network can reconfigure, because the ice is thinnerthan large ice sheet outlets. Thus, channels can remain openfor longer, because the thinner ice promotes slower creep clo-sure rates. Reconfigurations could have a marked effect onthe rate of submarine melting at the ice front beneath the wa-terline (e.g. Slater et al., 2015), and it would be worthwhile toinvestigate the effect of channel reconfigurations on ice frontstability in future work.
7.5 Implications for subglacial dynamics
The velocity maps in Fig. 5 show that the central and south-ern regions of the glacier tongue consistently flows fasterthan the northern region. The largest accelerations are ex-perienced at the terminus during the early-season speed-upevent, increasing by 2 m d−1 (since 4 June 2014). At thispoint, surface velocities in the central and southern regionsexceed 3 m d−1. These high velocities are likely to be theresult of differences in the efficiency of the drainage be-neath the northern, central and southern regions of the glaciertongue. Modelled hydraulic potential suggests that meltwa-ter is channelled to the northern region, assuming that flowrouting is largely governed by ice-pressure gradients. Thiseffectively isolates the central and southern regions from anefficient mechanism to evacuate meltwater. It is evident fromobservations of plume activity that channels cannot form forsufficiently long periods in this area, which enhances basal
lubrication and is a contributing factor to the localised highvelocities throughout the melt season.
Similar velocity patterns have been reported at other largeoutlet glaciers (e.g. Howat et al., 2005; Nick et al., 2009).It has also been observed in previous years at Kronebreen(Luckman et al., 2015). Schellenberger et al. (2015) empha-sised the importance of basal lubrication based on observedlinks between velocity and surface water production at Kro-nebreen from 2007 to 2013. Inverse modelling by Vallot et al.(2017) shows that seasonal velocity variations at Kronebreenare controlled by variations in basal friction (closely follow-ing surface water run-off) and calving retreat of the front(which reduces back stress), with the former process dom-inant. Our results show that variations in the velocity field atKronebreen are not only influenced by surface water produc-tion but also by the specific configuration of the subglacialdrainage system which is governed by ice-pressure gradientsat the bed.
We also argue here that 2014 is an abnormal year forthe dynamics of Kronebreen, based on the observations of aspeed-up event at the end of the melt season (Luckman et al.,2015; Vallot et al., 2017). It is likely that this speed-up wascaused by an unusually high rainfall event that overwhelmeda subglacial drainage system in a late-season phase with lowefficiency. Doyle et al. (2015) observed a similar event nearto the end of the 2011 melt season at Russell Glacier. Theysuggested that such speed-ups are amplified due to their late-season timing, which may also be the case at Kronebreen inthis instance. Although the inefficiency of the subglacial sys-tem is partly accountable for the late-season speed-up, it isalso likely that sustained high velocities were caused by theabnormally high rainfall event and the storage of this water ina distributed drainage system that was present under the cen-tral and southern regions of the glacier front. Changes in ve-locity are thus controlled by the location of efficient drainageat Kronebreen and resulting patterns of bed friction.
8 Conclusions
Subglacial hydrology has been examined at a tidewaterglacier in Svalbard using direct measurements of basal wa-ter pressure in conjunction with measurements of hydro-logical components (supraglacial lake drainage, meltwaterplume presence and plume surface area), modelled compo-nents (melt, run-off and hydraulic potential) and surface ve-locities derived from TerraSAR-X imagery. Two key eventsoccur at Kronebreen which provide insights into the hy-draulic regime during the 2014 melt season: (1) an up-glacier-propagating drainage event over a significant regionof the glacier tongue, with simultaneous measurements sug-gesting this was an episode of early-season subglacial flush-ing which occurred within a 3-day period (25–28 June) over adistance of 5 km; (2) An unusually high-rainfall event in mid-September which re-activated the subglacial drainage system
The Cryosphere, 11, 2691–2710, 2017 www.the-cryosphere.net/11/2691/2017/
P. How et al.: Subglacial hydrology at a tidewater glacier 2707
and is argued to be the cause of persistent high surface veloc-ities throughout the winter season (Vallot et al., 2017).
Our observations suggest that the event at the beginning ofthe melt season is linked to changes in subglacial drainagepathways that are initiated near the terminus and result in thedrawdown of subglacial meltwater from the adjacent uppercatchment. It is likely that subglacial flow routing is largelygoverned by ice-pressure gradients, routing a significant pro-portion of meltwater to the northern region of the glaciertongue (as shown by the presence of plume activity on thenorthern side of the terminus and indicated by hydraulic po-tential modelling).
Observations of intermittent plume activity on the south-ern side of the terminus imply that the drainage system forthe central and southern regions of the glacier tongue is dis-rupted throughout the melt season. It is likely that a stablesystem cannot form, because a smaller proportion of meltwa-ter is routed to this area (as suggested by hydraulic potentialmodelling) and there is high basal motion due to persistentfast velocities throughout the melt season. Plume activity isdisassociated from modelled run-off, which indicates that adistributed drainage system is active for the majority of themelt season (Slater et al., 2017). Periodic presence of a sur-facing plume is suggested here to be a signal for storage andrelease of meltwater that is related to internally driven pro-cesses that operate independently from tidal influence (Ka-vanaugh and Clarke, 2001). In effect, the plume activity is anindicator of modulated subglacial pulsing under the centraland southern regions of the glacier tongue.
This storage of subglacial water is a key control on iceflow over the 2014 melt season. Surface velocities show thatthe onset of the seasonal speed-up is relatively early com-pared to modelled run-off (i.e. melt production at the surfacewhich enters the englacial zone). This implies that meltwatercould be bypassing storage at the surface earlier in the meltseason than anticipated. The absence of plume activity earlyin the season further suggests that this meltwater is not beingquickly evacuated from the subglacial zone. Therefore melt-water is possibly being stored at the bed and enhancing basallubrication, which facilitates the early onset of the seasonalspeed-up.
The surface velocities also reveal that the central andsouthern regions of the glacier tongue is faster flowing thanthe northern region. This suggests that meltwater is being re-tained in the subglacial environment within the central andsouthern regions and a local distributed drainage system pre-sides despite the presence of an efficient drainage system inthe northern region. This spatial pattern in surface velocityhas been identified tentatively in previous years (Luckmanet al., 2015; Schellenberger et al., 2015). It is evident thatvariations in the velocity field at Kronebreen are not only in-fluenced by surface run-off but also by the specific configu-ration of the subglacial drainage system. The high velocitiesobserved in the latter part of the 2014 melt season are ab-normal due to an unusually high-rainfall event and storage of
this water in a localised region of the glacier tongue whichenhanced basal lubrication (Doyle et al., 2015). While it isacknowledged that glacier dynamics play a key role in icevelocity, it is argued here that changes in velocities are alsocontrolled by the location of efficient and inefficient drainageand the regions where water is stored and evacuated.
Code and data availability. It is intended to publicly release thePyTrx photogrammetry toolbox at a later date, along with the pho-togrammetry data sets used in this research. In addition, time-lapsephotographs, borehole data and velocity data will be released fol-lowing completion of Penelope How’s PhD. Meteorological datacan be accessed at http://www.kartverket.no/. Tidal data can be ac-cessed at http://www.met.no/.
Author contributions. PH is the primary author of this paper. Inaddition she developed the photogrammetric tools in PyTrx andprocessed the borehole and photogrammetric data sets used here.DIB is the project leader and had an active role in developingthe ideas presented in this paper. NRJH designed the time-lapsecamera systems, developed the photogrammetric tools in PyTrxand carried out the hydraulic potential calculations. BH led theborehole fieldwork. AL provided velocities from feature trackingthrough TerraSAR-X satellite imagery. HS assisted on all relatedfieldwork and aided in data processing. WJJVP provided melt andrun-off data. KL provided a bed DEM for the Kronebreen catch-ment. JK provided a surface DEM, facilitated fieldwork and gavehelpful insight into the ideas presented in this paper. WB designedand installed the pressure sensors which were placed on the glacierbed.
Competing interests. The authors declare that they have no conflictof interest.
Acknowledgements. This work was funded by the ConocoPhillips-Lundin Northern Area Program through theCRIOS project (Calving Rates and Impact On Sea level,http://www.researchinsvalbard.no/project/7037). Penelope How issupported by a NERC PhD studentship. TerraSAR-X data wereprovided by DLR (project OCE1503). This work would not havebeen possible without the logistical support provided by AirliftAS, the Norwegian Polar Institute Sverdrup Research Stationin Ny Ålesund, and the University Centre in Svalbard (UNIS)Tech and Logistics team. We greatly acknowledge Alex Hartand the GeoSciences Mechanical Workshop at the University ofEdinburgh for manufacturing the time-lapse camera enclosuresthat were used in this study. Bryn Hubbard acknowledges capitalequipment support from HEFCW/Aberystwyth University. Wewould also like to thank Silje Smith-Johnsen for her assistancein the deployment of the time-lapse cameras, Fiona Clubb forher guidance on data visualisation, Donald Slater for usefulcomments and feedback on this paper, Andreas Vieli as thenominated editor of this paper, and the three appointed review-ers who consisted of Shin Sugiyama and two anonymous reviewers.
www.the-cryosphere.net/11/2691/2017/ The Cryosphere, 11, 2691–2710, 2017
2708 P. How et al.: Subglacial hydrology at a tidewater glacier
Edited by: Andreas VieliReviewed by: Shin Sugiyama and two anonymous referees
References
Andrews, L. C., Catania, G. A., Hoffman, M. J., Gulley,J. D., Lüthi, M. P., Ryser, C., Hawley, R. L., and Neu-mann, T. A.: Direct observations of evolving subglacialdrainage beneath the Greenland Ice Sheet, Nature, 514, 80–83,https://doi.org/10.1038/nature13796, 2014.
Bartholomaus, T. C., Stearns, L. A., Sutherland, D. A., Shroyer, E.L., Nash, J. D., Walker, R. T., Catania, G., Felikson, D., Car-roll, D., Fried, M. J., Noël, and Van Den Broeke, M. R.: Con-trasts in the response of adjacent fjords and glaciers to ice-sheetsurface melt in West Greenland, Ann. Glaciol., 57, 73, 25–38,https://doi.org/10.1017/aog.2016.19, 2016.
Batholomew, I., Nienow, P., Mair, D., Hubbard, A., King, M. A.,and Sole, A.: Seasonal evolution of subglacial drainage and ac-celeration in a Greenland outlet glacier, Nat. Geosci., 3, 408–411,https://doi.org/10.1038/ngeo863, 2010.
Bueler, E. and van Pelt, W.: Mass-conserving subglacial hydrologyin the Parallel Ice Sheet Model version 0.6, Geosci. Model Dev.,8, 1613–1635, https://doi.org/10.5194/gmd-8-1613-2015, 2015.
Clason, C. C., Mair, D. W. F., Nienow, P. W., Bartholomew,I. D., Sole, A., Palmer, S., and Schwanghart, W.: Modellingthe transfer of supraglacial meltwater to the bed of LeverettGlacier, Southwest Greenland, The Cryosphere, 9, 123–138,https://doi.org/10.5194/tc-9-123-2015, 2015.
Cottier, F., Tverberg, V., Inall, M., Svendsen, H., Nilsen, F.,and Griffiths, C.: Water mass modification in an Arctic fjordthrough cross-shelf exchange: The seasonal hydrography ofKongsfjorden, Svalbard, J. Geophys. Res.-Oceans, 110, C12005,https://doi.org/10.1029/2004JC002757, 2005.
Cowton, T., Slater, D., Sole, A., Goldberg, D., and Nienow, P.:Modeling the impact of glacial runoff on fjord circulation andsubmarine melt rate using a new subgrid-scale parameteriza-tion for glacial plumes, J. Geophys. Res.-Oceans, 120, 796–812,https://doi.org/10.1002/2014JC010324, 2015.
Danielson, B. and Sharp, M.: Development and applicationof a time-lapse photograph analysis method to investi-gate the link between tidewater glacier flow variation andsupraglacial lake drainage events, J. Glaciol., 59, 287–302,https://doi.org/10.3189/2013jog12j108, 2013.
Darlington, E.: Meltwater delivery from the tidewater glacier Kro-nebreen to Kongsfjorden, Svalbard; insights from in-situ andremote-sensing analyses of sediment plumes, PhD thesis, Lough-borough University, Loughborough, UK, 2015.
Doyle, S. H., Hubbard, A., van de Wal, R. S. W., Box, J. E.,van As, D., Scherrer, K., Melerbachtol, T. W., Smeets, P. C.J. P., Harper, J., Johansson, E., Mottram, R. H., Mikkelsen,A. B., Willhelms, F., Patton, H., Christoffersen, P., and Hub-bard, B.: Amplified melt and flow of the Greenland ice sheetdriven by late-summer cyclonic rainfall, Nat. Geosci., 8, 647–653, https://doi.org/10.1038/ngeo2482, 2015.
Doyle, S. H., Hubbard, B., Christoffersen, P., Young, T. J., Hofstede,C., Bougamont, M., Box, J. E., and Hubbard, A.: Physical con-ditions of fast glacier flow: observations from boreholes drilled
to the bed of Store Glacier in West Greenland, J. Geophys. Res.-Earth, in review, 2017.
Eiken, T. and Sund, M.: Photogrammetric methods applied to Sval-bard glaciers: accuracies and challenges, Polar Res., 31, 18671,https://doi.org/10.3402/polar.v31i0.18671, 2012.
Evatt, G. W., Fowler, A. C., Clark, C. D., and Hulton, N. R. J.:Subglacial floods beneath ice sheets, Philos. T. R. Soc. A, 264,1769–1794, https://doi.org/10.1098/rsta.2006.1798, 2006.
Everett, A., Murray, T., Selmes, N., Rutt, I. C., Luckman,A., James, T. D., Clason, C., O’Leary, O., Karunarathna,H., Moloney, V., and Reeve, D. E.: Annual down-glacierdrainage of lakes and water-filled crevasses at Helheim Glacier,southeast Greenland, J. Geophys. Res.-Earth, 121, 1819–1833,https://doi.org/10.1002/2016JF003831, 2016.
Fried, M. J., Catania, G. A., Bartholomaus, T. C., Duncan, D.,Davis, M., Stearns, L. A., Nash, J., Shroyer, E., and Sutherland,D.: Distributed subglacial discharge drives significant submarinemelt at a Greenland tidewater glacier, Geophs. Res. Lett., 42,9328–9336, https://doi.org/10.1002/2015GL065806, 2015.
Gimbert, F., Tsai, V. C., Amundson, J. M., Bartholomaus, T. C., andWalter, J. I.: Subseasonal changes observed in subglacial channelpressure, size, and sediment transport, Geophys. Res. Lett., 43,3786–3794, https://doi.org/10.1002/2016GL068337, 2016.
Greuell, W. and Konzelmann, T.: Numerical modelling of theenergy balance and the englacial temperature of the Green-land Ice Sheet. Calculations for the ETH-Camp location (WestGreenland, 1155 m a.s.l.), Global Planet. Change, 9, 91–114,https://doi.org/10.1016/0921-8181(94)90010-8, 1994.
Hewitt, I. J.: Seasonal changes in ice sheet motion due to meltwater lubrication, Earth Planet. Sc. Lett., 371–372, 16–25,https://doi.org/10.1016/j.epsl.2013.04.022, 2013.
Howat, I. M., Joughin, I., Tulaczyk, S., and Gogineni,S.: Rapid retreat and acceleration of Helheim Glacier,east Greenland, Geophys. Res. Lett., 32, L22502,https://doi.org/10.1029/2005GL024737, 2005.
Hubbard, B. and Nienow, P.: Alpine subglacial hydrology, Qua-ternary Sci. Rev., 16, 939–955, https://doi.org/10.1016/s0277-3791(97)00031-0, 1997.
Hubbard, B. P., Sharp, M. J., Willis, I. C., Nielsen, M.K., and Smart, C. C.: Borehole water-level variations andthe structure of the subglacial hydrological system of HautGlacier d’Arolla, Valais, Switzerland, J. Glaciol., 41, 572–583,https://doi.org/10.1016/s0277-3791(97)00031-0, 1995.
Iken, A. and Truffer, M.: The relationship between subglacialwater pressure and velocity of Findelengletscher, Switzer-land, during its advance and retreat, J. Glaciol., 43, 328–338,https://doi.org/10.1017/S0022143000003282, 1997.
Jansson, P.: Water pressure and basal sliding on Stor-glaciären, northern Sweden, J. Glaciol., 41, 232–240,https://doi.org/10.1017/S0022143000016130, 1995.
Kääb, A., Lefauconnier, B., and Melvold, K.: Flowfield of Kronebreen, Svalbard, using repeated Land-sat 7 and ASTER data, Ann. Glaciol., 42, 7–13,https://doi.org/10.3189/172756405781812916, 2005.
Kamb, B., Engelhardt, H., Fahnestock, M. A., Humphrey, N., Meier,M., and Stone, D.: Mechanical and hydrologic basis for the rapidmotion of a large tidewater glacier: 2. Interpretation, J. Geophys.Res., 99, 15231–15244, https://doi.org/10.1029/94JB00467,1994.
The Cryosphere, 11, 2691–2710, 2017 www.the-cryosphere.net/11/2691/2017/
P. How et al.: Subglacial hydrology at a tidewater glacier 2709
Kargel, J. S., Leonard, G. J., Bishop, M. P., Kääb, A., and Raup,B.: Global Land Ice Measurements from Space, Springer-Verlag,Berlin, Heidelberg, https://doi.org/10.1007/978-3-540-79818-7,876 pp., 2014.
Kavanaugh, J. L.: Exploring glacier dynamics with subglacial waterpressure pulses: Evidence for self-organized criticality?, J. Geo-phys. Res., 144, F01021, https://doi.org/10.1029/2008JF001036,2009.
Kavanaugh, J. L. and Clarke, G. K. C.: Abrupt glacier motionand reorganization of basal shear stress following the establish-ment of a connected drainage system, J. Glaciol., 47, 472–480,https://doi.org/10.3189/172756501781831972, 2001.
Klok, E. and Oerlemans, J.: Model study of the spatialdistribution of the energy and mass balance of Morter-atschgletscher, Switzerland, J. Glaciol., 48, 505–518,https://doi.org/10.3189/172756502781831133, 2002.
Köhler, A., Chapuis, A., Nuth, C., Kohler, J., and Wei-dle, C.: Autonomous detection of calving-related seismic-ity at Kronebreen, Svalbard, The Cryosphere, 6, 393–406,https://doi.org/10.5194/tc-6-393-2012, 2012.
Lefeuvre, P.-M., Jackson, M., Lappegard, G., and Ha-gen, J. O.: Interannual variability of glacier basal pres-sure from a 20 year record, Ann. Glaciol., 56, 33–44,https://doi.org/10.3189/2015AoG70A019, 2015.
Lindbäck, K., Pettersson, R., Doyle, S. H., Helanow, C., Jansson,P., Kristensen, S. S., Stenseng, L., Forsberg, R., and Hubbard,A. L.: High-resolution ice thickness and bed topography of aland-terminating section of the Greenland Ice Sheet, Earth Syst.Sci. Data, 6, 331–338, https://doi.org/10.5194/essd-6-331-2014,2014.
Luckman, A., Benn, D. I., Cottier, F., Bevan, S., Nilsen,F., and Inall, M.: Calving rates at tidewater glaciers varystrongly with ocean temperature, Nat. Commun., 6, 8566,https://doi.org/10.1038/ncomms9566, 2015.
Meier, M. F. and Post, A.: Fast tidewater glaciers, J. Geophys.Res., 92, 9051–9058, https://doi.org/10.1029/JB092iB09p09051,1987.
Meier, M., Lundstrom, S., Stone, D., Kamb, B., Engelhardt, H.,Humphrey, N., Dunlap, W. W., Fahnestock, M., Krimmel, R. M.,and Walters, R.: Mechanical and hydrologic basis for the rapidmotion of a large tidewater glacier: 1. Observations, J. Geophys.Res., 99, 15219–15229, https://doi.org/10.1029/94JB00237,1994.
Messerli, A. and Grinsted, A.: Image georectification and featuretracking toolbox: ImGRAFT, Geosci. Instrum. Method. DataSyst., 4, 23–34, https://doi.org/10.5194/gi-4-23-2015, 2015.
Murray, T. and Clarke, G. K. C.: Black-box modeling of thesubglacial water system, J. Geophys. Res., 100, 10231–10245,https://doi.org/10.1029/95JB00671, 1995.
Nick, F. M., Vieli, A., Howat, I. M., and Joughin, I.:Large-scale changes in Greenland outlet glacier dynam-ics triggered at the terminus, Nat. Geosci., 2, 110–114,https://doi.org/10.1038/ngeo394, 2009.
Nienow, P., Sharp, M., and Willis, I.: Seasonal changesin the morphology of the subglacial drainage system,Haut Glacier d’Arolla, Switzerland, Earth Surf. Proc.Land., 23, 825–843, https://doi.org/10.1002/(SICI)1096-9837(199809)23:9<825::AID-ESP893>3.0.CO;2-2, 1998.
Nuth, C., Schuler, T. V., Kohler, J., Altena, B., and Hagen, J. O.:Estimating the long-term calving flux of Kronebreen, Svalbard,from geodetic elevation changes and mass-balance modelling, J.Glaciol., 58, 119–133, https://doi.org/10.3189/2012JoG11J036,2012.
Pimentel, S., Flowers, G. E., and Schoof, C. G.: A hydrologi-cally coupled higher-order flow-band model of ice dynamics witha Coulomb friction sliding law, J. Geophys. Res.-Earth, 115,F04023, https://doi.org/10.1029/2009JF001621, 2010.
Pimentel, S. and Flowers, G. E.: A numerical study of hydrologi-cally driven glacier dynamics and subglacial flooding, P. R. Soc.A., 467, 537–558, https://doi.org/10.1098/rspa.2010.0211, 2011.
Rippin, D., Willis, I., Arnold, N., Hodson, A., Moore, J., Kohler,J., and Björnsson, H.: Changes in geometry and subglacialdrainage of Midre Lovénbreen, Svalbard, determined from dig-ital elevation models, Earth Surf. Proc. Land., 28, 273–298,https://doi.org/10.1002/esp.485, 2003.
Schellenberger, T., Dunse, T., Kääb, A., Kohler, J., and Reijmer, C.H.: Surface speed and frontal ablation of Kronebreen and Kongs-breen, NW Svalbard, from SAR offset tracking, The Cryosphere,9, 2339–2355, https://doi.org/10.5194/tc-9-2339-2015, 2015.
Schild, K. M., Hawley, R. L., and Morriss, B. F.: Sub-glacial hydrology at Rink Isbræ, West Greenland inferredfrom sediment plume appearance, Ann. Glaciol., 57, 118–127,https://doi.org/10.1017/aog.2016.1, 2016.
Schoof, C.: Ice-sheet acceleration driven by melt supply variabil-ity, Nature, 468, 803–806, https://doi.org/10.1038/nature09618,2010.
Schoof, C., Rada, C. A., Wilson, N. J., Flowers, G. E., and Haseloff,M.: Oscillatory subglacial drainage in the absence of surfacemelt, The Cryosphere, 8, 959–976, https://doi.org/10.5194/tc-8-959-2014, 2014.
Shreve, R. L.: Movement of water in glaciers, J. Glaciol., 11, 205–214, 1972.
Slater, D. A., Nienow, P. W., Cowton, T. R., Goldberg, D. N., andSole, A. J.: Effect of near-terminus subglacial hydrology on tide-water glacier submarine melt rates, Geophs. Res. Lett., 42, 2861–2868, https://doi.org/10.1002/2014GL062494, 2015.
Slater, D., Nienow, P., Sole, A., Cowton, T., Mottram, R.,Langen, P., and Mair, D.: Spatially distributed runoff atthe grounding line of a large Greeenlandic tidewater glacierinferred from plume modelling, J. Glaciol., 63, 309–323,https://doi.org/10.1017/jog.2016.13, 2017.
Smeets, C. J. P. P., Boot, W., Hubbard, A., Pettersson, R., Wilhelms,F., Van Den Broeke, M. R., and Van De Wal, R. S. W.: A wirelesssubglacial probe for deep ice applications, J. Glaciol., 58, 841–848, https://doi.org/10.3189/2012JoG11J130, 2012.
Stevens, L. A., Behn, M. D., McGuire, J. J., Das, S.B., Joughin, I., Herring, T., Shean, D. E., and King,M. A.: Greenland supraglacial lake drainages triggeredby hydrologically induced basal slip, Nature, 522, 73–76,https://doi.org/10.1038/nature14480, 2013.
Straneo, F., Hamilton, G., Sutherland, D. A., Stearns, L. A., David-son, F., Hammill, M. O., Stenson, G. B., and Rosing-Asvid,A.: Rapid circulation of warm subtropical waters in a ma-jor glacial fjord in East Greenland, Nat. Geosci., 3, 36–43,https://doi.org/10.1038/nature12854, 2010.
Sugiyama, S., Skvarca, P., Naito, N., Enomoto, H., Tsutaki, S.,Tone, K., Marinsek, S., and Aniya, M.: Ice speed of a calving
www.the-cryosphere.net/11/2691/2017/ The Cryosphere, 11, 2691–2710, 2017
2710 P. How et al.: Subglacial hydrology at a tidewater glacier
glacier modulated by small fluctuations in basal water pressure,Nat. Geosci., 4, 597–600, https://doi.org/10.1038/ngeo1218,2011.
Sundal, A. V., Shepherd, A., Nienow, P., Hanna, E., Palmer, S.,and Huybrechts, P.: Evolution of supra-glacial lakes across theGreenland Ice Sheet, Remote Sens. Environ., 113, 2164–2171,https://doi.org/10.1016/j.rse.2009.05.018, 2009.
Tedstone, A., Nienow, P. W., Gourmelen, N., Dehecq, A., Goldberg,D., and Hanna, E.: Decadal slowdown of a land-terminating sec-tor of the Greenland Ice Sheet despite warming, Nature, 526,692–695, https://doi.org/10.1038/nature15722, 2015.
Vallot, D., Pettersson R., Luckman, A., Benn, D. I., Zwinger, T., vanPelt, W. J. J., Kohler, J., Schäfer, M., Claremar, B., and Hulton,N. R. H.: Surface changes influence on spatio-temporal varia-tions of basal properties for Kronebreen, Svalbard, J. Glaciol.,https://doi.org/10.1017/jog.2017.69, accepted, 2017.
Vallot, D., Åström, J., Zwinger, T., Pettersson, R., Everett, A.,Benn, D. I., Luckman, A., Van Pelt, W. J. J., and Nick, F.:Effects of undercutting and sliding on calving: a coupled ap-proach applied to Kronebreen, Svalbard, The Cryosphere Dis-cuss., https://doi.org/10.5194/tc-2017-166, in review, 2017.
Van der Veen, C. J.: Fracture propagation as means of rapidlytransferring surface meltwater to the base of glaciers, Geophys.Res. Lett., 34, L01501, https://doi.org/10.1029/2006GL028385,2007.
van Pelt, W. J. J., Oerlemans, J., Reijmer, C. H., Pohjola, V. A.,Pettersson, R., and van Angelen, J. H.: Simulating melt, runoffand refreezing on Nordenskiöldbreen, Svalbard, using a coupledsnow and energy balance model, The Cryosphere, 6, 641–659,https://doi.org/10.5194/tc-6-641-2012, 2012.
Van Pelt, W. J. J. and Kohler, J.: Modelling the long-term mass balance and firn evolution of glaciers aroundKongsfjorden, Svalbard, J. Glaciol., 61, 731–744,https://doi.org/10.3189/2015JoG14J223, 2015.
Van Pelt, W. J. J., Pohjola, V. A., and Reijmer, C. H.: Thechanging impact of snow conditions and refreezing on themass balance of Svalbard glaciers, Front. Earth Sci., 4, 102,https://doi.org/10.3389/feart.2016.00102, 2016.
Werder, M. A., Hewitt, I. J., Schoof, C. G., and Flowers, G.E.: Modeling channelized and distributed subglacial drainagein two dimensions, J. Geophys. Res.-Earth, 118, 2140–2158,https://doi.org/10.1002/jgrf.20146, 2013.
Willis, I. C., Fitzsimmons, C. D., Melvold, K., Andreaseen, L. M.,and Giesen, R. H.: Structure, morphology and water flux of a sub-glacial drainage system, Midtdalsbreen, Norway, Hydrol. Pro-cess., 26, 3810–3829, https://doi.org/10.1002/hyp.8431, 2012.
The Cryosphere, 11, 2691–2710, 2017 www.the-cryosphere.net/11/2691/2017/