Embed Size (px)
Citation preview
Rare Charm Decays from FOCUS Angel M. López
University of Puerto Rico (Mayaguez)
Outline Theory – Why Study These Decays? Basic Blind Analysis Methodology
Event Selection Problem – Background Fluctuations
Affect Limit Calculations Affect Cut Optimization
Improved Analysis Methodology - Solutions Include background statistics Dual Bootstrap
Results
EPS2003
July 19, 2003 – Aachen, Germany


Results Based on the Analysis Work of:
• Daniel Engh• Vanderbilt University
• Hugo Hernandez• University of Puerto Rico
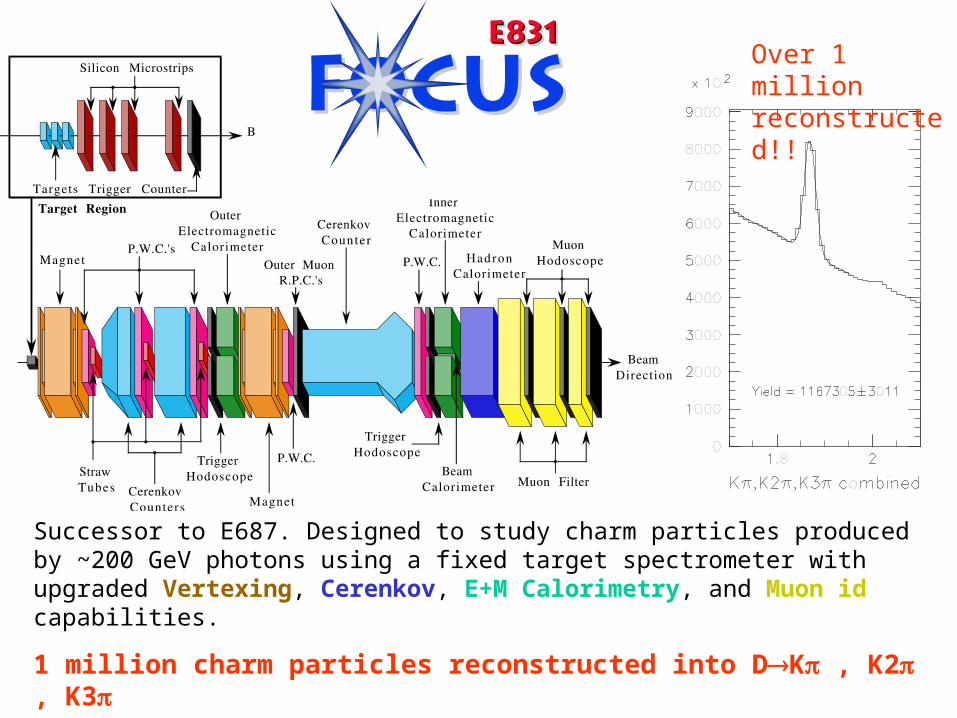
Successor to E687. Designed to study charm particles produced by ~200 GeV photons using a fixed target spectrometer with upgraded Vertexing, Cerenkov, E+M Calorimetry, and Muon id capabilities.
1 million charm particles reconstructed into DK , K2 , K3
Over 1 million reconstructed!!
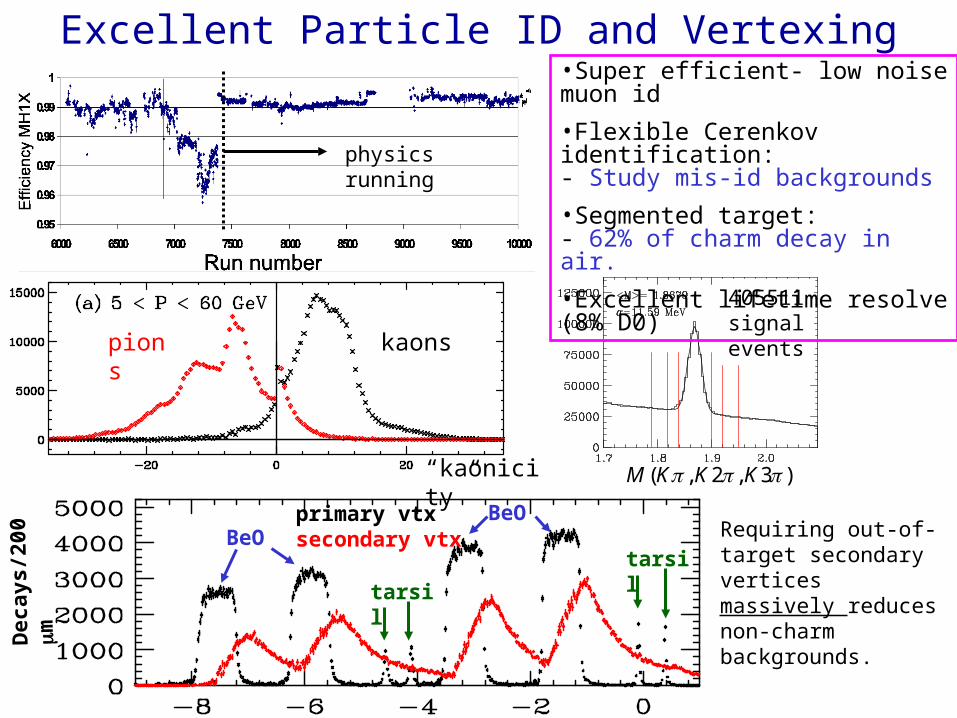
Excellent Particle ID and Vertexing
“kaonicity”
kaonspions
405511signal
events
( , 2 , 3 )M K K K
Dec
ays/
200
m
BeOBeO
tarsil
tarsil
primary vtx secondary vtx
•Super efficient- low noise muon id
•Flexible Cerenkov identification:- Study mis-id backgrounds
•Segmented target:- 62% of charm decay in air.
•Excellent lifetime resolve (8% D0)
physics running
Requiring out-of-target secondary vertices massively reduces non-charm backgrounds.
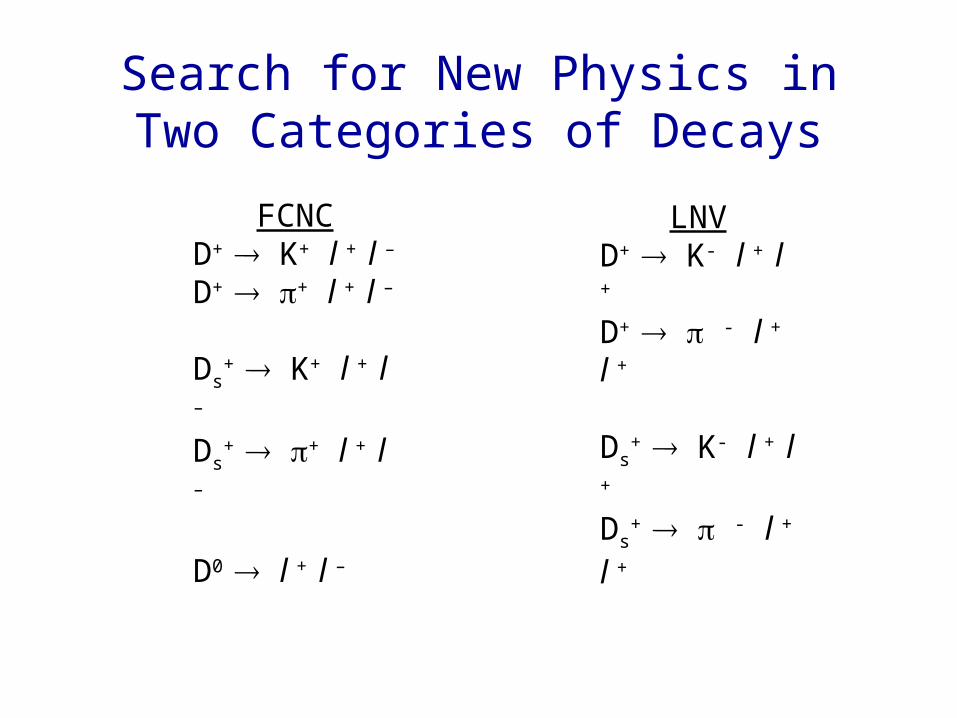
Search for New Physics inTwo Categories of Decays
FCNCD+ K+ l + l –
D+ + l + l –
Ds+ K+ l + l –
Ds+ + l + l –
D0 l + l –
LNVD+ K- l + l +
D+ - l + l +
Ds+ K- l + l +
Ds+ - l + l +
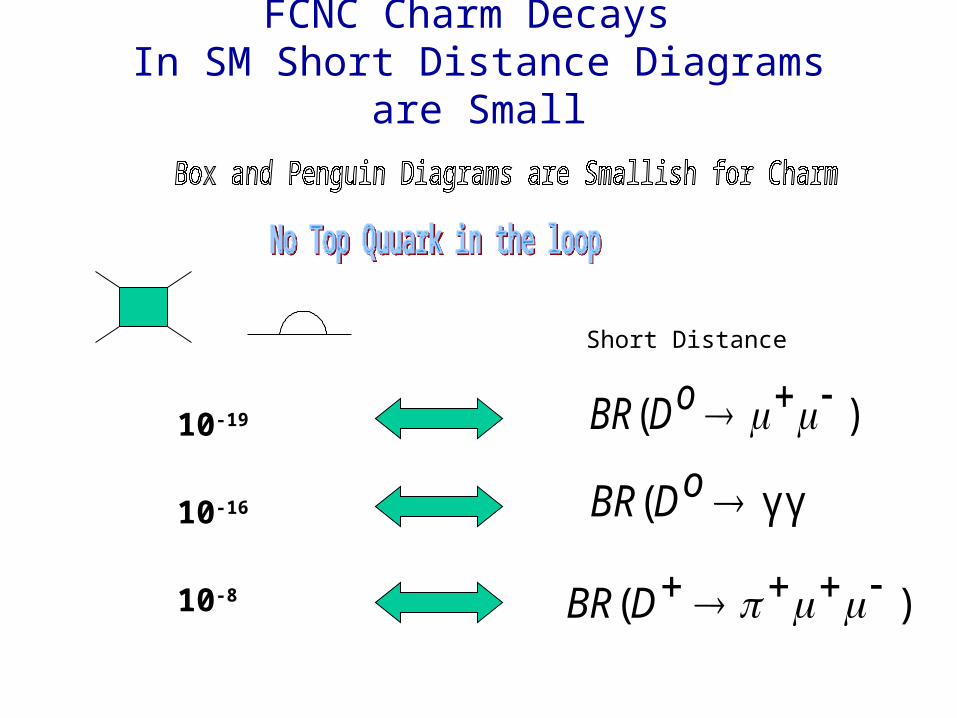
FCNC Charm Decays In SM Short Distance Diagrams are Small
10-19
10-16 γγ)( oDBR
)( oDBR
10-8 )( DBR
Short Distance
FCNC Charm Decays
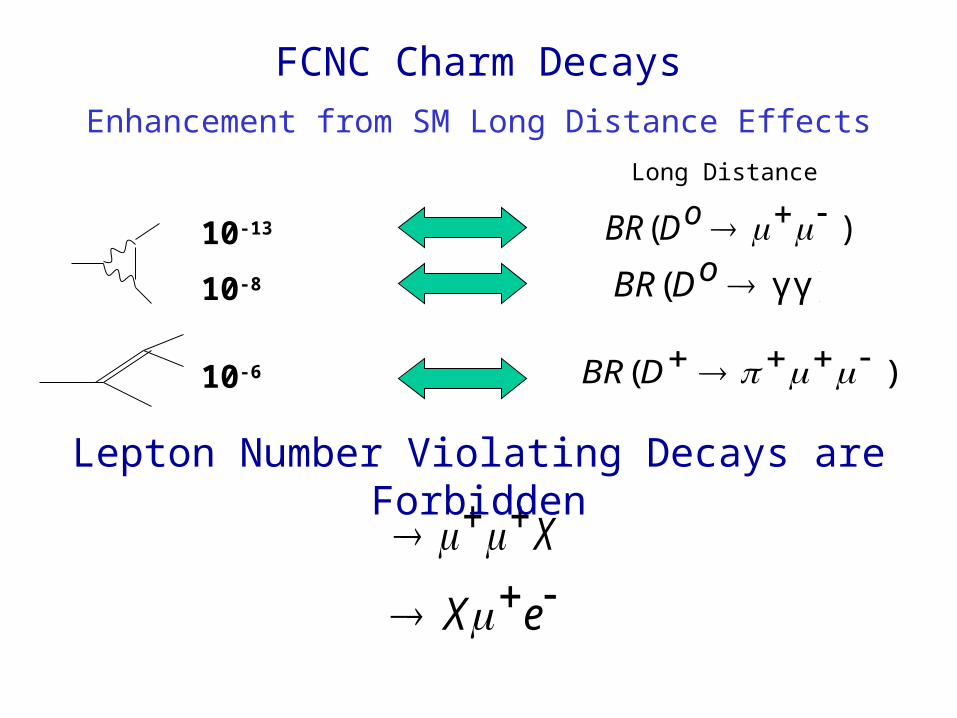
10-13
10-8 γγ)( oDBR
)( oDBR
10-6 )( DBR
Long Distance
Enhancement from SM Long Distance Effects
X eX
Lepton Number Violating Decays are Forbidden
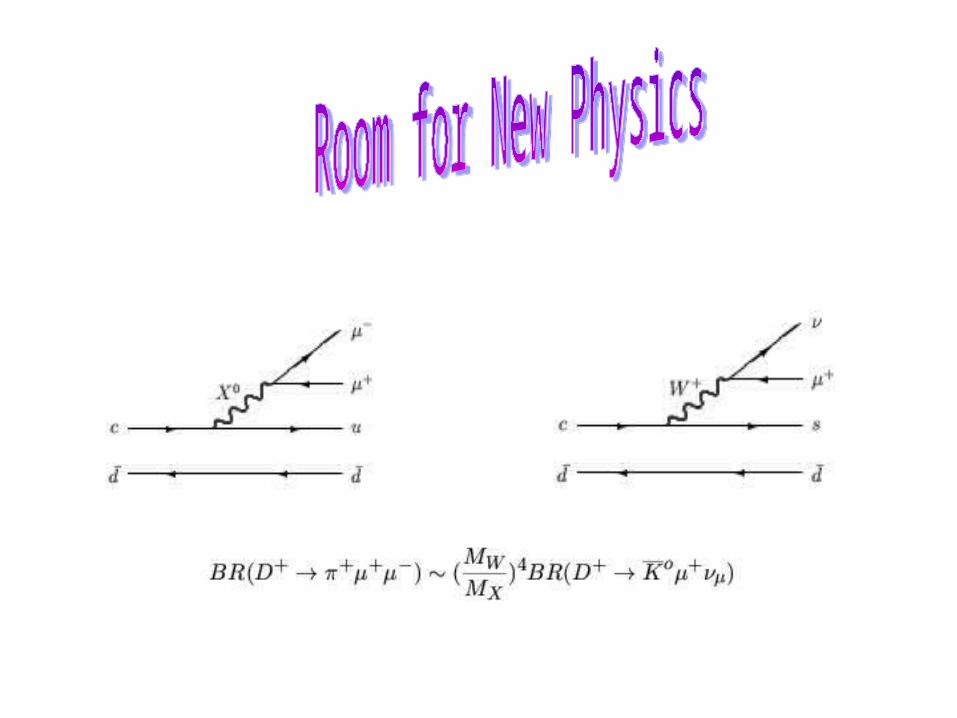
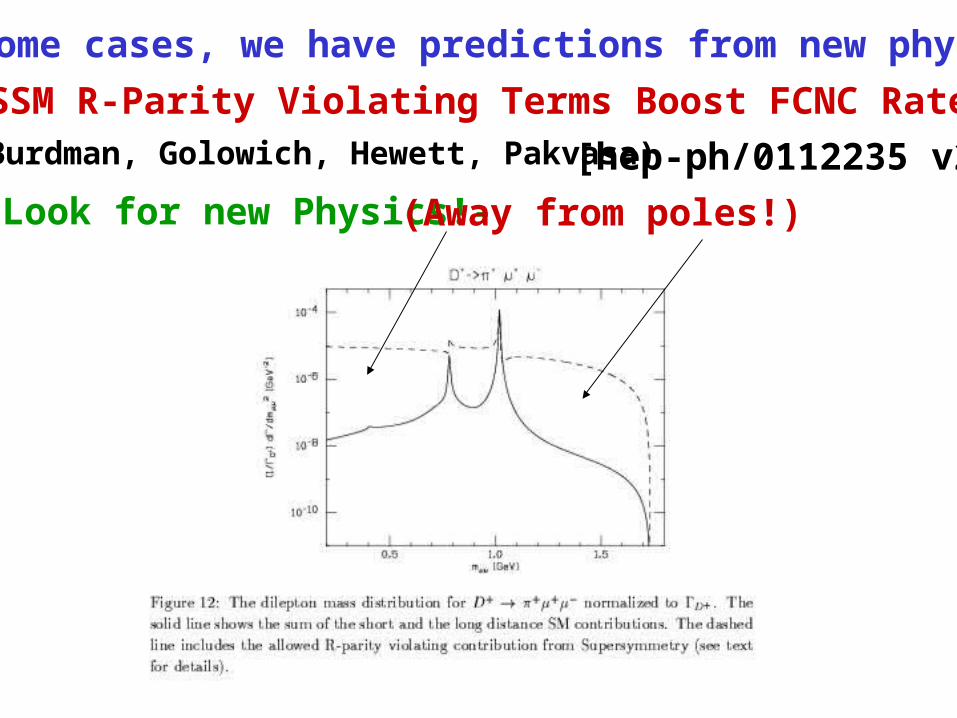
In some cases, we have predictions from new physics
MSSM R-Parity Violating Terms Boost FCNC Rates
[hep-ph/0112235 v2]
-Look for new Physics!-
(Burdman, Golowich, Hewett, Pakvasa)
(Away from poles!)
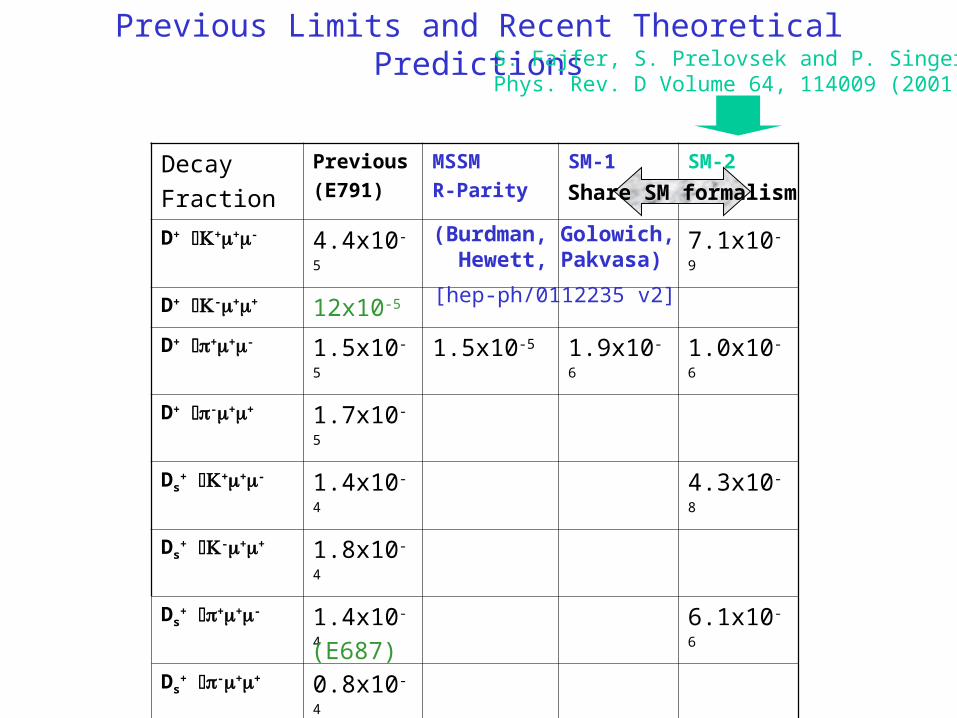
Decay
Fraction
Previous
(E791)
MSSM
R-Parity
SM-1 SM-2
D+ ++- 4.4x10⁻⁵ 7.1x10⁻⁹
D+ -++ 12x10-5
D+ ++- 1.5x10⁻⁵ 1.5x10⁻⁵ 1.9x10⁻⁶ 1.0x10⁻⁶
D+ -++ 1.7x10⁻⁵
Ds+ ++- 1.4x10⁻⁴ 4.3x10⁻⁸
Ds+ -++ 1.8x10⁻⁴
Ds+ ++- 1.4x10⁻⁴ 6.1x10⁻⁶
Ds+ -++ 0.8x10⁻⁴
D0 +- 4.1x10⁻⁶ 3.5x10⁻⁶ 3.0x10⁻¹³
Previous Limits and Recent Theoretical PredictionsS. Fajfer, S. Prelovsek and P. Singer
Phys. Rev. D Volume 64, 114009 (2001)
[hep-ph/0112235 v2]
(Burdman, Golowich, Hewett, Pakvasa)
Share SM formalism
(E687)
Basic Blind Analysis
• Skim data with loose cuts.• Consider all tight cut combinations in a cut grid.• Data sidebands are used to optimize cuts.• Data sidebands are also used to estimate background.• Open box. Look at signal region. Calculate confidence limits
from Feldman-Cousins table.
Problems:• Feldman-Cousins does not consider statistical uncertainty in
background estimate.
• Use of the same data to both select cuts and to estimate background biases the latter.
Event Selection Criteria• Vertexing (Candidate driven)
– Secondary vertex• Confidence Level (CLS)• Isolation - No other tracks come from that
vertex. (ISOS)– Primary vertex
• Require consistent with D track from secondary• Confidence Level (CLP)• Require a minimum multiplicity• Isolation - No tracks from secondary are
consistent with coming from the primary.(ISOP)• In target (z position)
– Detachment (L/)
More Event Selection Criteria
• Muon Identification– Number of Muon Planes with Hits (Mupl) – Confidence Level (MuCL)– Minimum momentum– Not consistent with being a kaon.
• Hadron identification – Triple Cerenkov System– Log likelihood for consistency between Cerenkov hits and a
particular particle id hypothesis– Compare log likelihoods for different species (Kaonicity)
Fixed (loose) Cuts for Two Body Mode
• Vertexing– CLP and CLS > 1%– Primary Multiplicity > 2– L/ > 3
• Muon Identification– Mupl 4– MuCL > 1%
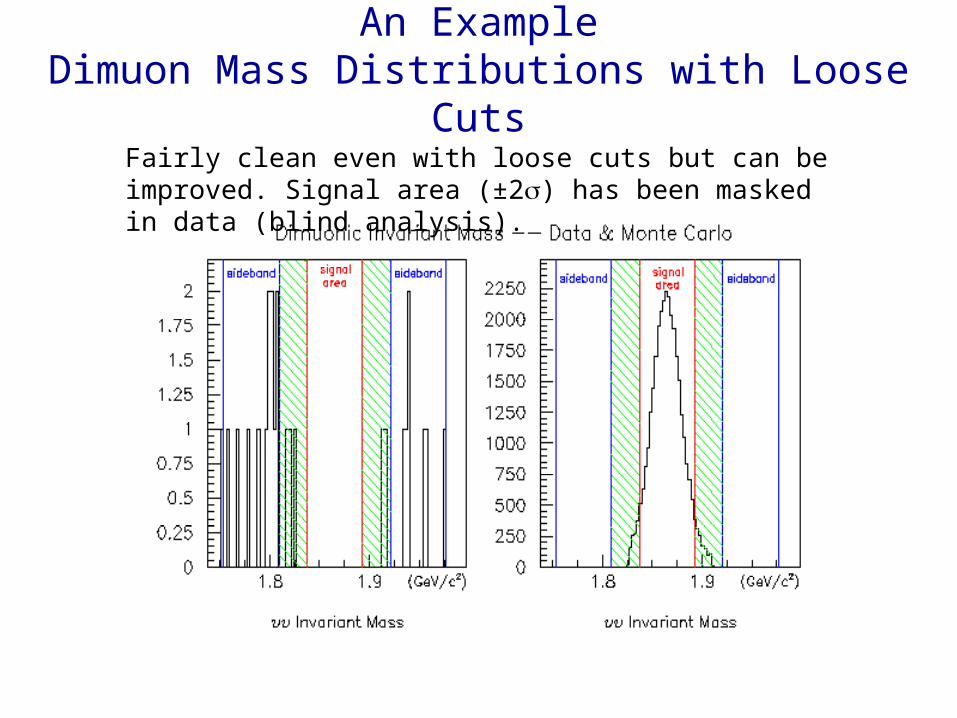
An ExampleDimuon Mass Distributions with Loose Cuts
Fairly clean even with loose cuts but can be improved. Signal area (±2) has been masked in data (blind analysis).
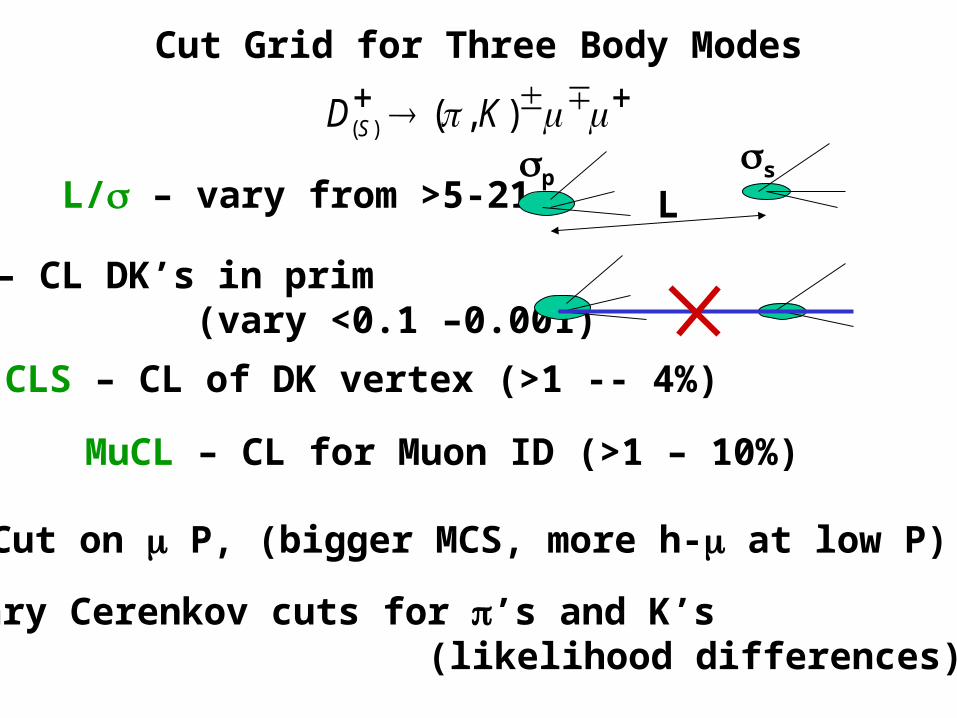
Cut Grid for Three Body Modes
L/ – vary from >5-21 Lp
s
ISOP – CL DK’s in prim (vary <0.1 –0.001)
Vary Cerenkov cuts for ’s and K’s (likelihood differences)
CLS – CL of DK vertex (>1 -- 4%)
MuCL – CL for Muon ID (>1 – 10%)
Cut on P, (bigger MCS, more h- at low P)
),()( KD S
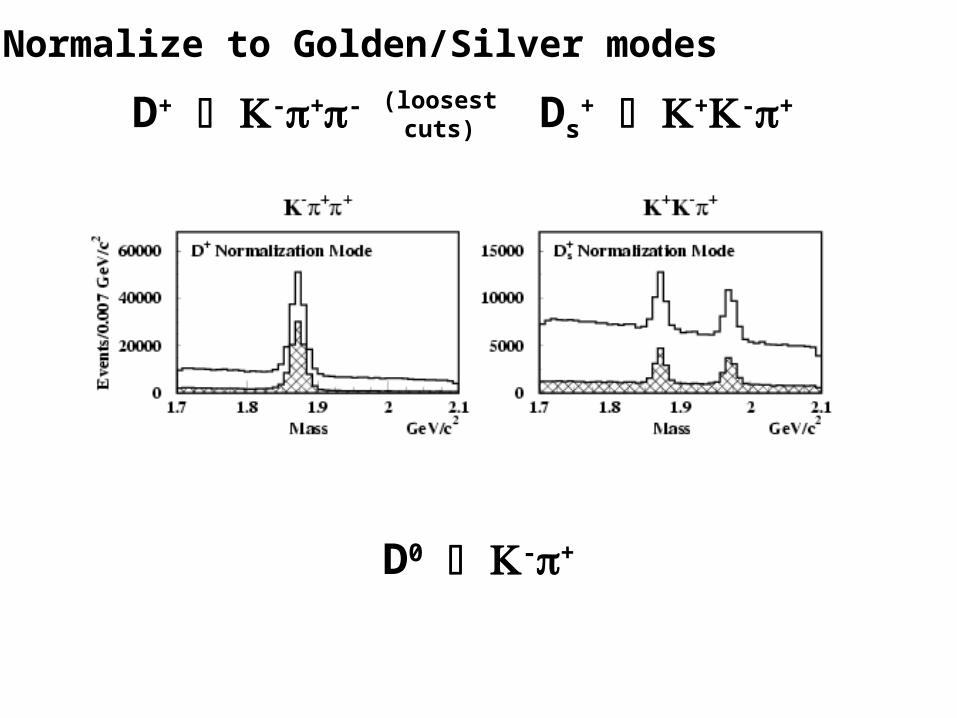
Normalize to Golden/Silver modes
Ds+ +-+D+ -+- (loosest
cuts)
D0 -+
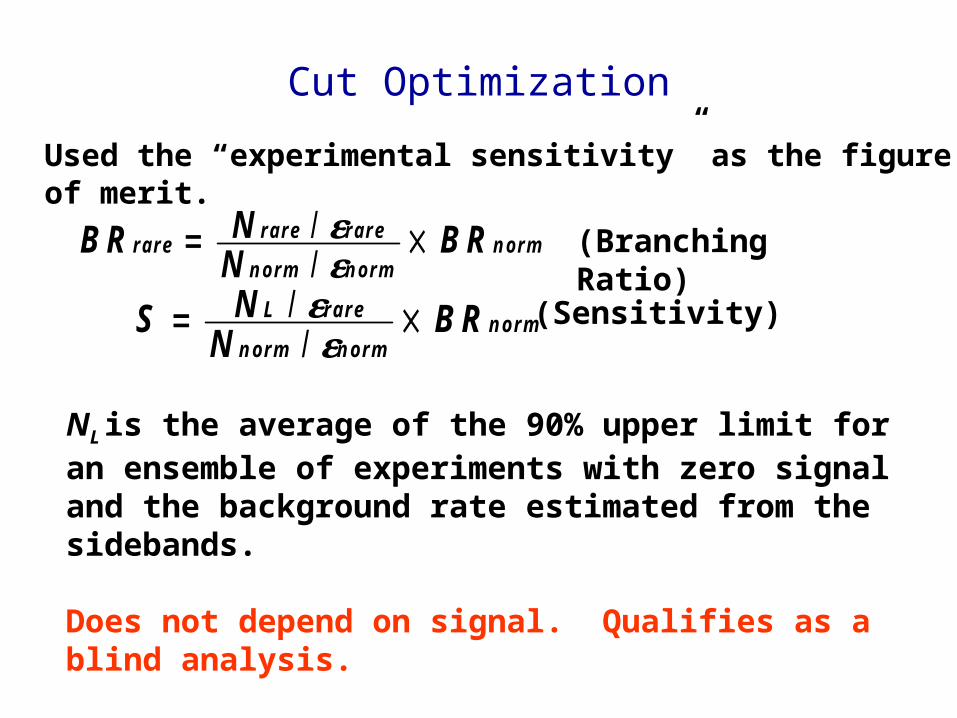
Cut Optimization
Used the “experimental sensitivity” as the figure of merit.
B R NN
B Rra rera re ra re
n o rm n o rmn o rm /
/
S NN
B RL ra re
n o rm n o rmn o rm /
/
(Branching Ratio)
(Sensitivity)
NL is the average of the 90% upper limit for an ensemble of experiments with zero signal and the background rate estimated from the sidebands.
Does not depend on signal. Qualifies as a blind analysis.
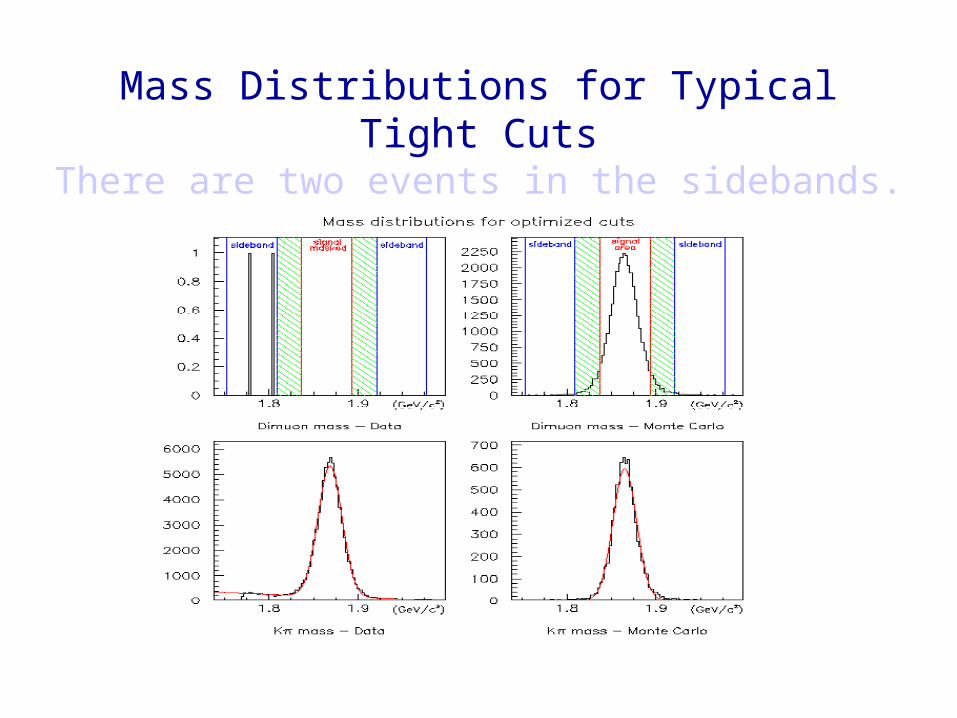
Mass Distributions for Typical Tight Cuts
There are two events in the sidebands.
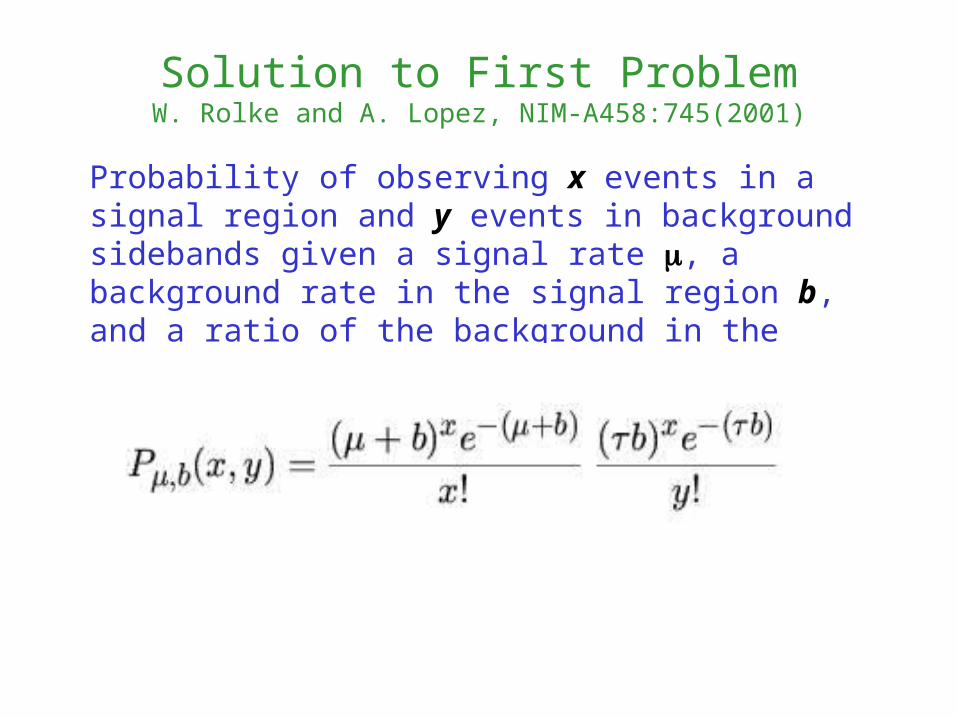
Solution to First ProblemW. Rolke and A. Lopez, NIM-A458:745(2001)
Probability of observing x events in a signal region and y events in background sidebands given a signal rate , a background rate in the signal region b, and a ratio of the background in the sidebands to the signal region :
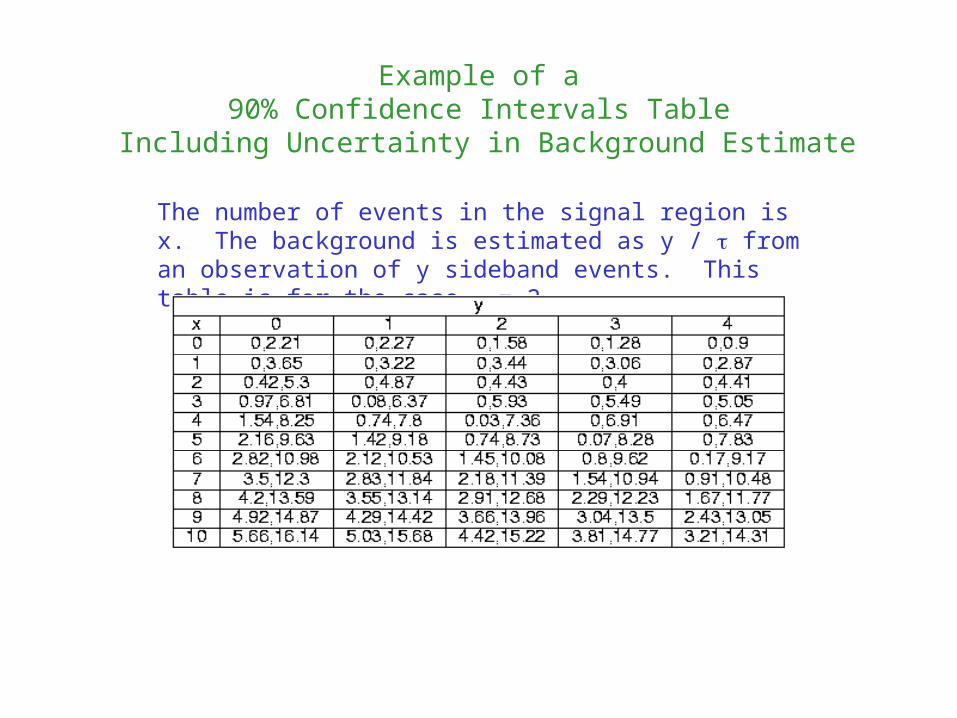
Example of a90% Confidence Intervals Table
Including Uncertainty in Background Estimate
The number of events in the signal region is x. The background is estimated as y / from an observation of y sideband events. This table is for the case = 2.
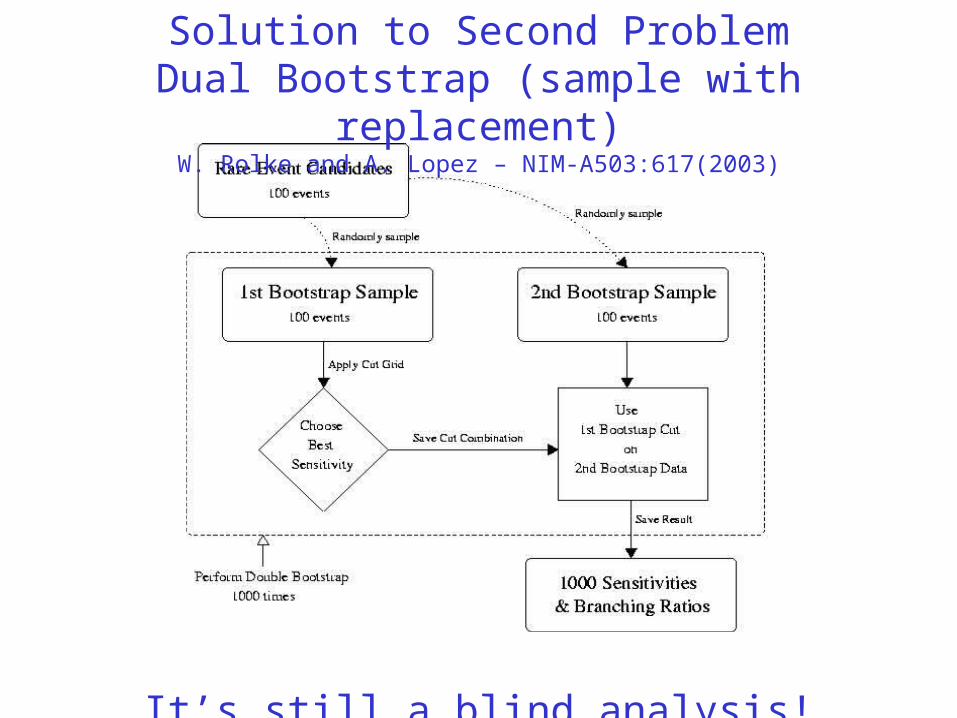
Solution to Second ProblemDual Bootstrap (sample with replacement)
W. Rolke and A. Lopez – NIM-A503:617(2003)
It’s still a blind analysis!
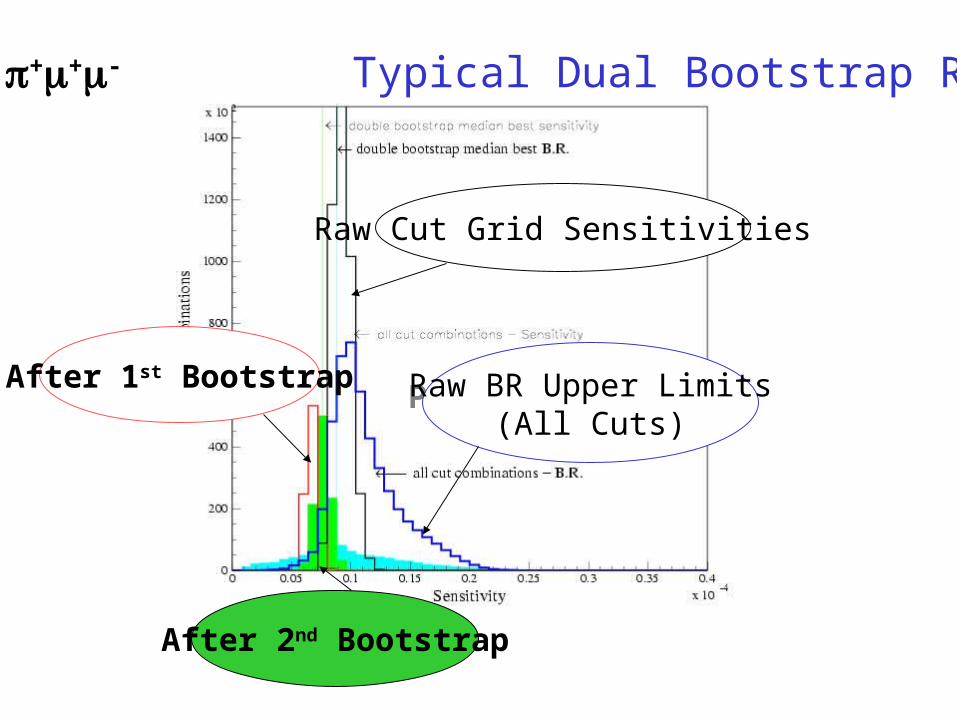
After 1st Bootstrap
After 2nd Bootstrap
Raw Cut Grid Sensitivities
D+ ++- Typical Dual Bootstrap Results
PreliminaryRaw BR Upper Limits(All Cuts)
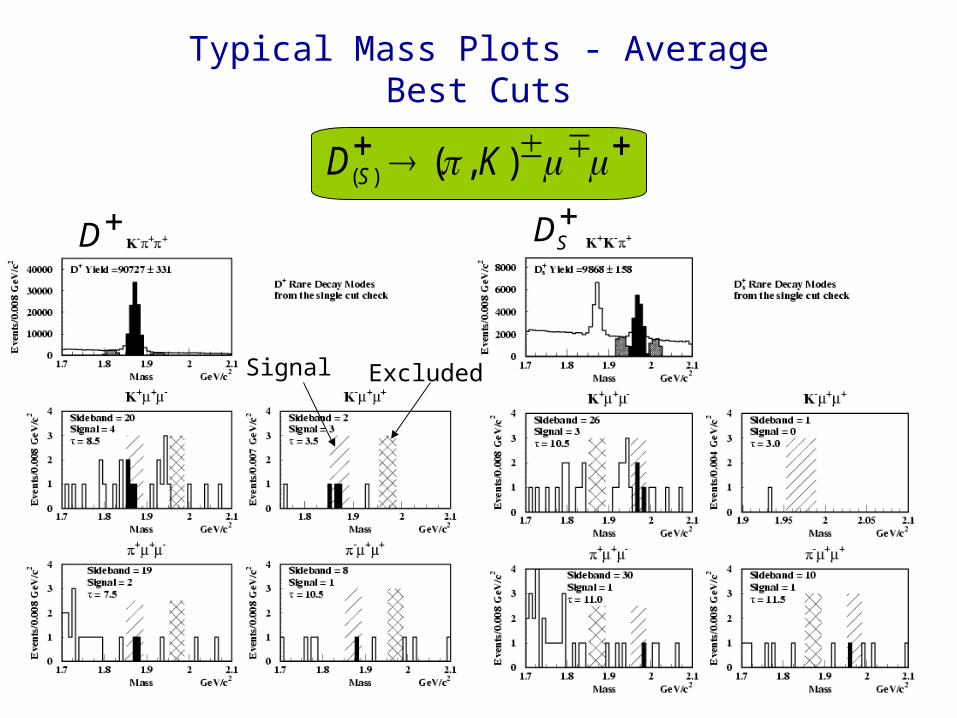
Typical Mass Plots - Average Best Cuts
),()( KD S
Signal Excluded
DSD
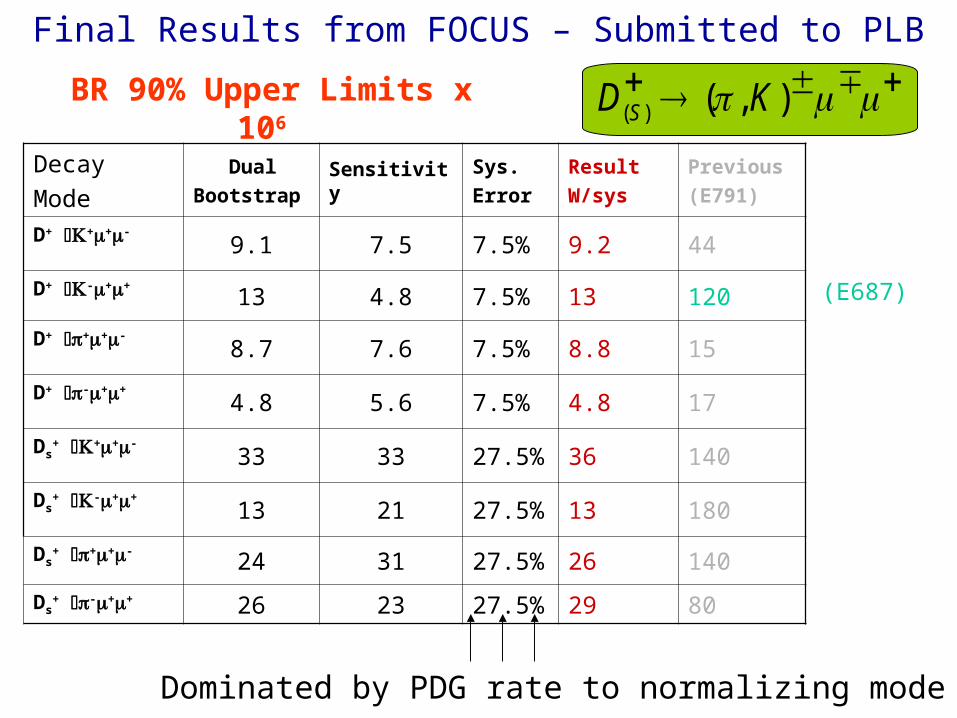
Decay
Mode Dual
BootstrapSensitivity
Sys.
Error
Result
W/sys
Previous
(E791)
D+ ++-
9.1 7.5 7.5% 9.2 44
D+ -++13 4.8 7.5% 13 120
D+ ++-
8.7 7.6 7.5% 8.8 15
D+ -++
4.8 5.6 7.5% 4.8 17
Ds+ ++-
33 33 27.5% 36 140
Ds+ -++
13 21 27.5% 13 180
Ds+ ++-
24 31 27.5% 26 140
Ds+ -++ 26 23 27.5% 29 80
(E687)
Dominated by PDG rate to normalizing mode
),()( KD S
Final Results from FOCUS – Submitted to PLB
BR 90% Upper Limits x 106
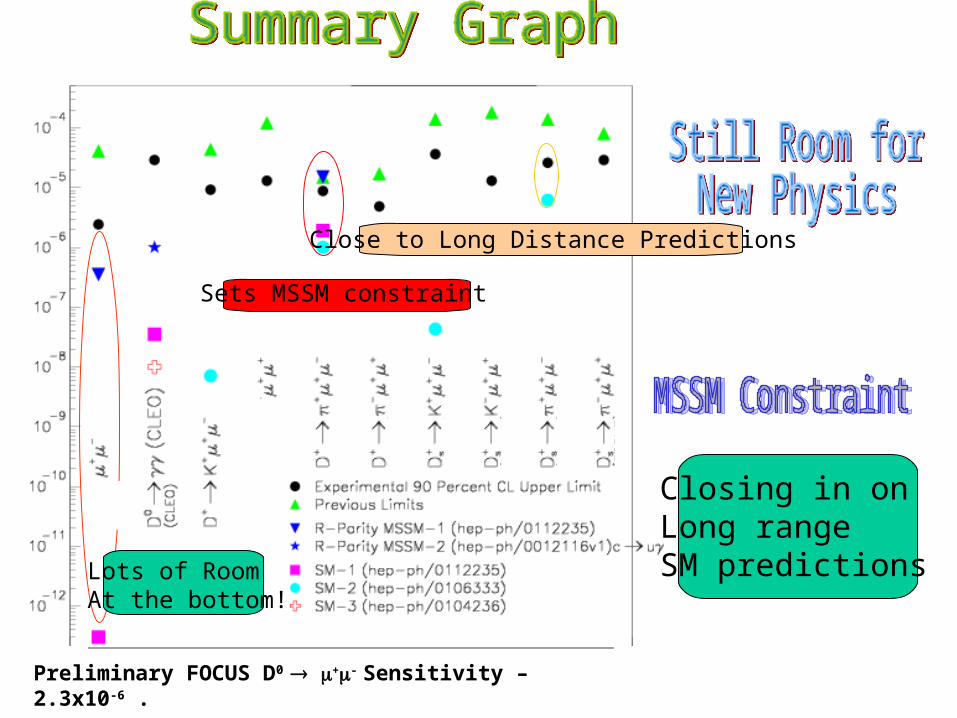
Closing in on Long rangeSM predictions
Sets MSSM constraint
Close to Long Distance Predictions
Lots of RoomAt the bottom!
Preliminary FOCUS D0 +- Sensitivity – 2.3x10⁻⁶ .
SUMMARY
(1) An improved methodology for the analysis of small signals has been developed.
(2) FOCUS obtains upper limits for several rare and forbidden decays which are approximately an order of magnitude lower than existing.
(3) FOCUS FCNC limits are below R-parity violating MSSM model predictions.

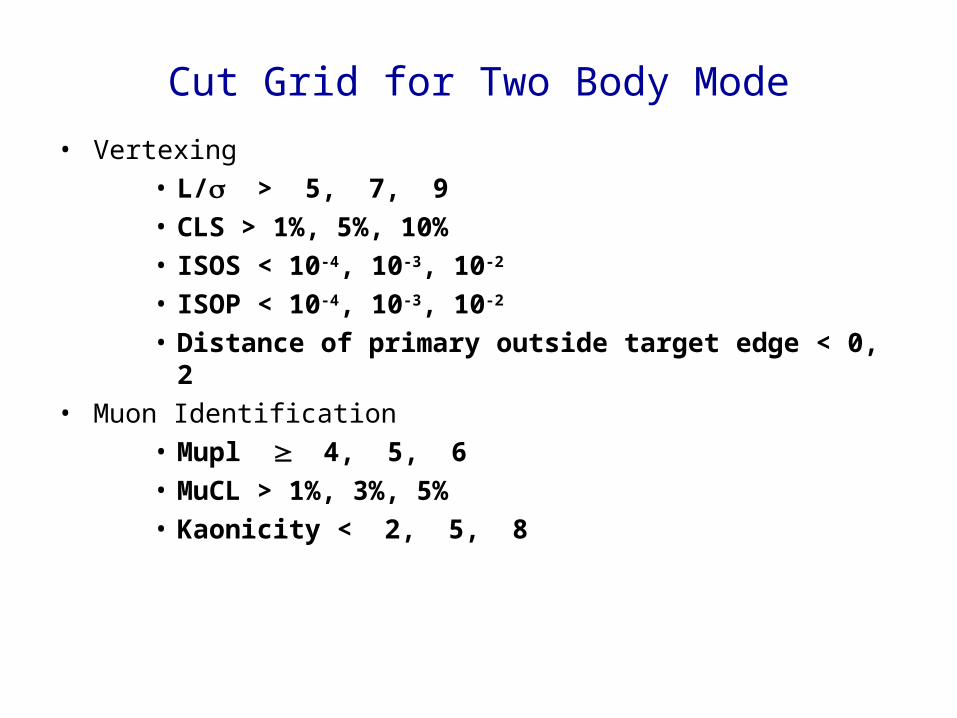
Cut Grid for Two Body Mode
• Vertexing• L/ > 5, 7, 9• CLS > 1%, 5%, 10%• ISOS < 10-4, 10-3, 10-2
• ISOP < 10-4, 10-3, 10-2
• Distance of primary outside target edge < 0, 2• Muon Identification
• Mupl 4, 5, 6• MuCL > 1%, 3%, 5%• Kaonicity < 2, 5, 8
A reminder during
“Journeys of an Accidental Statistician”[Gary Feldman, Fermilab conference on CL, March 2000] from the 1998
PDG [Euro. Phys. J. C3(1998)]:
“…we suggest that… a measure of sensitivity should be reported whenever expected
background is larger or comparable to the number of observed counts.”
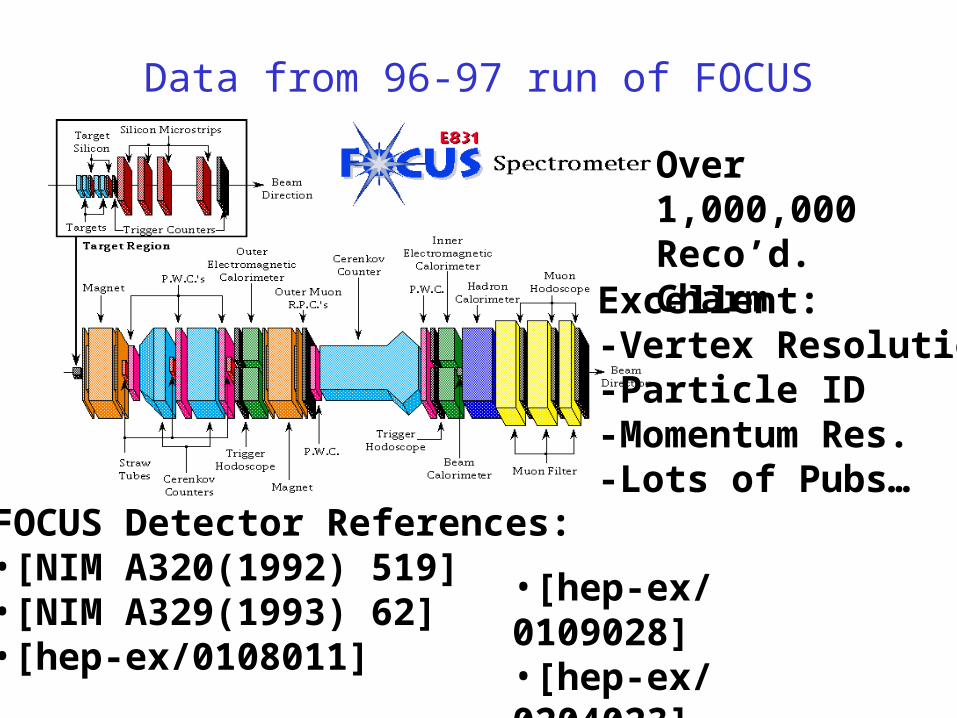
Data from 96-97 run of FOCUS
Over 1,000,000Reco’d. Charm
Excellent:-Vertex Resolution-Particle ID-Momentum Res.-Lots of Pubs…
FOCUS Detector References:•[NIM A320(1992) 519]•[NIM A329(1993) 62]•[hep-ex/0108011]
•[hep-ex/0109028]•[hep-ex/0204023]
Improvements to Small Signal Search MethodologyHandling of Background Fluctuations
1. In predicting background in the signal region.
Good cuts minimize background and often lead to background samples with limited statistics. Previously existing method (Feldman-Cousins) does not take into account background uncertainty. Our method (NIM-A458:745-758) provides the correct statistical treatment and always gives physical limits with the correct coverage.
2. In the selection of optimum cuts.
In a blind analysis, cuts are optimized on background but fluctuations bias the background prediction. The basic problem is that the same sample is used for optimization and for prediction. A solution based on the “bootstrap” procedure has been submitted to NIM. Bootstrap means sampling with replacement. In our “dual bootstrap” one sample is used for optimization and another for prediction.