Embed Size (px)
DESCRIPTION
RARE EARTH METALS
Citation preview
Final Report for The Greens/EFA Group
in the European Parliament
Authors :
Dr. Doris Schüler
Dr. Matthias Buchert
Dipl.-Ing. Ran Liu
Dipl.-Geogr. Stefanie Dittrich
Dipl.-Ing. Cornelia Merz
www.oeko.de
www.resourcefever.org
Öko-Institut e.V. Freiburg Head Office P.O. Box 17 71 79017 Freiburg. Germany Tel. +49 (0) 7 61 – 45 295 - 0 Fax +49 (0) 7 61 – 45 295 - 88 Street Address Merzhauser Str. 173 79100 Freiburg. Germany Tel. +49 (0) 761 – 45 295 - 0 Fax +49 (0) 761 – 45 295 - 88 Darmstadt Office Rheinstraße 95 64295 Darmstadt. Germany Tel. +49 (0) 6151 – 81 91 - 0 Fax +49 (0) 6151 – 81 91 - 33 Berlin Office Schicklerstr. 5-7 10179 Berlin. Germany Tel. +49 (0) 30 – 40 50 85 - 0 Fax +49 (0) 30 – 40 50 85 - 388
Study on Rare Earths and Their Recycling
Darmstadt, January 2011
Acknowledgements
Authors
Dr. Doris Schüler (Öko-Institut e.V.)
Dr. Matthias Buchert (Öko-Institut e.V.)
Dipl.-Ing. Ran Liu (Öko-Institut e.V.)
Dipl.-Geogr. Stefanie Dittrich (Öko-Institut e.V.)
Dipl.-Ing. Cornelia Merz (Öko-Institut e.V.)
Assistance
Nicole Neurohr (Öko-Institut e.V.)
Vanessa Cook (Öko-Institut e.V.)
We would like to thank the following colleagues for their input and constructive comments:
Dr. Georg Mehlhart (Öko-Institut e.V.)
Dipl.-Ing. Gerhard Schmidt (Öko-Institut e.V.)
Dipl.-Geogr. Andreas Manhart (Öko-Institut e.V.)
For further information please contact:
Dr. Doris Schüler
Infrastructure & Enterprises Division
Öko-Institut e.V. Darmstadt office
Email: [email protected]
Note: Within the scope of this study, Öko-Institut has used and assessed numerous primary sources in a carefully neutral fashion, complying all the time with established principles of research. Nevertheless Öko-Institut cannot guarantee that the forecasted will actually occur, particularly in the case of the supply-and-demand-balance, since – as the study shows – there are numerous factors of influence which can change at short notice.
.
Study on Rare Earths and Their Recycling
1
I List of Contents
II Executive Summary I - VI
III Final Report
1 Introduction 1
2 Methodologies for determination of criticality 3
3 Reserves 7
3.1 Global reserves 7
3.2 Reserves in China 8
3.3 Reserves outside of China 13
4 Mining data 18
4.1 World production 18
4.2 Mining in China 19
4.3 Mining activities outside of China 20
5 Global rare earth processing 25
5.1 Rare earth processing in China 25
5.1.1 Production statistics 25
5.1.2 The Chinese policy concerning the rare earth processing industry 30 5.1.2.1 Entry criteria for rare earth industry 30 5.1.2.2 The 2009-2015 plans for developing the rare earth industry 31
5.2 Rare earth processing outside of China 32
6 Rare earth trade 35
6.1 Global rare earths imports 35
6.2 Global rare earth exports 36
Study on Rare Earths and Their Recycling
2
6.2.1 Chinese rare earth exports 36
6.2.2 Non-Chinese rare earth exports 38
6.3 Development of prices 39
7 Environmental aspects of rare earth mining and processing 42
7.1 Overview of the main process steps in mining and processing 42
7.2 Environmental risks 43
7.3 Environmental aspects of mining and processing in China 47
7.3.1 Overview 47
7.3.2 Implemented technologies for mining and processing in China 48
7.3.3 Bayan Obo mine 49
7.3.4 Sichuan mine 50
7.3.5 Ion adsorption deposits 50
7.3.6 Waste water from REE separation and refining 51
7.3.7 Chinese environmental policy 51 7.3.7.1 Entry criteria for rare earth industry 51 7.3.7.2 The 2009-2015 plans for developing the rare earth industry 52 7.3.7.3 Emission standards of pollutants from rare earths industry 53
7.3.8 Chinese research activities on clean production of rare earths 53
7.4 Environmental aspects of mining and processing outside of China 55
7.4.1 General outlook 55
7.4.2 Mountain Pass, California, USA 56
7.4.3 Mount Weld, Australia and processing in Malaysia 57
7.4.4 Kvanefjeld, Greenland 58
7.5 Resource efficiency 59
8 Applications and demand of rare earths 62
8.1 Overview of applications and their demand in 2008 62
8.2 Magnets 66
8.2.1 Electric and hybrid electric vehicles 67
8.2.2 Wind turbines 69
8.2.3 Hard disks and electronic components with Nd-magnets 71
8.2.4 Magnetic cooling 72
8.2.5 Compilation of forecasts for the field of Nd-magnets 73
8.3 Phosphors and luminescence 75
8.4 Metal alloys / batteries 77
8.4.1 Ni-MH batteries 78
Study on Rare Earths and Their Recycling
3
8.4.2 Other appliances 79
8.4.3 Overall forecast 79
8.5 Catalysts 79
8.6 Glass, polishing and ceramics 80
8.7 Others 82
9 Demand-supply balance 84
9.1 Future supply 84
9.2 Future demand 88
9.3 Future demand-supply balance 89
10 Substitution and efficient use of rare earths 93
10.1 Overview 93
10.2 Magnets for motors and generators 93
10.2.1 Motor and generator types 93
10.2.2 Substitution of rare earths magnets in motors for electric vehicles 95
10.2.3 Substitution of rare earths in generators for wind turbines 96
10.2.4 Substitution of dysprosium and terbium in permanent magnets 97
10.2.5 Substitution of neodymium magnets by SmCo magnets 98
10.2.6 Substitution of rare earths demands by enhanced process efficiencies 99
10.3 Magnets in electronic devices, mainly disk drives 99
10.4 Batteries 100
10.5 Lighting and luminescence 101
10.5.1 Fluorescent lamps 102
10.5.2 Electro-luminescence 103
10.6 Catalysts 103
11 Recycling of rare earths – current situation 105
11.1 Recycling of rare earths from magnets 105
11.2 Recycling of rare earths from batteries 106
11.3 Recycling of rare earths from lighting and luminescence 107
11.4 Recycling of rare earths from catalysts 107
11.5 Recycling of rare earths from other applications 108
11.6 Challenges for an efficient rare earths recycling 108
12 Strategy for a sustainable rare earth economy 111
12.1 Background 111
Study on Rare Earths and Their Recycling
4
12.2 Development of recycling schemes 112
12.2.1 European competence network on rare earth 113
12.2.2 Basic research on rare earth processing 114
12.2.3 European material flow analysis 114
12.2.4 Identification of initial products 114
12.2.5 Development of collection and pre-treatment schemes 115
12.2.6 Development of pilot plants 115
12.2.7 Financial issues 115
12.2.8 Legal framework 116
12.2.9 Large scale implementation 117
12.3 Strategy for enabling a more efficient use of rare earth and substitution 119
12.4 International aspects 120
12.4.1 Co-operation with China on sustainable rare earth mining 120
12.4.2 Promotion of environmentally-friendly mining 121
12.4.3 Supporting sustainable development in Greenland 123
13 Literature 125
List of Conclusions
Conclusion on methodologies for determination of criticality 6
Conclusion on reserves 17
Conclusion on mining 24
Conclusion on global rare earth processing 34
Conclusion on rare earth trade 41
Conclusion on environmental aspects of rare earth mining and processing 61
Conclusion on applications and demand of rare earths 83
Conclusion on the demand-supply balance 92
Conclusion on substitution and efficient use of rare earths 104
Conclusion on current situation of rare earth recycling 110
Conclusion on the development of a recycling scheme 118
Conclusion on recommended international activities 124
Study on Rare Earths and Their Recycling
5
List of Figures
Figure 1 Steps towards a European rare earth recycling scheme IV
Figure 2 Rare earth elements and their position in the periodic table 2
Figure 3 Global rare earth reserves by country estimated by USGS (2010a) 7
Figure 4 Distribution of major rare earth resources in China 9
Figure 5 Rare earth composition of bastnaesite at Bayan Obo/Inner Mongolia (Wang 2009) 12
Figure 6 Rare earth composition of two ore deposits in the Jiangxi Province in southern China (Wang 2009) 12
Figure 7 Reserve estimations of selected deposits which are compliant with the JORC code according to Alkane (2010b) 15
Figure 8 Global production of rare earth oxides [in thousand t] (Angerer et al 2009) 19
Figure 9 Share of individual rare earth oxides at the Chinese production in 2006 (MEP 2009) 26
Figure 10 Process steps and national shares of neodymium magnet production (GAO 2010, Molycorp 2010c) 33
Figure 11 Share of different EU countries in the total rare earth compounds imported by the EU-27 (Eurostat 2010) 36
Figure 12 Gross exportation volume of rare earths from 1979 to 2008 in China (Chen 2010) 37
Figure 13 Prices for lanthanum, cerium, neodymium, europium, dysprosium and terbium oxides from 2001-2010 39
Figure 14 Main process steps in REE mining and processing 42
Figure 15 Risks of rare earth mining without or with insufficient environmental protection systems 44
Figure 16 Global demand of rare earths by volume from 2006 to 2008, in t REO per year 62
Figure 17 Global applications of rare earth elements (compiled by Öko-Institut) 63
Figure 18 Global demand of rare earths in terms of economic value in 2008 according to Kingsnorth (2010) 64
Figure 19 Demand of rare earths per volume in China in t REO in 2008 (Chen 2010) 65
Figure 20 Global wind power capacities in June 2010 (WWEA 2010b) 69
Figure 21 Newly installed wind power capacity in the first half of 2010 (WWEA 2010b) 70
Figure 22 Expected advantages of magnetic cooling 73
Figure 23 Steps towards a European rare earth recycling scheme 113
Study on Rare Earths and Their Recycling
6
List of Tables
Table 3-1 Distribution of REE reserves in tons REO (MEP 2009) 8
Table 3-2 REE resources in China: types of minerals and ore grades (Lin 2009) 10
Table 3-3 The distribution of ion adsorption deposits in the South of China (MEP 2009) 10
Table 3-4 Components of China’s major rare earth minerals in REO% (Wang 2009) 11
Table 3-5 Rare earth reserves by countries according to USGS (2010a) 13
Table 3-6 Yttrium reserves by countries according to USGS (2010b) 14
Table 4-1 World production of rare earths 2008 and 2009 (USGS 2010a) 18
Table 4-2 Chinese production of rare earth concentrates from the different types of minerals from 2000 to 2007 in t REO 20
Table 4-3 Selected current pre-mining activities outside of China (compiled by Öko-Institut) 22
Table 5-1 Production of rare earth carbonate and chloride from 1987 to 2006 in t REO (MEP 2009) 27
Table 5-2 Production of major rare earth oxides from 1986 to 2006 in t REO (MEP 2009) 28
Table 5-3 Production of polishing powder and metal alloys from 1987 to 2006 in t REO (MEP 2009) 29
Table 5-4 Production of major single rare earth metals from 1987 to 2006 in t REO (MEP 2009) 30
Table 5-5 Selected industrial activities in rare earth processing in Europe 32
Table 6-1 Imports of rare earth compounds of Europe, United States and Japan in 2008 35
Table 6-2 Chinese rare earths exports of state and foreign-invested enterprises from 2008 - 2010 (MOFCOM 2010b) 37
Table 6-3 Export quota only for domestic Chinese-invested enterprises for 2008, 2009 and the first half of 2010 (MOFCOM 2010b) 38
Table 6-4 Exports of semi-products of rare earths of Japan, USA and Europe in 2008 39
Table 6-5 Prices of selected rare earths oxides on 22 Nov 2010* 40
Table 6-6 Prices of selected rare earths metals on 22 Nov 2010* 40
Table 7-1 Major risks of REE mining and processing with insufficient environmental techniques 46
Table 7-2 Overview of mining, extraction and separation methods adopted in China's rare earth industry (compiled based on MEP 2009) 48
Table 8-1 Application of rare earths in China in 2007 and 2008 (Chen 2010) 66
Study on Rare Earths and Their Recycling
7
Table 8-2 Compilation of estimates for the demand of magnet applications (in t/a) 74
Table 8-3 Overview of main applications in the group “glass, polishing and ceramics” 80
Table 8-4 Overview of main applications in the group „others “ 82
Table 9-1 Forecasted supply in 2014 stated by Kingsnorth (2010) and Lynas (2010a) 87
Table 9-2 Forecasted demand in 2014 by Kingsnorth (2010) and Lynas (2010a) 88
Table 9-3 Forecasted supply-demand balance for individual rare earths in 2014 by Kingsnorth (2010) and Lynas (2010a) 89
Study on Rare Earths and Their Recycling
8
List of Abbreviations
°C degree Celsius
a anno = year
AFP Analytical fingerprint
BAM Barium magnesium aluminate
CAT Cerium magnesium aluminate
Ce Cerium
CFL Compact fluorescent lamps
Co Cobalt
Dy Dysprosium
e.g. exempli gratia = for example
e-bikes electric bikes
EC European Commission
EIB European Investment Bank
EL electro-luminescence
ELV End of life vehicle
e-mobility electric mobility
Er Erbium
etc et cetera
Eu Europium
EU-27 Austria, Belgium, Bulgaria, Cyprus, Czech Republic, Germany, Denmark,
Estonia, Spain, Finland, France, United Kingdom, Greece, Hungary, Ireland,
Italy, Lithuania, Luxembourg, Latvia, Malta, Netherlands, Poland, Portugal,
Romania, Sweden, Slovenia, Slovakia
EV Electric Vehicle
FCC Fluid cracking catalyst
Gd Gadolinium
GMEL Greenland Minerals and Energy Ltd.
Hci coercivity
HCl Hydrochloric acid
HDD Hard disk drive
HEV Hybrid Electric Vehicle
HID High intensity discharge (lamp)
Ho Holmium
Study on Rare Earths and Their Recycling
9
HREE Heavy Rare Earth Element
HTS High temperature superconductor
JOGMEC Japan Oil, Gas and Metals National Corporation
JORC Australasian Joint Ore Reserves Committee
K Potassium
kW Kilowatt
La Lanthanum
LAP Lanthanum phosphate
LCD Liquid crystal display
LED Light Emitting Diode
Li-ion battery Lithium ion battery
LREE Light Rare Earth Element
Lu Lutetium
MFA Material flow analysis
mg Milligram
Mio Million
MRI Magnetic resonance imaging
n.d. No data available
Nd Neodymium
NdFeB Neodymium ferrium boron
nGy/h Nanogray per hour (Gamma dose rate)
NH3 Ammonia
NH4+ Ammonium ion
Ni Nickel
Ni-MH battery Nickel metal-hydride battery
OLED Organic light emitting diode
PHEV Plug-in hybrid electric vehicle
Pm Promethium
Pr Praseodymium
R&D Research and development
Ra Radium
REE Rare earth element
REO Rare earth oxide (common trade unit)
Study on Rare Earths and Their Recycling
10
RMB Renminbi = official currency of the People´s Republic of China; principal unit is
Yuan
Sc Scandium
Sm Samarium
SOFC Solid oxide fuel cell
SSD Solid state drive
SSEEC Solid state energy efficient cooling
t Metric tons
Tb Terbium
Th Thorium
Tm Thulium
TREO Total rare earth oxide
U Uranium
UK United Kingdom
UNEP United Nations Environment Programme
VCM Voice-coil-motor
WEEE Waste Electrical and Electronic Equipment
Y Yttrium
Yb Ytterbium
YOE Yttrium europium oxide

Study on Rare Earths and Their Recycling
11
EXECUTIVE SUMMARY

I
Study on Rare Earths and Their Recycling
The focus of this study for the Greens/EFA Group in the European Parliament lies on the
development of a European strategy for a sustainable rare earth economy. It particularly
addresses the recycling, the substitution and the efficient use of rare earths and develops a
strategy towards a green rare earth economy.
The rare earth elements under analysis in this study by Öko-Institut include the 17 elements
yttrium (Y), lanthanum (La), cerium (Ce), praseodymium (Pr), neodymium (Nd), promethium
(Pm), samarium (Sm), europium (Eu), gadolinium (Gd), terbium (Tb), dysprosium (Dy),
holmium (Ho), erbium (Er), thulium (Tm), ytterbium (Yb), lutetium (Lu) and scandium (Sc) and
the role they play in the case of green technologies.
The chapters 1 to 9 provide a comprehensive overview of methodological approaches to
assess the criticality as well as global aspects such as rare earth mining, processing, trade,
environmental impacts, applications, current and future demand and the expected demand-
supply balance. Each chapter culminates in a conclusion, by means of which the reader can
gain a quick overview of its contents. These data are not summarised in the executive
summary. Instead, the executive summary focuses on the main target of the study, the
development of a European strategy for a sustainable rare earth economy.
Background
During recent years technological innovations resulted in manifold applications using rare
earths which lead to a steep increase in their demand. A relevant share of the increasing
demand is caused by so-called “green technologies” which are designed to contribute to
environmental protection in terms of reduction of the energy consumption, the further
development of renewable energy carriers or air pollution control. There is serious concern
that the demand of some individual rare earth elements such as neodymium, praseodymium,
dysprosium, terbium, lanthanum, yttrium and europium might exceed the present supply
within a few years. Even if China imposes no export restrictions it is to be expected that the
increasing demand up to 2014 can only be met if further mines in addition to the two planned
mines in Australia and USA are opened. The two mines in Australia and the USA have
already obtained approval from the national authorities and started construction works so
that large scale operation can commence around 2012.
The high demand and the expected supply shortages, additionally triggered by Chinese
export restrictions, lead to a significant increase in rare earth prices. This steep increase is
not only a burden for manufacturers and consumers. It offers the chance to address the
problem of today’s rare earth supply in more depth and to build up a sustainable rare earth
economy in all relevant sectors. The low prices in the past lead to a significant waste of
resources. Until now, there has been almost no recycling of rare earths. The new prices
might be a starting point to building up recycling systems for rare earth compounds. Similarly,
Study on Rare Earths and Their Recycling
II
science and industry are beginning to conduct research and development on options for a
substitution of rare earth.
The high public interest in this issue further revealed the high environmental burden in the
surrounding of the Chinese mines and processing plants. If the EU demands rare earth
compounds for their green technology, it is up to the EU to contribute to a “greener” rare
earth supply. The contradiction between the “green” application of rare earth and their high
environmental pressures in production calls for action to be taken particularly by Europe,
America and Japan where – besides China – the majority of the rare earths are consumed.
The action in the fields of recycling should be started now without further delay as it will take
a minimum of five to ten years for the first large-size implementation to take place. The
research for substitution options and efficiency should also be reinforced as soon as possible
as it takes some years to move from successful research to industrial implementation.
Analysis of the substitution of rare earths and their efficient use
The examination of substitutions for scarce REE has shown that there is quite rarely a simple
substitution of a REE compound by another compound. In most cases substitution requires a
totally new product design. The identified options for substitution in the case of the major
green applications are summarised below:
Rare earths are currently used in around 14 % of newly installed wind turbines with a
gear-less design and technical advantages in terms of reliability. A supply shortage of
rare earths would lead to a shift to alternative turbine types. Further research on a higher
reliability of traditional techniques with gears would support this substitution.
Rare earths are used in permanent motors of hybrid electric vehicles and electric
vehicles. Substitutions based on alternative electric motor designs are principally
available. However, R&D is required for a higher performance of existing electric motor
types and for the realisation of new motor concepts.
Most new energy-efficient lighting systems contain rare earths (compact fluorescent
lamp, LED, plasma display, LCD display). Substitutions are rare, particularly for compact
fluorescent lamps. R&D is required for alternative phosphors with high efficiency and
high light quality.
Automotive catalysts contain cerium, and catalysts for petroleum cracking and other
industrial processes contain lanthanum. Substitutions are rare, and R&D is urgently
required for alternative catalysts.
Concerning a higher efficiency of the rare earth use, R&D is urgently needed in all fields of
application and is also needed on the supply side to enable higher efficiencies in mining,
beneficiation and processing. One example for high losses in the production chain is the
traditional magnet production in China.
Study on Rare Earths and Their Recycling
III
Nanotechnology is considered to be applied in some green applications in order to raise the
efficiency by nano-sized rare earths. An attendant risk assessment is highly recommended.
Analysis of the current recycling activities of rare earths
Only a few industrial recycling activities are currently implemented for rare earths. Until now,
there has been no large scale recycling of rare earths from magnets, batteries, lighting and
catalysts. Principally, the recycling processes for the rare earths are quite complex and
extensive if re-use is not possible and a physical and chemical treatment is necessary. Most
of the recycling procedures are energy-intensive processes. The main post-consumer
activities – the recycling of rare earths from electric motors and hard disks and other
electronic components – will require intensive dismantling.
Several constraints for a wider recycling of rare earths were identified: the need for an
efficient collection system, the need for sufficiently high prices for primary and secondary
rare earths compounds, losses of post-consumer goods by exports in developing countries
and the long lifetime of products such as electric motors in vehicles and wind turbines of
10 - 20 years before they could enter the recycling economy.
Advantages of recycling
The recycling of rare earths has several advantages in comparison to the use of primary
resources:
Europe is one of the globally large consumers of rare earths. Increasing amounts of
waste from final products containing rare earths are arising in Europe. These valuable
resources should be returned to the industrial metabolism by “urban mining”.
The dependency on foreign resources will be reduced by supplying the European
market with secondary rare earth materials.
Apart from a few specialised industries and applications, the know-how in rare earth
processing is quite low in Europe. The building up of know-how in recycling will widen
the competency of enterprises and scientific institutions in Europe concerning rare earth
processing.
The processing of secondary rare earths will be free from radioactive impurities. The
mining and further processing of primary rare earths is involved in most cases with
nuclear radiation coming from radioactive elements of the natural deposits.
The recycling requires some energy carriers and chemicals. On the other hand it saves
significant amounts of energy, chemicals and emissions in the primary processing chain.
It is to be expected that most recycling processes will have a high net-benefit
concerning air emissions, groundwater protection, acidification, eutrophication and
climate protection.
Study on Rare Earths and Their Recycling
IV
Strategy for the development of a European rare earth recycling scheme
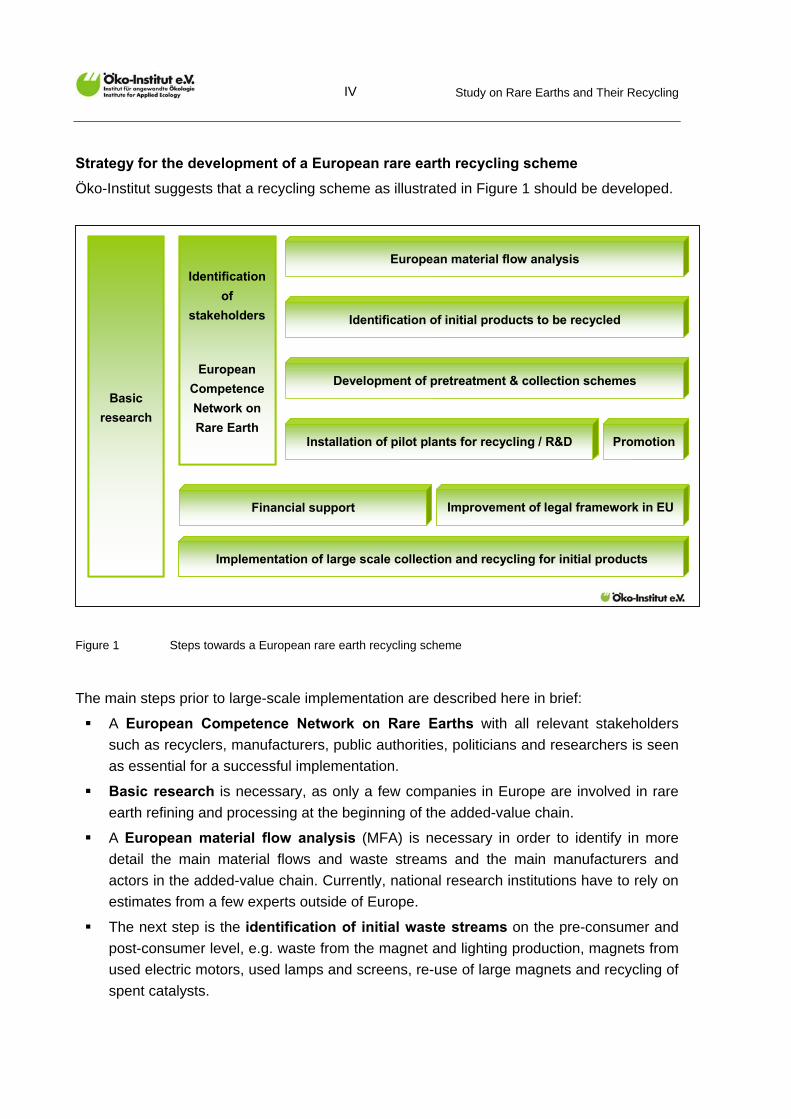
Öko-Institut suggests that a recycling scheme as illustrated in Figure 1 should be developed.
Development of pretreatment & collection schemes
Identification of initial products to be recycled
European material flow analysis
Installation of pilot plants for recycling / R&D
Financial support
Implementation of large scale collection and recycling for initial products
Identification
of
stakeholders
European
Competence
Network on
Rare EarthPromotion
Basic
research
Improvement of legal framework in EU
Figure 1 Steps towards a European rare earth recycling scheme
The main steps prior to large-scale implementation are described here in brief:
A European Competence Network on Rare Earths with all relevant stakeholders
such as recyclers, manufacturers, public authorities, politicians and researchers is seen
as essential for a successful implementation.
Basic research is necessary, as only a few companies in Europe are involved in rare
earth refining and processing at the beginning of the added-value chain.
A European material flow analysis (MFA) is necessary in order to identify in more
detail the main material flows and waste streams and the main manufacturers and
actors in the added-value chain. Currently, national research institutions have to rely on
estimates from a few experts outside of Europe.
The next step is the identification of initial waste streams on the pre-consumer and
post-consumer level, e.g. waste from the magnet and lighting production, magnets from
used electric motors, used lamps and screens, re-use of large magnets and recycling of
spent catalysts.
Study on Rare Earths and Their Recycling
V
The treatment of many relevant wastes is already regulated by the Waste Electrical and
Electronic Equipment Directive (hereafter WEEE), the EU End of Life Vehicles Directive
(ELV) and the EU Battery Directive. Thus, the collection of rare earths containing
wastes has to be integrated in existing collection schemes.
The development of pilot plants is accompanied by large-scale R&D projects which
aim to gain more insight into the complex chemical processes and the required
sophisticated equipment.
Recycling plants bear high financial risks due to the required high investment and the
high uncertainty of the future price development of rare earths. Therefore, it should be
analysed whether the European Investment Bank (EIB) could reduce financial risks for
investments in rare earth recycling.
A recycling scheme of rare earths not only requires adequate logistic and technical
preconditions but also an appropriate legal framework. Hence, an important step will
be the adaption of the legal EU framework in order to optimise post-consumer rare
earth recycling. Potential relevant directives which should be verified in terms of
modification for the support of a rare earth recycling scheme are the Ecodesign
Directive, the WEEE Directive, the ELV Directive and the Battery Directive.
Recommendations for international activities
The development of a sustainable rare earth supply for Europe concerning environmental,
social and security aspects requires a solid international co-operation. Important partners for
the EU in facing this challenge are not only China but also Japan and the United States.
Öko-Institut suggests three selected activities:
Öko-Institut proposes an EU-China co-operation on sustainable mining which is
designed as a large-size co-operation focusing on the sustainable mining of rare earths
at one specific site with the target to optimise the efficiency, the environmental
performance, the remediation of contaminated sites and the potential recovery of rare
earths from old tailings. The EC would supply co-funding and expertise, and China
would agree on an adequate rare earth supply.
Green technologies call for “green metals”, and Europe should support a sustainable
mining. Worldwide, there are manifold initiatives for sustainable mining. Among them
are certification schemes addressing different problems such as environmental aspects,
small-scale mining, safety issues and human rights. There is increasing interest in
politics and industry on certified minerals, and today’s mining companies could be
interested in certification schemes or similar co-operations with EU participation in order
to highlight their environmental efforts.
The high pressure on the opening of new mines outside of China by the steeply
increasing demand raises the concern that new mines could be opened which do not

Study on Rare Earths and Their Recycling
VI
keep minimum environmental standards. One case could be the Kvanefjeld deposit in
Greenland where the residues from the ore concentration (tailings) shall be stored in a
natural lake with connection to the sea. The EU and the European Environmental
Agency (EEA), which has a general co-operation with Greenland, should appeal clearly
to the Greenlandic authorities to act carefully and responsibly.

I
Study on Rare Earths and Their Recycling
FINAL REPORT

1
Study on Rare Earths and Their Recycling
1 Introduction
In the last seven years international discussions about mineral resources with a special focus
on metals have gained a new dimension.1 Driven by the growth of the global economy and
the enhanced pace of the emerging economies (China, India, Brazil, etc.), the global demand
for many metals is increasing rapidly and the most forecasts predict further growth of metal
consumption. Besides well-known mass metals like steel or aluminium, new challenges in the
field of the so-called critical metals are under serious concerns. The EC defines the
“criticality” of raw materials in its recent publication “Critical raw materials for the EU” (EC
2010): “This means that raw material is labelled “critical” when the risks of supply shortage
and their impacts on the economy are higher compared with most of the other raw materials.”
It could be stated that in many cases the discussions about critical metals are linked with
new innovations and technologies – very often in the field of green technologies like electric
vehicles, wind power, PV and many others. Therefore in many relevant publications
synonyms like “green minor metals”, “specialty metals”, “technology metals” and “rare
metals” are used for the term “critical metals”. As part of the activities of the EC’s “Raw
Materials Initiative”, the Ad-hoc Working Group on defining critical raw materials ranked 14
raw materials at EC level as the most critical metals (EC 2010). This group of 14 raw
materials contains the whole group of rare earth elements (REE).
The rare earth elements under analysis in this study by Öko-Institut for the Greens/EFA
Group in the European Parliament include the 17 elements: yttrium (Y), lanthanum (La),
cerium (Ce), praseodymium (Pr), neodymium (Nd), promethium 2 (Pm), samarium (Sm),
europium (Eu), gadolinium (Gd), terbium (Tb), dysprosium (Dy), holmium (Ho), erbium (Er),
thulium (Tm), ytterbium (Yb), lutetium (Lu) and scandium (Sc).
The large group of the REE is sub-divided into the heavy rare earth elements (HREE) and
the light rare earth elements (LREE). Unfortunately there is no worldwide accepted definition
for which REE belongs to the HREE or the LREE group. Therefore, crosschecks of data from
different sources which refers to facts and figures and so on about HREE and LREE have to
be carried out very carefully to avoid failures and misinterpretations (this holds especially for
the contribution of yttrium). For this study Öko-Institut uses the definition of the USGS (USGS
2002), which defines yttrium (Y), gadolinium (Gd), terbium (Tb), dysprosium (Dy), holmium
(Ho), erbium (Er), thulium (Tm), ytterbium (Yb), lutetium (Lu) as HREE and lanthanum (La),
cerium (Ce), praseodymium (Pr), neodymium (Nd), samarium (Sm), europium (Eu), and
scandium (Sc) as LREE.
1 See, for instance, the special website developed by Öko-Institut: www.resourcefever.org. 2 Promethium does not occur in nature as no stable isotope exists.
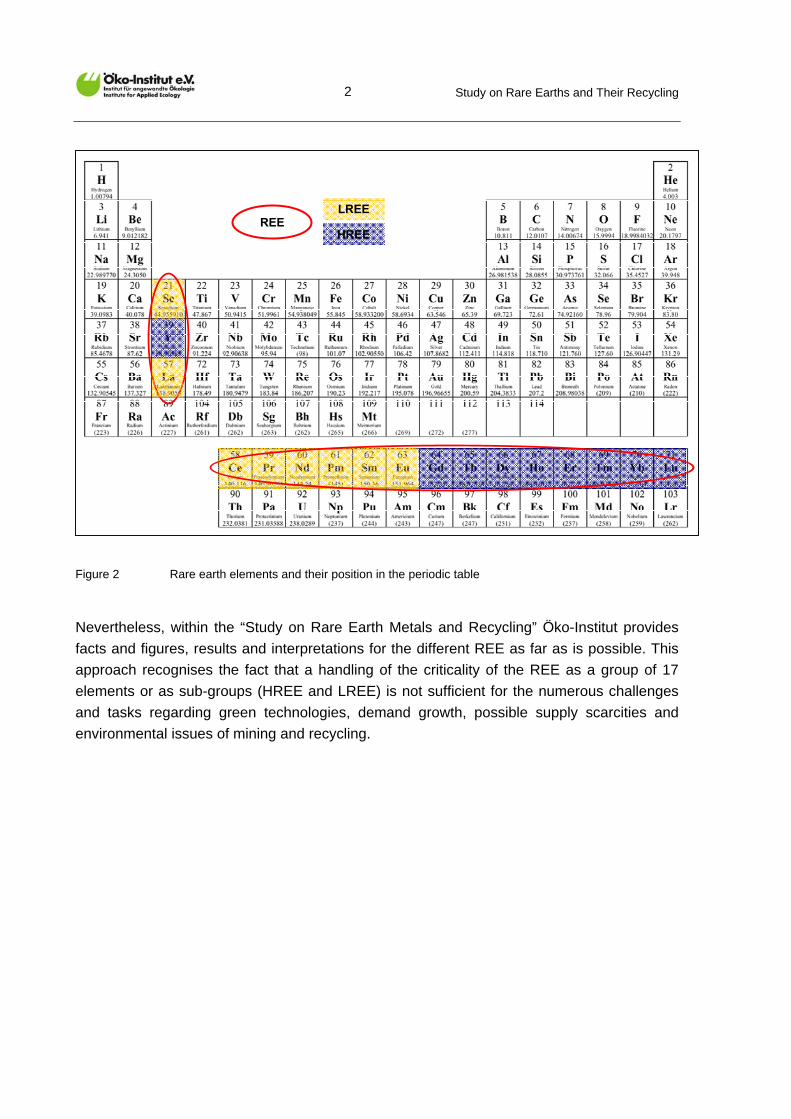
Study on Rare Earths and Their Recycling
2
HREE
LREEREE
HREE
LREEREE
Figure 2 Rare earth elements and their position in the periodic table
Nevertheless, within the “Study on Rare Earth Metals and Recycling” Öko-Institut provides
facts and figures, results and interpretations for the different REE as far as is possible. This
approach recognises the fact that a handling of the criticality of the REE as a group of 17
elements or as sub-groups (HREE and LREE) is not sufficient for the numerous challenges
and tasks regarding green technologies, demand growth, possible supply scarcities and
environmental issues of mining and recycling.
Study on Rare Earths and Their Recycling
3
2 Methodologies for determination of criticality
Against the background of rapid demand growths, increasing prices and possible supply
restrictions of certain metals with high potential for future technologies having received
increasing attention by media, scientists, enterprises and the politics, several classification
systems to rank the numerous raw materials and metals have been developed in recent
years. It should be mentioned that the purpose of these studies is not always the same und
therefore a one-by-one comparison of the results could not be undertaken. In most cases a
national or regional point of view is the driving force behind the classifications systems for
criticality. For an overview the methodological approach of the report “Minerals, Critical
Minerals and the U.S. Economy” (National Academies 2008) and the approach of the Ad-hoc
Working Group on defining critical raw materials (EC 2010) are selected. Finally an approach
of Öko-Institut for the UNEP will be briefly introduced.
In 2008 the National Academy of Sciences released a comprehensive report with the title
“Minerals, Critical Minerals and the US Economy” (National Academies 2008). The
motivation for this study is reflected by the following excerpt of the study’s preface: “In the
twenty-first century, the nature of the concerns over Earth resources has shifted once again.
Energy and mineral commodity prices are relatively high for the first extended period since
the 1970s, driven primarily by unexpectedly large demand growth in China, India, and other
countries. At the same time, while the United States remains an important producer of
energy and mineral resources, the extraction and production of these resources overall has
shifted away from the United States toward other nations; U.S. import dependence for many
commodities has increased and has raised concerns about reliability of the foreign supply.”
The driving force for the US study was clearly the assessment that the US economy faces
increasing dependence on raw materials imports. So, the whole study and including the
released criticality matrix has to be considered in the context of this motivation.
The US approach is based on two dimensions of criticality; importance in use and
availability. The dimension of importance in use reflects the idea that some non-fuel raw
materials are more important in use than others. The authors pointed out that the possibility
of substitution is the key here. The second dimension, availability, includes several medium-
to long-term considerations: geologic, technical, environmental, social, political and economic
factors have to be taken into account. In addition, the consideration of the reliability or risk of
supply in the short term is important. On this basis the authors have developed a two-
dimension criticality matrix. The criticality matrix, as established in this report, allows
evaluation of the criticality of a given mineral. A specific mineral or mineral product can be
placed on this matrix after assessing the impact of a potential restriction on the mineral’s
supply (importance in use: vertical axis) and the likelihood of a supply restriction (availability:
horizontal axis). The degree of criticality increases as one moves from the lower-left to the
upper-right corner of the matrix. The committee used a combination of quantitative measures
and expert (qualitative) judgement in implementing the matrix methodology. The rare earths
Study on Rare Earths and Their Recycling
4
were determined by this methodology (as one of five out of 11 minerals or mineral groups) to
fall in or near the critical zone of the criticality matrix.
The US approach was applied in a report on the critical materials strategy from the US
Department of Energy in 2010 (DOE 2010). It focuses on nine individual rare earth elements
and the metals gallium, tellurium, lithium, indium and cobalt and their importance to the clean
energy economy.
In July 2010 the EC published the report “Critical raw materials for the EU” which was worked
out by the Ad-hoc Working Group on defining critical raw materials (EC 2010). The EC report
provides a pragmatic approach based on various existing methods. In line with other studies,
the report puts forward a relative concept of criticality. This means that raw material is
labelled “critical” when the risks of supply shortage and their impacts on the economy are
higher compared with most of the other raw materials. It considers three main aggregated
indicators or dimensions, i.e. the economic importance of the considered raw material, its
supply risk (for instance restrictive measures from resource-rich countries) and an
environmental country risk assessing the potential for environmental measures that may
restrain access to deposits or the supply of raw materials. These three aggregated indicators
are calculated for each raw material.
41 different raw materials were assessed by the Ad-hoc Working Group with this criticality
approach based on the three main aggregated indicators/dimensions. In a first step the 41
raw materials are positioned in a two-dimensional matrix comparable with the US approach
(see above). The vertical axis reflects the positioning of the materials in relation to the supply
risks that have been identified. The production of a material in few countries marked by
political and economic instability, coupled to a low recycling rate and low substitutability, will
result in a very high supply risk. The results show for the rare earths the highest rank among
all 41 assessed raw materials.
The horizontal axis reflects the positioning of the material in relation to its importance to the
EU. For this dimension the rare earths are in the midfield. From this two-dimensional matrix a
list of 14 different raw materials including the rare earths are assessed as critical, because
they are of high economic importance and have a high supply risk. Finally the environmental
country risk – the third indicator – was used to finish the determination of criticality. However,
the overall result for the group of 14 was not altered by this indicator. It is important to note
that the rare earths were ranked as the raw material with the highest environmental country
risk among all assessed 41 raw materials.
Study on Rare Earths and Their Recycling
5
In 2009 Öko-Institut completed a study for UNEP entitled “Critical metals for future
sustainable technologies and their recycling potential” (Öko-Institut 2009). For the
classification of selected “green minor metals” with a potential for sustainable technologies
an own classification system with the three main pillars “demand growth”, “supply risks” and
“recycling restrictions” was developed. To enable extensive classification and differentiation
of the different metals, the following sub-criteria are taken into account by Öko-Institut:
Demand growth
o Rapid demand growth: > 50% increase of total demand until 2020
o Moderate demand growth > 20% increase of total demand until 2020
Supply risks
o Regional concentration of mining (> 90% share of the global mining in the major
three countries)
o Physical scarcity (reserves compared to annual demand)
o Temporary scarcity (time lag between production and demand)
o Structural or technical scarcity (metal is just a minor product in a coupled
production and inefficiencies occur often in the mining process, production and
manufacturing)
Recycling restrictions
o High scale of dissipative applications
o Physical/chemical limitations for recycling
o Lack of suitable recycling technologies and/or recycling infrastructures
o Lack of price incentives for recycling
In contrast to other ranking systems this classification system are not based on a national
point of view, which means the results are universal and not specific to a single country or
region. The availability of all REE could prove to be very critical following this approach for
the period up to 2020 (for details see: Öko-Institut 2009). Within the REE group the
availability of several elements could prove to be even more critical as the result of this report
suggest.
As a group the REE have already been ranked highest in terms of criticality by the EC in July
2010 (EC 2010) and in previous assessments conducted by other organisations. This
classification is justified without any doubt. For this study for the Greens/EFA Group in the
European Parliament in late 2010 Öko-Institut has chosen an in-depth analysis approach for
the individual REE, because the REE schematic rankings of the whole group of REE are not
sufficient to produce detailed results as a basis for strategies. Based on the detailed results
the proposed strategies for Europe regarding the REE are summarised in Chapter 12.
Study on Rare Earths and Their Recycling
6
Conclusion on methodologies for determination of criticality
In recent years, several classification systems were developed to rank numerous raw
materials and metals in terms of their criticality. Examples of such ranking systems are the
report “Minerals, Critical Minerals and the U.S. Economy” by the National Academies 2008,
the approach of the European Ad-hoc Working Group on defining critical raw materials (EC
2010), the approach of Öko-Institut for the UNEP and the recently published analysis of
criticality of nine rare earth elements and five other metals by the US Department of Energy
(DOE 2010). Due to their expected scarcity rare earths are taken into account in these
reports.
There is a consensus in all approaches that some rare earth elements are critical or near-
critical in terms of the supply risk and their importance for green technologies. Consequently,
a more in-depth analysis which evaluates the criticality of the individual rare earth elements
is necessary in order to produce detailed results as basis for political strategies.
Study on Rare Earths and Their Recycling
7
3 Reserves Company Project Location Cut-off Contained REO Production Start-up
3.1 Global reserves
USGS (2010a) estimates the global reserves of the sum of all rare earth oxides to be at
99 000 000 t REO. This is quite high compared to the estimated world production of
124 000 t REO (USGS 2010a) in 2009. Hereby, the reserve is defined by the USGS as “the
part of the reserve base which could be economically extracted or produced at the time of
determination.” On the contrary, the reserve base not only comprises the resources that are
currently economic (= reserves) but also marginally economic reserves, and some of those
that are currently sub-economic. The reserve base was estimated to amount to
150 000 000 t REO by USGS (2008). In 2009, reserve base estimates of the USGS were
discontinued.
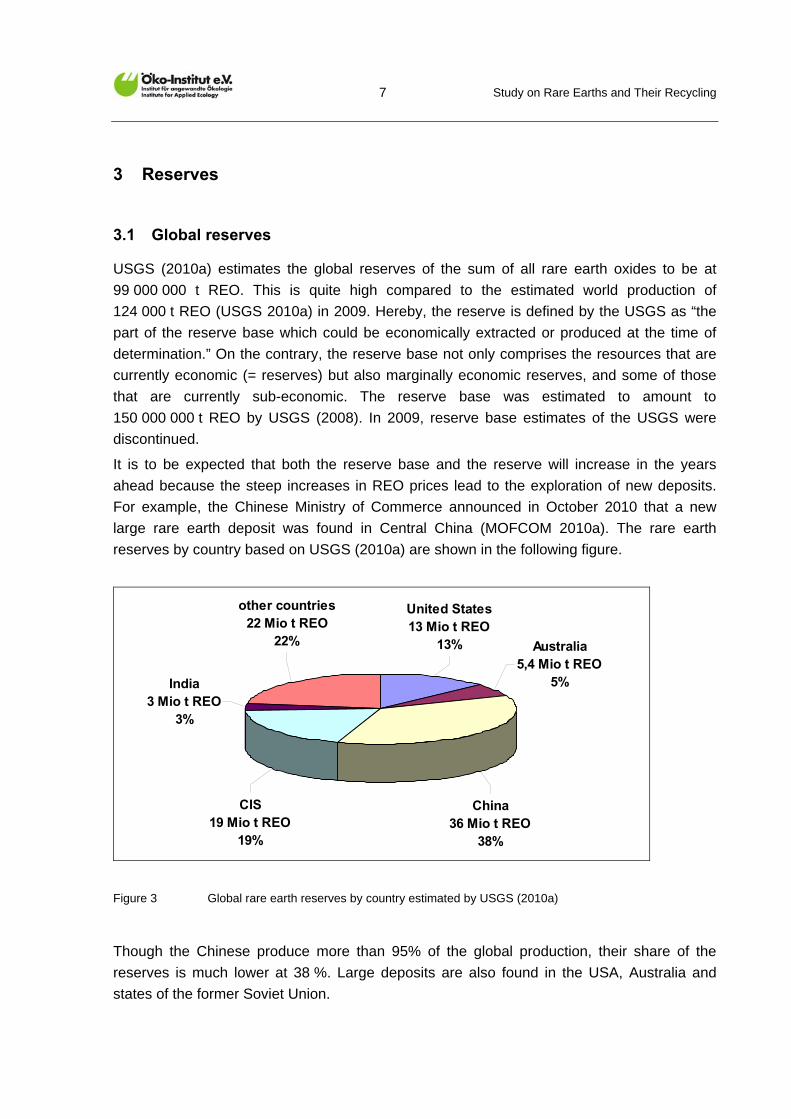
It is to be expected that both the reserve base and the reserve will increase in the years
ahead because the steep increases in REO prices lead to the exploration of new deposits.
For example, the Chinese Ministry of Commerce announced in October 2010 that a new
large rare earth deposit was found in Central China (MOFCOM 2010a). The rare earth
reserves by country based on USGS (2010a) are shown in the following figure.
Australia 5,4 Mio t REO
5%
China 36 Mio t REO
38%
CIS 19 Mio t REO
19%
United States 13 Mio t REO
13%
India 3 Mio t REO
3%
other countries 22 Mio t REO
22%
Figure 3 Global rare earth reserves by country estimated by USGS (2010a)
Though the Chinese produce more than 95% of the global production, their share of the
reserves is much lower at 38 %. Large deposits are also found in the USA, Australia and
states of the former Soviet Union.
Study on Rare Earths and Their Recycling
8
However, the figures on the total reserves which refer to the sum of all rare earth elements
do not reflect the need for a detailed look on the supply of individual elements. As discussed
later in the study, shortages will be expected for some REE and their specific reserves are of
importance.
The following chapters will provide some reserve estimations for the group of heavy rare
earth elements as well as Chinese reserve estimations. Unfortunately, the USGS, Chinese,
Australian and Canadian institutions have different definitions of reserves, reserve base and
resources, which make it difficult or even impossible to compare the different national
reserve and resource statistics. International attempts to harmonise the classification3 are not
developed in so far that they already provide harmonised reserve data on rare earths.
3.2 Reserves in China
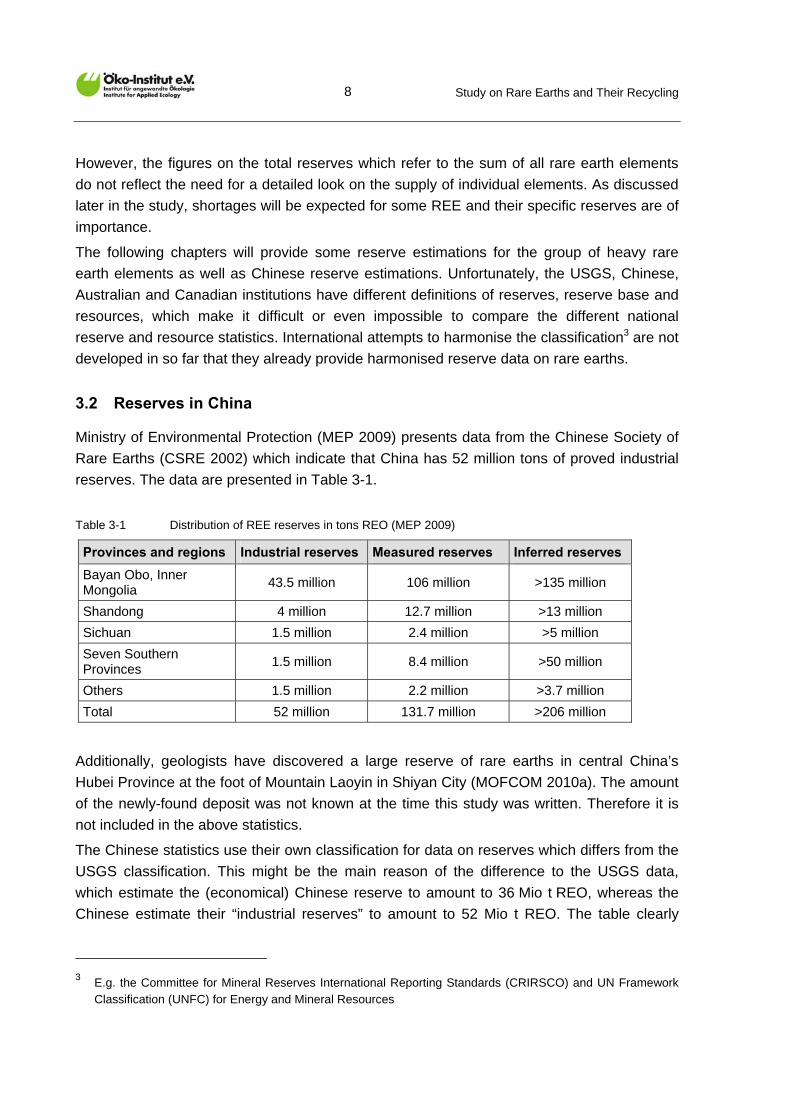
Ministry of Environmental Protection (MEP 2009) presents data from the Chinese Society of
Rare Earths (CSRE 2002) which indicate that China has 52 million tons of proved industrial
reserves. The data are presented in Table 3-1.
Table 3-1 Distribution of REE reserves in tons REO (MEP 2009)
Provinces and regions Industrial reserves Measured reserves Inferred reserves
Bayan Obo, Inner Mongolia
43.5 million 106 million >135 million
Shandong 4 million 12.7 million >13 million
Sichuan 1.5 million 2.4 million >5 million
Seven Southern Provinces
1.5 million 8.4 million >50 million
Others 1.5 million 2.2 million >3.7 million
Total 52 million 131.7 million >206 million
Additionally, geologists have discovered a large reserve of rare earths in central China’s
Hubei Province at the foot of Mountain Laoyin in Shiyan City (MOFCOM 2010a). The amount
of the newly-found deposit was not known at the time this study was written. Therefore it is
not included in the above statistics.
The Chinese statistics use their own classification for data on reserves which differs from the
USGS classification. This might be the main reason of the difference to the USGS data,
which estimate the (economical) Chinese reserve to amount to 36 Mio t REO, whereas the
Chinese estimate their “industrial reserves” to amount to 52 Mio t REO. The table clearly
3 E.g. the Committee for Mineral Reserves International Reporting Standards (CRIRSCO) and UN Framework
Classification (UNFC) for Energy and Mineral Resources
Study on Rare Earths and Their Recycling
9
shows that the major reserves are in Inner Mongolia at Bayan Obo, where the world largest
rare earth mine is already in operation.
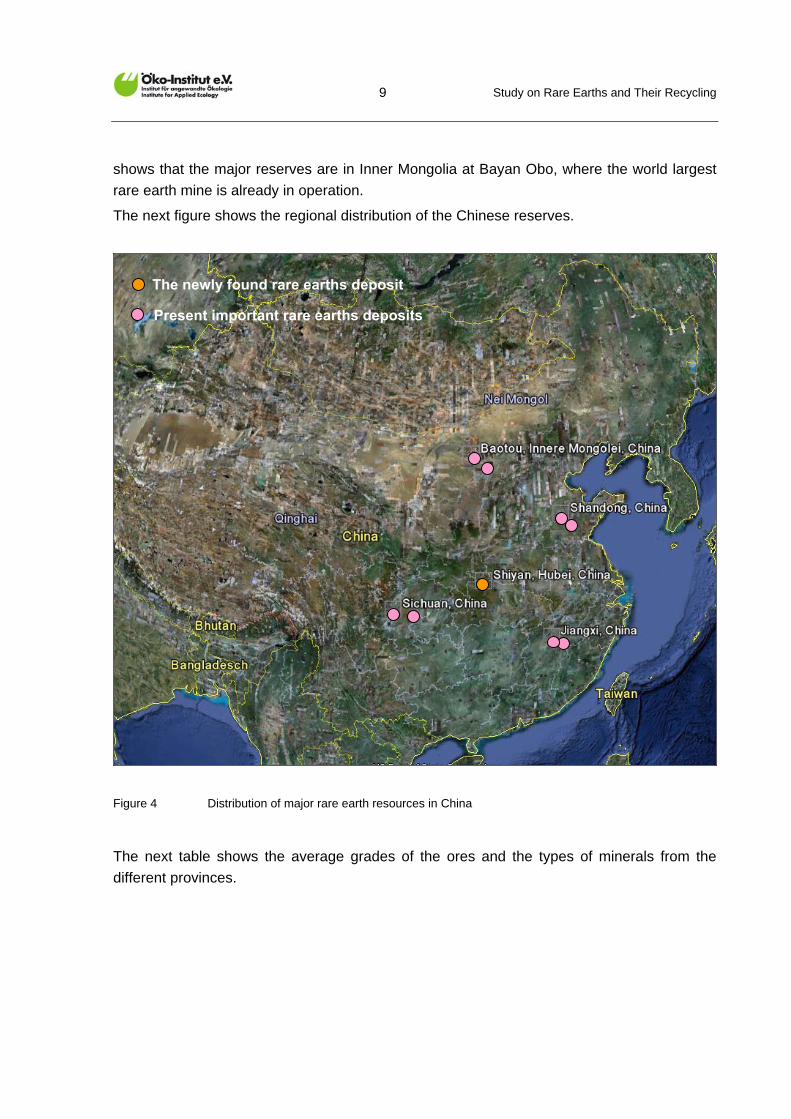
The next figure shows the regional distribution of the Chinese reserves.
Figure 4 Distribution of major rare earth resources in China
The next table shows the average grades of the ores and the types of minerals from the
different provinces.
The newly found rare earths deposit
Present important rare earths deposits
Study on Rare Earths and Their Recycling
10
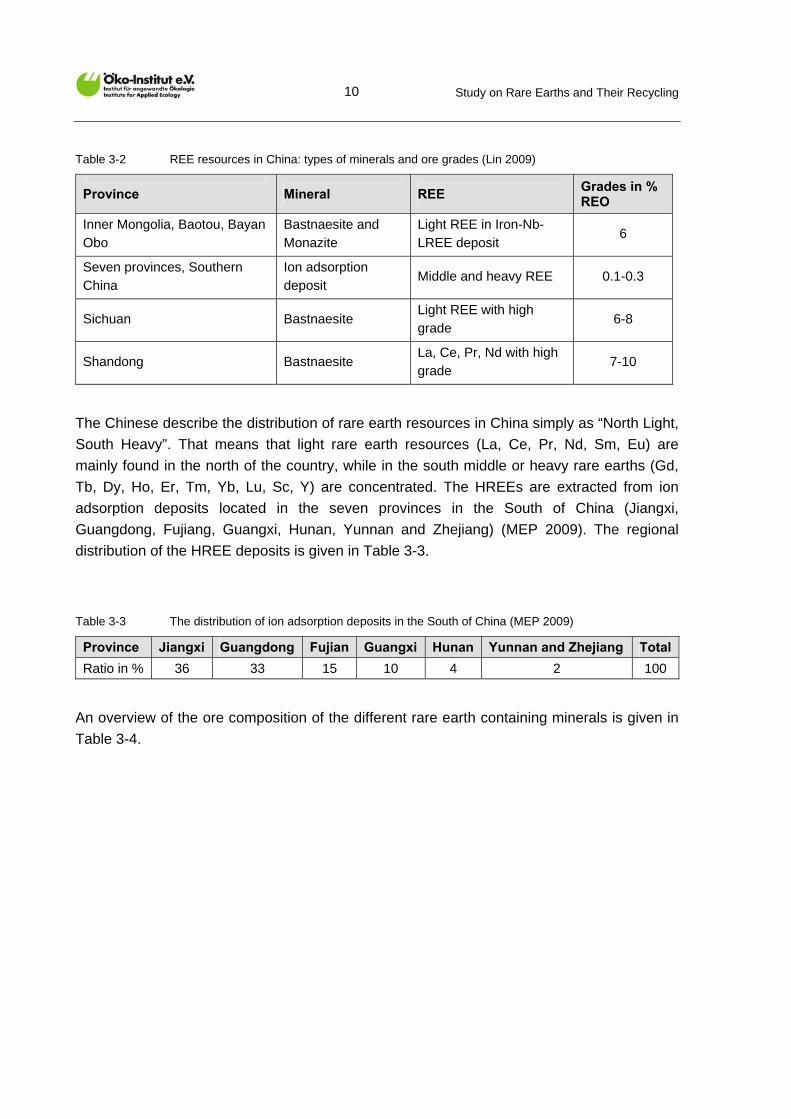
Table 3-2 REE resources in China: types of minerals and ore grades (Lin 2009)
Province Mineral REE Grades in % REO
Inner Mongolia, Baotou, Bayan Obo
Bastnaesite and Monazite
Light REE in Iron-Nb-LREE deposit
6
Seven provinces, Southern China
Ion adsorption deposit
Middle and heavy REE 0.1-0.3
Sichuan Bastnaesite Light REE with high grade
6-8
Shandong Bastnaesite La, Ce, Pr, Nd with high grade
7-10
The Chinese describe the distribution of rare earth resources in China simply as “North Light,
South Heavy”. That means that light rare earth resources (La, Ce, Pr, Nd, Sm, Eu) are
mainly found in the north of the country, while in the south middle or heavy rare earths (Gd,
Tb, Dy, Ho, Er, Tm, Yb, Lu, Sc, Y) are concentrated. The HREEs are extracted from ion
adsorption deposits located in the seven provinces in the South of China (Jiangxi,
Guangdong, Fujiang, Guangxi, Hunan, Yunnan and Zhejiang) (MEP 2009). The regional
distribution of the HREE deposits is given in Table 3-3.
Table 3-3 The distribution of ion adsorption deposits in the South of China (MEP 2009)
Province Jiangxi Guangdong Fujian Guangxi Hunan Yunnan and Zhejiang Total
Ratio in % 36 33 15 10 4 2 100
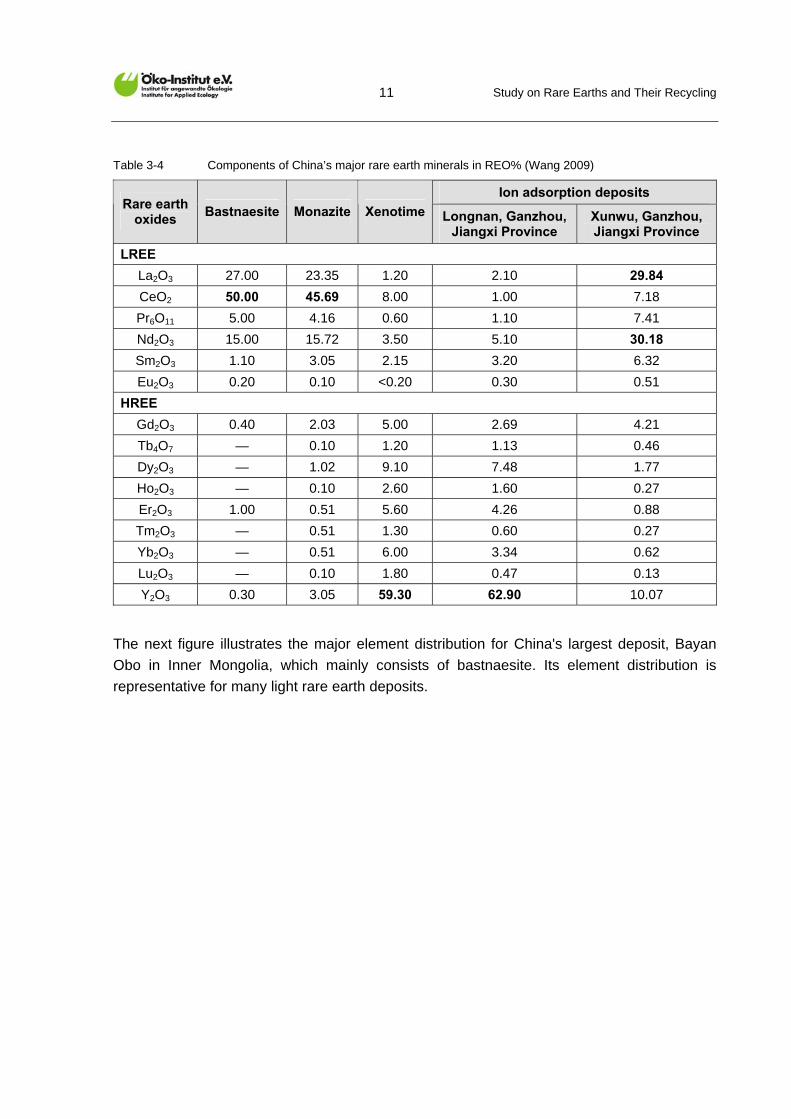
An overview of the ore composition of the different rare earth containing minerals is given in
Table 3-4.
Study on Rare Earths and Their Recycling
11
Table 3-4 Components of China’s major rare earth minerals in REO% (Wang 2009)
Ion adsorption deposits Rare earth
oxides Bastnaesite Monazite Xenotime Longnan, Ganzhou,
Jiangxi Province Xunwu, Ganzhou, Jiangxi Province
LREE
La2O3 27.00 23.35 1.20 2.10 29.84
CeO2 50.00 45.69 8.00 1.00 7.18
Pr6O11 5.00 4.16 0.60 1.10 7.41
Nd2O3 15.00 15.72 3.50 5.10 30.18
Sm2O3 1.10 3.05 2.15 3.20 6.32
Eu2O3 0.20 0.10 <0.20 0.30 0.51
HREE
Gd2O3 0.40 2.03 5.00 2.69 4.21
Tb4O7 — 0.10 1.20 1.13 0.46
Dy2O3 — 1.02 9.10 7.48 1.77
Ho2O3 — 0.10 2.60 1.60 0.27
Er2O3 1.00 0.51 5.60 4.26 0.88
Tm2O3 — 0.51 1.30 0.60 0.27
Yb2O3 — 0.51 6.00 3.34 0.62
Lu2O3 — 0.10 1.80 0.47 0.13
Y2O3 0.30 3.05 59.30 62.90 10.07
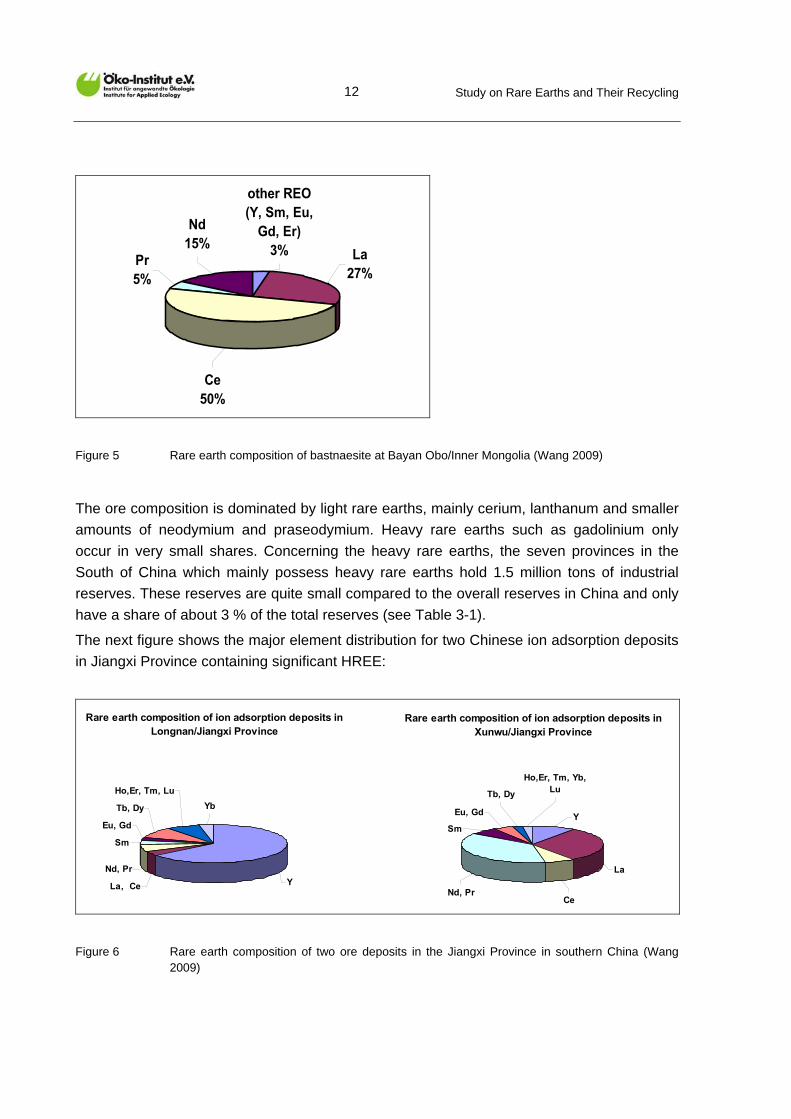
The next figure illustrates the major element distribution for China's largest deposit, Bayan
Obo in Inner Mongolia, which mainly consists of bastnaesite. Its element distribution is
representative for many light rare earth deposits.
Study on Rare Earths and Their Recycling
12
Ce50%
Pr5%
Nd15%
other REO (Y, Sm, Eu,
Gd, Er)3% La
27%
Figure 5 Rare earth composition of bastnaesite at Bayan Obo/Inner Mongolia (Wang 2009)
The ore composition is dominated by light rare earths, mainly cerium, lanthanum and smaller
amounts of neodymium and praseodymium. Heavy rare earths such as gadolinium only
occur in very small shares. Concerning the heavy rare earths, the seven provinces in the
South of China which mainly possess heavy rare earths hold 1.5 million tons of industrial
reserves. These reserves are quite small compared to the overall reserves in China and only
have a share of about 3 % of the total reserves (see Table 3-1).
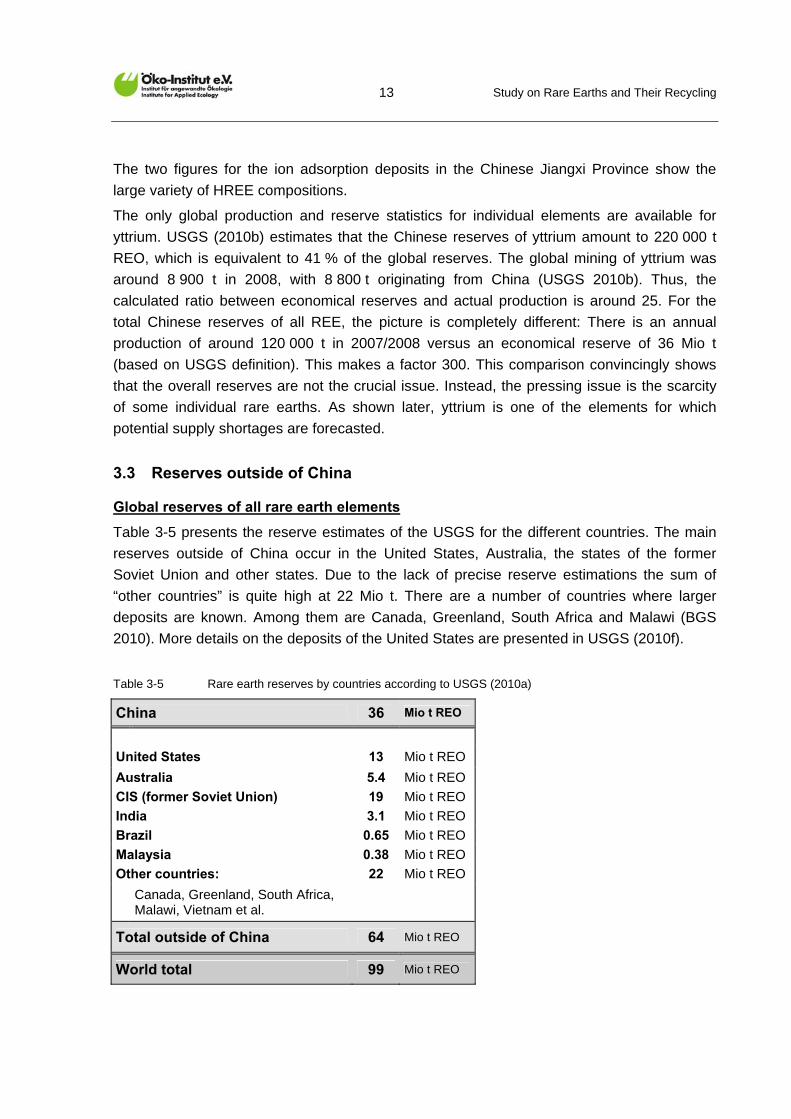
The next figure shows the major element distribution for two Chinese ion adsorption deposits
in Jiangxi Province containing significant HREE:
Rare earth composition of ion adsorption deposits in Longnan/Jiangxi Province
La, Ce
Nd, Pr
Sm
Eu, Gd
Tb, Dy
Ho,Er, Tm, Lu
Y
Yb
Rare earth composition of ion adsorption deposits in Xunwu/Jiangxi Province
Eu, Gd
Tb, Dy
Sm
La
CeNd, Pr
Ho,Er, Tm, Yb, Lu
Y
Figure 6 Rare earth composition of two ore deposits in the Jiangxi Province in southern China (Wang 2009)
Study on Rare Earths and Their Recycling
13
The two figures for the ion adsorption deposits in the Chinese Jiangxi Province show the
large variety of HREE compositions.
The only global production and reserve statistics for individual elements are available for
yttrium. USGS (2010b) estimates that the Chinese reserves of yttrium amount to 220 000 t
REO, which is equivalent to 41 % of the global reserves. The global mining of yttrium was
around 8 900 t in 2008, with 8 800 t originating from China (USGS 2010b). Thus, the
calculated ratio between economical reserves and actual production is around 25. For the
total Chinese reserves of all REE, the picture is completely different: There is an annual
production of around 120 000 t in 2007/2008 versus an economical reserve of 36 Mio t
(based on USGS definition). This makes a factor 300. This comparison convincingly shows
that the overall reserves are not the crucial issue. Instead, the pressing issue is the scarcity
of some individual rare earths. As shown later, yttrium is one of the elements for which
potential supply shortages are forecasted.
3.3 Reserves outside of China
Global reserves of all rare earth elements
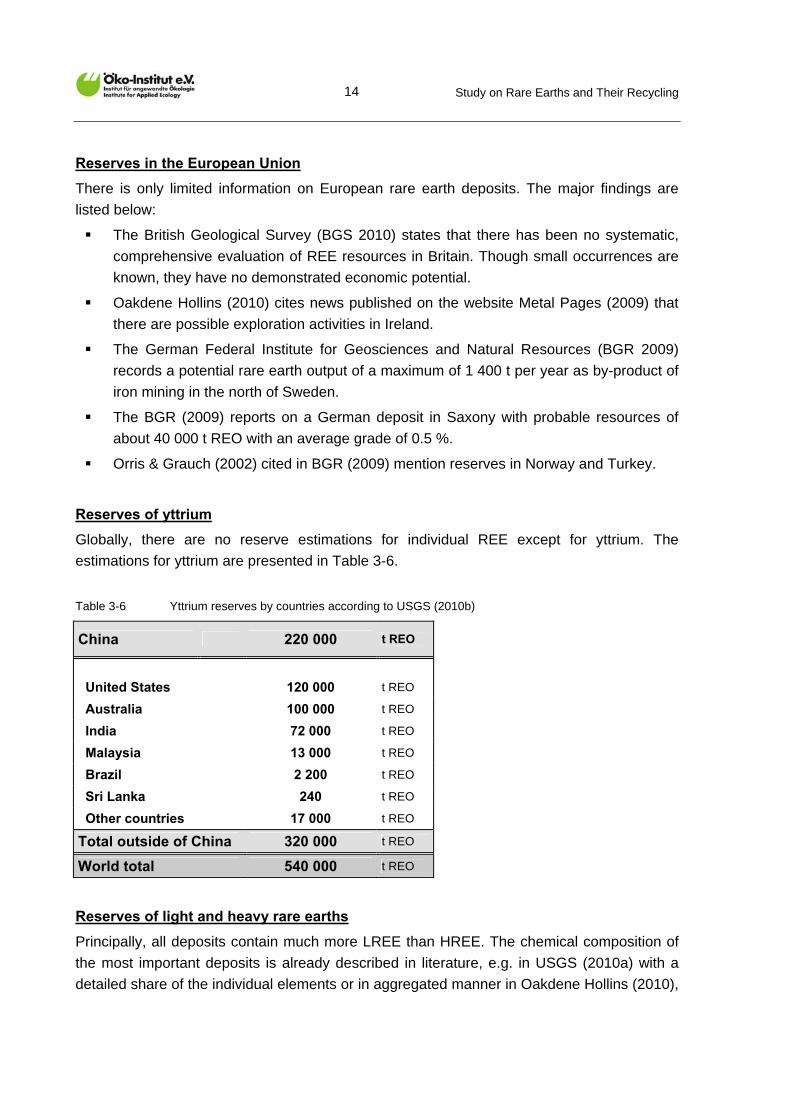
Table 3-5 presents the reserve estimates of the USGS for the different countries. The main
reserves outside of China occur in the United States, Australia, the states of the former
Soviet Union and other states. Due to the lack of precise reserve estimations the sum of
“other countries” is quite high at 22 Mio t. There are a number of countries where larger
deposits are known. Among them are Canada, Greenland, South Africa and Malawi (BGS
2010). More details on the deposits of the United States are presented in USGS (2010f).
Table 3-5 Rare earth reserves by countries according to USGS (2010a)
China 36 Mio t REO
United States 13 Mio t REO
Australia 5.4 Mio t REO
CIS (former Soviet Union) 19 Mio t REO
India 3.1 Mio t REO
Brazil 0.65 Mio t REO
Malaysia 0.38 Mio t REO
Other countries: 22 Mio t REO
Canada, Greenland, South Africa, Malawi, Vietnam et al.
Total outside of China 64 Mio t REO
World total 99 Mio t REO
Study on Rare Earths and Their Recycling
14
Reserves in the European Union
There is only limited information on European rare earth deposits. The major findings are
listed below:
The British Geological Survey (BGS 2010) states that there has been no systematic,
comprehensive evaluation of REE resources in Britain. Though small occurrences are
known, they have no demonstrated economic potential.
Oakdene Hollins (2010) cites news published on the website Metal Pages (2009) that
there are possible exploration activities in Ireland.
The German Federal Institute for Geosciences and Natural Resources (BGR 2009)
records a potential rare earth output of a maximum of 1 400 t per year as by-product of
iron mining in the north of Sweden.
The BGR (2009) reports on a German deposit in Saxony with probable resources of
about 40 000 t REO with an average grade of 0.5 %.
Orris & Grauch (2002) cited in BGR (2009) mention reserves in Norway and Turkey.
Reserves of yttrium
Globally, there are no reserve estimations for individual REE except for yttrium. The
estimations for yttrium are presented in Table 3-6.
Table 3-6 Yttrium reserves by countries according to USGS (2010b)
China 220 000 t REO
United States 120 000 t REO
Australia 100 000 t REO
India 72 000 t REO
Malaysia 13 000 t REO
Brazil 2 200 t REO
Sri Lanka 240 t REO
Other countries 17 000 t REO
Total outside of China 320 000 t REO
World total 540 000 t REO
Reserves of light and heavy rare earths
Principally, all deposits contain much more LREE than HREE. The chemical composition of
the most important deposits is already described in literature, e.g. in USGS (2010a) with a
detailed share of the individual elements or in aggregated manner in Oakdene Hollins (2010),
Study on Rare Earths and Their Recycling
15
and will not be repeated here in detail. However, representative examples for ore
compositions were given in Chapter 3.2 for some Chinese ores.
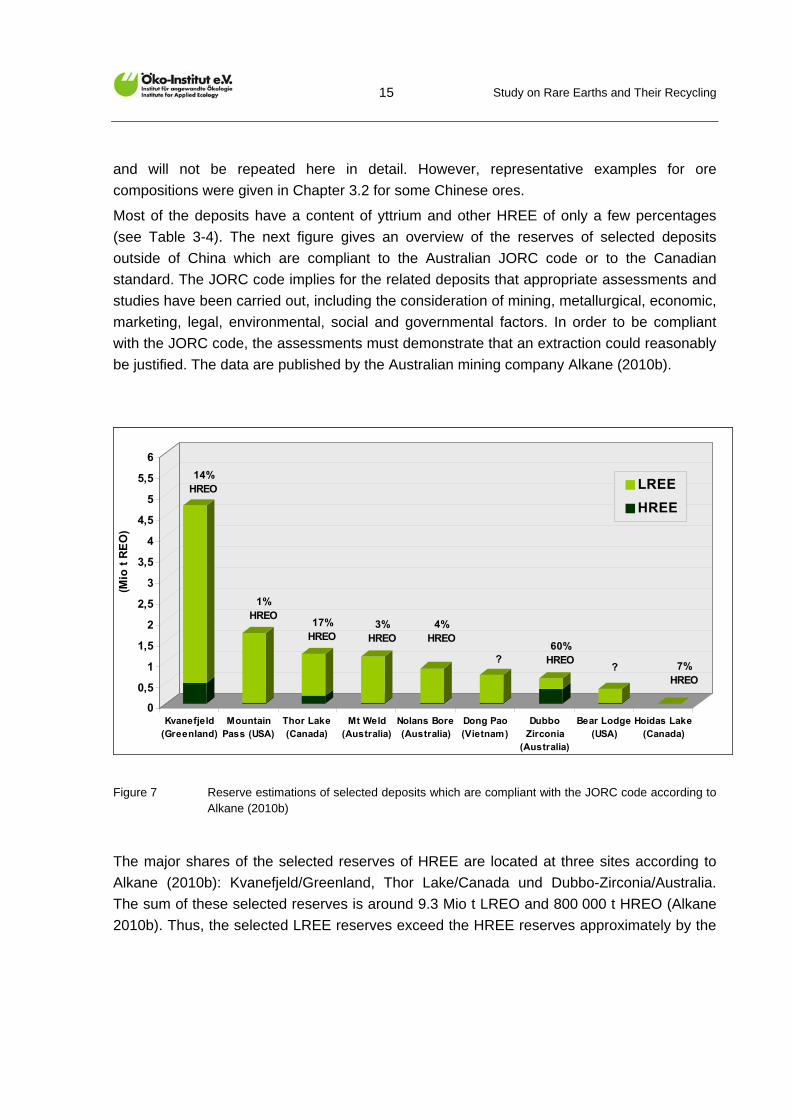
Most of the deposits have a content of yttrium and other HREE of only a few percentages
(see Table 3-4). The next figure gives an overview of the reserves of selected deposits
outside of China which are compliant to the Australian JORC code or to the Canadian
standard. The JORC code implies for the related deposits that appropriate assessments and
studies have been carried out, including the consideration of mining, metallurgical, economic,
marketing, legal, environmental, social and governmental factors. In order to be compliant
with the JORC code, the assessments must demonstrate that an extraction could reasonably
be justified. The data are published by the Australian mining company Alkane (2010b).
0
0,5
1
1,5
2
2,5
3
3,5
4
4,5
5
5,5
6
(Mio
t R
EO
)
Kvanefjeld(Greenland)
MountainPass (USA)
Thor Lake(Canada)
Mt Weld(Australia)
Nolans Bore(Australia)
Dong Pao(Vietnam)
DubboZirconia
(Australia)
Bear Lodge(USA)
Hoidas Lake(Canada)
LREE
HREE
14% HREO
1% HREO
17% HREO
3%HREO
4%HREO
60%HREO
7%HREO
??
Figure 7 Reserve estimations of selected deposits which are compliant with the JORC code according to Alkane (2010b)
The major shares of the selected reserves of HREE are located at three sites according to
Alkane (2010b): Kvanefjeld/Greenland, Thor Lake/Canada und Dubbo-Zirconia/Australia.
The sum of these selected reserves is around 9.3 Mio t LREO and 800 000 t HREO (Alkane
2010b). Thus, the selected LREE reserves exceed the HREE reserves approximately by the
Study on Rare Earths and Their Recycling
16
factor twelve. The major element comprising around two thirds to the HREE-fraction is
yttrium. The other HREE arise in much lower concentrations4.
Further information on deposits where advanced exploration activities such as feasibility
studies, laboratory tests or even construction works are already taking place is given in
Chapter 4.3.
4 The Kvanefjield deposits contribute 7.7 % Y, 0.2 % Tb, 1.1 % Dy, 0.2 % Ho, 0.6 % Er, 0.1 % Tm and 0.5 % Yb
according to GMEL (2010b). The Dubbo project and the Canadian Thor Lake project would produce an HREE with a share of Y amounting to around 2/3 (Alkane 2010a, Scott Wilson 2010).
Study on Rare Earths and Their Recycling
17
Conclusion on reserves
The US Geological Survey (USGS) estimates the global reserves of the sum of all rare
earth oxides to amount to 99 000 000 t REO. This is quite high compared to the
estimated world production of 124 000 t REO in 2009. Hereby, the reserve is defined by
the USGS as “the part of the reserve base which could be economically extracted or
produced at the time of determination.” Unfortunately, there are different definitions of
“reserves”, “reserve base” and “resources” globally which makes the comparison of
different data sources difficult. Due to a lack of harmonised data this study refers to data
from different classification schemes such as USGS estimations of global reserves,
estimations on heavy rare earth elements (HREE) according to the Australian JORC
code and data on Chinese reserves according to Chinese definitions.
The overall global reserves are spread with larger reserves in the United States, the
states from the former Soviet Union, China, Australia, India, Canada, Greenland, South
Africa, Malawi and other countries. However, the analysis showed that the total sum of
reserves is not relevant for the forecast of shortages of individual REE. Hence, an
individual analysis for selected rare earth elements is necessary.
Principally, all deposits contain more light rare earth elements (LREE) than heavy rare
earth elements (HREE). Mostly only a few percentages of the rare earths are HREE.
Among them are the potentially critical elements dysprosium (Dy), terbium (Tb) and
yttrium (Y). According to the chosen definition for this study the LREE comprise eight
REE, among them are the widely used lanthanum (La), cerium (Ce), praseodymium (Pr),
neodymium (Nd) and europium (Eu).
Presently, no data on overall reserves of HREE are available. An estimation from the
Australian Mining company ALKANE for nine potential mines outside of China (one
deposit in Greenland and Vietnam, two deposits in the USA and Canada, three deposits
in Australia) calculates economically available reserves of HREE of about 800 000 t and
reserves of LREE of about 9.3 Mt. Furthermore, quite large reserves of HREE and
reserves of LREE are located in China. Concerning European rare earth deposits, there
is only limited information on a few potential sites, and no extensive explorations are
known.
Study on Rare Earths and Their Recycling
18
4 Mining data
4.1 World production
The world production of rare earths in 2008 and 2009 according to USGS (2010a) is shown
in Table 4-15.
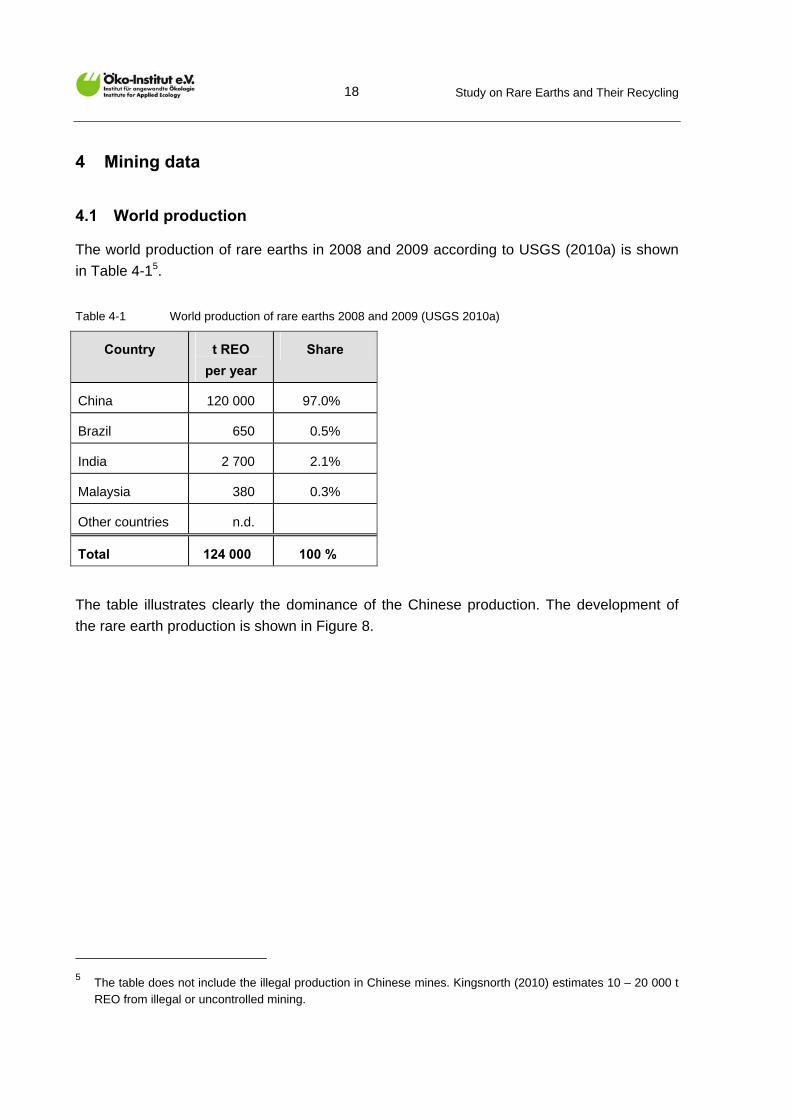
Table 4-1 World production of rare earths 2008 and 2009 (USGS 2010a)
Country t REO
per year
Share
China 120 000 97.0%
Brazil 650 0.5%
India 2 700 2.1%
Malaysia 380 0.3%
Other countries n.d.
Total 124 000 100 %
The table illustrates clearly the dominance of the Chinese production. The development of
the rare earth production is shown in Figure 8.
5 The table does not include the illegal production in Chinese mines. Kingsnorth (2010) estimates 10 – 20 000 t
REO from illegal or uncontrolled mining.
Study on Rare Earths and Their Recycling
19
China
USA
Others
China
USA
Others
Bastnasite-carbonatite period
Mountain Pass deposit(United States)
Bayan-Obodeposit etc. (China)
Monazite period
1950 1960 1970 1980 1990 2000 2006
Years
140
120
100
80
60
40
20
0
China
USA
Others
China
USA
Others
Bastnasite-carbonatite period
Mountain Pass deposit(United States)
Bayan-Obodeposit etc. (China)
Monazite period
1950 1960 1970 1980 1990 2000 2006
Years
140
120
100
80
60
40
20
0
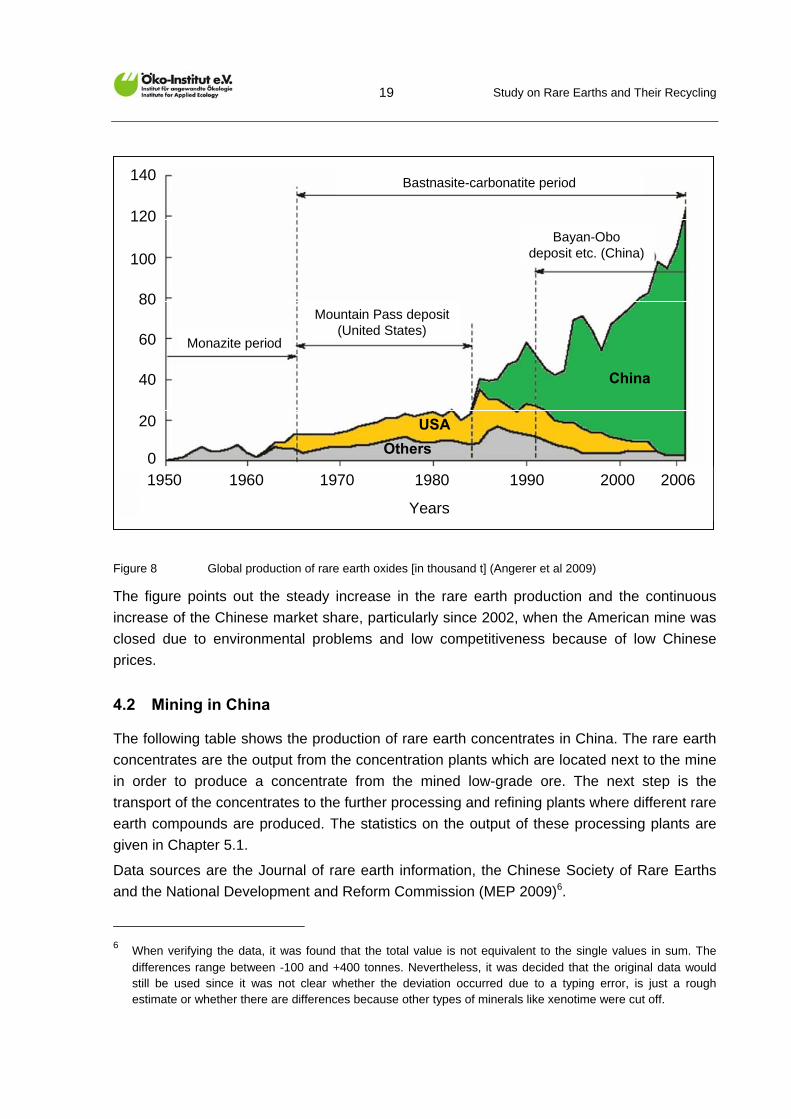
Figure 8 Global production of rare earth oxides [in thousand t] (Angerer et al 2009)
The figure points out the steady increase in the rare earth production and the continuous
increase of the Chinese market share, particularly since 2002, when the American mine was
closed due to environmental problems and low competitiveness because of low Chinese
prices.
4.2 Mining in China
The following table shows the production of rare earth concentrates in China. The rare earth
concentrates are the output from the concentration plants which are located next to the mine
in order to produce a concentrate from the mined low-grade ore. The next step is the
transport of the concentrates to the further processing and refining plants where different rare
earth compounds are produced. The statistics on the output of these processing plants are
given in Chapter 5.1.
Data sources are the Journal of rare earth information, the Chinese Society of Rare Earths
and the National Development and Reform Commission (MEP 2009)6.
6 When verifying the data, it was found that the total value is not equivalent to the single values in sum. The
differences range between -100 and +400 tonnes. Nevertheless, it was decided that the original data would still be used since it was not clear whether the deviation occurred due to a typing error, is just a rough estimate or whether there are differences because other types of minerals like xenotime were cut off.
Study on Rare Earths and Their Recycling
20
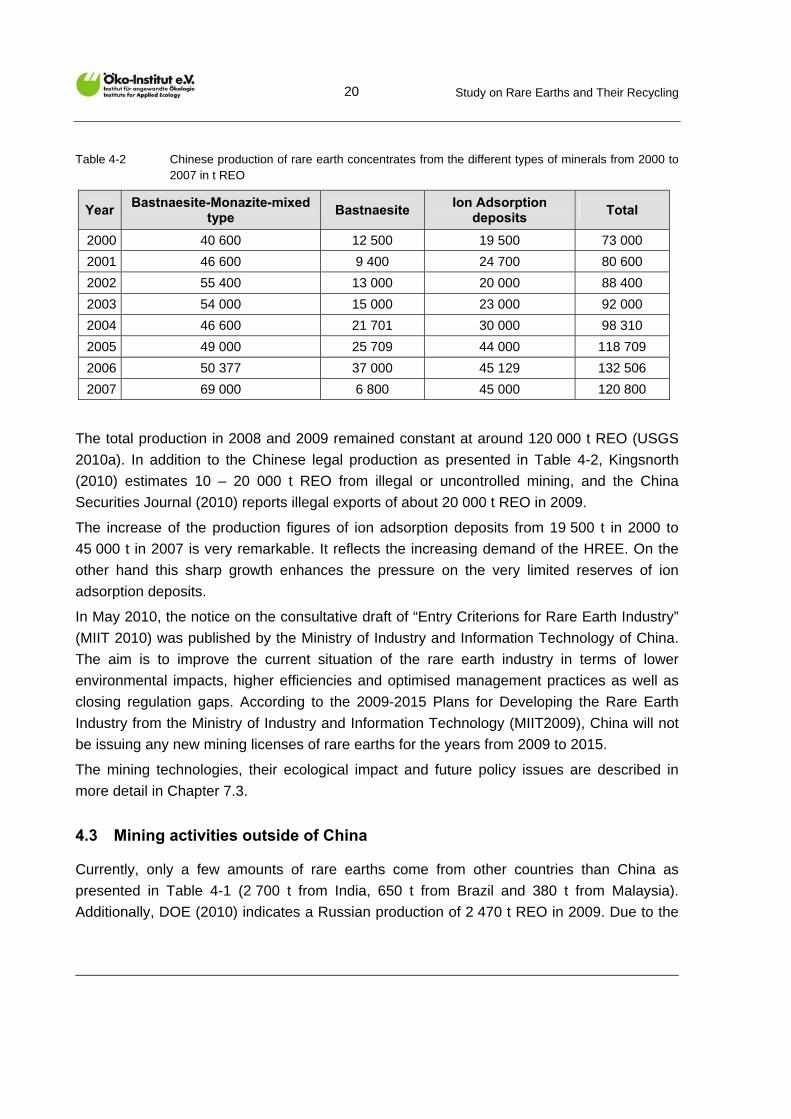
Table 4-2 Chinese production of rare earth concentrates from the different types of minerals from 2000 to 2007 in t REO
Year Bastnaesite-Monazite-mixed
type Bastnaesite
Ion Adsorption deposits
Total
2000 40 600 12 500 19 500 73 000
2001 46 600 9 400 24 700 80 600
2002 55 400 13 000 20 000 88 400
2003 54 000 15 000 23 000 92 000
2004 46 600 21 701 30 000 98 310
2005 49 000 25 709 44 000 118 709
2006 50 377 37 000 45 129 132 506
2007 69 000 6 800 45 000 120 800
The total production in 2008 and 2009 remained constant at around 120 000 t REO (USGS
2010a). In addition to the Chinese legal production as presented in Table 4-2, Kingsnorth
(2010) estimates 10 – 20 000 t REO from illegal or uncontrolled mining, and the China
Securities Journal (2010) reports illegal exports of about 20 000 t REO in 2009.
The increase of the production figures of ion adsorption deposits from 19 500 t in 2000 to
45 000 t in 2007 is very remarkable. It reflects the increasing demand of the HREE. On the
other hand this sharp growth enhances the pressure on the very limited reserves of ion
adsorption deposits.
In May 2010, the notice on the consultative draft of “Entry Criterions for Rare Earth Industry”
(MIIT 2010) was published by the Ministry of Industry and Information Technology of China.
The aim is to improve the current situation of the rare earth industry in terms of lower
environmental impacts, higher efficiencies and optimised management practices as well as
closing regulation gaps. According to the 2009-2015 Plans for Developing the Rare Earth
Industry from the Ministry of Industry and Information Technology (MIIT2009), China will not
be issuing any new mining licenses of rare earths for the years from 2009 to 2015.
The mining technologies, their ecological impact and future policy issues are described in
more detail in Chapter 7.3.
4.3 Mining activities outside of China
Currently, only a few amounts of rare earths come from other countries than China as
presented in Table 4-1 (2 700 t from India, 650 t from Brazil and 380 t from Malaysia).
Additionally, DOE (2010) indicates a Russian production of 2 470 t REO in 2009. Due to the
Study on Rare Earths and Their Recycling
21
high demand for rare earth and the decreasing Chinese export, there are many activities
aimed at the opening of new mines outside of China.
The most advanced mining projects are re-opening of the Mountain Pass mine in California
by Molycorp Minerals and the new rare earth mine at Mt Weld in Australia by Lynas with
processing in Malaysia. Their operation is scheduled to begin in 2012 and 2011, respectively.
When operating at full capacity they will each produce around 20 000 t REO light rare earths.
Their technologies and environmental aspects are described in Chapter 7.4.
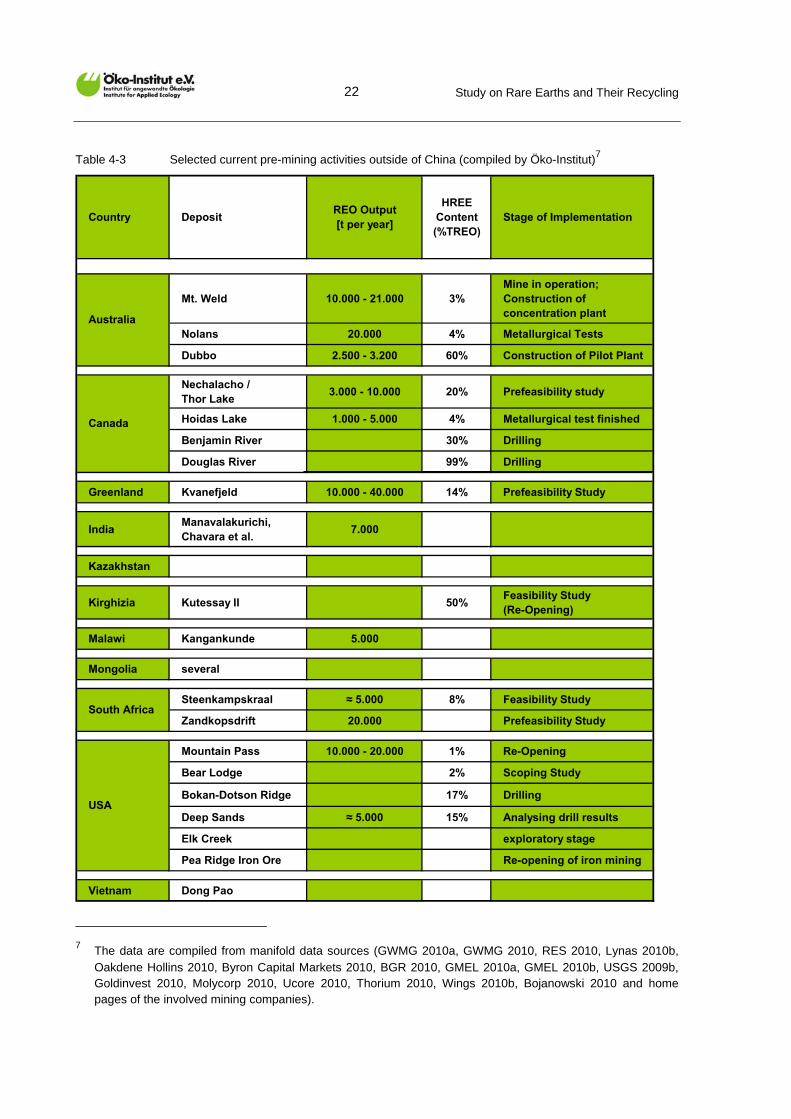
The next table gives an overview of further mining projects which are in an earlier stage. The
table provides information on the potential annual production, the content of HREE and the
stage of preparation. However, it is not certain whether these mining projects will be realised.
There are many obstacles to overcome, such as technological challenges, environmental
problems, funding of the capital intensive facilities and the approval procedures. If the
environmental equipment is not appropriate, there are high environmental risks which are
outlined in Chapter 7. The main technological challenges arise in the further processing of
the rare earth ores and their separation. There is a marginal know-how in the countries
outside of China, and the chemistry of rare earths is quite complex. Compared to the difficult
processing, the mining and the first concentration step is quite similar to the mining of other
metals and easier to handle.
Study on Rare Earths and Their Recycling
22
Table 4-3 Selected current pre-mining activities outside of China (compiled by Öko-Institut)7
Country DepositREO Output [t per year]
HREEContent (%TREO)
Stage of Implementation
Mt. Weld 10.000 - 21.000 3%Mine in operation; Construction of concentration plant
Nolans 20.000 4% Metallurgical Tests
Dubbo 2.500 - 3.200 60% Construction of Pilot Plant
Nechalacho / Thor Lake
3.000 - 10.000 20% Prefeasibility study
Hoidas Lake 1.000 - 5.000 4% Metallurgical test finished
Benjamin River 30% Drilling
Douglas River 99% Drilling
Greenland Kvanefjeld 10.000 - 40.000 14% Prefeasibility Study
IndiaManavalakurichi, Chavara et al.
7.000
Kazakhstan
Kirghizia Kutessay II 50%Feasibility Study (Re-Opening)
Malawi Kangankunde 5.000
Mongolia several
Steenkampskraal ≈ 5.000 8% Feasibility Study
Zandkopsdrift 20.000 Prefeasibility Study
Mountain Pass 10.000 - 20.000 1% Re-Opening
Bear Lodge 2% Scoping Study
Bokan-Dotson Ridge 17% Drilling
Deep Sands ≈ 5.000 15% Analysing drill results
Elk Creek exploratory stage
Pea Ridge Iron Ore Re-opening of iron mining
Vietnam Dong Pao
Australia
Canada
USA
South Africa
7 The data are compiled from manifold data sources (GWMG 2010a, GWMG 2010, RES 2010, Lynas 2010b,
Oakdene Hollins 2010, Byron Capital Markets 2010, BGR 2010, GMEL 2010a, GMEL 2010b, USGS 2009b, Goldinvest 2010, Molycorp 2010, Ucore 2010, Thorium 2010, Wings 2010b, Bojanowski 2010 and home pages of the involved mining companies).
Study on Rare Earths and Their Recycling
23
Additionally, BGS (2010) reports about some further projects which are in an early
exploration state in Canada, USA, Namibia, Australia and Malawi. The German company
Tantalus Rare Earths AG started the geological sampling at a potential deposit in
Madagascar (Tantalus 2010). Japanese companies are involved in the development of rare
earth mining in Kazakhstan, Vietnam and India (BGS 2010, BBC 2010, Reuters 2010, DOE
2010).
The time span needed in order to start the operation of a mining including the concentration
of the ore depends on many site-specific factors. Based on the examples of the moderni-
zation at the Mountain Pass and the new implementations of Mt Weld, the following time
ranges can be estimated which are required for the implementation of new mining projects.
However the time schedules for specific mines may vary significantly because every mining
has its specific challenges (environmental issues, type of mineral, type of mining, ore grade,
financial equipment, social context, etc.):
Feasibility studies, metallurgical tests, pilot plan: around four years
Installation of the mining equipment: around one year
Installation of the concentration plant to enrich
the low-grade ore from the mine: around two years
Installation of rare earth processing plants
from concentrated ore: around four years
The approval procedure also requires several years and usually runs parallel to the project
development and implementation. The operation of the Mountain Pass requires more than 20
permissions concerning environmental issues, building, work safety and others (Molycorp
2010b). Oakdene Hollins (2010) estimates a minimum time of 6 – 10 years before a mine
starts operation. USGS (2010f) gives an overview of the time needed for the approval
procedure and the construction work since the discovery of the deposit. The time spans vary
significantly from 5 to 50 years.
Another aspect concerning the opening of new mines and rare earth processing plants is the
high investment. Oakdene Hollins (2010) cites a document from an OECD workshop in 2009
with the estimate that typically capacity costs are more than 30 000 US$ per ton of capacity
for separated REE. The figures are in the same range as data on investment compiled by
Lifton (2010a) on mining and processing companies and their need of financial investment
for the development of the rare earth production including processing: Molycorp (Mountain
Pass, USA) more than US$ 500 million, Avalon Rare metals (Thor Lake, Canada): C$ 900
million for the Northwest Territories project, Lynas (Mt Weld, Australia): US$ 500 million,
Arafura Resources (Nolans, Australia) more than US$ 500 million. The major investment
Study on Rare Earths and Their Recycling
24
costs in this context arise from the processing. USGS (2010f) also confirms the need of large
sources and capitals and outlines that already the pre-mining activities (exploration,
metallurgical process development, approval procedure) cause high expenses.
The specific production costs per unit of processed rare earth also show just a small
contribution from the mining: Lynas (2010a) estimates the contribution of the overall cash
costs for process rare earth oxides (finished REO) as follows: Mining 4 %; concentration of
the ore 21 %, shipping from Australia to Malaysia (9 %) and refining and processing 66 %.
Conclusion on mining
The world production of rare earths was around 124 000 t REO per year in 2008 and 2009
according to data from the US Geological Survey (USGS). This is quite low compared with
the annual primary production of other metals, e.g. 39 Mt aluminium or 22 Mt copper.
More than 97 % of the production and a large share of the further processing are located
in China. Small amounts are produced in Malaysia, Brazil, India and Russia. Additionally,
around 20 000 t REO were illegally produced in China and are not included in the above
given USGS data.
Due to the high demand for rare earths and the decreasing Chinese exports, there are
many activities aimed at the opening of new mines outside of China. The most advanced
mining projects are the re-opening of the Mountain Pass mine in California by Molycorp
Minerals and the new rare earth mine at Mt Weld in Australia by Lynas with processing in
Malaysia. Their operation is scheduled to begin in 2012 and 2011, respectively.
Additionally, there are numerous further mining projects which are in an earlier stage in
Australia, Canada, USA, India, Kazakhstan, Kirghizia, Malawi, South Africa, Vietnam and
Madagascar. However, it is not certain whether these mining projects will be realised.
There are many obstacles to overcome, such as technological problems, environmental
problems, funding of the capital intensive facilities and the approval procedures. The time
span needed in order to start the operation of a mining including the concentration of the
ore depends on many site-specific factors and is estimated to take a minimum of six to ten
years.
Study on Rare Earths and Their Recycling
25
5 Global rare earth processing
5.1 Rare earth processing in China
In terms of separation and smelting technologies, China owns internationally advanced rare
earth technology. Since 1972, China has been conducting investigations on separation and
smelting technologies of rare earth. It is the only country in the world that can provide rare
earth products of all grades and specifications, stated Lin Donglu, Secretary General of the
Chinese Society of Rare Earths in an interview by Xinhua News Agency’s finance magazine
(Beijng Review 2010). By now, there are about 24 domestic enterprises for rare earth mining
and 100 rare earth enterprises (11 among them are joint ventures) for separating and
smelting as well as refining production in China according to The Explanation of Compiling
Emission Standards of Pollutants from Rare Earths Industry. Three major extraction areas
are located in Inner Mongolia, Sichuan and seven provinces in the South of China, mainly in
Jiangxi. Their technologies are described in Chapter 7.3.2.
China not only produces the rare earth containing intermediate products such as metals,
alloys or carbonates but also manufactures most of the final products, e.g. phosphors, LEDs,
catalysts, Ni-MH batteries, magnets. China's government encourages its enterprises to
extend the manufacturing of these products with a higher value using high-technology at the
end of the process chain in order to supply the growing Chinese market as well as for export.
5.1.1 Production statistics
Figure 9 gives an overview of the rare earth oxide production in China in 2006 and the
contribution of specific elements. The detailed figures are presented in Table 5-2.
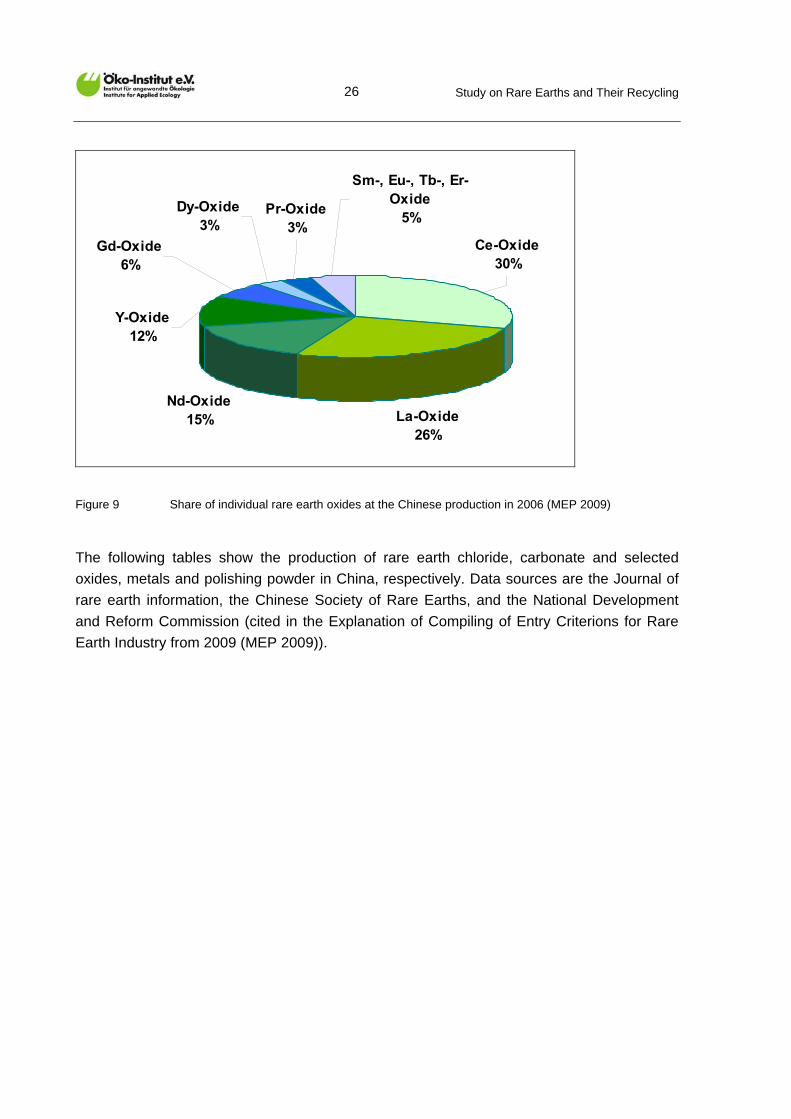
Study on Rare Earths and Their Recycling
26
Ce-Oxide30%
La-Oxide26%
Nd-Oxide15%
Y-Oxide12%
Gd-Oxide6%
Sm-, Eu-, Tb-, Er-Oxide
5%Pr-Oxide
3%
Dy-Oxide3%
Figure 9 Share of individual rare earth oxides at the Chinese production in 2006 (MEP 2009)
The following tables show the production of rare earth chloride, carbonate and selected
oxides, metals and polishing powder in China, respectively. Data sources are the Journal of
rare earth information, the Chinese Society of Rare Earths, and the National Development
and Reform Commission (cited in the Explanation of Compiling of Entry Criterions for Rare
Earth Industry from 2009 (MEP 2009)).
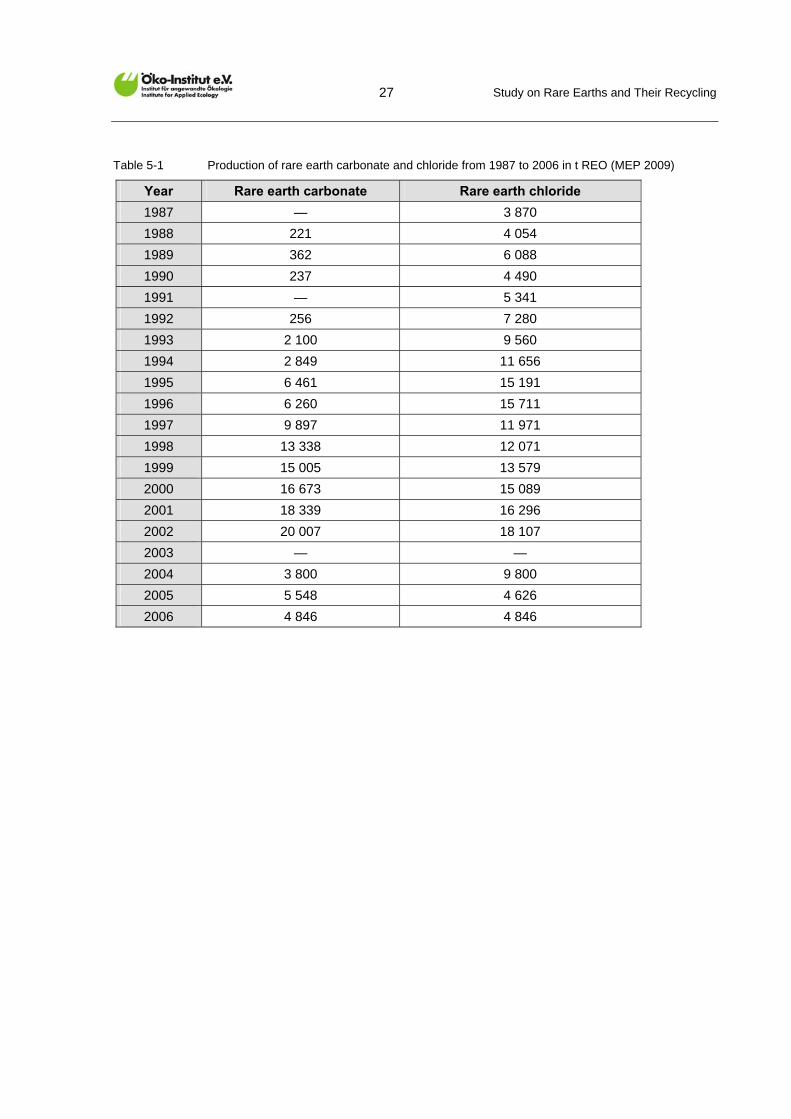
Study on Rare Earths and Their Recycling
27
Table 5-1 Production of rare earth carbonate and chloride from 1987 to 2006 in t REO (MEP 2009)
Year Rare earth carbonate Rare earth chloride
1987 — 3 870
1988 221 4 054
1989 362 6 088
1990 237 4 490
1991 — 5 341
1992 256 7 280
1993 2 100 9 560
1994 2 849 11 656
1995 6 461 15 191
1996 6 260 15 711
1997 9 897 11 971
1998 13 338 12 071
1999 15 005 13 579
2000 16 673 15 089
2001 18 339 16 296
2002 20 007 18 107
2003 — —
2004 3 800 9 800
2005 5 548 4 626
2006 4 846 4 846
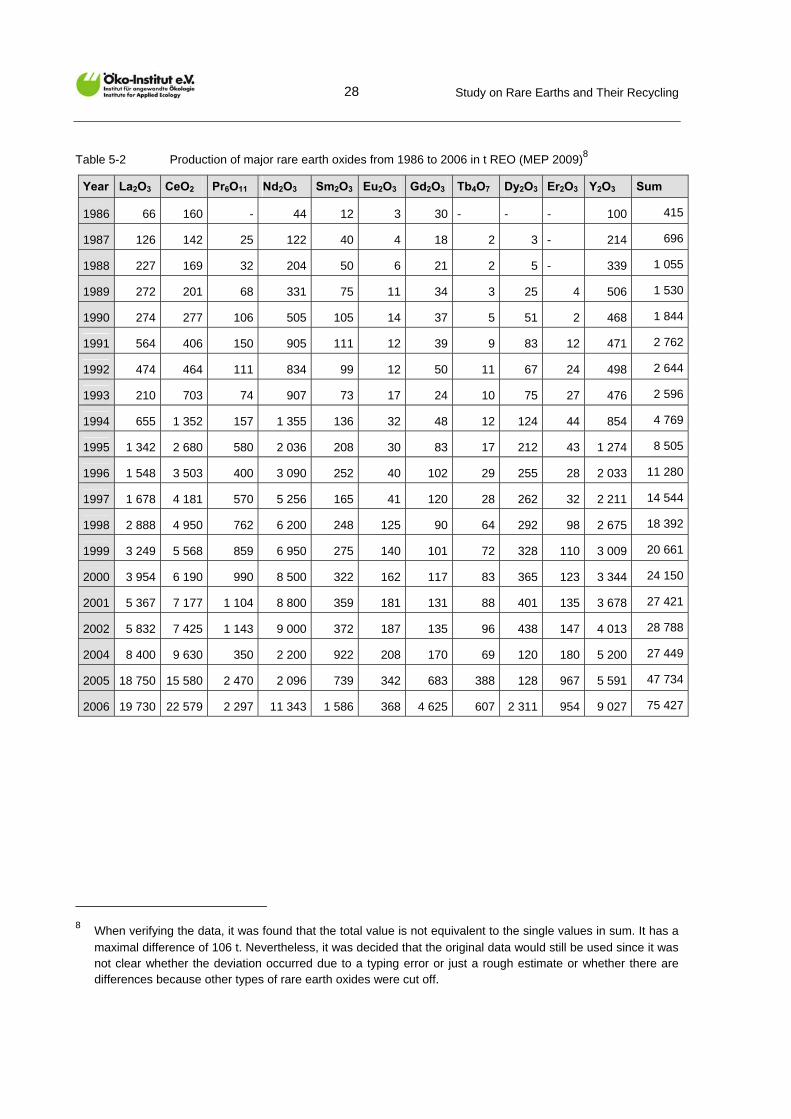
Study on Rare Earths and Their Recycling
28
Table 5-2 Production of major rare earth oxides from 1986 to 2006 in t REO (MEP 2009)8
Year La2O3 CeO2 Pr6O11 Nd2O3 Sm2O3 Eu2O3 Gd2O3 Tb4O7 Dy2O3 Er2O3 Y2O3 Sum
1986 66 160 - 44 12 3 30 - - - 100 415
1987 126 142 25 122 40 4 18 2 3 - 214 696
1988 227 169 32 204 50 6 21 2 5 - 339 1 055
1989 272 201 68 331 75 11 34 3 25 4 506 1 530
1990 274 277 106 505 105 14 37 5 51 2 468 1 844
1991 564 406 150 905 111 12 39 9 83 12 471 2 762
1992 474 464 111 834 99 12 50 11 67 24 498 2 644
1993 210 703 74 907 73 17 24 10 75 27 476 2 596
1994 655 1 352 157 1 355 136 32 48 12 124 44 854 4 769
1995 1 342 2 680 580 2 036 208 30 83 17 212 43 1 274 8 505
1996 1 548 3 503 400 3 090 252 40 102 29 255 28 2 033 11 280
1997 1 678 4 181 570 5 256 165 41 120 28 262 32 2 211 14 544
1998 2 888 4 950 762 6 200 248 125 90 64 292 98 2 675 18 392
1999 3 249 5 568 859 6 950 275 140 101 72 328 110 3 009 20 661
2000 3 954 6 190 990 8 500 322 162 117 83 365 123 3 344 24 150
2001 5 367 7 177 1 104 8 800 359 181 131 88 401 135 3 678 27 421
2002 5 832 7 425 1 143 9 000 372 187 135 96 438 147 4 013 28 788
2004 8 400 9 630 350 2 200 922 208 170 69 120 180 5 200 27 449
2005 18 750 15 580 2 470 2 096 739 342 683 388 128 967 5 591 47 734
2006 19 730 22 579 2 297 11 343 1 586 368 4 625 607 2 311 954 9 027 75 427
8 When verifying the data, it was found that the total value is not equivalent to the single values in sum. It has a
maximal difference of 106 t. Nevertheless, it was decided that the original data would still be used since it was not clear whether the deviation occurred due to a typing error or just a rough estimate or whether there are differences because other types of rare earth oxides were cut off.
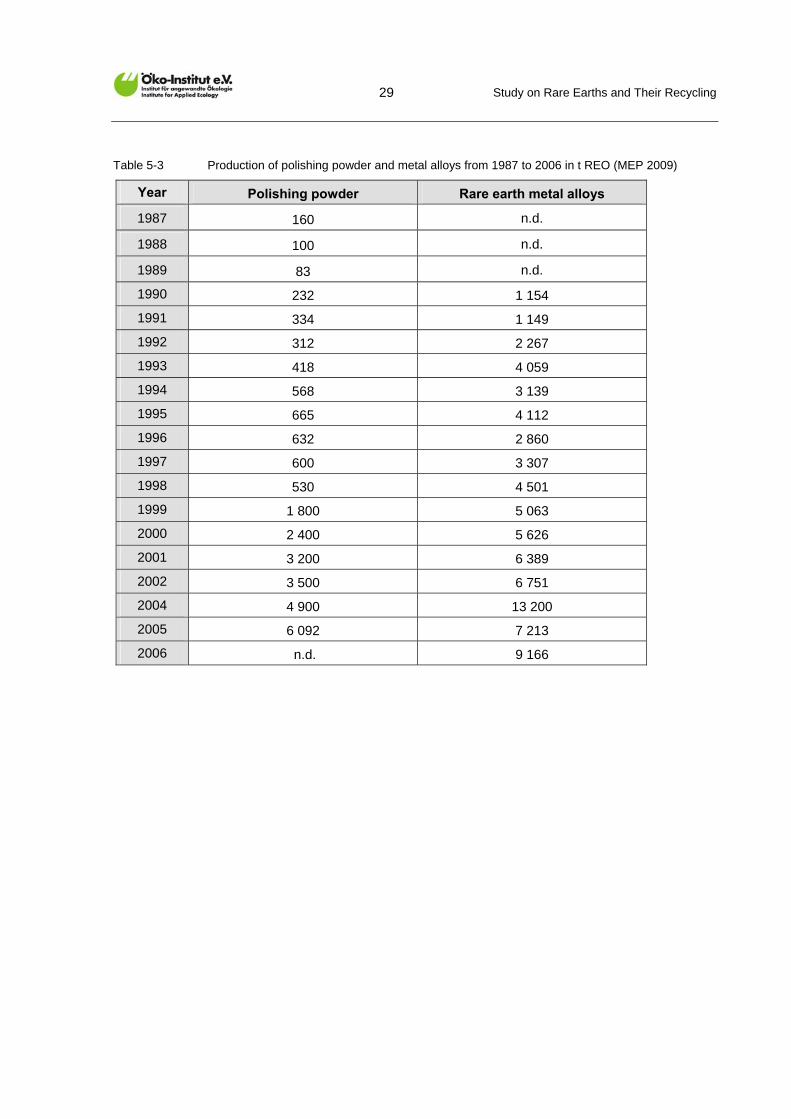
Study on Rare Earths and Their Recycling
29
Table 5-3 Production of polishing powder and metal alloys from 1987 to 2006 in t REO (MEP 2009)
Year Polishing powder Rare earth metal alloys
1987 160 n.d.
1988 100 n.d.
1989 83 n.d.
1990 232 1 154
1991 334 1 149
1992 312 2 267
1993 418 4 059
1994 568 3 139
1995 665 4 112
1996 632 2 860
1997 600 3 307
1998 530 4 501
1999 1 800 5 063
2000 2 400 5 626
2001 3 200 6 389
2002 3 500 6 751
2004 4 900 13 200
2005 6 092 7 213
2006 n.d. 9 166
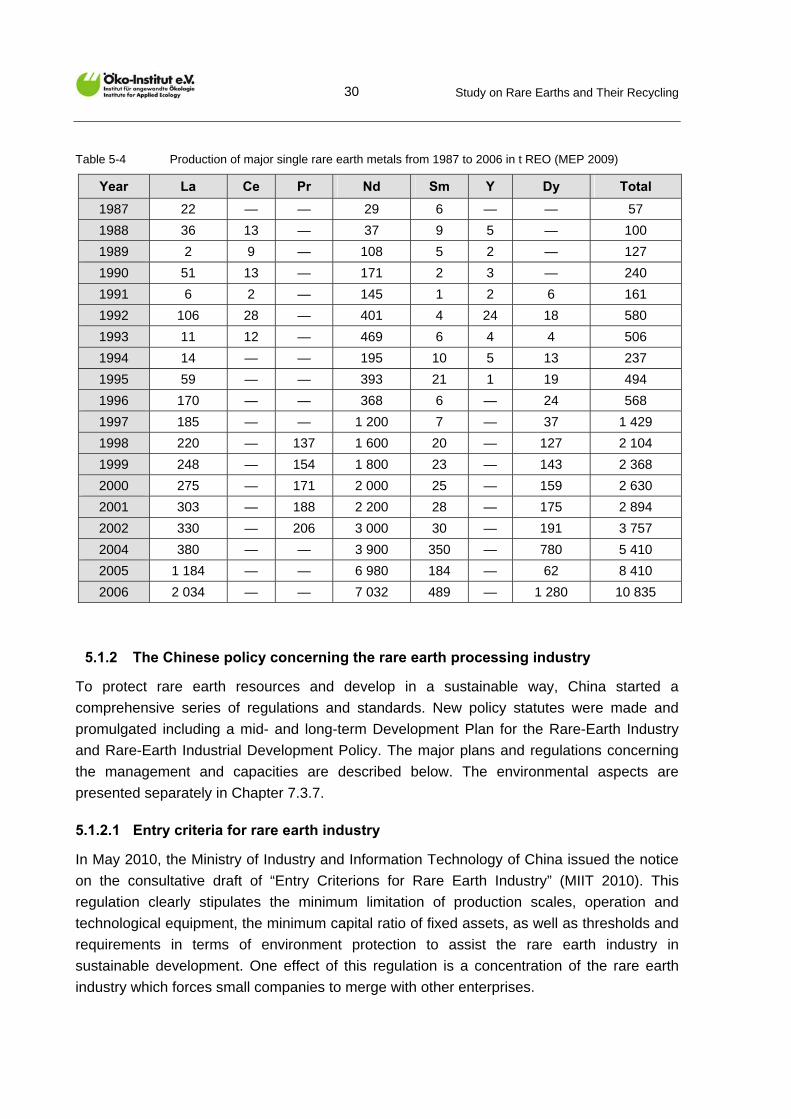
Study on Rare Earths and Their Recycling
30
Table 5-4 Production of major single rare earth metals from 1987 to 2006 in t REO (MEP 2009)
Year La Ce Pr Nd Sm Y Dy Total
1987 22 — — 29 6 — — 57
1988 36 13 — 37 9 5 — 100
1989 2 9 — 108 5 2 — 127
1990 51 13 — 171 2 3 — 240
1991 6 2 — 145 1 2 6 161
1992 106 28 — 401 4 24 18 580
1993 11 12 — 469 6 4 4 506
1994 14 — — 195 10 5 13 237
1995 59 — — 393 21 1 19 494
1996 170 — — 368 6 — 24 568
1997 185 — — 1 200 7 — 37 1 429
1998 220 — 137 1 600 20 — 127 2 104
1999 248 — 154 1 800 23 — 143 2 368
2000 275 — 171 2 000 25 — 159 2 630
2001 303 — 188 2 200 28 — 175 2 894
2002 330 — 206 3 000 30 — 191 3 757
2004 380 — — 3 900 350 — 780 5 410
2005 1 184 — — 6 980 184 — 62 8 410
2006 2 034 — — 7 032 489 — 1 280 10 835
5.1.2 The Chinese policy concerning the rare earth processing industry
To protect rare earth resources and develop in a sustainable way, China started a
comprehensive series of regulations and standards. New policy statutes were made and
promulgated including a mid- and long-term Development Plan for the Rare-Earth Industry
and Rare-Earth Industrial Development Policy. The major plans and regulations concerning
the management and capacities are described below. The environmental aspects are
presented separately in Chapter 7.3.7.
5.1.2.1 Entry criteria for rare earth industry
In May 2010, the Ministry of Industry and Information Technology of China issued the notice
on the consultative draft of “Entry Criterions for Rare Earth Industry” (MIIT 2010). This
regulation clearly stipulates the minimum limitation of production scales, operation and
technological equipment, the minimum capital ratio of fixed assets, as well as thresholds and
requirements in terms of environment protection to assist the rare earth industry in
sustainable development. One effect of this regulation is a concentration of the rare earth
industry which forces small companies to merge with other enterprises.
Study on Rare Earths and Their Recycling
31
Concerning production scales at the separation and processing level, the production capacity
of separation and refinement of mixed types of ores should not be less than 8 000 t REO per
year. The production capacity of separating and refining of bastnaesite should not be less
than 5 000 t REO annually.
As regards production scales at the metal refining level, the production capacity of
enterprises should not be less than 1 500 t per year. Furthermore, the capital ratio of fixed
assets investment should account for at least 40 % of total investment.
The environmental standards determined in the regulation are presented in Chapter 7.3.7.
5.1.2.2 The 2009-2015 plans for developing the rare earth industry
This development plan is a mandatory planning compiled by the Ministry of Industry and
Information Technology of China. According to the 2009-2015 Plans for Developing the Rare
Earth Industry, rare earth industry in China will divide into three large districts: South, North
and West (MIIT 2009). As for light REE mining, the focus is located in Inner Mongolia
(Northern district) and Sichuan (Southwest district), with some development in Shandong as
far as needed. The heavy REE mining is concentrated in the southern districts such as
Jiangxi, Guangdong, Fujian and Hunan (China Net 2010). The aim of the Plan is to simplify
management of China’s rare earth resources by “designating large districts”. Because of the
scattered distribution of rare earth resources, it is difficult to carry out an efficient oversight of
the industry (Hurst 2010).
According to the mandatory planning, from 2009 to 2015, the whole production of refined
rare earth metals should range between 13 000 and 15 000 tons annually. The production
capacity of separating and smelting enterprises should be between 12 000 and 15 000 tons.
Moreover, China is undergoing consolidation – mergers and acquisitions by large companies
and closing of small plants. For the years from 2009 to 2015, China will not be issuing any
new mining licenses of rare earths. During this period, the existing rare earth enterprises
should put emphasis on improving the level of technical equipment, environmental protection
and management capability. Meanwhile, mergers and acquisitions (M&As) in rare earth
industry are promoted. Furthermore, a plan has clearly been specified to close down a
number of small and illegal as well as inefficient separating and smelting enterprises in order
to gain more control. It was reported that the government planned to cut down the number of
enterprises from 100 at the moment to 20 (China Net 2010).
As for the monitoring aspect, the Ministry of Industry and Information Technology will over-
see the industry by creating an examination and inspection system for rare earth extraction
to guarantee that national directive plans are being implemented and executed.
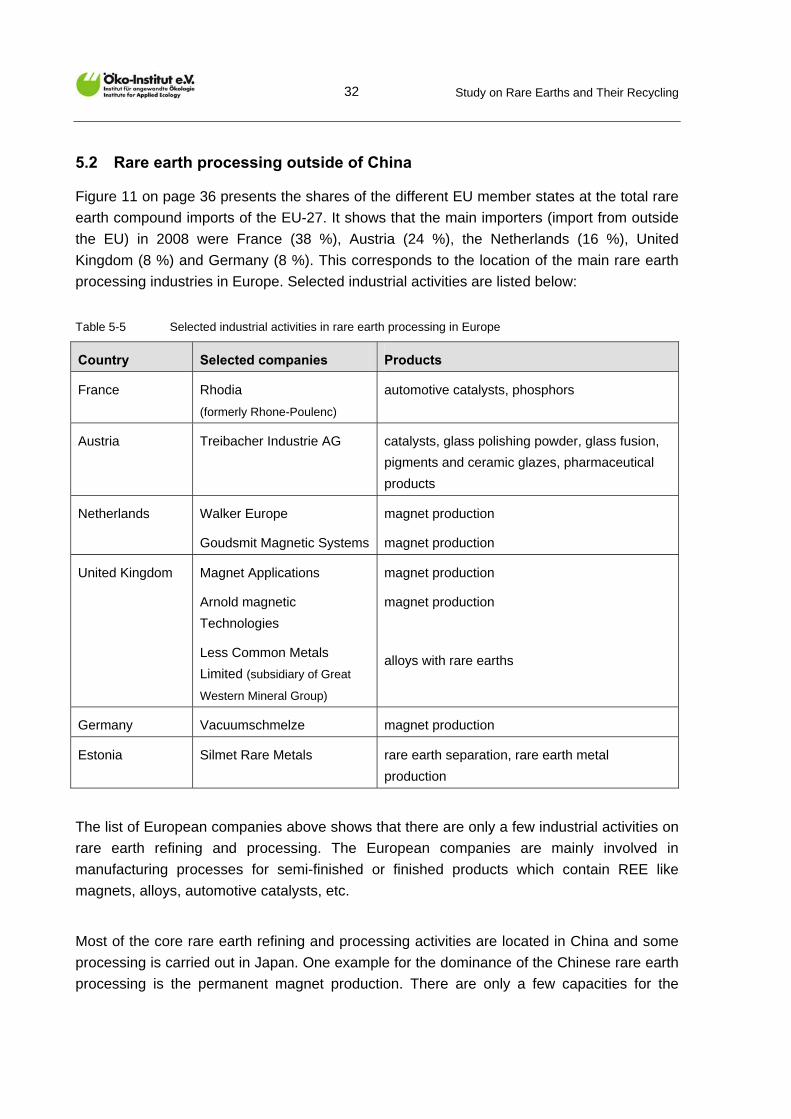
Study on Rare Earths and Their Recycling
32
5.2 Rare earth processing outside of China
Figure 11 on page 36 presents the shares of the different EU member states at the total rare
earth compound imports of the EU-27. It shows that the main importers (import from outside
the EU) in 2008 were France (38 %), Austria (24 %), the Netherlands (16 %), United
Kingdom (8 %) and Germany (8 %). This corresponds to the location of the main rare earth
processing industries in Europe. Selected industrial activities are listed below:
Table 5-5 Selected industrial activities in rare earth processing in Europe
Country Selected companies Products
France Rhodia
(formerly Rhone-Poulenc)
automotive catalysts, phosphors
Austria Treibacher Industrie AG catalysts, glass polishing powder, glass fusion,
pigments and ceramic glazes, pharmaceutical
products
Netherlands Walker Europe
Goudsmit Magnetic Systems
magnet production
magnet production
United Kingdom Magnet Applications
Arnold magnetic
Technologies
Less Common Metals
Limited (subsidiary of Great
Western Mineral Group)
magnet production
magnet production
alloys with rare earths
Germany Vacuumschmelze magnet production
Estonia Silmet Rare Metals rare earth separation, rare earth metal
production
The list of European companies above shows that there are only a few industrial activities on
rare earth refining and processing. The European companies are mainly involved in
manufacturing processes for semi-finished or finished products which contain REE like
magnets, alloys, automotive catalysts, etc.
Most of the core rare earth refining and processing activities are located in China and some
processing is carried out in Japan. One example for the dominance of the Chinese rare earth
processing is the permanent magnet production. There are only a few capacities for the
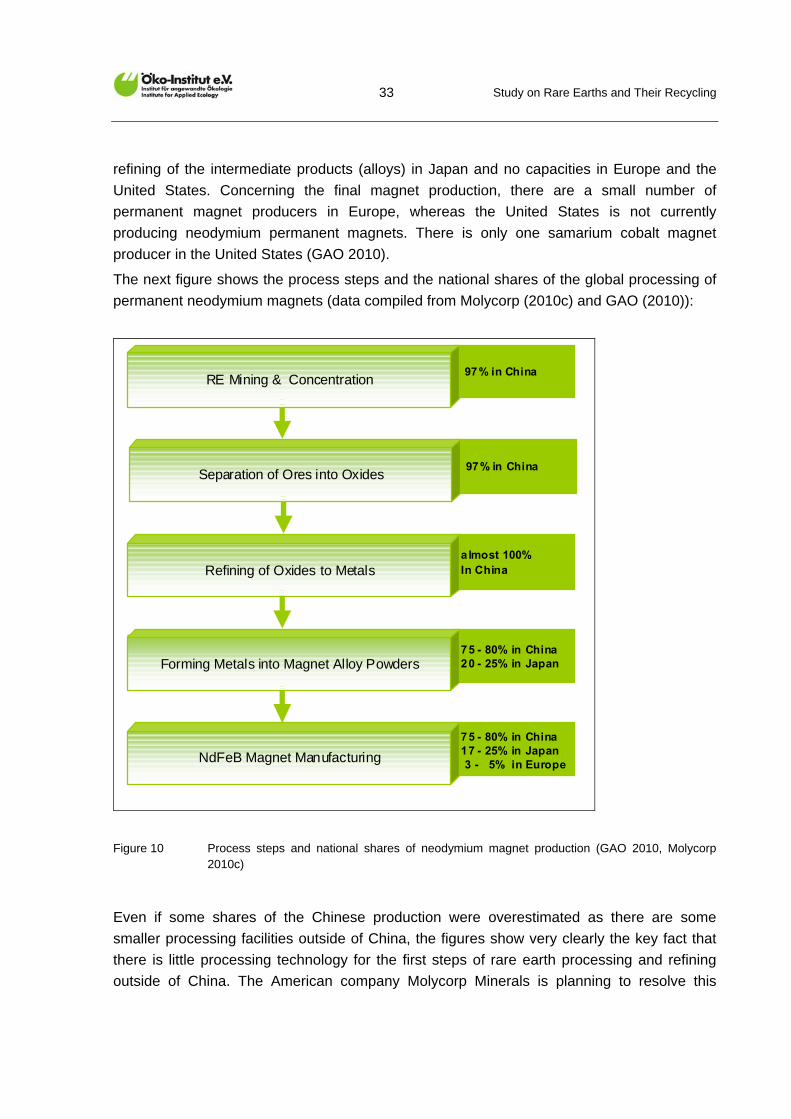
Study on Rare Earths and Their Recycling
33
refining of the intermediate products (alloys) in Japan and no capacities in Europe and the
United States. Concerning the final magnet production, there are a small number of
permanent magnet producers in Europe, whereas the United States is not currently
producing neodymium permanent magnets. There is only one samarium cobalt magnet
producer in the United States (GAO 2010).
The next figure shows the process steps and the national shares of the global processing of
permanent neodymium magnets (data compiled from Molycorp (2010c) and GAO (2010)):
97% in China
almost 100% In China
75 - 80% in China20 - 25% in Japan
75 - 80% in China17 - 25% in Japan3 - 5% in Europe
RE Mining & Concentration
Refining of Oxides to Metals
Forming Metals into Magnet Alloy Powders
NdFeB Magnet Manufacturing
97% in ChinaSeparation of Ores into Oxides
Figure 10 Process steps and national shares of neodymium magnet production (GAO 2010, Molycorp 2010c)
Even if some shares of the Chinese production were overestimated as there are some
smaller processing facilities outside of China, the figures show very clearly the key fact that
there is little processing technology for the first steps of rare earth processing and refining
outside of China. The American company Molycorp Minerals is planning to resolve this
Study on Rare Earths and Their Recycling
34
problem by re-opening their rare earth mine and concentration plant at the Mountain Pass in
California and complementing it with the whole rare earth processing chain including a
neodymium permanent magnet production.
Conclusion on global rare earth processing
In terms of separation and smelting technologies, China owns internationally advanced
rare earth technology. It is the only country in the world that can provide rare earth
products of all grades and specifications. China not only produces rare earth containing
intermediate products but also manufactures most of the final products. China's
government encourages its enterprises to extend the manufacturing of finished products
with a higher value using high-technology at the end of the process chain.
According to the “Entry Criterions for Rare Earth Industry” and the “2009-2015 Plans for
Developing the Rare Earth Industry”, the rare earth industry in China will be divided into
three large districts in order to undergo consolidation with mergers and closing of small
plants. For the years from 2009 to 2015, China will not be issuing any new mining licenses
of rare earths. During this period, the existing rare earth enterprises should put emphasis
on improving the level of technical equipment, environmental protection and management
capability. Furthermore, a plan has clearly been specified to close down a number of small
and illegal as well as inefficient separating and smelting enterprises. An examination and
inspection system shall also be created.
Besides China, Japan is able to carry out some rare earth processing. In Europe, there
are only a few industrial activities on rare earth refining and processing. The European
companies are mainly involved in manufacturing processes for semi-finished or finished
products which contain REE like magnets, lighting systems, alloys, automotive catalysts,
etc.
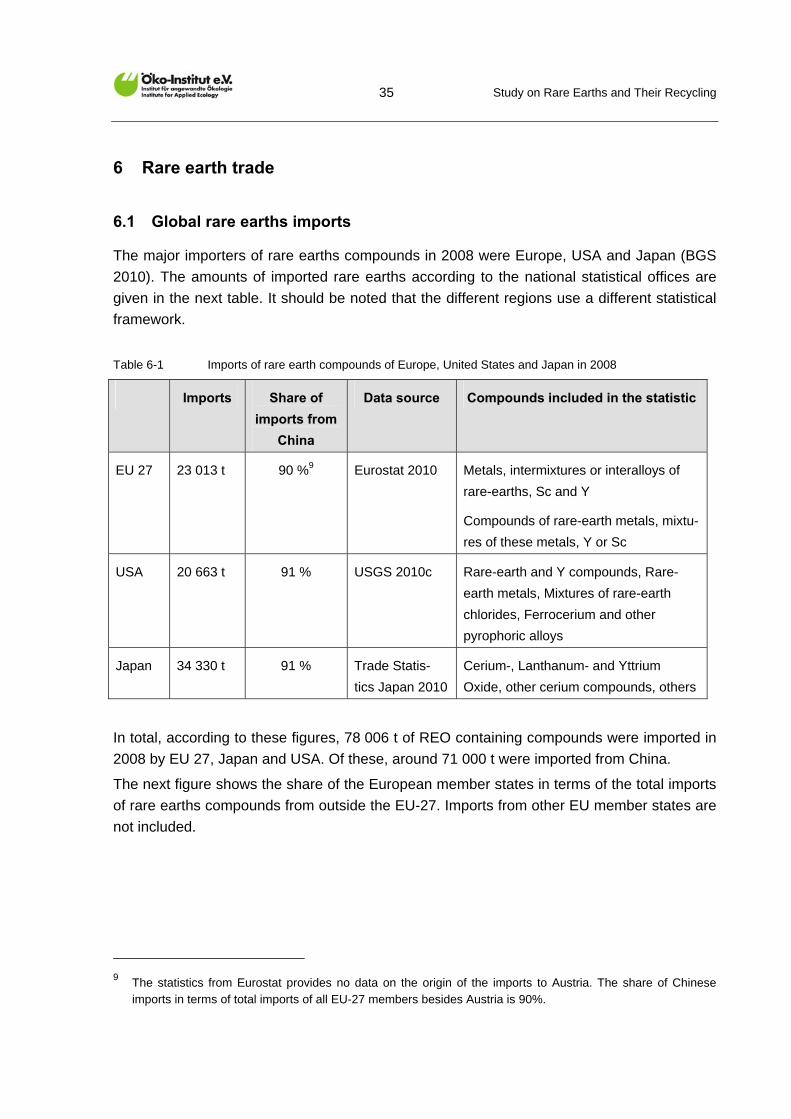
Study on Rare Earths and Their Recycling
35
6 Rare earth trade
6.1 Global rare earths imports
The major importers of rare earths compounds in 2008 were Europe, USA and Japan (BGS
2010). The amounts of imported rare earths according to the national statistical offices are
given in the next table. It should be noted that the different regions use a different statistical
framework.
Table 6-1 Imports of rare earth compounds of Europe, United States and Japan in 2008
Imports Share of
imports from
China
Data source Compounds included in the statistic
EU 27 23 013 t 90 %9 Eurostat 2010 Metals, intermixtures or interalloys of
rare-earths, Sc and Y
Compounds of rare-earth metals, mixtu-
res of these metals, Y or Sc
USA 20 663 t 91 % USGS 2010c Rare-earth and Y compounds, Rare-
earth metals, Mixtures of rare-earth
chlorides, Ferrocerium and other
pyrophoric alloys
Japan 34 330 t 91 % Trade Statis-
tics Japan 2010
Cerium-, Lanthanum- and Yttrium
Oxide, other cerium compounds, others
In total, according to these figures, 78 006 t of REO containing compounds were imported in
2008 by EU 27, Japan and USA. Of these, around 71 000 t were imported from China.
The next figure shows the share of the European member states in terms of the total imports
of rare earths compounds from outside the EU-27. Imports from other EU member states are
not included.
9 The statistics from Eurostat provides no data on the origin of the imports to Austria. The share of Chinese
imports in terms of total imports of all EU-27 members besides Austria is 90%.
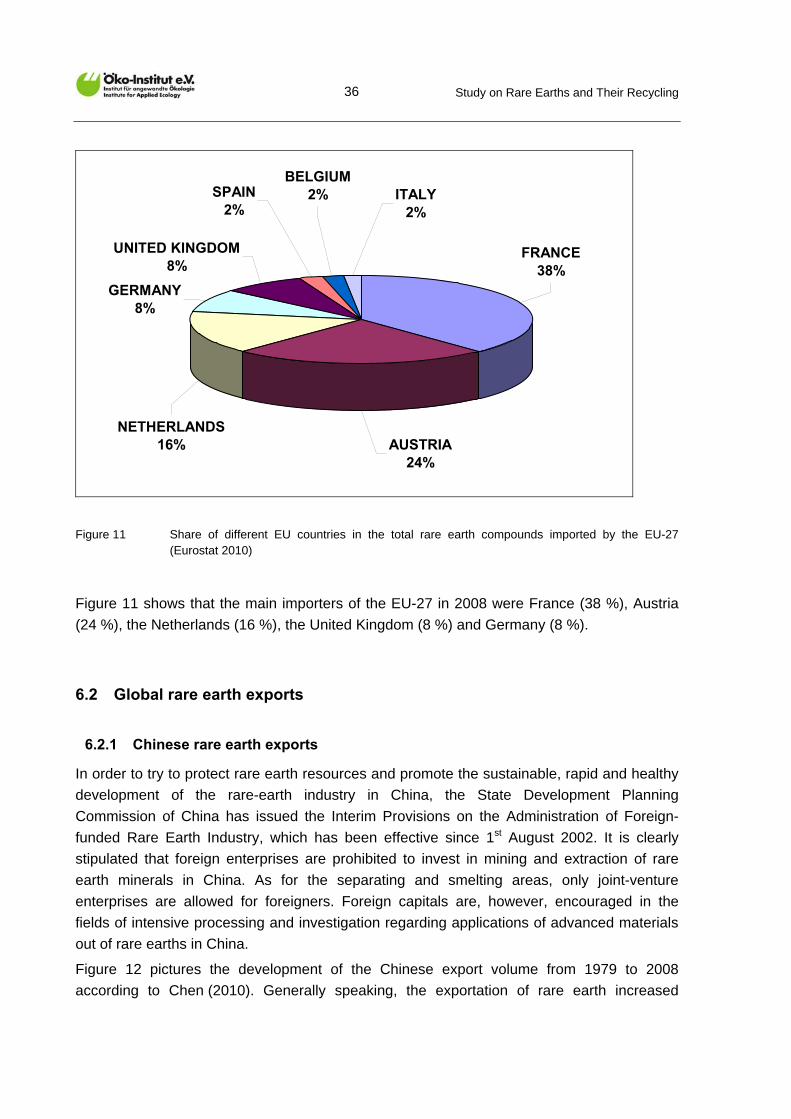
Study on Rare Earths and Their Recycling
36
GERMANY 8%
UNITED KINGDOM8%
FRANCE38%
NETHERLANDS16% AUSTRIA
24%
SPAIN2%
BELGIUM 2% ITALY
2%
Figure 11 Share of different EU countries in the total rare earth compounds imported by the EU-27 (Eurostat 2010)
Figure 11 shows that the main importers of the EU-27 in 2008 were France (38 %), Austria
(24 %), the Netherlands (16 %), the United Kingdom (8 %) and Germany (8 %).
6.2 Global rare earth exports
6.2.1 Chinese rare earth exports
In order to try to protect rare earth resources and promote the sustainable, rapid and healthy
development of the rare-earth industry in China, the State Development Planning
Commission of China has issued the Interim Provisions on the Administration of Foreign-
funded Rare Earth Industry, which has been effective since 1st August 2002. It is clearly
stipulated that foreign enterprises are prohibited to invest in mining and extraction of rare
earth minerals in China. As for the separating and smelting areas, only joint-venture
enterprises are allowed for foreigners. Foreign capitals are, however, encouraged in the
fields of intensive processing and investigation regarding applications of advanced materials
out of rare earths in China.
Figure 12 pictures the development of the Chinese export volume from 1979 to 2008
according to Chen (2010). Generally speaking, the exportation of rare earth increased
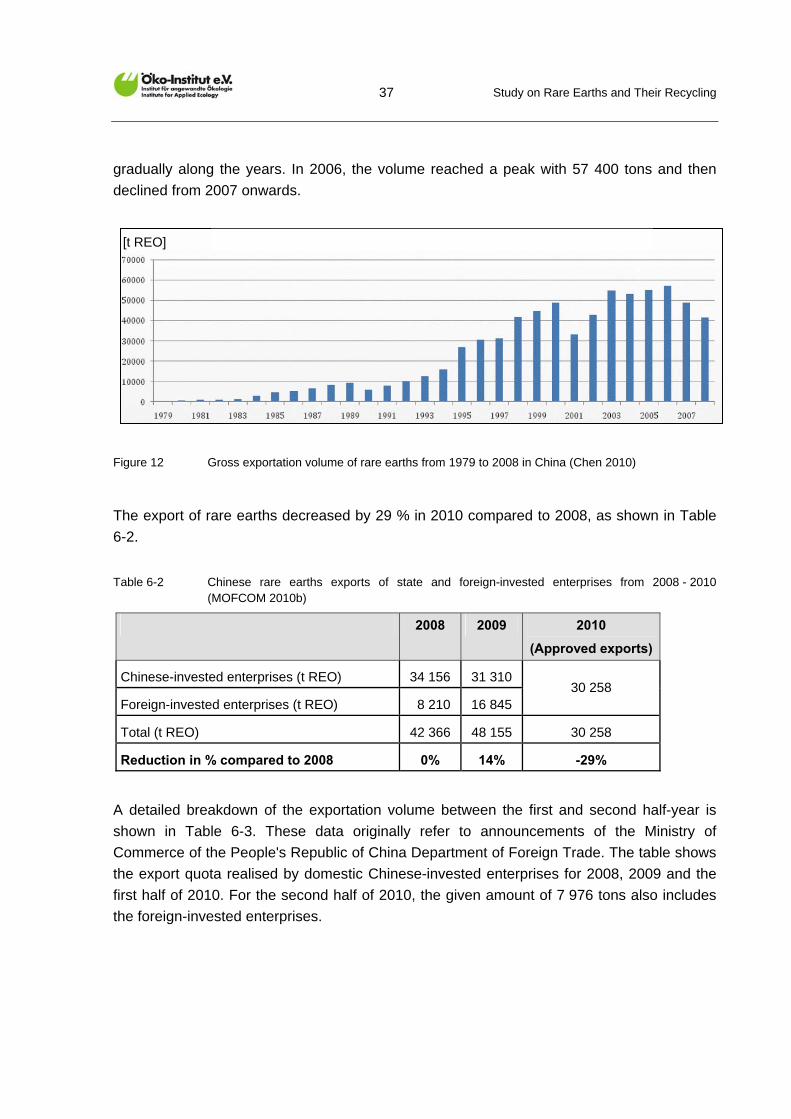
Study on Rare Earths and Their Recycling
37
gradually along the years. In 2006, the volume reached a peak with 57 400 tons and then
declined from 2007 onwards.
[t REO][t REO]
Figure 12 Gross exportation volume of rare earths from 1979 to 2008 in China (Chen 2010)
The export of rare earths decreased by 29 % in 2010 compared to 2008, as shown in Table
6-2.
Table 6-2 Chinese rare earths exports of state and foreign-invested enterprises from 2008 - 2010 (MOFCOM 2010b)
2008 2009 2010
(Approved exports)
Chinese-invested enterprises (t REO) 34 156 31 310
Foreign-invested enterprises (t REO) 8 210 16 845 30 258
Total (t REO) 42 366 48 155 30 258
Reduction in % compared to 2008 0% 14% -29%
A detailed breakdown of the exportation volume between the first and second half-year is
shown in Table 6-3. These data originally refer to announcements of the Ministry of
Commerce of the People's Republic of China Department of Foreign Trade. The table shows
the export quota realised by domestic Chinese-invested enterprises for 2008, 2009 and the
first half of 2010. For the second half of 2010, the given amount of 7 976 tons also includes
the foreign-invested enterprises.
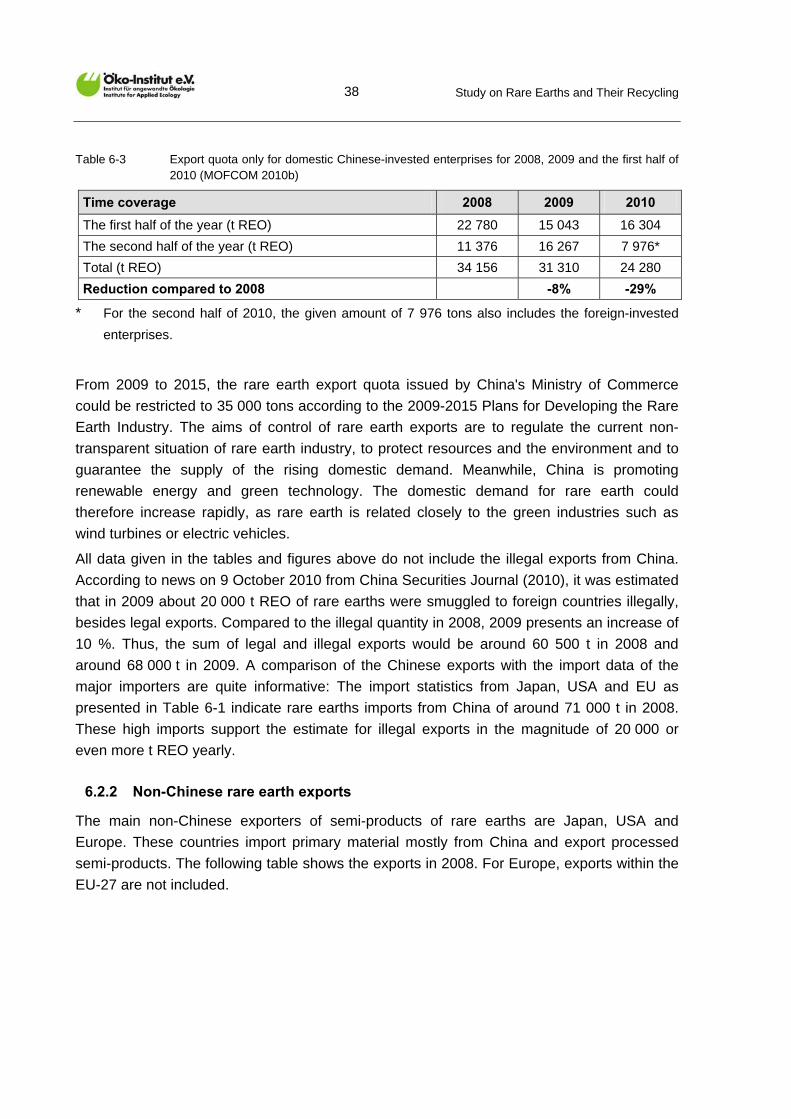
Study on Rare Earths and Their Recycling
38
Table 6-3 Export quota only for domestic Chinese-invested enterprises for 2008, 2009 and the first half of 2010 (MOFCOM 2010b)
Time coverage 2008 2009 2010
The first half of the year (t REO) 22 780 15 043 16 304
The second half of the year (t REO) 11 376 16 267 7 976*
Total (t REO) 34 156 31 310 24 280
Reduction compared to 2008 -8% -29%
* For the second half of 2010, the given amount of 7 976 tons also includes the foreign-invested
enterprises.
From 2009 to 2015, the rare earth export quota issued by China's Ministry of Commerce
could be restricted to 35 000 tons according to the 2009-2015 Plans for Developing the Rare
Earth Industry. The aims of control of rare earth exports are to regulate the current non-
transparent situation of rare earth industry, to protect resources and the environment and to
guarantee the supply of the rising domestic demand. Meanwhile, China is promoting
renewable energy and green technology. The domestic demand for rare earth could
therefore increase rapidly, as rare earth is related closely to the green industries such as
wind turbines or electric vehicles.
All data given in the tables and figures above do not include the illegal exports from China.
According to news on 9 October 2010 from China Securities Journal (2010), it was estimated
that in 2009 about 20 000 t REO of rare earths were smuggled to foreign countries illegally,
besides legal exports. Compared to the illegal quantity in 2008, 2009 presents an increase of
10 %. Thus, the sum of legal and illegal exports would be around 60 500 t in 2008 and
around 68 000 t in 2009. A comparison of the Chinese exports with the import data of the
major importers are quite informative: The import statistics from Japan, USA and EU as
presented in Table 6-1 indicate rare earths imports from China of around 71 000 t in 2008.
These high imports support the estimate for illegal exports in the magnitude of 20 000 or
even more t REO yearly.
6.2.2 Non-Chinese rare earth exports
The main non-Chinese exporters of semi-products of rare earths are Japan, USA and
Europe. These countries import primary material mostly from China and export processed
semi-products. The following table shows the exports in 2008. For Europe, exports within the
EU-27 are not included.
Study on Rare Earths and Their Recycling
39
Table 6-4 Exports of semi-products of rare earths of Japan, USA and Europe in 2008
Exports of rare
earth compounds
in 2008
Data source Compounds included in the statistic
EU 27 4 704 t Eurostat
2010
Metals, intermixtures or interalloys of rare-earths, Sc
and Y
Compounds of rare-earth metals, mixtures of these
metals, Y or Sc
USA 8 253 t USGS 2010c Rare-earth and Y compounds, rare-earth metals,
mixtures of rare-earth chlorides, ferrocerium and
other pyrophoric alloys
Japan 8 997 t Trade
Statistics
Japan 2010
Cerium-, lanthanum- and yttrium oxide, other cerium
compounds, others
The main destination countries for Japanese exports are South Korea (33 %), China (17 %),
Taiwan (15 %), Thailand (14 %) and USA (9 %).
6.3 Development of prices
Figure 13 shows the development of some selected rare earths oxides from 2001 to 2010.
0
10
20
30
40
50
60
70
80
90
Jun01
Jun02
Jun03
Jun04
Jun05
Jun06
Jun07
Jun08
Jun09
Jun10
Pri
ce
($
/kg
)
Nov 10
Nd
Ce La
2001 2002 2003 2004 2005 2006 2007 2008 2009 2010
0
100
200
300
400
500
600
700
800
Jun01
Jun02
Jun03
Jun04
Jun05
Jun06
Jun07
Jun08
Jun09
Jun10
Pri
ce
($
/kg
)
2001 2002 2003 2004 2005 2006 2007 2008 2009 2010
Nov 10
Dy
Tb
Eu
a) Lanthanum, cerium and neodymium oxide b) Europium, dysprosium and terbium oxide
Figure 13 Prices for lanthanum, cerium, neodymium, europium, dysprosium and terbium oxides from 2001-2010
The figure shows the moderate price development up to the end of the decade and the steep
increase due to the increased global demand and the reduction of Chinese exports. The
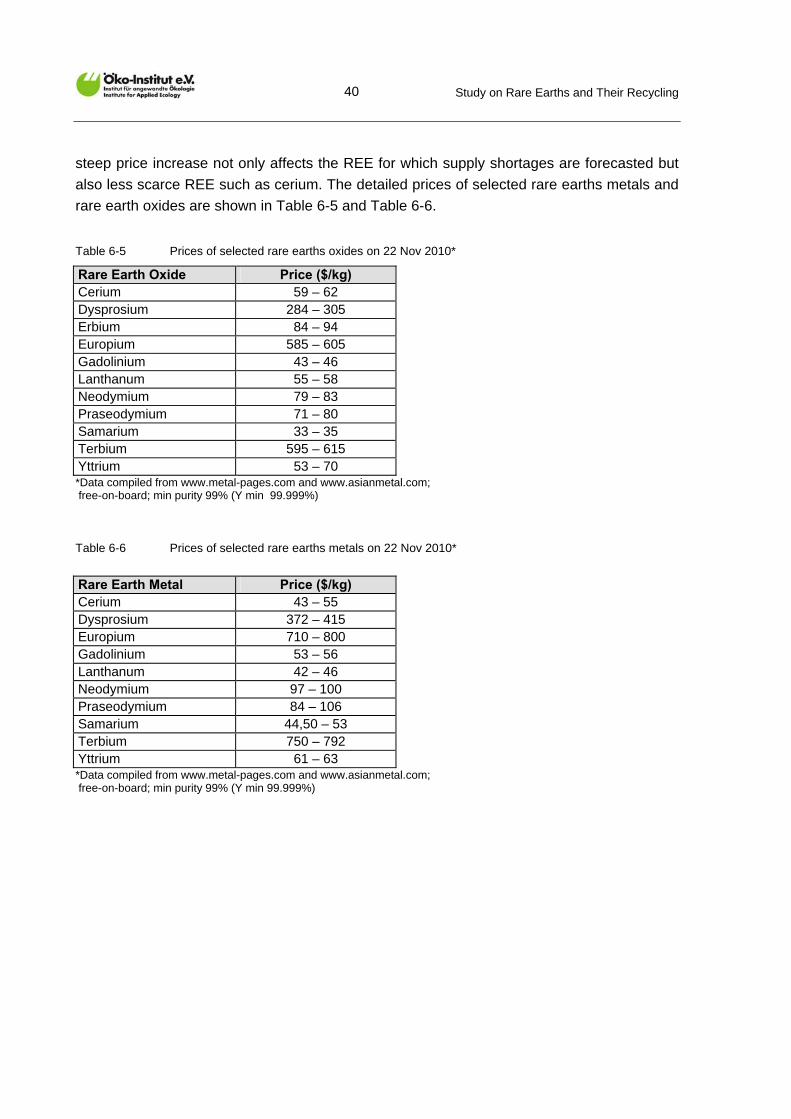
Study on Rare Earths and Their Recycling
40
steep price increase not only affects the REE for which supply shortages are forecasted but
also less scarce REE such as cerium. The detailed prices of selected rare earths metals and
rare earth oxides are shown in Table 6-5 and Table 6-6.
Table 6-5 Prices of selected rare earths oxides on 22 Nov 2010*
Rare Earth Oxide Price ($/kg) Cerium 59 – 62 Dysprosium 284 – 305 Erbium 84 – 94 Europium 585 – 605 Gadolinium 43 – 46 Lanthanum 55 – 58 Neodymium 79 – 83 Praseodymium 71 – 80 Samarium 33 – 35 Terbium 595 – 615 Yttrium 53 – 70 *Data compiled from www.metal-pages.com and www.asianmetal.com; free-on-board; min purity 99% (Y min 99.999%)
Table 6-6 Prices of selected rare earths metals on 22 Nov 2010*
Rare Earth Metal Price ($/kg) Cerium 43 – 55 Dysprosium 372 – 415 Europium 710 – 800 Gadolinium 53 – 56 Lanthanum 42 – 46 Neodymium 97 – 100 Praseodymium 84 – 106 Samarium 44,50 – 53 Terbium 750 – 792 Yttrium 61 – 63 *Data compiled from www.metal-pages.com and www.asianmetal.com; free-on-board; min purity 99% (Y min 99.999%)
Study on Rare Earths and Their Recycling
41
Conclusion on rare earth trade
China is the world leading exporter of rare earths. The exports in 2009 amounted to about
48 000 t REO legal exports plus additional illegal exports of around 20 000 t REO. The major
importers of rare earths compounds were Europe, USA and Japan, importing a total of 78 000
t of rare earths containing compounds in 2008. Of these, more than 90 % were imported from
China.
China reduced the official exports in 2010 by 29 % compared to 2008 (around 30 000 t REO
in 2010) and announced further export restrictions for 2011. This policy and the increasing
demand for rare earths lead to a steep increase in the prices of most rare earth elements.
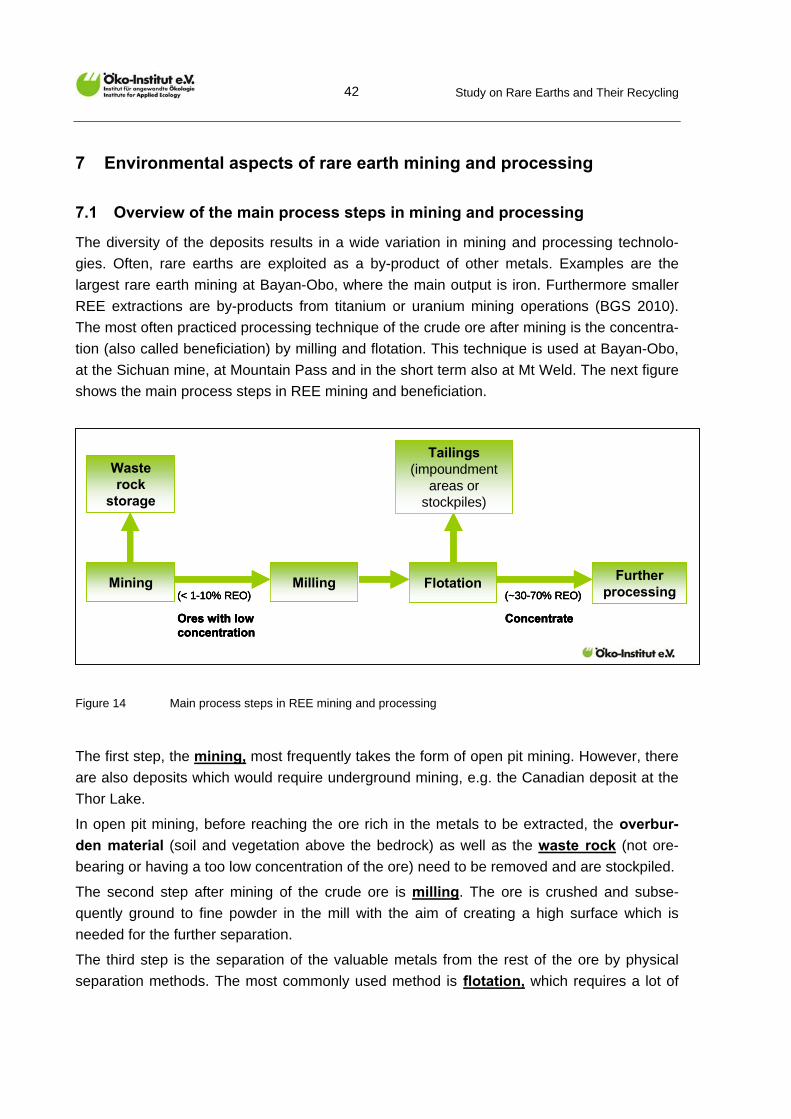
Study on Rare Earths and Their Recycling
42
7 Environmental aspects of rare earth mining and processing
7.1 Overview of the main process steps in mining and processing
The diversity of the deposits results in a wide variation in mining and processing technolo-
gies. Often, rare earths are exploited as a by-product of other metals. Examples are the
largest rare earth mining at Bayan-Obo, where the main output is iron. Furthermore smaller
REE extractions are by-products from titanium or uranium mining operations (BGS 2010).
The most often practiced processing technique of the crude ore after mining is the concentra-
tion (also called beneficiation) by milling and flotation. This technique is used at Bayan-Obo,
at the Sichuan mine, at Mountain Pass and in the short term also at Mt Weld. The next figure
shows the main process steps in REE mining and beneficiation.
Ores with lowconcentration
Waste rock
storage
Milling Flotation(~30-70% REO)
Concentrate
Furtherprocessing
Mining(< 1-10% REO)
Tailings(impoundment
areas orstockpiles)
Ores with lowconcentration
Waste rock
storage
Milling Flotation(~30-70% REO)
Concentrate
Furtherprocessing
Mining(< 1-10% REO)
Tailings(impoundment
areas orstockpiles)
Ores with lowconcentration
Waste rock
storage
Milling Flotation(~30-70% REO)
Concentrate
Furtherprocessing
Mining(< 1-10% REO)
Tailings(impoundment
areas orstockpiles)
Figure 14 Main process steps in REE mining and processing
The first step, the mining, most frequently takes the form of open pit mining. However, there
are also deposits which would require underground mining, e.g. the Canadian deposit at the
Thor Lake.
In open pit mining, before reaching the ore rich in the metals to be extracted, the overbur-
den material (soil and vegetation above the bedrock) as well as the waste rock (not ore-
bearing or having a too low concentration of the ore) need to be removed and are stockpiled.
The second step after mining of the crude ore is milling. The ore is crushed and subse-
quently ground to fine powder in the mill with the aim of creating a high surface which is
needed for the further separation.
The third step is the separation of the valuable metals from the rest of the ore by physical
separation methods. The most commonly used method is flotation, which requires a lot of
Study on Rare Earths and Their Recycling
43
water and chemicals (flotation agents) as well as a high amount of energy (see, for example,
Canino et al. 2005). The input into the flotation is the milled crude ore with usually low
concentrations (grades) of REO (often between 1 and 10 %). The product of the flotation is
an enriched concentrate with a higher REE-percentage (in the range of 30 – 70 %). The
huge waste streams, called tailings, are a mixture of water, process chemicals and finely
ground minerals. Usually, the tailings are led to impoundment areas, which can be either
artificial reservoirs or even natural water bodies (e.g. lakes). They are surrounded by dams.
Finally, the concentrate undergoes further processing. It is transported to a refinery which
can be off-site. There the REE are further extracted and separated into the different elements
as required. This separation of individual REE is particularly difficult due to their chemical
similarity.
An alternative mining technology is the in-situ leaching technology which is used in the
Chinese HREE mining from ion adsorption deposits. It is introduced in Chapter 7.3.5.
7.2 Environmental risks
The next figure gives an overview of potential dangers for the environment if the mining and
processing is carried out without or with insufficient environmental technologies. The red
flashes in the figure symbolise the main risk spots. The size of the flashes is an indicator for
the severity of the risk.
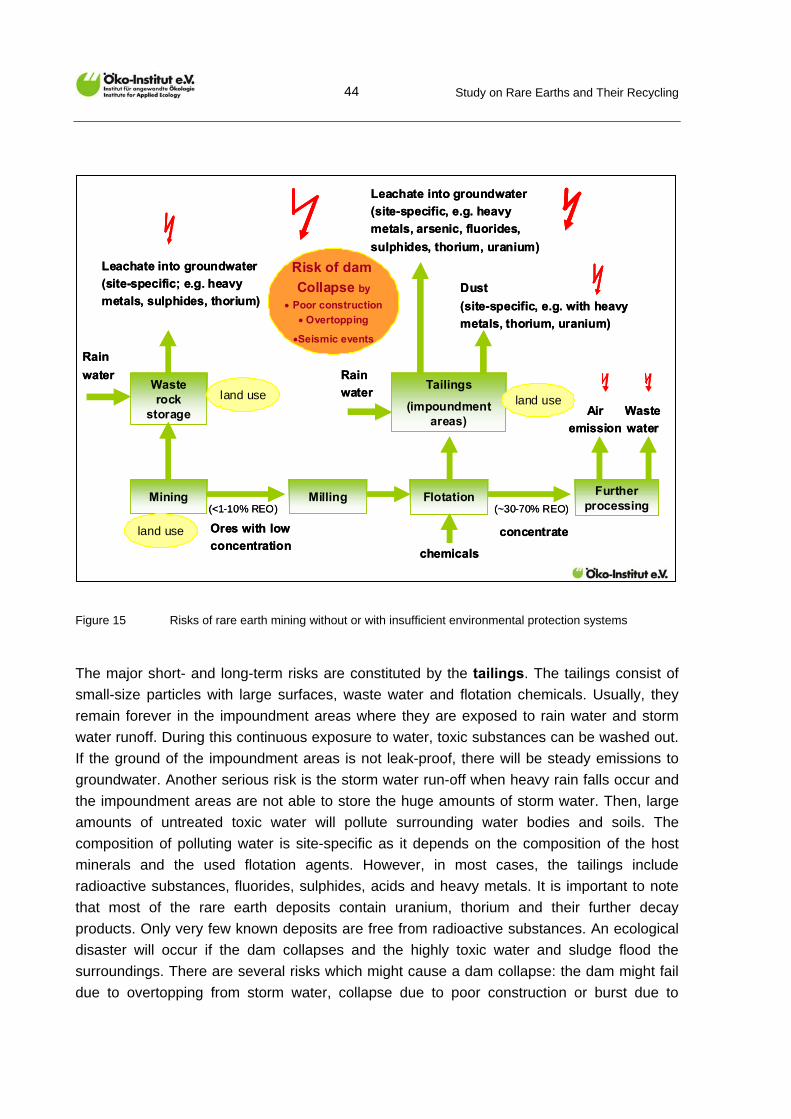
Study on Rare Earths and Their Recycling
44
Leachate into groundwater
(site-specific, e.g. heavy
metals, arsenic, fluorides,
sulphides, thorium, uranium)
Waste
water
Ores with low
concentration
Air
emission
Waste rock
storage
Milling Flotation(~30-70% REO)
concentrate
Furtherprocessing
Mining(<1-10% REO)
land use
Rain
water
land use
Leachate into groundwater
(site-specific; e.g. heavy
metals, sulphides, thorium)
Tailings
(impoundmentareas)
land use
Dust
(site-specific, e.g. with heavy
metals, thorium, uranium)
chemicals
Rain
water
Risk of dam
Collapse by
Poor construction
Overtopping
Seismic events
Leachate into groundwater
(site-specific, e.g. heavy
metals, arsenic, fluorides,
sulphides, thorium, uranium)
Waste
water
Ores with low
concentration
Air
emission
Waste rock
storage
Milling Flotation(~30-70% REO)
concentrate
Furtherprocessing
Mining(<1-10% REO)
land use
Rain
water
land use
Leachate into groundwater
(site-specific; e.g. heavy
metals, sulphides, thorium)
Tailings
(impoundmentareas)
land use
Dust
(site-specific, e.g. with heavy
metals, thorium, uranium)
chemicals
Rain
water
Risk of dam
Collapse by
Poor construction
Overtopping
Seismic events
Figure 15 Risks of rare earth mining without or with insufficient environmental protection systems
The major short- and long-term risks are constituted by the tailings. The tailings consist of
small-size particles with large surfaces, waste water and flotation chemicals. Usually, they
remain forever in the impoundment areas where they are exposed to rain water and storm
water runoff. During this continuous exposure to water, toxic substances can be washed out.
If the ground of the impoundment areas is not leak-proof, there will be steady emissions to
groundwater. Another serious risk is the storm water run-off when heavy rain falls occur and
the impoundment areas are not able to store the huge amounts of storm water. Then, large
amounts of untreated toxic water will pollute surrounding water bodies and soils. The
composition of polluting water is site-specific as it depends on the composition of the host
minerals and the used flotation agents. However, in most cases, the tailings include
radioactive substances, fluorides, sulphides, acids and heavy metals. It is important to note
that most of the rare earth deposits contain uranium, thorium and their further decay
products. Only very few known deposits are free from radioactive substances. An ecological
disaster will occur if the dam collapses and the highly toxic water and sludge flood the
surroundings. There are several risks which might cause a dam collapse: the dam might fail
due to overtopping from storm water, collapse due to poor construction or burst due to
Study on Rare Earths and Their Recycling
45
seismic events. These risks require a long-term monitoring as the dams must not only remain
stable during the mining operation, but also keep intact over decades and centuries after the
closure of the mine.
A similar risk is given by the waste rock stockpiles. They are also exposed to rain water,
and toxic substances such as radioactive substances, fluorides, sulphides, acids and heavy
metals will be washed out and spread into water bodies and soil, if no water management
and water treatment is installed. In most cases, the potential release is lower than in the
tailings, as the rock consists of coarse minerals whereas the tailings consist of finely milled
particles.
Another environmental risk is the open pit itself, particularly after the closure of the mine. It
will be exposed to rain water, which will wash out toxic and radioactive substances as
described above for the waste rock stockpiles.
Besides the manifold risks due to toxic and radioactive water emissions, the mining and
processing also causes serious air emissions if no adequate measures are taken. A main
risk factor for the workers and the neighbourhood are wind-blown dust particles containing
thorium or other radioactive substance. Further toxic substances in the dust might be heavy
metals. The dusts arise from different sources: the mine and the mining operations, the
milling, the transportation and storages as well as from the wind-blown dust particles from
the waste rock stockpiles or the tailings. The two last-mentioned sources are a long-term risk
if no adequate post-operative treatment will be implemented after the closure of the mine.
Further environmental harm is connected to the land-use. It covers the mine, the storage of
the waste rocks, the tailings, the whole infrastructure and the surrounding areas, which are
affected by pollution during the mining operation as well as after the mine closure. Another
environmental burden is the large water consumption, particularly if the mining is carried
out in dry areas.
The further refining of the rare earth concentrate is a very energy-intensive process and
causes serious air emissions (e.g. SO2, HCl, dust, radioactive substances) if no abatement
technologies are installed. Depending on the used energy carriers, high CO2-emissions will
arise and contribute to climate change.
Furthermore, radioactive waste arises in most cases, as the majority of the rare earths
deposits also contain thorium and/or uranium. The radionuclides are partly separated in the
flotation and partly remain in the tailings. The other part enters the further processing with the
concentrate and is subsequently separated. A safe disposal is required in all cases.
Table 7-1 summarises the major environmental risks:
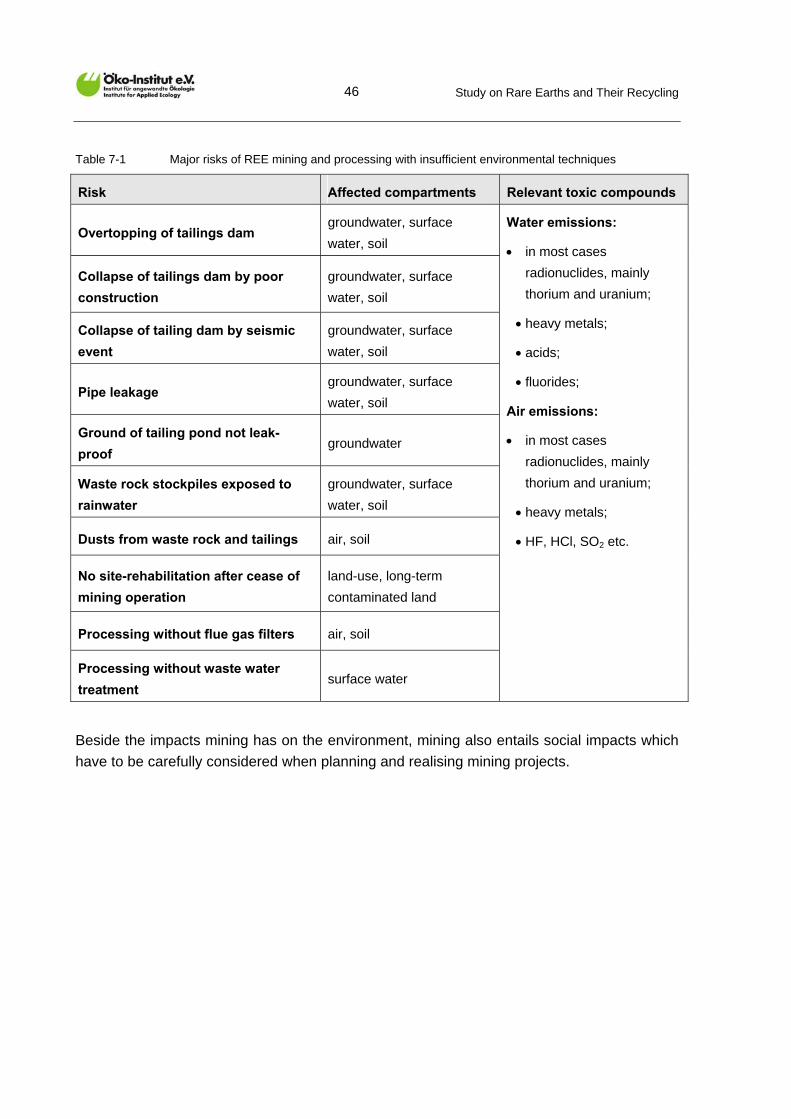
Study on Rare Earths and Their Recycling
46
Table 7-1 Major risks of REE mining and processing with insufficient environmental techniques
Risk Affected compartments Relevant toxic compounds
Overtopping of tailings dam groundwater, surface
water, soil
Collapse of tailings dam by poor
construction
groundwater, surface
water, soil
Collapse of tailing dam by seismic
event
groundwater, surface
water, soil
Pipe leakage groundwater, surface
water, soil
Ground of tailing pond not leak-
proof groundwater
Waste rock stockpiles exposed to
rainwater
groundwater, surface
water, soil
Dusts from waste rock and tailings air, soil
No site-rehabilitation after cease of
mining operation
land-use, long-term
contaminated land
Processing without flue gas filters air, soil
Processing without waste water
treatment surface water
Water emissions:
in most cases
radionuclides, mainly
thorium and uranium;
heavy metals;
acids;
fluorides;
Air emissions:
in most cases
radionuclides, mainly
thorium and uranium;
heavy metals;
HF, HCl, SO2 etc.
Beside the impacts mining has on the environment, mining also entails social impacts which
have to be carefully considered when planning and realising mining projects.
Study on Rare Earths and Their Recycling
47
7.3 Environmental aspects of mining and processing in China
7.3.1 Overview
China currently operates several large mines and a large number of small – partly illegal –
mines, the environmental problems of which are briefly described below in order to give a
quick overview. Further environmental aspects are given in the following chapters.
The Bayan-Obo Mine in Inner Mongolia is the largest rare earth mine in the world. The
main product is iron ore, light rare earths are a side product. The surface mining extracts
a bastnaesite-monazite-mix containing LREE and also thorium. There are severe
environmental problems and health hazards in mining, concentration and further
processing. Another large open-pit mine for LREE based on bastnaesite is the Sichuan
mine. Here, the bastnaesite also contains thorium (MEP 2009).
Heavy rare earths are mined from ion adsorption deposits in southern China. They
belong to the few known deposits without radioactive accompanying elements.
Nevertheless, there are serious environmental problems. The mining is carried out with
in-situ leaching, a technique which requires no surface and no underground mining
(Cheng & Che 2010). Holes are hereby drilled into the ore deposit. Then, the leaching
solution is pumped into the deposit where it makes contact with the ore. The solution
bearing the dissolved ore content is then pumped to the surface and processed. The
Chinese government regards the in-situ leaching technology as more environmentally
sound than other leaching technologies such as pond and heap leaching (MIIT 2010).
However it should be noted that this leaching procedure is also problematic because it is
not controllable hydro-geologically.
There are numerous small illegal mines in China. There are estimations that around
20 000 t REO were illegally mined and smuggled outside of China. Probably, most of
these mines have no environmental technologies at all, and there are reports of serious
environmental damages and health hazards in their surroundings (Bork 2010, Zajec
2010).
In the course of the extracting, separating and refining processes, a large number of
chemical materials are applied, leading to a huge amount of waste gas, waste water and
solid waste. Most facilities do not have sufficient treatment systems. Some small rare
earth smelting separation facilities even do not have any system for environmental
protection at all (Chen 2010).
The Chinese government is aware of these challenges and is willing to raise the environ-
mental standards. Details on the mines, the processing and the Chinese environmental
policy are presented in the next chapters.
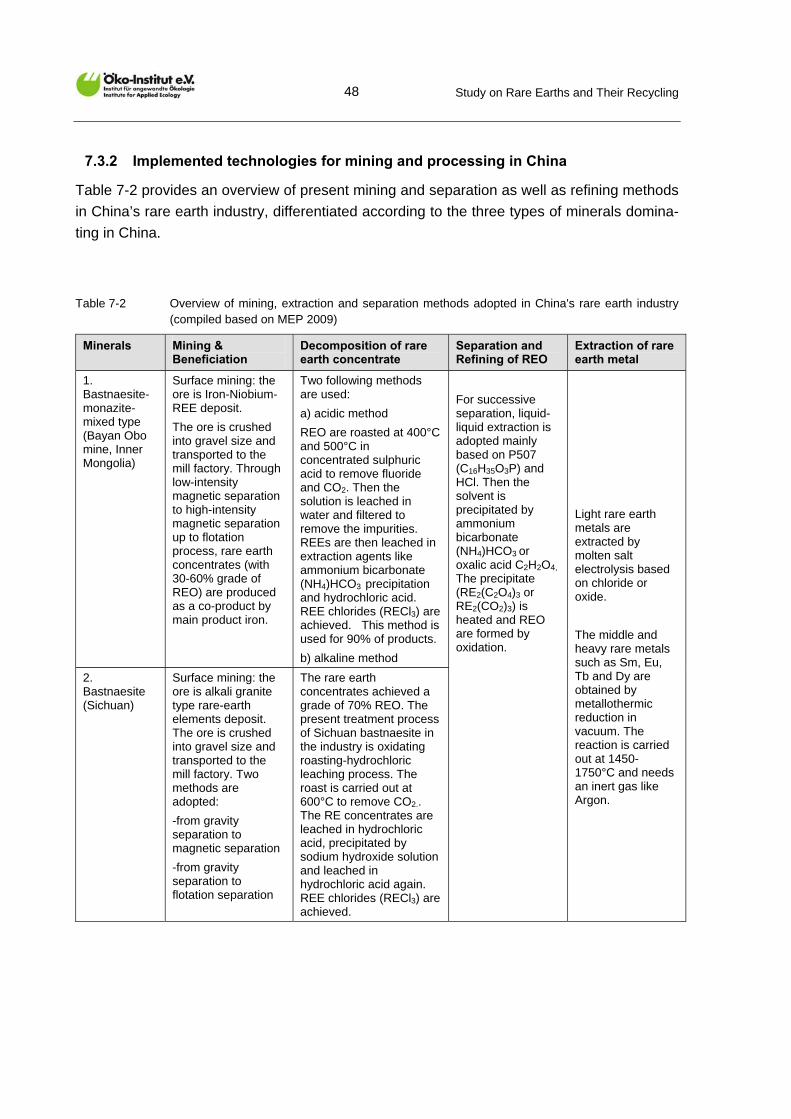
Study on Rare Earths and Their Recycling
48
7.3.2 Implemented technologies for mining and processing in China
Table 7-2 provides an overview of present mining and separation as well as refining methods
in China’s rare earth industry, differentiated according to the three types of minerals domina-
ting in China.
Table 7-2 Overview of mining, extraction and separation methods adopted in China's rare earth industry (compiled based on MEP 2009)
Minerals Mining & Beneficiation
Decomposition of rare earth concentrate
Separation and Refining of REO
Extraction of rare earth metal
1. Bastnaesite-monazite-mixed type (Bayan Obo mine, Inner Mongolia)
Surface mining: the ore is Iron-Niobium-REE deposit.
The ore is crushed into gravel size and transported to the mill factory. Through low-intensity magnetic separation to high-intensity magnetic separation up to flotation process, rare earth concentrates (with 30-60% grade of REO) are produced as a co-product by main product iron.
Two following methods are used:
a) acidic method
REO are roasted at 400°C and 500°C in concentrated sulphuric acid to remove fluoride and CO2. Then the solution is leached in water and filtered to remove the impurities. REEs are then leached in extraction agents like ammonium bicarbonate (NH4)HCO3 precipitation and hydrochloric acid. REE chlorides (RECl3) are achieved. This method is used for 90% of products.
b) alkaline method
2. Bastnaesite (Sichuan)
Surface mining: the ore is alkali granite type rare-earth elements deposit. The ore is crushed into gravel size and transported to the mill factory. Two methods are adopted:
-from gravity separation to magnetic separation
-from gravity separation to flotation separation
The rare earth concentrates achieved a grade of 70% REO. The present treatment process of Sichuan bastnaesite in the industry is oxidating roasting-hydrochloric leaching process. The roast is carried out at 600°C to remove CO2.. The RE concentrates are leached in hydrochloric acid, precipitated by sodium hydroxide solution and leached in hydrochloric acid again. REE chlorides (RECl3) are achieved.
For successive separation, liquid-liquid extraction is adopted mainly based on P507 (C16H35O3P) and HCl. Then the solvent is precipitated by ammonium bicarbonate (NH4)HCO3 or oxalic acid C2H2O4,
The precipitate (RE2(C2O4)3 or RE2(CO2)3) is heated and REO are formed by oxidation.
Light rare earth metals are extracted by molten salt electrolysis based on chloride or oxide.
The middle and heavy rare metals such as Sm, Eu, Tb and Dy are obtained by metallothermic reduction in vacuum. The reaction is carried out at 1450-1750°C and needs an inert gas like Argon.
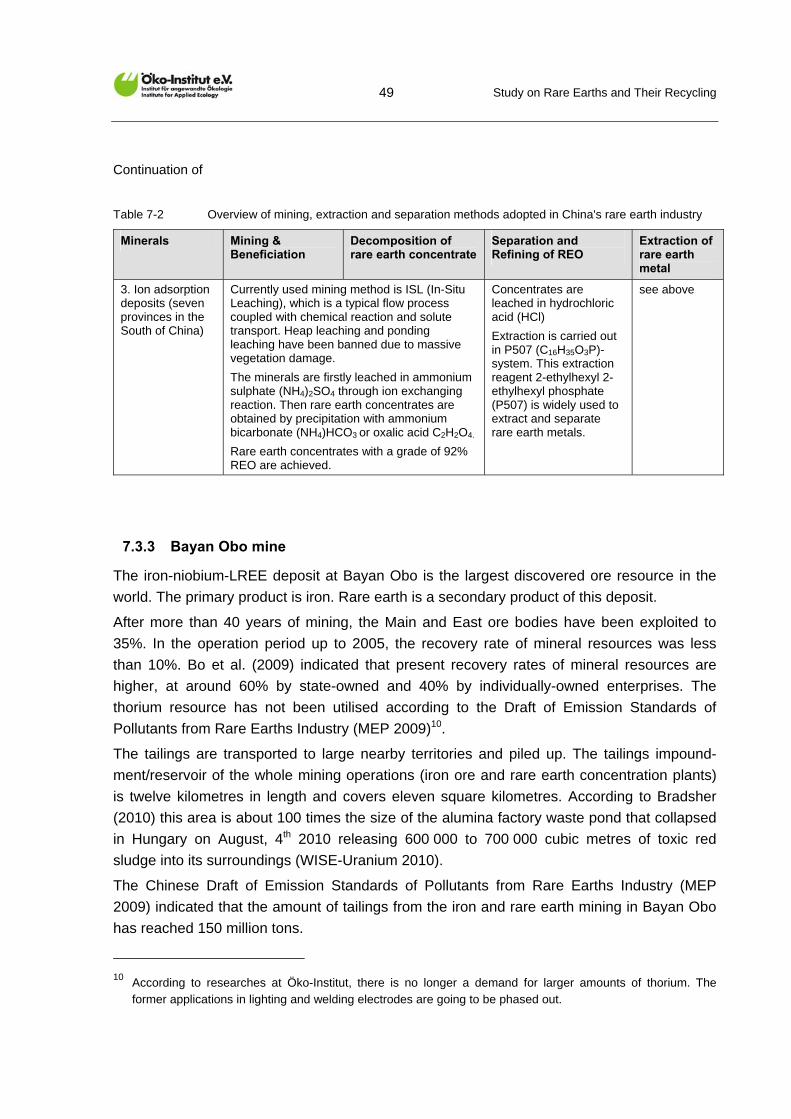
Study on Rare Earths and Their Recycling
49
Continuation of
Table 7-2 Overview of mining, extraction and separation methods adopted in China's rare earth industry
Minerals Mining & Beneficiation
Decomposition of rare earth concentrate
Separation and Refining of REO
Extraction of rare earth metal
3. Ion adsorption deposits (seven provinces in the South of China)
Currently used mining method is ISL (In-Situ Leaching), which is a typical flow process coupled with chemical reaction and solute transport. Heap leaching and ponding leaching have been banned due to massive vegetation damage.
The minerals are firstly leached in ammonium sulphate (NH4)2SO4 through ion exchanging reaction. Then rare earth concentrates are obtained by precipitation with ammonium bicarbonate (NH4)HCO3 or oxalic acid C2H2O4.
Rare earth concentrates with a grade of 92% REO are achieved.
Concentrates are leached in hydrochloric acid (HCl)
Extraction is carried out in P507 (C16H35O3P)-system. This extraction reagent 2-ethylhexyl 2-ethylhexyl phosphate (P507) is widely used to extract and separate rare earth metals.
see above
7.3.3 Bayan Obo mine
The iron-niobium-LREE deposit at Bayan Obo is the largest discovered ore resource in the
world. The primary product is iron. Rare earth is a secondary product of this deposit.
After more than 40 years of mining, the Main and East ore bodies have been exploited to
35%. In the operation period up to 2005, the recovery rate of mineral resources was less
than 10%. Bo et al. (2009) indicated that present recovery rates of mineral resources are
higher, at around 60% by state-owned and 40% by individually-owned enterprises. The
thorium resource has not been utilised according to the Draft of Emission Standards of
Pollutants from Rare Earths Industry (MEP 2009)10.
The tailings are transported to large nearby territories and piled up. The tailings impound-
ment/reservoir of the whole mining operations (iron ore and rare earth concentration plants)
is twelve kilometres in length and covers eleven square kilometres. According to Bradsher
(2010) this area is about 100 times the size of the alumina factory waste pond that collapsed
in Hungary on August, 4th 2010 releasing 600 000 to 700 000 cubic metres of toxic red
sludge into its surroundings (WISE-Uranium 2010).
The Chinese Draft of Emission Standards of Pollutants from Rare Earths Industry (MEP
2009) indicated that the amount of tailings from the iron and rare earth mining in Bayan Obo
has reached 150 million tons.
10 According to researches at Öko-Institut, there is no longer a demand for larger amounts of thorium. The
former applications in lighting and welding electrodes are going to be phased out.
Study on Rare Earths and Their Recycling
50
The radioactive element thorium (Th) is contained in tailings and residues. The measuring
results presented by the Baotou Radiation & Environmental Management Institute in Novem-
ber 1998 showed that the average Th content is 0.0135% and the gamma-radiation dose
rate of East, South, West and North ore bodies of Bayan Obo is 60.6-958.6 nGy/h, 54.5-546
nGy/h, 60.3-611.3 nGy/h and 49.7-599nGy/h, respectively, thus considerably exceeding the
normal environmental conditions. It turned out that the environment was contaminated. The
sample analysis of plants on 232Th, 238U, 226Ra, 40K showed that the specific radioactivity in
plant tests is a factor of 32 and in soil tests a factor of 1.7 higher than that of references. This
provides evidence that plants and soil at Baotou region have been contaminated (MEP
2009).
The Explanation of Compiling of Emission Standards of Pollutants (MEP 2009) also stated
that Th-containing dust is emitted in a range of 61.8 t per year during the crushing process.
Considering the human health aspect, the Healthcare Research Centre has proved in a
twenty-year follow-up study on health effects following long-term exposure to thorium dusts
that the mortality rate of lung cancer has significantly increased for the workers in Baotou
(Chen et al. 2004).
Furthermore, Buckley (2010) reports on groundwater pollution from the tailing pond which
affects the wells of the nearby villages, the livestock and the agriculture and causes serious
damage to the health of the inhabitants.
Processing 100 thousand tons of rare earth concentrates per year during the extraction
phase, approximately 200 tons of ThO2 contained in sludge are left over. Using the sulphuric
acid-roasting method during the production of one ton of rare earth concentrate, between
9600-12000 m3 of waste gas containing fluoride, SO2, SO3 and dust may be emitted.
Furthermore, 75 m3 of acid-washing waste water and one ton of radioactive residues are
generated per ton (MEP 2009)
7.3.4 Sichuan mine
The recovery rate of the mining and the concentration plant of the Sichuan mine has been
less than 50% (Cheng & Che 2010).
Oxidising roasting-hydrochloric acid leaching method is currently mainly adopted in the treat-
ment process of Sichuan bastnaesite in the rare earth industry. The problem associated with
this method is that the purity of the cerium produced is low. Furthermore, fluorine and
thorium are dispersed into waste residues and waste water.
7.3.5 Ion adsorption deposits
The scarce HREE from ion adsorption deposits in the south of China has at present an
average recovery rate of 75% by applying the in-situ leaching method. Between 1970 and
1999 the recovery rate was only about 26% by using the ponding leaching method (Cheng &
Che 2010).
Study on Rare Earths and Their Recycling
51
7.3.6 Waste water from REE separation and refining
Since saponification with ammonia is still used for rare earth refining, a large number of
waste water is produced. To separate one ton of rare earth concentrate with a REE content
of 92% REO, 1 – 1.2 tons of ammonium bicarbonate are needed (MEP 2009) .
Overall, it is estimated that within the whole rare earth refining industry approximately 20 000
– 25 000 thousand t of waste water are generated per year, based on the production data of
103 900 t REO in 2005. The NH3/NH4+-content of waste water ranges roughly between 300
and 5000 mg/litre. That factor exceeds the limit set by the government by more than ten to
even 200 times (MEP 2009).
7.3.7 Chinese environmental policy
In the past, few environmental concerns were taken into account during mining and proces-
sing, and an efficient use of resources was not taken into consideration. Altogether, with the
increasing importance of rare earths in applications, China has realised the current problems
in the rare earth industry and the urgent need for an efficient use of resources and better
management practices. China also identified a lack of regulation. In order to protect its rare
earth resources and to develop them in a sustainable way, China started a comprehensive
series of regulations and standards. New policy statutes were made and promulgated
including a Mid- and Long-Term Development Plan for the Rare-Earth Industry and the Rare-
Earth Industrial Development Policy. The environmental aspects are described in the
subsequent chapters. Further issues such as the intended structure of companies including
the closure of small mines and processing facilities are presented in Chapter 5.1.2.
7.3.7.1 Entry criteria for rare earth industry
In May 2010, the Ministry of Industry and Information Technology of China issued the notice
on the consultative draft of “Entry Criterions for Rare Earth Industry” (MIIT 2010). This
regulation clearly stipulates thresholds and requirements in terms of environment protection
to assist the rare earth industry in sustainable development. It also foresees a restructuring
of the rare earths industry. The major environmental aspects are:
Mining of pure monazite minerals is banned due to the high-level radioactive elements
and the resulting environmental damage.
As for the operation and technological equipment, the facilities for the processing of
bastnaesite and mixed minerals are obliged to install a complete treatment system for
waste water, waste gas, and solid waste.
Regarding ion adsorption deposits, ponding and heap leaching was banned due to
massive environmental damage. Instead, the ISL- (In-Situ Leaching-) method shall be
applied.
Study on Rare Earths and Their Recycling
52
Saponification with ammonia is banned from rare earth refining.
Elementary metal refining should not adopt the process of electrolysing metals by their
chlorides.
With respect to the electrolysis system when using molten salt fluoride, facilities should
be equipped with a treatment system capable of dealing with fluorine-containing waste
water and waste gas.
Fluor-containing solid waste should be disposed separately and must not be mixed with
other industry residues.
Requirements for an efficient electricity supply and specifications concerning the
maximum energy demand per ton of rare earths produced are also indicated.
Regarding the resource aspects, it is also required that the mining-loss rate for mixed
rare earth minerals and bastnaesite should not be more than 10 %, while the ore
dressing recovery rate of these ores should be not less than 72 %.
The ore dressing recovery rate of ion adsorption deposits should not be less than 70 %.
The recycling rate of ore dressing waste water of mixed rare earth minerals and
bastnaesite should be not less than 85 %, while that of ion adsorption deposits should
not drop below 90 %.
The rehabilitation of plants and vegetation after mining of ion adsorption deposits should
include at least 90 % of the affected area.
The yield of refined rare earth metal should be more than 92 %.
7.3.7.2 The 2009-2015 plans for developing the rare earth industry
This development plan is a mandatory planning compiled by the Ministry of Industry and
Information Technology of China (MIIT 2009). The major aim of the plan is to simplify
management of China’s rare earth resources by “designating large districts.” The
environmental aspects included in this plan are:
For the years from 2009 to 2015, China will not be issuing any new mining licences of
rare earths. During this period, the existing rare earth enterprises should put emphasis
on improving the level of technical equipment, environmental protection and manage-
ment capability.
The plan has clearly specified the shutdown of a number of small and illegal enterprises
as well as inefficient separating and smelting enterprises in order to gain more control.
As for the monitoring aspect, the Ministry of Industry and Information Technology will
oversee the industry by creating an examination and inspection system for rare earth
extraction to guarantee that national directive plans are being implemented and execu-
ted.
Study on Rare Earths and Their Recycling
53
7.3.7.3 Emission standards of pollutants from rare earths industry
The revision of Emission Standards of Pollutants from Rare Earths Industry was finalised by
the Ministry of Environmental Protection of China in July 2010. It is estimated that this
regulation will be effective soon. This standard sets specific thresholds (differentiated
between existing enterprises and newly-established enterprises) for the amount of pollutants
including waste water, waste gas and radioactive elements, especially thorium. In comparing
these thresholds to those set in some industry countries, the Explanation of Compiling
“Emission Standards of Pollutants from Rare Earths Industry 2009” found that certain
thresholds in these emission standards were even more stringent than those in industrial
nations.
7.3.8 Chinese research activities on clean production of rare earths
China actively endeavours to encourage and promote the national clean production towards
a sustainable economic and social growth and development. This was reflected at the 6th
International Conference on Rare Earth Development and Application in Beijing where
Chinese experts presented many survey papers on clean-tech/green-tech applications (Lifton
2010b). Additionally, certain papers from the 2nd Academic Meeting on Rare Earths for Junior
Scholars held by the Chinese Society of Rare Earths in 2008 analysed green or clean
production of rare earth, besides investigating physical and chemical characteristics of rare
earths in technical application. A website on patent information showed that 29 patents on
the recovery of rare earths were taken out (Patent information 2010). The next paragraphs
shortly summarise selected research projects:
Che (2008) revealed in her study that the tailings from Bayan Obo lead to environ-
mental damage and human toxicity. Furthermore, it means a waste of resources. Che
(2008) discussed a clean dressing process, in which tailings are comprehensively
utilised and which is “emission-free”.
The University of Science & Technology Beijing obtained a patent in 2009 for achieving
full recycling and clean production in the rare earth leaching process by applying
the sulphate roasting method (University of Science & Technology Beijing 2009). The
green production technology realises direct transformation from sulphate to carbonate by
using the transformation technology of double decomposition reaction in chemical
processes according to the principle of mutual transformation between solid substances
with different solubility products. Non-rare-earth-compounds (such as ammonium
sulphate and ammonium carbonate) and the like are fully recovered at low costs.
Simultaneously, waste water can be fully recycled and reused.
Study on Rare Earths and Their Recycling
54
The scandium extraction grade from Bayan Obo deposit is relatively low. Cheng (2008)
showed that the extraction rate of Sc3+ could reach 98 % by using liquid membrane
emulsion technology.
The present treatment of Sichuan bastnaesite in the rare earth industry is the oxidising
roasting-hydrochloric acid leaching process. Luo et al. (2008) indicated that this method
leads to pollution resulting from fluorine and thorium and generates cerium of low purity.
Luo et al. (2008) demonstrated in their study that the oxidising roasting-sulphuric acid
leaching-extraction process is a promising alternative green process, since it can
not only produce high purity cerium, but also effectively realises the separation of
fluorine and thorium. The results of their study indicated that stripping thorium from
HEHEHP (2-ethylhexyl 2-ethylhexyl phosphate) is more efficient than stripping it from
other phosphoric extraction agents. A thorium recovery of a maximum of 70 % could be
obtained by a single stage stripping.
In 2005, Grirem Advanced Materials Co., Ltd. developed an environmentally friendly
hydrometallurgical separation processes. A non-saponification solvent extraction
process based on hydrochloric acid and sulphuric acid was developed to separate
neodymium and samarium. This method eliminates the generation of ammonia
nitrogen waste water. The consumption of other extraction agents is decreased by 20 %
due to a reduced number of processes which also imply greatly reduced costs
(MEP 2009).
The Beijing General Research Institute for Nonferrous Metals took out a patent in 2008
relating to a technological method for extracting and separating quadrivalent cerium,
thorium and fluorine, as well as to a small extent trivalent cerium from rare-earth-
sulphate solution. The synergistic extraction agents are based on P507 (2-ethylhexyl 2-
ethylhexyl phosphate) or P204 (Di(2-ethylhexyl)phosphoric acid). Cerium, thorium,
fluorine and iron are extracted into an organic phase. Then selective washing and back
extraction are performed step by step. The advantages of this method are that the
separation ratio of thorium is high, no emulsion is generated during the extraction
process and all elements are extracted and separated in the same extraction system.
With regard to the environment, since no ammonia saponification agent is adopted, there
is no ammonia-nitrogen containing waste water, and fluorine and thorium are recovered
(Beijing Nonfer-rous Metal 2008).
Liu et al. (2008) studied green synthesis techniques of highly purified dysprosium iodide
(DyI3) for HID (High Intensity Discharge) lamps. The traditional synthesising method
uses mercury iodide and dysprosium in a chemical reaction which pollutes the
environment due to the poisonous mercury. A green synthesis was therefore investiga-
ted through a direct reaction between dysprosium and iodine in terms of reaction
conditions. The results showed that anhydrous dysprosium iodide was synthesised with
a purity of 99.95 % and a product yield of 88 %.
Study on Rare Earths and Their Recycling
55
In 2009, XIAN Technological University invented a method for an improved separation of
heavy rare earth metals with an optimised membrane technology (XIAN Technological
University 2009).
7.4 Environmental aspects of mining and processing outside of China
7.4.1 General outlook
The expected supply shortage of some REE has created manifold activities for the opening
of new mines outside of China. Due to the tough timelines and the economic pressure, the
incentive is quite high to implement new mining and processing facilities without considering
the ecological impacts. Therefore, environmental aspects should be monitored attentively by
the authorities and the public.
The following Chapters 7.4.2 and 7.4.3 provide an overview of two mining and processing
projects which will probably start operation in 2011 and 2012: the Mountain Pass project in
California (USA) and the Mt Weld project in the desert of Western Australia with further
processing in Malaysia. These two projects passed national approval procedures, and it is to
be assumed that major environmental aspects will be taken into account. However, the
operation practice will not only depend on the installed technologies but also on the proper
management and monitoring by the operating companies and the authorities.
The opening of new mines is discussed and exploration activities are carried out (drilling,
laboratory tests and feasibility studies) on various other sites. One example is the Kvanefjeld
deposit in Greenland which is presented in Chapter 7.4.4. Further countries where
exploration activities are taking place are Canada, South Africa, Malawi, India and Vietnam,
Kirghizia and Kazakhstan. There is some concern that some of these projects might be
realised without sufficient environmental protection technologies.
In the past, xenotime from Malaysian placer deposits with very high contents of uranium
(2 %) and thorium (0.7 %) was processed in Malaysia. Due to this high radioactivity level, the
Malaysian processing industry failed and the plants were closed (Meor Yusoff and Latifah
2002, cited in BGS 2010). High levels of radioactivity also appear in monazite. Fortunately,
the processing of beach sands containing monazite has been banned in Australia, China and
Europe due to environmental concerns (Curtis 2009, cited in BGS 2010). However, nearly all
deposits which are currently under exploration also have some more or less high contents of
uranium and thorium and their decay products. The two outstanding exceptions are the ion-
adsorption clay deposits in southern China as well as the Douglas River deposit in
Saskatchewan, Canada (Kanasawa & Kamitani 2006, GWMG 2010a).
Against the background of the severe problems of accompanying radioactivity in mining,
Kanazawa and Kamitani (2006) suggest that countries should examine geological structures
similar to the ion-adsorption clay deposits in China in order to discover other radioactivity-free
Study on Rare Earths and Their Recycling
56
sources. Otherwise R&D for mineral separation, smelting and recovery should be promoted,
including disposal of radioactive wastes.
The presence of thorium and/or uranium in the rare earth ores is not only of importance for
mining and concentration but also for refining and further processing. In all process steps,
radioactive wastes arise and have to be handled cautiously. An example for the arising of
radioactive waste is the French company Rhodia Electronics and Catalysts which processes
rare earths. This waste was classified and handled according the French law (ANDRA 2009).
Furthermore, the refining of the rare earth concentrate is a very energy-intensive process,
causes air and water emissions and contributes to the global climate change.
7.4.2 Mountain Pass, California, USA
Due to environmental concerns as well as competition from lower-cost Chinese sources of
rare earths beginning in the mid-1980s, production at the only mine of the United States at
the Mountain Pass in California was stopped in 2002. Currently, the site is held by Molycorp
Minerals, which is currently only generating revenue from products manufactured from its
relatively small stockpile of rare earths. Molycorp Minerals plans the re-opening of the rare
earths mining from 2012 to 2042 with an annual production of approximately 20 000 t. The
average grade of the Mountain Pass ore is 8.2 % (using a cut-off grade of 5 %). The
concentrate shall contain 68 % rare earths. The recovery rate shall be around 90 %
according to Molycorp (2010a).
The planned re-opening required an extensive approval procedure which resulted in an
approval in 2004. Smaller plant modifications and improvements are subject to a further
permit procedure.
Due to the extensive public approval procedure, it is to be expected that the plant operation
will run on an environmentally advanced standard, which will significantly reduce the
environmental damage compared to old outdated techniques, if the management of the
monitoring is carried out responsibly by the authorities and the operator.
The documents concerning the approval procedure are publicly available (Molycorp 2010c).
According to Molycorp Minerals (Molycorp 2010a, 2010b) the major issues in terms of the
environment are as follows:
The ore at Mountain Pass contains 0.02 % thorium and 0.002 % uranium by weight, as
uranium and thorium occur in the bastnaesite mineral. Therefore, radionuclides will be
part of the tailings and the concentrate. For the permission of the new plant operation,
Molycorp received a broad scope licence, which allows facility personnel to conduct the
day-to-day management of radioactive materials under the oversight of a Radiation
Safety Officer and a Radiation Safety Committee.
Molycorp plans the installation of a salt recovery (recovery of hydrochloric acid, sodium
hydroxide, sodium hypochlorite) and water recycling facilities in order to reduce the
Study on Rare Earths and Their Recycling
57
water consumption. The aim is to reduce the fresh water consumption of the mid-1990s
(when the mine had an output of 20 000 t REO per year) by approximately 90 %.
The waste water generated from the mineral recovery operations as well as waste water
from the treatment of pit water and ground water remediation systems would be evapo-
rated in a series of on-site ponds.
A groundwater remediation system will be operated.
The open pit water will be pumped, treated and re-used. The facility is constructed with a
series of storm water diversion ditches and settling ponds, along with a series of check
dams and silt fencing to minimise erosion.
The hazardous waste (mainly containing lead) shall be disposed of on exterior landfills
for hazardous wastes.
Flue gas treatment plants will be installed in order to reduce air emissions.
The remediation of the area after mine closure was also part of the approval in 2004.
7.4.3 Mount Weld, Australia and processing in Malaysia
Lynas started mining (open pit) and the installation of a concentration plant at Mt Weld
deposit in 2007. In 2008, about 800 000 t of ore with an average grade of 15 % REO were
mined and stored. The concentration plant is supposed to start operation in 2011 and to
produce a concentrate of around 40 %. Mining is planned for a period of eleven years
whereas the concentration plant shall operate for 18 years. The production of REO-
concentrate at Mt Weld shall start with 11 000 t REO per year and increase up to 20 000 t
REO per year [Lynas 2010a]. The recovery rate will be around 63 %. The cut-off grade is set
to 2.5 % [Lynas 2009]. Further processing will be carried out at the Lynas Advanced
Materials Plant in Malaysia.
The Environmental Protection Authority of The Government of Western Australia provided
the Ministerial Approval Statement to the Mining & Beneficiation Project at Mt Weld in 2006
(EPA 2006). In 2008, the Department of Environment and Conservation granted the works
approval (DEC 2008). The documents include some information on the operating conditions.
The main issues are listed below:
The premises are located approximately 35 km from the next housing area and 20 km
from a lake. The surrounding landscape is characterised by arid plains.
Dust suppression techniques are required in order to ensure that dust emissions are of
low significance.
The tailings are stored in the tailing ponds. The tailing ponds will be equipped with an
impervious layer on the base and on the walls. The authority state that they demand high
standard of seepage management design. A groundwater monitoring system is required.
Study on Rare Earths and Their Recycling
58
Around 14 % of the water input to the tailing pond will be returned to the process plant.
The tailing ponds will be deemed a contaminated site after plant closure.
The pipelines will be controlled by electronic supervisory devices as well as by daily sight
inspections.
The tailings contain 500 ppm thorium oxide and 30 ppm uranium oxide. There are no
details given on the management of the radioactivity. The approval refers to the manage-
ment by the Radiological Council under the Radiation Safety Act 1999.
The rehabilitation works of the overburden stockpiles have started (Lynas 2009).
Further processing of the concentrate with an output of up to 22 000 t REO per year will be
carried out in Malaysia by the 100 % subsidiary of Lynas called Lynas Malaysia. The
approval from the Malaysian authorities was obtained in 2008, and the construction works
already started in 2008. The start of operation is scheduled for 2011. The environmental
impact assessment for the Malaysian plant is not publically available via internet. Concerning
the chosen location for the processing plant, Lynas argues that the processing of the Mt
Weld material will be realised in Malaysia because of the good infrastructure, the skilled
labour force with experience in the chemical industry and the nearby supply of the required
chemicals.
7.4.4 Kvanefjeld, Greenland
Large resources of rare earths with a high content of HREE of about 14 % can be found in
the Kvanefjeld region in southern Greenland, which is currently discussed for the joint mining
of uranium and rare earths. Figure 7 on page 15 impressively shows the very large size of
this deposit and its significant HREE contents in comparison to other deposits where pre-
mining activities also take place. The interested mining company is Greenland Minerals and
Energy Ltd. (GMEL) with its head office in Perth, Australia, which plans to start construction
work in 2013 and to initiate production in 2015.
A very critical point for environmental hazards in this project is the tailing's management.
According to current considerations GMEL favour tailings disposal in the nearby natural lake
Taseq (GMEL 2009). Following an extensive study Risø (1990) concluded that the outlet
from contaminated water from Taseq would cause pollution of the whole fluvial system (from
the lake, via rivers, into the ocean) with radioactive substances, fluorine and heavy metals. It
is very doubtful if waste water treatment installations at the outlet of the lake are capable to
manage the large amounts of water particularly in times of heavy rain or snow melting.
The extensive work on the Kvanefjeld deposit (the results of which were published by Risø in
1990) was conducted by Danish authorities and scientists up to the early 1980s and also
form the basis of the GMEL planning activities (GMEL 2010c). This work was carried out with
the focus of mining uranium only and provides very detailed considerations and analysis
Study on Rare Earths and Their Recycling
59
results concerning environmental impacts. Beside the tailings impoundment it identified the
open pit and the waste dump as the most important sources of pollution. In the long term
(> 100 years) the tailings pond will be the most critical point. Risø (1990) compared two
options: the direct inlet of the tailings into the sea and the tailings disposal in the nearby
natural lake Taseq (see above). The latter was considered even worse in terms of
environmental impacts than the direct inlet into the ocean.
Though waste disposal in oceans was frequently practised in the past, the procedure is not
acceptable at all either. Equally, inlet of toxic tailings into natural water bodies has to be
banned completely and does not meet any environmental standards. The situation in
Greenland seems particularly critical when considering the fact that the expected climate
change – it is linked to melting of glaciers and unfreezing of permafrost soils – might alter
water bodies and the stability of soils considerably.
The next paragraph gives a short overview of the planned technologies for the GMEL-
Kvanefjeld project and the progress of the (pre-)feasibility studies and approval issues:
Mining shall be carried out in a conventional open pit followed by uranium extraction with the
Carbonate Pressure Leach- (CPL-) technology. The CPL-residue can then be processed and
the REO concentrated by froth flotation, leached with acid and then refined to produce rare-
earth-carbonate. The nominal forecast annual production amounts to approx. 44 000 t REO
and nearly 4 000 t of uranium oxide; the overall plant recovery rates are 34 % and 84 %,
respectively (GMEL 2009).
In December 2009 and February 2010 GMEL presented the Interim Reports of the Pre-
feasibility Study (GMEL 2010c, GMEL 2009). As the Greenland government has recently
relaxed restrictions on uranium deposits, the company now envisages the realisation of a
definitive feasibility study (WNN 2010). According to the same article the Greenland govern-
ment has stressed that although radioactive elements may now be surveyed, their extraction
is still not permitted. However, a comprehensive review process into the exploration and
exploitation of the radioactive materials was announced by the Ministry for Industry and Raw
Materials. In this context, the cooperation agreement between the government of Greenland
and the European Environment Agency on environmental issues signed in November 2010
(EEA 2010) might lead to an exchange of expertise and contribute to a sustainable course of
action concerning the Kvanefjeld deposit and mining activities in Greenland in general.
7.5 Resource efficiency
The specific environmental burden of mined and processed rare earths could be reduced
significantly by higher efficiencies in all stages of the production. The first losses occur in the
mining process when the cut-off grade is chosen too high. This means that minerals with
lower REO-contents are not further processed. The cut-off grade is site-specific as it
depends on the kind of minerals and its properties in the concentration process.
Study on Rare Earths and Their Recycling
60
The next losses arise in the concentration process. The mines show quite different recovery
rates (ratio between REO output and REO input of the concentration plant). The Mountain
pass concentration plant shall operate with a high recovery rate of about 90 % due to a very
fine grinding of the minerals. Lynas states that the plant at Mt Weld will have a recovery rate
of 63 %. The recovery of Chinese mines is reported to have been very low in the past.
Currently, they range from 40 to 60 % for flotation and about 75 % for the in-situ leaching
method (see Chapter 7.3.3 to 7.3.5). However, a site-specific analysis is necessary in order
to assess in detail if higher recovery rates are possible and improve the overall performance
of the plant.
Further losses arise in all stages of further refining and processing. They are also plant-
specific.
The Chinese government is aware of the high potential of higher efficiencies as described in
Chapter 7.3.7. Further aspects concerning the efficiency of rare earths used in different fields
of applications is discussed in Chapter 10.
Study on Rare Earths and Their Recycling
61
Conclusion on environmental aspects of rare earth mining and processing
The rare earth mining shows high environmental risks. The main risks are the tailings,
which are a mixture of small-size particles, waste water and flotation chemicals and arise
at the concentration of the mined ore. They are stored in impoundment areas. The tailing
dam is exposed to manifold risks such as overtopping due to storm water, poor
construction or seismic events. A failing dam leads to site-specific emissions such as
thorium, uranium, heavy metals and fluorides. Generally, most rare earth deposits
contain radioactive materials which impose the risk of radioactive dust and water
emissions. Further potential damages are other air emissions, soil contamination, land
use, etc.
There are serious environmental damages in the Chinese rare earth mines and their
surroundings. The Chinese government intends to reduce the environmental harm by
installing environmental technologies in the large mines and by reducing the numerous
small illegal mines which probably have no environmental technologies at all. China also
aims at higher efficiencies in mining and processing and is running some research
projects on a sustainable rare earth economy.
The most advanced mines outside of China at the Mountain Pass in the United States
and at Mt. Weld in Australia will provide environmental protection systems, which will
significantly reduce the environmental damage compared to old outdated techniques, if
the management and the monitoring are conducted responsibly by the authorities and the
operators.
However, the global pressure for a steady rare earth supply might lead to further new
mines outside of China with inacceptable environmental standards. One example of
potential concern about environmental damage is the plan for joint mining of uranium and
rare earths in Greenland. The interested mining company intends to store the tailings in a
natural lake with connection to maritime waters.
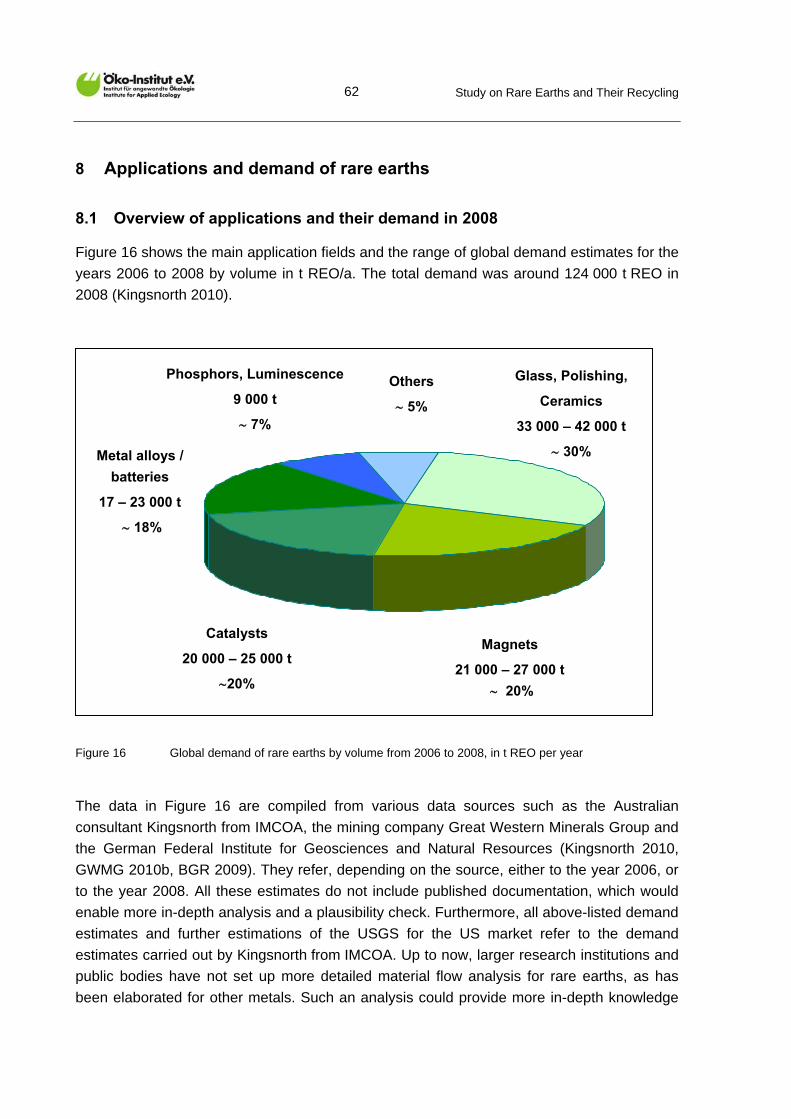
Study on Rare Earths and Their Recycling
62
8 Applications and demand of rare earths
8.1 Overview of applications and their demand in 2008
Figure 16 shows the main application fields and the range of global demand estimates for the
years 2006 to 2008 by volume in t REO/a. The total demand was around 124 000 t REO in
2008 (Kingsnorth 2010).
Figure 16 Global demand of rare earths by volume from 2006 to 2008, in t REO per year
The data in Figure 16 are compiled from various data sources such as the Australian
consultant Kingsnorth from IMCOA, the mining company Great Western Minerals Group and
the German Federal Institute for Geosciences and Natural Resources (Kingsnorth 2010,
GWMG 2010b, BGR 2009). They refer, depending on the source, either to the year 2006, or
to the year 2008. All these estimates do not include published documentation, which would
enable more in-depth analysis and a plausibility check. Furthermore, all above-listed demand
estimates and further estimations of the USGS for the US market refer to the demand
estimates carried out by Kingsnorth from IMCOA. Up to now, larger research institutions and
public bodies have not set up more detailed material flow analysis for rare earths, as has
been elaborated for other metals. Such an analysis could provide more in-depth knowledge
Glass, Polishing,
Ceramics
33 000 – 42 000 t
30%
Magnets
21 000 – 27 000 t
20%
Catalysts
20 000 – 25 000 t
20%
Metal alloys /
batteries
17 – 23 000 t
18%
Phosphors, Luminescence
9 000 t
7%
Others
5%
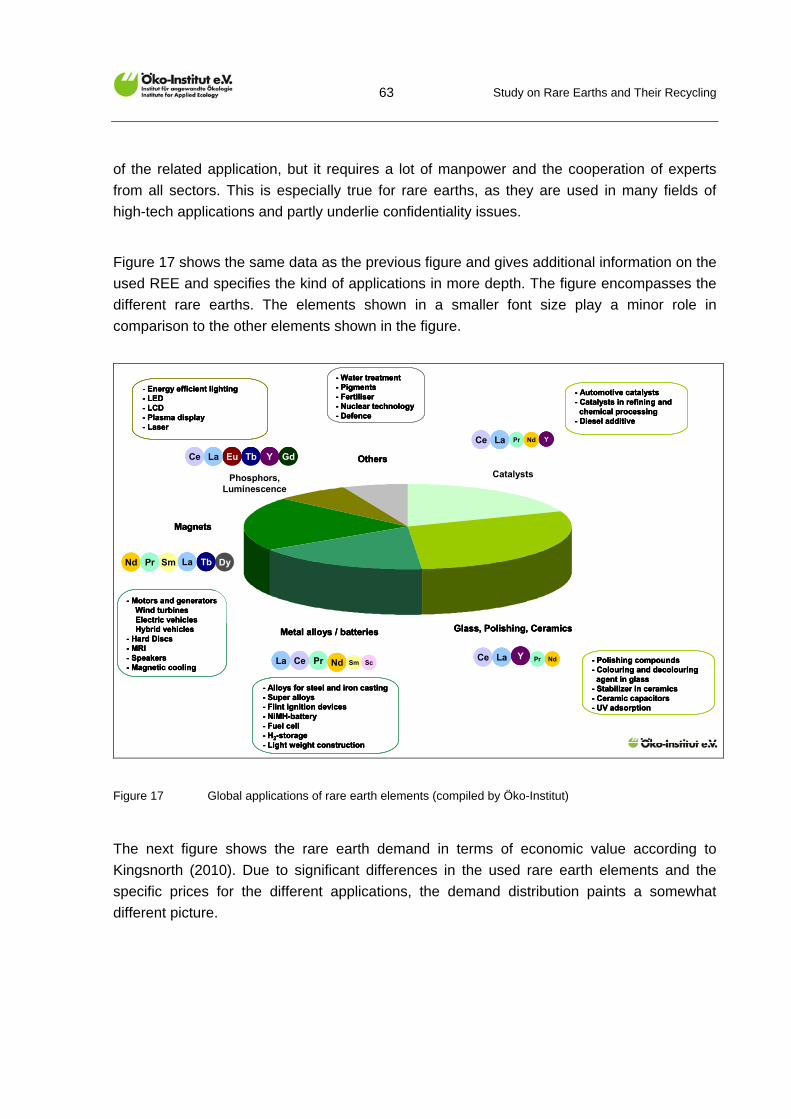
Study on Rare Earths and Their Recycling
63
of the related application, but it requires a lot of manpower and the cooperation of experts
from all sectors. This is especially true for rare earths, as they are used in many fields of
high-tech applications and partly underlie confidentiality issues.
Figure 17 shows the same data as the previous figure and gives additional information on the
used REE and specifies the kind of applications in more depth. The figure encompasses the
different rare earths. The elements shown in a smaller font size play a minor role in
comparison to the other elements shown in the figure.
YTb GdEuCe La
DyTbNd Pr Sm
La Ce Pr Nd Sm ScCe La Y Pr Nd
Ce La Pr Nd Y
Glass, Polishing, Ceramics
Magnets
Catalysts
Metal alloys / batteries
Phosphors, Luminescence
Others
- Alloys for steel and iron casting- Super alloys- Flint ignition devices- NiMH-battery- Fuel cell- H2-storage- Light weight construction
- Polishing compounds- Colouring and decolouringagent in glass
- Stabilizer in ceramics- Ceramic capacitors- UV adsorption
- Motors and generatorsWind turbinesElectric vehiclesHybrid vehicles
- Hard Discs- MRI- Speakers- Magnetic cooling
- Energy efficient lighting- LED- LCD- Plasma display- Laser
- Water treatment- Pigments- Fertiliser- Nuclear technology- Defence
- Automotive catalysts- Catalysts in refining and
chemical processing- Diesel additive
La
Figure 17 Global applications of rare earth elements (compiled by Öko-Institut)
The next figure shows the rare earth demand in terms of economic value according to
Kingsnorth (2010). Due to significant differences in the used rare earth elements and the
specific prices for the different applications, the demand distribution paints a somewhat
different picture.
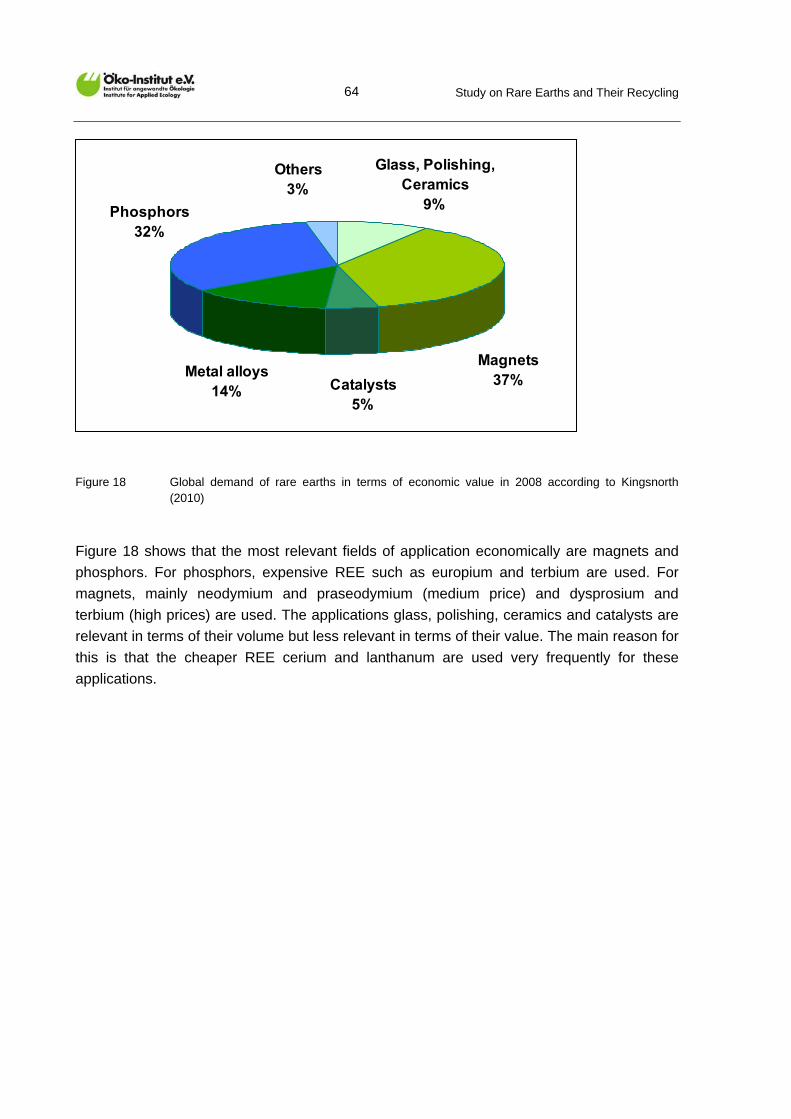
Study on Rare Earths and Their Recycling
64
Phosphors32%
Metal alloys14% Catalysts
5%
Magnets37%
Glass, Polishing, Ceramics
9%
Others3%
Figure 18 Global demand of rare earths in terms of economic value in 2008 according to Kingsnorth (2010)
Figure 18 shows that the most relevant fields of application economically are magnets and
phosphors. For phosphors, expensive REE such as europium and terbium are used. For
magnets, mainly neodymium and praseodymium (medium price) and dysprosium and
terbium (high prices) are used. The applications glass, polishing, ceramics and catalysts are
relevant in terms of their volume but less relevant in terms of their value. The main reason for
this is that the cheaper REE cerium and lanthanum are used very frequently for these
applications.
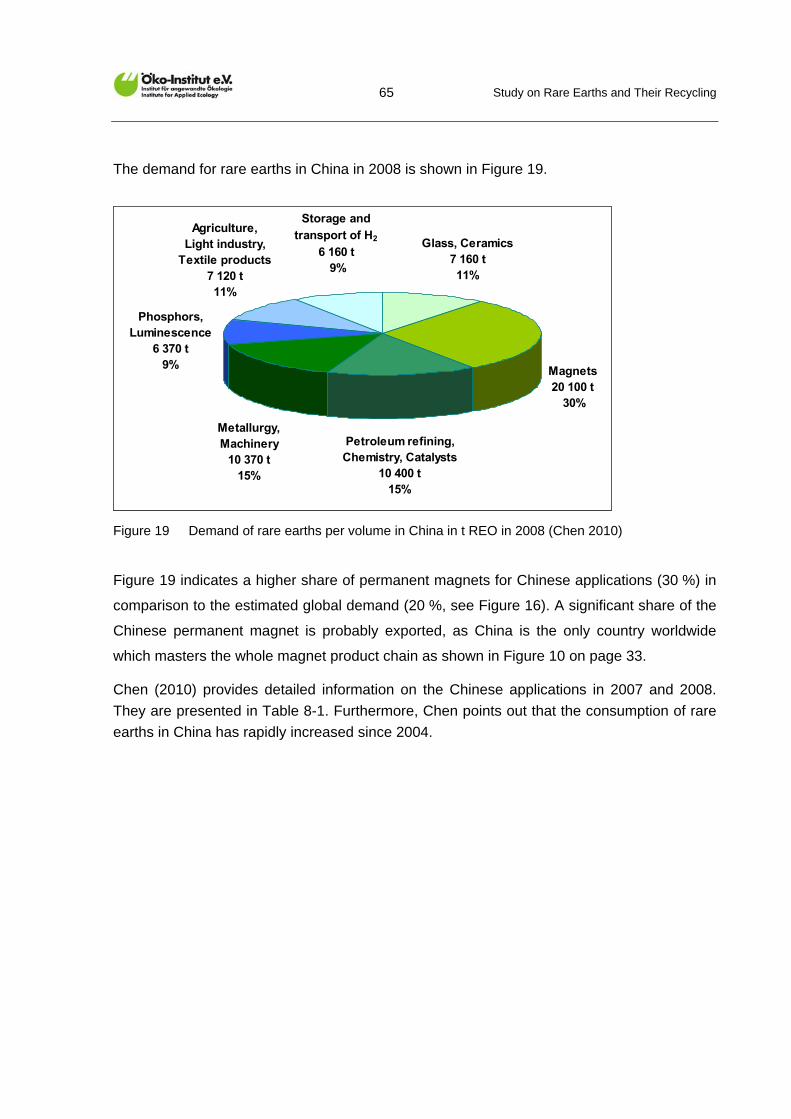
Study on Rare Earths and Their Recycling
65
The demand for rare earths in China in 2008 is shown in Figure 19.
Agriculture,Light industry,
Textile products7 120 t 11%
Phosphors, Luminescence
6 370 t 9%
Metallurgy, Machinery
10 370 t15%
Petroleum refining, Chemistry, Catalysts
10 400 t15%
Magnets20 100 t
30%
Glass, Ceramics7 160 t11%
Storage and
transport of H2
6 160 t 9%
Figure 19 Demand of rare earths per volume in China in t REO in 2008 (Chen 2010)
Figure 19 indicates a higher share of permanent magnets for Chinese applications (30 %) in
comparison to the estimated global demand (20 %, see Figure 16). A significant share of the
Chinese permanent magnet is probably exported, as China is the only country worldwide
which masters the whole magnet product chain as shown in Figure 10 on page 33.
Chen (2010) provides detailed information on the Chinese applications in 2007 and 2008.
They are presented in Table 8-1. Furthermore, Chen points out that the consumption of rare
earths in China has rapidly increased since 2004.
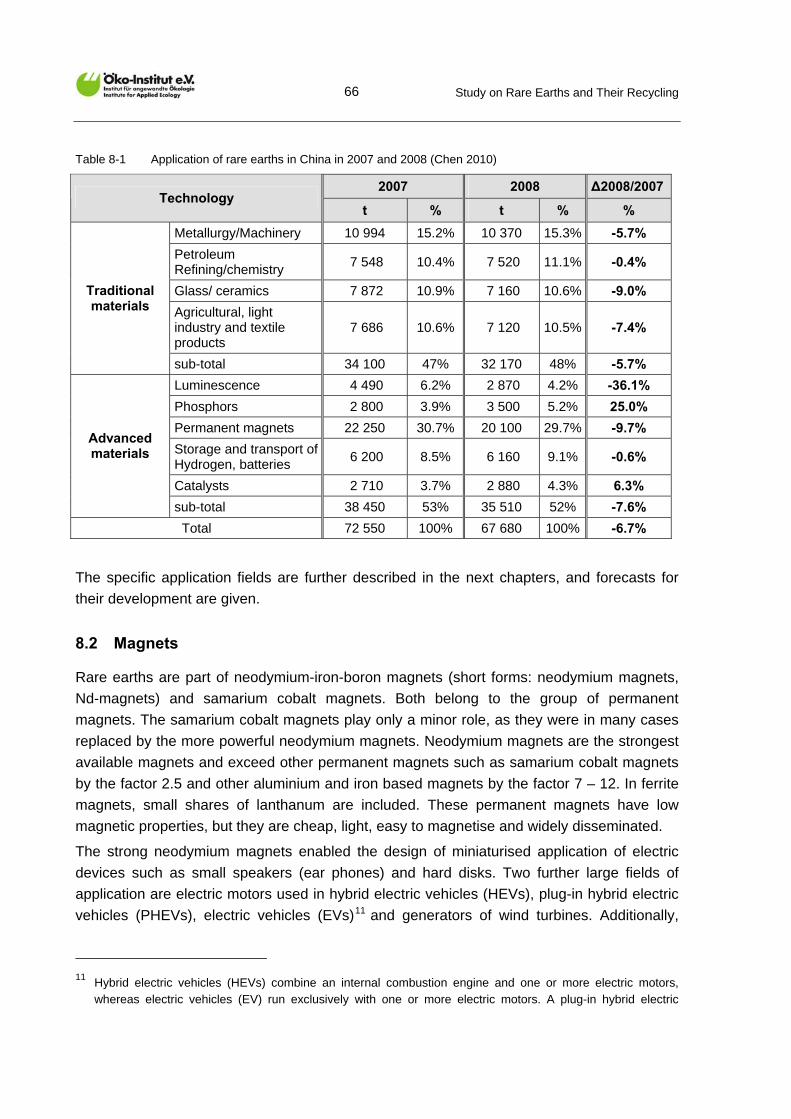
Study on Rare Earths and Their Recycling
66
Table 8-1 Application of rare earths in China in 2007 and 2008 (Chen 2010)
2007 2008 ∆2008/2007 Technology
t % t % %
Metallurgy/Machinery 10 994 15.2% 10 370 15.3% -5.7%
Petroleum Refining/chemistry
7 548 10.4% 7 520 11.1% -0.4%
Glass/ ceramics 7 872 10.9% 7 160 10.6% -9.0%
Agricultural, light industry and textile products
7 686 10.6% 7 120 10.5% -7.4%
Traditional materials
sub-total 34 100 47% 32 170 48% -5.7%
Luminescence 4 490 6.2% 2 870 4.2% -36.1%
Phosphors 2 800 3.9% 3 500 5.2% 25.0%
Permanent magnets 22 250 30.7% 20 100 29.7% -9.7%
Storage and transport of Hydrogen, batteries
6 200 8.5% 6 160 9.1% -0.6%
Catalysts 2 710 3.7% 2 880 4.3% 6.3%
Advanced materials
sub-total 38 450 53% 35 510 52% -7.6%
Total 72 550 100% 67 680 100% -6.7%
The specific application fields are further described in the next chapters, and forecasts for
their development are given.
8.2 Magnets
Rare earths are part of neodymium-iron-boron magnets (short forms: neodymium magnets,
Nd-magnets) and samarium cobalt magnets. Both belong to the group of permanent
magnets. The samarium cobalt magnets play only a minor role, as they were in many cases
replaced by the more powerful neodymium magnets. Neodymium magnets are the strongest
available magnets and exceed other permanent magnets such as samarium cobalt magnets
by the factor 2.5 and other aluminium and iron based magnets by the factor 7 – 12. In ferrite
magnets, small shares of lanthanum are included. These permanent magnets have low
magnetic properties, but they are cheap, light, easy to magnetise and widely disseminated.
The strong neodymium magnets enabled the design of miniaturised application of electric
devices such as small speakers (ear phones) and hard disks. Two further large fields of
application are electric motors used in hybrid electric vehicles (HEVs), plug-in hybrid electric
vehicles (PHEVs), electric vehicles (EVs)11 and generators of wind turbines. Additionally,
11 Hybrid electric vehicles (HEVs) combine an internal combustion engine and one or more electric motors,
whereas electric vehicles (EV) run exclusively with one or more electric motors. A plug-in hybrid electric
Study on Rare Earths and Their Recycling
67
neodymium magnets are used for industrial equipment such as lifters or magnetic
separators. A new application which might be implemented on a larger scale in the years
from 2015 is the magnetic cooling.
The share of magnets of the total rare earth application is around 20 % in terms of the global
volume. The share of value is higher at around 37 %. The basic chemical formula of Nd-
magnetic material is Nd2Fe14B, which comprises a mix of neodymium and praseodymium
( 30 %) and mostly the additives dysprosium ( 3 %) and terbium in even lower contents.
Neodymium and praseodymium belong to the rare earths which have a medium price,
whereas dysprosium and terbium are very expensive elements (for details on prices, see
Chapter 6.3).
Technical details on the applications motors, wind turbines and hard disks are given in
Chapter 10.2 and Chapter 11.1, where recycling aspects, options for a substitution and
options for a more efficient use of the REE are discussed. The next chapters analyse the
main factors influencing the development of the future demand.
The future demand for permanent magnets is significantly determined by the three
applications electric motors for hybrid and electric vehicles, wind turbines and hard disks.
The following chapters analyse the expected development of the main application fields.
8.2.1 Electric and hybrid electric vehicles
The demand development of Nd-magnets in the field of e-mobility depends on three main
drivers:
the future production of hybrid electric (HEV), plug-in electric vehicles (PHEV) and
electric vehicles (EV),
the future production of electric bikes,
the future motor technology and the share of motors using Nd-magnets in EV, HEV and
PHEV and
the specific neodymium magnets demand per electric motor.
Byron Capital Markets (2010) makes a forecast which includes the major producers of HEVs
(Toyota, Chevy, Nissan, Ford and Honda) and e-bikes. E-bikes are already used in large
quantities in China. An average annual growth rate of 50 % is estimated. Despite this high
growth rate, Byron Capital Markets (2010) only calculates a moderate overall demand in
vehicle (PHEVs) is a hybrid vehicle with rechargeable batteries, which can be plugged to an external electric power source for charging.
Study on Rare Earths and Their Recycling
68
terms of HEVs even in 2015, because the assumed specific rare earth content of the electric
motors is much lower in Byron’s scenario than in scenarios of other experts. Byron assumes
a demand of 193 g Nd per motor12, whereas other experts expect up to 1.8 kg neodymium for
the electric motor of the Toyota Prius. This means a difference in the baseline of a factor of
10!
Another uncertainty is the estimation of the number of hybrid electric vehicles. The number of
hybrid electric vehicles to be sold is estimated by Byron Capital Markets to be 1.2 million
HEVs and EVs in 2014; and to be 2.1 million by Iwatani (cited in Oakdene Hollins 2010).
Optimistic scenarios by IEA (2009) and Fraunhofer ISI (2009) forecast 9 to 14 million sold
HEV and EV for 2015.
Öko-Institut carried out an analysis of different scenarios for the development of e-mobility
from different institutions (IEA 2009, Fraunhofer ISI 2009, McKinsey 2010, BCG 2009). The
analysis revealed that the range of future scenarios is quite high. The projections for the year
2020 lie within the range of 9 to 33 million HEVs, EVs and PEVs sold in 2020. Electric
vehicles are supposed to play a minor role up to 2015.
The annual sales of e-bikes are estimated by IEA (2009) to be more that 10 million. Byron
Capital Markets (2010) estimates for 2010 and 2014 annual sales of 25 and 33 million e-
bikes, mainly in China. Recent information delivered from Chinese experts to Öko-Institut
confirms a current range of 20 – 25 million units for the annual production of e-bikes in
China.
The main conclusion from these explanations is that the demand estimations for the rare
earths in EV and HEV should be handled with caution, as there is a very high uncertainty in
the economic development of the electric and hybrid electric vehicles market and the
embedded technologies (type of motor, specific Nd-demand per motor, etc.). Two different
scenarios outline the wide range of forecasts for the resulting Nd-demand: Byron forecasts
an Nd-oxide demand of around 1 200 t in 2015. Oakdene Hollins (2010) calculate on the
basis of the three projections developed by McKinsey (2009) and the assumption of 1 kg Nd
per motor, the resulting Nd-oxide-requirement ranges from only 875 t in 2020 for a scenario
with very slow growth of hybrid electric vehicles (only 1 million HEV/EV in 2020) up to
23 000 t Nd-oxide demand in 2020 in a scenario with very high growth rates ( 20 million
HEV/EV in 2020). There is an additional uncertainty on the used motor technologies. The
presented scenarios on the Nd-demand of future electric and hybrid electric vehicles assume
that the motors are using permanent magnets. It is not considered that there are several
12 Byron Capital Markets assumes the use of sintered magnets of 650 g for a 55 kW motor, containing 193 g Nd
and 24 g of Dy. According to Oakdene Hollins (2010), Lifton estimates 1 kg of Nd in the electric Prius motor, whereas Kingsnorth even estimates that 1.9 kg of Nd is required in the electric Prius motor. Angerer et al (2009) estimate the Nd-demand of 0.5 – 1 kg per hybrid electric vehicle.
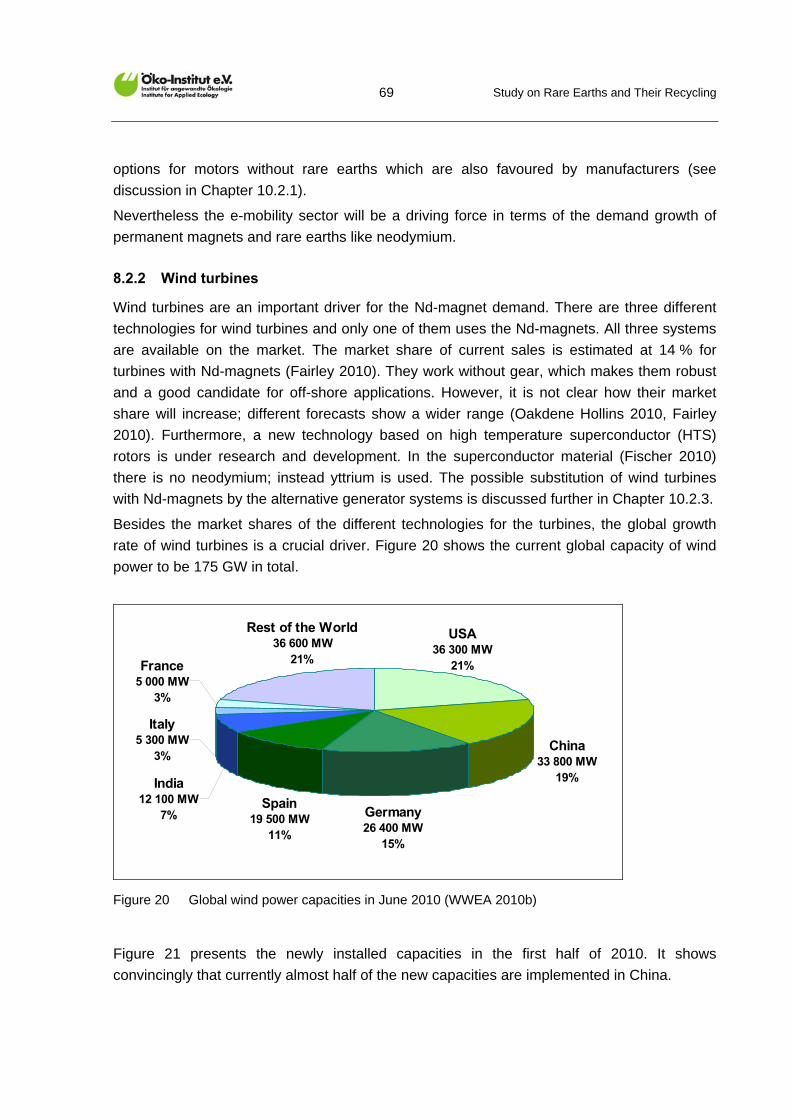
Study on Rare Earths and Their Recycling
69
options for motors without rare earths which are also favoured by manufacturers (see
discussion in Chapter 10.2.1).
Nevertheless the e-mobility sector will be a driving force in terms of the demand growth of
permanent magnets and rare earths like neodymium.
8.2.2 Wind turbines
Wind turbines are an important driver for the Nd-magnet demand. There are three different
technologies for wind turbines and only one of them uses the Nd-magnets. All three systems
are available on the market. The market share of current sales is estimated at 14 % for
turbines with Nd-magnets (Fairley 2010). They work without gear, which makes them robust
and a good candidate for off-shore applications. However, it is not clear how their market
share will increase; different forecasts show a wider range (Oakdene Hollins 2010, Fairley
2010). Furthermore, a new technology based on high temperature superconductor (HTS)
rotors is under research and development. In the superconductor material (Fischer 2010)
there is no neodymium; instead yttrium is used. The possible substitution of wind turbines
with Nd-magnets by the alternative generator systems is discussed further in Chapter 10.2.3.
Besides the market shares of the different technologies for the turbines, the global growth
rate of wind turbines is a crucial driver. Figure 20 shows the current global capacity of wind
power to be 175 GW in total.
USA36 300 MW
21%
China33 800 MW
19%
Germany 26 400 MW
15%
Spain19 500 MW
11%
Italy5 300 MW
3%
India12 100 MW
7%
France5 000 MW
3%
Rest of the World36 600 MW
21%
Figure 20 Global wind power capacities in June 2010 (WWEA 2010b)
Figure 21 presents the newly installed capacities in the first half of 2010. It shows
convincingly that currently almost half of the new capacities are implemented in China.
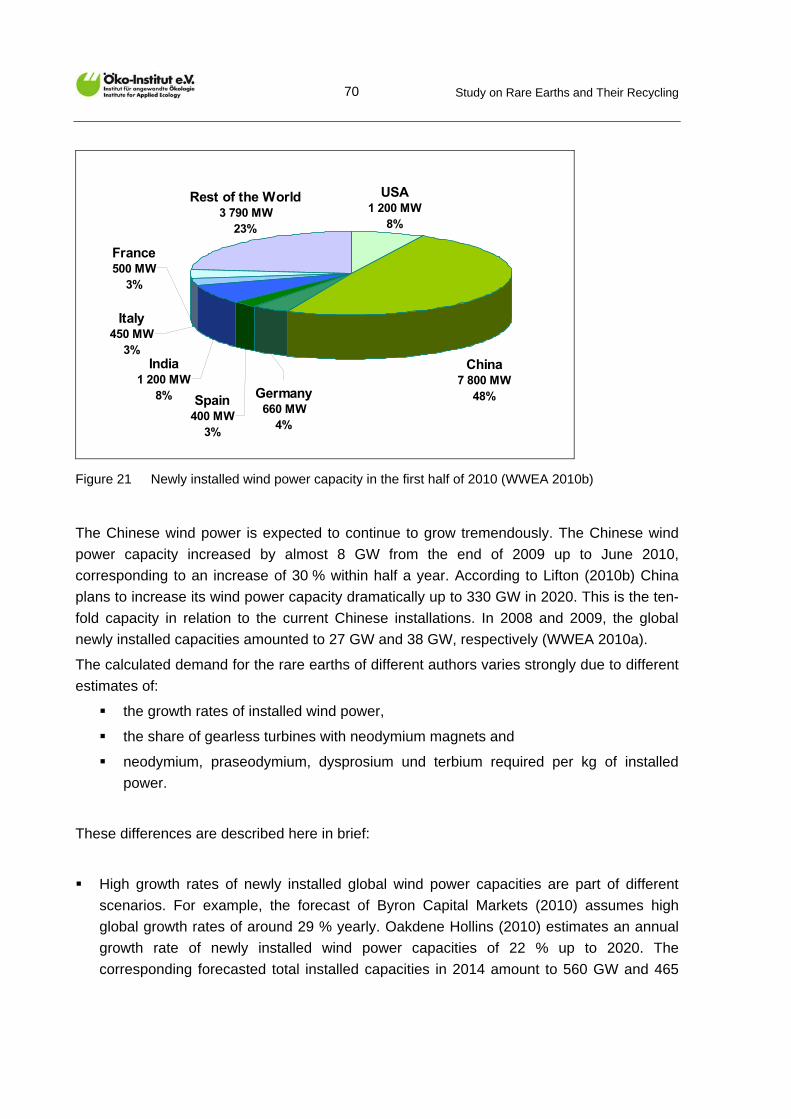
Study on Rare Earths and Their Recycling
70
Italy450 MW
3%
France500 MW
3%
India1 200 MW
8% Spain400 MW
3%
Germany660 MW
4%
China7 800 MW
48%
USA1 200 MW
8%
Rest of the World3 790 MW
23%
Figure 21 Newly installed wind power capacity in the first half of 2010 (WWEA 2010b)
The Chinese wind power is expected to continue to grow tremendously. The Chinese wind
power capacity increased by almost 8 GW from the end of 2009 up to June 2010,
corresponding to an increase of 30 % within half a year. According to Lifton (2010b) China
plans to increase its wind power capacity dramatically up to 330 GW in 2020. This is the ten-
fold capacity in relation to the current Chinese installations. In 2008 and 2009, the global
newly installed capacities amounted to 27 GW and 38 GW, respectively (WWEA 2010a).
The calculated demand for the rare earths of different authors varies strongly due to different
estimates of:
the growth rates of installed wind power,
the share of gearless turbines with neodymium magnets and
neodymium, praseodymium, dysprosium und terbium required per kg of installed
power.
These differences are described here in brief:
High growth rates of newly installed global wind power capacities are part of different
scenarios. For example, the forecast of Byron Capital Markets (2010) assumes high
global growth rates of around 29 % yearly. Oakdene Hollins (2010) estimates an annual
growth rate of newly installed wind power capacities of 22 % up to 2020. The
corresponding forecasted total installed capacities in 2014 amount to 560 GW and 465
Study on Rare Earths and Their Recycling
71
GW, respectively. Thus, a tremendous increase in comparison to the global capacity of
175 GW in June 2010 is forecasted.
Byron Capital Markets estimates that 20 % of the turbines will be installed with
permanent magnet-equipped generators, though it supposes that this figure is likely to be
too high. Oakdene Hollins assumes a gearless contribution of 10 % up to 2014 and 20 %
from 2015 onwards.
There are different data on how much neodymium is necessary per installed MW
electricity of the turbine. Lifton (2010b) estimates 667 kg neodymium-magnets per MW
electricity, whereas the exploration company Avalon assumes 400 kg of neodymium
magnet embedded per MW electricity (cited in Oakdene Hollins 2010).
The World Wind Energy Association counts the new installations in 2008 at 27 GW.
Assuming a share of 14 % for gearless turbines with Nd-magnets and an average
consumption of 400 kg Nd-magnet per MW electricity, the total Nd-demand in 2008 would
have been about 450 t Nd and about 570 Nd-oxide, respectively.
Based on the forecast by Oakdene Hollins (2010), the Nd-demand for wind turbines is
calculated as 1 200 t/a REO up to 2014 and 4 200 t/a REO from 2015 onwards.
Summarizing the explanations above, it is to point out that it is currently not clear which
direction the technology development will actually take. Therefore, for the wind turbines as
well as for the electric vehicles, the forecasts should be taken into account with care, as
there is a high uncertainty of the implementation of future techniques.
8.2.3 Hard disks and electronic components with Nd-magnets
According to the Japanese company Shin-Etsu (cited in Oakdene Hollins 2010) around a
third of the Nd-magnets are used in hard disk devices. Öko-Institut estimates that around
1 700 t Nd (corresponds to 2 150 t Nd-oxide) were embedded in hard disks in PCs including
laptops which were sold in 200813. Here, some degree of substitution by the SSD technology
which is described in Chapter 10.3 is expected. However, it is also expected that the
substitution will occur gradually and will probably not affect all hard disk devices.
Furthermore, Shin-Etsu (cited in Oakdene Hollins 2010) estimates that about further 10 % of
all neodymium magnets are embedded in optical and acoustic applications.
The future demand development of the permanent magnets in hard disks is probably almost
linear to the sales of computers. The annual global growth of personal computers and
particularly laptops is high. The market research institution Gartner forecasts a growth rate of
16 % for 2011 (Gartner 2010).
13 Calculation based on 291 million computer sales in 2008 and measurements by A. Manhart at Öko-Institut of
magnets from hard disks (22 g per magnet, corresponding at 5.9 g Nd per hard disks for Nd-share of 27 %).
Study on Rare Earths and Their Recycling
72
The future demand development of permanent magnets in optical and acoustic devices is
probably similar to the sales of electronic goods. Average growth rates in the electronics
sector are estimated at 5 % for the period from 2010 to 2013 by the industry research firm
RNCOS (Daily News 2010).
These figures imply that the demand of the applications hard disks and other electronics
should not be underestimated, even if the possible growth rates for wind turbines and electric
and hybrid electric cars might be higher.
8.2.4 Magnetic cooling
A new technology which is currently under development is the magnetic cooling. It is based
on the magneto-caloric effect phenomenon, in which a reversible change in the temperature
of magnetic materials occurs in the magnetisation/demagnetisation process. The technology
promises high energy savings of 50 – 60 % in comparison to the traditional compression
refrigerating machines (EEC 2010, Katter 2010, Jiang 2008). Possible applications are
refrigerators in household and commercial appliances, industrial cooling, heat pumps and air-
conditioning systems.
The European Union is currently supporting the research project SSEEC (Solid State Energy
Efficient Cooling) in which several prototypes for air-conditioning are constructed. The aim is
to develop magnetic cooling devices which are suitable for industrial use by the end of 2011
(Katter 2010).
Rare earths are needed for these devices for both the magnetic source and the refrigerant.
As a magnetic source, the neodymium magnets are the best option (Katter 2010). BGS
(2010) reports in addition that gadolinium is a suitable refrigerant. Research has been carried
out in China on magnetic refrigerants based on gadolinium-silicon-germanium materials
(Jiang 2008).
Katter (2010) of the German company Vacuumschmelze, which is a relevant permanent
magnet producer, expects that it might take some years until magnetic cooling will achieve
economical relevance. He identifies the high costs for the magneto-caloric materials and the
high amount of Nd-magnets required for magnetic refrigeration as a major barrier to a wide
dissemination. With approx. 200 million cooling machines being sold worldwide each year, it
is to be assumed that the magnetic cooling will require a significant amount of rare earths if
the magnetic cooling technology is to be widely disseminated.
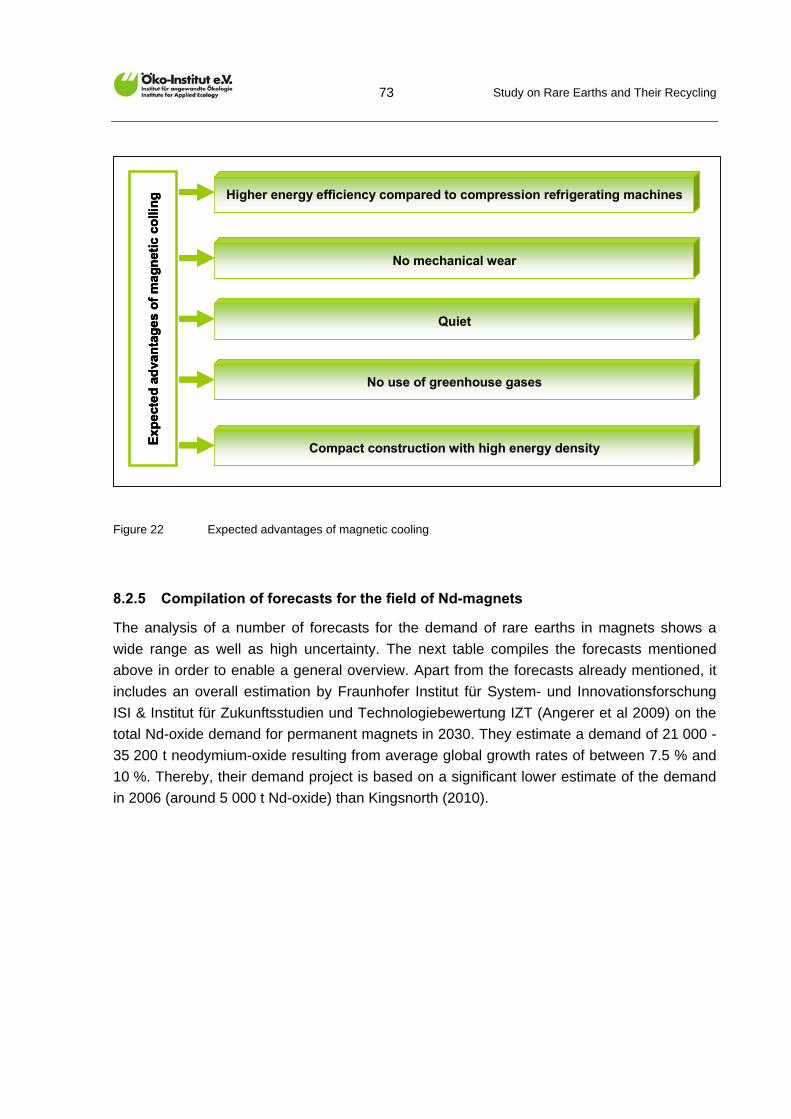
Study on Rare Earths and Their Recycling
73
Quiet
No mechanical wear
Ex
pe
cte
dad
van
tag
eso
f m
agn
etic
colli
ng Higher energy efficiency compared to compression refrigerating machines
No use of greenhouse gases
Compact construction with high energy density
Quiet
No mechanical wear
Ex
pe
cte
dad
van
tag
eso
f m
agn
etic
colli
ng Higher energy efficiency compared to compression refrigerating machines
No use of greenhouse gases
Compact construction with high energy density
Quiet
No mechanical wear
Ex
pe
cte
dad
van
tag
eso
f m
agn
etic
colli
ng Higher energy efficiency compared to compression refrigerating machines
No use of greenhouse gases
Compact construction with high energy density
Figure 22 Expected advantages of magnetic cooling
8.2.5 Compilation of forecasts for the field of Nd-magnets
The analysis of a number of forecasts for the demand of rare earths in magnets shows a
wide range as well as high uncertainty. The next table compiles the forecasts mentioned
above in order to enable a general overview. Apart from the forecasts already mentioned, it
includes an overall estimation by Fraunhofer Institut für System- und Innovationsforschung
ISI & Institut für Zukunftsstudien und Technologiebewertung IZT (Angerer et al 2009) on the
total Nd-oxide demand for permanent magnets in 2030. They estimate a demand of 21 000 -
35 200 t neodymium-oxide resulting from average global growth rates of between 7.5 % and
10 %. Thereby, their demand project is based on a significant lower estimate of the demand
in 2006 (around 5 000 t Nd-oxide) than Kingsnorth (2010).
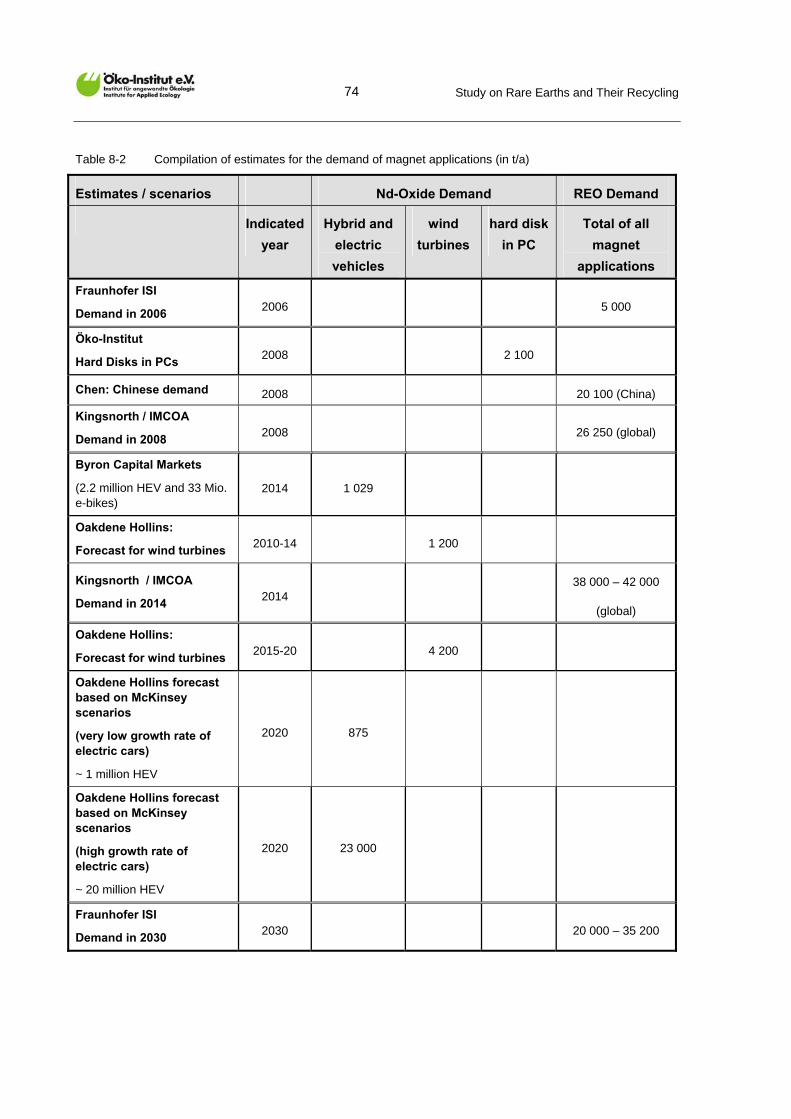
Study on Rare Earths and Their Recycling
74
Table 8-2 Compilation of estimates for the demand of magnet applications (in t/a)
Estimates / scenarios Nd-Oxide Demand REO Demand
Indicated
year
Hybrid and
electric
vehicles
wind
turbines
hard disk
in PC
Total of all
magnet
applications
Fraunhofer ISI
Demand in 2006 2006 5 000
Öko-Institut
Hard Disks in PCs 2008 2 100
Chen: Chinese demand 2008 20 100 (China)
Kingsnorth / IMCOA
Demand in 2008 2008 26 250 (global)
Byron Capital Markets
(2.2 million HEV and 33 Mio. e-bikes)
2014 1 029
Oakdene Hollins:
Forecast for wind turbines 2010-14 1 200
Kingsnorth / IMCOA
Demand in 2014 2014
38 000 – 42 000
(global)
Oakdene Hollins:
Forecast for wind turbines 2015-20 4 200
Oakdene Hollins forecast based on McKinsey scenarios
(very low growth rate of electric cars)
~ 1 million HEV
2020 875
Oakdene Hollins forecast based on McKinsey scenarios
(high growth rate of electric cars)
~ 20 million HEV
2020 23 000
Fraunhofer ISI
Demand in 2030 2030 20 000 – 35 200
Study on Rare Earths and Their Recycling
75
This summary shows a significant gap between the high demand estimates by the Austra-
lian expert Kingsnorth (2010) and the Chinese expert Chen (2010) on the one hand and the
sectoral analyses on the other hand. The sectoral analyses indicate a comparably low share
of the wind turbines, a comparably low contribution from hybrid and electric vehicles (apart
from the 2020 scenario by McKinsey, which assumes that hybrid electric vehicles will
dominate the fleet) and a comparably low contribution from hard disks in computers.
The high Chinese demand estimate for 2008 compared to the global demand estimate for
the same year provided in Kingsnorth (2010) is plausible, as China is the main magnet
producer and produced not only for the domestic market but also for the export.
The comparison of the total demand estimates and the sectoral analysis might indicate
higher shares of many magnet applications in other fields such as industrial equipment (e.g.
lifters or magnetic separators), electronics, medical advices and other motor applications.
One further aspect which is probably not considered in the sectoral analyses is the high loss
of material in the magnet production. This issue is discussed in Chapter 10.2, which analyses
options for a more efficient use of rare earths.
The situation regarding data uncertainty clearly shows that there is an obvious need for more
reliable information. Precise analyses and reliable demand forecasts require a compre-
hensive material flow analysis to be undertaken by a research group with independent
experts from all relevant application fields who have additional know-how of the specific
national features.
8.3 Phosphors and luminescence
Almost all future energy saving lighting and display technologies, such as compact fluores-
cent lamps (CFL), fluorescent tubes, LEDs, OLEDs, EL foils, plasma displays and LCDs
require the use of rare earths as phosphors, providing a high energy efficiency and high
colour quality. In the past, many chemical elements and compounds are being studied for
their use in luminescence. Among the substances being analysed, rare earths in particular
seem to be most promising in terms of their high colour quality and good energy efficiency. It
seems very unlikely that this performance will be achieved without the use of rare earths
from the current perspective.
Thereby, the REE europium, samarium, terbium, cerium, erbium, dysprosium, thulium,
gadolinium, and lutetium play a role as activators. The matrix or host lattices partly contain
REE like yttrium, lanthanum or cerium.
The share of phosphors and luminescence in total rare earth application is around 7 %
worldwide and around 9 % in China, in terms of volume. However, the share in terms of
economic value is much higher at around 32 % according to the estimate provided in
Kingsnorth (2010). One reason for the high value of the phosphors is the high price of
Study on Rare Earths and Their Recycling
76
europium and terbium, which both cost more than 700 US $/kg (see details on prices in
Chapter 6.3) in November 2010.
Lynas (2010a) estimates that around 84 % of the phosphors are globally used for lighting,
around 12 % for LCD and around 4 % for plasma displays. Hereby, 74 % are estimated to be
used for red light, 25 % for green light and 0.5 % for blue light.
Informative figures are given on the relevance of europium and terbium in lighting appliances
for the total demand of these elements by NEDO (2009). NEDO (2009) estimates that Japan
is the world's leading consumer of terbium and europium with around 70 to 80 % of demand
generated by the need for fluorescent powder.
The growth of rare earth consumption in the sector of lighting is determined by following
parameters:
The global overall growth including all types of lighting is estimated at 7 % per year by
Philips (2008) for the years 2004 to 2011.
Incandescent bulbs are going to be phased out due to their high energy demand. For
example, the European Union, Australia, Canada and the United States banned the
sale of incandescent bulbs in the years ahead in accordance with national law
(Jaspersen McKeown 2008, DOE 2010). They will be replaced by other lighting
systems, mainly by compact fluorescent lamps (CFL) and halogen lamps. Besides
these types, there are numerous other lighting systems. Most of the energy efficient
lighting systems include phosphors based on rare earths.
Currently LEDs which also contain rare earths still play a minor role in lighting with a
market share of 2.4 % in 2008. The main current uses were decorative effect lighting
and orientation light; they are also starting to replace other lighting systems, e.g.
automobile headlights. However, their development is progressing rapidly, and wider
uses at very high efficiencies are to expect, particularly if the current comparably high
prices begin to decrease. Trendforce (2010) assumes a growth rate of 32 % from
2008 to 2013 with a market share of about 8 % in 2013.
Cathode-ray tubes which were used formerly on a large scale in TV sets and monitors
are currently replaced by plasma displays and LCDs. Both techniques use rare
earths. In 2008, around 130 million television sets with plasma and LCD displays
were sold (DisplaySearch 2010). DisplaySearch (2010) forecasts an increase to
approx. 280 million in 2014. This corresponds to an annual growth rate of 14 %.
These different aspects highlight that a considerable growth rate for energy efficient lighting
systems with rare earth elements is to be expected. Kingsnorth (2010) assumes an annual
growth rate of 4 – 6 % between 2008 and 2014. It is possible that this projected growth rate
is too low and that higher growth rates will occur.
Study on Rare Earths and Their Recycling
77
More technical details are given in Chapter 10.5 and Chapter 11.3, in which recycling
aspects and options for a substitution of the REE are discussed.
8.4 Metal alloys / batteries
This application field comprises various uses which are summarised below (BGS 2010):
One of the oldest applications is the use of cerium and lanthanum in pyrophoric alloys
which are used in flint ignition devices for lighters and torches.
Mischmetal and cerium are used as minor alloys for casting of steel and iron. They
improve the stability of the casted product.
REE (Y, La, Ce) which are added to heat-resistant superalloys can dramatically improve
their performance.
REE are used for the solid state storage of hydrogen where a metallic matrix of different
metals absorbs a large amount of hydrogen at room temperature. This procedure is
better than storage as cryogenic liquid or compressed gas in terms of safety, volume and
energy saving.
REE are used in Ni-MH batteries which in turn are used in hybrid electric vehicles (e.g.
Toyota Prius) and portable appliances.
Scandium-aluminium alloys are a suitable material for light weight construction. Due to
the limited availability, it is mainly used in military aviation and not disseminated in civil
aviation. Angerer et al (2009) estimate the current scandium supply at 5 t per year and
report a new Australian mining project with the production target of 200 t scandium oxide.
A new technology still under development is the solid oxide fuel cell (SOFC) which is
regarded as the most promising fuel cell technology. Yttrium is contained in the
electrolyte, and electrodes with mischmetal containing rare earths might improve their
performance and reduce their costs (BGS 2010). There is also research on fuel cells for
electric vehicles which could operate without the expensive platinum or palladium
catalysts. The research also explores the incorporation of mischmetal containing rare
earths in this context (BGS 2010).
The share of the global applications of metal alloys and batteries in the total rare earth
demand is around 18 % in terms of volume. The global share of economical value is lower at
around 14 %. Figure 19 on China shows a higher share of volume for H2-storage (9 %) and
for metallurgy (15 %). In this data the use of rare earths in Ni-MH batteries is integrated in
the data for H2-storage.
Study on Rare Earths and Their Recycling
78
8.4.1 Ni-MH batteries
Ni-MH batteries are used in hybrid electric vehicles and in portable appliances. Besides
nickel and cobalt, they contain a mix of lanthanum, cerium, neodymium and praseodymium.
This mix is also called “mischmetal”.
Pillot (2009) estimates that in 2009 the hybrid electric vehicles already had a larger share
(57 %) in the total Ni-MH battery market in terms of value than the other applications (43 %).
Since the HEV market is nascent, it could be expected that the demand for Ni-MH batteries
will be dominated by the development of the HEV market in the years ahead. The resulting
rare earth demand depends on several factors:
The specific rare earth demand for a Ni-MH battery.
The growth rate of hybrid electric vehicle market.
The applied battery system is of high relevance as the alternative battery system – Li-ion
batteries – use currently no or just small amounts of rare earths.
The analysis conducted by Öko-Institut on the basic assumptions of published forecasts
(Oakdene Hollins 2010, Kingsnorth 2010, GWMG 2010b, BGR 2009, BGS 2010, Lynas
2009) shows that the demand for rare earths arising for Ni-MH batteries in hybrid electric
vehicles is widely overestimated in literature and information distributed on the internet.
These overestimates are based on assumptions regarding the rare earth content of the
Toyota Prius battery. Former estimates provided by Lifton (cited in Oakdene Hollins 2010)
and Kingsnorth (2008) range from 10 to 15 kg of lanthanum for one Prius battery. Latest data
from Öko-Institut (Buchert 2010) base on a life cycle assessment for Ni-MH batteries for
hybrid electric vehicles based on data from Toyota. These data indicate that the battery of
Prius II has a REO content of 2.9 kg per battery14. This implies an overestimate by the factor
4 in most published forecasts.
The growth rate for the sales of HEVs has already been discussed in Chapter 8.2.1, which
analysed the rare earth demand of motors of HEV. The figures there illustrated the wide
range of different scenarios based on technical, economical and political developments in the
field of e-mobility in the years ahead.
The share of Ni-MH batteries in terms of the total hybrid electric vehicle batteries is currently
very high because the market is dominated by the Toyota Prius, which is equipped with a Ni-
MH battery. In 2008, the Prius had a market share of HEVs amounting to approx. 83 %.
However, in the long term, Li-ion batteries will replace Ni-MH batteries due to several
advantages described in Chapter 10.5, where the substitution of rare earth elements is
analysed. Other manufactures will start producing HEVs with Li-ion batteries and Toyota
14 The Prius battery has a weight of 35 kg and a share of 7 % of the rare metals. This makes a weight of 2.45 kg
rare earth per car battery (corresponding to 2.9 kg REO).
Study on Rare Earths and Their Recycling
79
announced that it will launch a newly developed Prius hybrid minivan with a lithium battery in
2011 (Reuters 2010b). The large Chinese market for e-bikes mainly operates with lead
batteries.
8.4.2 Other appliances
There are no forecasts for the future growth of other applications such as pyrophoric alloys,
alloys for casting, metallic super alloys and the solid state storage of hydrogen. It is to be
assumed that the growth rates will not be smaller than the growth rates of the steel industry.
Its growth is estimated at 5.3 % for 2011 (Worldsteel 2010).
8.4.3 Overall forecast
Kingsnorth (2010) estimates a rare earth demand in the field of metal alloys and batteries of
43 – 47 000 t REO in 2014, compared to a demand of 22 500 t REO in 2008. The average
growth rate is given as between 15 % and 20 %. Possibly, this forecast and other demand
analyses (Oakdene Hollins 2010, GWMG 2010b, BGR 2009 and Lynas 2010) contain
overestimations due to the specific rare earth demand of Ni-MH batteries being set too high.
8.5 Catalysts
The rare earths cerium and lanthanum are widely used for catalysts. Cerium compounds are
used in automotive catalysts and as diesel additives in order to improve a clean combustion.
Lanthanum and cerium are important in the petroleum refining as fluid cracking catalysts
(FCC). Further applications are used in chemical processing. The demand for rare earth as
catalysts contributes to the total rare earth demand, constituting 20 % in terms of volume
according to estimates of Kingsnorth (2009). Relatively low prices of lanthanum and cerium
lead to a low share of value accounting for just 5 % in 2008 (Kingsnorth 2009). Nevertheless,
these applications are highly relevant in terms of emission reduction, energy efficiency and
the reduction of embedded precious metals (platinum, palladium and rhodium) in the
catalysts due to an increased catalyst performance.
For the future, a further increase in the demand could be expected as the global stock of fuel
driven vehicles increase steadily at approximately 3 % per year. Thus, the demand for
automotive catalysts will grow as well as the demand for petroleum.
BBC Research (2010) forecasts an annual growth rate of 6 % for environmental catalysts.
Kingsnorth (2010) forecasts an annual growth rate of 3 -5 % for all catalysts containing rare
earths. Thus, he expects an increase in demand from about 25 000 t REO in 2008 to
30 - 33 000 t REO in 2014.
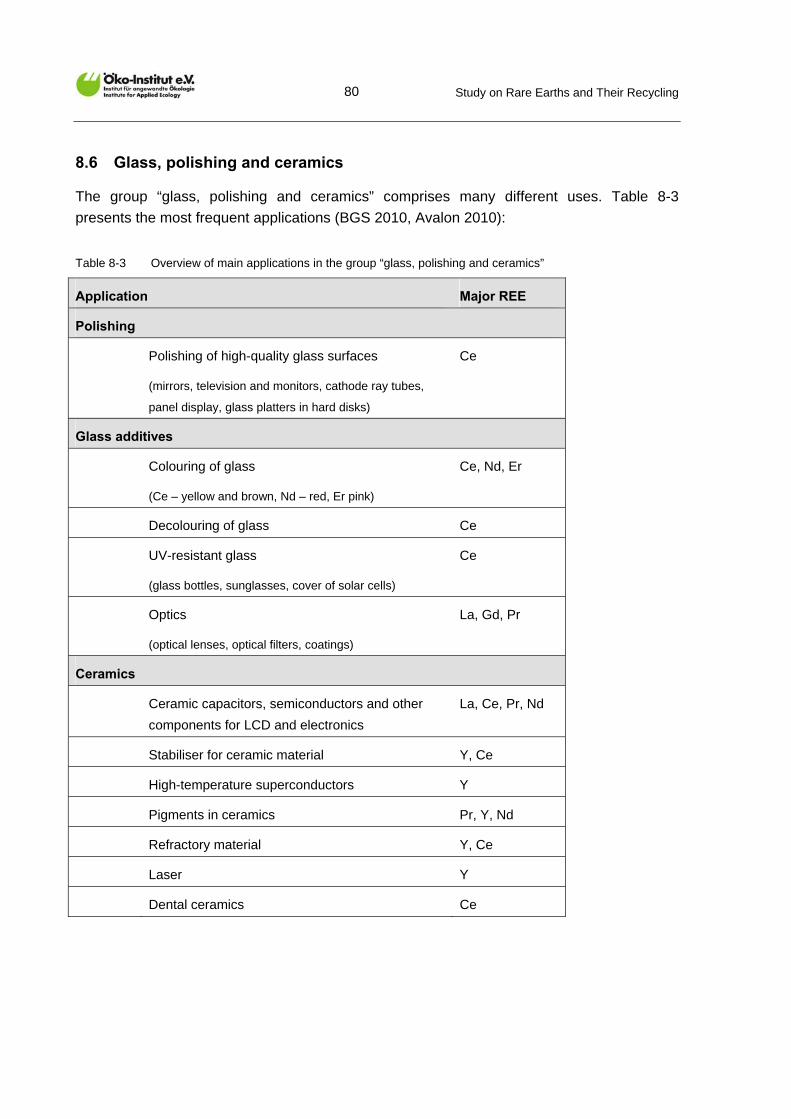
Study on Rare Earths and Their Recycling
80
8.6 Glass, polishing and ceramics
The group “glass, polishing and ceramics” comprises many different uses. Table 8-3
presents the most frequent applications (BGS 2010, Avalon 2010):
Table 8-3 Overview of main applications in the group “glass, polishing and ceramics”
Application Major REE
Polishing
Polishing of high-quality glass surfaces
(mirrors, television and monitors, cathode ray tubes,
panel display, glass platters in hard disks)
Ce
Glass additives
Colouring of glass
(Ce – yellow and brown, Nd – red, Er pink)
Ce, Nd, Er
Decolouring of glass Ce
UV-resistant glass
(glass bottles, sunglasses, cover of solar cells)
Ce
Optics
(optical lenses, optical filters, coatings)
La, Gd, Pr
Ceramics
Ceramic capacitors, semiconductors and other
components for LCD and electronics
La, Ce, Pr, Nd
Stabiliser for ceramic material Y, Ce
High-temperature superconductors Y
Pigments in ceramics Pr, Y, Nd
Refractory material Y, Ce
Laser Y
Dental ceramics Ce
Study on Rare Earths and Their Recycling
81
The applications described have a high share of the total rare earth demand of about 30 % in
terms of volume according the estimate from Kingsnorth (2010). Due to the manifold use of
quite cheap cerium, the share of economical value was much lower at 9 % (estimated from
Kingsnorth 2010).
Kingsnorth (2010) also gives more detailed estimates on the sectors for 2008:
Glass polishing 15 000 t REO (44 %)
Glass additives 12 000 t REO (35 %)
Ceramics 7 000 t REO (21 %)
Compared to the global demand, the consumption in China is comparably low, totaling 7 160
t. It is likely that a high share of rare earths for these applications is used in Japan. The
Japanese New Energy and Industrial Technology Development Organization (NEDO 2009)
states that Japan is the world’s leading consumer of cerium, and more than the half of
demand is for abrasives. The main uses here are flat panel display for TV sets and hard
disks in computers.
Angerer et al (2009) analyse an upcoming application: the use of yttrium-barium-copper-
oxide (YBCO) as high temperature super conductor of the second generation. Associated
advantages of this application are lower costs and a potentially higher performance. Angerer
et al (2009) estimate that commercial use will begin around 2013/2014 and assumes that this
application might transform the electricity industry significantly in the long term, coupled with
an increase of the yttrium demand for this field. However, Angerer et al (2009) estimate the
demand of super conductors for yttrium at only 75 t in 2030, which is very small compared to
the global yttrium production of almost 9 000 t in 2009 according to USGS (2010b).
Cerium-doped covers of solar cells absorb UV radiation. Thus, they prevent the darkening
due to UV radiation and increase the lifetime of the solar cells. Since these UV wavelengths
are not used by solar cells, their efficiency is not lowered (JDSU 2009, Messer 2009).
The growth rates for glass polishing is supposed to be in the range of the growth rates for
plasma and LCD displays and computers, which are around 14 and 16 %, respectively as
discussed in Chapter 8.2 and Chapter 8.3 (DisplaySearch 2010, Gartner 2010). The growth
rate of ceramic application might be in the range of the growth of electronics, which is
estimated by the industry research firm RNCOS (Daily News 2010) at 5 % for 2010 - 2013.
Kingsnorth (2010) estimates an increase in the demand of the whole application group of
less than 5 %. Hereby, he expects almost no growth for glass additives and moderate growth
rates for polishing and ceramics (estimates vary from 2 - 4 % to 6 - 7 %). Possibly, this is an
underestimation of the potential demand increase triggered by the booming markets of PCs
and flat screens for computers and TV sets.
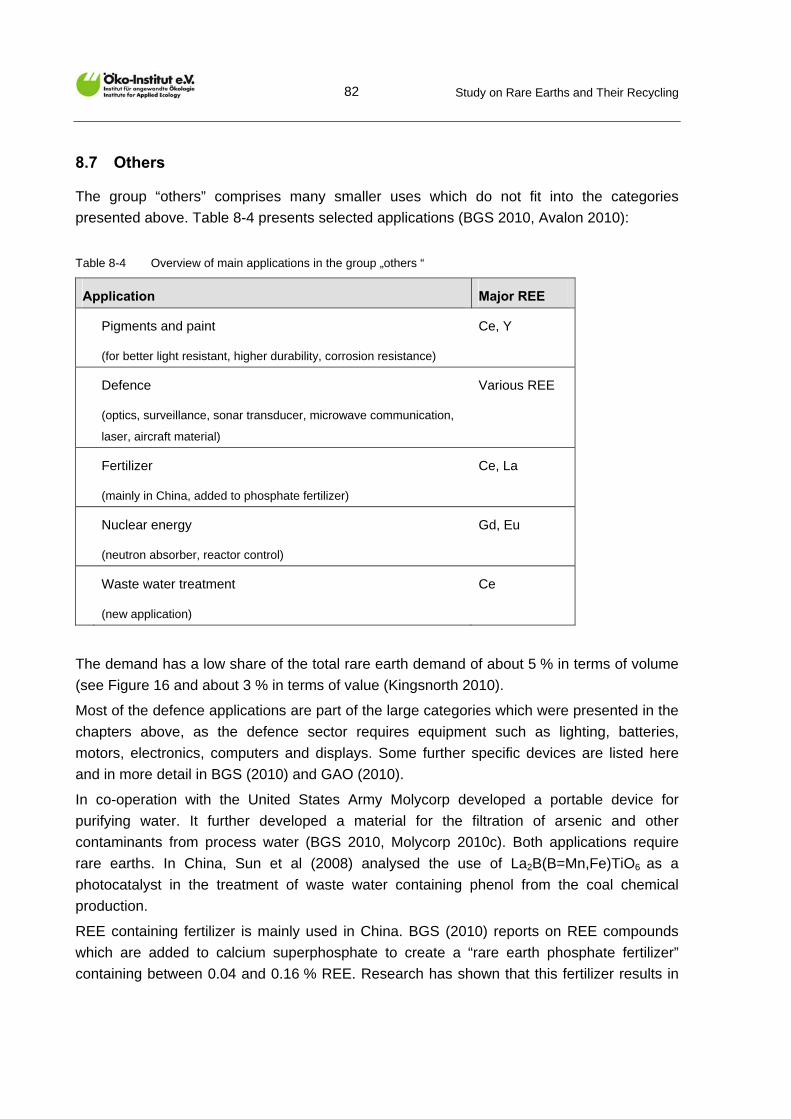
Study on Rare Earths and Their Recycling
82
8.7 Others
The group “others” comprises many smaller uses which do not fit into the categories
presented above. Table 8-4 presents selected applications (BGS 2010, Avalon 2010):
Table 8-4 Overview of main applications in the group „others “
Application Major REE
Pigments and paint
(for better light resistant, higher durability, corrosion resistance)
Ce, Y
Defence
(optics, surveillance, sonar transducer, microwave communication,
laser, aircraft material)
Various REE
Fertilizer
(mainly in China, added to phosphate fertilizer)
Ce, La
Nuclear energy
(neutron absorber, reactor control)
Gd, Eu
Waste water treatment
(new application)
Ce
The demand has a low share of the total rare earth demand of about 5 % in terms of volume
(see Figure 16 and about 3 % in terms of value (Kingsnorth 2010).
Most of the defence applications are part of the large categories which were presented in the
chapters above, as the defence sector requires equipment such as lighting, batteries,
motors, electronics, computers and displays. Some further specific devices are listed here
and in more detail in BGS (2010) and GAO (2010).
In co-operation with the United States Army Molycorp developed a portable device for
purifying water. It further developed a material for the filtration of arsenic and other
contaminants from process water (BGS 2010, Molycorp 2010c). Both applications require
rare earths. In China, Sun et al (2008) analysed the use of La2B(B=Mn,Fe)TiO6 as a
photocatalyst in the treatment of waste water containing phenol from the coal chemical
production.
REE containing fertilizer is mainly used in China. BGS (2010) reports on REE compounds
which are added to calcium superphosphate to create a “rare earth phosphate fertilizer”
containing between 0.04 and 0.16 % REE. Research has shown that this fertilizer results in
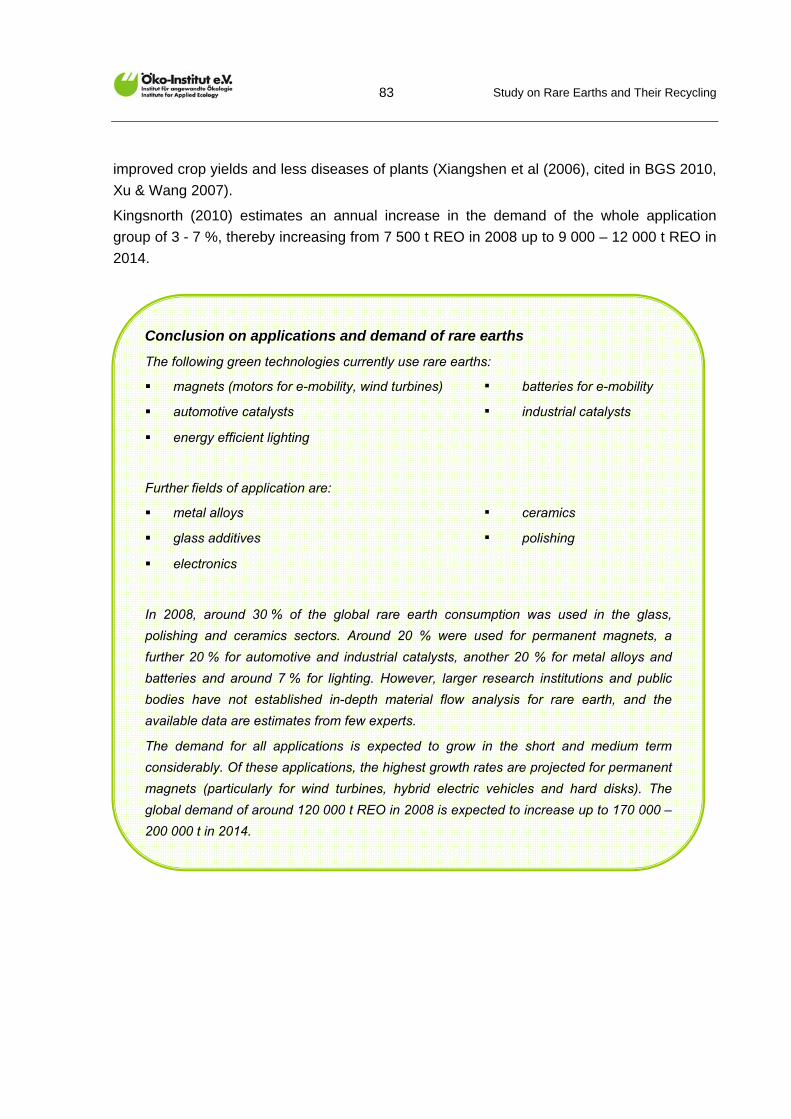
Study on Rare Earths and Their Recycling
83
improved crop yields and less diseases of plants (Xiangshen et al (2006), cited in BGS 2010,
Xu & Wang 2007).
Kingsnorth (2010) estimates an annual increase in the demand of the whole application
group of 3 - 7 %, thereby increasing from 7 500 t REO in 2008 up to 9 000 – 12 000 t REO in
2014.
Conclusion on applications and demand of rare earths
The following green technologies currently use rare earths:
magnets (motors for e-mobility, wind turbines) ▪ batteries for e-mobility
automotive catalysts ▪ industrial catalysts
energy efficient lighting
Further fields of application are:
metal alloys ▪ ceramics
glass additives ▪ polishing
electronics
In 2008, around 30 % of the global rare earth consumption was used in the glass,
polishing and ceramics sectors. Around 20 % were used for permanent magnets, a
further 20 % for automotive and industrial catalysts, another 20 % for metal alloys and
batteries and around 7 % for lighting. However, larger research institutions and public
bodies have not established in-depth material flow analysis for rare earth, and the
available data are estimates from few experts.
The demand for all applications is expected to grow in the short and medium term
considerably. Of these applications, the highest growth rates are projected for permanent
magnets (particularly for wind turbines, hybrid electric vehicles and hard disks). The
global demand of around 120 000 t REO in 2008 is expected to increase up to 170 000 –
200 000 t in 2014.
Study on Rare Earths and Their Recycling
84
9 Demand-supply balance
The supply risk of individual rare earths is indicated by the development of the future
demand-supply balance. Most of the available forecasts refer to the year 2014 which is also
used as a target year within this study.
In the following, the future demand and supply of the most relevant 11 REE are examined.
For the group of holmium, thulium, ytterbium and lutetium, only aggregated data are
available. Due to their limited supply (~ probably < 1 000 t/a), they are not yet significant. No
data are given on promethium which is radioactive and therefore has only limited
applications. Brief information is provided on scandium, which is produced in extremely low
amounts (approx. 5 t annually), in Chapter 8.4 on page 77. A supply shortage is not to be
expected for scandium according to the German Federal Institute for Geosciences and
Natural Resources (BGR 2010a).
9.1 Future supply
The future supply depends on some key factors:
development of the total Chinese REO production,
development of the Chinese export quota,
progress in installation works for Mountain Pass (USA) and Mt Weld (Australia),
progress of other mining projects (approval, feasibility studies, construction work).
The development of the total Chinese production and the progress of mining projects outside
of China are discussed in the following paragraphs. The relevance of Chinese export quotas
and the progress of the advanced mining projects Mountain Pass and Mt Weld concerning
the demand-supply balance are further discussed in Chapter 9.3.
Future supply by China
The total Chinese production in 2008 and 2009 amounted to approx. 120 000 t REO
according to USGS (2010). Chinese data sources cited in the Explanation of Compiling of
Entry Criterions for Rare Earth Industry 2010 specify a production of 120 800 t REO in 2007.
In contrast, Kingsnorth (2010) estimates a legal production of 125 – 140 000 t REO in the
years 2006 and 2008. In addition to these quantities of legal production, there are around 20
000 t REO which were produced illegally and seem not to be included in these data. The
comparison of these figures shows that there are no accurate data on the current situation,
particularly due to a relevant quantity of illegal production.
In the light of the Chinese 2009-2015 plan mentioned in Chapter 5.1.2, it is to be assumed
that China’s rare earth industry will undergo a phase of consolidation and will not significantly
increase their REO production. This is in accordance with Lynas (2010a) which forecasts a
Chinese production of 114 000 t in 2014, with 110 000 t coming from primary mining and a
Study on Rare Earths and Their Recycling
85
further 4 000 t coming from recycling. In contrast, Kingsnorth (2010) estimates a higher
Chinese production of 160 – 170 000 t REO in 2014 without recycling. This constitutes a
significant difference of 50 000 – 60 000 t REO in the forecast of the Chinese REO
production.
The forecasted production of rare earths from the Chinese ion adsorption deposits containing
HREE makes for a more uniform picture. Chinese data sources (MEP 2009) specify a
production of 45 000 t REO in 2007. Kingsnorth (2010) similarly estimates a Chinese
production of 40 - 50 000 t REO in 2014, whereas Lynas (2010a) assumes a lower
production of only 30 000 t REO. The main conclusion derived from these figures is that the
Chinese HREE production will probably not rise and eventually even decrease.
Future supply outside of China
Table 4-3 on page 22 provides an overview of current mining activities. Despite the high
number of intended mining projects, only two of them are sufficiently advanced to have
obtained approval from the authorities and construction work has begun: Mountain Pass in
California, USA and Mt Weld in Australia. The processing for the latter is located in Malaysia.
Their nominal capacity is an output of 20 000 t REO for each location, respectively.
Operation shall commence in 2011 in Australia/Malaysia and in 2012 in California. It is
uncertain whether the mineral companies will succeed in operating their plants at full load in
a short term because the chemistry of rare earth processing and refining is very complex.
Lynas (2010a) further assumes that India and Russia might be able to increase their
capacities up to 12 000 t in 2014, and estimates secondary rare earths from recycling of
almost 2000 t in 2014.
Neither Kingsnorth (2010) nor Lynas (2010a) expect the opening of further mines with larger
capacities until 2014, except for India and Russia. This is in accordance with Table 4-3 on
page 22 which was compiled by Öko-Institut and shows that the listed mines (besides
Mountain Pass and Mt Weld) have reached the stage of feasibility studies or drillings. From
this point, it will take some years before mining and processing on an industrial scale can
take place. More details on the time frames needed were presented in Chapter 4.3 on page
20.
Global supply forecast
Table 9-1 presents the forecasts from Kingsnorth (2010) and Lynas (2010a) and their
estimated production for individual rare earths. The forecast of Kingsnorth (2010) is
supplemented by other figures from Kingsnorth which are cited in Oakdene Hollins 2010. As
mentioned above, both forecasts assume that Mountain Pass and Mt Weld commence
operation before 2014, and that - besides the consideration of Russian and Indian mines in
the Lynas forecast - no other mining and processing projects will be ready for production until

Study on Rare Earths and Their Recycling
86
2014. The main difference is the estimate of the future mining in China. Additionally, both
forecasts do not include the illegally mined quantities. This is reasonable as the Chinese
government intends to control the rare earth industry more strictly and prevent illegal mining.
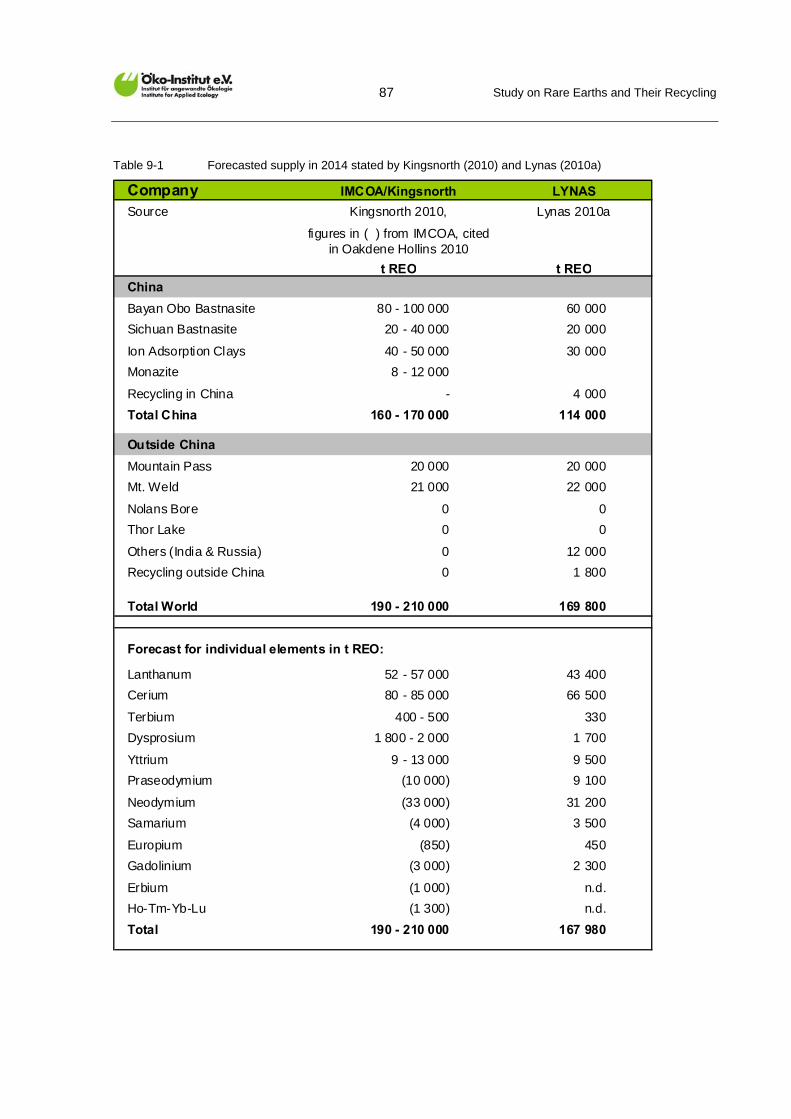
Study on Rare Earths and Their Recycling
87
Table 9-1 Forecasted supply in 2014 stated by Kingsnorth (2010) and Lynas (2010a)
Company IMCOA/Kingsnorth LYNAS
Source Kingsnorth 2010, Lynas 2010a
figures in ( ) from IMCOA, cited in Oakdene Hollins 2010
t REO t REO
China
Bayan Obo Bastnasite 80 - 100 000 60 000
Sichuan Bastnasite 20 - 40 000 20 000
Ion Adsorption Clays 40 - 50 000 30 000
Monazite 8 - 12 000
Recycling in China - 4 000
Total China 160 - 170 000 114 000
Outside China
Mountain Pass 20 000 20 000
Mt. Weld 21 000 22 000
Nolans Bore 0 0
Thor Lake 0 0
Others (India & Russia) 0 12 000
Recycling outside China 0 1 800
Total World 190 - 210 000 169 800
Forecast for individual elements in t REO:
Lanthanum 52 - 57 000 43 400
Cerium 80 - 85 000 66 500
Terbium 400 - 500 330
Dysprosium 1 800 - 2 000 1 700
Yttrium 9 - 13 000 9 500
Praseodymium (10 000) 9 100
Neodymium (33 000) 31 200
Samarium (4 000) 3 500
Europium (850) 450
Gadolinium (3 000) 2 300
Erbium (1 000) n.d.
Ho-Tm-Yb-Lu (1 300) n.d.
Total 190 - 210 000 167 980
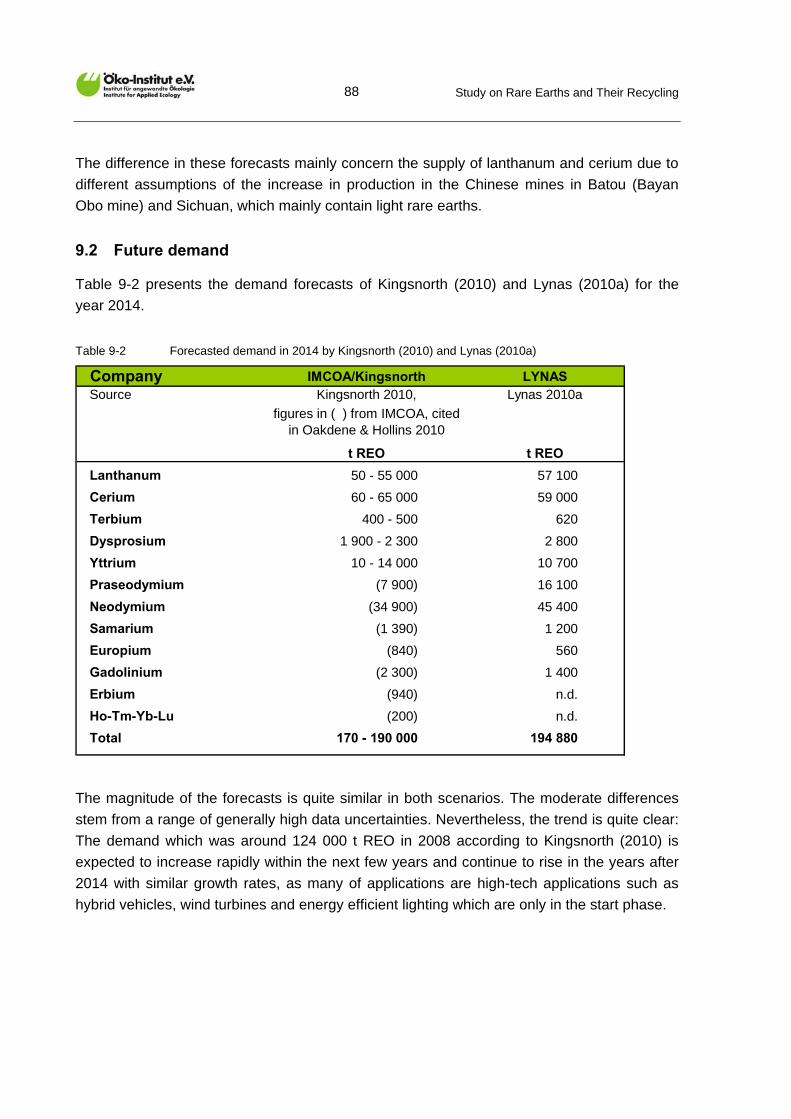
Study on Rare Earths and Their Recycling
88
The difference in these forecasts mainly concern the supply of lanthanum and cerium due to
different assumptions of the increase in production in the Chinese mines in Batou (Bayan
Obo mine) and Sichuan, which mainly contain light rare earths.
9.2 Future demand
Table 9-2 presents the demand forecasts of Kingsnorth (2010) and Lynas (2010a) for the
year 2014.
Table 9-2 Forecasted demand in 2014 by Kingsnorth (2010) and Lynas (2010a)
Company IMCOA/Kingsnorth LYNASSource Kingsnorth 2010, Lynas 2010a
figures in ( ) from IMCOA, cited in Oakdene & Hollins 2010
t REO t REO
Lanthanum 50 - 55 000 57 100
Cerium 60 - 65 000 59 000
Terbium 400 - 500 620
Dysprosium 1 900 - 2 300 2 800
Yttrium 10 - 14 000 10 700
Praseodymium (7 900) 16 100
Neodymium (34 900) 45 400
Samarium (1 390) 1 200
Europium (840) 560
Gadolinium (2 300) 1 400
Erbium (940) n.d.
Ho-Tm-Yb-Lu (200) n.d.
Total 170 - 190 000 194 880
The magnitude of the forecasts is quite similar in both scenarios. The moderate differences
stem from a range of generally high data uncertainties. Nevertheless, the trend is quite clear:
The demand which was around 124 000 t REO in 2008 according to Kingsnorth (2010) is
expected to increase rapidly within the next few years and continue to rise in the years after
2014 with similar growth rates, as many of applications are high-tech applications such as
hybrid vehicles, wind turbines and energy efficient lighting which are only in the start phase.
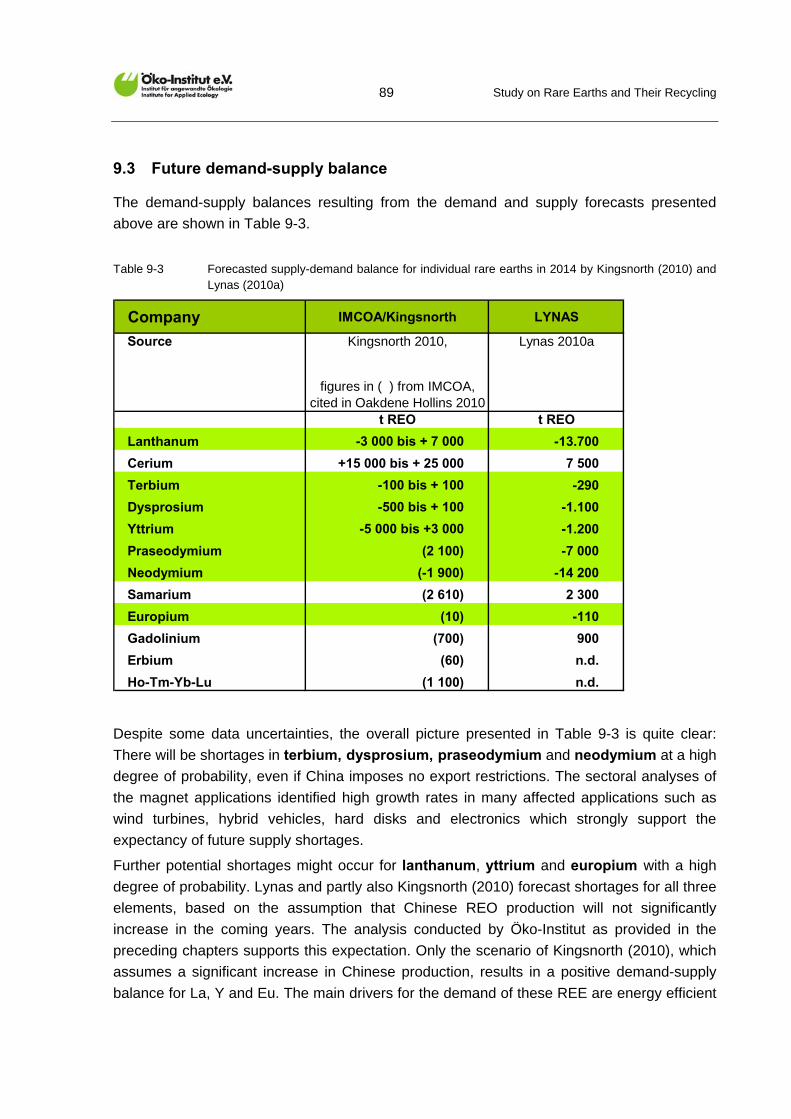
Study on Rare Earths and Their Recycling
89
9.3 Future demand-supply balance
The demand-supply balances resulting from the demand and supply forecasts presented
above are shown in Table 9-3.
Table 9-3 Forecasted supply-demand balance for individual rare earths in 2014 by Kingsnorth (2010) and Lynas (2010a)
Company IMCOA/Kingsnorth LYNAS
Source Kingsnorth 2010, Lynas 2010a
figures in ( ) from IMCOA, cited in Oakdene Hollins 2010
t REO t REO
Lanthanum -3 000 bis + 7 000 -13.700
Cerium +15 000 bis + 25 000 7 500
Terbium -100 bis + 100 -290
Dysprosium -500 bis + 100 -1.100
Yttrium -5 000 bis +3 000 -1.200
Praseodymium (2 100) -7 000
Neodymium (-1 900) -14 200
Samarium (2 610) 2 300
Europium (10) -110
Gadolinium (700) 900
Erbium (60) n.d.
Ho-Tm-Yb-Lu (1 100) n.d.
Despite some data uncertainties, the overall picture presented in Table 9-3 is quite clear:
There will be shortages in terbium, dysprosium, praseodymium and neodymium at a high
degree of probability, even if China imposes no export restrictions. The sectoral analyses of
the magnet applications identified high growth rates in many affected applications such as
wind turbines, hybrid vehicles, hard disks and electronics which strongly support the
expectancy of future supply shortages.
Further potential shortages might occur for lanthanum, yttrium and europium with a high
degree of probability. Lynas and partly also Kingsnorth (2010) forecast shortages for all three
elements, based on the assumption that Chinese REO production will not significantly
increase in the coming years. The analysis conducted by Öko-Institut as provided in the
preceding chapters supports this expectation. Only the scenario of Kingsnorth (2010), which
assumes a significant increase in Chinese production, results in a positive demand-supply
balance for La, Y and Eu. The main drivers for the demand of these REE are energy efficient
Study on Rare Earths and Their Recycling
90
lighting (La, Y and Eu), catalysts (La), ferrite magnets (La), Ni-MH batteries (La) and
ceramics (Y).
The supply risk for the HREE terbium and dysprosium seems to be the highest, as the
Mountain Pass and Mt Weld mines will not produce relevant amounts of these metals; and
potential Chinese supply constraints regarding HREE cannot be compensated by relevant
production capacities outside of China. Furthermore, China will probably not increase its
HREE production in the next few years, though the global demand increases steeply.
A relevant supply risk of the LREE neodymium and praseodymium is the complex processing
technology required for rare earths refining which might lead to delays in implementation in
California and Malaysia.
The negative supply-demand balance after 2014 might be attenuated, if further mines
besides Mountain Pass and Mt Weld start production of HREE and LREE, significant
improvements in resource efficiency are implemented (particularly increasing the recovery
rates in the rare earth mining and reduction of production losses in the magnet production)
and relevant substitutions are realised. Furthermore, efficient recycling systems are required.
These issues will be analysed in more depth in Chapter 10 and 11.
Another important issue is the high pressure on the fast opening of new mines from
manufactures which require rare earths for their finished goods, coupled with the expectation
of investors to make profits with rare earth production as long as possible supply shortages
exist. This situation might lead to the rapid opening of new mines with inadequate
environmental standards. Chapter 7 illustrated clearly the environmental burdens of mines
and processing plants which are poorly designed or managed. National authorities, investors
and mining operators are asked to act responsibly in designing and operating these plants in
order to develop a sustainable rare earth industry. This is particularly true as appropriate
environmental technologies are available and awaiting application.
The U.S. Department of Energy published in December 2010 an analysis of the criticality of
selected rare metals (DOE 2010). The highest criticality in terms of supply risk and the
importance to clean energy production are the five REE dysprosium, neodymium, terbium,
yttrium and europium, which are also seen as critical by Öko-Institut as outlined in the
paragraphs before. The element praseodymium is seen as less critical by DOE (2010)
though it is widely interchangeable with neodymium and is mostly used in neodymium /
praseodymium mixtures as it is found in mineral ores. The criticality of lanthanum is
estimated to be near-critical by DOE (2010) and as critical by Öko-Institut. Hereby, DOE
(2010) projects an additional supply of these elements not only from Mountain Pass and Mt.
Weld but also from five further new mines (Nolans Bore/Australia, Nechalacho/Canada,
Dong Pao/Vietnam, Hoidas Lake/Canada and Dubbo Zirconia/Australia) up to 2015.
Considering the long time spans needed to develop new mining projects including the further
rare earth processing, this forecast seems to be quite optimistic. However, apart from the
Study on Rare Earths and Their Recycling
91
evaluation of the speed progress of new mining projects, the assessment of Öko-Institut and
DOE (2010) show a broad consensus.
Finally, potential supply shortages for “green” applications are summarised in brief:
There will be shortages of rare earths for the production of permanent magnets in the
short term, with a high degree of probability. The relevant elements are terbium,
dysprosium, praseodymium and neodymium and the applications wind turbines, hybrid
vehicles and electric vehicles are concerned. However, there are options for their
substitution which are discussed in Chapter 10.2.
The production of Ni-MH batteries for hybrid vehicles might become limited due to
shortages in neodymium and lanthanum. This will probably lead to an accelerated
substitution of Ni-MH batteries by Li-ion batteries.
There will be shortages of rare earths for the production of lighting devices in the short
term, with a high degree of probability. Significant shortages are to be expected for
europium and terbium. Furthermore, the supply with yttrium and lanthanum might also
become scarce. Relevant applications are energy efficient lighting such as compact
fluorescent lamps, fluorescent tubes, LED, plasma and LCD displays. An additional supply
risk for most of these applications is the lack of adequate substitutes for many phosphors
in the short term (see Chapter 10.5).
Catalysts in refining and processing might suffer from a lanthanum shortage. Here
again, no substitutions are available in the short term.
Future new technologies such as magnetic cooling, wind turbines with high-temperature
superconductors (containing yttrium) and efficient and cost efficient fuel cells (containing
yttrium and mischmetal) might suffer from supply constraints slowing down their future
dissemination.
The compilation shows that most green applications listed above are closely related to
climate protection and reduction of the depletion of non-renewable energy carriers. They
contribute to a more efficient use of energy or to energy production by renewable energy
sources. This applies to motors and batteries for hybrid vehicles and electric vehicles, energy
efficient lighting, wind turbines, magnetic cooling and fuel cells. Additionally, catalysts
contribute significantly to the enhancement of process efficiencies and the prevention of air
pollution.
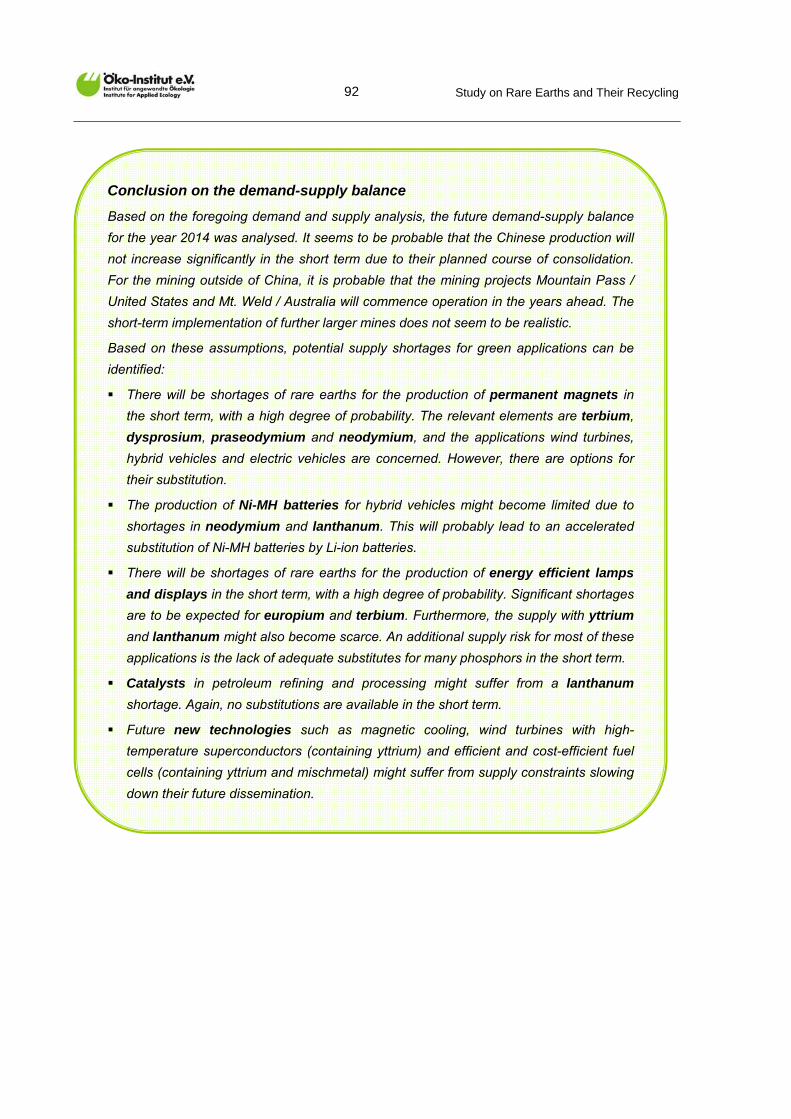
Study on Rare Earths and Their Recycling
92
Conclusion on the demand-supply balance
Based on the foregoing demand and supply analysis, the future demand-supply balance
for the year 2014 was analysed. It seems to be probable that the Chinese production will
not increase significantly in the short term due to their planned course of consolidation.
For the mining outside of China, it is probable that the mining projects Mountain Pass /
United States and Mt. Weld / Australia will commence operation in the years ahead. The
short-term implementation of further larger mines does not seem to be realistic.
Based on these assumptions, potential supply shortages for green applications can be
identified:
There will be shortages of rare earths for the production of permanent magnets in
the short term, with a high degree of probability. The relevant elements are terbium,
dysprosium, praseodymium and neodymium, and the applications wind turbines,
hybrid vehicles and electric vehicles are concerned. However, there are options for
their substitution.
The production of Ni-MH batteries for hybrid vehicles might become limited due to
shortages in neodymium and lanthanum. This will probably lead to an accelerated
substitution of Ni-MH batteries by Li-ion batteries.
There will be shortages of rare earths for the production of energy efficient lamps
and displays in the short term, with a high degree of probability. Significant shortages
are to be expected for europium and terbium. Furthermore, the supply with yttrium
and lanthanum might also become scarce. An additional supply risk for most of these
applications is the lack of adequate substitutes for many phosphors in the short term.
Catalysts in petroleum refining and processing might suffer from a lanthanum
shortage. Again, no substitutions are available in the short term.
Future new technologies such as magnetic cooling, wind turbines with high-
temperature superconductors (containing yttrium) and efficient and cost-efficient fuel
cells (containing yttrium and mischmetal) might suffer from supply constraints slowing
down their future dissemination.
Study on Rare Earths and Their Recycling
93
10 Substitution and efficient use of rare earths Company Project Location Cut-off Contained REO Production Start-up
10.1 Overview
Facing possible scarcities of natural resources and the challenge to search alternatives for
substitution, there are two options in principle: substitution of the REE by another material or
another design approach of the products or their applications. The analysis of substitutions
for scarce REE has shown that a simple substitution of a REE compound by another
compound is a quite rare case. In most cases substitution requires a totally new product
design. The following sub-chapters describe the options for substitution concerning the main
fields of applications: motors/generators, magnets in electronic devices, batteries,
lighting/luminescence and catalysts.
10.2 Magnets for motors and generators
10.2.1 Motor and generator types
In this sub-chapter a short description of the current relevant motor and generator types is
given. An overview of these technologies is required to understand the substitution potentials
of rare earths.
State of the art for electric motors for e-mobility:
Synchronous electric motor with a neodymium magnet:
Currently the motor type with the highest efficiency!
Use in most electric vehicles, e.g. from Toyota, Mercedes, Honda and BMW,
Increasing use in high performance generator of wind turbines (market share about
14 % according to Fairley (2010)),
Compact size,
Expensive.
Asynchronous motor
Mostly used motor in industrial appliances; produced in high quantities,
Use in some electric vehicles, e.g. Fiat Seicento Electra, Ford E-Ka,
Good efficiency at nominal load, low efficiency at some operations conditions,
Low costs,
No need for neodymium,
Study on Rare Earths and Their Recycling
94
Simple construction,
Lower efficiency and bigger size than motors with neodymium magnets.
Alternatives:
Synchronous motor with electromagnets (external excitation)
No need for rare earths,
Higher copper demand than permanent magnet motors (factor 3),
Broader realisation possible in the short term or the medium term,
Conti is developing such a motor for a power range of 5 to 120 kW.
Permanent magnet motor with a SmCo magnet (synchronous motor)
SmCo (Samarium-Cobalt) magnets are the first generation in the family of rare earth
magnets, NdFeB magnets belong to the second generation,
These motors were used for high-performance applications before the construction of
motors with neodymium magnets,
Due to their high costs their application is restricted. With increasing Nd-prices they
might become competitive,
SmCo magnets have a much higher magnetic energy product than ferrite, but lower
than that of neodymium magnets,
They can operate at higher temperatures than NdFeB-magnets (Hatch 2010).
Permanent magnet motor with ferrite magnet (synchronous motor)
Lower magnetic properties (factor 4), therefore more volume und more weight
(Benecki 2007),
Lower efficiency – there are R&D activities for higher efficiencies, e.g. (Fang et al.
2009),
Lower price,
R&D project in Japan (Kudling 2010).
Reluctance motors
Technical advantages and disadvantages according to Matoy (2008):
Simple and robust construction,
Noise problems (loud)!
Low price,
Study on Rare Earths and Their Recycling
95
Due to serious noise development no application in electric vehicles or wind turbines.
Hybrid motors (combination of permanent magnet and reluctance motor)
Technical advantages and disadvantages according to Matoy (2008):
Combines the advantages of both motor types,
Needs less neodymium than the permanent motor,
High potential for the future!
Still in the R&D phase.
10.2.2 Substitution of rare earths magnets in motors for electric vehicles
The analysis of the different motor types shows that there are alternatives to permanent
magnet motors containing rare earths. There are asynchronous motors which are currently
used in electric vehicles (e.g. Fiat Seicento Electra, Ford E-Ka). Generally, asynchronous
motors are the most widely used motor type, and though they are less compact and less
efficient in some operation conditions than the permanent motors, they also show
advantages such as simple construction methods and low costs. They are an alternative, at
least in mild hybrid vehicles. Therefore, the German government has included the research
on asynchronous motors in its national development plan for e-mobility (Bundesregierung
2009).
Besides the industrially available asynchronous motors, there are three other motor types
which show a potential to be an alternative to pure Nd-containing permanent motors:
The synchronous motor with electromagnets (external excitation). Broader realisation
seems to be possible for the short or medium term. Conti is currently developing a
motor for a power range of 5 to 120 kW.
A permanent magnet motor with ferrite magnet is currently under development in
Japan. The higher volume of the weaker ferrite magnet shall be compensated by
another geometrical arrangement.
Hybrid motors which are a combination of permanent magnet and reluctance motor
might show a promising potential for the use in electric vehicles. They need less
neodymium than the pure permanent magnet motors and tend to have a better
performance than the permanent magnet motors. The German government has
included the research on reluctance motors in its national development plan for e-
mobility (Bundesregierung 2009).
Study on Rare Earths and Their Recycling
96
10.2.3 Substitution of rare earths in generators for wind turbines
Currently, the global market share of wind turbines working with gear drive and
asynchronous or synchronous generators is 86 %. They work with electro magnets and thus
without permanent magnets and rare earths (Fairley 2010). There have been wind turbines
without gear drives (direct drive turbine) since 1991. They usually work with neodymium
containing permanent magnets. One of the advantages of these turbines is the absence of a
gear, which facilitate higher efficiencies and higher reliabilities. Furthermore, due to the
compact permanent magnet motor, the gearless wind turbines are lighter than the types
equipped with a gear drive. Therefore, they are an attractive option for offshore plants. But
also onshore plants are running without gears. The main obstacle for increasing market
shares of gearless wind turbines are the high costs for the permanent magnets.
The international market share of gearless wind turbines is estimated at 14 % (Fairley 2010).
However, in Germany the market share is already much higher; the company ENERCON,
which completely shifted to gearless drives, has a market share of around 50- 60 % (Kettwig
2009). The trend indicates that more and more companies are offering gearless turbines, and
large companies such as Siemens and General Electric are developing new gearless
turbines for the offshore applications.
There are manifold discussions about the future development of the market shares of
gearless drives. There are two key parameters: The first one is the question of how
successful the gears will be improved in order to achieve a higher reliability for conventional
turbines with gear drive technology. The second issue is the future development of the price
and the availability of the permanent magnets (rare earths!) which might inhibit future growth
rates of direct drive turbines.
If there are shortages in neodymium, the following alternatives could be drawn upon:
“Classic” wind turbine technology with gears for onshore and offshore plants. An
overview of the largest protoypes (year 2006) shows that four companies have
developed off-shore prototypes with gear and asynchronous generator for a capacity
of 4 – 5 MW (Koenemann & Tschierschke 2006).
Magnetic direct drive turbines with SmCo-magnets. However, SmCo-magnets are
quite expensive, and the resources are also limited.
Furthermore, a new technology based on high temperatures superconductor (HTS) rotors is
now under development. At the moment it is not yet clear whether this technology might be
able to replace the gearless wind turbines with Nd-magnets. However, following
announcements of the company AMSC (Terra Magnetica 2009, Fischer 2010), the design
and implementation of turbines with HTS technologies for plants with capacity of 10 MW and
more are planned. Currently, most off-shore turbines operate up to 5 MW. Nevertheless, the
Study on Rare Earths and Their Recycling
97
superconductors used for this technology also require a rare earth element – yttrium. The
basic HTS wire substrate is nickel tungsten. Various buffer layers are applied before the
superconductor — yttrium barium copper oxide — and a very thin cap layer of silver is also
applied. (Fischer 2010). The resource implications (yttrium, tungsten, silver etc.) of this new
technology have to be considered very carefully in the years ahead.
10.2.4 Substitution of dysprosium and terbium in permanent magnets
Most of the neodymium magnets consist of approximately 65 - 70% iron, 1 % bor, 30 % mix
of neodymium/praseodymium, 3 % dysprosium and sometimes terbium (Oakdene Hollins
2010). High-performance applications (e.g. e-mobility) may even need a higher share of
dysprosium.
The function of dysprosium is to enhance the coercivity (intensity of the applied magnetic
field required to reduce the magnetisation of that material to zero) and thus the temperature
tolerance, which is needed for applications with high temperatures such as motors or
generators (Oakdene Hollins 2010). The use of dysprosium also tends to improve the
corrosion resistance of the magnets (Avalon 2010).
The function of terbium is similar to that of dysprosium, but its use is limited to the very
scarce supply and the high price. One particular quality of terbium is that it has less impact
on the remanence (magnetisation left after an external magnetic field is removed, which
should be low in order to achieve a high performance) than dysprosium according to
Oakdene Hollins (2010).
Due to a forecasted supply shortage for dysprosium and terbium, industrial companies and
researchers are looking for alternatives, but there is no decisive solution in sight. The
following summarises different activities and options in this context:
Benecki (2009) assumes that “magnet producers will likely be forced to offer NdFeB
magnets with modified compositions, even if some performance is sacrificed. For
example, a reduction of dysprosium or terbium content could result in an Hci (coercivity)
reduction of 10-30%. Cost considerations may eventually dictate such compositional
changes for some applications.”
Discussions with European magnet experts have shown that there is no commercially
available substitute for dysprosium in neodymium magnets yet. An abandonment of
terbium seems feasible for most applications which require no extremely high
performance if the wider available dysprosium is applied to enhance the stability and the
performance.
Study on Rare Earths and Their Recycling
98
Furthermore, different research and development activities are being undertaken which focus
on a better performance of the neodymium magnets with less dysprosium and terbium
content than the current magnets. A research project of this kind is currently underway at St.
Pölten University of Applied Sciences (Austria), in cooperation with the University of Sheffield
(UK). The scientists are exploring the ideal composition and structure for high-performance
permanent magnets intended for use in hybrid and electric car motors—specifically, how the
proportion of dysprosium can be reduced without compromising the thermal stability of the
magnets. By optimising magnets, the researchers suggest, hybrid and electric cars can be
made economically competitive.
Another example is provided by Ames Laboratory, where researcher Bill McCallum is
investigating how to lower the rare-earth content in the permanent magnets used in the
traction motors of hybrid electric vehicles (Jenkins 2010).
Komuro et al. (2010) reports that effective processes have recently been developed to
reduce the amount of terbium by sputtering or vaporising techniques for magnets which have
a thickness of up to 10 mm. The terbium is diffused along grain boundaries in sintered
neodymium magnets. The condensed terbium atoms near grain boundaries increase the
coercivity without a large reduction of remanence. A new process for thicker magnets
whereby the surface of the magnet powder is coated before sintering is described by Komuro
et al (2010).
10.2.5 Substitution of neodymium magnets by SmCo magnets
The production of SmCo magnets is a difficult and expensive multi-step process. Therefore,
these magnets are only used in a small number of applications, and the majority of
permanent magnets are neodymium magnets. A substitution of neodymium magnets by
SmCo magnets is only an economically attractive alternative, if the SmCo magnets become
cheaper and/or the price of neodymium magnets rise.
Apart from the steep increase of Nd-prices in 2010, there are two developments which might
lead to SmCo magnets having a higher market share:
The Northeastern University (2008) presents a new one-step production process which
might result in much cheaper SmCo magnets: “Unlike the traditional multi-step
metallurgical techniques that provide limited control of the size and shape of the final
magnetic particles, the Northeastern scientists’ one-step method produces air-stable
“nanoblades” (elongated nanoparticles shaped like blades) that allow for a more efficient
assembly that may ultimately result in smaller and lighter magnets without sacrificing
performance.”
SmCo magnets need – in contrast to neodymium magnets – no coating. Therefore,
particularly small SmCo magnets might become economical if the neodymium prices
continue to rise. The reason is that the economical advantage of not coating the
Study on Rare Earths and Their Recycling
99
magnets is more relevant for small magnets as the costs of coating do not change much
when changing the size of the magnet (Trout 2007).
However, a substitution of neodymium magnets by SmCo magnets will be strongly limited
due to the resource limits of samarium. The samarium supply is estimated at 4 000 – 5 000 t
in 2012 whereas the neodymium supply is estimated at 30 000 – 40 000 t in 2012 (Oakdene
Hollins 2010). The rare earth breakdown of the minerals of mines in China, Australia,
Canada, United States and Greenland shows that all minerals contain significantly more
neodymium than samarium (Oakdene Hollins 2010). Thus, there is no potential for an
enhanced samarium supply which might be able to substitute a significant share of
neodymium. Additionally, the high costs and resource limits of cobalt contribute to the high
price of SmCo magnets (Co prices range from 30 – 130 $/kg in recent years15; annual
production in 2009 around 61.000 t) according to USGS (2010d).
Another drawback is the high environmental and social burden related to the cobalt mining in
Democratic Republic of the Congo where armed conflicts on resources take place. Around
40 % of the global cobalt production is currently mined in the Democratic Republic of the
Congo (USGS 2010g).
10.2.6 Substitution of rare earths demands by enhanced process efficiencies
According to Benecki (2007) there are actions that the magnet industry can take to address
rising REE prices. First, the classic Chinese production process of producing blocks of
NdFeB and then cutting them to the desired shape wastes tons of Nd and Pr each year. The
Chinese need to shift to “press to shape” manufacturing, the process that has been common
in Japan and the West for decades. The Chinese need to reduce the waste of precious rare
earth materials inherent in their traditional “slicing and dicing” process.
According to Bax & Willems (2010) nanocomposite magnets could constitute a new
generation of magnets; DOE (2010) sees nano-structured permanent magnets as one high-
priority research area. In this context, Öko-Institut proposes the incorporation of a case-
specific risk assessment in their development of all applications of nanotechnologies (Öko-
Institut 2007).
10.3 Magnets in electronic devices, mainly disk drives
Approximately one third of the neodymium magnets were used in hard disk drives in 2007,
and around 10 % of magnets were used in optical and acoustic devices (Oakdene Hollins
2010). In this application field they are used for small motors, writing/reading heads,
speakers and ear phones and sensors.
15 Compare with Nd-price in October 2010 of around 80 $/kg.
Study on Rare Earths and Their Recycling
100
Most hard disk drive systems currently use a voice-coil-motor (VCM) to actuate the read/write
recording arm assembly. This motor usually contains a neodymium magnet. In principle, hard
disk drives (HDD) with VCM can be substituted by a new generation of data storage devices,
the solid state drive (SSD). The SSD is a data storage device that uses solid-state memory
to store persistent data. It uses microchips and contains no moving parts. Compared to
traditional HDDs, SSDs are typically less susceptible to physical shock, quieter, and have
lower access time and latency. SSDs use the same interface as hard disk drives, thus easily
replacing them in most applications. SSDs are still significantly more expensive than HDDs,
but there are already some laptops working with SDD and more computer manufacturers are
beginning to offer SSDs. There is still a need for further research, but it is to be expected that
new developments will lead to lower prices and increasing performance, particularly in terms
of capacity, life time and safety (Marwan 2010). Benecki (2009) assumes that “as solid state
drive utilisation increases, their costs (and prices) will decline and they will gradually replace
the traditional magnet-consuming VCM we have taken for granted for so many years.
Shortages of rare earths would simply accelerate this transition.” However, it also seems
possible that both technologies, HDD and SDD, will co-exist in the medium term. There are
also hybrid drives commercially available which are a combination of a HDD and a SSD.
The partial substitution of dysprosium and terbium has already been discussed in chapter
10.2.4 (Substitution of dysprosium and terbium in permanent magnets). It is to be expected
that the substitution of Dy and Tb is easier in these small-size applications than in permanent
magnets for electric vehicles and generators, where operation temperatures are much
higher.
The substitution of neodymium magnets by SmCo magnets is discussed in chapter 10.2.5
(Substitution of neodymium magnets by SmCo magnets). Due to constraints in price and
availability, it will only be an option for a few sophisticated applications.
10.4 Batteries
Rare earths are used in Ni-MH batteries. Besides nickel and cobalt the MH-electrode
contains a mix of different rare earth elements. The mixture varies between the
manufacturers. Mostly, the main rare earths are lanthanum and cerium with additional input
of neodymium and praseodymium (Luidold 2010).
Ni-MH-batteries are used in portable appliances (e.g. power tools) and hybrid vehicles (HEV)
(e.g. Toyota Prius). Around 50% of the worldwide sales stem from use in HEV batteries.
The Ni-MH battery for hybrid vehicles is a mature technology and is used in the Toyota Prius
with more than 2 million sales. However, there is little room for further improvements in
energy power (limited energy and power density) and costs according to Bax & Willems
(2010) which refer to a study conducted by the Rocky Mountain Institute. The future battery
generations will be lithium-ion batteries. This trend is underlined by the fact that Toyota will
Study on Rare Earths and Their Recycling
101
start to equip the new Prius van with a lithium battery with a higher capacity in 2011. At the
same time, the German government has set up a national development plan for e-mobility
(Bundesregierung 2009). It also estimates that lithium-ion batteries have the highest potential
for future energy storage systems. Additionally ZEBRA (high temperature) batteries, redox-
flow and magnesium batteries and metal-air batteries might play an important role in the
future. Thus, the broader use of Ni-MH batteries for hybrid vehicles is expected to phase out
gradually. Pillot (2009) forecasts the market share of Li-ion batteries for HEV to rise to 35 %
in 2020 (35 % in the base scenario and 60 % in the optimistic scenario). In 2009 the market
share of Li-ion batteries for HEVs was approximately 2 %.
The trend for portable appliances is that Li-ion batteries gain increasing market shares.
They have already largely substituted Ni-MH batteries in laptops and mobile phones and
have relevant market shares in further applications such as cameras and power tools (ifeu /
Öko-Institut 2010).
In summary, it is expected that the market share of Li-ion batteries will significantly increase
in the years ahead. The use of Ni-MH batteries for HEV will phase out in the medium term.
The same trend is to expect for most portable appliances. A shortage in rare earth supply
might accelerate this development.
10.5 Lighting and luminescence
Phosphor materials emit light after absorption of energy. They are produced by dotting salt-
like host lattices with metal ions in small concentrations. The colour of the light essentially
depends on the properties of these metal ions, also called activators. As an example, in the
following some metal ions and their corresponding colours are listed (Riedel et al. 2007):
Samarium (Sm3+): red-violet
Europium (Eu3+): red Europium (Eu2+): blue
Terbium (Tb3+): green Cerium (Ce3+): green
Erbium (Er3+): green Dysprosium (Dy3+): yellow
Thulium (Tm3+): blue
White colour originates from the mixture of three colours. The temperature of the colour can
be adjusted (warm or cold light), depending on the composition. As the spectra of the
individual metals are limited, lamps with special requirements use up to eight phosphors,
mainly lanthanides (Wickleder 2010).
Host lattices comprise compounds without rare earths such as BaMgAl10O17, BaFCl or
Zn2SiO4 as well as compounds containing rare earths such as Y2O3, La2O3 and CeMgAl11O19.
The following chapters describe the main areas of application: fluorescent lamps, plasma
displays as well as electro-luminescence with a focus on LEDs (light-emitting diodes) and
Study on Rare Earths and Their Recycling
102
LCDs (liquid crystal displays). Other fields of application with smaller quantitative relevance
are laser and X-ray technology where REE are used, too (e.g. neodymium for lasers16).
10.5.1 Fluorescent lamps
Fluorescent lamps encompass the group of tube-like lamps (fluorescent tubes), compact
fluorescent lamps (CFL), high intensity discharge (HID) lamps, and low-pressure sodium
vapour lamps.
In the following the chemical composition of the most frequent luminescent materials (=
phosphors) used in these lamps (Wojtalewicz-Kasprzak 2007) is provided:
Phosphors without rare earths:
Halophosphate: CaO, P2O5, MnO, Sb2O3, F, Cl (white, blue)
Phosphors with rare earths:
Yttrium europium oxide (YOE): 95 % Y2O3 , 5 % Eu2O3 (red)
Barium magnesium aluminate (BAM): Al2O3, BaO, MgO, 2 % Eu2O3 (blue)
Cerium magnesium aluminate (CAT): Al2O3, 11 % Ce2O3, 8 % Tb2O3, MgO (green)
Lanthanum phosphate (LAP): 40 % La2O3, 16 % Ce2O3, 11 % Tb2O3, P2O3 (green)
Inexpensive fluorescent lamps use halophosphate (light yield 75 - 80 lm/W, low-quality
colour reproduction), while high-quality fluorescent tubes use a three band phosphor
containing REE (light yield 100 lm/W, good colour reproduction); they contain 2 %
halophosphate or three band phosphor, respectively, in terms of weight. In compact
fluorescent lamps the three band phosphor constitutes about 0.3 % in terms of weight
(Wojtalewicz-Kasprzak 2007). Guarde et al. (2010) reported on high rare earths contents in
fluorescent powders from the recycling of used fluorescent lamps and tubes, particularly
yttrium with up to 9 % and smaller amounts of europium (up to 0.6 %), lanthanum (up to
0.5 %), cerium (up to 0.4 %), gadolinium (up to 0.3 %) and terbium (up to 0.2 %).
The summary above shows that all three band phosphors use REE as activators. In many
cases the host lattice is also dotted with REE like yttrium, cerium or lanthanum. According to
USGS (2010b) yttrium cannot be substituted by other elements in the use as phosphor.
Considering various phosphors Jüstel (2007) concludes that phosphors containing REE are
superior to other phosphors. However, he mentions manganese (Mn2+) as a possible
alternative to terbium. Regarding phosphor technology shift, Lynas (2010a) mentions a
potential decrease of Tb consumption amounting to 40 %. A Japanese research project
which started in 2009 aims at finding a substitute for Tb and Eu by using a high-speed
16 Angerer et al 2009 estimate a very low demand of only 0.2 t Nd for use in laser crystals in 2030.
Study on Rare Earths and Their Recycling
103
theoretical calculation method and combinatorial chemistry synthesis of materials (NEDO
2009). DOE (2010) states that there is no proven substitute for europium in fluorescent
lamps and no proven substitute for europium as red phosphor in television screens.
Plasma displays make use of UV-rays and have a similar working principle as fluorescent
lamps. Here, REE like europium, yttrium, terbium and gadolinium are used.
10.5.2 Electro-luminescence
Illuminants which are based on the phenomenon of electro-luminescence comprise LEDs
(based on inorganic compounds), OLEDs (based on organic compounds) and EL-foils. LEDs
or EL-foils are also used as backlight for LCDs.
In the medium term LEDs constitute a promising alternative to CFL. Their efficiency is
already higher and a further drastic increase of their efficiency is expected. Wickleder (2010)
states that various commercial LED-applications are already available. Nevertheless, to
enable broader dissemination new phosphors capable of providing a better light quality need
to be developed.
Currently, the REE gadolinium, cerium, terbium, europium, yttrium, lanthanum, samarium
and lutetium are used in the host lattices and as activators.
Organic LEDs (OLEDs) are likely to be the next LED generation. Some commercial
applications which also use REE like europium, terbium, samarium, lanthanum, gadolinium,
lutetium, thulium and dysprosium are already on the market or are being developed (Huang
2010).
In future, LEDs might eliminate the need for lanthanum and terbium phosphors while
continuing use of cerium and europium (DOE 2010). Future generations of OLEDs might
even be free of all rare earths (DOE 2010).
10.6 Catalysts
Rare earths are used for industrial catalysts as well as for automotive catalysts. A very
important example of rare earths used for industrial catalysts is FCC (fluid catalytic cracking)
catalysts, which support refineries in the production of high quality products at high rates.
Hykawy (2010) reports an estimate provided by G. Ragan from Albemarle, which assumes a
global market of about 600 000 t for FCC catalysts with a rare earth content of approx. 2%,
mostly lanthanum. This means an annual lanthanum demand of approx. 12 000 t for FCC
catalysts. According to Hykawy (2010), P.Chang from BASF pointed out that lanthanum is
crucial for FCC catalysts because it provides thermal stability and selectivity. Currently no
substitutes for lanthanum in FCC catalysts are known, but experts state that there is an
additional impetus for reduction or substitution due to the increasing prices of REE like
lanthanum.
Study on Rare Earths and Their Recycling
104
In automotive catalysts REEs (mostly cerium) are also responsible for enhanced thermal
stability and emission reduction (Hykawy 2010). Currently no substitution materials are
known for the REEs used for automotive catalysts.
Conclusion on substitution and efficient use of rare earths
The analysis of substitutions for scarce REE has shown that a simple substitution of a
REE compound by another compound is a quite rare case. In most cases substitution
requires totally new product design. The identified options for substitution for the major
green applications are summarised below:
Rare earths are currently used in around 14 % of newly installed wind turbines with
gear-less design and technical advantages in terms of reliability. A supply shortage
of rare earths would lead to a shift to alternative turbine types. Further research into
the higher reliability of traditional techniques with gears would support this
substitution.
Rare earths are used in permanent motors of hybrid electric vehicles and electric
vehicles. Substitutions based on alternative motor designs are available. However,
R&D is required to enable higher performance of existing electric motor types and to
realise new electric motor concepts.
Most new energy efficient lighting systems contain rare earths (compact
fluorescent lamp, LED, plasma display, LCD display). Substitutions are rare,
particularly in the case of compact fluorescent lamps. R&D is required for alternative
phosphors with a high efficiency and high light quality.
Automotive catalysts contain cerium, and catalysts for petroleum refining and other
industrial processes contain lanthanum. Substitutions are rare, and R&D is urgently
required for alternative catalysts.
Concerning a higher efficiency of the rare earth, R&D is urgently needed in all fields of
application and is also needed to enable higher efficiencies in mining, beneficiation and
processing. One example of high losses in the production chain is the traditional magnet
production.
The use of nanotechnology in some green applications is being considered in order to
increase the efficiency by nano-sized rare earth compounds. An attendant risk
assessment is highly recommended.
Study on Rare Earths and Their Recycling
105
11 Recycling of rare earths – current situation Company Project Location Cut-off Contained REO Production Start-up
The recycling of rare earths could be stated as a very uncommon issue until today. A recent
analysis of Öko-Institut conducted for UNEP on critical metals provided information on very
small quantities of recycled rare earths with pre-consumer origins (permanent magnet scrap),
but no indications of any post-consumer recycling of rare earth containing products could be
found (Öko-Institut 2009). The reasons for this were quite dissipative applications, quite low
prices of rare earths and a tendency of REE to move in the slags of smelter plants.
Nevertheless the sharp increase of the rare earth prices in 2010 and the high media
coverage of possible supply shortages and export restrictions by China have put the issue of
recycling rare earths on the agenda worldwide. The following sub-chapters summarise the
results of the intensive new analysis conducted by Öko-Institut in late 2010.
11.1 Recycling of rare earths from magnets
Research activities are being conducted on pre-consumer and post-consumer recycling in
China and other countries. An important focus is the recycling of magnet scrap which arises
in large amounts not only after consumption but already during the production.
It is estimated that 20-30 % of the rare earth magnets are scrapped during
manufacturing (Zhong et al. 2007). However, the recovery of the rare earths from
production waste is not yet practiced (Shirayama Okabe 2009). Possible technologies
are as follows (Oakdene Hollins 2010):
o Re-melting the scrap and recover in an un-oxidised state. According to Oakdene
Hollins (2010) the yields are expected to be low.
o The recovery of the rare earth as oxide. However, the value of the oxidized rare
earth is much lower than the value of the metallic rare earths, as the oxides have
to undergo the energy-intensive reduction and refining process again.
o Re-use of the magnetic materials for new magnets without a separation of the
material mix.
o Selective extraction of Nd and Dy directly from magnet scrap by using molten
magnesium chloride as the selective extracting agent. Laboratory tests were
carried out in Japan with temperatures of around 1.000 °C (Shirayama Okabe
2009).
There are various studies in China on the recovery of rare earth metals from
neodymium magnet scrap and waste. Wang et al. (2006) reported that Dy2O3 could
be recovered to an extent of over 99 %. Furthermore, Tang et al. (2009) compared
two methods employing Na2SO4 double-salt precipitation and oxalate secondary
precipitation which achieve a recovery rate of Nd2O3 of more than 82 %. Zhang et al
Study on Rare Earths and Their Recycling
106
(2010) researched a separation method based on the electrical reduction by using
P507 extraction and comparing this with the traditional separation methods in terms
of material consumption and costs. Test results showed that this newly electrical
reduction technology may result in a recovery rate of 96.1 % of rare earth from
neodymium magnet scraps und save 6 033 RMB (about 650 Euro) per ton of rare
earth recycled.
Shi (2008) invented a process for the recovery of neodymium from acid cleaning
waste water which arises before NdFeB is electrically plated.
Zakotnik et al (2009) recycled neodymium magnets from disk drives successfully by
milling and re-sintering with the addition of 1 % new neodymium in a technical scale.
Kawasaki et al (2003) developed a similar recycling process for sintered neodymium
magnets by adding Nd-rich alloy powders to the ground magnet scrap powder before
re-sintering.
Current research is ongoing in Japan into the post-consumer recycling of rare earths
from motors/generators (permanent magnets). Pyro-metallurgical and
hydrometallurgical approaches are described which focus on the recovery of REE as
metals. (Takeda 2009, Koyama 2009).
Hitachi announced that it has developed a machine for the dismantling of neodymium
magnets from hard disks and compressors (Clenfield Shiraki 2010). The machine has
a capacity of 100 magnets per hour, about eight times faster than manual labour. The
developed dismantling process shall commence operation in 2013.
11.2 Recycling of rare earths from batteries
The Japanese JOGMEC's Metals Mining Technology Group has been creating
technology to recover rare earths metals such as lanthanum and cerium from used
Ni-MH batteries used for HEVs, and to refine the recovered metals for re-use in new
batteries. The electrodes are first treated with a multi-element refinery process, then
the separated reduction of the rare earths takes place (JOGMEC 2010). There are no
references to the implementation of a plant of industrial size.
The recovery of REE from Ni-MH batteries is examined by Luidold (2010). Despite
other attempts to extract the REE out of slags from smelting operations by means of
hydrometallurgical methods, this approach is aimed at the previous separation of the
REE from the other materials.
Researchers from Freiberg/Germany developed a hydrometallurgical process to
recover rare earth metal from the slag of the pyro-metallurgical treatment of used Ni-
MH batteries (Heegn 2009).
The Chinese researchers Wu & Zhang (2010) studied the recovery of Ni, Co and rare
earth (lanthanum, cerium, neodymium and praseodymium) from used Ni-MH batteries
Study on Rare Earths and Their Recycling
107
by leaching with sulphuric acid. The tests showed recovery rates of 95 %. Gao (2009)
also investigated the recovery of rare earth from spent Ni-MH batteries.
11.3 Recycling of rare earths from lighting and luminescence
There are some research activities and new patents in the field of post-consumer recycling.
They are listed below:
OSRAM holds a patent on the recycling of yttrium and europium from discharge
lamps and fluorescent lamps (OSRAM 2009, Wojtalewicz-Kasprzak 2007).
Guarde et al (2010) report on the recycling of fluorescent lamps and tubes and the
output of a distilled powder fraction which contains up to 10 % rare earths. Currently
this fraction is disposed (compare with more detailed figures in Chapter 10.5.1).
Further research activities are being undertaken which focus on yttrium and europium
recovery not only from lamps but also from TV tubes and computer monitors (Rabah
2008, Resende Morais 2010).
A scientific overview of conceivable recovery methods for the recycling of rare earths
fluorescent powder containing yttrium, europium, lanthanum and cerium is provided
by the Chinese publication Mei et al (2007).
11.4 Recycling of rare earths from catalysts
The recycling of REE from spent catalysts (industrial as well as automotive catalysts) is not
common due to relative low prices of REE in the past. A German source from 2001 reported
that the 9 100 t (1998) of spent FCC catalysts from catalytic cracking processes in German
oil refineries was completely used as cement additives (Hassan 2001), which means a
recovery of the REE from the spent FCC catalysts was not an issue. It is an open question
whether a recovery of the REE (mostly lanthanum) from FCC catalysts could be interesting
from an economic point of view in the next years. This will mainly depend on the price
development of lanthanum. From a technical point of view the large global mass flow of FCC
catalysts – 600 000 t per year (Hykawy 2010) – with about 2 % REE content means an
interesting REE potential for recycling from this specific application. It should be mentioned
that Öko-Institut and Umicore (GFMS 2005), after in-depth investigations regarding the
recycling flows of platinum group metals, came to the clear conclusion that the usual
business-to-business relationships (e.g. between the catalysts suppliers and the oil
refineries) are a very good pre-condition for very high recovery rates of the platinum group
metals (almost 100 % collection rate of the spent catalysts). Nevertheless the development
of a technically feasible and economically acceptable solution for the recycling of REE from
FCC catalysts is a task for the future.
Study on Rare Earths and Their Recycling
108
The recycling activities of the automotive catalysts focus worldwide on the recovery of the
valuable platinum group metals (GFMS 2005). Therefore the recovery of the REE content
(mainly cerium) from these catalysts has not yet become a focus. Currently the REE moves
into the slags from smelter processes due to the high affinity of the REE to oxygen. It
remains an open question whether a recovery of REE from spent automotive catalysts could
feature in the future.
11.5 Recycling of rare earths from other applications
Further studies deal with highly specific recycling processes from cleaning water, ferrosilicon
and waste from the aluminium production. They are briefly described below:
Wang et al. (2005) conducted an investigation on recovering the rare earth metals
from solid waste generated from aluminium production called red mud. The study
firstly reviews the existing recovery methods of rare earth metals from red mud in
China and abroad and secondly introduces the methods in Shanxi Aluminium Limited
Company at the laboratory stage. There, red mud was roasted and rare earth metals
were leached by HCl; finally scandium and other rare earth oxides were separated
from liquid.
Ferrosilicon which contains rare earths is used as a pre-alloy in the production of
ductile graphite iron. Chen (2007) analysed the technological conditions of smelting
rare-earth ferrosilicon by means of two thermal methods.
The Japanese company Kosaka Smelting and Refining tries to develop ways to
reclaim rare earths like neodymium and dysprosium from electronic scrap (Tabuchi
2010).
11.6 Challenges for an efficient rare earths recycling
The analysis shows that recycling plants and technologies are quite rare. The publications of
the US Geological Survey from 2010 only mention rare earth recycling for small amounts of
magnetic scrap (USGS 2010a) containing Nd, Pr and Dy and small amounts of yttrium from
laser and garnet applications. Furthermore, there is no current industrial recycling process for
the recovery of rare earths from Ni-MH batteries containing La, Ce, Nd and Pr (Oakdene
Hollins 2010, Luidold 2010, Tabuchi 2010).
Oakdene Hollins (2010) provides an overview of the recycling activities of rare earth. Their
conclusion is that a significant amount of research into the recycling of rare earth metals has
been undertaken, most notably in Japan. The result of the research activities is that there are
potentially a number of extraction processes but none of them has been developed
commercially due to drawbacks on yields and cost. The evaluation provided by Oakdene
Hollins (2010) is that the most attractive method is the treatment with liquid metals. They
Study on Rare Earths and Their Recycling
109
further state that most of the patents are from the early 1990s and that little progress was
made in the following 15 years. Therefore they see a potential for further new developments.
Research conducted by Öko-Institut affirms the fact that few industrial recycling activities are
being implemented. The latest publications show the following industrial recycling schemes:
Sludge from shaping and grinding of magnet alloys is recovered (Shirayama Okabe
2009), probably in Japan.
Recycling of yttrium is realised for small quantities, primarily from laser crystals and
synthetic garnets (USGS 2010b).
Magnets from MRI (magnetic resonance imaging for medical application) are being
re-used (Shirayama Okabe 2009).
Principally, the recycling processes for the rare earths are quite complex and extensive if re-
use is not possible and a physical and chemical treatment is necessary. Most of the recycling
procedures are energy-intensive processes. The main post-consumer activities – the
recycling of rare earth from motors and hard disks and other electronic components – will
require intensive dismantling.
A large challenge for a closed-loop economy in the field of the rare earths is the recycling of
the rare earths magnets, as it is the most important application with expected shortages in
the rare earth supply. The following constraints have to be overcome:
The transport of magnetic materials is restricted as their field can interfere with
aircraft instruments. This requires demagnetisation before air transportation, other
transport modes or regional recycling activities (Oakdene Hollins 2010).
Most of the rare earth magnets are used in motors and HDD (hard disk drive). Here,
the recycling requires a costly and extensive dismantling, as the magnet is quite
small. Further, it has to be demagnetised before separation from the iron parts is
possible. Additional work has to be conducted if the magnet is embedded in plastics.
Electronic scrap is often recycled in classic pyro-metallurgical plants. Many metals
can be recovered, but the rare earths are lost as they become a part of the slag which
is currently not recovered.
General constraints for wider recycling of rare earths in most application fields are:
The implementation of an efficient collection system has to be built up.
Post-consumer goods such as end-of-life vehicles or electronic scrap are partly
exported in developing countries. These exported goods will not be easily available
for an efficient urban mining.
Up to now, the prices for rare earths have been too low for the running of an
economical recycling process, particularly when considering the complex dismantling
and treatment processes and the quite high energy demand. Even increasing prices
due to the current Chinese export restriction do not guarantee a long-term stability of
Study on Rare Earths and Their Recycling
110
adequate prices for rare earths, which is a pre-condition for economic recycling
processes.
It will take a long time span for many of the devices containing rare earths to reach
the end of their life time. In particular electric motors in vehicles and wind turbines
should have life times of 10 – 20 years.
Conclusion on current situation of rare earth recycling
Only a few industrial recycling activities are currently implemented for rare earths. Up to
now, there has been no large-scale recycling of rare earths from magnets, batteries,
lighting and catalysts. In principle, the recycling processes for the rare earths are quite
complex and extensive if re-use is not possible and a physical and chemical treatment is
necessary. The main post-consumer activities – the recycling of rare earths from motors
and hard disks and other electronic components – will require intensive dismantling.
Several constraints for a wider recycling of rare earths were identified: the need for an
efficient collection system, the need for adequate high prices for primary and secondary
rare earth compounds, losses of post-consumer goods by exports in developing countries
and the long life time of products such vehicles and wind turbines of 10 – 20 years before
they enter the recycling economy.
At the same time, the potential supply shortages and the steep increase in prices of rare
earths are providing for the first time the opportunity to address the problem of today’s rare
earth supply in more depth and to seriously build up a recycling economy. The advantages
of rare earth recycling include the utilisation of European resources, independence from
foreign resources and environmental benefits. A corresponding strategy for developing
such a European recycling scheme is provided in the next chapter.
Study on Rare Earths and Their Recycling
111
12 Strategy for a sustainable rare earth economy
12.1 Background
In recent years tremendous changes have occurred in the global application of rare earths.
Technological innovations and the research on rare earths resulted in manifold applications
leading to a steep increase in the demand. A relevant share of the increasing demand is
caused by so called “green technologies” which are designed to contribute to environmental
protection by means of a reduction of the energy consumption, the further development of
renewable energy carriers or air pollution control. There is serious concern that the demand
of several different rare earth elements such as neodymium, praseodymium, dysprosium,
terbium, lanthanum, yttrium and europium might exceed the current supply within a few
years. Even if China imposes no export restrictions it is to be expected that the increasing
demand can only be met if further mines are opened in addition to the two mines in Australia
and USA which have already obtained approval from the national authorities and begun
construction works so that large-scale operation can commence around 2012.
The high demand and the expected supply shortages, additionally triggered by Chinese
export restrictions, lead to a significant increase in rare earth prices. This steep increase is
not only a burden for manufacturers and consumers. It provides an opportunity to address
the problem of today’s rare earth supply in more depth and to develop a sustainable rare
earth economy in all relevant sectors. The low prices in the past have led to a significant
waste of resources. To date there has been almost no recycling of rare earths. The new
prices might be a starting point for setting up recycling systems for rare earths.
Similarly, science and industry are beginning research and development into options for the
substitution of rare earths. The Chinese export restrictions revealed the high vulnerability of
the EU and other developed countries. Alternative technologies with less or without
application of rare earths attract more attention. Research projects started which aim to
develop green technologies and other applications which require no or less rare earths.
The high public interest in this issue has further revealed the high environmental burden in
the surroundings of the Chinese mines and processing plants. If the EU demands rare earth
technology for their green technology, it is up to the EU to contribute to a “greener” rare earth
supply. The contradiction between the “green” application of rare earth and their high
environmental pressures in production calls for action to be taken particularly by Europe,
America and Japan where – besides China – the majority of the rare earths are consumed.
Action in the field of recycling should begin now without further delay as it will take a
minimum of five to ten years for the first large-size implementation to take place.
The recycling of rare earths has several advantages compared to the use of primary
resources:
Study on Rare Earths and Their Recycling
112
Europe is one of the largest consumers of rare earths worldwide. Increasing amounts of
waste from final products containing rare earths arise in Europe. These valuable
resources should be returned to the industrial metabolism by “urban mining”.
Dependence on foreign resources will be reduced by supplying the European market
with secondary rare earth materials.
Apart from a few specialised industries and applications, the know-how in rare earth
processing is quite low in Europe because most of the European rare earth handling
involves the subsequent processing of refined material. The upstream processes are
mainly being carried out in China and to some degree in Japan. The building-up of know-
how in recycling will widen the competency of enterprises and scientific institutions in
Europe.
The processing of secondary rare earths will be free from radioactive impurities. The
mining and further processing of primary rare earths is associated with nuclear radiation
coming from radioactive elements of the natural deposits in most cases. Therefore,
primary rare earth processing generally produces radioactive waste.
The recycling requires some energy carriers and chemicals. At the same time it saves
significant amounts of energy, chemicals and emissions in the primary processing chain.
The accurate net benefit for recycling is process-specific and can be identified by a life
cycle assessment. It is to be expected that most recycling processes will have a high
net-benefit concerning air emissions, groundwater protection, acidification,
eutrophication and climate protection.
The next chapters will firstly address strategies for action within the European Union in order
to promote a sustainable rare earth management. Related issues are the developing of
recycling schemes and actions required for improvements concerning a more efficient use of
rare earths and improvements of alternative applications which work without the use of rare
earths. Secondly, aspects related to foreign affairs and the potential contribution of the
European Union to an environmentally sound mining will be addressed.
12.2 Development of recycling schemes
Öko-Institut suggests taking action in the short term in order to establish a European
recycling scheme for rare earths. The development and implementation might take some
years. When a relevant amount of products containing rare earths which now enter the
market reach the end of their life cycle and are available for recycling such an collection and
recycling scheme should be implemented.
The next figure provides an overview of main steps toward a European recycling scheme as
suggested by Öko-Institut.
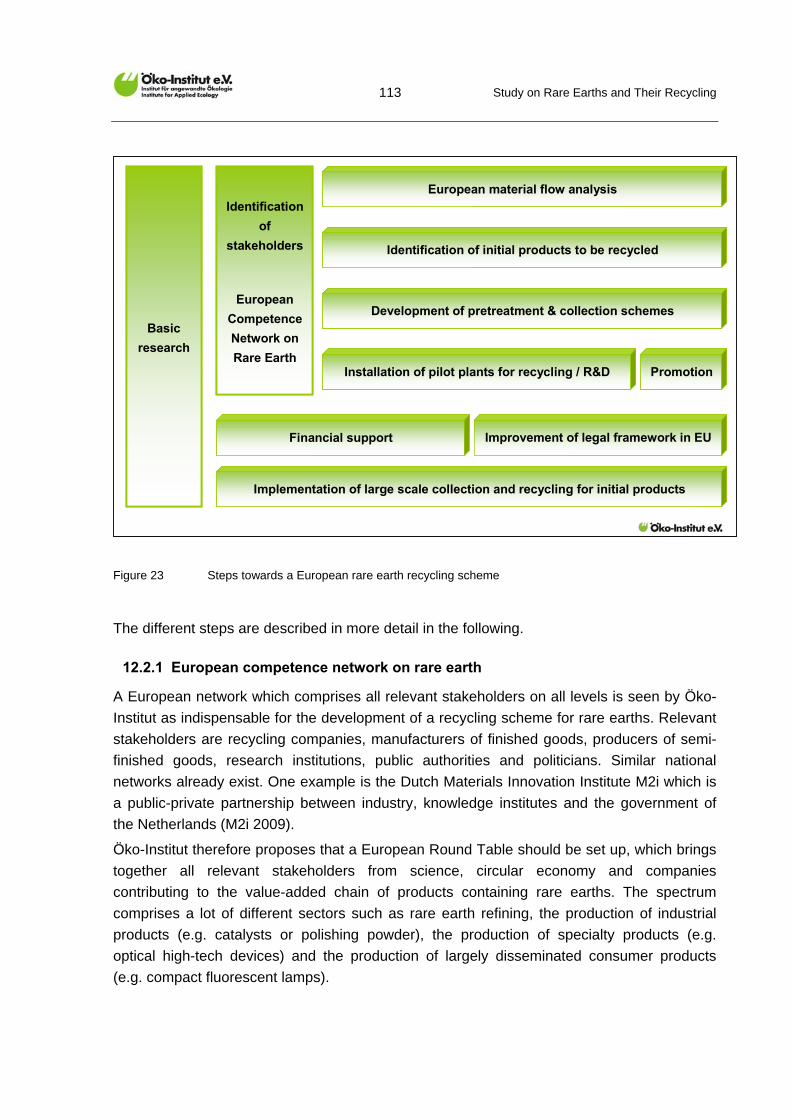
Study on Rare Earths and Their Recycling
113
Development of pretreatment & collection schemes
Identification of initial products to be recycled
European material flow analysis
Installation of pilot plants for recycling / R&D
Financial support
Implementation of large scale collection and recycling for initial products
Identification
of
stakeholders
European
Competence
Network on
Rare EarthPromotion
Basic
research
Improvement of legal framework in EU
Figure 23 Steps towards a European rare earth recycling scheme
The different steps are described in more detail in the following.
12.2.1 European competence network on rare earth
A European network which comprises all relevant stakeholders on all levels is seen by Öko-
Institut as indispensable for the development of a recycling scheme for rare earths. Relevant
stakeholders are recycling companies, manufacturers of finished goods, producers of semi-
finished goods, research institutions, public authorities and politicians. Similar national
networks already exist. One example is the Dutch Materials Innovation Institute M2i which is
a public-private partnership between industry, knowledge institutes and the government of
the Netherlands (M2i 2009).
Öko-Institut therefore proposes that a European Round Table should be set up, which brings
together all relevant stakeholders from science, circular economy and companies
contributing to the value-added chain of products containing rare earths. The spectrum
comprises a lot of different sectors such as rare earth refining, the production of industrial
products (e.g. catalysts or polishing powder), the production of specialty products (e.g.
optical high-tech devices) and the production of largely disseminated consumer products
(e.g. compact fluorescent lamps).
Study on Rare Earths and Their Recycling
114
12.2.2 Basic research on rare earth processing
Due to the fact that there is no rare earth mining in Europe and only a very few companies
are involved in rare earth refining, there is a need for enhanced basic research in Europe on
rare earth processing. This knowledge might be necessary in order to build up a large-scale
urban mining on rare earths and to establish more independence from the process
knowledge which is currently mainly available in China and Japan. The United States is
currently planning to develop a knowledge base in order to be able to process the rare earths
to be mined from the re-opened mine (Mountain Pass) from 2012 onwards. The current
situation in magnet production is representative for other sectors. The large scale of China’s
know-how and capacity in all stages of production is clearly shown by Figure 10 on page 33.
The first step to building up more know-how on rare earths in Europe would be the detailed
identification of gaps of knowledge and competences in Europe related to rare earth
processing. As a further step Öko-Institut proposes the creation of chemical chairs which
carry out basic research on rare earths and their sustainable management.
12.2.3 European material flow analysis
The key aim of a European material flow analysis is to close significant data gaps and to gain
broader knowledge on the material flows in Europe related to rare earths. The analyses in
the previous chapters have shown that little data is available on the manifold and mostly
young applications using rare earths. The global demand and supply forecasts of national
research institutions such as the American USGS, the British BGS and the German BGR
have to rely on the knowledge and estimates of a few experts mainly outside of Europe. The
data situation of the rare earth flows should be improved within Europe and globally in the
near future. This is a critical point for a sustainable economy of rare earths as more in-depth
knowledge is indispensable to facilitating a successful course of action in terms of recycling
and a more efficient use of rare earths.
The first step to enabling a European material flow analysis is to identify the main
manufacturers and actors in the added-value chain related to rare earths. This step is linked
with the build-up of a European Competence Network. The next task should be to identify the
main material flows and to estimate the amount of rare earths which will be embedded in
specific waste streams and available for recycling. Close co-operation with the European
rare earth processing industry is regarded by Öko-Institut as essential to obtaining robust
results.
12.2.4 Identification of initial products
Building up the recycling scheme step by step and beginning with a couple of initial products
suited to recycling is highly recommended. These products should encompass, for example,
a large amount of rare earths, high economic relevance, a design allowing an easy
dismantling or a high concentration of the rare earth in the waste stream. The material flow
Study on Rare Earths and Their Recycling
115
analysis will provide a more detailed picture of the rare earth material flows in products and
waste streams.
Based on current knowledge, potential initial waste streams could arise on the pre-consumer
level (waste arising during manufacturing) from the magnet production, the lighting industry,
the upstream rare earth processing industry, the industry using polishing powder and the
production of IT-devices and electronics.
In quantitative terms, the post-consumer waste will be much more relevant. The following
products might prove to be appropriate initial products for a new recycling scheme when the
end of their life cycle is reached: magnets from electric motors and generators (arising in
wind power plants, hybrid and electric vehicles, hard disks and e-bikes), lamps (fluorescent
lamps), displays (plasma display and LCD) and possibly automotive catalysts. Spent
industrial catalysts are also a promising candidate.
12.2.5 Development of collection and pre-treatment schemes
Based on knowledge gathered from the material flow analysis and the selection of initial
products, the next step will be to design a collection and pre-treatment scheme.
The treatment of many wastes which contain rare earths is already regulated by existing
guidelines, e.g. the WEEE Directive, the ELV Directive or the Battery Directive. However,
there are not yet specific regulations for rare earths. The specific requirements for collection
schemes for waste containing rare earths have to be integrated in procedures already
implemented. Another aspect is the consideration of required pre-treatments. For example,
magnets have to be demagnetised before transportation, or batteries have to be discharged
due to safety issues.
12.2.6 Development of pilot plants
The next step is to design pilot plants needed to learn more about the complex recycling
processes. This step also comprises research activities on the specific recycling procedures.
In most cases, it will be necessary to set up large-scale R&D projects as rare earth recycling
often requires high-technology based on complex chemical processes and sophisticated
equipments. Some ongoing or past R&D projects are described in Chapter 11. The overview
shows the high complexity of most of the project tasks.
12.2.7 Financial issues
The investment in recycling plants bears a high risk for investors, as outlined below:
Most of the recycling plants will require a high long-term investment due to the required
complex technologies.
There is a large number of mining projects with uncertainty about their realisation (see
the overview provided in Table 4-3 on page 22). If a high number of projects were
Study on Rare Earths and Their Recycling
116
realised, it could not be excluded that REE prices will decrease again in the medium to
long term, thus depriving recycling of its economic basis.
Generally, there is high uncertainty about the future price developments. Reliable data
on the demand and the supply situation are scarce, the rare earth stocks of companies
and nations are unknown and speculations on rare earths prices might cause
turbulences on the trade markets.
Therefore, it should be analysed whether the European Investment Bank (EIB) could reduce
financial risks for investments in recycling.
An example of financial instruments outside of Europe are programmes from the US
Department of Energy which support the production of clean energy components and new
vehicle technologies by providing loan guarantees, loans or tax credits (DOE 2010). The
Japanese administrative institution JOGMEC promotes a stable supply of metal resources,
providing funding for research and field survey, loan guarantees and financial assistance to
mining projects, maintaining stockpiles and disseminating information on mineral availability
issues (DOE 2010).
12.2.8 Legal framework
A recycling scheme of rare earths not only requires appropriate logistical and technical
requirements but also an appropriate legal framework.
The first task of this step will be a screening in order to identify the sectors where the
collection and treatment is already regulated and sectors where no regulation takes place,
e.g. wind turbines.
The next step will be to adapt the legal EU framework in order to optimise post-consumer
rare earth recycling. In this context, specific issues might be addressed, e.g. the obligation to
conduct magnet recycling from dismantled wind power plants or the prevention of exports of
valuable electronic scrap and catalysts to developing countries where no recycling of
speciality metals takes place (compare Öko-Institut & Eurometaux 2010). Öko-Institut further
proposes verification of whether the Ecodesign Directive (2009) and related regulations
should be adapted in order to support the dismantling and recycling of rare earth
components from energy-using products. Another issue which should be discussed for rare
earth components in electronic devices and automotive applications are the overall recycling
quotas which are required by the WEEE Directive, the ELV Directive and the Battery
Directive. These compulsory quotas do not consider the ecological relevance of the recycled
substances. Hence, the WEEE Directive and ELV Directive mainly support the recycling of
the basic materials but not the recycling of scarce and precious metals which have a high
ecological relevance but only contribute a low share in terms of volume. The rare earth
recycling should be addressed by specific requirements, e.g. the obligation for dismantling of
selected rare earth containing components.
Study on Rare Earths and Their Recycling
117
Concerning the ELV Directive, Öko-Institut proposes the introduction of the obligation to
dismantle the electric motors of hybrid electric and electric vehicles prior to the shredder. A
more in-depth analysis (material flow analysis) should verify whether an obligatory
dismantling of further smaller components would be justified.
12.2.9 Large scale implementation
The last step is the large scale implementation of the developed recycling schemes for the
selected initial products. This step not only comprises the beginning of the rare-earth specific
collection, pre-treatment, and recycling (refining plants in industrial scale) but also the
monitoring of the performance, its optimisation and the outlook for widening the existing
recycling scheme. To enable broader dissemination, the export of recycling technologies and
the development of a wider product range might be considered.
Study on Rare Earths and Their Recycling
118
Conclusion on the development of a recycling scheme
Öko-Institut proposes the development of a recycling scheme based on the following
steps prior to a large scale implementation:
A European Competence Network on Rare Earths with all relevant stakeholders
such as recyclers, manufacturers, public authorities, politicians and researchers is
seen as essential to successful implementation.
Basic research is necessary, as only a few companies in Europe are involved in
rare earth refining and processing at the beginning of the added-value chain.
A European material flow analysis (MFA) is necessary in order to identify the
main material flows and waste streams and the main manufacturers and actors in
the added-value chain. Currently, national research institutions have to rely on
knowledge and estimates from a few experts outside of Europe.
The next step is to identify initial waste streams on the pre-consumer and post-
consumer level, e.g. waste from the magnet and lighting industry, neodymium
magnets from electric motors, used lamps and displays, re-use of large magnets
and recycling of spent catalysts.
The collection and treatment of many relevant wastes is already regulated by the
WEEE Directive, the ELV Directive and the Battery Directive. Thus, the collection
of rare earths containing wastes has to be specified and integrated in existing
collection schemes.
Large-scale R&D projects can develop pilot plants in order to learn about the
complex chemical processes and the required sophisticated equipment.
Recycling plants bear high financial risks due to the required high investment and
the high uncertainty of the future price developments of rare earths. Therefore, it
should be analysed whether the European Investment Bank (EIB) could reduce
financial risks for investments in recycling.
A recycling scheme of rare earths not only requires appropriate logistic and
technical requirements but also an appropriate legal framework. Hence, an
important step will be to adapt the legal EU framework in order to optimise post-
consumer rare earth recycling.
Study on Rare Earths and Their Recycling
119
12.3 Strategy for enabling a more efficient use of rare earth and substitution
The sectoral analysis as presented in the previous chapters has shown that the potential for
an increase in the resource efficiency in the processing and the use of rare earth is quite
different. It is likely that the knowledge and research on efficiency issues is not the same for
all applications.
Most available information relates to magnet production and magnetic applications. The
analysis showed that the traditional production technologies usually have high material
losses whereas newer sinter technologies have much better material efficiencies. The high
prices and the expected shortages of the minor elements dysprosium and terbium lead to
some research activities aimed at achieving a similar performance with less specific input of
these very scarce elements. This example shows that the research into efficiency issues in
this context is in early stages. This is not surprising as the applications themselves are
mostly very young. In the past, the major aim has been to develop workable applications.
Now, the next phase, which focuses on improvements and high efficiency rates, is beginning.
The expected supply shortages even lead to serious considerations of how scarce rare
earths can be substituted. According to the in-depth analysis presented in Chapter 10,
alternatives seem to be feasible in some applications, whereas other sectors do not offer
quick solutions. In most cases, rare earths cannot just be substituted by another element or
another compound. Instead, the whole technical design of machines and applications has to
be changed. For example, the alternative to an electric motor containing a neodymium
magnet is an electric motor with a different mode of operation and a distinct design, which
has specific advantages as well as disadvantages.
The screening of the different applications (see Chapter 10) showed that further R&D is
necessary to develop feasible technologies for rare earth substitution in the field of green
technology and to achieve higher material efficiencies.
The available information was the best for neodymium magnet applications such as wind
turbines, electric vehicles, and hybrid vehicles and the Ni-MH batteries. The analysis showed
that in principle alternatives are available. Nevertheless, intensive research is necessary to
develop these alternative products in terms of high efficiencies, economic competitiveness
and reliability. Examples are alternative electric motor types, operating either with traditional
techniques which should be further improved or younger motor designs which need further
research to reach the technical maturity for wider use. Another example is wind power. Here,
gearless wind turbines using neodymium magnets still provide the smaller share of new
installations. But a higher reliability is expected in large-size plants, particularly in off-shore
plants. The main conclusion on these competing technologies is not to focus exclusively on
the rare earth technologies but to work simultaneously on increasing the reliability of the
traditional systems with gears and on improving the research of next generation technologies
like high-temperature superconductors (HTS).
Study on Rare Earths and Their Recycling
120
The analysis of the green technologies such as energy efficient lighting and catalysts showed
in the first place that no fast solutions seem to be feasible without the use of rare earths.
There are almost no options for alternative techniques which operate without rare earths and
have an equal performance and economical competitiveness. Intensive research in these
fields is highly recommended.
Another aspect to be considered in the improvement of efficiency is the future role of
nanotechnology. The application of nano-sized rare earth compounds are being considered
in green technologies such as magnets, batteries, fuel cells, H2-storage and catalysts. The
principal aims, the improvement of energy efficiency or material efficiency, is desirable. In
order to avoid negative secondary effects, Öko-Institut proposes the carrying out of a
corresponding risk assessment.
12.4 International aspects
Besides activities within the EU which aim to promote the recycling and the efficient
processing of rare earths and to improve research on alternatives for substitution, the EU
faces a tremendous task in terms of action on the international level. Even if the recycling of
rare earths (for example) succeeds in the medium term in the EU (this would be a real
success and progress), the global demand for primary rare earths will increase up to 2020
and beyond, driven by many applications in the field of green technologies.
The development of a sustainable rare earth supply for Europe concerning environmental,
social and security aspects requires solid international co-operation. Important partners for
the EU to face this challenge are predominantly China, and Japan and the United States.
In the next sub-chapters, selected potential international activities of the EU proposed by
Öko-Institut are presented.
12.4.1 Co-operation with China on sustainable rare earth mining
Despite different new mining projects in other countries like USA, Australia etc., China will
remain the world’s largest producer of primary rare earths for the next decade at least.
China’s authorities are well aware that China is facing many challenges with regard to its rare
earth mining and processing industry, which require a lot of investments, human resources
and capacity building. Having examined the official Chinese government plans for the rare
earth industry for the next years, this conclusion is well-founded and clear. Europe has a
well-regarded knowledge and technology base and much experience in the field of
environmental protection (e.g. decontamination of soils, landfills, mining areas, groundwater
protection etc.) which should be offered to China to enable a fruitful and fair co-operation
between the EU and PR China in the field of rare earths. The idea is to offer China a
partnership: an exemplary re-cultivation of a large rare earth mining site in China on the one
Study on Rare Earths and Their Recycling
121
hand and an export of a certain amount rare earth compounds extracted and processed from
this mining site to the EU on the other hand.
Such an EU-Chinese partnership on rare earth mining could include the following aspects:
Signing of an official large framework agreement between the EC and the Chinese
government,
Installation of a common expert round table to define and select the first common
project in practice: selection of an appropriate rare earth mining and processing site,
Line-up and schedule for common activities, e.g. the enhancement of recovery rates for
rare earths (mining and processing), reduction of environmental pressures from former
mining activities (remediation of contaminated sites); assessment whether a second
treatment of tailings (extraction of remained rare earths in the tailings) could be
promising, reduction of environmental pressures of the current and future mining,
concentration and processing activities, etc.,
Definition of the practical steps in detail: negotiations about the contribution of European
experts, institutions and companies,
Agreement about the co-funding of investments by the EC,
Agreement about the amount of rare earth exports to the EU,
Outlook for further EU-Chinese projects within the partnership on rare earths.
The basic idea is to support China, which has supplied the world economy with rare earths
for many years, to improve its rare earth industry in facing the challenges of the years ahead
relating to the development of a sustainable rare earth economy.
12.4.2 Promotion of environmentally-friendly mining
The analysis of the environmental impacts from rare earths mining and processing as
presented in Chapter 7 shows the high environmental burdens of mines which are not
equipped with adequate environmental techniques. The high pressure on the opening of new
mines by the steeply increasing demand raises the concern that new mines outside of China
could be opened which do not keep minimum standards.
At the same time, the comparably young sector of rare earth mining and processing provides
an opportunity to build up the new mining activities based on the experience of decades of
mining of other metals. In these decades, environmental technologies have been developed
after experiencing environmental hazards and health impacts. Today, these environmental
technologies are available and should be strongly applied. An additional opportunity is
provided by the fact that all future mines need completely new approvals; there is no reason
for weakening environmental standards as is often practiced for existing installations.
Study on Rare Earths and Their Recycling
122
As Europe uses a high share of rare earth in green technologies, it should consistently
promote and support environmentally-friendly mining by means of its political instruments
and its diplomacy. Chapter 4.3 provides some figures on the economical contribution of the
mining to the added-value chain. It shows that the financial contribution from mining and
beneficiation is smaller than the contribution from further processing. This implies that higher
costs of an environmentally sound mining will not lead to significant price increases of rare
earth compounds. This implies that higher costs of an environmentally sound mining will not
lead to relevant price increases of rare earth compounds. When considering further that rare
earths are usually found in very low concentration in final products, the consumer prices will
probably not be seriously affected by higher costs resulting from environmentally sound
mining.
During the last decade, manifold initiatives aiming at a sustainable mining have been
developed. In the political arena and in industry there has also been increasing interest in the
certification of sustainable raw materials (Manhart 2010). It should be discussed how rare
earth mining can be integrated in existing schemes or whether an additional initiative
specifically promoting “green and social rare earth mining” might be helpful. In order to give a
picture of the wide range of approaches, selected initiatives on sustainable mining are
summarised below (BGR 2007):
The German Federal Institute for Geosciences and Natural Resources (BGR) developed
in cooperation with authorities in Rwanda and Democratic Republic of Congo pilot
projects on certified trading chains on tin, tantalum, tungsten, gold and coltan (BGR
2010b).
The German Federal Institute for Geosciences and Natural Resources (BGR) developed
an analytical fingerprint (AFP) which is able to determine the origin of a specific ore. The
basic principle is that each deposit holds a specific “fingerprint” which can be detected in
the laboratory not only for concentrates but also for refined products. BGR developed the
AFP for tantalum (coltan) concentrates (BGR 2010b). There are further AFP activities for
gold, platinum group metals, copper and cobalt (BGR 2007, BGR 2010b, Perelygin et al
2008).
The Kimberley process – a co-operation of 71 nations – resulted in a certification system
for diamonds and the implementation of a related EU directive. The major aim is to ban
imports of diamonds whose revenues are used to finance civil wars.
The International Council on Mining and Metals (ICMM) established in 2001 comprises
18 mining and metal companies as well as 30 mining associations and global commodity
associations. Its aim is the sustainable development in the mining sector.
The International Cyanide Management Code (ICMI) is an initiative for the certification of
the gold mining industry with the aim of an environmentally sound handling of cyanide. It
holds 28 members which covered around a third of the industrial gold production in 2006.
Study on Rare Earths and Their Recycling
123
The Green Lead project with co-operation from UNEP, national authorities and mining
industries aims at the certification of lead-acid batteries which meet criteria concerning
environment, health protection, work safety and social responsibility.
The Initiative for Responsible Mining Assurance (IRMA) is a multi-sector effort, launched
in Vancouver, Canada, in June 2006, to develop and establish a voluntary system to
independently verify compliance with environmental, human rights and social standards
for mining operations. Its target is mainly the mining for jewellery manufacturing.
There are numerous initiatives focused on small-scale mining of diamond, gold and
platinum.
Today’s mining companies could be interested in a certification scheme or similar co-
operations as a large number of mining projects are being planned. The worst case would be
that technologically advanced mines would have to close again when other mining operators
start to supply cheaper “dirty” rare earths. Therefore, the promotion of environmental sound
mining is an international issue of tremendous urgency. One component of a certification
scheme could be the analytical fingerprint which can be used to identify the origin of minerals
if other control mechanisms prove to be insufficient.
12.4.3 Supporting sustainable development in Greenland
One selected example of environmental concern is the intended joint mining of rare earths
and uranium from the Kvanefjeld deposit in Greenland which was described in Chapter 7.4.4.
The prefeasibility study formerly launched by Danish authorities and the current project
scheme which envisions the inlet of radioactive and toxic tailings in a natural lake with
connection to sea water raises the concern of potential high environmental hazards
concerning the lake, its surroundings and maritime waters, even if waste water treatment
technologies are installed.
At the same time, the deposit contains high shares of the most scarce heavy rare earth
elements (HREE); high profits are expected. Therefore, Öko-Institut highly recommends that
Europe appeals clearly to the Greenland authorities to act carefully and responsibly.
Furthermore, the co-operation agreement between the government of Greenland and the
European Environmental Agency (EEA) signed in November 2010 should support a
responsible course of action within this project.
Study on Rare Earths and Their Recycling
124
Conclusion on recommended international activities
Concerning international activities, Öko-Institut proposes three selected activities:
Öko-Institut proposes an EU-China co-operation on sustainable rare earth mining
and processing which could be designed as a large-size co-operation which focuses
on the sustainable mining of rare earth at one specific site with the aim of optimising
the efficiency, the environmental performance, remediation of contaminated sites
and a potential recovery of rare earths from old tailings. The EC could supply co-
funding and expertise, and China would agree on a defined amount of rare earth
supply.
Green technologies call for “green metals”, and Europe should support sustainable
mining. There are manifold initiatives for sustainable mining and certification
schemes addressing social and environmental aspects. Today’s mining companies
are showing increasing interest in certification schemes or similar co-operations with
EU participation in order to highlight their environmental efforts.
The high pressure on the opening of new mines brought about by the steeply
increasing demand raises the concern that new mines outside of China could be
opened which do not keep minimum standards. One case in point could be the
Kvanefjeld deposit in Greenland where the residues from the ore concentration
(tailings) shall be stored in a natural lake with connection to the sea. The EU and the
European Environmental Agency (EEA) should appeal clearly the Greenland
authorities to act carefully and responsibly.
Study on Rare Earths and Their Recycling
125
13 Literature
Alkane 2010a ALKANE Resources Ltd.: Dubbo Zirconia Project. Marketing Presentation, Hong Kong, November 2010
Alkane 2010b ALKANE Resources Ltd.: Chart on rare earth resource by country excluding China, published on the website http://www.australianrareearths.com/current-issues.html, download at 04 Nov 2010
ANDRA 2009 Agence Nationale pour la Gestion des Déchets radioactifs (ANDRA): L’Édition 2009 de l’inventaire Nationale des Matières et Déchets Radioactifs; www.andra.fr
Angerer et al 2009 Angerer, G., et al: Rohstoffe für Zukunftstechnologien, Fraunhofer Institut für System- und Innovationsforschung ISI, Karlsruhe in cooperation with Institut für Zukunftsstudien und Technologie-bewertung IZT gGmbH, Berlin; 15 May 2010, Stuttgart
Avalon 2010 Avalon rare metals inc.: Rare metals information, download from http://avalonraremetals.com/rare_earth_metal/rare_earths/, download in Nov 2010
Bax & Willems (2010) Bax & Willems Consulting Venturing: Observatory Nano. Nanotechnology and electric vehicle, Working Paper Version, April 2010
BBC 2010 BBC New Acia Pacific: Rare earths supply deal between Japan and Vietnam, Oct 31th 2010, download from http://www.bbc.co.uk/news/world-asia-pacific-11661330, last access 02 Dec 2010
BBC Research 2010 BBC Research: Catalysts for Environmental and Energy Applications, 1st June 2010; download at 06 Dec 2010 http://www.marketresearch.com/product/display.asp?productid=2718689
BCG 2009 The Boston Consulting Group: The Comeback of the Electric Car? How Real, How Soon, and What Must Happen Next; 2009
Beijing Nonferrous Metal 2008 Beijing Nonferrous Metal, Technique for extraction separation of quadravalence cerium, thorium, fluorine and cerium cerium less tervalence rare earth from sulphuric acid rare earth solution, Patent CN 200710098732 A, viewed 15 October, <http://ip.com/patapp/CN101294244>
Beijing Review 2010 Beijing Review, ‘Observer: China Not the Only Rare Earth Exporter’ on 11 October 2010, viewed 15 October 2010,
Study on Rare Earths and Their Recycling
126
<http://www.bjreview.com.cn/business/txt/2010-10/11/content_ 302977.htm>
Benecki 2007 Walter Benecki: Rare Earths are becoming rare! Magnetics Business & Technology, November 2007, download from http://www.waltbenecki.com/uploads/rare_earths_are_becoming_rare.pdf
Benecki 2009 Walter Benecki: What Rare Earths Crisis? Magnetics & Technology Magazine, Winter 2009, download from http://www.waltbenecki.com/uploads/rare_earth_crisis.pdf
BGR 2007 Bundesanstalt für Geowissenschaften und Rohstoffe: Zertifizierte Handelsketten im Bereich mineralischer Rohstoffe, Hannover, April 2010
BGR 2009 Bundesanstalt für Geowissenschaften und Rohstoffe, Liedtke, M., Elsner, H.: Seltene Erden In: Commodity Top News Nr. 31, 2009
BGR 2010a Bundesanstalt für Geowissenschaften und Rohstoffe, Elsner, H., Melcher, F., Schwarz-Schampera, U., Buchholz, P.: Elektronikmetalle – zukünftig steigender Bedarf bei unzureichender Versorgungslage? In: Commodity Top News Nr. 33, Hannover 2010
BGR 2010b Bundesanstalt für Geowissenschaften und Rohstoffe: Mineral Certification: Certified Trading Chains (CTC) and the Analytical Fingerprint (AFP). Hannover, September 2010
BGS 2010 British Geological Survey: Rare Earth Elements, June 2010
Bo et al. 2009 BO Xiao-ping, ZHAO Yali, MENG Gang, SHANG Yu, FEI Mingming, Diskussion on output control problem of Chinese proponderant strategic mineral resources, China Mining Magazine, Vol 18, No.6 June 2009
Bojanowski 2010 Bojanowski, A.: Deutschen Firmen gehen Hightech-Metalle aus. Spiegel online 21.10.2010, download from http://www.spiegel.de/wissenschaft/natur/0,1518,724405,00.html
Bork 2010 Bork, H.: Chinas Kokain, Süddeutsche Zeitung N° 257, pp. 28-29, 6./7.Nov 2010
Bradsher 2010 Bradsher, K.: After China´s Rare Earth Embargo, a New Calculus; New York Times, 29.10.2010
Buchert 2010 Buchert, M., Öko-Institut: Life Cycle Assessment (LCA) of Ni-MH Batteries for HEV Application, IARC, Basel March 2010
Buckley 2010 Buckley, C: Dream for Rare Earths Rests On Grim Costs, In Reuters: Fight For Rare Earth, November 2010, China
Study on Rare Earths and Their Recycling
127
Bundesregierung 2009 Bundesregierung: Nationaler Entwicklungsplan Elektromobilität der Bundesregierung, August 2009
Byron Capital Markets 2010 Byron Capital Markets 2010: The Rare Earths. Pick your Spots carefully, March 2010
Canino et al. 2005 Canino, M.; Ulgiati, S.; Nivala, A.: A thermodynamic and environmental assessment of lanthanide chloride production from Bastnaesite. Second International Conference Sustainable Development Indicators in the Minerals Industry – SDIMI, Aachen, Germany, May 18th to 20th 2005
Che 2008 Che Liping, recovery of Rare Earth Minerals from the Tailings Dam of Baogang, abstracts from the 2th Academic Meeting on Rare Earths for Junior Scholars by the Chinese Society of Rare Earths in 2008, viewed 14 October, <http://wenku.baidu.com/view/1fdeca8a6529647d272852d0.html>
Chen 2007 Chen Jingyou, Exploration of methods in smelting rare-earth ferrosilicon, Sichuan Minjiang Si Industry Co.,Ltd., China, Journal of Ferro-alloys, No.1, 2007
Chen 2010 Chen Zhanheng, Outline on the development and policies of China rare earth industry, Deputy Director Office of the Chinese Society of Rare earths, April, 2010. Viewed 13 October 2010 <http://www.reitausa.org/storage/OutlineonthedevandPoliciesofChinaRareEarthindustry.pdf>
Chen et al. 2004 Chen, X.A.; Cheng, Y.E.; Xiao, H.; Feng, G.; Deng, Y.H.; Feng, Z.L.; Chen, L.; Han, X.M.; Yang, Y.J.; Dong, Z.H.; Zhen, R.: A Twenty-year Follow-up Study on Health Effects Following Long-term Exposure to Thorium Dusts; HEIR 2004, 9th International Conference on Health Effects of Incorporated Radionuclides Emphases on Radium, Thorium, Uranium and their Daughter Products, GSF-Bericht 06/05, Proceedings, Neuherberg, DE, Nov 29 - Dec 01, 2004
Cheng & Che 2010 Cheng Jianzhong, Che Liping, Current Mining Situation and Potential Development of Rare Earth in China, Baogang Research Institute of Mine, Baotou, Iron & Steel Co., China, Journal of Chinese Rare Earths, Vol.31, No.2, PP65-69, 04.2010
Cheng et al. 2008 Cheng Jianzhong, Hou Yunbing, Che Liping, Extracting Sc3+ Using Liquid Membrane Emulsion Technology, abstracts from the 2t Academic Meeting on Rare Earths for Junior Scholars by the Chinese Society of Rare Earths in 2008, viewed 14 October, <http://wenku.baidu.com/view/1fdeca8a6529647d272852d0.html>
China Net 2010 China Net, ‘China fights Rare Earth Defense Battle’ 25-05-2010, viewed 11 October 2010, <http://www.china.com.cn/economic/txt/ 2010-05/25/content_20110079_2.htm>
Study on Rare Earths and Their Recycling
128
China Securities Journal 2010 China Securities Journal, ‘about 40% of smuggling rare earths out of China, another way beyond export quota’ viewed 12 October 2010, <http://cs.xinhuanet.com/xwzx/05/201010/t20101009_2617310.html>
Clenfield, Shiraki 2010 Clenfield, J.; Shiraki, M.: Hitachi Develops Machine to Recycle Rare Earths to Cut Reliance on China, 6th December 2010, download from http://www.bloomberg.com/news/2010-12-06/hitachi-says-it-developed-machine-to-recycle-rare-earths.html
CSRE 2002 Chinese Society of Rare Earth: Annual report 2002
Daily News 2010 Daily News, June 15, 2010: Stron Global Consumer Electronics Growth Forecast
DEC 2008 Government of Western Australia, Department of Environment and conservation: Works Approval W4440/2008/1 for Mt. Weld Rare Earth Operation concentration Plant and Environmental Assessment Report, July 2008
DisplaySearch 2010 DisplaySearch 2010: Graphik on globale TV sales and forecast, cited in: Hevesi, M.: DisplaySearch: LCD-TV-Markt wächst weiter, LED setzt sich 2011 durch, 0.10.2010, PRAD Pro Adviser, http://www.prad.de/new/news/shownews_alg3719.html
DOE 2010 U.S. Department of Energy: Critical Materials Strategy. December 2010
EC 2010 European Commission, DG Enterprise and Industry: “Critical raw materials for the EU”; Report of the Ad-hoc Working Group on defining critical raw materials; 30 July 2010
Ecodesign 2009 Ecodesign Directive 2009/125/EC of the European Parliament and of the council of 21 October 2009 establishing a framework for setting of ecodesign requirements for energy-related products. In: Official Journal of the European Union, October 2009
EEA 2010 European Environment Agency: EEA to enhance cooperation with Greenland. 26 November 2010, download from http://www.eea.europa.eu/highlights/eea-to-enhance-cooperation-with-greenland
EEC 2010 Electron Energy Corporation: Electron Energy Corporation Wins Phase I Research Contract to Design Environmentally Friendly Magnetic Refrigerator for U.S. Air Force. February 2010, Landsville, PA
EPA 2006 Minister for the environment, employment and training; Statement No. 000476, Rare earths mining and beneficiation at Mt Weld, Laverton and secondary processing at Meenaar, near Northam, July 31st 2006.
Study on Rare Earths and Their Recycling
129
Eurostat 2010 Eurostat: External Trade, 18 November 2010, download from http://epp.eurostat.ec.europa.eu/newxtweb/setupdimselection.do
Fairley 2010 Fairley, P.: Windkraft ohne Umwelt, Technology Review, 20.04.2010, download from http://www.heise.de/tr/artikel/Windkraft-ohne-Umweg-985824.html
Fang et al. 2009 Fang, L.; Lee, B.; Lee, J.; Kim, H.; Hong, J.; Hanyang Univ., Seoul, South Korea : Study on high-efficiency characteristics of interior permanent magnet synchronous motor with different magnet material, Electrical Machines and Systems, 2009. ICEMS 2009.
Fischer 2010 Fischer, M. AMSC Windtec: Superconducting SeaTitan Opens up a New Path to 10 MW, RenewableEnergyWorld.com, 12. October 2010; download from http://www.renewableenergyworld.com/rea/news/article/2010/10/superconducting-seatitan-opens-path-to-10-mw
Fraunhofer ISI 2009 Angerer, G.; Marscheider-Weidemann, F.; Wendl, M.; Wietschel, M.: Lithium für Zukunftstechnologien. Nachfrage und Angebot unter besonderer Berücksichtigung der Elektromobilität; Karlsruhe, December 2009
Gao 2009 Gao,H., Tang,Y. „Recovery or rare earth from spent metal hydride-nickel batteries“ Shenyang Li-gong Daxue Xuebao 2009, (pp. 11 – 15)
GAO 2010 United States Government Accountability Office: Rare Earth Materials in the Defense Supply Chain. Briefing for Congressional Committees, April 1, 2010. GAO-10-617R
Gartner 2010 Computer Bild: PC-Markt 2011: Gartner sagt 16 % Wachstum voraus, 30. November 2010, http://www.computerbild.de/artikel/cb-News-PC-Hardware-PC-Markt-2010-Wachstum-Statistik-Studie-Informationstechnik-5807975.html
GFMS 2005 Hagelüken, C. (Umicore Precious Metals Refining); Buchert, M.; Stahl, H.; (Öko-Institut e.V.): Materials Flow of Platinum Group Metals – Systems Analysis and Measures for Sustainable Optimization of the Materials Flow of Platinum Group Metals. Umicore Precious Metals Refining and Öko-Institut e. V. ISBN 0-9543293-7-6, London: GFMS Ltd, 2005
GMEL 2009 Greenland Minerals and Energy Ltd.: Kvanefjeld Multi-Element Project, Pre-Feasibility Study - Interim Report Section 2, Executive Summary, December 2009
GMEL 2010a Greenland Minerals and Energy Ltd: Kvanefjeld Project, 09.11.2010 http://www.ggg.gl/Projects/Kvanefjeld-Project-Greenland.htm
Study on Rare Earths and Their Recycling
130
GMEL 2010b Greenland Minerals and Energy Ltd.: Building the foundations of a world-class mining project, October 2010 http://www.ggg.gl/userfiles/Greenland_Presentation_Oct_2010.pdf
GMEL 2010c Greenland Minerals and Energy Ltd.: Kvanefjeld Multi-Element Project, Pre-Feasibility Study - Interim Report, Market Summary, February 2010
Goldinvest 2010 Goldinvest: Seltene Erden suchen Weg aufs Parkett. 09.11.2010 http://www.goldinvest.de/index.php/frontier-rare-earths-seltene-erden-suchen-weg-aufs-parkett-18349
Guarde et al. 2010 Guarde, D.; von Heeren, C.; Sanchez, J.C.; Arnaiz, S.; Iribarnegaray, D.; Castillo, B.: Improved Management and Recycling of Waste Fluorescent Lamps. The Prolux Project; Care Innovation 2010, Vienna, Austria, 08.-11. November 2010
GWMG 2010a Great Western Minerals Group, 29.04.2010 http://www.gwmg.ca/images/file/PresentationGWMGApril29.pdf
GWMG 2010b Great Western Minerals Group, 04.11.2010 http://www.gwmg.ca/html/about_rare_earth_elements/key_stistics/index.cfm
Hassan 2001 Hassan, A.: “Rohstoffeinsparung durch Kreislaufführung von verbrauchten Katalysatoren aus der chemischen Industrie”, TU Berlin, UBA-Texte 21/01, Berlin März 2001.
Hatch 2010 Hatch, G.: Rare earths magnets. Earth, wind & fire. Industrial Minerals, June 2010, download from http://www.rareelementresources.com/i/pdf/IM_Wind_Power_And_RE_Article_2010_06.pdf
Heegn 2009 Heegn, H.: Recycling moderner Batterien, Teil 1: Aufbereitung von Nickel-Metallhydrid-Batterien. Aufbereitungstechnik 50 (2009), Nr. 6, S. 48-61
http://www.zhb.gov.cn/info/bgw/bbgth/200907/W020090713562804335545.pdf
Huang 2010 Huang, C. (Editor): Rare Earth Coordination Chemistry. Fundamentals and Applications, John Wiley &Sons, Singapore 2010
Hurst 2010 Cindy Hurst, China’s Rare Earth Elements Industry: What Can the West Learn?, Institute for the Analysis of Global Security (IAGS), 03.2010
Hykawy 2010 Hykawy, J.: Report on the 6th International Rare Earths conference, Hong Kong, download from http://www.techmetalsresearch.com/2010/11/6th-international-rare-earths-conference, last access 05 Dec 2010
Study on Rare Earths and Their Recycling
131
IEA 2009 International Energy Agency: Technology Roadmap. Electric and plug-in hybrid electric vehicles, 2009
Ifeu / Öko-Institut 2010 Institut für Energie- und Umweltforschung GmbH, Öko-Institut e.V.: Wiederaufladbare Lithium-Batterien für den Einsatz in tragbaren Geräten. Entwicklung der Vergabekriterien für ein klimaschutz-bezogenes Umweltzeichen. PROSA Kurzstudie; Darmstadt / Heidel-berg, 2010
Jaspersen McKeown 2008 Jaspersen McKeown, A.: Strong Growth in Compact Fluorescent Bulbs reduces electricity demand. World Watch Institute, Oct 27, 2008, http://www.worldwatch.org/node/5920
JDSU 2009 JDS Uniphase Corporation: Solar Cell Coverglass, Radiation-Resistant Glass, April 2009
Jenkins 2010 Jenkins, S.: Rare-Earth metals for the future. Chemical Engineering, 1th oct 2010, download from http://www.che.com/processing_and_handling/solids_handling/
Jiang 2008 Jiang Zilian, Research Progress of Gd-Si-Ge Magnetic Refrigerant Material, Journal of Material&Heat Treatment, 1001-3814(2008)-0099-04, viewed 14 October http://wenku.baidu.com/view/aa920517866fb84ae45c8ded.html
JOGMEC 2010 Japan Oil, Gas and Metals National Corporation: metal recycling project from Ni-H batteries for hybrid electric vehicles and slag, Homepage der JOGMEC, http://www.jogmec.go.jp/english/activities/technology_metal/recyclingproject.html, download July 2010
Jüstel 2007 Jüstel, T., University of Applied Sciences Münster: Fluorescent lamp phosphors. Is there still News? PGS, Seoul, March 2007
Kanasawa & Kamitani 2006 Kanasawa, Y. and Kamitani, M.: Rare earth minerals and resources in the world. Journal of Alloys and Compounds, Vol. 408-412, pp. 1339-1343, 2006
Katter 2010 Katter, M.: Magnetische Kühlung für die Industrie, ElektronikPraxis Nr. 14, 26. July 2010
Kawasaki et al. 2003 Kawasaki, T., Itoh, M.; Machida, K.: Reproduction of Nd-Fe-B sintered magnet scraps using a binary alloy blending technique, Osaka University, Japan. Materials Transaction, Vol. 44, No. 9, 2003
Kettwig 2009 Kettwig, H., ENERCON: Stabilität auf hohem Niveau, Sonne Wind & Wärme 11/2009
Study on Rare Earths and Their Recycling
132
Kingsnorth 2010 Kingsnorth, D., IMCOA: “Rare Earths: Facing New Challenges in the New Decade” presented by Clinton Cox SME Annual Meeting 2010, 28 Feb – 03 March 2010, Phoenix, Arizona
Koenemann & Tschierschke 2006 Koenemann, D.; Tschierschke, M.: Offshore class prototypes. Sun, Wind and Energy, volume 1/ 2006; http://www.wwindea.org/technology/ch01/estructura-en.htm
Komuro et al. 2010 Komuro, M.; Satsu, Y.; Suzuki, H.: Microstructure and magnetic properties of NdFeB magnets using fluorides nano-coated process, Advanced Research Laboratory, Hitachi Ltd., Japan, Materials Science Forum, Vol. 634-642, pp. 1357-1362, 2010
Koyama 2009 Koyama,K., Kitajima,A., Tanaka,M. “Selective leaching of rare earth elements from an Nd-Fe-B-magnet” Kidorui 2009 (pp. 36 – 37)
Kudling 2010 Kudling, M.: Japanische Forscher entwickeln Elektromotor ohne Seltene-Erde-Metalle, Wattgehtab News, 11. October 2010, download from http://www.wattgehtab.com/elektroantrieb/japanische-forscher-entwickeln-elektromotor-ohne-seltene-erde-metalle-2808
Lifton 2010a Lifton, J.: The billion-dollar rare-earth-mining club, published 10/1/2010, download from Resource Investor, http://www.resourceinvestor.com/News/2010/10/Pages/The-Billion-Dollar Rare Earth Mining-Club.aspx, last access 2.12.2010
Lifton 2010b Jack Lifton, A report from the Rare Earths conference in Beijing, viewed 07 October 2010, <http://www.resourceinvestor.com/News/2010/8/Pages/A-Report-From-The-Rare-Earths-Conference-In-Beijing.aspx>
Lin 2009 Lin Hecheng, The Development and Prospect of China’s Rare Earth Production, Journal of Rare earth, Vol.1, PP11-17, 2009
Liu et al. (2008) Liu Yuzhu, He Huaqiang, Zhuang Weidong, Wu Hao, Zeng Jia, Yuan Laisuo, Study on Green Synthese Techniques of highly purified Dysprosium Iodide for HID Lamp, abstracts from the 2th Academic Meeting on Rare Earths for Junior Scholars by the Chinese Society of Rare Earths in 2008, viewed 14 October, <http://wenku.baidu.com/view/1fdeca8a6529647d272852d0.html>
Luidold 2010 Luidold, S., Montanuniversität Leoben, AT: Urban Mining von Seltenen Erden. Recycling Magazin, Band 65, Heft 14, Sonderheft: Metallrecycling, p. 30-33, 2010
Luo et al. 2008 Luo Xinghua, Huang Xiaowei, Long Zhiqi, Cui Dali, Recycling of thorium in the green process of bastnaesite, abstracts from the 2th Academic Meeting on Rare Earths for Junior Scholars by the Chinese Society of Rare Earths in 2008, viewed 14 October, <http://wenku.baidu.com/view/1fdeca8a6529647d272852d0.html>
Study on Rare Earths and Their Recycling
133
Lynas 2009 Lynas Corporation Ltd: Annual Report 2009
Lynas 2010a Lynas Corporation Ltd: Rare Earths. J.P. Morgan. Australia Corporate Access Days. New York 27-28 September 2010
Lynas 2010b Lynas Corporation Ltd: Homepage, 09.11.2010, http://www.lynascorp.com/
M2i 2009 Materials innovation institute: Material Scarcity. An M2i study by Wouters, H. and Bol, D., Netherlands, November 2009
Manhart 2010 Manhart, A (Öko-Institut e.V.): Nachhaltige Rohstoffwirtschaft durch Zertifizierung. Jahrbuch Ökologie, Umwälzung der Erde. Konflikte um Ressourcen, p.126-131; Stuttgart, 2009
Marwan 2010 Marwan, P.: SDD gegen HDD: Vor- und Nachteile der Technologien aus Firmensicht. ZDNET.de, 21. January 2010, download from http://www.zdnet.de/it_business_technik_ssd_gegen_hdd_vor__und_nachteile_der_technologien_aus_firmensicht_story-11000009-41525969-1.htm
Matoy 2008 Matoy, A.: Die Entwicklung bei Batterien und Antriebstechnik für Elektroautomobile. Download from http://www.park-charge.ch/documents/0801Mathoy.pdf. Bulletin SEV/AES 1/2008
McKinsey 2009 McKinsey & Company: Roads toward a low-carbon future: Reducing CO2 emissions from passenger vehicles in the global road transportation system. March 2009
McKinsey 2010 McKinsey & Company: Beitrag der Elektromobilität zu langfristigen Klimaschutzzielen und Implikationen für die Automobilindustrie, Berlin, 15. April 2010
Mei et al. 2007 Mei Guangjun, Xie Kefeng, Li Gang, Progress in study on spent fluorescent lamps’ harmless disposal and resource utilization, College of Resources and Environmental engineering, Wuhan University of Technology, China. 2007
Meor Yusoff and Latifah 2002 Meor Yusoff, M.S.; Latifah, A.: Rare earth processing in Malaysia: case study of ARE and MAREC plants. Proceedings of Regional Symposium on Environment and Natural Resources, 10-11 April, Kuala Lumpur, Vol. 1, p287-295; 2002
MEP 2009 Ministry of Environmental Protection In: The Explanation of Compiling Emission Standards of Pollutants from Rare Earths Industry 2009 viewed 11 October 2010,
Messer 2009 Messer, A.E.: Rare earth metal enhances phosphate glass. Innovations report. 16 December 2009, download from http://www.innovations-
Study on Rare Earths and Their Recycling
134
report.de/html/berichte/materialwissenschaften/rare_earth_metal_enhances_phosphate_glass_145748.html
Metal Pages 2009 Metal Pages: Coastal Pacific Mining to enter joint venture to explore for Rare Earth in Ireland, November 2009
MIIT 2009 Ministry of Industry and Information Technology of China: The 2009-2015 Plans for Developing the Rare Earth Industry
MIIT 2010 Ministry of Industry and Information Technology of China: Notice on the consultative draft of “Entry Criterions for Rare Earth Industry”, May 2010
MOFCOM 2010a The Ministry of commerce of the People’s Republic of China: Large rare earths deposit found in central China, viewed 08 October 2010 http://english.mofcom.gov.cn/aarticle/newsrelease/commonnews/201010/20101007173822.html
MOFCOM 2010b The Ministry of commerce of the People's Republic of China Department of Foreign Trade, viewed 09 October 2010 <http://wms.mofcom.gov.cn/aarticle/zcfb/n/200912/20091206714593.html?423415892=721652780>
Molycorp 2010a Molycorp Minerals. Revised mine and reclamation plan for the mountain pass mine. Draft: subsequent mitigated negative declaration. Subsmitted to County of San Bernardino, prepared by Environmental Audit, Inc. September 2010 (download from http://www.sbcounty.gov/landuseservices/Public%20Notices/Projects/Projects.htm)
Molycorp 2010b Molycorp Minerals: Security-registration Statement from 7/13/2010, download from http://sec.edgar-online.com/molycorp-inc/s-1a-securities-registration-statement/2010/07/13/section19.aspx
Molycorp 2010c Molycorp Minerals: Global Outlook, viewed 10 November 2010 http://www.molycorp.com/globaloutlook.asp
National Academics 2008 “Minerals, Critical Minerals, and the U.S. Economy”, Committee on Critical Mineral Impacts of the U.S. Economy, Committee on Earth Resources, National Research Council, National Academy of Sciences (editor), Washington D.C. 2008
NEDO 2009 New Energy and Industrial Technology Development Organization (NEDO): National Project 2009 Rare Metal Substitute Materials Development Project, R&D period from 2008-2013: Outline of the National Projects. Download from www.nedo.go.jp/kankobutsu/pamphlets/04nano/nano_e/13.pdf, last access 6th dec 2010
Study on Rare Earths and Their Recycling
135
Northeastern University 2008 Northeastern University: Norteastern University Scientists discover rapid, cost-effective, 100% recyclable method to produce ultra-strong magnets. University communications & Publications. campus News. download from http://www.northeastern.edu/nupr/news/0708/Magnet_Samarium_Coba.html, 2008
Oakdene Hollins 2010 Oakdene Hollins Research & Consulting: Lanthanide Resources and Alternatives, A report for Deparment for Transport and Department for Business, Innovation and Skills. March 2010
Öko-Institut 2007 Öko-Institut e.V.: Chancen der Nanotechnologie nutzen! Risiken rechtzeitig erkennen und vermeiden! Positionspapier des Öko-Instituts e.V., Freiburg / Darmstadt, Juni 2007
Öko-Institut 2009 Bleher, D.; Buchert, M.; Schüler, D. (Öko-Institut e.V.): Critical Metals For Future Sustainable Technologies and Their Recycling Potential. UNEP DTIE (editor), Paris, July 2009
Öko-Institut&Eurometaux 2010 Öko-Institut e.V. & Eurometaux-European Association of Metals: Eurometaux´s proposals for the raw materials initiative, Darmstadt / Brussels, June 2010
Orris & Grauch 2002 Orris, G.J. & Grauch, R.I.: Rare Earth Element Mines, Deposits and Occurrences. – USGS Open File Rep., 02-189: 174pp; 2002, Tucson, AZ
OSRAM 2009 United States Patent Application Publication. Inventors: Otto, R.; Wojtalewicz-Kasprzak, A. Assignee: OSRAM GmbH, title: Method for recovery of rare earths from fluorescent lamps. Pub. No. US 2009/0162267 A1
Patent information 2010 Patent information on rare earth technologies, viewed 16 October 2010, http://www.cnzljs.cn/Html/?3323.html
Perelygin et al. 2008 Perelygin, A.; Kuchkin, A.; Kharkov, N.; Moskvina, T.: Criminalistic identification of PGM-containing products of mining and metallurgical companies. In: Forensic Science International 174, 2008
Philips 2008 den Daas, K.: Lighting: Building the future, New York, March 5, 2008.
Pillot 2009 Pillot, C.: Present and future market situation for batteries, Batteries 2009, Sep30th – Oct 2nd. 2009
Rabah 2008 Rabah, M.: Recyclables recovery of europium and yttrium metals and some salts from spent fluorescent lamps, Waste management 28, P. 318-325, 2008
RES 2010 Rare Element Resources, 09.11.2010 www.rareelementresources.com
Study on Rare Earths and Their Recycling
136
Resende Morais 2010 Resende, L.; Morais, C.: Study of the recovery of rare earth elements from computer monitor scraps – leaching experiments, Minerals Engineering 23, P.277-280, 2010
Reuters 2010 Reuters: India aims for 2011 rare earth exports, download from www.reuters.com/article/idUSTRE69Q1V320101027, last access 2.12.2010
Reuters 2010b The Economic Times: Toyota to launch lithium battery Prius in 2011. Reuters, 17 Apr 2010, download from http://economictimes.indiatimes.com/news/news-by-industry/auto/automobiles/Toyota-to-launch-lithium-battery-Prius-in-2011-Report/articleshow/5823862.cms
Riedel et al. 2007 Riedel, E. (Hrsg.): Moderne Anorganische Chemie, 3. Auflage, De Gruyter Verlag 2007
Risø 1990 Pilegaard, K.: Preliminary Environmental Impact Statement for the Kvanefjeld Uranium Mine; Risø National Laboratory, Roskilde, Denmark, 1990
Scott Wilson 2010 Scott Wilson Mining: Technical report on the Thor Lake Project, NI 43-101 Report, July 2010.
Shi 2008 Shi Zhihong, Method for extracting neodymium from neodymium-iron-boron electroplating pro-processing acid washing waste water, Patent No. CN 200710156061 A, 2008. viewed 15 October 2010, http://ip.com/patapp/CN101186970
Shirayama Okabe 2009 Shirayama, S.; Okabe, T.: Selective extraction of Nd and Dy from rare earth magnet scrap into molten salt, Processing materials for Properties, The Minerals, Metals & Materials Society, 2009
Sun et al. 2008 Sun Yan, Hu Ruisheng, Bai Feng, Ma Lan, Xu Na, Preparation of La2BtiO6(B=Mn,Fe) catalysts and their photocatalytic activities in Phenol Degradation, abstracts from the 2th Academic Meeting on Rare Earths for Junior Scholars by the Chinese Society of Rare Earths in 2008, viewed 14 October, <http://wenku.baidu.com/view/1fdeca8a6529647d272852d0.html>
Tabuchi 2010 Tabuchi, Hiroko: Japan recycles minerals from used electronics, published on NYTimes.com, 4th October 2010
Takeda 2009 Takeda,O., Nakano,K., Sato,Y. “Resource recovery from waste of rare earth magnet by utilizing fluoride molten salts” Yooyuen oyobi Koon Kagaku 2009 (pp. 63 – 70)
Tang et al. 2009 Tang Jie, Wei Chengfu, Zhao Daowen, Lin Hong, Tian Guihua, Nd2O3 Recovery from Sintered NdFeB scrap, Journal of Rare Metals and
Study on Rare Earths and Their Recycling
137
Cemented Carbides, 2009-01, abstract viewed 15 October 2010, <http://en.cnki.com.cn/Article_en/CJFDTOTAL-XYJY200901004.htm>
Tantalus 2010 Tantalus Rare Earths AG: The Tantalus Rare Earths-Tantalum-Niobium-Zirconium Project in Northern Madagascar. A Key Project in the Area of Rare Earths, Düsseldorf, Germany, 2010
Terra Magnetica 2009 Terra Magnetica: 10 MW And Beyond: Are Superconductors The Future Of Wind Energy? 7 August 2009, download from http://www.terramagnetica.com/2009/08/07/10-mw-and-beyond-are-superconductors-the-future-of-wind-energy/
The Explanation of Compiling Emission Standards of Pollutants from Rare Earths Industry 2009 viewed 11 October 2010, <http://www.zhb.gov.cn/info/bgw/bbgth/200907/W020090713562804335545.pdf>
Thorium 2010 Thorium Energy Inc.: Lemhi Pass Rare Earth, viewed 10 November 2010, http://www.thoriumenergy.com/index.php?option=com_content&task=view&id=19&Itemid=37
Trade Statistics Japan 2010 Trade Statistics of Japan, Ministry of Finance, 23 November 2010, download from http://www.customs.go.jp/toukei/srch/indexe.htm
Trendforce 2010 Press center of Trendforce Corp: LEDinside: Compound annual growth rate of LED light source reaches 32 %. 14.01.2010, http://press.trendforce.com/en/node/373
Trout 2007 Trout, S.R.: Magnet Recycling. Magnetics Magazine, 2007, download from http://www.spontaneousmaterials.com/Papers/Summer2007.pdf
Ucore 2010 Ucore Rare Metals Inc: Projects – Bokan Mountain, 09.11.2010, http://www.ucoreraremetals.com/bokan.asp
University of Science & Technology Beijing 2009 University of Science & Technology Beijing, Cleaning production technique for directly transforming rare earth sulphate bake ore to extract rare earth, Patent CN 200810225955 A, viewed 15 October, <http://ip.com/patapp/CN101392332>
USGS 2002 U.S. Geological Survey: Rare earth elements – critical resources for high technology. USGS Fact Sheet 087-02, 2002
USGS 2008 U.S. Geological Survey, 2008 Minerals commodity Summaries Rare Earths, January 2008
USGS 2010a U.S. Geological Survey, Mineral commodity Summaries, Rare Earths, January 2010
Study on Rare Earths and Their Recycling
138
USGS 2010b U.S. Geological Survey, Mineral commodity Summaries, Yttrium, January 2010
USGS 2010c U.S. Geological Survey, 2008 Minerals Yearbook Rare Earths (Advance release), October 2010
USGS 2010d U.S. Geological Survey, 2008 Minerals Yearbook Cobalt (Advance release), April 2010
USGS 2010e U.S. Geological Survey, 2008 Minerals Yearbook Rare Earths (Advance release), Appendix C October 2010
USGS 2010f U.S. Geological Survey: The principal rare earth elements deposits of the United States, USGS Scientific Investigations Report 2010-2050, 2010
USGS 2010g U.S. Geologival Survey: Mineral commodity Summaries, Cobalt, January 2010
Wang 2009 Wang Guozhen, Current Mining Situation and Potential Development of Rare Earth in China, China Nonferrous Engineering and Research Institute, Journal of Sichuan Rare earth, No 3, 2009
Wang et al. 2005 Wang Hongzhen, Liang Yong, Jiang Pingguo, Recovering the rare earth from red mud generation, Rare earth letter 1008-5939(2005)10-005-04, 2005
Wang et al. 2006 Wang Yijun, Liu Yuhui, Guo Junxun, Wang Suling, Weng Guoqing, Recovery of Rare Earth Metals from NdFeB Waste Materials using Hydrochloric Acid, Journal of Hydrometallurgy of China 2006-04, abstract viewed 15 October 2010, <http://en.cnki.com.cn/Article_en/CJFDTotal-SFYJ200604009.htm>
Wickleder 2010 Wickleder; C: Leuchtstoffe der Zukunft, in: chemie&more – Energie: Licht-Lampen – Lumineszens, labore&more, 1/2010, download from http://www.laborundmore.de/news/485689/chemiemore-Energie:-Licht-%E2%80%93-Lampen-%E2%80%93-Lumineszenz.html
Wings 2010b Wings Enterprises Inc.: Homepage, last access: 10.11.2010, http://www.wingsironore.com/
WISE-Uranium 2010 WISE-Uranium Project, download from http://www.wise-uranium.org/mdafko.html, last access: 02.12.2010
WNN 2010 World Nuclear News, 13.09.2010: Greenland clears way for uranium study; download from http://www.world-nuclear-news.org/ENF-Greenland_clears_way_for_uranium_study-1309104.html; last access: 02.12.2010
Study on Rare Earths and Their Recycling
139
Wojtalewicz-Kasprzak 2007 Wojtalewicz-Kasprzak, A.: Erzeugung von synthetischen Selten-Erd-Konzentraten aus Leuchtstoffabfällen. Dissertation an der TU Clausthal, 2007
Worldsteel 2010 Worldsteel Association: worldsteel Short Range Outlook, 04 October 2010, Tokyo; download from http://www.worldsteel.org/?action=newsdetail&id=309
Wu & Zhang 2010 Wu Wei, Zhang Honglin, Recovery of Ni, Co, Rare Earth from Waste MH-Ni Battery, Chinese Journal of Rare Metals, No.1, last access: 14.10.2010, <http://en.cnki.com.cn/Article_en/CJFDTOTAL-ZXJS201001016.htm>
WWEA 2010a World Wind Energy Association (WWEA): World Wind Energy Report 2009, http://www.wwindea.org/home/index.php, last access: 30.11.2010
WWEA 2010b World Wind Energy Association (WWEA): Table “Wind Power Worldwide June 2010”, published on http://www.wwindea.org/home/index.php, last access: 30.11.2010
XIAN Technological University 2009 XIAN Technological University, Method for separating and recovering mixed vector dispersed supported liquid membrane of heavy rare earth metal, Patent CN 200910022410 A, viewed 15 October, http://ip.com/patapp/CN101560612
Xiangshen et al. 2006 Xiangsheng, L., Jiachen, W., Jun, Y., Yubin, F., Yanping, W., He, Z.: Applications of rare earth phosphate fertilizer in western area of China. Journal of Rare Earths, Vol. 24, page 423-426, 2006
Xu & Wang 2007 Xu, X.; Wang, Z.: Phosphorus Uptake and Translocation in Field-Grown Maize after Application of Rare Earth-Containing Fertilizer. Journal of Plant Nutrition, April 2007, download from http://www.informaworld.com/smpp/941799145-63272489/content~db=all~content=a777113091~frm=abslink
Zajec 2010 Zajec, O.: China – Herr über die seltenen Erden; Monde Diplomatique, Internationale Beilage der tageszeitung, November 2010
Zakotnik et al. 2009 Zakotnik, M.; Harris, I.R.; Williams, A.J. Institution University of Birmingham: Multiple recycling of NdFeB-type sintered magnets. Journal of Alloys and Compounds * Band 469, Heft 1-2, pp. 314-321, 2009
Zhang et al. 2010 Zhang Xuanxu, Yu Danghua, Guo Lianping, Test Study New Process on Recovering Rare Earth by Electrical Reduction – P507 Extraction Separation Method, Journal of Copper Engineering, Vol 1, 1009-3842(2010)-0066-04, 2010

Study on Rare Earths and Their Recycling
140
Zhong et al.2007 Zhong Xiaolin, Song Ning, Gong Bi, Preparation of Mn-Zn Ferrites Powder by Waste From Recycling the NdFeB Magnet Scrap, Journal of Mianyang Normal University, Vol 5, 2010, viewed 15 October 2010, <http://www.cnki.com.cn/Article/CJFDTOTAL-MYSF201005013.htm>


![Yangibana Rare Earths Project Environmental Review ... · Yangibana Rare Earths Project Environmental Review Document [1] Yangibana Rare Earths Project Environmental Review Document](https://img.pdfslide.net/doc/110x75/5e4823f9e96f8107dc434563/yangibana-rare-earths-project-environmental-review-yangibana-rare-earths-project.jpg)