Embed Size (px)
Citation preview
Reaction Kinetics Of Bismuth Dissolution From Lead Cake By Sulfuric Acid Leaching
J. D. Miller, J. A. Herbst, and J. L. Sepulveda
Abstract-Lead cake, a zinc smelter flue dust residue, consists primarily of lead sulfate. Characteristic properties of lead cake were determined in order to aid the understanding of reaction mechanisms involved in bismuth removal from lead cake by sulfuric acid digestion. Sp gr (specific gravity) measurements, surface area measurements, and photomicrographs revealed that the particles of lead cake are quite porous and seem to consist of an agglomeration of sub micron grains (0.4 !-1m) fused together in a manner similar to cement clinker. Analysis of experimental rate data, which was independent of particle size, indicates that the dissolution reaction involves two distinct, rate limiting steps. The initial stage of reaction appears to be limited mainly by intergranular diffusion of the reactant, hydrogen ion, while the latter stage of reaction appears to be controlled by diffusion of soluble reaction products through the reaction product layer of the individual grains.
Introduction
The initial step in processing flue dust from St. Joe's zinc smelter for cadmium recovery is a selective sulfation roast at 450 0 c.l The principal products from the roast are zinc oxide, cadmium sulfate, and lead sulfate. A water leach of the roasted material results in 80% recovery of the water soluble cadmium. After further purification by dichromate, the liquor containing the cadmium is further processed in another reactor where cementation of cadmium sponge is accomplished with zinc dust
388 APRI L 1978
at pH 4. The residue from the water leach goes to an acid leach (5 to 20 giL sulfuric acid) which dissolves the zinc and re;.idual cadmium. The liquor from this leach is neutralized, and reacted, with metallic zinc to produce cadmium slime which is oxidized and recycled to the selective sulfation roast. Details of the flow sheet and operating conditions have been reported by Sheppard and Marte\.2 The residue from the dilute acid leach is referred to as lead cake, which consists primarily oflead sulfate.
Lead cake contains a significant amount of silver, in excess of 2570 glt (100 oz. per ton), and as such represents a valuable product. The full value of this product may not be realized, however, due to penalties imposed for bismuth content by some lead smelters. Indeed, some lead smelters, require feed material containing less than 0.02% bismuth. Research was initiated to investigate details of the sulfuric acid leach to determine if bismuth could be removed from the lead cake selectively with respect to the silver and lead content. In a previous publicaiton the critical nature of chloride addition necessary to obtain enhanced selective dissolution of bismuth from smelter flue dusts was established. 3
J. D. Miller, Member SME, is an Associate Prof., J. A. Herbst, Member SME, is an Associate Prof., and J. L. Sepulveda, Member SME, is a Graduate Research Assistant, Metallurgy Dept., Univ. of Utah, Salt Lake City, UT. 76B215. Manuscript, May 27, 1976. Discussion of this paper must be submitted, in duplicate, prior to July 30,1978.
• SOCIETY ..
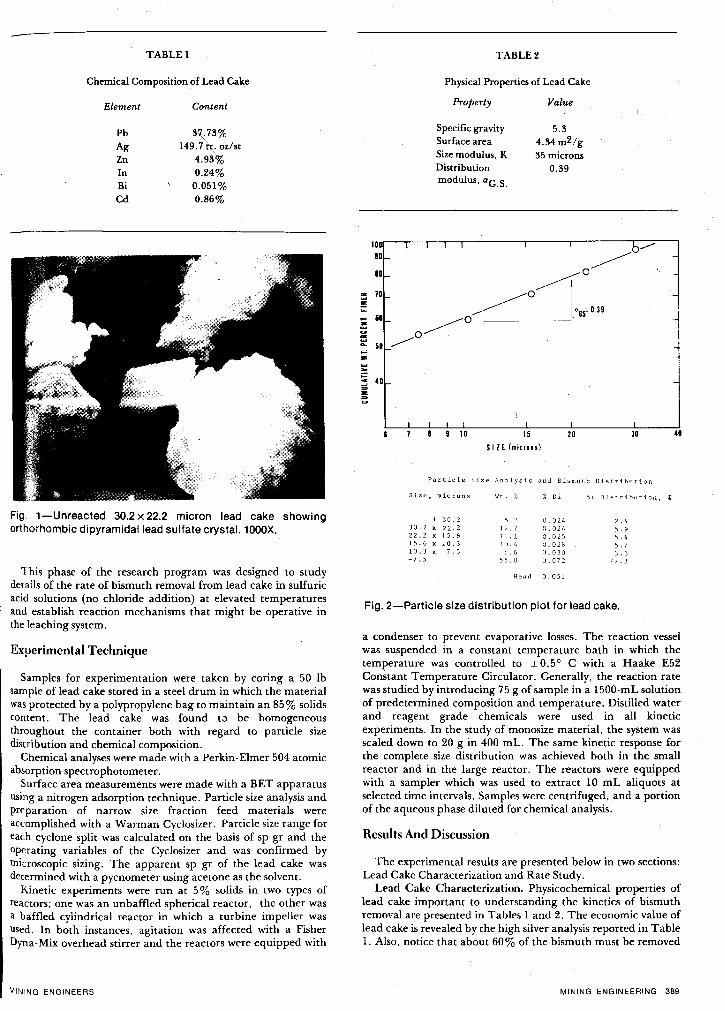
TABLE 1
Chemical Composition of Lead Cake
Element Content
Pb 1)7,,73% Ag 149.7 tr,. oz/st Zn 4.91)% In 0.24% Bi 0.051% Cd 0.86%
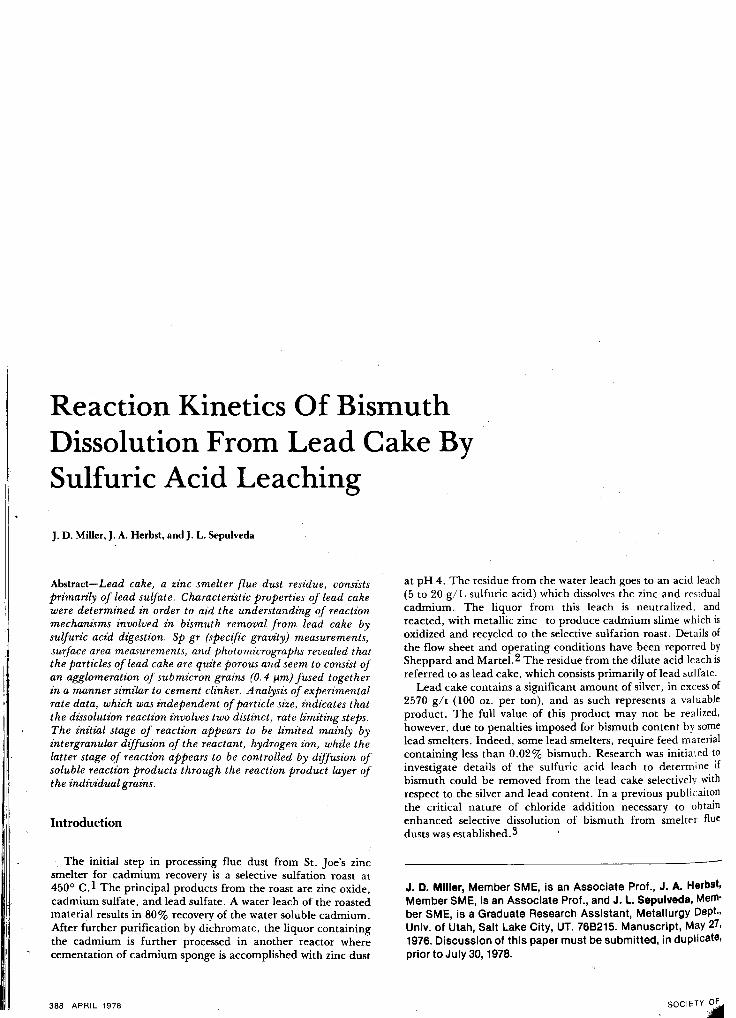
Fig. 1-Unreacted 30.2 X 22.2 micron lead cake showing orthorhombic dipyramidallead sulfate crystal. 1000X.
This phase of the research program was designed to study details of the rate of bismuth removal from lead cake in sulfuric acid solutions (no chloride addition) at elevated temperatures and establish reaction mechanisms that might be operative in the leaching system.
Experimental Technique
Samples for experimentation were taken by coring a 50 lb sample of lead cake stored in a steel drum in which the material was protected by a polypropylene bag to maintain an 85% solids content. The lead cake was found tv be homogeneous throughout the container both with regard to particle size distribution and chemical composition.
Chemical analyses were made with a Perkin· Elmer 504 atomic absorption spectrophotometer.
Surface area measurements were made with a BET apparatus using a nitrogen adsorption technique. Particle size analysis and preparation of narrow size fraction feed materials were accomplished with a Warman Cyclosizer. Particle size range for each cyclone split was calculated on the basis of sp gr and the operating variables of the Cyclosizer and was confirmed by microscopic sizing. The apparent sp gr of the lead cake was determined with a pycnometer using acetone as the solvent.
Kinetic experiments were run at 5 % solids in two types of reactors; one was an unbaffled spherical reactor, the other was a baffled cylindrical reactor in which a turbine impeller was Used. In both instances, agitation was affected with a Fisher Dyna-Mix overhead stirrer and the reactors were equipped with
MINING ENGINEERS
100 10
10
-~ 10 !!
- 6D :; ~
::: 50
"" .. ~
> ; 40
~
TABLE 2
Physical Properties of Lead Cake
Property
Specific gravity Surface area Size modulus, K Distribution modulus, <l'G.S.
Value
5.1) 4.!!4 m 2 /g 35 microns
0.39
0-----0~1
~ "GS~0.39 ~O
.........----0
9 10 15 20
S II E (microns)
30
Particle Sizt;' Analysis and Bismuth Distribution
Size. mic rons \.'t. % % Bi Bi Il i ~ t r i btl t i on.
+ 30.2 5.2 0.024 2.4 30.2 x 22.2 12.7 0.02/1 5. ~ 22.2 x 15.6 11 .1 0.025 5.4 15.6 x "0.3 10. I, 0.028 5.7 10.3 x 7.5 5.6 0.010 3.3 -7.5 55.0 U. 07 2 77.3
Head 0.051
Fig. 2-Particle size distribution plot for lead cake.
40
%
a condenser to prevent evaporative losses. The reaction vessel was suspended in a constant temperature bath in which the temperature was controlled to ± 0.5 0 C with a Haake E52 Constant Temperature Circulator. Generally, the reaction rate was studied by introducing 75 g of sample in a 1500-mL solution of predetermined composition and temperature. Distilled water and reagent grade chemicals were used in all kinetic experiments. In the study of monosize material, the system was scaled down to 20 g in 400 mL. The same kinetic response for the complete size distribution was achieved both in the small reactor and in the large reactor. The reactors were equipped with a sampler which was used to extract 10 mL aliquots at selected time intervals. Samples were centrifuged, and a portion of the aqueous phase diluted for chemical analysis.
Results And Discussion
The experimental results are presented below in two sections: Lead Cake Characterization and Rate Study.
Lead Cake Characterization. Physicochemical properties of lead cake important to understanding the kinetics of bismuth removal are presented in Tables 1 and 2. The economic value of lead cake is revealed by the high silver analysis reported in Table 1. Also, notice that about 60% of the bismuth must be removed
MINING ENGINEERING 389
to meet the desired level of 0.02% bismuth. X-ray diffraction patterns revealed that the major component of lead cake is lead sulfate. No other structure could be identified. Presumably other metallic constituents are present either as solid solutions and/ or as minor oxides and sulfoxide compounds. The physical properties listed in Table 2 show that the lead cake has an apparent sp gr close to that of crystalline lead sulfate (6.3). The lower sp gr for lead cake (5.3) arises from the porous nature of the lead cake material, also demonstrated by surface area measurements, 4.34 m2/ g, and photomicrographs obtained with a Cambridge Steroscan Scanning Electron Microscope. A photomicrograph of a sample of the lead cake is presented in Fig. 1. 'Of particular interest in the photomicrograph of the 30.2 X 22.3 micron size fraction is a well-formed, orthorhombic dipyramidal crystal, which by EDAX analysis, was shown to be lead sulfate in one of its most common crystal habits.
Size distribution data for the "as is" feed material is shown by the lo~-log plot of cumulative weight-percent finer vs. particle size in Fig. 2, and a good straight line can be drawn through the data points which indicates that the particulate assemblage conforms to the Gaudin-Schuhmann Eq. :
d ' ac.s. F3(di) = 100 (....!.)
K (1)
with ac.s. = 0.39 and K == 35 microns , where F3(di) = cumulative weight-percent finer than size di; d(= particle diam , microns ; K=size modulus . microns ; and ac. S. c.= distribution modulus .
Also included in Fig. 2 is a tabulation of the particle size data and the bismuth distribution . Notice that the - 7.5 /Am material contains 77% ofthe bismuth .
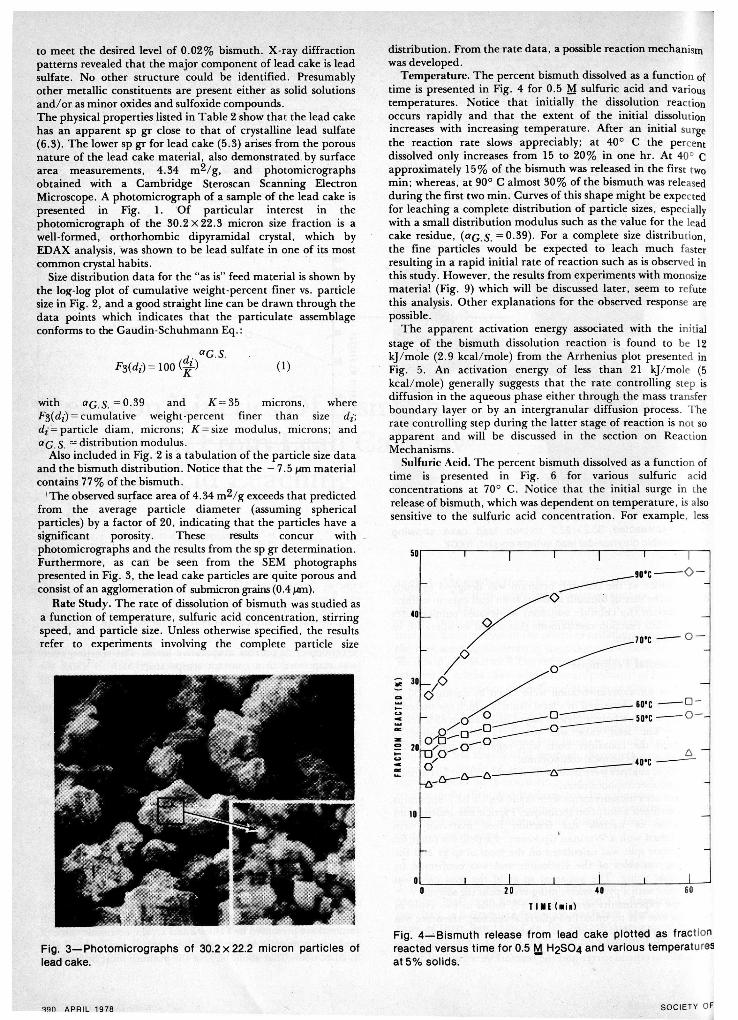
I The observed surface area of 4.34 m2/ g exceeds that predicted from the average particle diameter (assuming spherical particles) by a factor of 20, indicating that the particles have a significant porosity. These results concur with photomicrographs and the results from the sp gr determination. Furthermore, as cart be seen from the SEM photographs presented in Fig. 3, the lead cake particles are quite porous and consist of an agglomeration of submicron grains (0.4 /AID).
Rate Study. The rate of dissolution of bismuth was studied as a function of temperature , sulfuric acid concenlration, stirring speed, and particle size . Unless otherwise specified, the results refer to experiments involving the complete particle size
Fig. 3-Photomicrographs of 30.2 X 22.2 micron particles of lead cake.
~~n APRIL 1978
distribution. From the rate data, a possible reaction mechanism was developed.
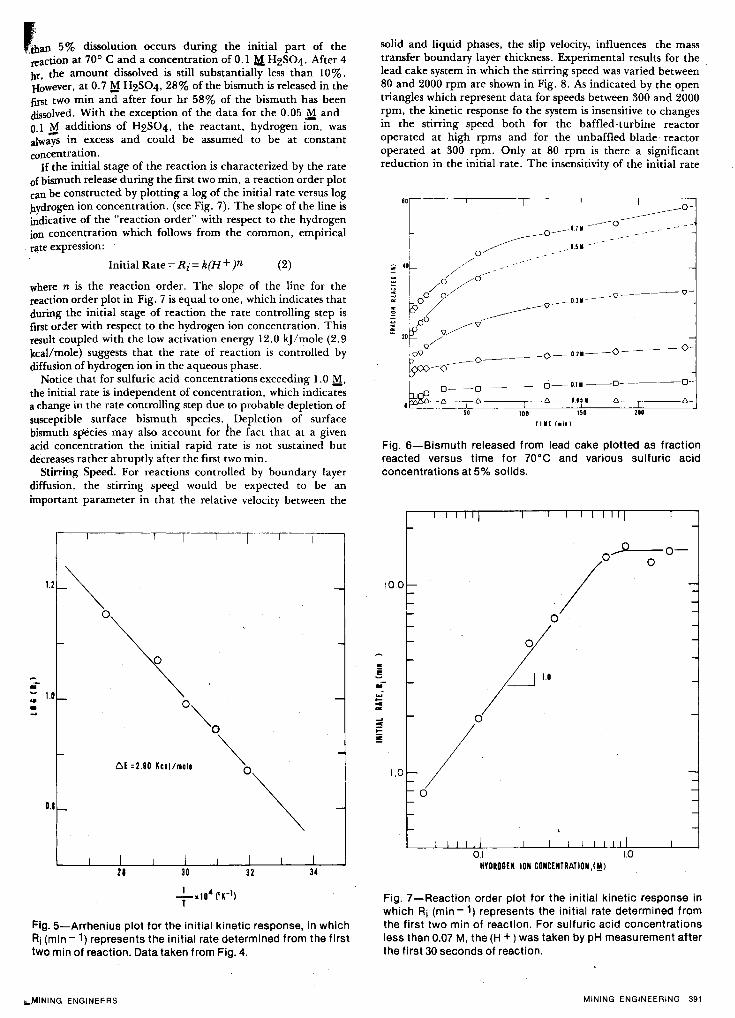
Temperature. The percent bismuth dissolved as a function of time is presented in Fig. 4 for 0.5 M sulfuric acid and various temperatures. Notice that initially the dissolution reaction occurs rapidly and that the extent of the initial dissolution increases with increasin.g temperature. After an initial surge the reaction rate slows appreciably; at 40° C the percent dissolved only increases from 15 to 20% in one hr. At 40° C approximately 15% of the bismuth was released in the firs t two min; whereas, at 90° C almost 30% of the bismuth was released during the first two min . Curves of this shape might be expected for leaching a complete distribution of particle sizes, especially with a small distribution modulus such as the value for the lead cake residue, (ac.s. = 0.39). For a complete size distribution, the fine particles would be expected to leach much faster resulting in a rapid initial rate of reaction such as is observed in this study. However, the results from experiments with monosize materia! (Fig. 9) which will be discussed later, seem to refute this analysis. Other explanations for the observed response are possible.
The apparent activation energy associated with the initial stage of the bismuth dissolution reaction is found to be 12 kJ/ mole (2 .9 kcallmole) from the Arrhenius plot presented in Fig. 5. An activation energy of less than 21 kJ / mole (5 kcallmole) generally suggests that the rate controlling step is diffusion in the aqueous phase either through the mass transfer boundary layer or by an intergranular diffusion process . T he rate controlling step during the latter stage of reaction is not so apparent and will be discussed in the section on Reaction Mechanisms. .
Sulfuric Acid. The percent bismuth dissolved as a function of time is presented in Fig. 6 for various sulfuric acid concentrations at 70° C . Notice that the initial surge in the release of bismuth, which was dependent on temperature, is also sensitive to the sulfuric acid concentration. For example . less
50r-----.-----,------.----~------.-----.-~
40
10
O~-----L----~~-----L----~L------L----~~~ o
Fig. 4-'Bismuth release from lead cake plotted as frac t ion reacted versus time for 0.5 b1 H2S04 and various temperatures at 5% solids.
SOCIETY o f
'than 5% dissolution occurs during the initial part of the reaction at 70° C and a concentration of 0.1 h1 H2S04. After 4 br, the amount dissolved is still substantially less than 10%. However, at o. 7 ~ H2S04, 2S% of the bismuth is released in the first tWO min and after four hr 5S % of the bismuth has been dissolved. With the exception of the data for the 0.05 M and 0.1 1:1 additions of H2S04, the reactant, hydrogen ion, was always in excess and could be assumed to be at constant concentration.
If the initial stage of the reaction is characterized by the rate of bismuth release during the first two min, a reaction order plot can be constructed by plotting a log of the initial rate versus log hydrogen ion concentration. (see Fig. 7). The slope of the line is indicative of the "reaction order" with respect to the hydrogen ion concentration which follows from the common, empirical rate expression:
Initial Rate = Ri = k(H + )n (2)
where n is the reaction order. The slope of the line for the reaction order plot in Fig. 7 is equal to one, which indicates that during the initial stage of reaction the rate controlling step is first order with respect to the hydrogen ion concentration. This result coupled with the low activation energy 12.0 kJ/mole (2.9 kcallmole) suggests that the rate of reaction is controlled by diffusion of hydrogen ion in the aqueous phase.
Notice that for sulfuric acid concentrations exceeding 1.0 M tbe initial rate is independent of concentration, which indica-;;~ a change in the rate controlling step due to probable depletion of susceptible surface bismuth species. Depletion of surface bismuth species may also account for lhe fact that at a given acid concentration the initial rapid rate is not sustained but decreases rather abruptly after the first two min.
Stirring Speed. For reactions controlled by boundary layer diffusion, the stirring speep would be expected to be an important parameter in that the relative velocity between the
I I I I I I I I
-
-
.--
• 0"" o~
o~ -
6E = 2.90 KCll/mol1
0.1t-
-
I I I I I I I I 28 30 32 34
Fig. 5-Arrhenius plot for the initial kinetic response, in which Ri (min -1) represents the initial rate determined from the first two min of reaction. Data taken from Fig. 4.
"",MINING ENGINEERS
solid and liquid phases, the slip velocity, influences the mass transfer boundary layer thickness. Experimental results for the lead cake system in which the stirring speed was varied between SO and 2000 rpm are shown in Fig. S. As indicated by the open triangles which represent data for speeds between 300 and 2000 rpm, the kinetic response fo the system is insensitive to changes in the stirring speed both for the baffled· turbine reactor operated at high rpms and for the unbaffled·blade reactor operated at 300 rpm. Only at SO rpm is there a significant reduction in the initial rate. The insensitivity of the initial rate
Fig. 6-Bismuth released from lead cake plotted as fraction reacted versus time for 70·e and various sulfuric acid concentrations at 5% solids.
10.0
° ... - iJ 1.0
... ... ... ...
1.0
0.1 HYDROGEN ION CONCENTRATION ,<!!!)
Fig. 7-Reaction order plot for the initial kinetic response in which Ri (min - 1) represents the initial rate determined from the first two min of reaction. For sulfuric acid concentrations less than 0.07 M, the (H +) was taken by pH measurement after the first 30 seconds of reaction.
MINING ENGINEERING 391
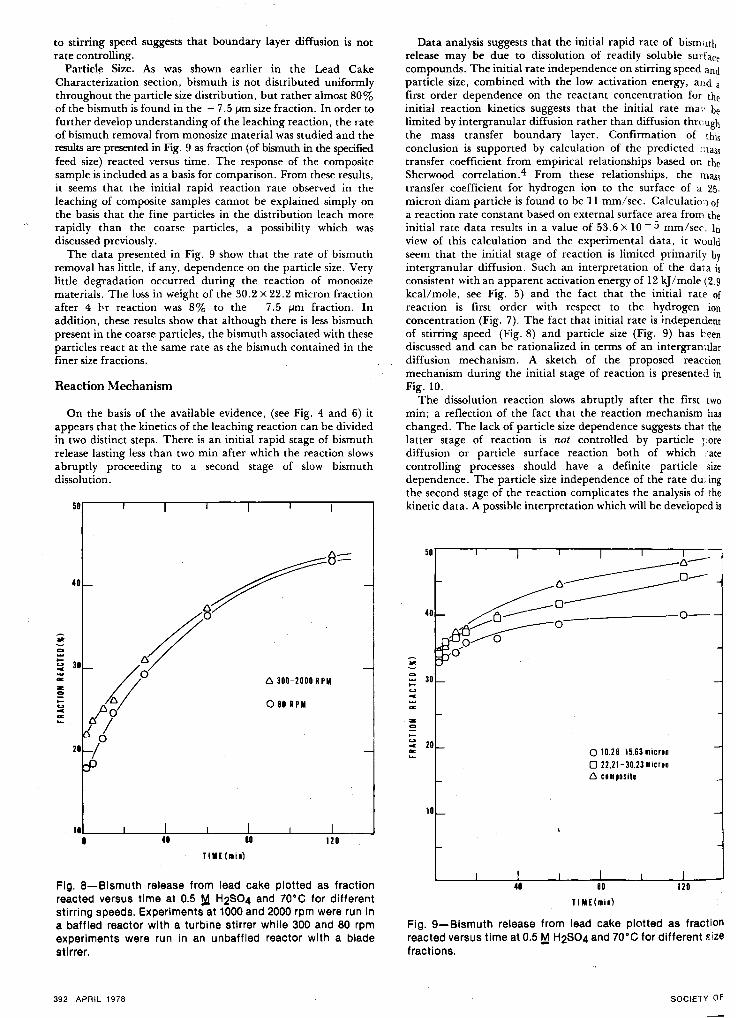
to stirring speed suggests that boundary layer diffusion is not rate controlling.
Particle Size. As was shown earlier in the Lead Cake Characterization section, bismuth is not distributed uniformly throughout the particle size distribution, but rather almost 80% of the bismuth is found in the - 7.5 f.lm size fraction. In order to further develop understanding of the leaching reaction, the rate of hismuth removal from monosize material was studied and the results are presented in Fig. 9 as fraction (of bismuth in the specified feed size) reacted versus time. The response of the composite sample is included as a basis for comparison. From these results, it seems that the initial rapid reaction rate observed in the leaching of composite samples cannot be explained simply on the basis that the fine particles in the distribution leach more rapidly than the coarse particles, a possibility which was discussed previously.
The data presented in Fig. 9 show that the rate of bismuth removal has little, if any, dependence on the particle size. Very little degradation occurred during the reaction of monosize materials. The loss in weight of the 30.2 X 22.2 micron fraction after 4 l>r reaction was 8% to the - 7.5 f.lm fraction. In addition, these results show that although there is less bismuth present in the coarse particles, the bismuth associated with these particles react at the same rate as the bismuth contained in the finer size fractions.
Reaction Mechanism
On the basis of the available evidence, (see Fig. 4 and 6) it appears that the kinetics of the leaching reaction can be divided in two distinct steps. There is an initial rapid stage of bismuth release lasting less than two min after which the reaction slows abruptly proceeding to a second stage of slow bismuth dissolution.
50.-----"--r-I ---.----.I--r-I-'Ir--...
-C, 300-2000 RPM
080 RPM
-
I.L...-_....L-__ ~ '_-L..._-+.J,--_.l..--J_....JII....--.--.J • 41 80 120
Fig. a-Bismuth release from lead cake plotted as fraction reacted versus time at 0.5 M H2S04 and 70·C for different stirring speeds. Experiments at 1000 and 2000 rpm were run in a baffled reactor with a turbine stirrer while 300 and 80 rpm experiments were run in an unbaffled reactor with a blade stirrer.
392 APRIL 1978
Data analysis suggests that the initial rapid rate of bismuth release may be due to dissolution of readily soluble surface compounds. The initial rate independence on stirring speed and particle size, combined with the low activation energy, and a first order dependence on the reactant concentration for the initial reaction kinetics suggests that the initial rate rna \' be limited by intergranular diffusion rather than diffusion thrnugh the mass transfer boundary layer. Confirmation of this conclusion is supported by calculation of the predicted ':1ass transfer coefficient from empirical relationships based on the Sherwood correlation.4 From these relationships, the mass transfer coefficient for hydrogen ion to the surface of a 25. micron diam particle is found to be 11 mm/sec. Calculatio:1of a reaction rate constant based on external surface area from the initial rate data results in a value of 53.6 X 10 - 5 mm/sec. In view of this calculation and the experimental data, it would seem that the initial stage of reaction is limited primarily by intergranular diffusion. Such an interpretation of the data is consistent with an apparent activation energy of 12 kJ/mole (2.9 kcallmole, see Fig. 5) and the fact that the initial rate of reaction is first order with respect to the hydrogen ion concentration (Fig. 7). The fact that initial rate is independent of stirring speed (Fig. 8) and particle size (Fig. 9) has been discussed and can be rationalized in terms of an intergranular diffusion mechanism. A sketch of the proposed reaction mechanism during the initial stage of reaction is presented in Fig. 10.
The dissolution reaction slows abruptly after the first two min; a reflection of the fact that the reaction mechanism has changed. The lack of particle size dependence suggests that the latter stage of reaction is not controlled by particle j!ore diffusion or particle surface reaction both of which (ate controlling processes should have a definite particle size dependence. The particle size independence of the rate duing the second stage of the reaction complicates the analysis of the kinetic data. A possible interpretation which will be developed is
50.-----r---~r---~-----,----~----~---
40
::: 30 ~ ... z co .... ~ 20 ...
10
c,--------=0-· c,:-------~o 0-
~--..,-- -._____0 0...---0
if
o 10.28-15.63 micron o 22.21-30.23 micron C, composite
TIME(minl
Fig. 9-Bismuth release from lead cake plotted as fraction reacted versus time at 0.5 M H2S04 and 70·e for different size fractions.
SOCIETY of
that the reaction rate is controlled by the reaction of the individual grains which constitute the bulk of the particle. Analysis of the grain size distribution as determined from SEM photomicrographs (Fig. 3) reveals a very narrow distribution which can be represented by the following Gaudin-Schuhmann Eq.:
F3(dJ = (dz"/2.0 )1.79 (3)
A model will be developed which considers that the rate of reaction of each of these grains is controlled by diffusion of the product, i. e., aqueous species of bismuth and/or zinc, through the remnant layer of lead sulfate surrounding the unreacted grain core. Such an intragranular diffusion model should follow shrinking core kinetics for a quasi·steady state condition. A sketch of the proposed second stage reaction mechanism is presented in Fig. 10.
For spherical monosize grains in which the reaction is controlled by diffusion through the product layer, it can be shown that the following relation between fraction reacted, a, and time, t, holds5,6
1 - 2/3£1 - (1 - (1)2/3 = 2CsatDe (4) Qcr2
the chemical reaction being represented as:
(5)
where t = reaction time; a = fraction reacted; Qc = molar density of species C being dissolved; r = grain radius; Csat = concentration of species C at the unreacted surface (saturation); De = effective diffusivity of species C through pores in the product layer; s = refers to solid phase; f = refers to fluid phase.
The solution to Eq. 4 is given by Bartlett 7 as,
301 +4n 3 a = 1 - [1/2 + cost--3 ) 1 (6)
where 2t
301 = arc cos (T -1) (7)
T= 6DeCsat (8)
T represents the required time of reaction to obtain complete conversion (a = 1.0).
PARTICLE
1 at Stage of Reaction. Intergranular diffusion of the hydrogen ion.
&RA IN
2nd Stage of Reaction. Intragranular pore diffusion of soluble reaction products through the reacted shell of individual grains.
Fig. 10-Schematic representation of the proposed reaction mechanism for acid leaching of lead cake.
~ MINING ENGINEERS
KEY o 90·C
o 70·C
0.02 o 60·C
o 50·C
640·C
_---6-__ ,---6_6-
200 TIME(min)
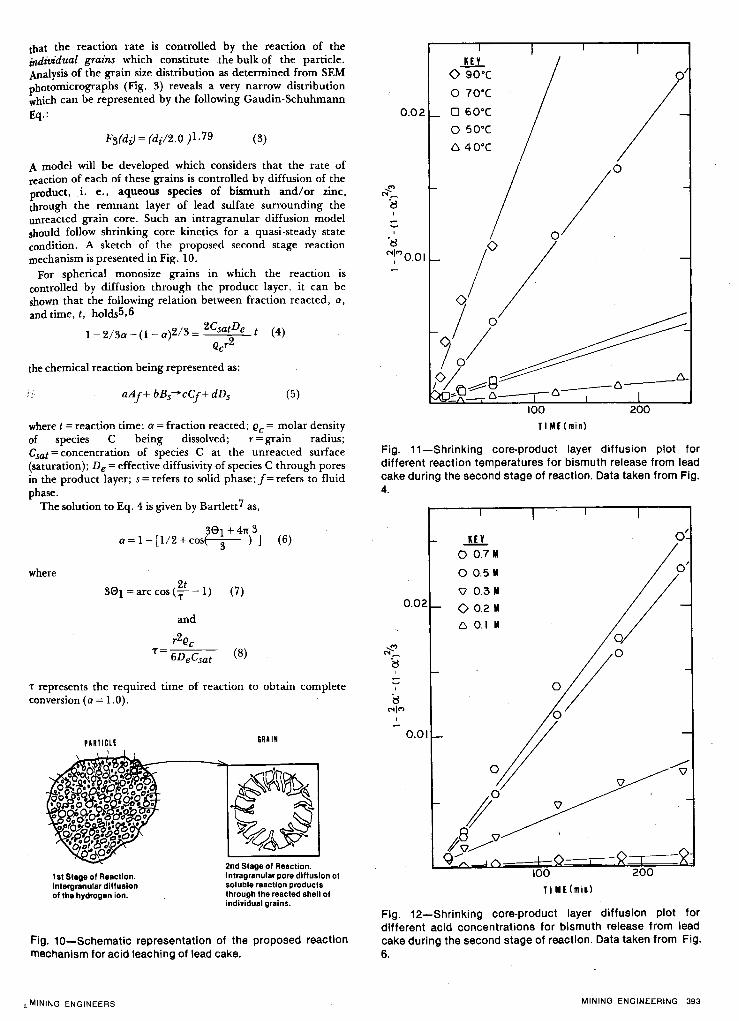
Fig. 11-Shrinking core-product layer diffusion plot for different reaction temperatures for bismuth release from lead cake during the second stage of reaction. Data taken from Fig. 4.
~ ,
0.02
0.01
...lli.. o 0.7M
o 0.5M
\} 0.3 M
00.2 M
6 0.1 M
0'
TlME(min)
Fig. 12-Shrinking core-product layer diffusion plot for different acid concentrations for bismuth release from lead cake during the second stage of reaction. Data taken from Fig. 6.
MINING ENGINEERING 393
'" 'I"
o
-4.0 o
o o
-5.0 6E = 15.00 Kcal/mole
o
26 28 30 32
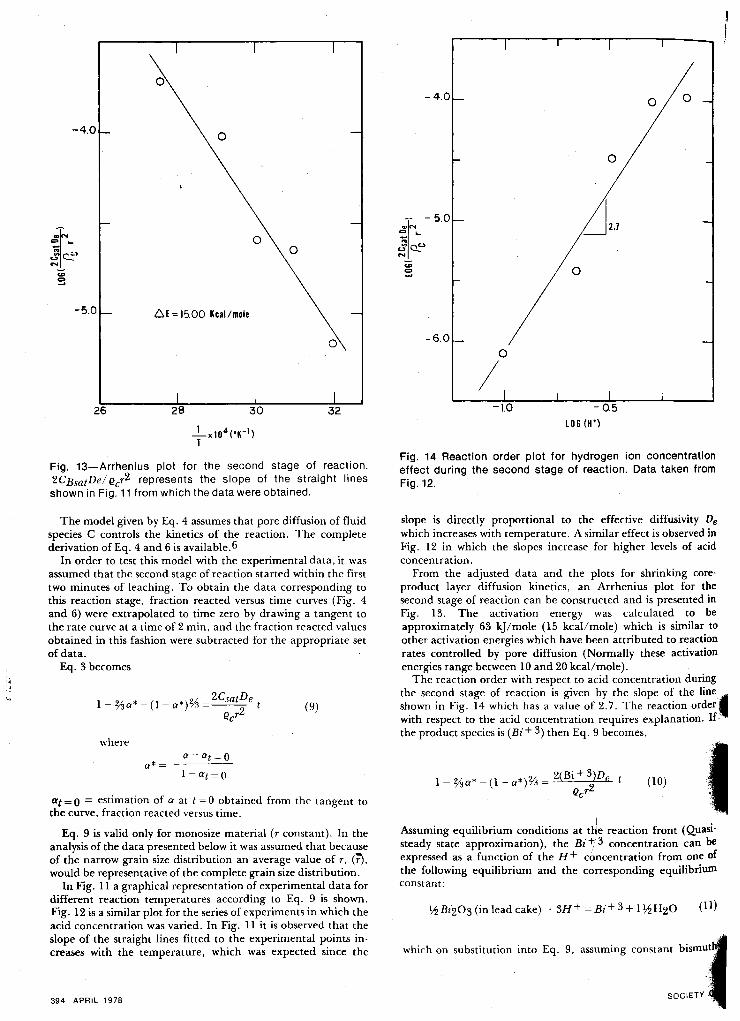
Fig. 13-Arrhenius plot for the second stage of reaction. 2CBsatDei Qcr2 represents the slope of the straight lines shown in Fig. 11 from which the data were obtained.
The model given by Eq. 4 assumes that pore diffusion of fluid species C controls the kinetics of the reaction. The complete derivation of Eq. 4 and 6 is available. 6
In order to test this model with the experimental data. it was assumed that the second stage of reaction startt"d within the first two minutes of leaching. To obtain the data corresponding to this reaction stage, fraction reacted versus time curves (Fig. 4 and 6) were extrapolated to time zero by drawing a tangent to the rate curve at a time of 2 min. and the fraction reacted values obtained in this fashion were subtracted for the appropriate set of data.
Eq. 3 becomes
where
a* = a - at = 0
1- at = 0
at = 0 = estimation of a at t = 0 obtained from the tangent to the curve, fraction reacted versus time.
Eq. 9 is valid only for monosize material (r constant). In the analysis of the data presented below it was assumed that because of the narrow grain size distribution an average value of r, (T), would be representative of the complete grain size distribution.
In Fig. 11 a graphical representation of experimental data for different reaction temperatures according to Eq. 9 is shown. Fig. 12 is a similar plot for the series of experiments in which the acid concentration was varied. In Fig. 11 it is observed that the slope of the straight lines fitted to the experimental points in· creases with the temperature, which was expected since the
394 APRIL 1978
-4.0 o o
o
o
-6.0
o
/ LOG (H+)
Fig. 14 Reaction order plot for hydrogen ion concentration effect during the second stage of reaction. Data taken from Fig. 12.
slope is directly proportional to the effective diffusivity De which increases with temperature. A similar effect is observed in Fig. 12 in which the slopes increase for higher levels of acid concentration.
From the adjusted data and the plots for shrinking core· product layer diffusion kinetics, an Arrhenius plot for the second stage of reaction can be constructed and is presented in Fig. 13. The activation energy was calculated to be approximately 63 kJ/mole (15 kcal/mole) which is similar to other activation energies which have been attributed to reaction rates controlled by pore diffusion (Normally these activation energies range between 10 and 20 kcallmole).
The reaction order with respect to acid concentration during the second stage of reaction is given by the slope of the line shown in Fig. 14 which has a value of 2.7. The reaction order t with respect to the acid concentration requires explanation. If,' the product species is (Bi+ 3) then Eq. 9 becomes,
(10) I I •
Assuming equilibrium conditions at tlje reaction front (QuasI-steady state approximation), the Bi+ 3 concentration can be expressed as a function of the H + concentration from one of the following equilibrium and the corresponding equilibrium constant:
which 00 ,ub""udoo inw Eq. 9, ~mmiog com,=, bi""U~
SOCIETY ~
~ co ........ .... .,. ... c "" .... .... V>
"" ~~ _ c:> ....... ....... ""V> "" CD ... z <=Iii< .... = :;;"" => c; c
20 o
10
o ~
o -0-------=
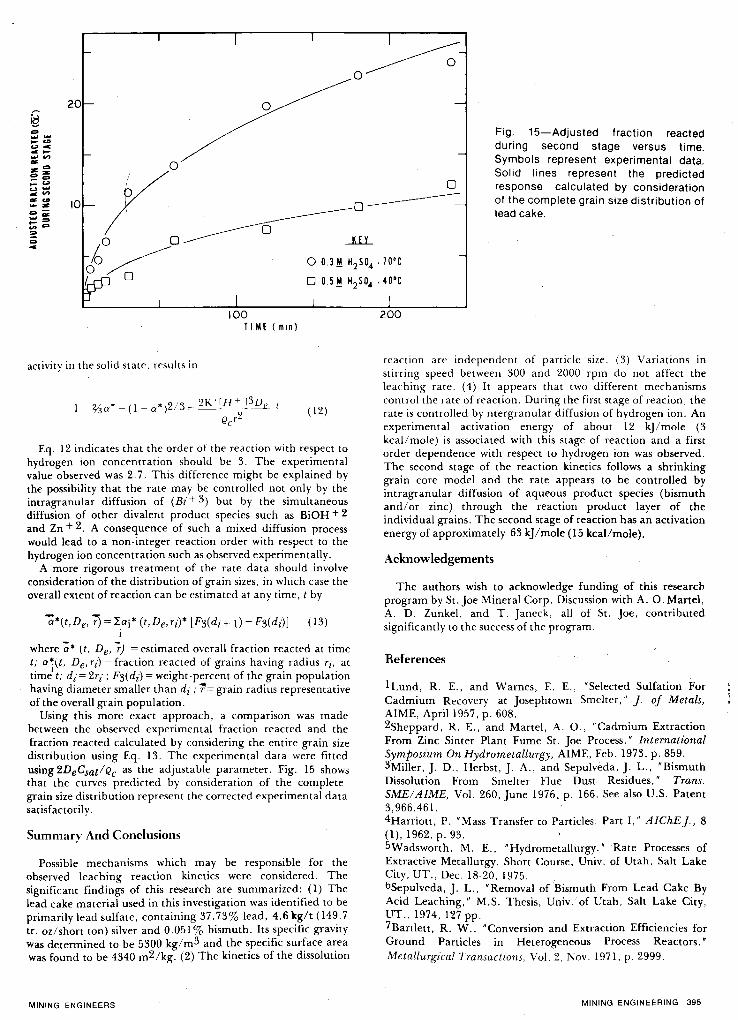
Fig. 15-Adjusted fraction reacted during second stage versus time . Symbols represent experimental data. Solid lines represent the predicted response calculated by consideration of the complete grain size distribution of lead cake .
o 0..3 M H2SO.4 .7D·C
o 0..5 M H2SO.4 .4D·C
activity in the solid state. results in
100 TIME(mln)
( 12)
Eq. 12 indicates that the order of the reaction with respect to hydrogen ion concentration should be 3. The experimental value observed was 2.7. This difference might be explained by the possibility that the rate may be controlled not only by the intrawanular diffusion of (Bi + 3) but by the simultaneous diffusion of other divalent product species such as BiOH + 2 and Zn + 2. A consequence of such a mixed diffusion process would lead to a non·integer reaction order with respect to the hydrogen ion concentration such as observed experimentally.
A more rigorous treatment of the rate data should involve consideration of the distribution of wain sizes. in which case the overall extent of reaction can be estimated at any time. t by
a*(t,De, ;j = ~ai* (t,De, Tl)* [F3(d1 + 1) - F3(d1l] (13) I
where a* (t. De, r) = estimated overall fraction reacted at time t; a*(t, De, Ti) = fraction reacted of wains having radius Ti, at time
l t; di= 2Ti; F3(di) = weight-percent of the grain population
having diameter smaller than di ; -:(= grain radius representative of the overall grain population.
Using this more exact approach, a comparison was made between the observed experimental fraction reacted and the fraction reacted calculated by considering the entire grain size distribution using Eq. 13. The experimental data were fitted using 2DeCsat/Qc as the adjustable parameter. Fig. 15 shows that the curves predicted by consideration of the complete wain size distribution represent the corrected experimental data satisf actoril y.
Summary And Conclusions
Possible mechanisms which may be responsible for the observed leaching reaction kinetics were considered. The significant findings of this research are summarized: (1) The lead cake material used in this investigation was identified to be primarily lead sulfate, containing 37.73% lead, 4.6 kg/t (149.7 tr. oz/short ton) silver and 0.051 % bismuth. Its specific gravity was determined to be 5300 kg/m3 and the specific surface area was found to be 4340 m 2/kg. (2) The kinetics of the dissolution
MINING ENGINEERS
200
reaction are independent of particle sIze. (3) Variations in stirring speed between 300 and 2000 rpm do not affect the leaching rate. (4) It appears that two different mechanisms control the rate of reaction. During the first stage of reacion. the rate is controlled by ntergranular diffusion of hydrogen ion. An experimental activation energy of about 12 kJ/mole (3 kcallmole) is associated with this stage of reaction and a first order dependence with respect to hydrogen ion was observed. The second stage of the reaction kinetics follows a shrinking grain core model and the rate appears to be controlled by intragranular diffusion of aqueous product species (bismuth and/or zinc) through the reaction product layer of the individual grains. The second stage of reaction has an activation energy of approximately 63 kJlmole (15 kcallmole).
Acknowledgements
The authors wish to acknowledge funding of this research program by St. Joe Mineral Corp. Discussion with A. O. Martel, A. D. Zunkel, and T. Janeck. all of St. Joe, contributed significantly to the success of the program.
References
ILund, R. E., and Warnes, E. E., "Selected Sulfation For Cadmium Recovery at Josephtown Smelter." j. of Metals, AIME, April 1957, p. 608. 2Sheppard, R. E., and Martel, A. 0., "Cadmium Extraction From Zinc Sinter Plant Fume St. Joe Process." International Symposium On HydrometalluTgy, AIME, Feb. 1973, p. 859. 3Miller, J. D., Herbst, J. A., and Sepulveda, J. L.. "Bismuth Dissolution From Smelter Flue Dust Residues," Trans. SME/AIME, Vol. 260, June 1976. p. 166. See also U.S. Patent 3,966,461. 4Harriott. P. "Mass Transfer to Particles: Part I," AIChEj., 8 (1),1962, p. 93. 5Wadsworth, M. E., "Hydrometallurgy." Rate Processes of Extractive Metallurgy, Short Course, Univ. of Utah, Salt Lake City, UT., Dec. lR·20, 1975. tiSepulveda, J. L., "Removal of Bismuth From Lead Cake By Acid Leaching," M.S. Thesis, Univ. of Utah, Salt Lake City, UT., 1974, 127 pp. 7 Bartlett , R. W., "Conversion and Extraction Efficiencies for Ground Particles in Heterogeneous Process Reactors." MetaliuTgical Transactions, Vol. 2. Nov. 1971, p. 2999.
MINING ENGINEERING 395