Embed Size (px)
Citation preview
1
2
This document is a presentation of general background information about the Group’s activities current at the date of the presentation. It is information in a summary form and no representation or warranty is made as to the accuracy, completeness or reliability of the information. It is to be read in conjunction with the Bank’s half year results filed with the Australian Securities Exchange on 13 February 2017. It is not intended to be relied upon as advice to investors or potential investors and does not take into account the investment objectives, financial situation or needs of any particular investor. These should be considered, with or without professional advice, when deciding if an investment is appropriate.
This presentation may contain certain "forward-looking statements". The words "anticipate", “believe", "expect", "project", "forecast", "estimate", "likely", "intend", "should", "could", "may", "target", "plan" and other similar expressions are intended to identify forward-looking statements. Indications of, and guidance on, future earnings and financial position and performance are also forward-looking statements. Such forward-looking statements are not guarantees of future performance and involve known and unknown risks, uncertainties and other factors, many of which are beyond the control of the Group that may cause actual results to differ materially from those expressed or implied in such statements. There can be no assurance that actual outcomes will not differ materially from these statements. You are cautioned not to place undue reliance on forward-looking statements. Such forward-looking statements only speak as of the date of this presentation and the Group assumes no obligation to update such information.
To the maximum extent permitted by law, the Group shall have no liability whatsoever for any loss or liability of any kind arising in respect of the information contained, or not being contained, in this document.
Non-IFRS Financial Information: The discussion and analysis discloses the net profit after tax on both a ‘statutory basis’ and a ‘cash basis’. The statutory basis is prepared in accordance with the Corporations Act 2001 and the Australian Accounting Standards, which comply with International Financial Reporting Standards (IFRS). The cash basis is used by management to present a clear view of the Group’s underlying operating results, excluding a number of items that are deemed to be outside of our core activities and such items are not considered to be representative of the Group’s ongoing financial performance. Refer to the Appendix 4D for reconciliation to statutory profit.
Copyright protection exists in this presentation.
3
Overview
Financial performance
Summary and outlook
Appendices

4
Group Managing Director
Mike Hirst
5
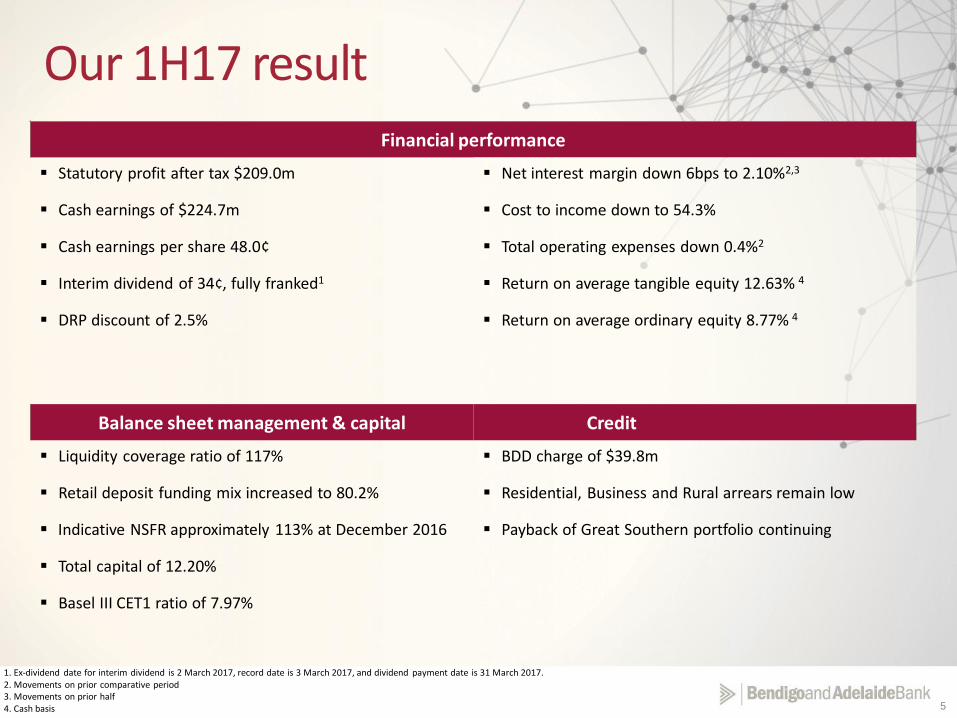
Financial performance
Statutory profit after tax $209.0m
Cash earnings of $224.7m
Cash earnings per share 48.0¢
Interim dividend of 34¢, fully franked1
DRP discount of 2.5%
Net interest margin down 6bps to 2.10%2,3
Cost to income down to 54.3%
Total operating expenses down 0.4%2
Return on average tangible equity 12.63% 4
Return on average ordinary equity 8.77% 4
Balance sheet management & capital Credit
Liquidity coverage ratio of 117%
Retail deposit funding mix increased to 80.2%
Indicative NSFR approximately 113% at December 2016
Total capital of 12.20%
Basel III CET1 ratio of 7.97%
BDD charge of $39.8m
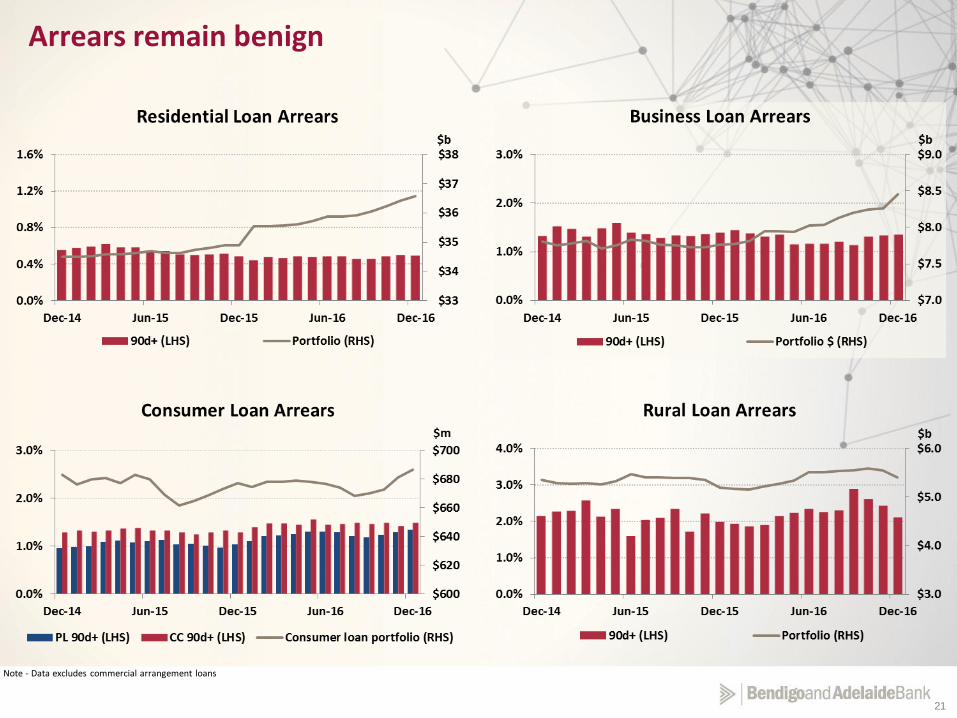
Residential, Business and Rural arrears remain low
Payback of Great Southern portfolio continuing
1. Ex-dividend date for interim dividend is 2 March 2017, record date is 3 March 2017, and dividend payment date is 31 March 2017.2. Movements on prior comparative period3. Movements on prior half4. Cash basis
Our 1H17 result
6
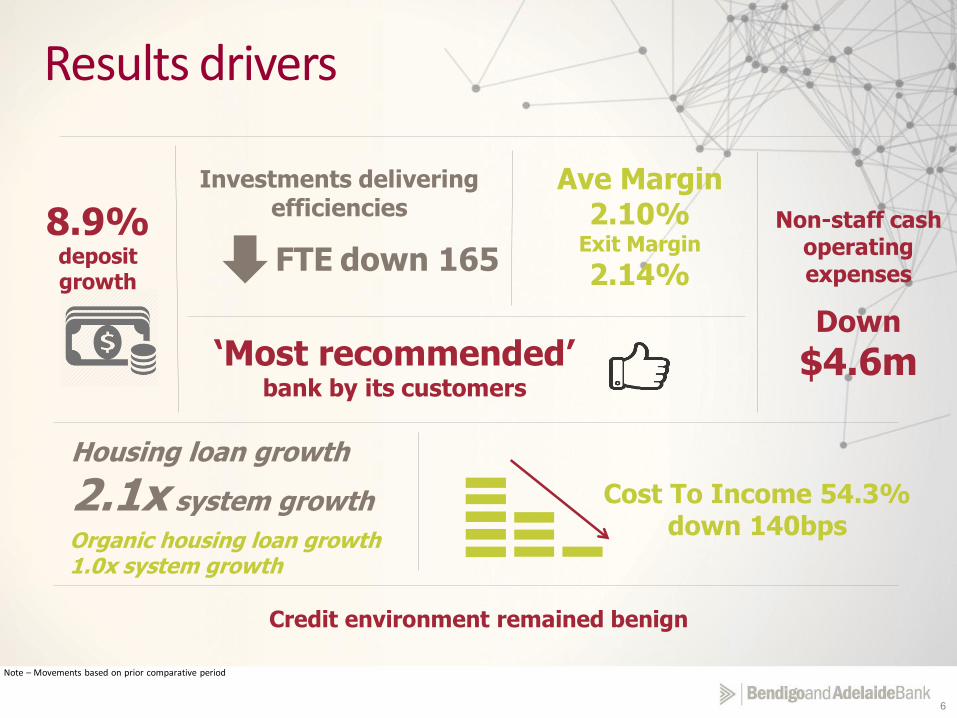
Results drivers
Cost To Income 54.3%down 140bps
Housing loan growth
2.1x system growth
8.9%deposit growth
‘Most recommended’ bank by its customers
Non-staff cash operating expenses
Down
$4.6m
Investments delivering efficiencies
FTE down 165
Ave Margin 2.10%
Exit Margin
2.14%
Organic housing loan growth 1.0x system growth
Credit environment remained benign
Note – Movements based on prior comparative period
7
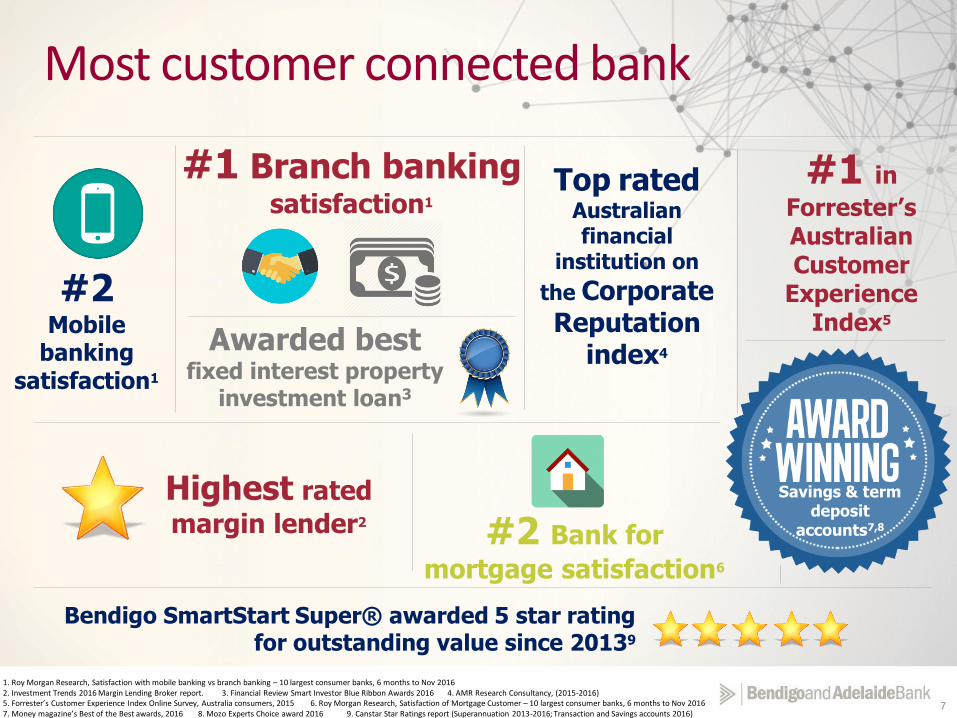
Most customer connected bank
#2
Top ratedAustralian financial
institution on
the Corporate Reputation
index4
#1 in
Forrester’s Australian Customer
Experience Index5
Bendigo SmartStart Super® awarded 5 star rating for outstanding value since 20139
Mobile banking
satisfaction1
#2 Bank for
mortgage satisfaction6
Highest rated
margin lender2
Savings & term deposit
accounts7,8
#1 Branch bankingsatisfaction1
Awarded best fixed interest property
investment loan3
1. Roy Morgan Research, Satisfaction with mobile banking vs branch banking – 10 largest consumer banks, 6 months to Nov 20162. Investment Trends 2016 Margin Lending Broker report. 3. Financial Review Smart Investor Blue Ribbon Awards 2016 4. AMR Research Consultancy, (2015-2016) 5. Forrester’s Customer Experience Index Online Survey, Australia consumers, 2015 6. Roy Morgan Research, Satisfaction of Mortgage Customer – 10 largest consumer banks, 6 months to Nov 20167. Money magazine’s Best of the Best awards, 2016 8. Mozo Experts Choice award 2016 9. Canstar Star Ratings report (Superannuation 2013-2016; Transaction and Savings accounts 2016)
8
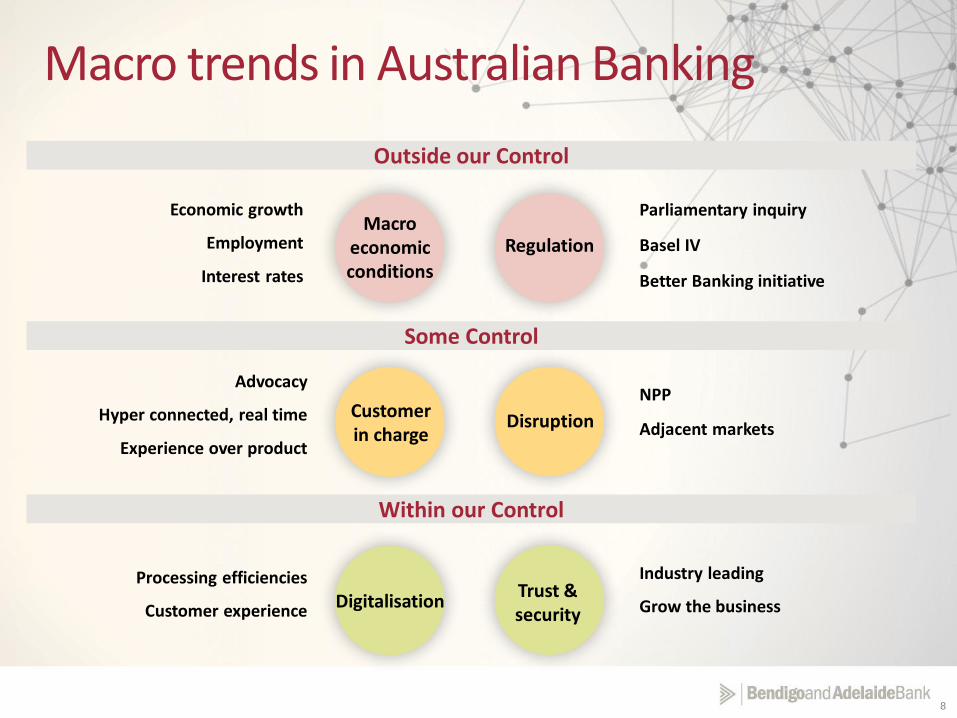
Regulation
Macro trends in Australian Banking
Macro economic conditions
Customer in charge
DigitalisationTrust & security
Disruption
Outside our Control
Some Control
Within our Control
Economic growth
Employment
Interest rates
Advocacy
Hyper connected, real time
Experience over product
Processing efficiencies
Customer experience
Parliamentary inquiry
Basel IV
Better Banking initiative
NPP
Adjacent markets
Industry leading
Grow the business
9
Chief Financial Officer
Richard Fennell
10
Capital and funding Dec-16Change
Dec16 – Jun16
Change
Dec16 – Dec15Balance sheet Dec-16
Change
Dec16 – Jun16
Change
Dec16 – Dec15
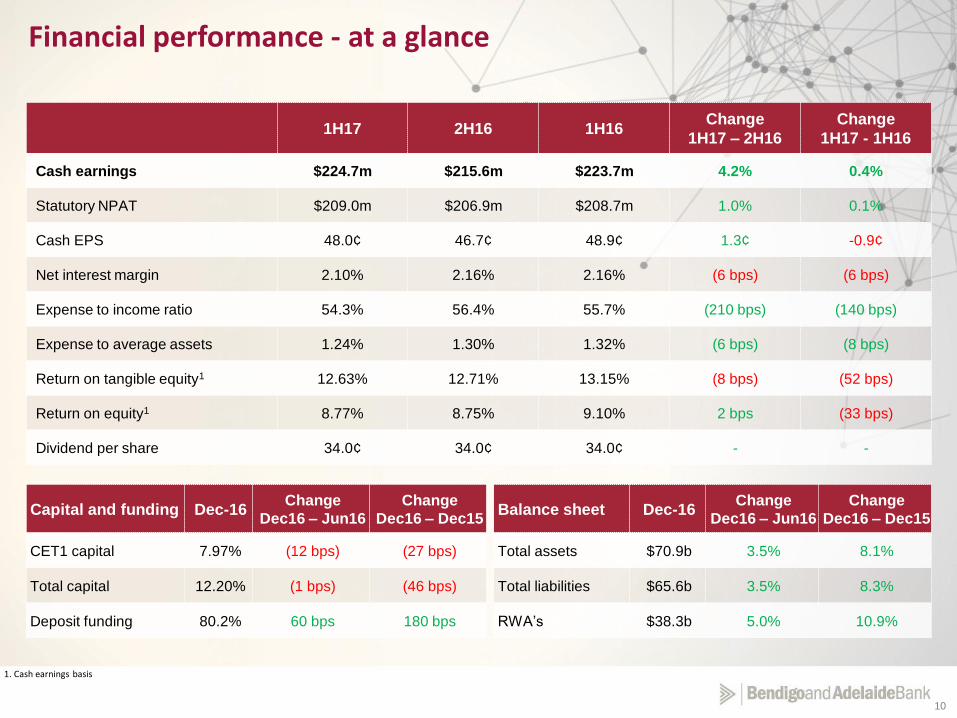
CET1 capital 7.97% (12 bps) (27 bps) Total assets $70.9b 3.5% 8.1%
Total capital 12.20% (1 bps) (46 bps) Total liabilities $65.6b 3.5% 8.3%
Deposit funding 80.2% 60 bps 180 bps RWA’s $38.3b 5.0% 10.9%
1H17 2H16 1H16Change
1H17 – 2H16
Change
1H17 - 1H16
Cash earnings $224.7m $215.6m $223.7m 4.2% 0.4%
Statutory NPAT $209.0m $206.9m $208.7m 1.0% 0.1%
Cash EPS 48.0¢ 46.7¢ 48.9¢ 1.3¢ -0.9¢
Net interest margin 2.10% 2.16% 2.16% (6 bps) (6 bps)
Expense to income ratio 54.3% 56.4% 55.7% (210 bps) (140 bps)
Expense to average assets 1.24% 1.30% 1.32% (6 bps) (8 bps)
Return on tangible equity1 12.63% 12.71% 13.15% (8 bps) (52 bps)
Return on equity1 8.77% 8.75% 9.10% 2 bps (33 bps)
Dividend per share 34.0¢ 34.0¢ 34.0¢ - -
Financial performance - at a glance
1. Cash earnings basis
11
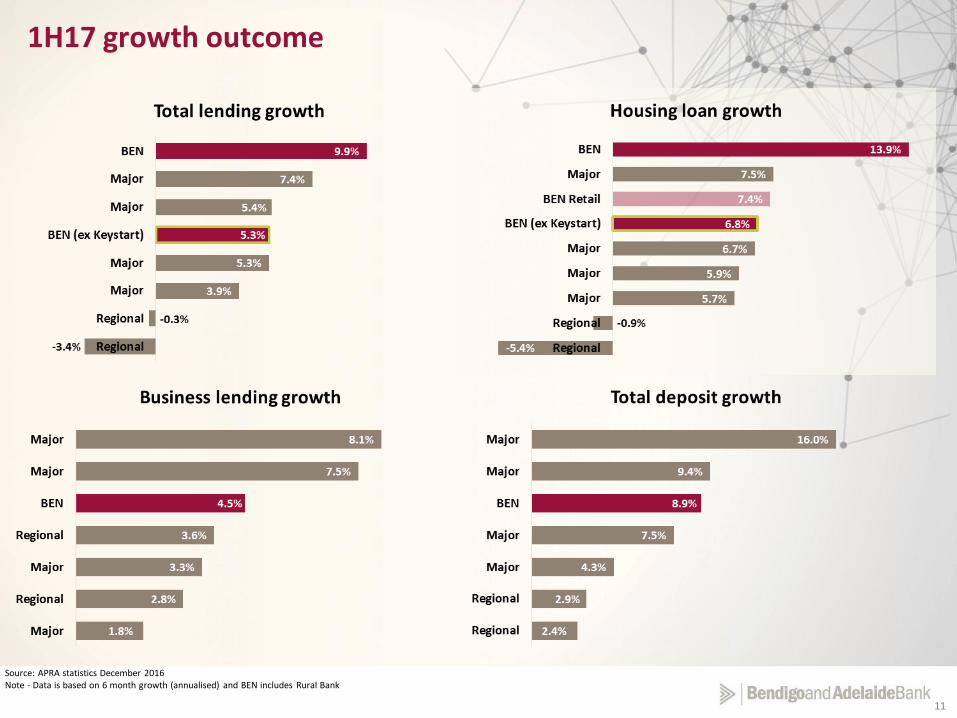
Source: APRA statistics December 2016 Note - Data is based on 6 month growth (annualised) and BEN includes Rural Bank
1H17 growth outcome
12
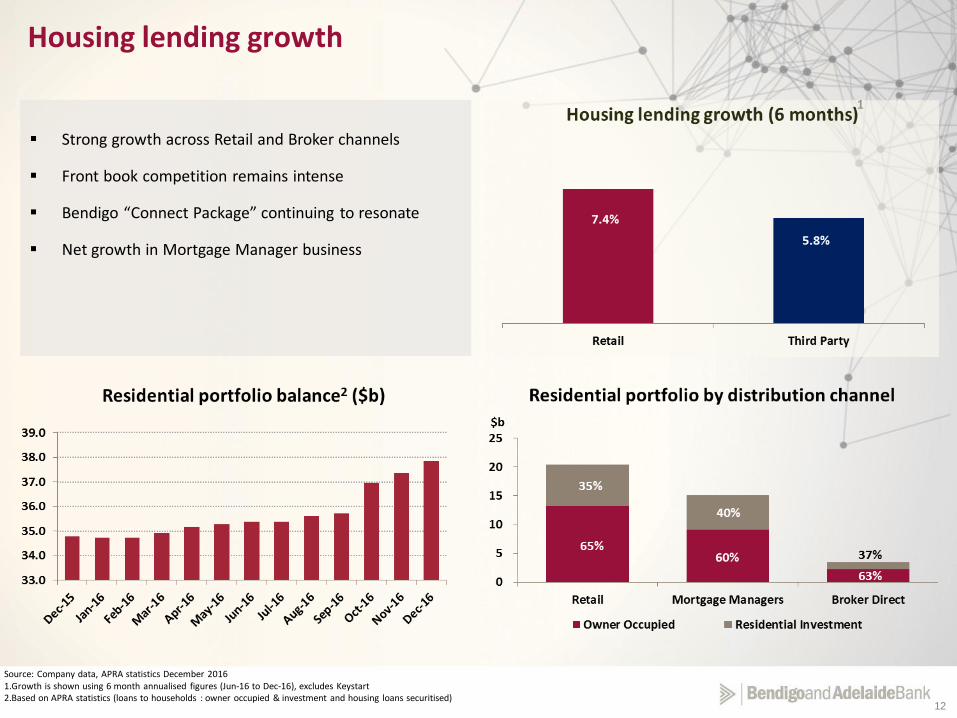
Source: Company data, APRA statistics December 2016 1.Growth is shown using 6 month annualised figures (Jun-16 to Dec-16), excludes Keystart2.Based on APRA statistics (loans to households : owner occupied & investment and housing loans securitised)
Strong growth across Retail and Broker channels
Front book competition remains intense
Bendigo “Connect Package” continuing to resonate
Net growth in Mortgage Manager business
Housing lending growth
1
13
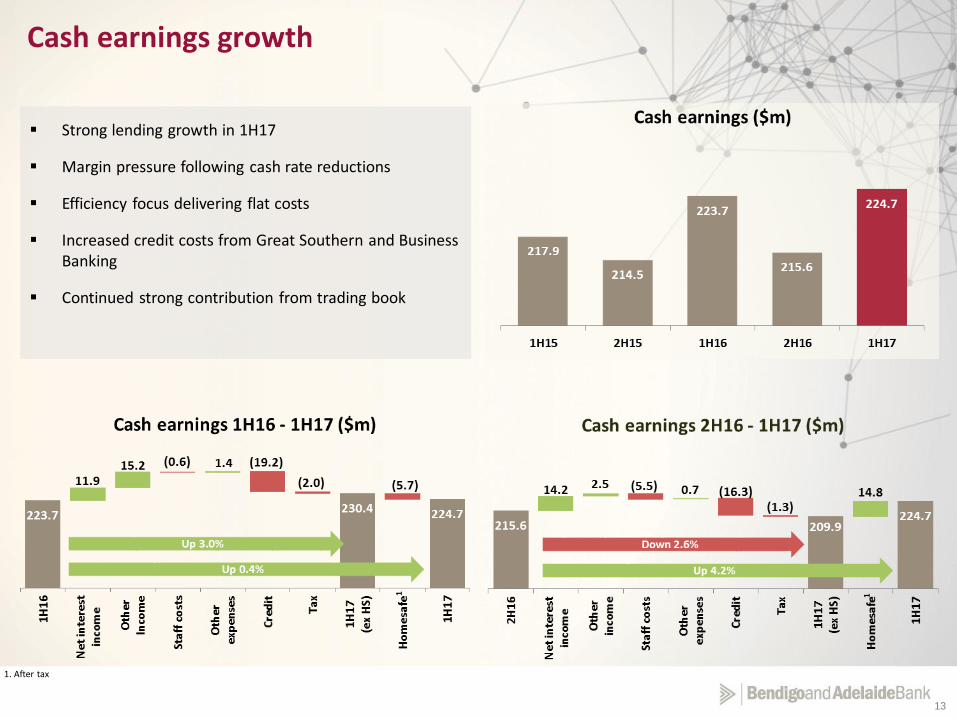
Strong lending growth in 1H17
Margin pressure following cash rate reductions
Efficiency focus delivering flat costs
Increased credit costs from Great Southern and Business Banking
Continued strong contribution from trading book
Cash earnings growth
1 1
1. After tax
14
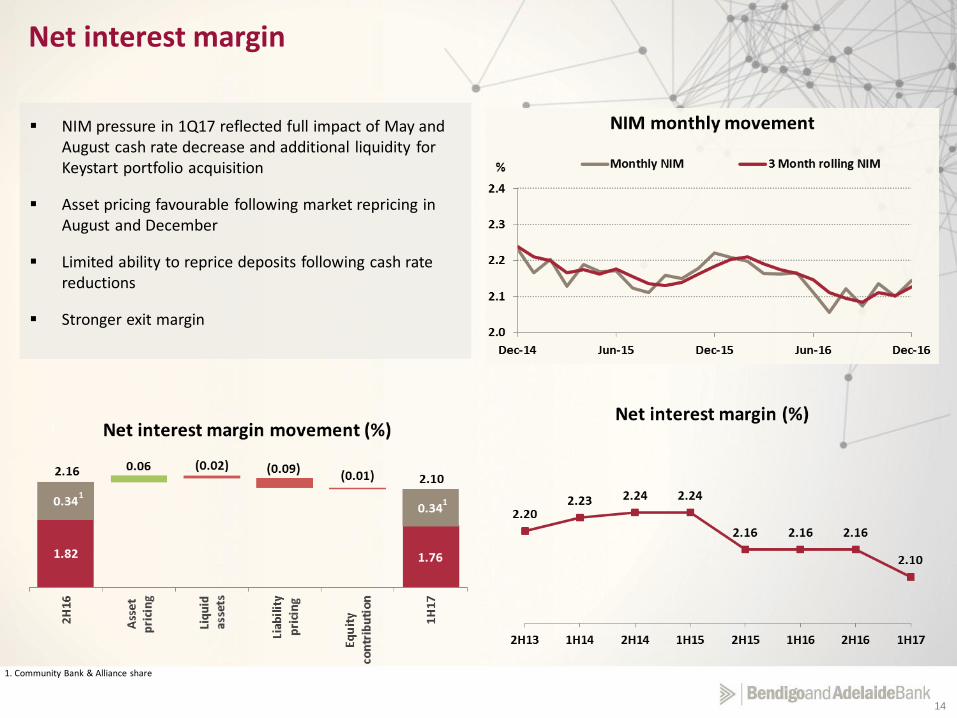
Net interest margin
NIM pressure in 1Q17 reflected full impact of May and August cash rate decrease and additional liquidity for Keystart portfolio acquisition
Asset pricing favourable following market repricing in August and December
Limited ability to reprice deposits following cash rate reductions
Stronger exit margin
1. Community Bank & Alliance share
11
15
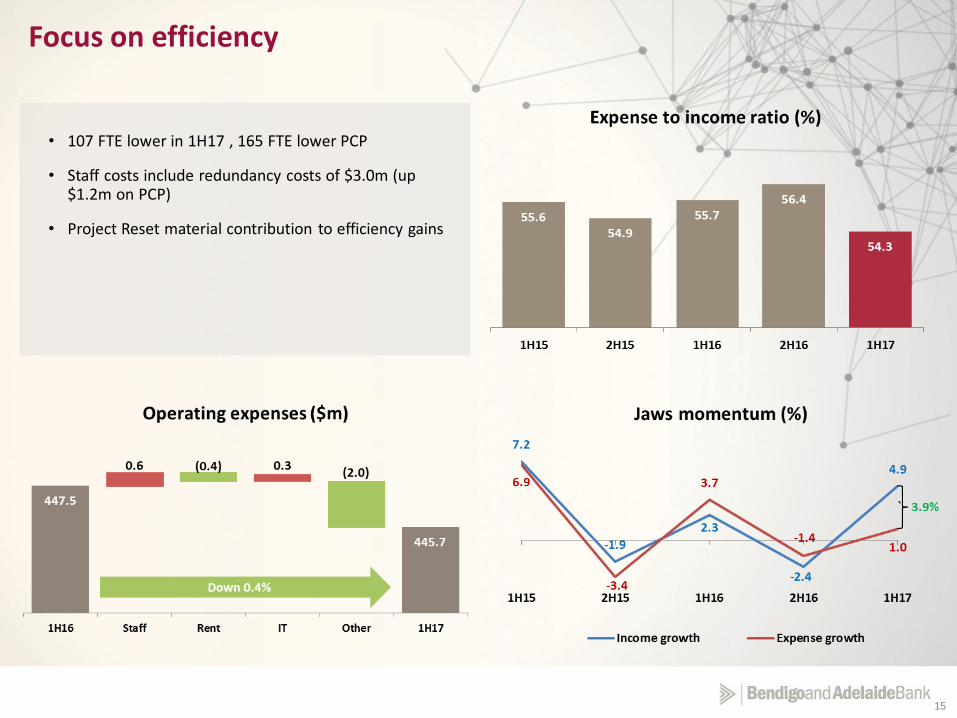
• 107 FTE lower in 1H17 , 165 FTE lower PCP
• Staff costs include redundancy costs of $3.0m (up $1.2m on PCP)
• Project Reset material contribution to efficiency gains
Focus on efficiency
16
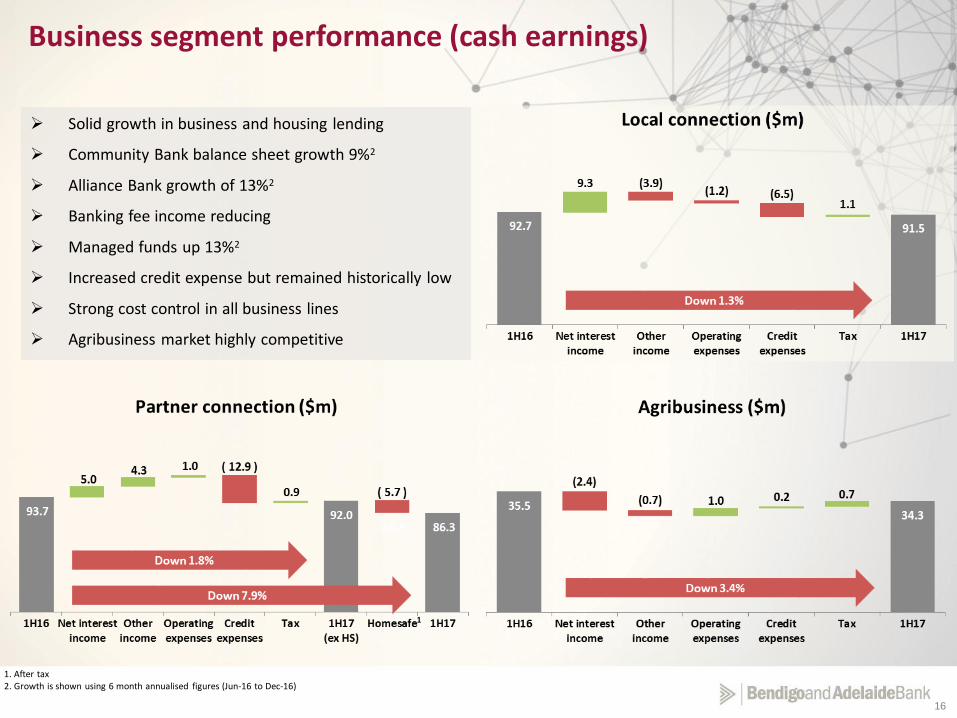
Business segment performance (cash earnings)
Solid growth in business and housing lending
Community Bank balance sheet growth 9%2
Alliance Bank growth of 13%2
Banking fee income reducing
Managed funds up 13%2
Increased credit expense but remained historically low
Strong cost control in all business lines
Agribusiness market highly competitive
1. After tax2. Growth is shown using 6 month annualised figures (Jun-16 to Dec-16)
1
17
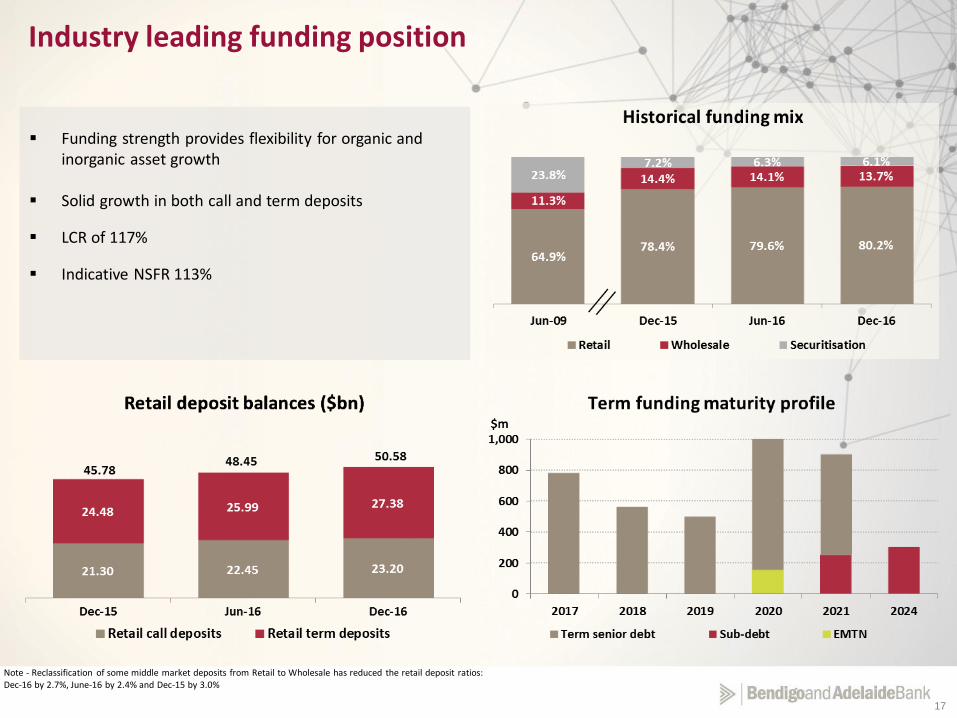
Industry leading funding position
Funding strength provides flexibility for organic and inorganic asset growth
Solid growth in both call and term deposits
LCR of 117%
Indicative NSFR 113%
Note - Reclassification of some middle market deposits from Retail to Wholesale has reduced the retail deposit ratios: Dec-16 by 2.7%, June-16 by 2.4% and Dec-15 by 3.0%
18
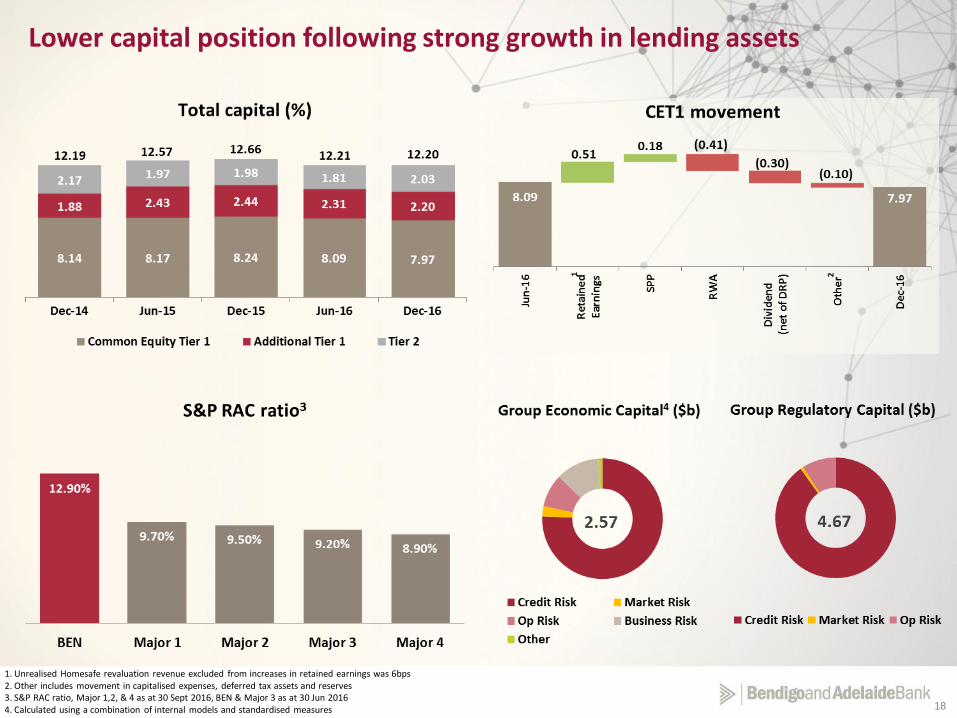
Lower capital position following strong growth in lending assets
1. Unrealised Homesafe revaluation revenue excluded from increases in retained earnings was 6bps2. Other includes movement in capitalised expenses, deferred tax assets and reserves 3. S&P RAC ratio, Major 1,2, & 4 as at 30 Sept 2016, BEN & Major 3 as at 30 Jun 20164. Calculated using a combination of internal models and standardised measures
21
19
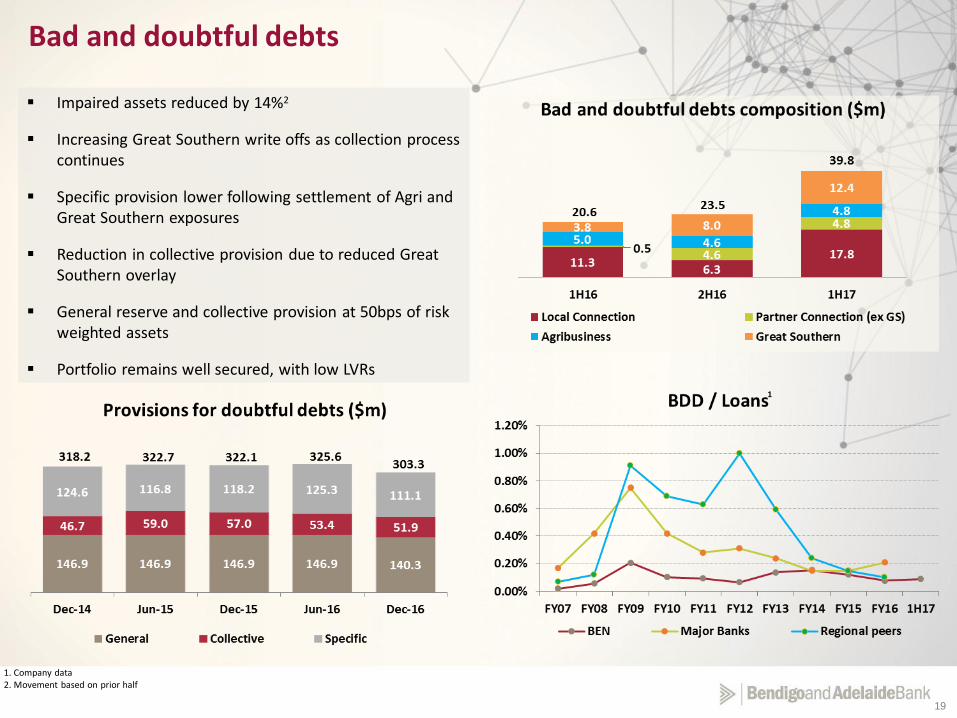
Impaired assets reduced by 14%2
Increasing Great Southern write offs as collection process continues
Specific provision lower following settlement of Agri and Great Southern exposures
Reduction in collective provision due to reduced Great Southern overlay
General reserve and collective provision at 50bps of risk weighted assets
Portfolio remains well secured, with low LVRs
Bad and doubtful debts
1. Company data2. Movement based on prior half
1
20
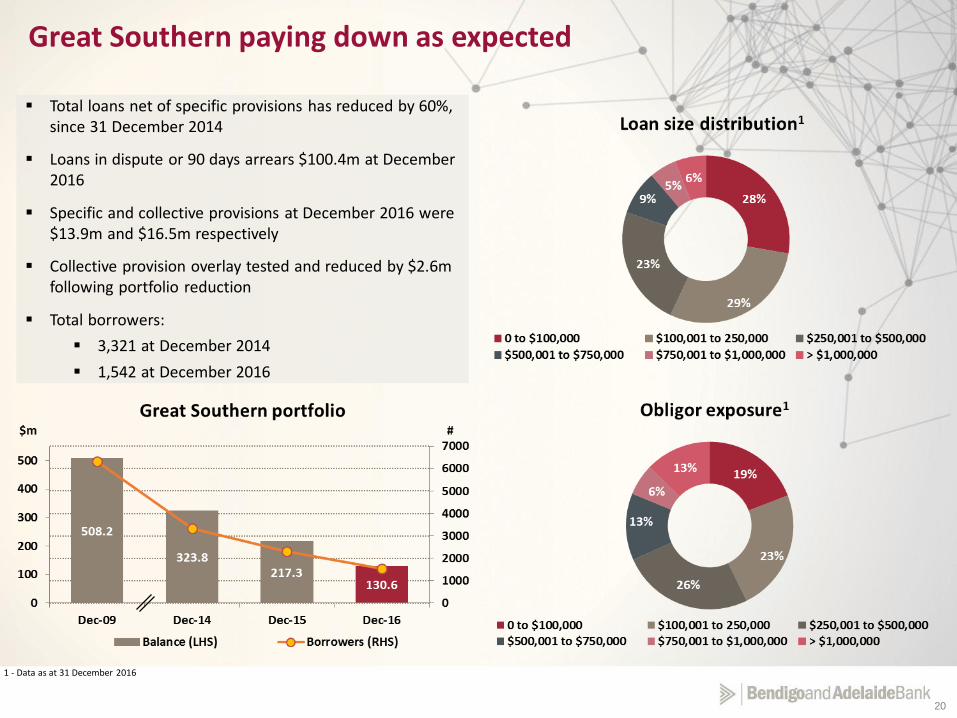
Total loans net of specific provisions has reduced by 60%, since 31 December 2014
Loans in dispute or 90 days arrears $100.4m at December 2016
Specific and collective provisions at December 2016 were $13.9m and $16.5m respectively
Collective provision overlay tested and reduced by $2.6m following portfolio reduction
Total borrowers:
3,321 at December 2014
1,542 at December 2016
Great Southern paying down as expected
1 - Data as at 31 December 2016
21
Arrears remain benign
Note - Data excludes commercial arrangement loans
22
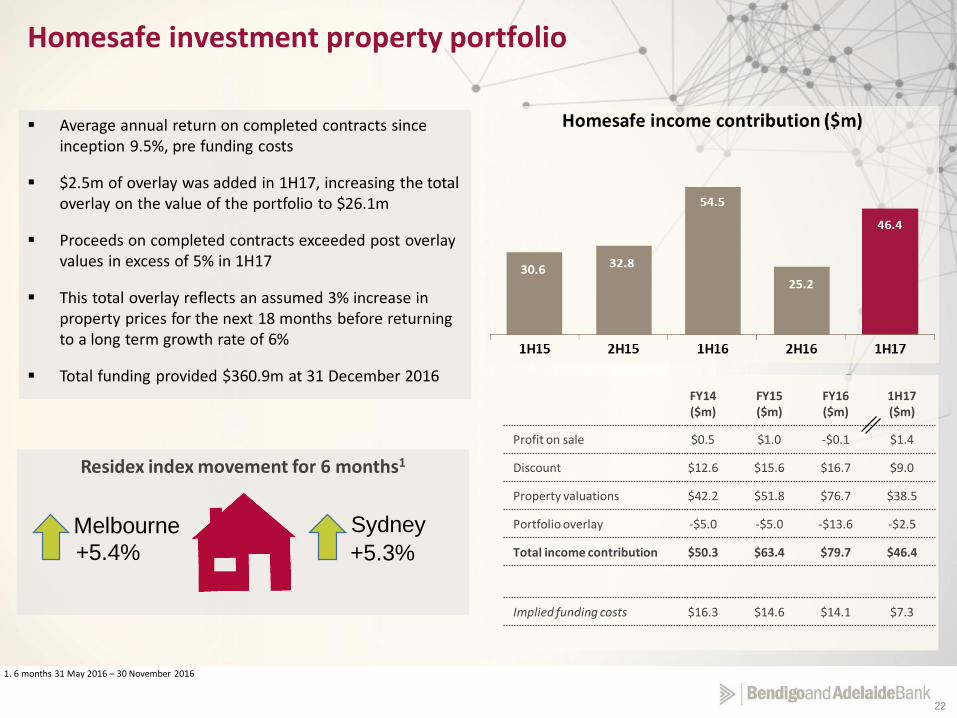
Average annual return on completed contracts since inception 9.5%, pre funding costs
$2.5m of overlay was added in 1H17, increasing the total overlay on the value of the portfolio to $26.1m
Proceeds on completed contracts exceeded post overlay values in excess of 5% in 1H17
This total overlay reflects an assumed 3% increase in property prices for the next 18 months before returning to a long term growth rate of 6%
Total funding provided $360.9m at 31 December 2016
1. 6 months 31 May 2016 – 30 November 2016
FY14 ($m)
FY15 ($m)
FY16 ($m)
1H17 ($m)
Profit on sale $0.5 $1.0 -$0.1 $1.4
Discount $12.6 $15.6 $16.7 $9.0
Property valuations $42.2 $51.8 $76.7 $38.5
Portfolio overlay -$5.0 -$5.0 -$13.6 -$2.5
Total income contribution $50.3 $63.4 $79.7 $46.4
Implied funding costs $16.3 $14.6 $14.1 $7.3
Homesafe investment property portfolio
Residex index movement for 6 months1
Melbourne Sydney
+5.3%+5.4%
23
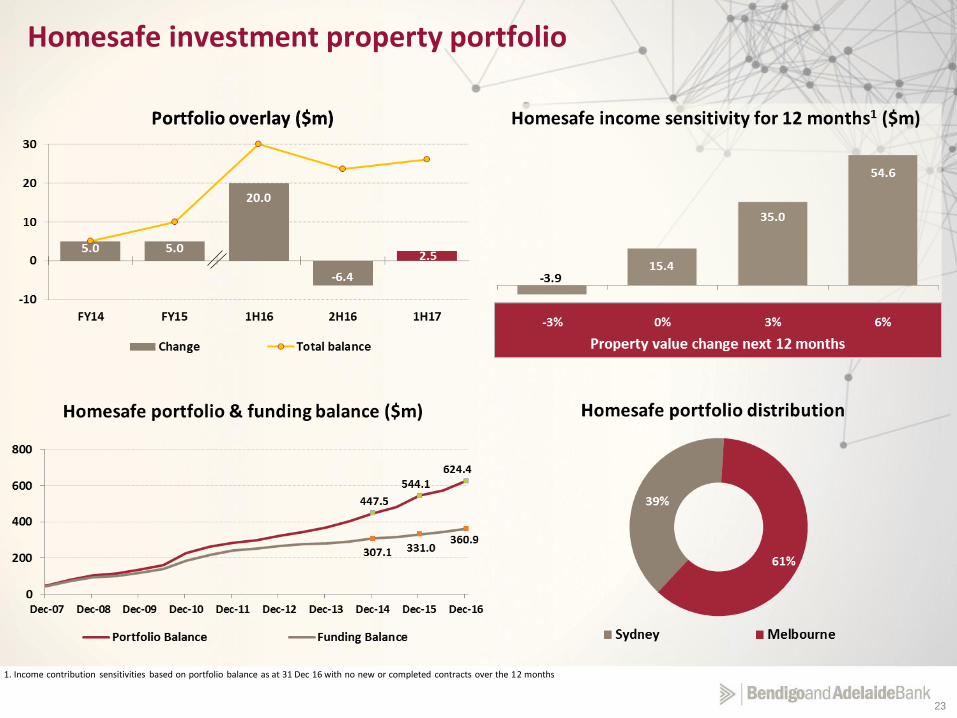
1. Income contribution sensitivities based on portfolio balance as at 31 Dec 16 with no new or completed contracts over the 12 months
Homesafe investment property portfolio
24
Group Managing Director
Mike Hirst
25
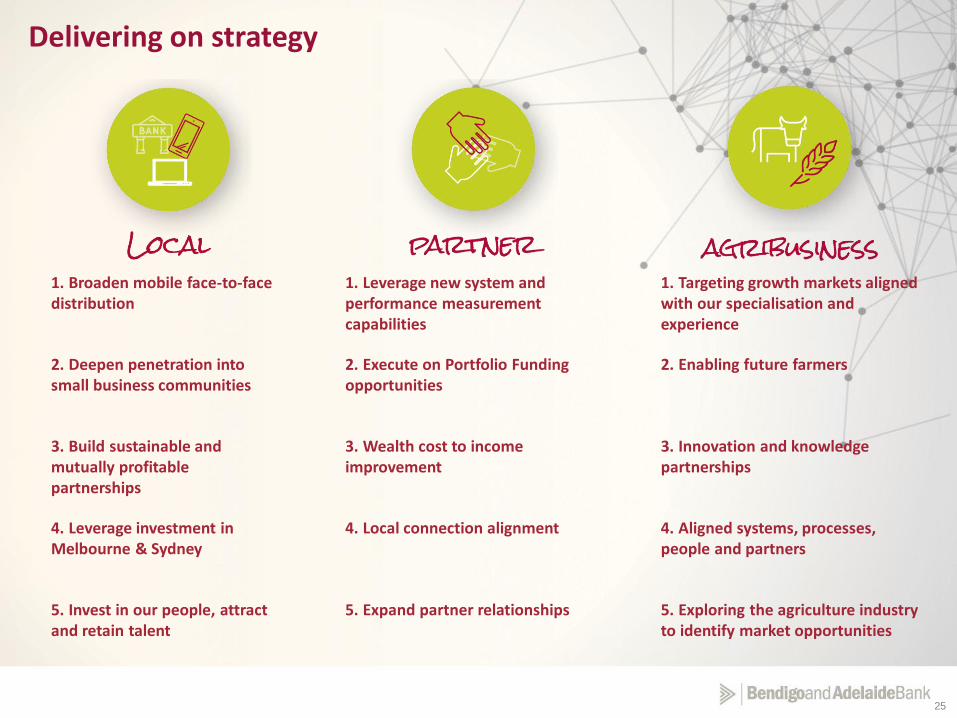
1. Broaden mobile face-to-facedistribution
1. Leverage new system and performance measurement capabilities
1. Targeting growth markets aligned with our specialisation and experience
2. Deepen penetration into small business communities
2. Execute on Portfolio Funding opportunities
2. Enabling future farmers
3. Build sustainable and mutually profitablepartnerships
3. Wealth cost to income improvement
3. Innovation and knowledge partnerships
4. Leverage investment in Melbourne & Sydney
4. Local connection alignment 4. Aligned systems, processes, people and partners
5. Invest in our people, attract and retain talent
5. Expand partner relationships 5. Exploring the agriculture industry to identify market opportunities
Customer facing businesses key focus areas
Delivering on strategy
26
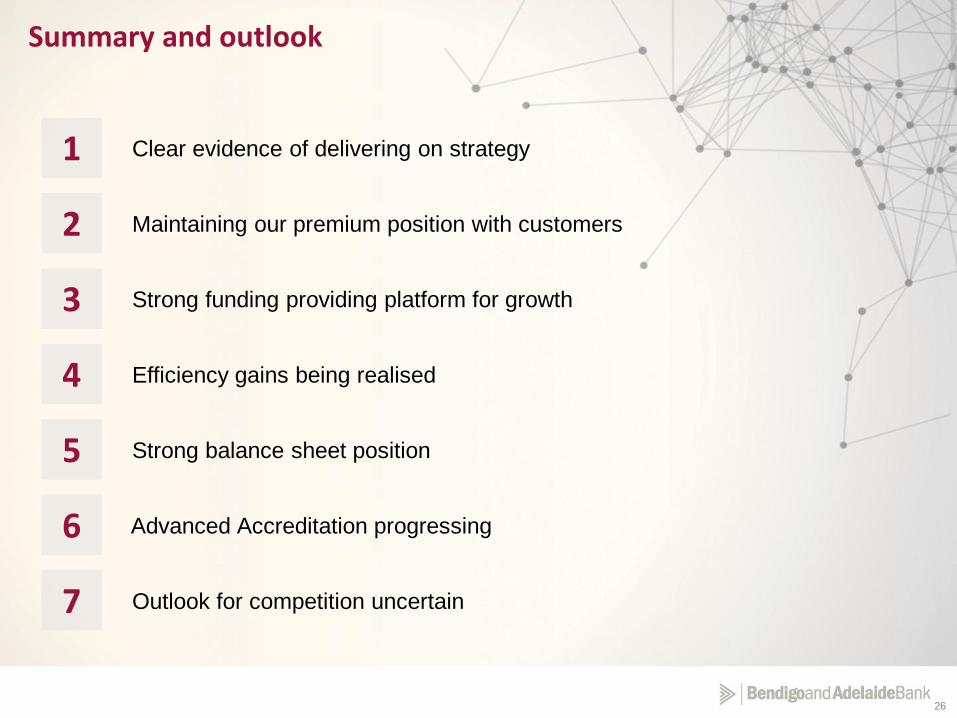
Strong funding providing platform for growth
Summary and outlook
Maintaining our premium position with customers
1
Efficiency gains being realised
2
Outlook for competition uncertain
3
Strong balance sheet position
7
Advanced Accreditation progressing
5
6
4
Clear evidence of delivering on strategy

27
Questions

28
Appendices
2929
30
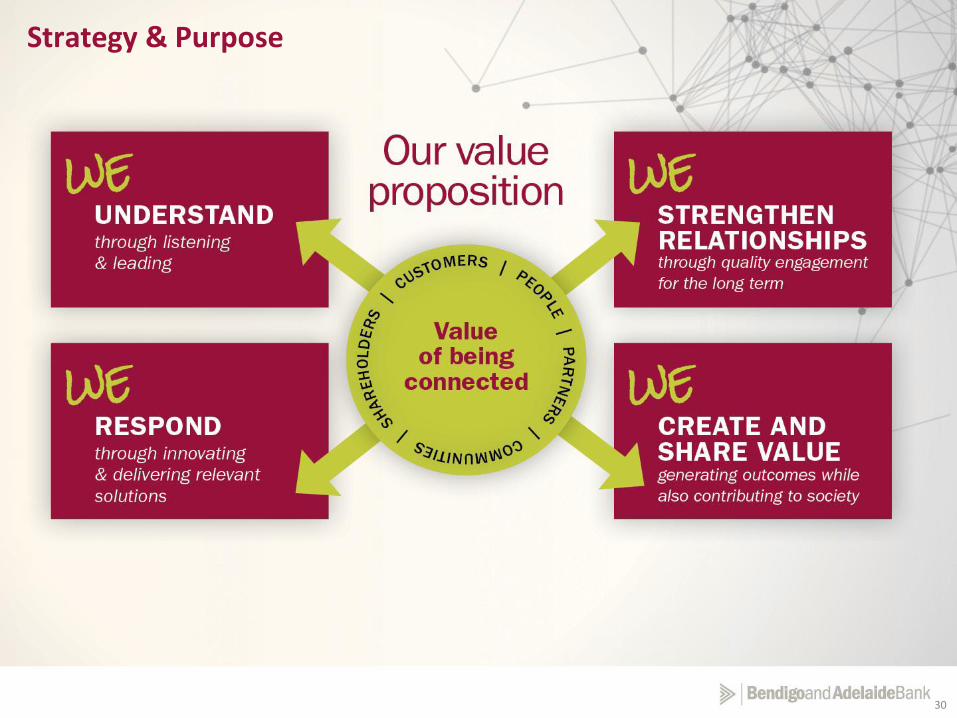
Strategy & Purpose
30
31
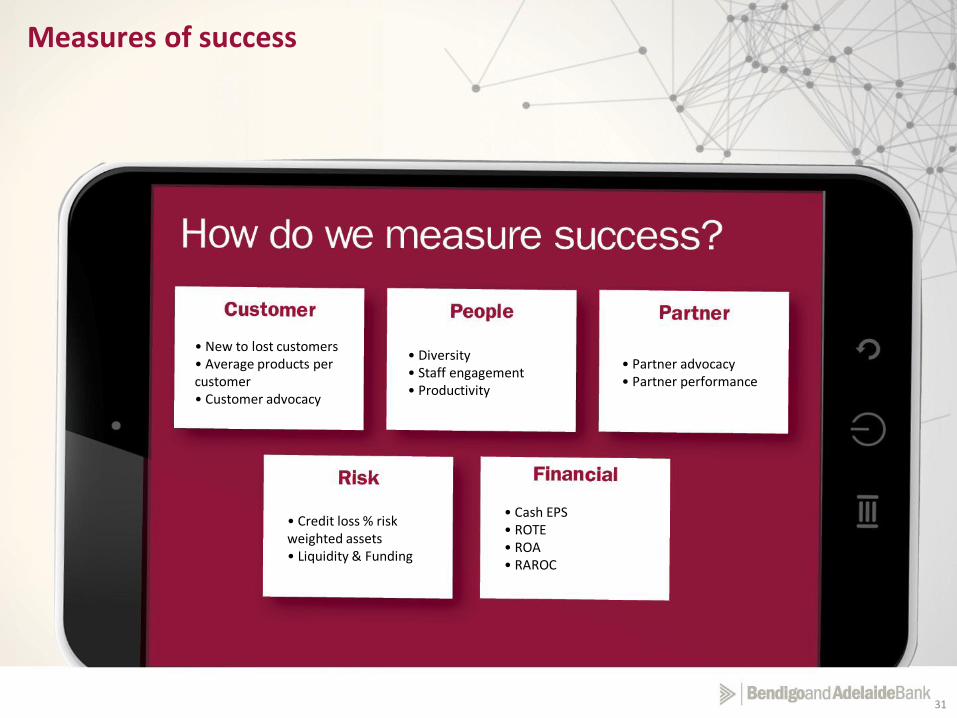
• New to lost customers• Average products per customer• Customer advocacy
• Diversity• Staff engagement• Productivity
• Partner advocacy• Partner performance
• Credit loss % risk weighted assets• Liquidity & Funding
• Cash EPS• ROTE• ROA• RAROC
Measures of success
31
32
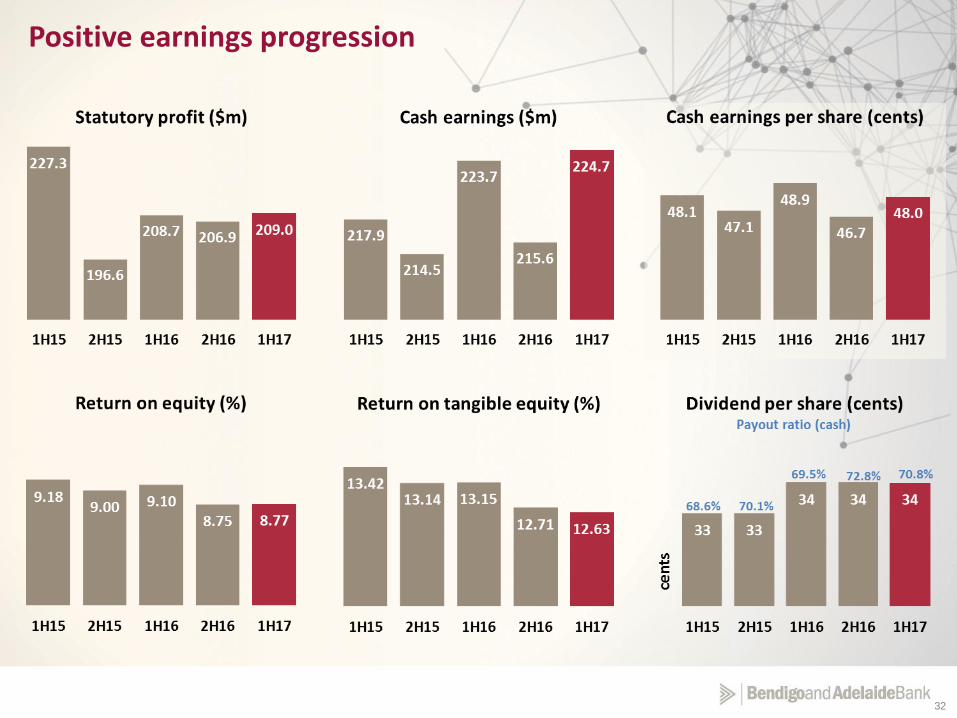
Positive earnings progression
33
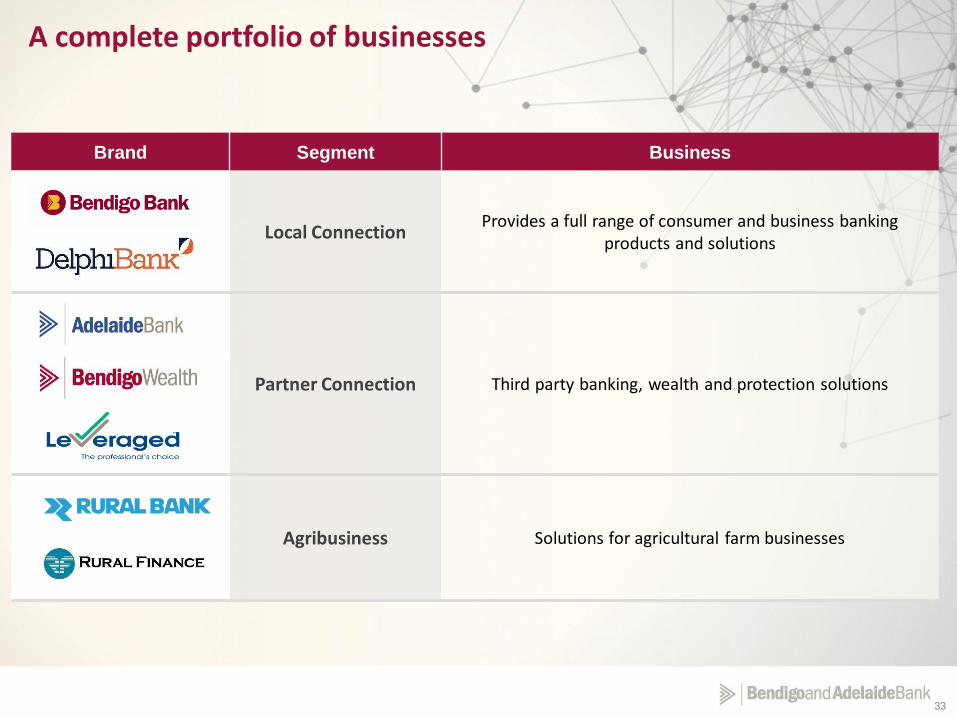
Brand Segment Business
Local ConnectionProvides a full range of consumer and business banking
products and solutions
Partner Connection Third party banking, wealth and protection solutions
Agribusiness Solutions for agricultural farm businesses
A complete portfolio of businesses
34
4
42
14
51
50
140
12
187
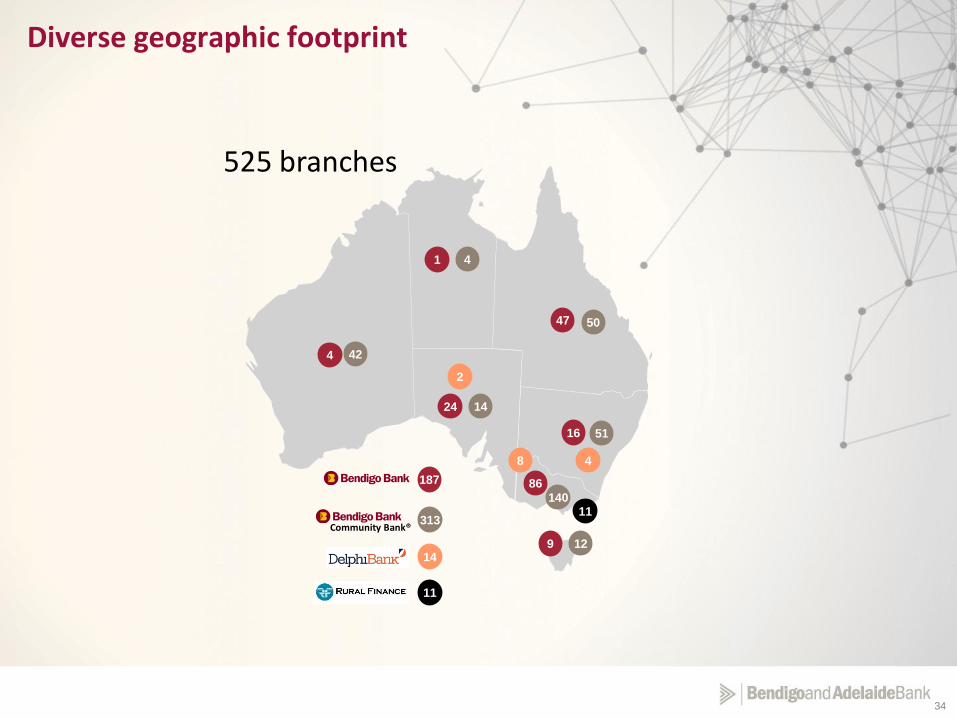
525 branches
Community Bank®
47
16
1
4
24
86
9
313
Diverse geographic footprint
14
2
8 4
11
11
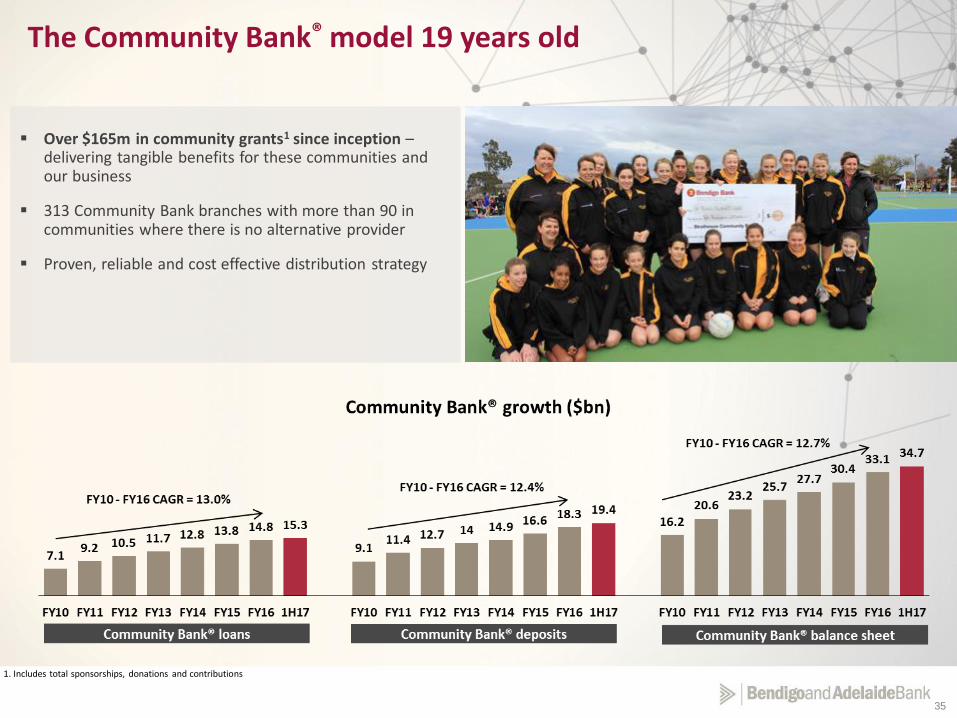
35
Over $165m in community grants1 since inception –delivering tangible benefits for these communities and our business
313 Community Bank branches with more than 90 in communities where there is no alternative provider
Proven, reliable and cost effective distribution strategy
The Community Bank® model 19 years old
1. Includes total sponsorships, donations and contributions
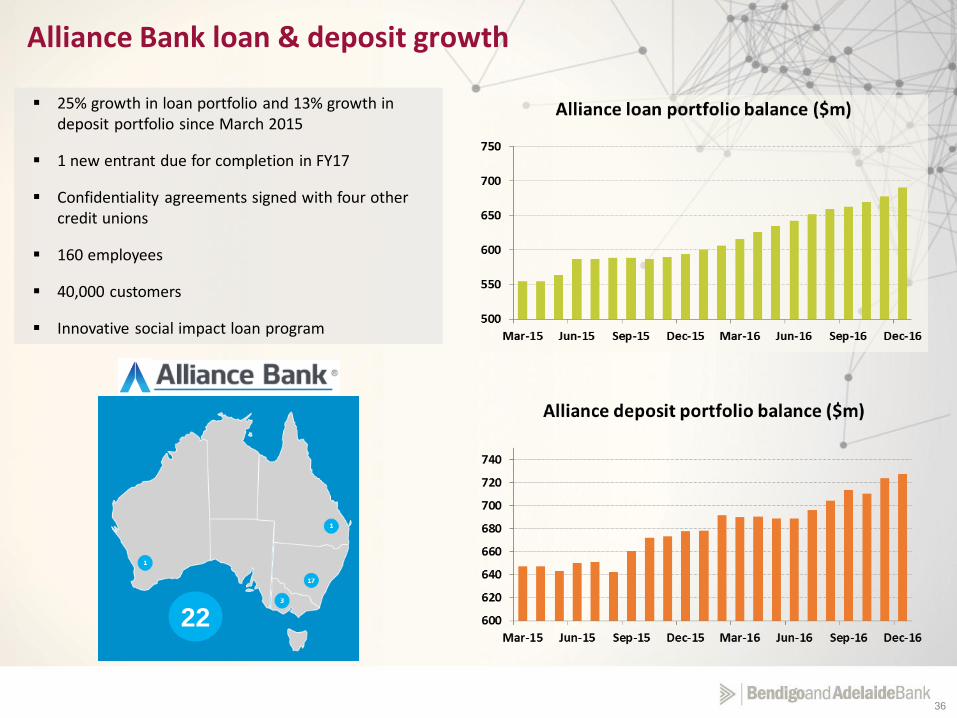
36
Alliance Bank loan & deposit growth
25% growth in loan portfolio and 13% growth in deposit portfolio since March 2015
1 new entrant due for completion in FY17
Confidentiality agreements signed with four other credit unions
160 employees
40,000 customers
Innovative social impact loan program
22
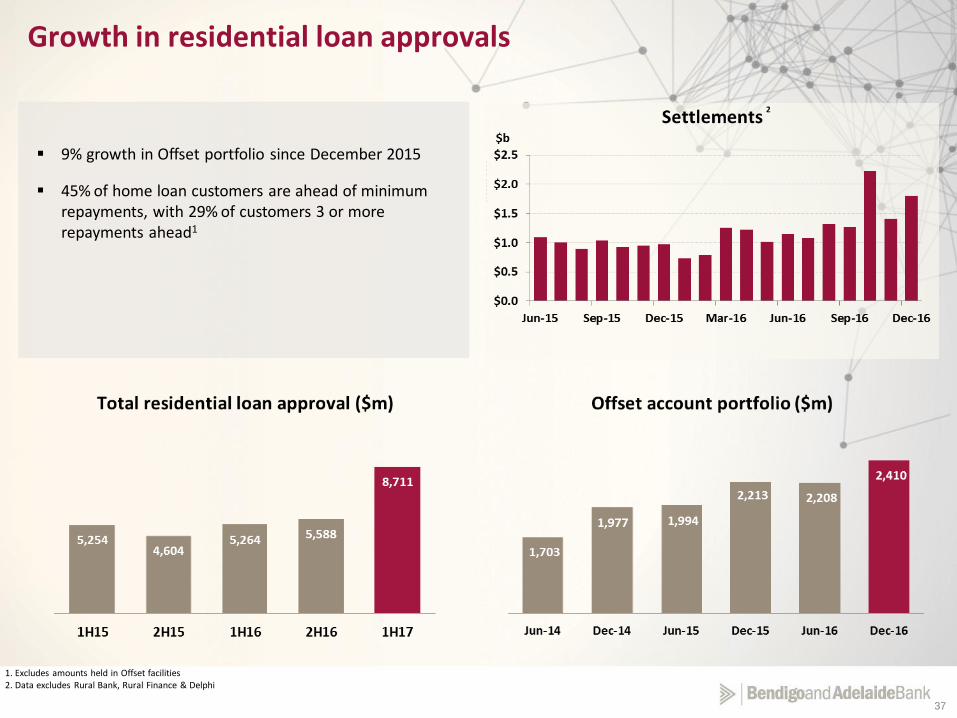
37
Growth in residential loan approvals
9% growth in Offset portfolio since December 2015
45% of home loan customers are ahead of minimum repayments, with 29% of customers 3 or more repayments ahead1
1. Excludes amounts held in Offset facilities2. Data excludes Rural Bank, Rural Finance & Delphi
2
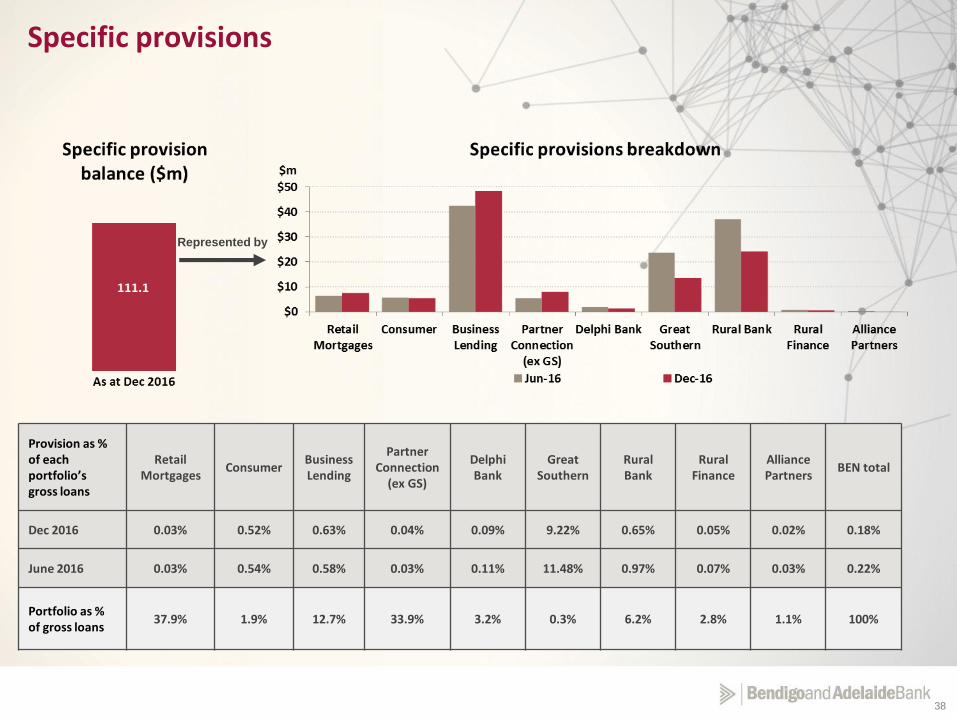
38
Provision as % of each portfolio’s gross loans
Retail Mortgages
ConsumerBusiness Lending
Partner Connection
(ex GS)
Delphi Bank
Great Southern
Rural Bank
Rural Finance
Alliance Partners
BEN total
Dec 2016 0.03% 0.52% 0.63% 0.04% 0.09% 9.22% 0.65% 0.05% 0.02% 0.18%
June 2016 0.03% 0.54% 0.58% 0.03% 0.11% 11.48% 0.97% 0.07% 0.03% 0.22%
Portfolio as % of gross loans
37.9% 1.9% 12.7% 33.9% 3.2% 0.3% 6.2% 2.8% 1.1% 100%
Specific provisions
Represented by
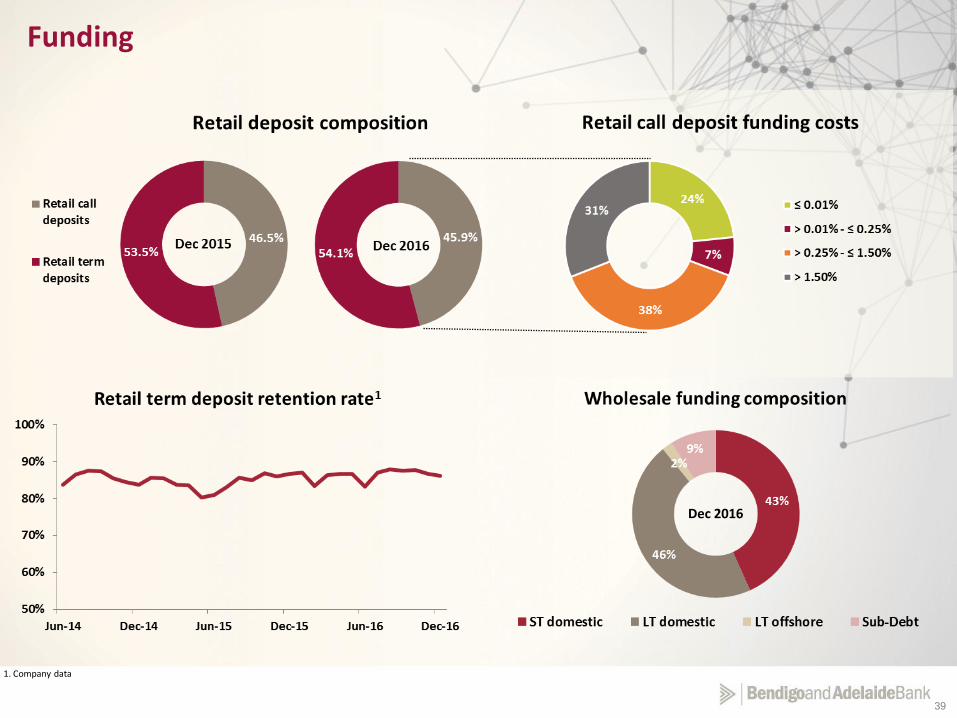
39
1. Company data
Funding
Dec 2016
40
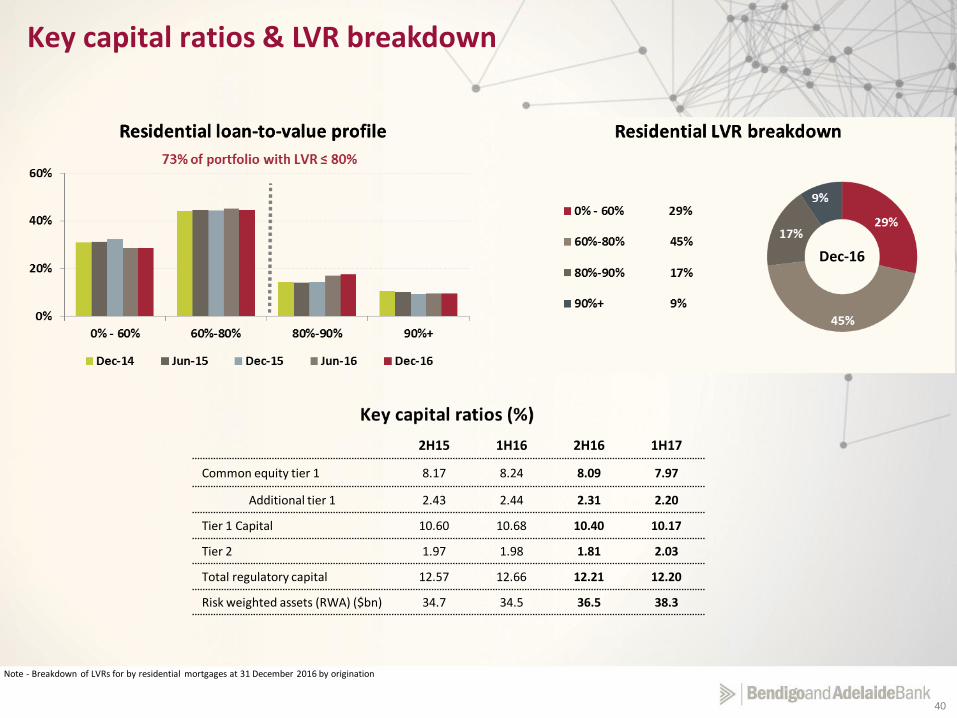
Note - Breakdown of LVRs for by residential mortgages at 31 December 2016 by origination
Key capital ratios & LVR breakdown
2H15 1H16 2H16 1H17
Common equity tier 1 8.17 8.24 8.09 7.97
Additional tier 1 2.43 2.44 2.31 2.20
Tier 1 Capital 10.60 10.68 10.40 10.17
Tier 2 1.97 1.98 1.81 2.03
Total regulatory capital 12.57 12.66 12.21 12.20
Risk weighted assets (RWA) ($bn) 34.7 34.5 36.5 38.3
Dec-16
41
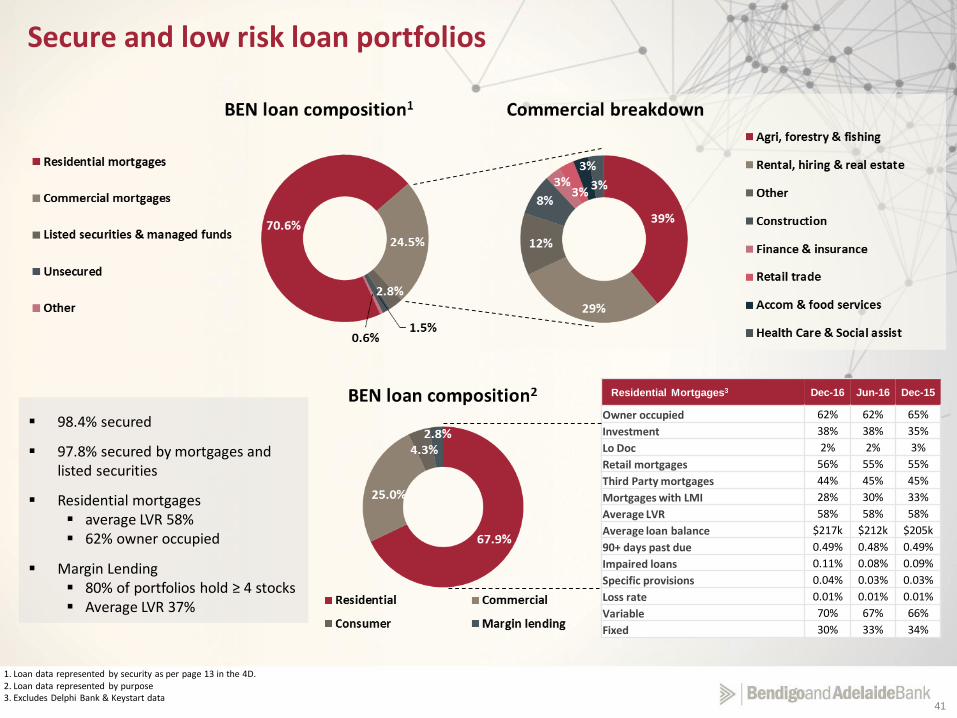
98.4% secured
97.8% secured by mortgages and listed securities
Residential mortgages average LVR 58% 62% owner occupied
Margin Lending 80% of portfolios hold ≥ 4 stocks Average LVR 37%
Secure and low risk loan portfolios
1. Loan data represented by security as per page 13 in the 4D.2. Loan data represented by purpose3. Excludes Delphi Bank & Keystart data
Residential Mortgages3 Dec-16 Jun-16 Dec-15
Owner occupied 62% 62% 65%
Investment 38% 38% 35%
Lo Doc 2% 2% 3%
Retail mortgages 56% 55% 55%
Third Party mortgages 44% 45% 45%
Mortgages with LMI 28% 30% 33%
Average LVR 58% 58% 58%
Average loan balance $217k $212k $205k
90+ days past due 0.49% 0.48% 0.49%
Impaired loans 0.11% 0.08% 0.09%
Specific provisions 0.04% 0.03% 0.03%
Loss rate 0.01% 0.01% 0.01%
Variable 70% 67% 66%
Fixed 30% 33% 34%
42
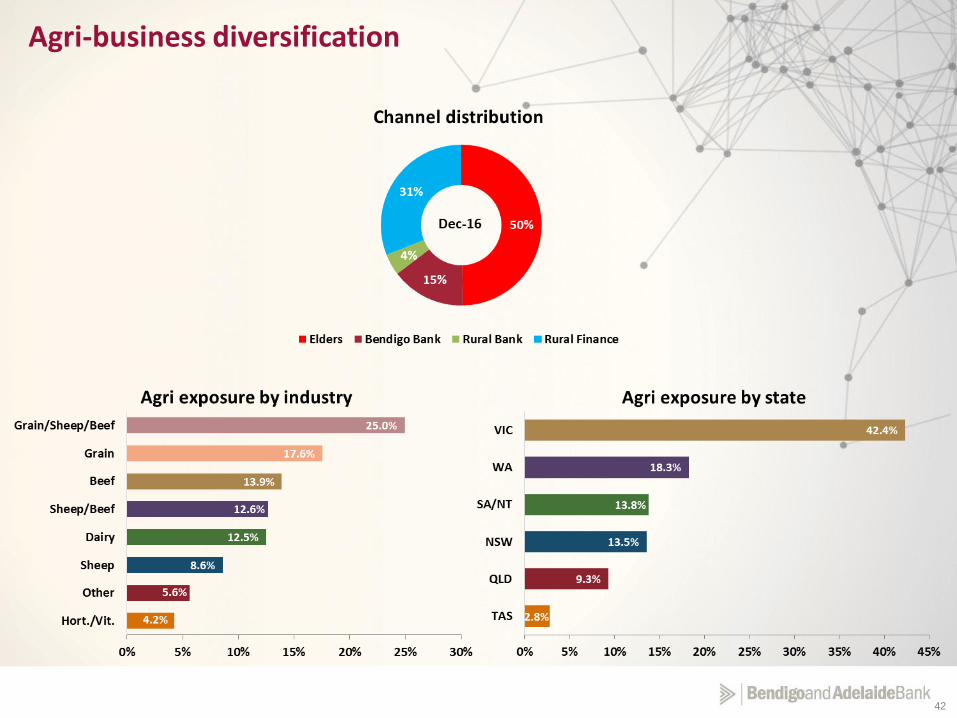
Agri-business diversification
43
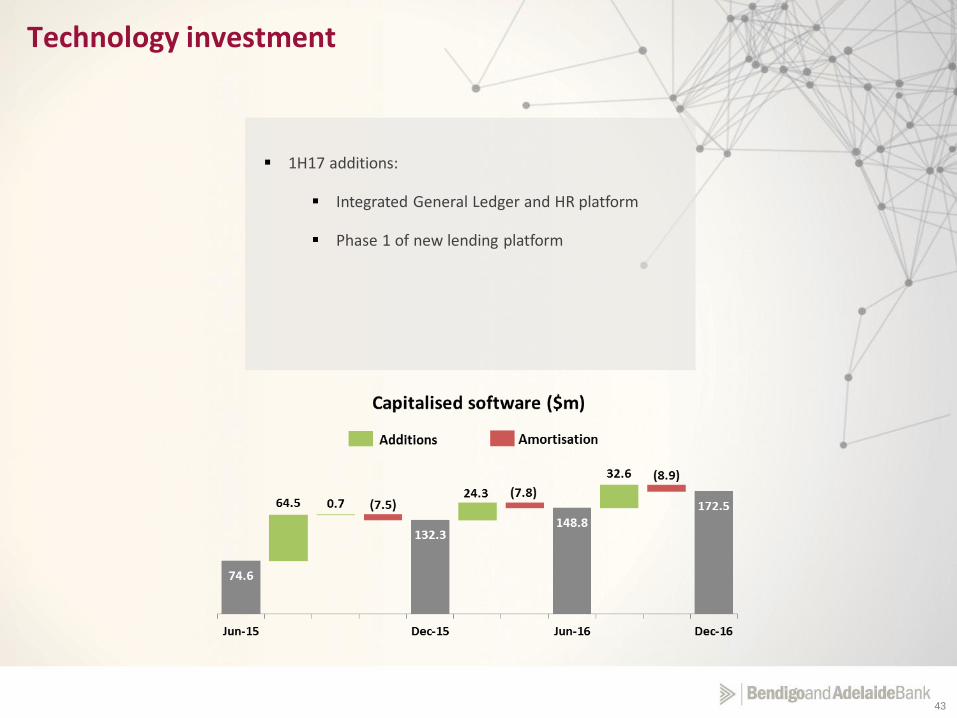
Technology investment
1H17 additions:
Integrated General Ledger and HR platform
Phase 1 of new lending platform
44
Analysts
Travis Crouch
Head of Investor Relations
Bendigo and Adelaide Bank Limited
Tel: +61 3 5485 6261
Mob: +61 418 552 922
Email: [email protected]
James Officer
Senior Manager Investor Relations
Bendigo and Adelaide Bank Limited
Tel: +61 8 8300 6056
Mob: +61 403 112 796
Email: [email protected]
Media
Silvana Arena
Head of Public Relations
Bendigo and Adelaide Bank Limited
Tel: +61 8 8220 7784
Mob: +61 402 110 445
Email: [email protected]
Contact