Embed Size (px)
DESCRIPTION
ImageJ tutorial showing the operations needed to calculate air-filled porosity for an example soil column. Reading/Importing data. If you want to load slices in a stack, import your data as an Image Sequence. Open one image from the folder where your data is stored. - PowerPoint PPT Presentation
Citation preview
ImageJ tutorial showing the operations
needed to calculate air-filled porosity for an example soil
column
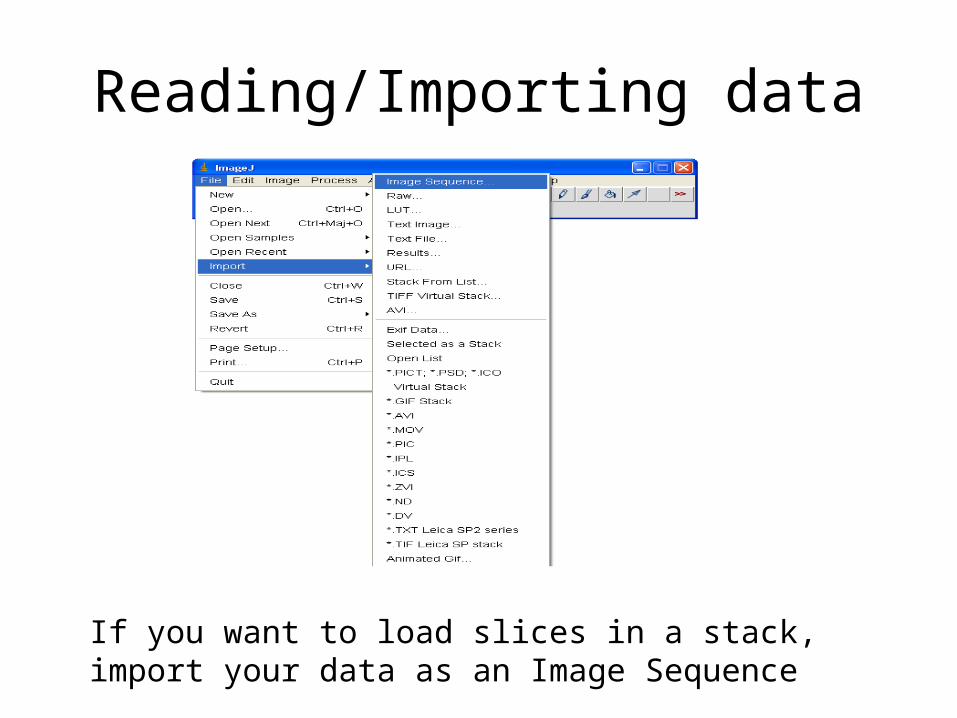
Reading/Importing data
If you want to load slices in a stack, import your data as an Image Sequence
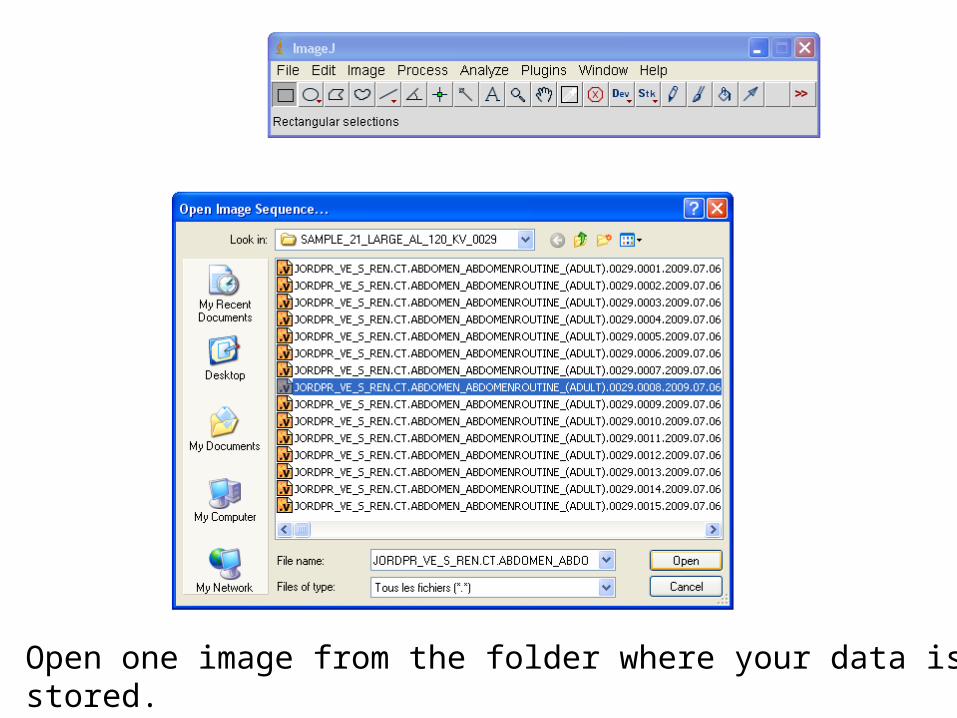
Open one image from the folder where your data is stored.
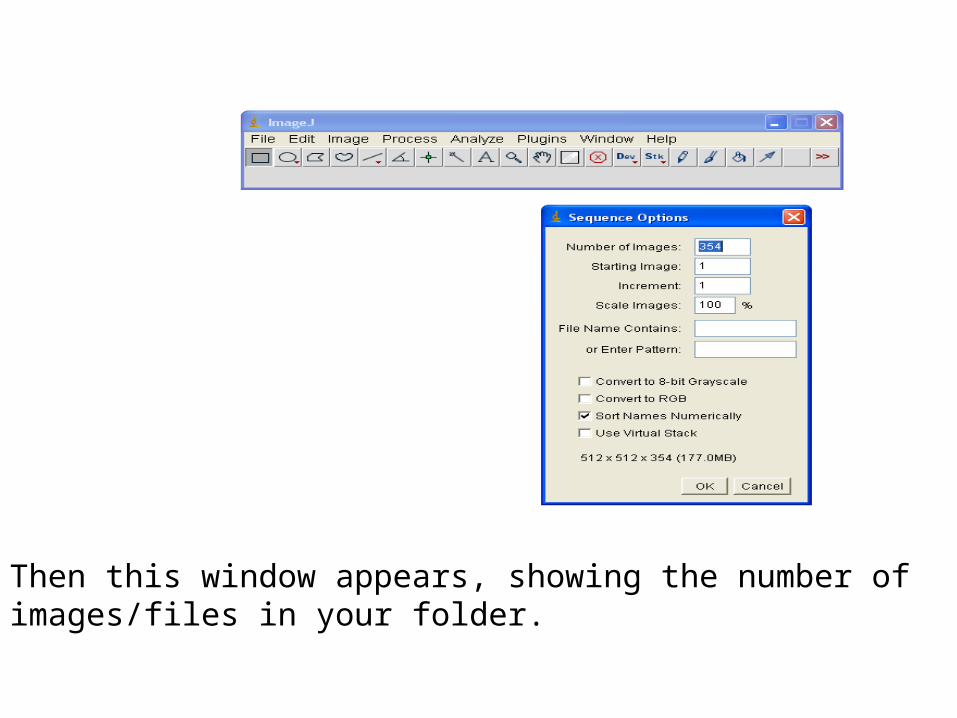
Then this window appears, showing the number of images/files in your folder.
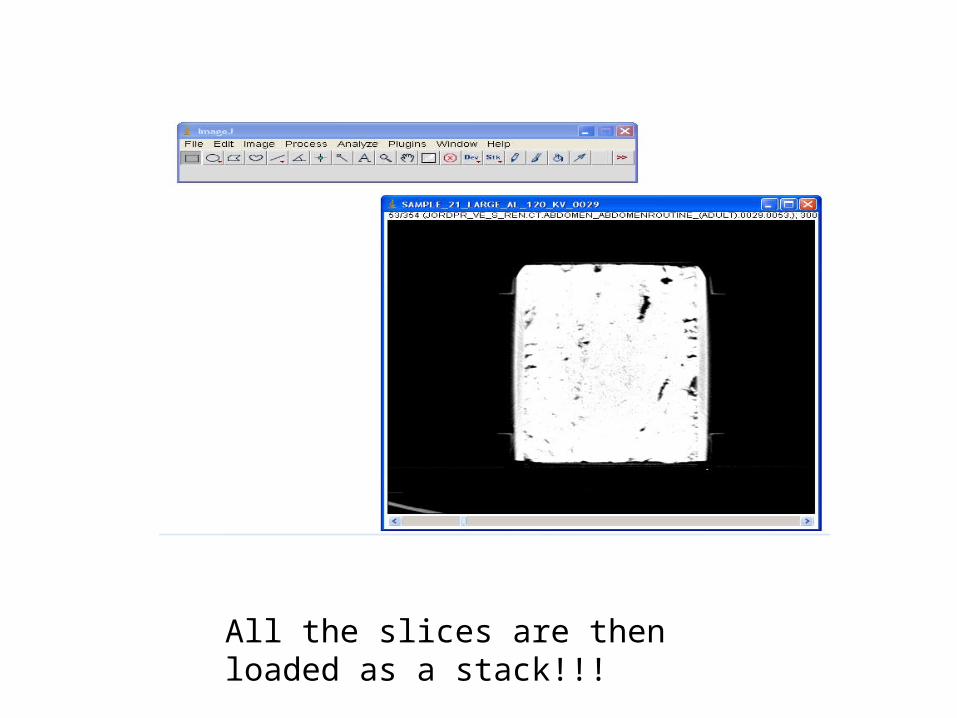
All the slices are then loaded as a stack!!!
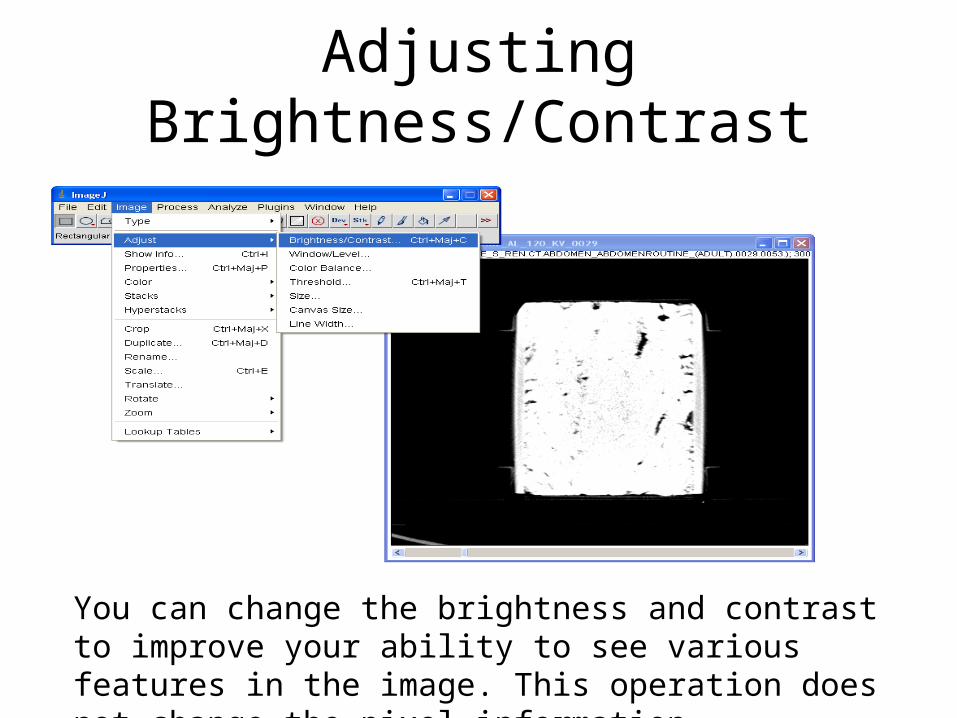
Adjusting Brightness/Contrast
You can change the brightness and contrast to improve your ability to see various features in the image. This operation does not change the pixel information.
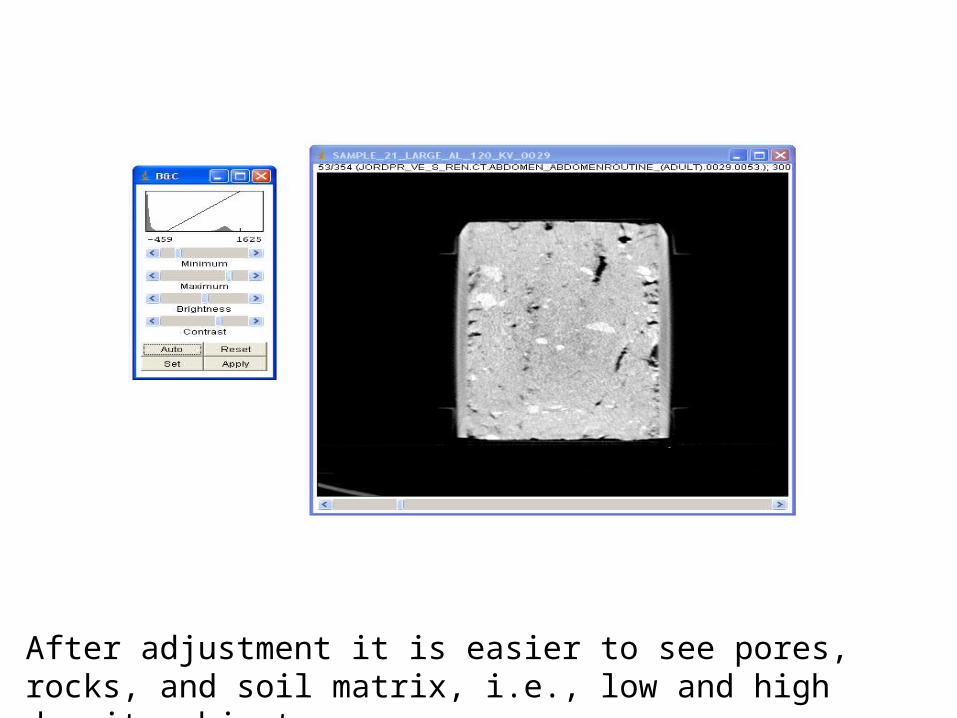
After adjustment it is easier to see pores, rocks, and soil matrix, i.e., low and high density objects
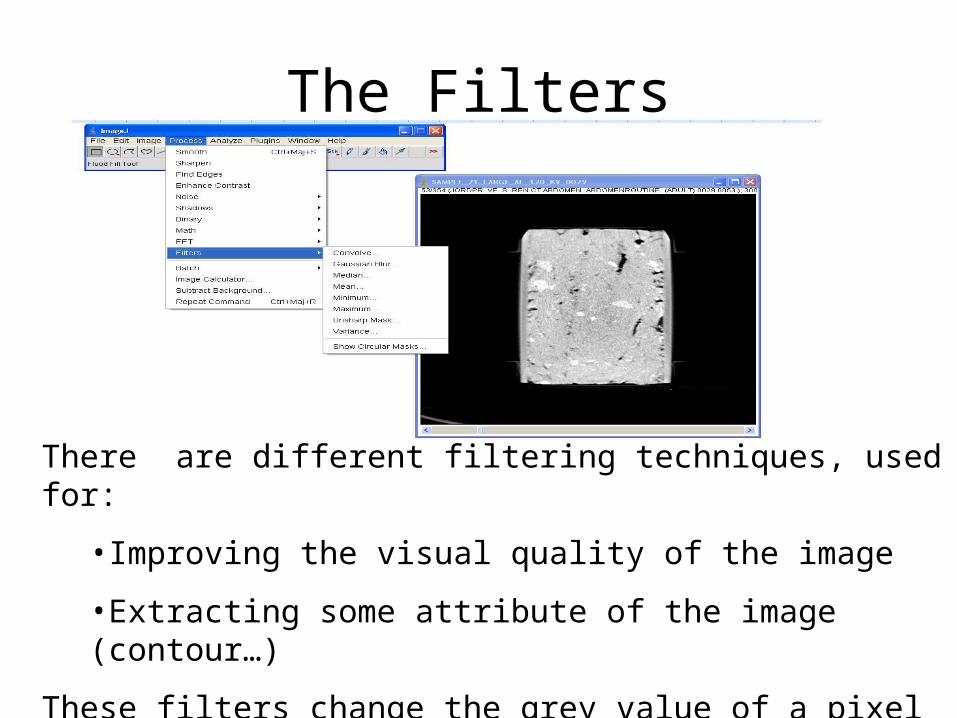
The Filters
There are different filtering techniques, used for:
•Improving the visual quality of the image
•Extracting some attribute of the image (contour…)
These filters change the grey value of a pixel according to the value of its neighbors (involves varying degree of smoothing)
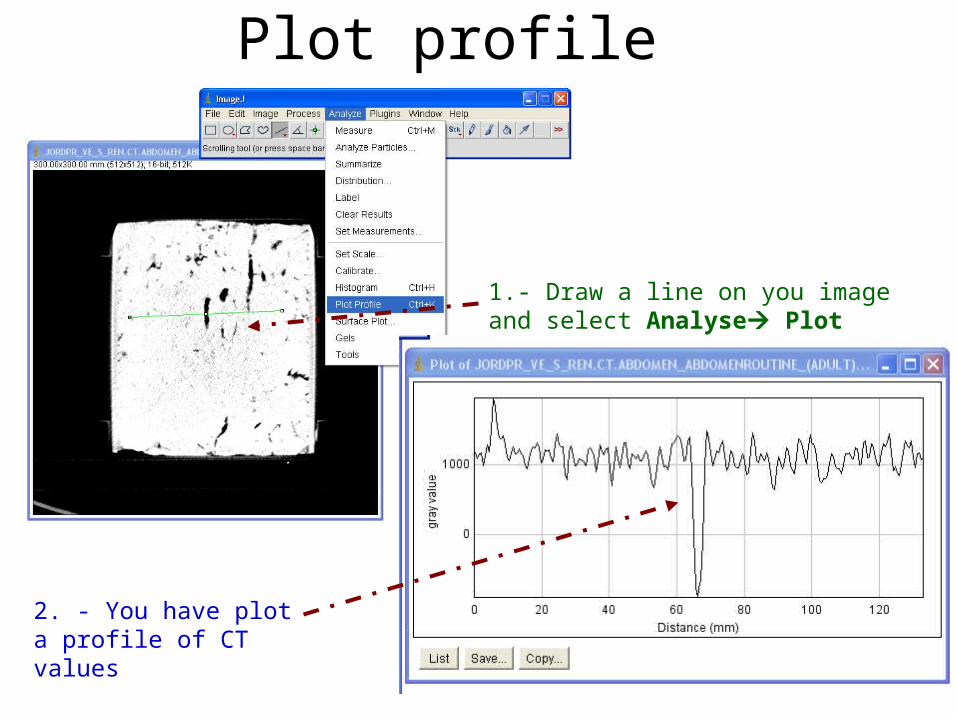
Plot profile
1.- Draw a line on you image and select Analyse Plot Profile
2. - You have plot a profile of CT values
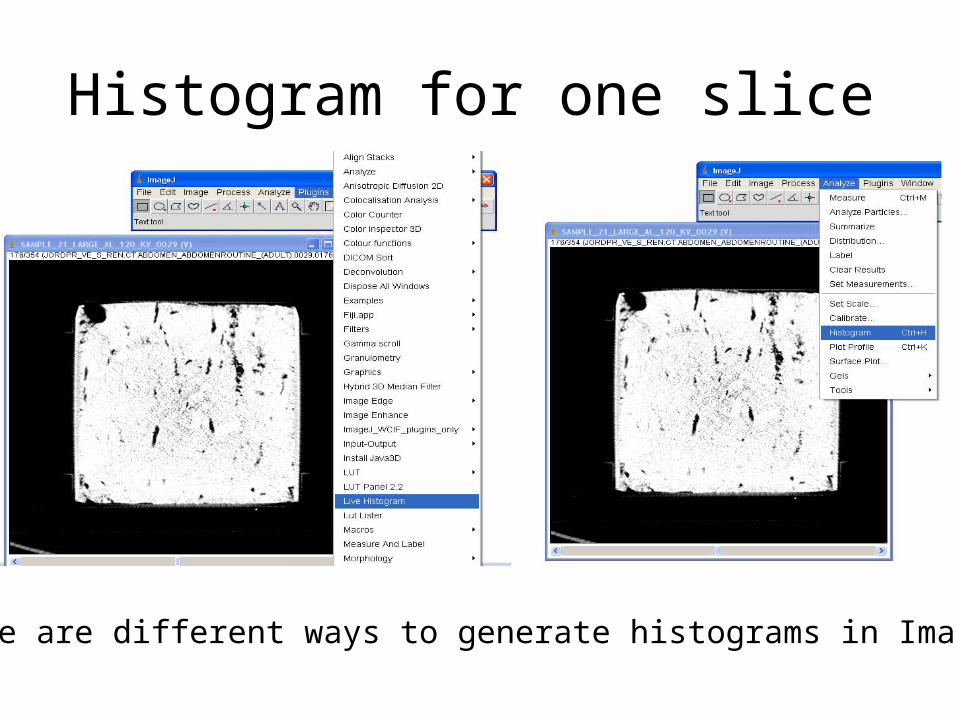
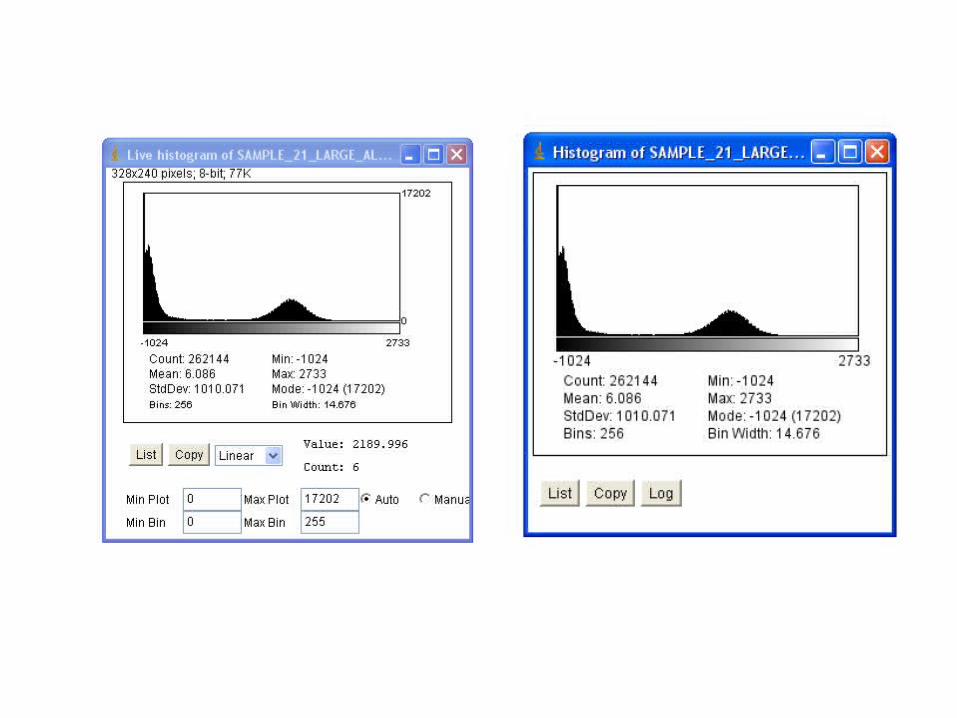
Histogram for one slice
There are different ways to generate histograms in ImageJ
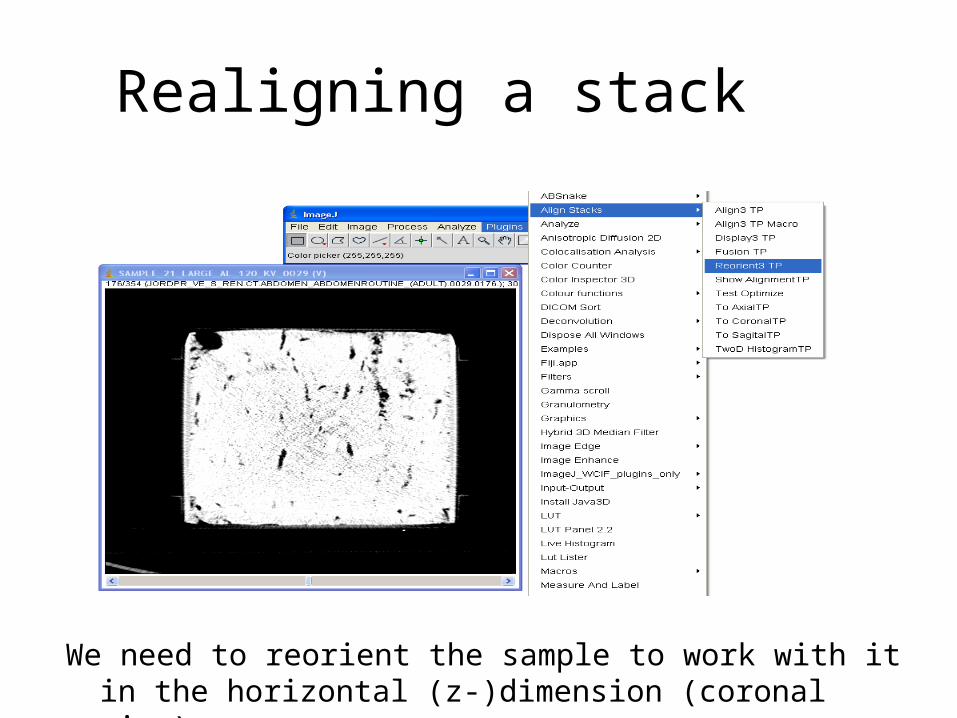
Realigning a stack
We need to reorient the sample to work with it in the horizontal (z-)dimension (coronal view).
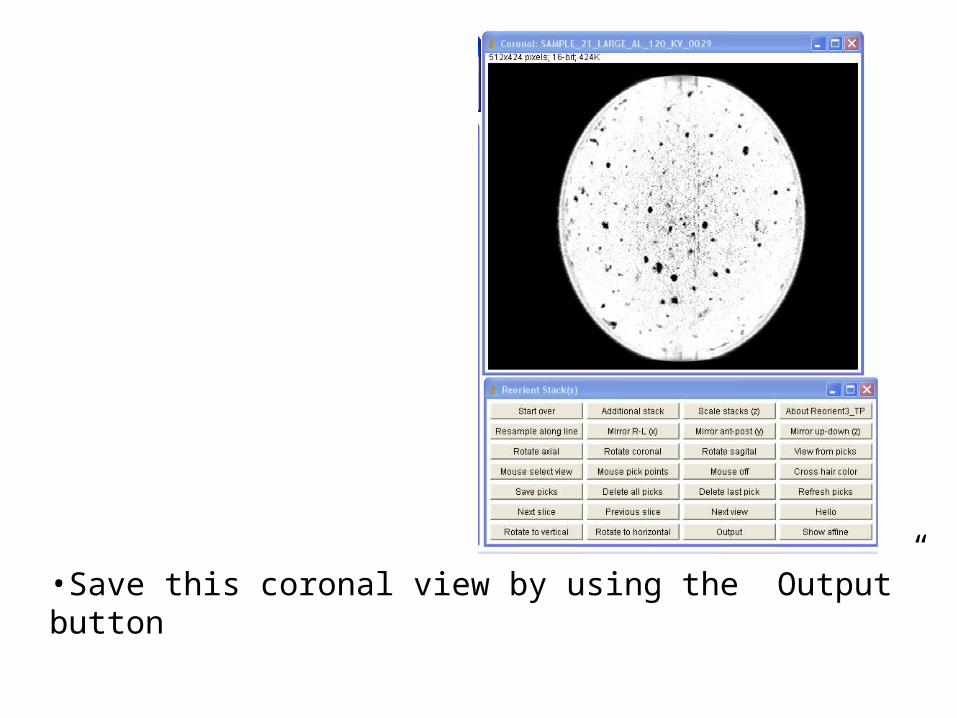
•Save this coronal view by using the ”Output” button
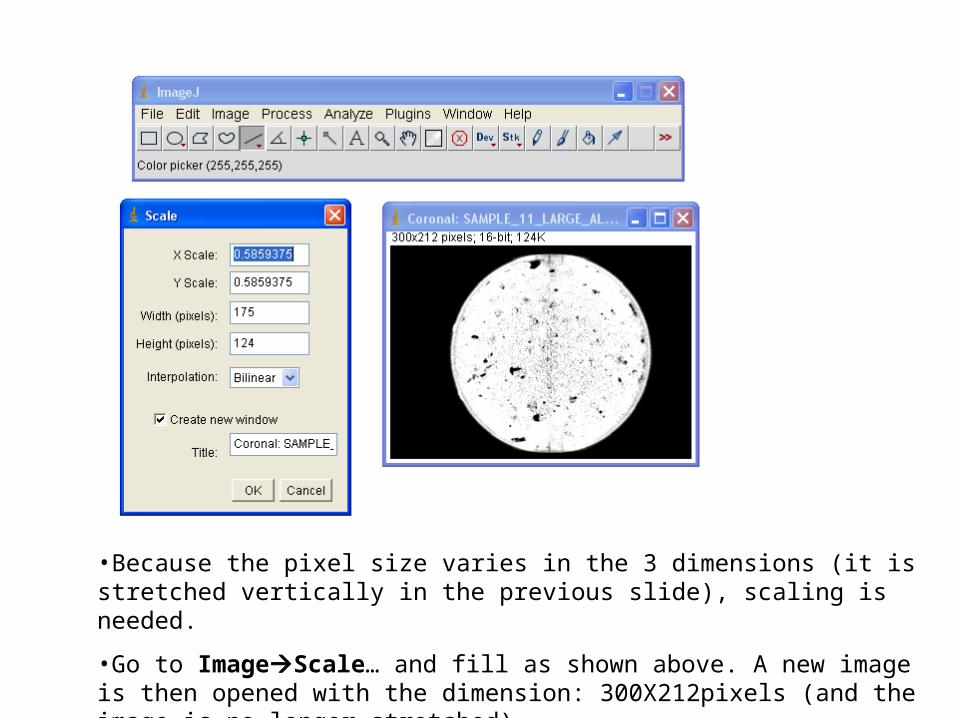
•Because the pixel size varies in the 3 dimensions (it is stretched vertically in the previous slide), scaling is needed.
•Go to ImageScale… and fill as shown above. A new image is then opened with the dimension: 300X212pixels (and the image is no longer stretched)
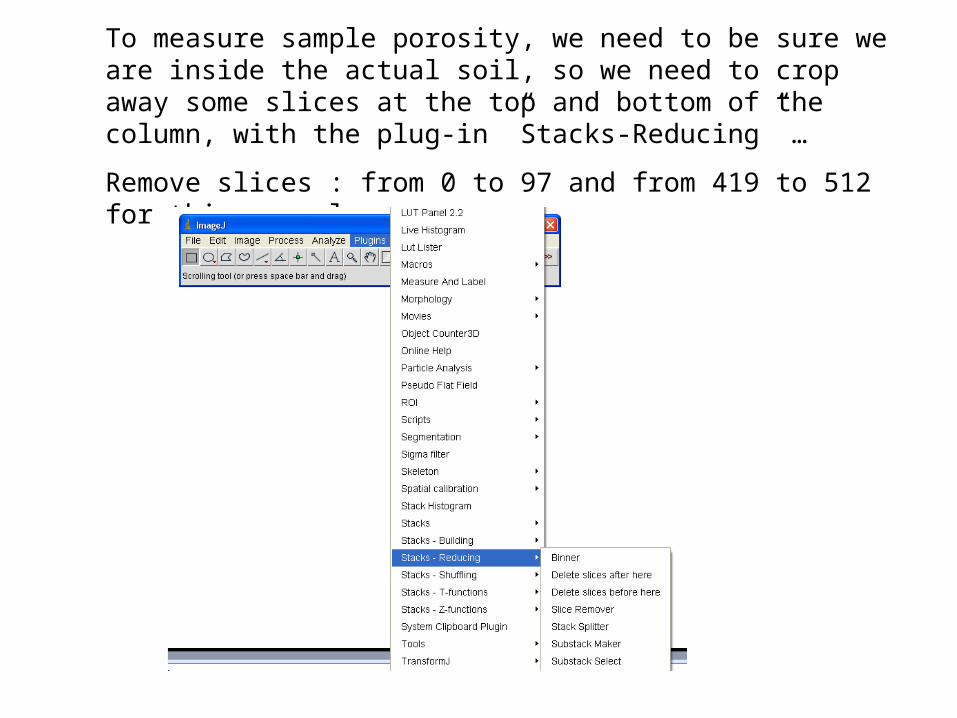
To measure sample porosity, we need to be sure we are inside the actual soil, so we need to crop away some slices at the top and bottom of the column, with the plug-in ”Stacks-Reducing” …
Remove slices : from 0 to 97 and from 419 to 512 for this example.
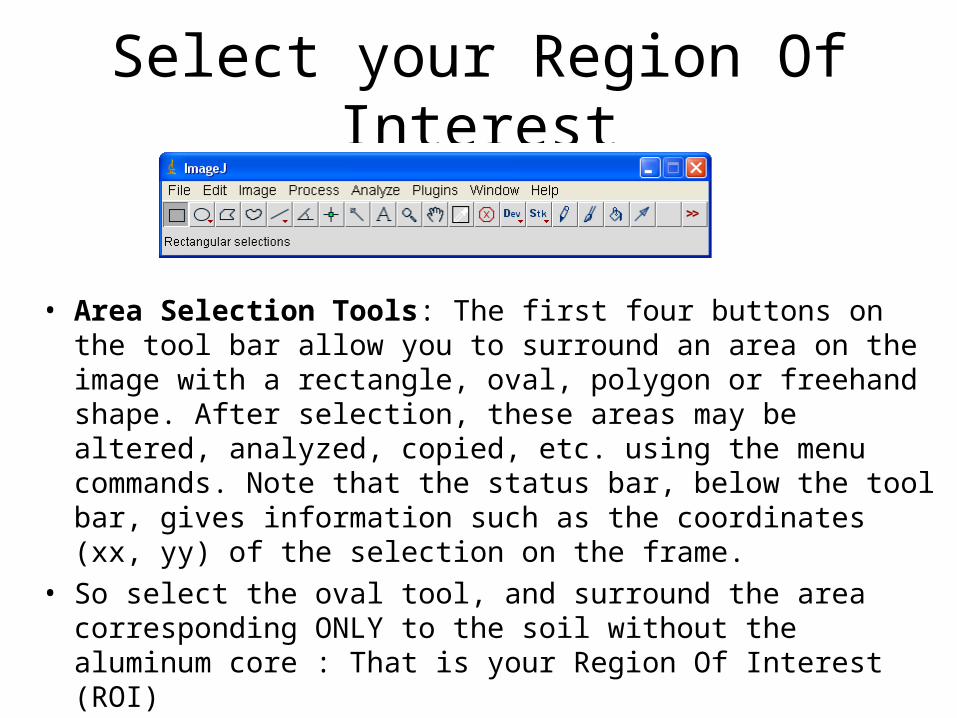
Select your Region Of Interest
• Area Selection Tools: The first four buttons on the tool bar allow you to surround an area on the image with a rectangle, oval, polygon or freehand shape. After selection, these areas may be altered, analyzed, copied, etc. using the menu commands. Note that the status bar, below the tool bar, gives information such as the coordinates (xx, yy) of the selection on the frame.
• So select the oval tool, and surround the area corresponding ONLY to the soil without the aluminum core : That is your Region Of Interest (ROI)
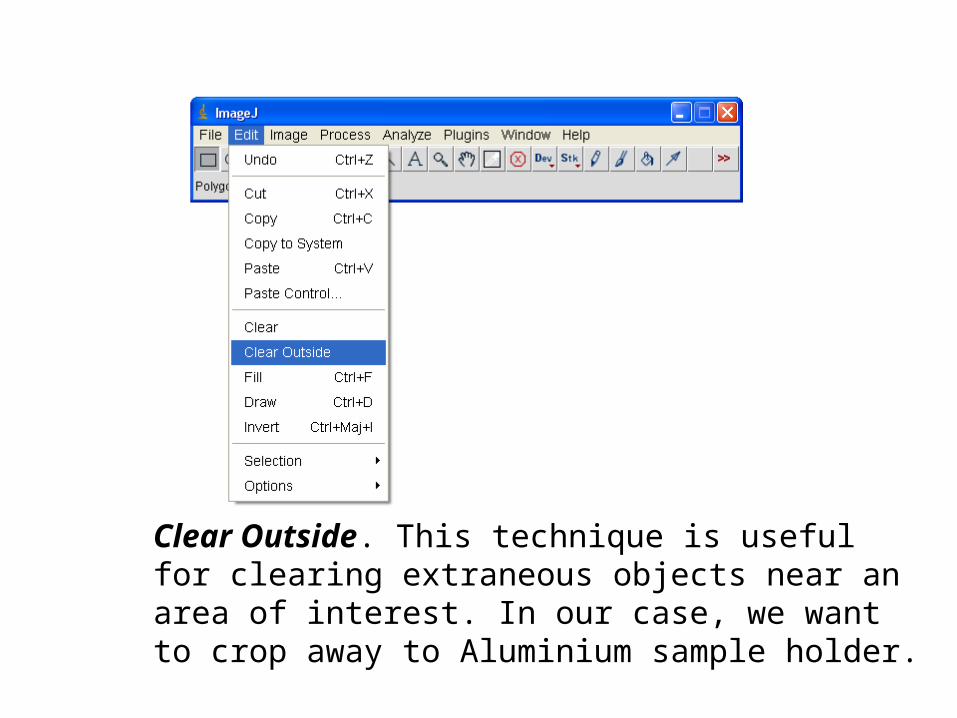
Clear Outside. This technique is useful for clearing extraneous objects near an area of interest. In our case, we want to crop away to Aluminium sample holder.
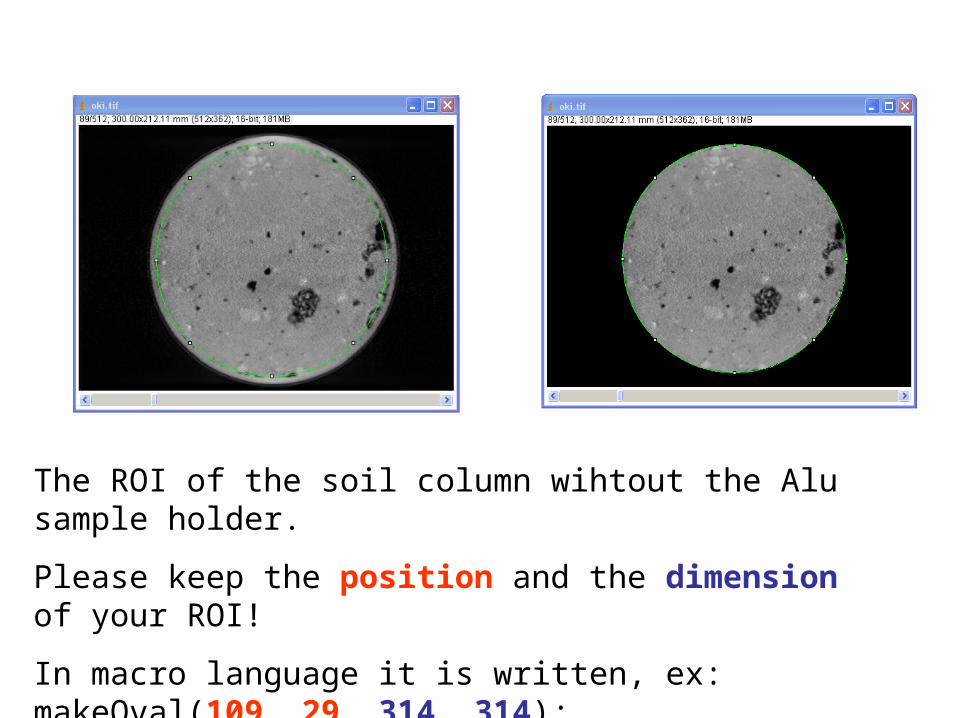
The ROI of the soil column wihtout the Alu sample holder.
Please keep the position and the dimension of your ROI!
In macro language it is written, ex: makeOval(109, 29, 314, 314);
All the slices in the stack can be processed this way then
Thresholding
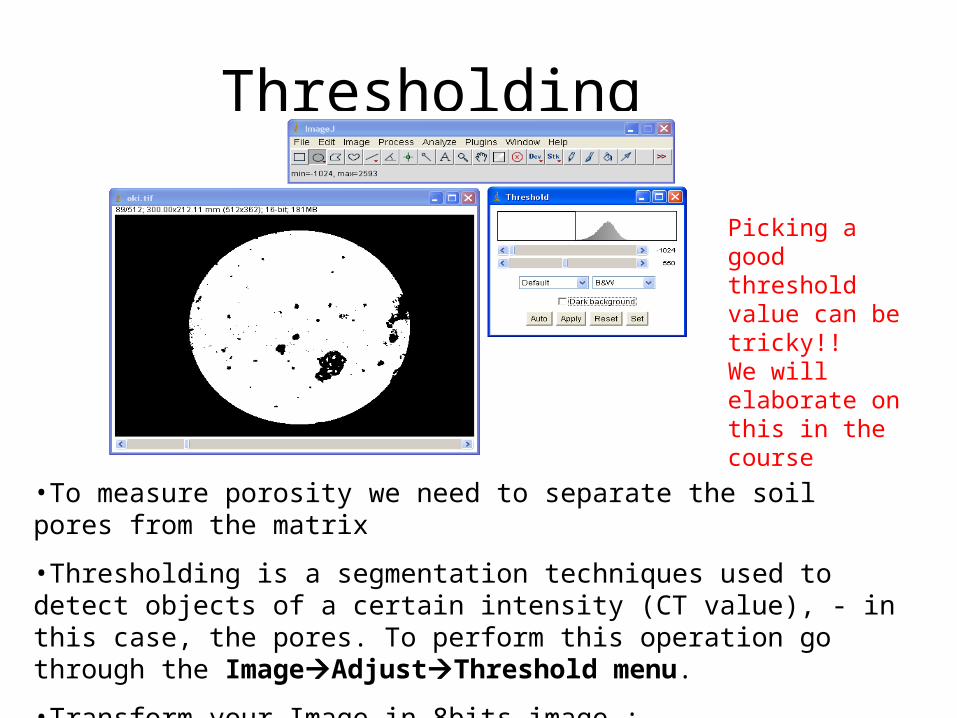
•To measure porosity we need to separate the soil pores from the matrix
•Thresholding is a segmentation techniques used to detect objects of a certain intensity (CT value), - in this case, the pores. To perform this operation go through the ImageAdjustThreshold menu.
•Transform your Image in 8bits image : ImageType8bits
•Then, invert the image color to show pores in white!
Picking a good threshold value can be tricky!! We will elaborate on this in the course
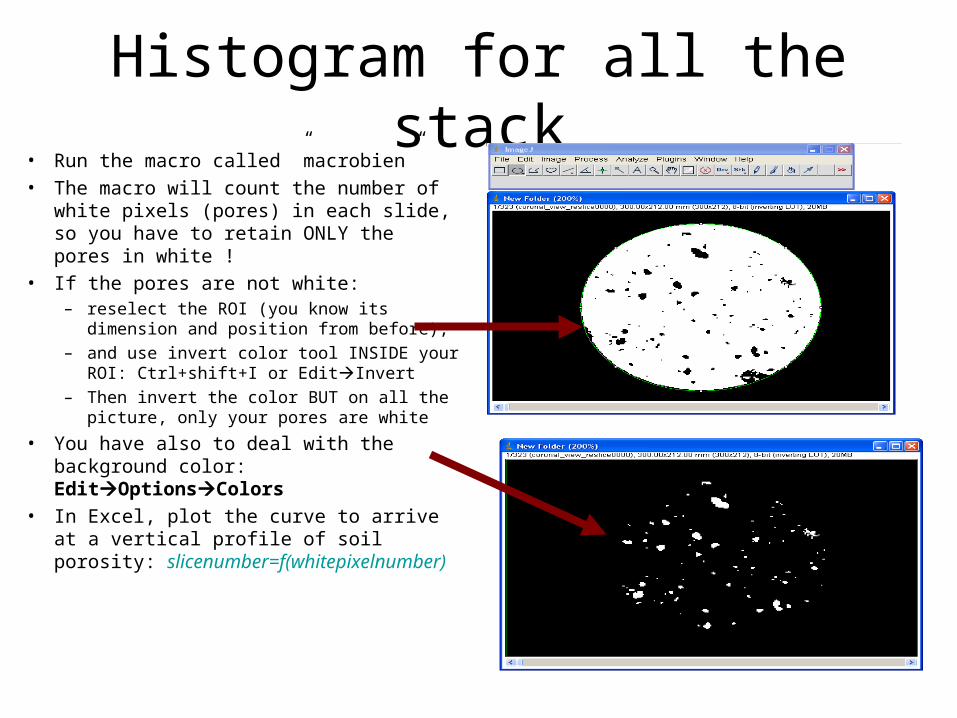
Histogram for all the stack• Run the macro called ”macrobien”
• The macro will count the number of white pixels (pores) in each slide, so you have to retain ONLY the pores in white !
• If the pores are not white:– reselect the ROI (you know its
dimension and position from before), – and use invert color tool INSIDE your
ROI: Ctrl+shift+I or EditInvert– Then invert the color BUT on all the
picture, only your pores are white
• You have also to deal with the background color: EditOptionsColors
• In Excel, plot the curve to arrive at a vertical profile of soil porosity: slicenumber=f(whitepixelnumber)
Calculation of the porosity
• The number of white (pore) pixels for each slice• The dimension of your ROI (then you know the volume
of the new core)• So we sum up the number of white pixels for the slices
relative to the total number of pixels in the volume we’re working with (pi*r*r*number of slices) for the soil column used here
• Then you can calculate the total air-filled porosity
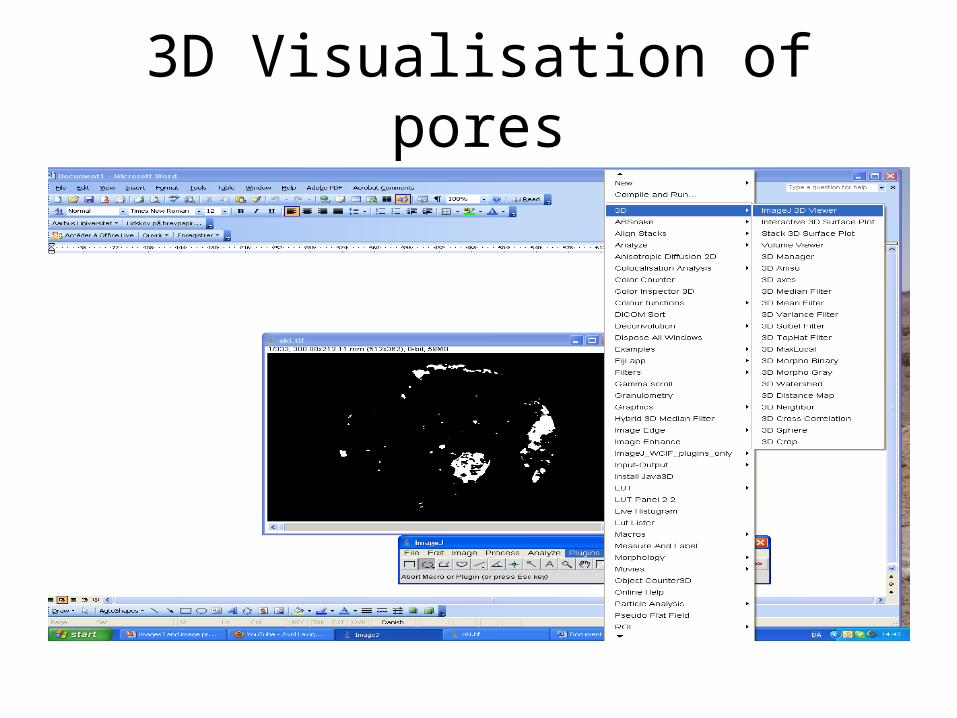
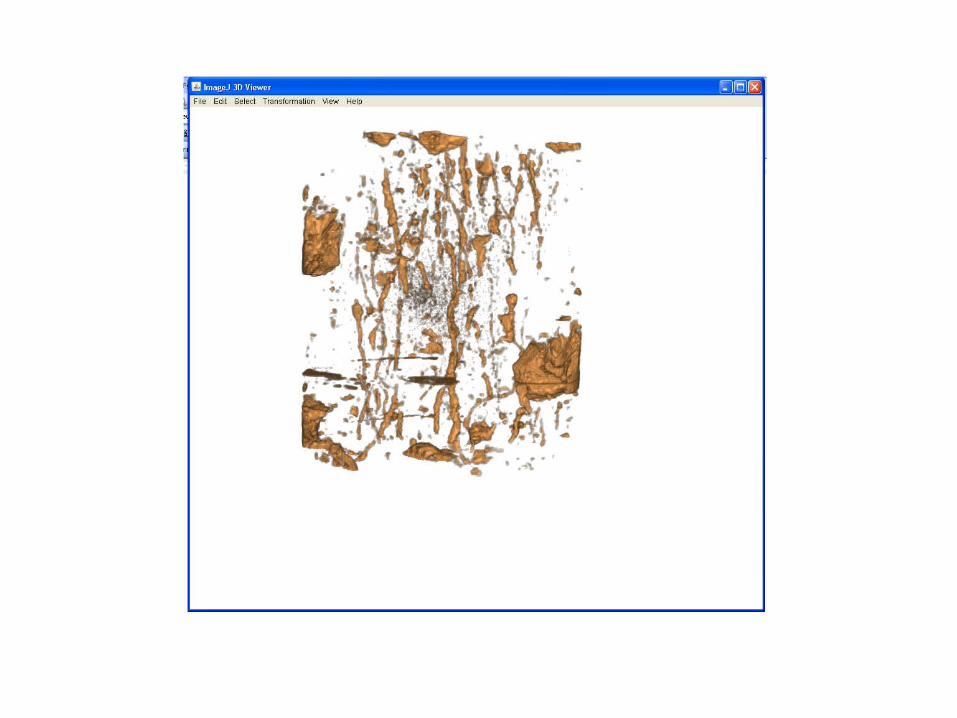
3D Visualisation of pores