Embed Size (px)
Citation preview
Real-World Activity of Heavy-Duty Tractors Hauling Container Chassis,
Flatbed Trailer, and Tank Trailer
1
Kanok Boriboonsomsina, Thomas D. Durbina, George Scoraa, Kent Johnsona, Daniel Sandeza, Alexander Vua, Yu Jianga, Andrew
Burnetteb, Alex Santosc, Stephan Lemieuxc, Hector Maldonadoc, Sonya Collierc, John Collinsc, and Seungju Yoonc
aUniversity of California at RiversidebinfoWedge
cCalifornia Air Resources Board
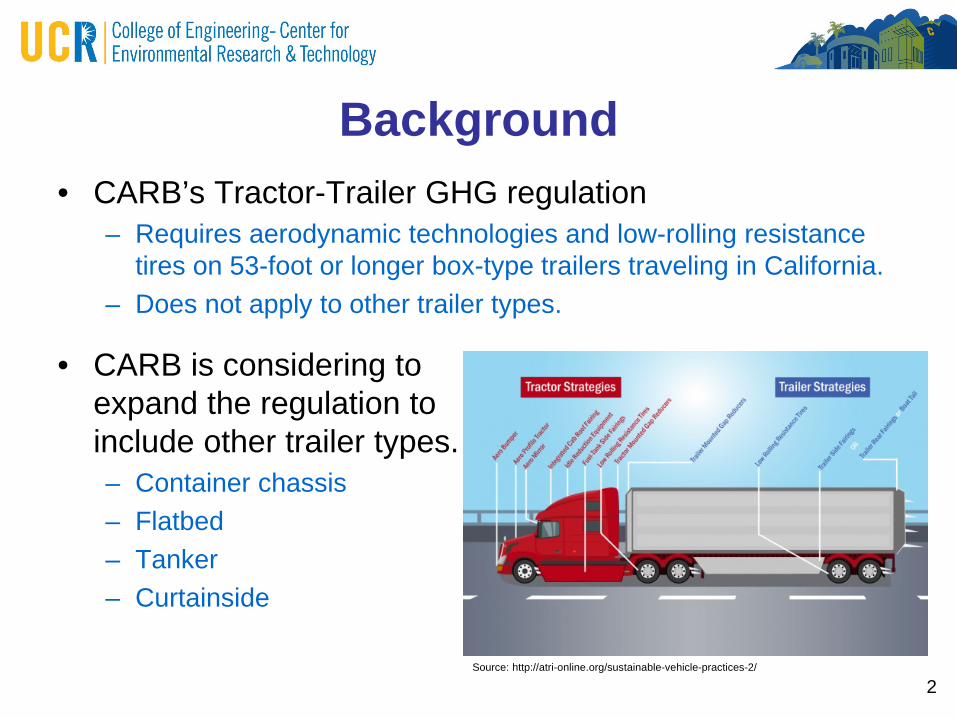
Background• CARB’s Tractor-Trailer GHG regulation
– Requires aerodynamic technologies and low-rolling resistance tires on 53-foot or longer box-type trailers traveling in California.
– Does not apply to other trailer types.
2
• CARB is considering to expand the regulation to include other trailer types.– Container chassis– Flatbed– Tanker– Curtainside
Source: http://atri-online.org/sustainable-vehicle-practices-2/
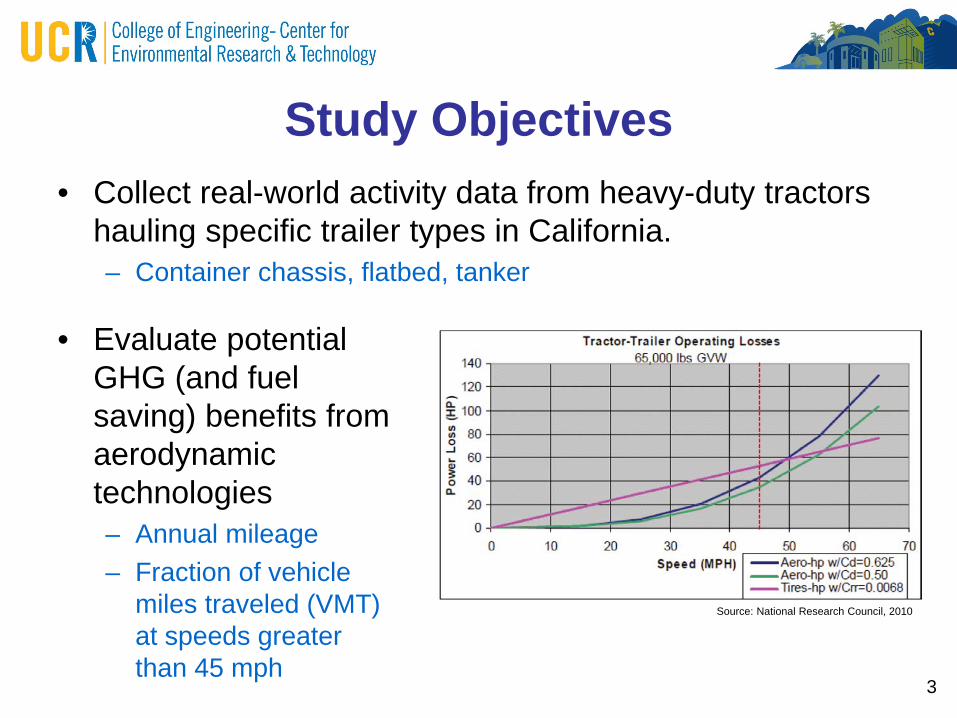
Study Objectives• Collect real-world activity data from heavy-duty tractors
hauling specific trailer types in California.– Container chassis, flatbed, tanker
3
Source: National Research Council, 2010
• Evaluate potential GHG (and fuel saving) benefits from aerodynamic technologies– Annual mileage– Fraction of vehicle
miles traveled (VMT) at speeds greater than 45 mph
Scope of Study • Evaluate a trailer registration database.
– IHS registration databased 2000-2015– Container chassis, flatbed, tanker, and curtainsides
• Fleet survey for fleets with registered trailers of interest.– # of different types of trailers, the applications and types of loads
these trailers carry, and how these trailers are typically used
• Collect activity data from trucks that haul trailers of interest.
4
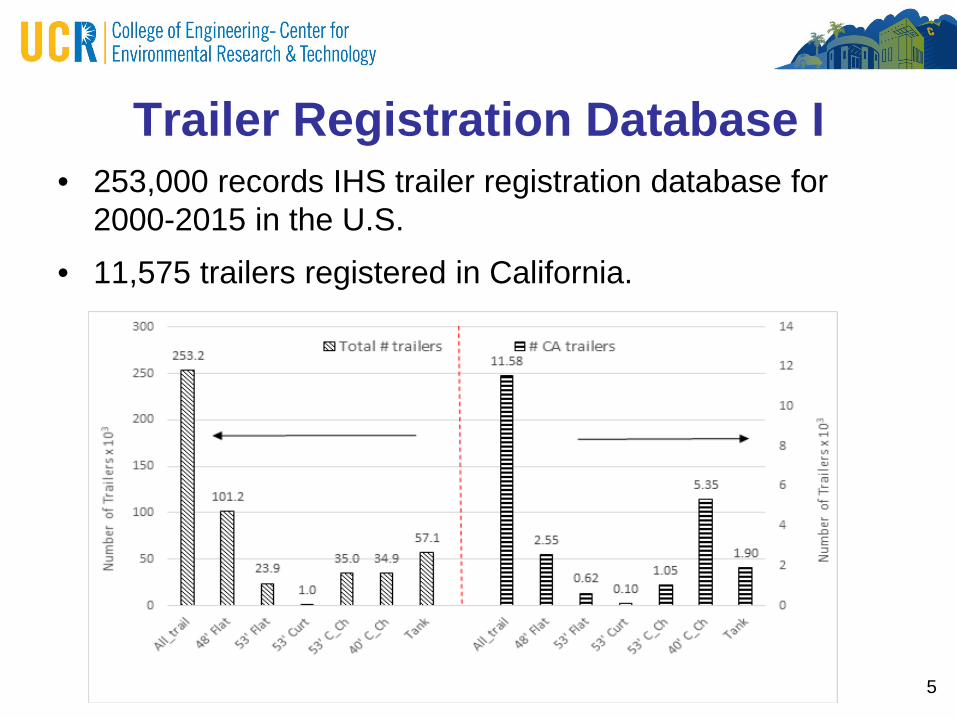
Trailer Registration Database I • 253,000 records IHS trailer registration database for
2000-2015 in the U.S.• 11,575 trailers registered in California.
5
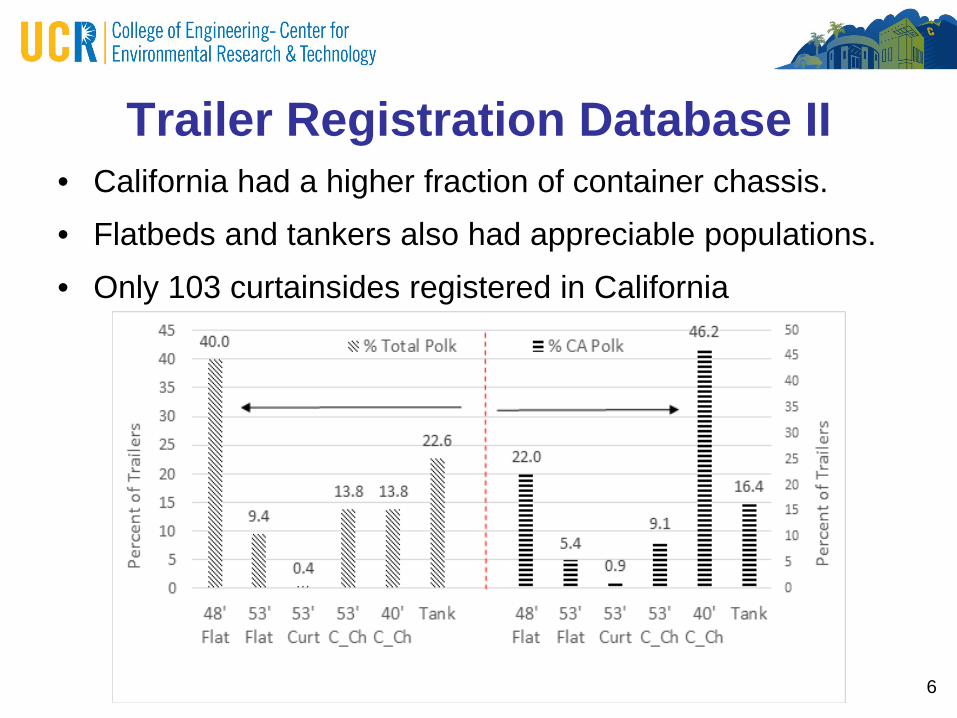
Trailer Registration Database II • California had a higher fraction of container chassis.• Flatbeds and tankers also had appreciable populations.• Only 103 curtainsides registered in California
6
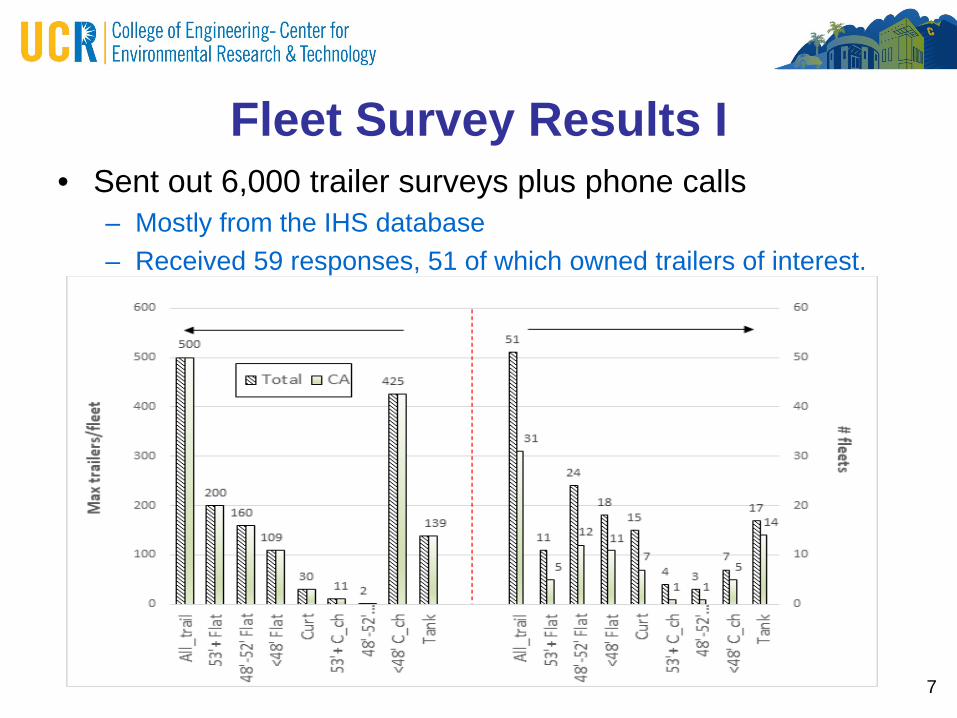
Fleet Survey Results I • Sent out 6,000 trailer surveys plus phone calls
– Mostly from the IHS database– Received 59 responses, 51 of which owned trailers of interest.
7
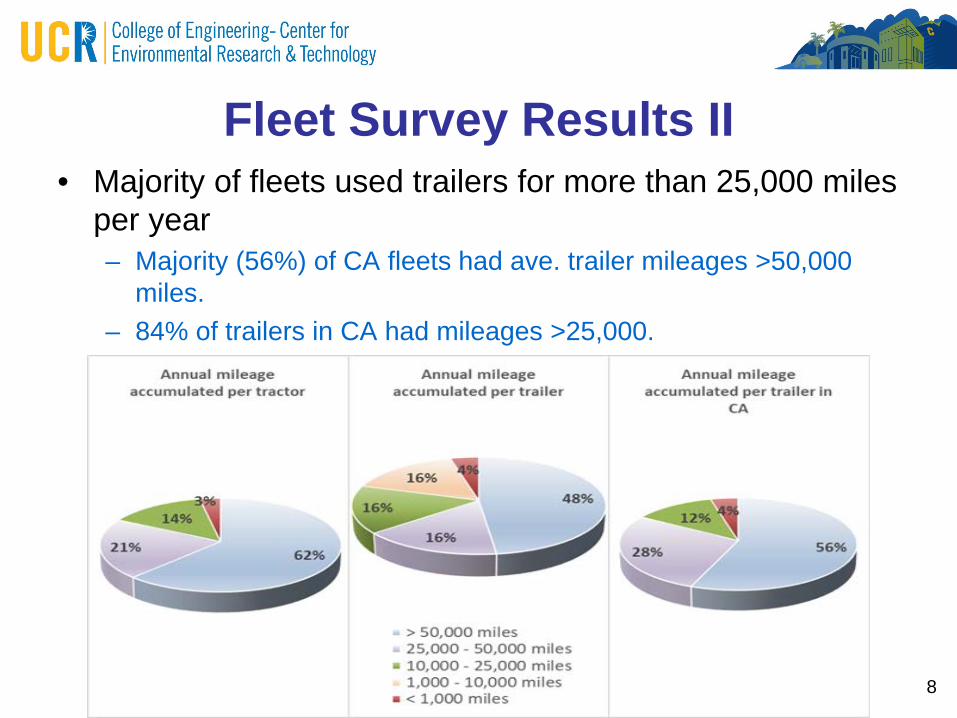
Fleet Survey Results II • Majority of fleets used trailers for more than 25,000 miles
per year– Majority (56%) of CA fleets had ave. trailer mileages >50,000
miles.– 84% of trailers in CA had mileages >25,000.
8
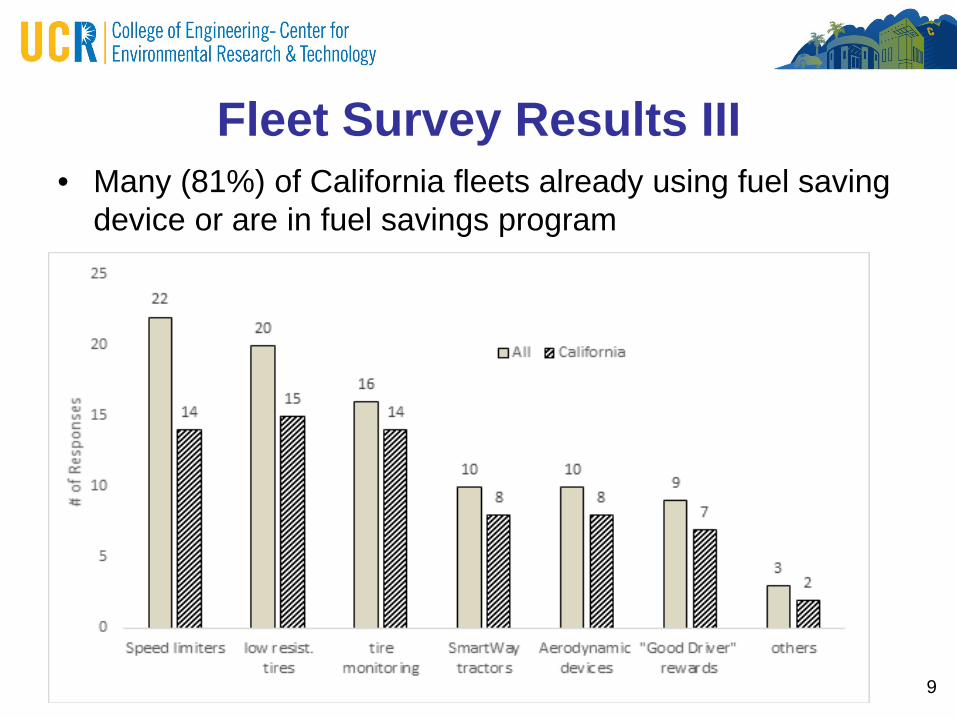
Fleet Survey Results III • Many (81%) of California fleets already using fuel saving
device or are in fuel savings program
9
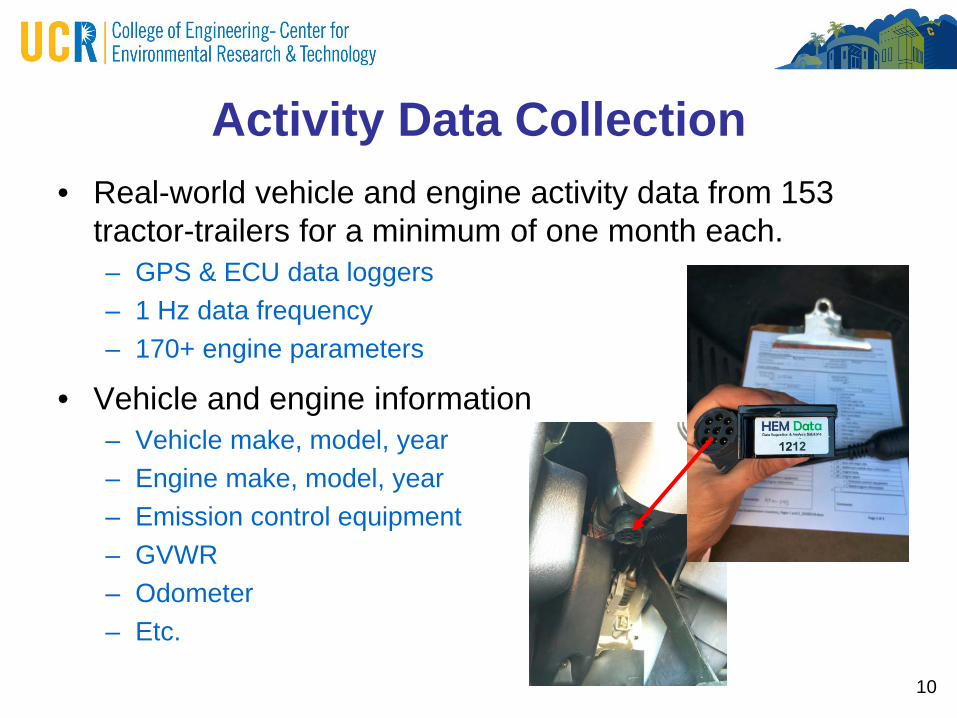
Activity Data Collection• Real-world vehicle and engine activity data from 153
tractor-trailers for a minimum of one month each.– GPS & ECU data loggers– 1 Hz data frequency– 170+ engine parameters
• Vehicle and engine information– Vehicle make, model, year– Engine make, model, year– Emission control equipment– GVWR– Odometer– Etc.
10
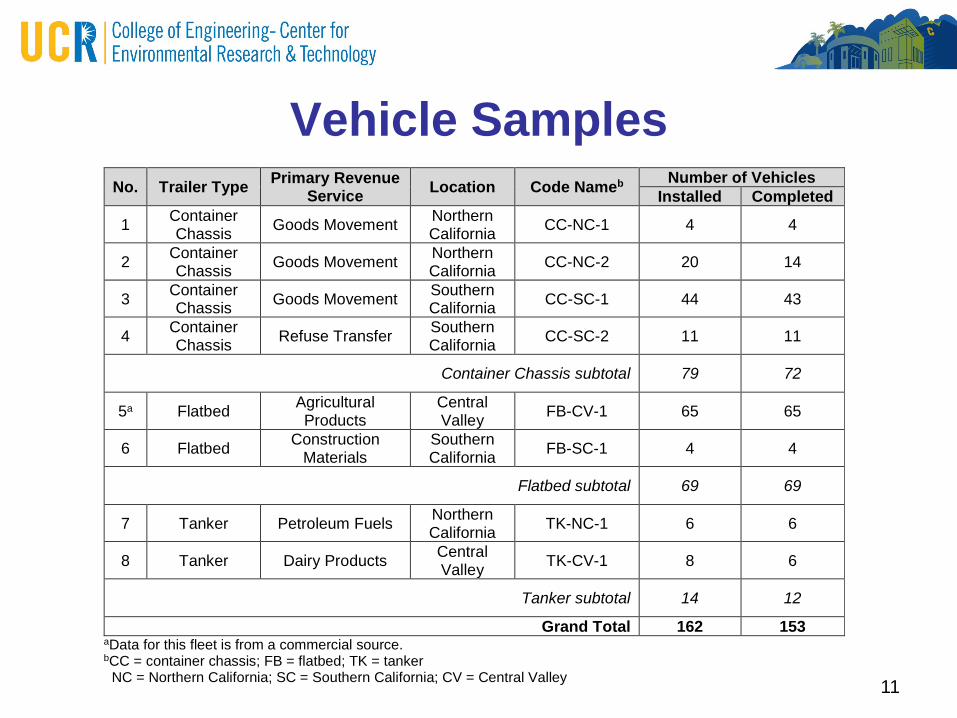
Vehicle Samples
11
No. Trailer Type Primary Revenue Service Location Code Nameb Number of Vehicles
Installed Completed
1 Container Chassis Goods Movement Northern
California CC-NC-1 4 4
2 Container Chassis Goods Movement Northern
California CC-NC-2 20 14
3 Container Chassis Goods Movement Southern
California CC-SC-1 44 43
4 Container Chassis Refuse Transfer Southern
California CC-SC-2 11 11
Container Chassis subtotal 79 72
5a Flatbed Agricultural Products
Central Valley FB-CV-1 65 65
6 Flatbed Construction Materials
Southern California FB-SC-1 4 4
Flatbed subtotal 69 69
7 Tanker Petroleum Fuels Northern California TK-NC-1 6 6
8 Tanker Dairy Products Central Valley TK-CV-1 8 6
Tanker subtotal 14 12
Grand Total 162 153 aData for this fleet is from a commercial source. bCC = container chassis; FB = flatbed; TK = tanker NC = Northern California; SC = Southern California; CV = Central Valley
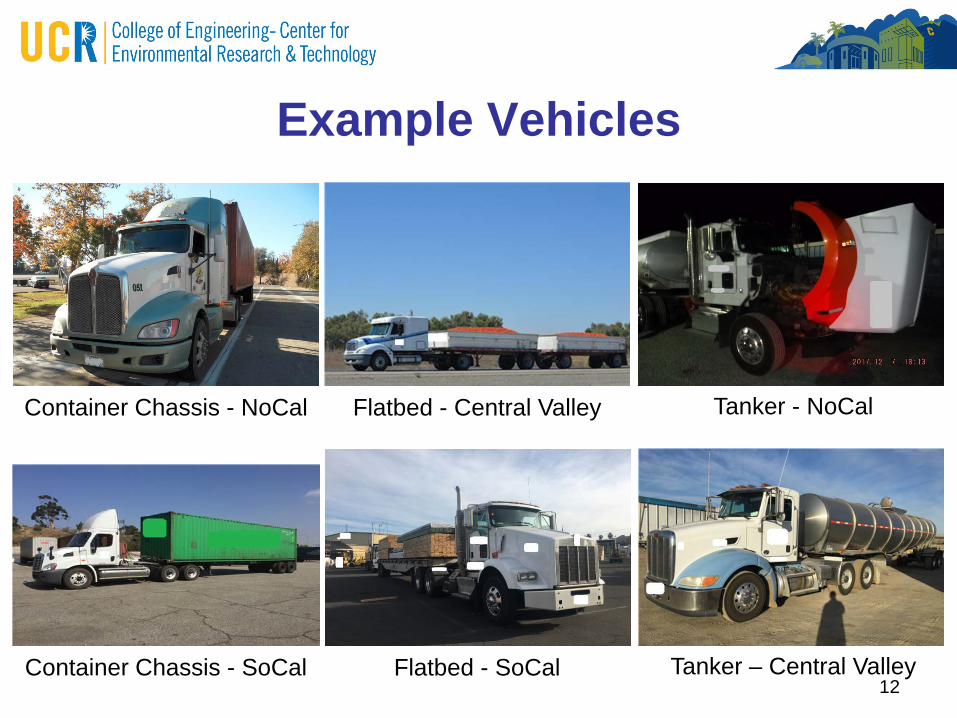
Example Vehicles
12
Container Chassis - NoCal Tanker - NoCalFlatbed - Central Valley
Container Chassis - SoCal Tanker – Central ValleyFlatbed - SoCal
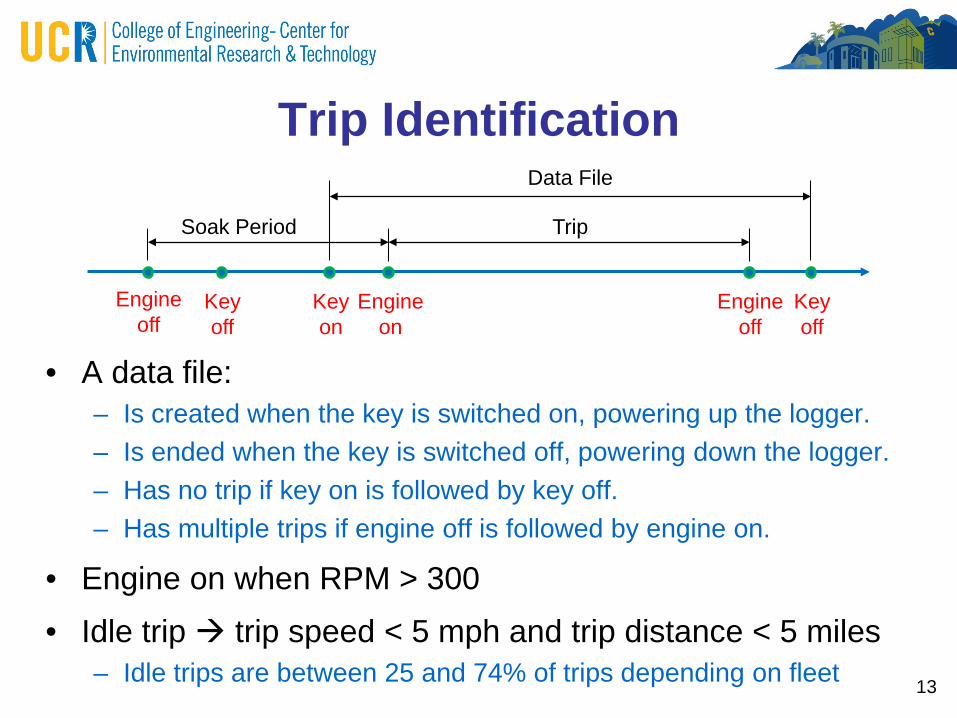
Trip Identification
• A data file:– Is created when the key is switched on, powering up the logger.– Is ended when the key is switched off, powering down the logger.– Has no trip if key on is followed by key off.– Has multiple trips if engine off is followed by engine on.
• Engine on when RPM > 300• Idle trip trip speed < 5 mph and trip distance < 5 miles
– Idle trips are between 25 and 74% of trips depending on fleet 13
Engine off
Key off
Keyon
Engine on
Engine off
Keyoff
Data File
TripSoak Period
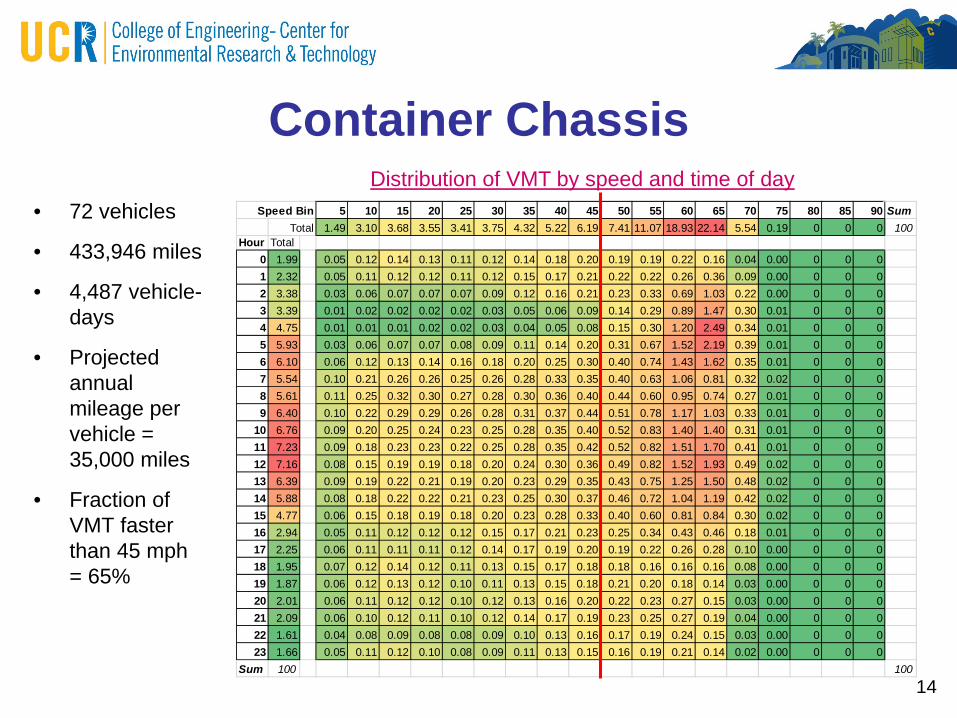
Container Chassis• 72 vehicles
• 433,946 miles
• 4,487 vehicle-days
• Projected annual mileage per vehicle = 35,000 miles
• Fraction of VMT faster than 45 mph = 65%
14
Speed Bin 5 10 15 20 25 30 35 40 45 50 55 60 65 70 75 80 85 90 SumTotal 1.49 3.10 3.68 3.55 3.41 3.75 4.32 5.22 6.19 7.41 11.07 18.93 22.14 5.54 0.19 0 0 0 100
Hour Total0 1.99 0.05 0.12 0.14 0.13 0.11 0.12 0.14 0.18 0.20 0.19 0.19 0.22 0.16 0.04 0.00 0 0 01 2.32 0.05 0.11 0.12 0.12 0.11 0.12 0.15 0.17 0.21 0.22 0.22 0.26 0.36 0.09 0.00 0 0 02 3.38 0.03 0.06 0.07 0.07 0.07 0.09 0.12 0.16 0.21 0.23 0.33 0.69 1.03 0.22 0.00 0 0 03 3.39 0.01 0.02 0.02 0.02 0.02 0.03 0.05 0.06 0.09 0.14 0.29 0.89 1.47 0.30 0.01 0 0 04 4.75 0.01 0.01 0.01 0.02 0.02 0.03 0.04 0.05 0.08 0.15 0.30 1.20 2.49 0.34 0.01 0 0 05 5.93 0.03 0.06 0.07 0.07 0.08 0.09 0.11 0.14 0.20 0.31 0.67 1.52 2.19 0.39 0.01 0 0 06 6.10 0.06 0.12 0.13 0.14 0.16 0.18 0.20 0.25 0.30 0.40 0.74 1.43 1.62 0.35 0.01 0 0 07 5.54 0.10 0.21 0.26 0.26 0.25 0.26 0.28 0.33 0.35 0.40 0.63 1.06 0.81 0.32 0.02 0 0 08 5.61 0.11 0.25 0.32 0.30 0.27 0.28 0.30 0.36 0.40 0.44 0.60 0.95 0.74 0.27 0.01 0 0 09 6.40 0.10 0.22 0.29 0.29 0.26 0.28 0.31 0.37 0.44 0.51 0.78 1.17 1.03 0.33 0.01 0 0 0
10 6.76 0.09 0.20 0.25 0.24 0.23 0.25 0.28 0.35 0.40 0.52 0.83 1.40 1.40 0.31 0.01 0 0 011 7.23 0.09 0.18 0.23 0.23 0.22 0.25 0.28 0.35 0.42 0.52 0.82 1.51 1.70 0.41 0.01 0 0 012 7.16 0.08 0.15 0.19 0.19 0.18 0.20 0.24 0.30 0.36 0.49 0.82 1.52 1.93 0.49 0.02 0 0 013 6.39 0.09 0.19 0.22 0.21 0.19 0.20 0.23 0.29 0.35 0.43 0.75 1.25 1.50 0.48 0.02 0 0 014 5.88 0.08 0.18 0.22 0.22 0.21 0.23 0.25 0.30 0.37 0.46 0.72 1.04 1.19 0.42 0.02 0 0 015 4.77 0.06 0.15 0.18 0.19 0.18 0.20 0.23 0.28 0.33 0.40 0.60 0.81 0.84 0.30 0.02 0 0 016 2.94 0.05 0.11 0.12 0.12 0.12 0.15 0.17 0.21 0.23 0.25 0.34 0.43 0.46 0.18 0.01 0 0 017 2.25 0.06 0.11 0.11 0.11 0.12 0.14 0.17 0.19 0.20 0.19 0.22 0.26 0.28 0.10 0.00 0 0 018 1.95 0.07 0.12 0.14 0.12 0.11 0.13 0.15 0.17 0.18 0.18 0.16 0.16 0.16 0.08 0.00 0 0 019 1.87 0.06 0.12 0.13 0.12 0.10 0.11 0.13 0.15 0.18 0.21 0.20 0.18 0.14 0.03 0.00 0 0 020 2.01 0.06 0.11 0.12 0.12 0.10 0.12 0.13 0.16 0.20 0.22 0.23 0.27 0.15 0.03 0.00 0 0 021 2.09 0.06 0.10 0.12 0.11 0.10 0.12 0.14 0.17 0.19 0.23 0.25 0.27 0.19 0.04 0.00 0 0 022 1.61 0.04 0.08 0.09 0.08 0.08 0.09 0.10 0.13 0.16 0.17 0.19 0.24 0.15 0.03 0.00 0 0 023 1.66 0.05 0.11 0.12 0.10 0.08 0.09 0.11 0.13 0.15 0.16 0.19 0.21 0.14 0.02 0.00 0 0 0
Sum 100 100
Distribution of VMT by speed and time of day
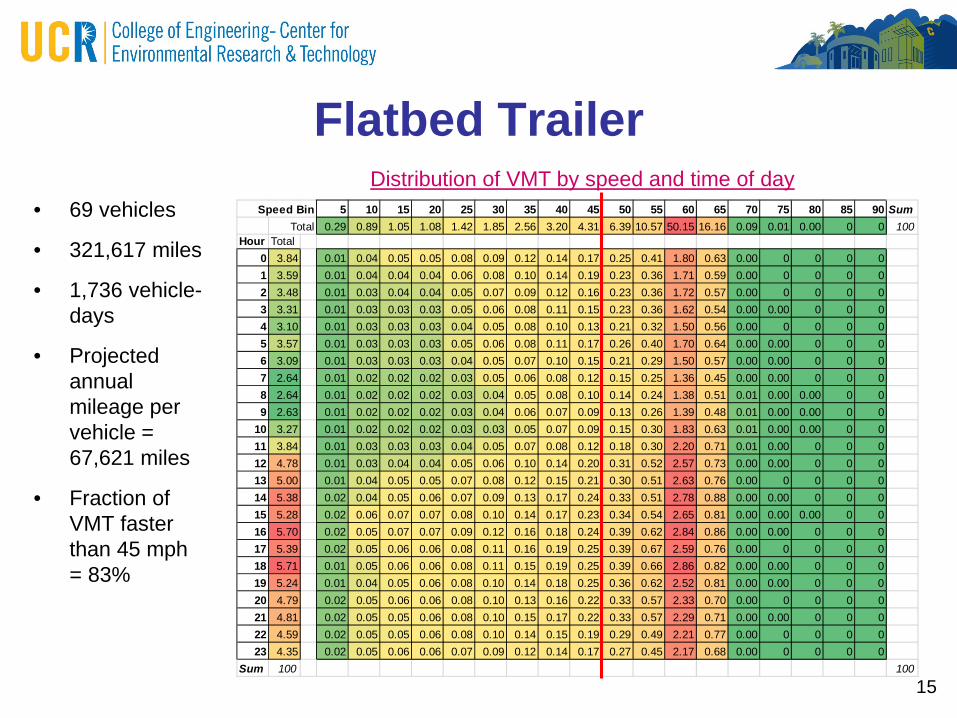
Flatbed Trailer• 69 vehicles
• 321,617 miles
• 1,736 vehicle-days
• Projected annual mileage per vehicle = 67,621 miles
• Fraction of VMT faster than 45 mph = 83%
15
Speed Bin 5 10 15 20 25 30 35 40 45 50 55 60 65 70 75 80 85 90 SumTotal 0.29 0.89 1.05 1.08 1.42 1.85 2.56 3.20 4.31 6.39 10.57 50.15 16.16 0.09 0.01 0.00 0 0 100
Hour Total0 3.84 0.01 0.04 0.05 0.05 0.08 0.09 0.12 0.14 0.17 0.25 0.41 1.80 0.63 0.00 0 0 0 01 3.59 0.01 0.04 0.04 0.04 0.06 0.08 0.10 0.14 0.19 0.23 0.36 1.71 0.59 0.00 0 0 0 02 3.48 0.01 0.03 0.04 0.04 0.05 0.07 0.09 0.12 0.16 0.23 0.36 1.72 0.57 0.00 0 0 0 03 3.31 0.01 0.03 0.03 0.03 0.05 0.06 0.08 0.11 0.15 0.23 0.36 1.62 0.54 0.00 0.00 0 0 04 3.10 0.01 0.03 0.03 0.03 0.04 0.05 0.08 0.10 0.13 0.21 0.32 1.50 0.56 0.00 0 0 0 05 3.57 0.01 0.03 0.03 0.03 0.05 0.06 0.08 0.11 0.17 0.26 0.40 1.70 0.64 0.00 0.00 0 0 06 3.09 0.01 0.03 0.03 0.03 0.04 0.05 0.07 0.10 0.15 0.21 0.29 1.50 0.57 0.00 0.00 0 0 07 2.64 0.01 0.02 0.02 0.02 0.03 0.05 0.06 0.08 0.12 0.15 0.25 1.36 0.45 0.00 0.00 0 0 08 2.64 0.01 0.02 0.02 0.02 0.03 0.04 0.05 0.08 0.10 0.14 0.24 1.38 0.51 0.01 0.00 0.00 0 09 2.63 0.01 0.02 0.02 0.02 0.03 0.04 0.06 0.07 0.09 0.13 0.26 1.39 0.48 0.01 0.00 0.00 0 0
10 3.27 0.01 0.02 0.02 0.02 0.03 0.03 0.05 0.07 0.09 0.15 0.30 1.83 0.63 0.01 0.00 0.00 0 011 3.84 0.01 0.03 0.03 0.03 0.04 0.05 0.07 0.08 0.12 0.18 0.30 2.20 0.71 0.01 0.00 0 0 012 4.78 0.01 0.03 0.04 0.04 0.05 0.06 0.10 0.14 0.20 0.31 0.52 2.57 0.73 0.00 0.00 0 0 013 5.00 0.01 0.04 0.05 0.05 0.07 0.08 0.12 0.15 0.21 0.30 0.51 2.63 0.76 0.00 0 0 0 014 5.38 0.02 0.04 0.05 0.06 0.07 0.09 0.13 0.17 0.24 0.33 0.51 2.78 0.88 0.00 0.00 0 0 015 5.28 0.02 0.06 0.07 0.07 0.08 0.10 0.14 0.17 0.23 0.34 0.54 2.65 0.81 0.00 0.00 0.00 0 016 5.70 0.02 0.05 0.07 0.07 0.09 0.12 0.16 0.18 0.24 0.39 0.62 2.84 0.86 0.00 0.00 0 0 017 5.39 0.02 0.05 0.06 0.06 0.08 0.11 0.16 0.19 0.25 0.39 0.67 2.59 0.76 0.00 0 0 0 018 5.71 0.01 0.05 0.06 0.06 0.08 0.11 0.15 0.19 0.25 0.39 0.66 2.86 0.82 0.00 0.00 0 0 019 5.24 0.01 0.04 0.05 0.06 0.08 0.10 0.14 0.18 0.25 0.36 0.62 2.52 0.81 0.00 0.00 0 0 020 4.79 0.02 0.05 0.06 0.06 0.08 0.10 0.13 0.16 0.22 0.33 0.57 2.33 0.70 0.00 0 0 0 021 4.81 0.02 0.05 0.05 0.06 0.08 0.10 0.15 0.17 0.22 0.33 0.57 2.29 0.71 0.00 0.00 0 0 022 4.59 0.02 0.05 0.05 0.06 0.08 0.10 0.14 0.15 0.19 0.29 0.49 2.21 0.77 0.00 0 0 0 023 4.35 0.02 0.05 0.06 0.06 0.07 0.09 0.12 0.14 0.17 0.27 0.45 2.17 0.68 0.00 0 0 0 0
Sum 100 100
Distribution of VMT by speed and time of day
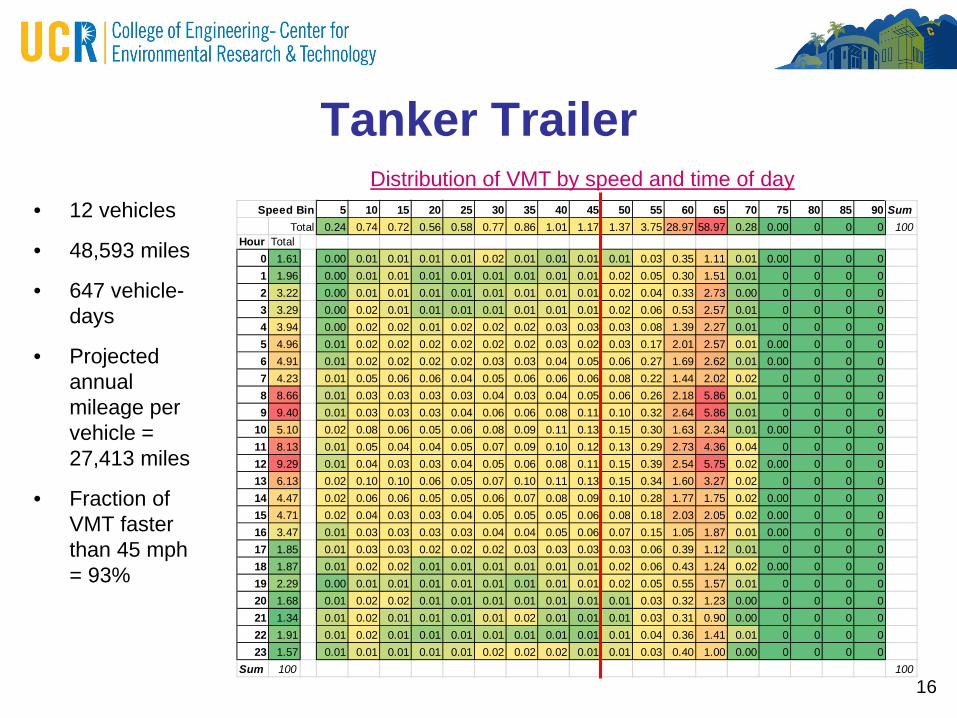
Tanker Trailer• 12 vehicles
• 48,593 miles
• 647 vehicle-days
• Projected annual mileage per vehicle = 27,413 miles
• Fraction of VMT faster than 45 mph = 93%
16
Speed Bin 5 10 15 20 25 30 35 40 45 50 55 60 65 70 75 80 85 90 SumTotal 0.24 0.74 0.72 0.56 0.58 0.77 0.86 1.01 1.17 1.37 3.75 28.97 58.97 0.28 0.00 0 0 0 100
Hour Total0 1.61 0.00 0.01 0.01 0.01 0.01 0.02 0.01 0.01 0.01 0.01 0.03 0.35 1.11 0.01 0.00 0 0 01 1.96 0.00 0.01 0.01 0.01 0.01 0.01 0.01 0.01 0.01 0.02 0.05 0.30 1.51 0.01 0 0 0 02 3.22 0.00 0.01 0.01 0.01 0.01 0.01 0.01 0.01 0.01 0.02 0.04 0.33 2.73 0.00 0 0 0 03 3.29 0.00 0.02 0.01 0.01 0.01 0.01 0.01 0.01 0.01 0.02 0.06 0.53 2.57 0.01 0 0 0 04 3.94 0.00 0.02 0.02 0.01 0.02 0.02 0.02 0.03 0.03 0.03 0.08 1.39 2.27 0.01 0 0 0 05 4.96 0.01 0.02 0.02 0.02 0.02 0.02 0.02 0.03 0.02 0.03 0.17 2.01 2.57 0.01 0.00 0 0 06 4.91 0.01 0.02 0.02 0.02 0.02 0.03 0.03 0.04 0.05 0.06 0.27 1.69 2.62 0.01 0.00 0 0 07 4.23 0.01 0.05 0.06 0.06 0.04 0.05 0.06 0.06 0.06 0.08 0.22 1.44 2.02 0.02 0 0 0 08 8.66 0.01 0.03 0.03 0.03 0.03 0.04 0.03 0.04 0.05 0.06 0.26 2.18 5.86 0.01 0 0 0 09 9.40 0.01 0.03 0.03 0.03 0.04 0.06 0.06 0.08 0.11 0.10 0.32 2.64 5.86 0.01 0 0 0 0
10 5.10 0.02 0.08 0.06 0.05 0.06 0.08 0.09 0.11 0.13 0.15 0.30 1.63 2.34 0.01 0.00 0 0 011 8.13 0.01 0.05 0.04 0.04 0.05 0.07 0.09 0.10 0.12 0.13 0.29 2.73 4.36 0.04 0 0 0 012 9.29 0.01 0.04 0.03 0.03 0.04 0.05 0.06 0.08 0.11 0.15 0.39 2.54 5.75 0.02 0.00 0 0 013 6.13 0.02 0.10 0.10 0.06 0.05 0.07 0.10 0.11 0.13 0.15 0.34 1.60 3.27 0.02 0 0 0 014 4.47 0.02 0.06 0.06 0.05 0.05 0.06 0.07 0.08 0.09 0.10 0.28 1.77 1.75 0.02 0.00 0 0 015 4.71 0.02 0.04 0.03 0.03 0.04 0.05 0.05 0.05 0.06 0.08 0.18 2.03 2.05 0.02 0.00 0 0 016 3.47 0.01 0.03 0.03 0.03 0.03 0.04 0.04 0.05 0.06 0.07 0.15 1.05 1.87 0.01 0.00 0 0 017 1.85 0.01 0.03 0.03 0.02 0.02 0.02 0.03 0.03 0.03 0.03 0.06 0.39 1.12 0.01 0 0 0 018 1.87 0.01 0.02 0.02 0.01 0.01 0.01 0.01 0.01 0.01 0.02 0.06 0.43 1.24 0.02 0.00 0 0 019 2.29 0.00 0.01 0.01 0.01 0.01 0.01 0.01 0.01 0.01 0.02 0.05 0.55 1.57 0.01 0 0 0 020 1.68 0.01 0.02 0.02 0.01 0.01 0.01 0.01 0.01 0.01 0.01 0.03 0.32 1.23 0.00 0 0 0 021 1.34 0.01 0.02 0.01 0.01 0.01 0.01 0.02 0.01 0.01 0.01 0.03 0.31 0.90 0.00 0 0 0 022 1.91 0.01 0.02 0.01 0.01 0.01 0.01 0.01 0.01 0.01 0.01 0.04 0.36 1.41 0.01 0 0 0 023 1.57 0.01 0.01 0.01 0.01 0.01 0.02 0.02 0.02 0.01 0.01 0.03 0.40 1.00 0.00 0 0 0 0
Sum 100 100
Distribution of VMT by speed and time of day
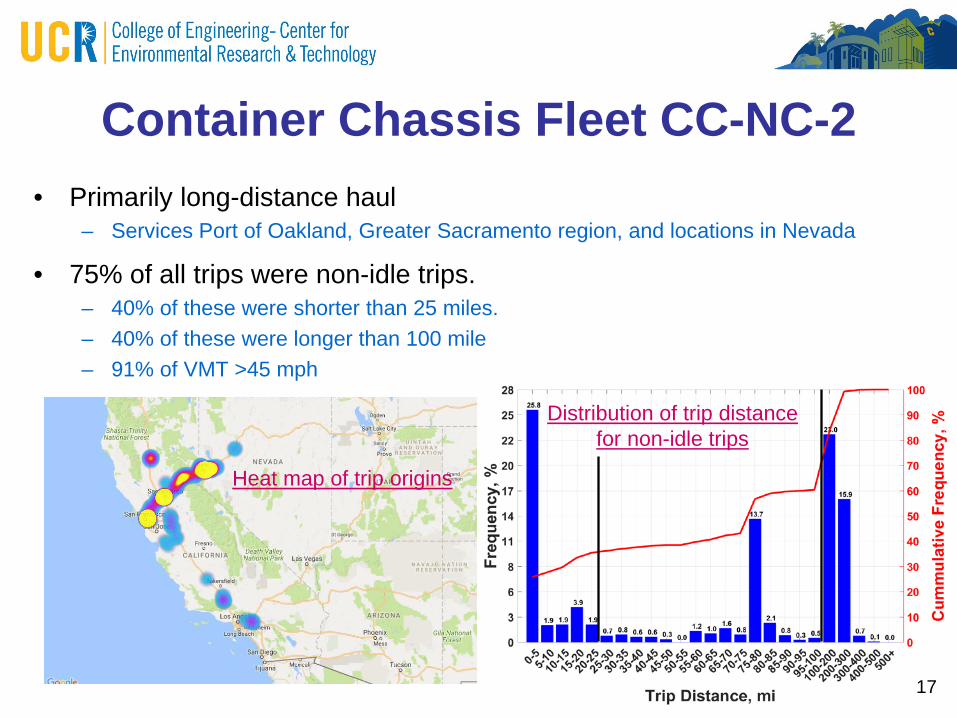
Container Chassis Fleet CC-NC-2• Primarily long-distance haul
– Services Port of Oakland, Greater Sacramento region, and locations in Nevada
• 75% of all trips were non-idle trips.– 40% of these were shorter than 25 miles.– 40% of these were longer than 100 mile– 91% of VMT >45 mph
17
Heat map of trip origins
Distribution of trip distance for non-idle trips
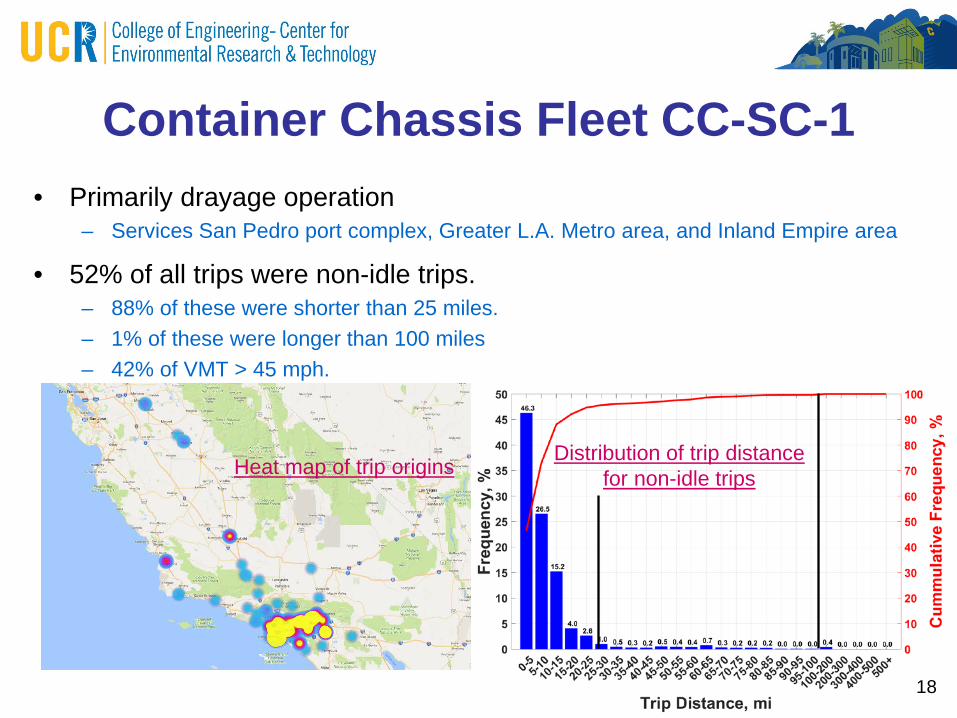
Container Chassis Fleet CC-SC-1• Primarily drayage operation
– Services San Pedro port complex, Greater L.A. Metro area, and Inland Empire area
• 52% of all trips were non-idle trips.– 88% of these were shorter than 25 miles.– 1% of these were longer than 100 miles– 42% of VMT > 45 mph.
18
Heat map of trip origins Distribution of trip distance for non-idle trips
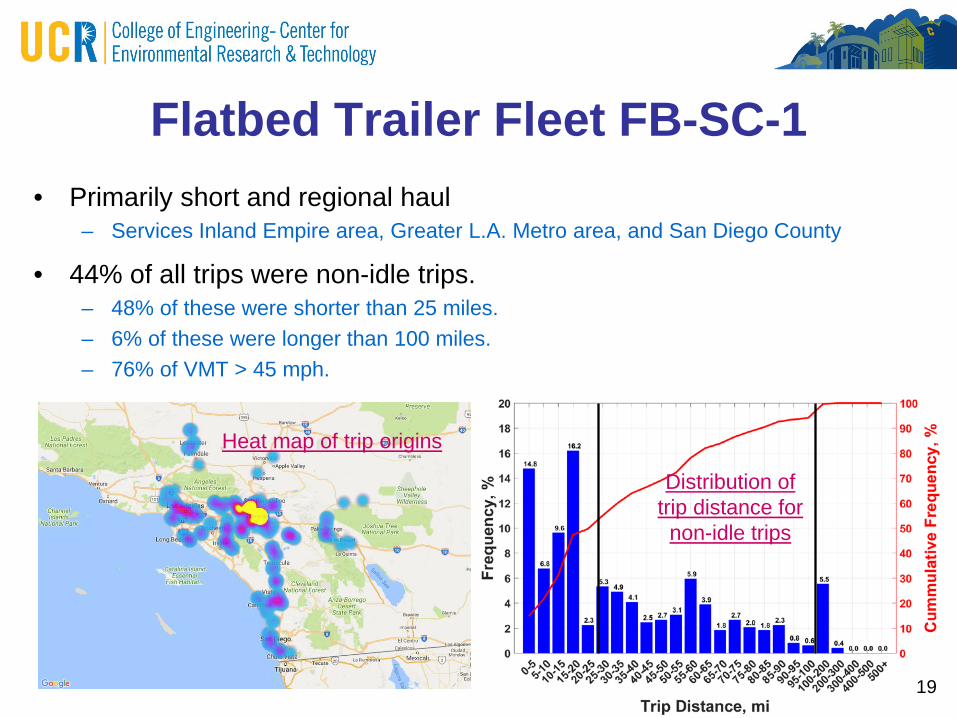
Flatbed Trailer Fleet FB-SC-1• Primarily short and regional haul
– Services Inland Empire area, Greater L.A. Metro area, and San Diego County
• 44% of all trips were non-idle trips.– 48% of these were shorter than 25 miles.– 6% of these were longer than 100 miles.– 76% of VMT > 45 mph.
19
Heat map of trip origins
Distribution of trip distance for
non-idle trips
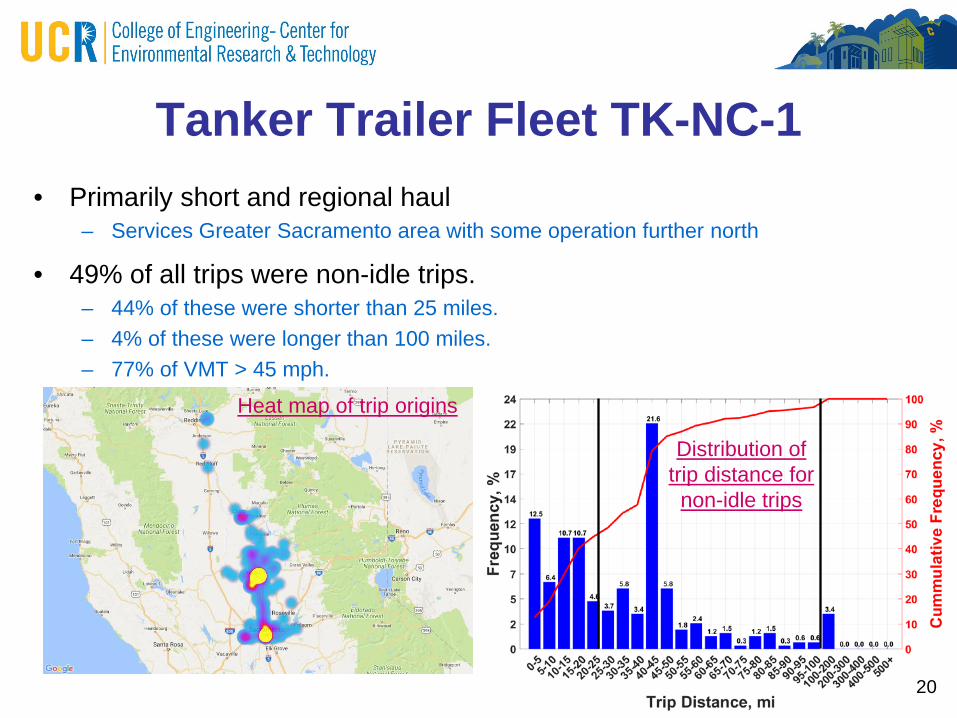
Tanker Trailer Fleet TK-NC-1• Primarily short and regional haul
– Services Greater Sacramento area with some operation further north
• 49% of all trips were non-idle trips.– 44% of these were shorter than 25 miles.– 4% of these were longer than 100 miles.– 77% of VMT > 45 mph.
20
Heat map of trip origins
Distribution of trip distance for
non-idle trips
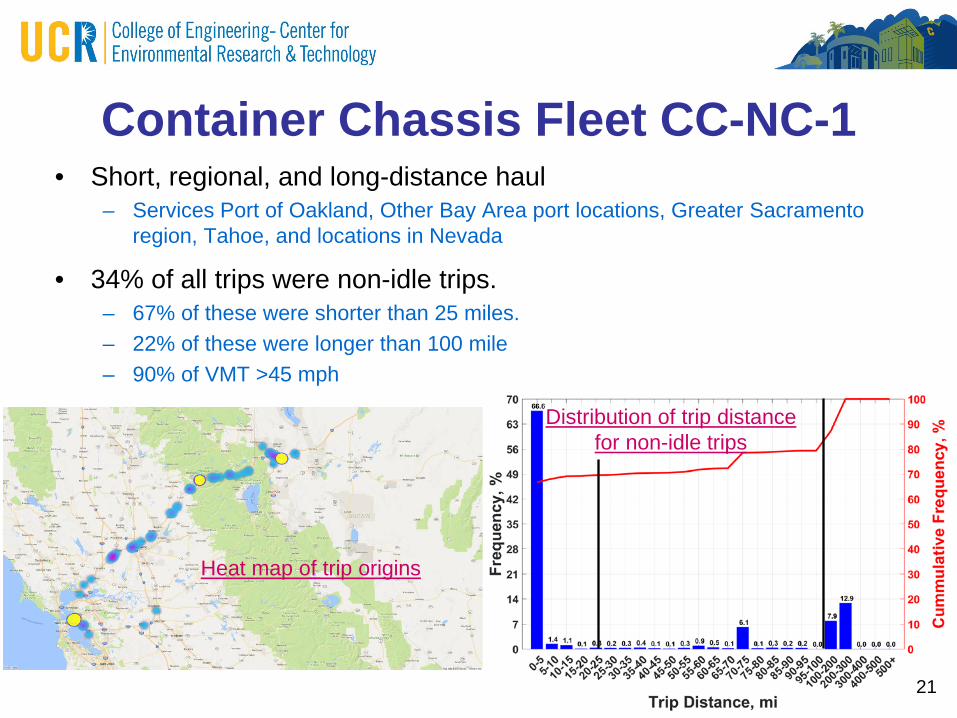
Container Chassis Fleet CC-NC-1• Short, regional, and long-distance haul
– Services Port of Oakland, Other Bay Area port locations, Greater Sacramento region, Tahoe, and locations in Nevada
• 34% of all trips were non-idle trips.– 67% of these were shorter than 25 miles.– 22% of these were longer than 100 mile– 90% of VMT >45 mph
21
Heat map of trip origins
Distribution of trip distance for non-idle trips
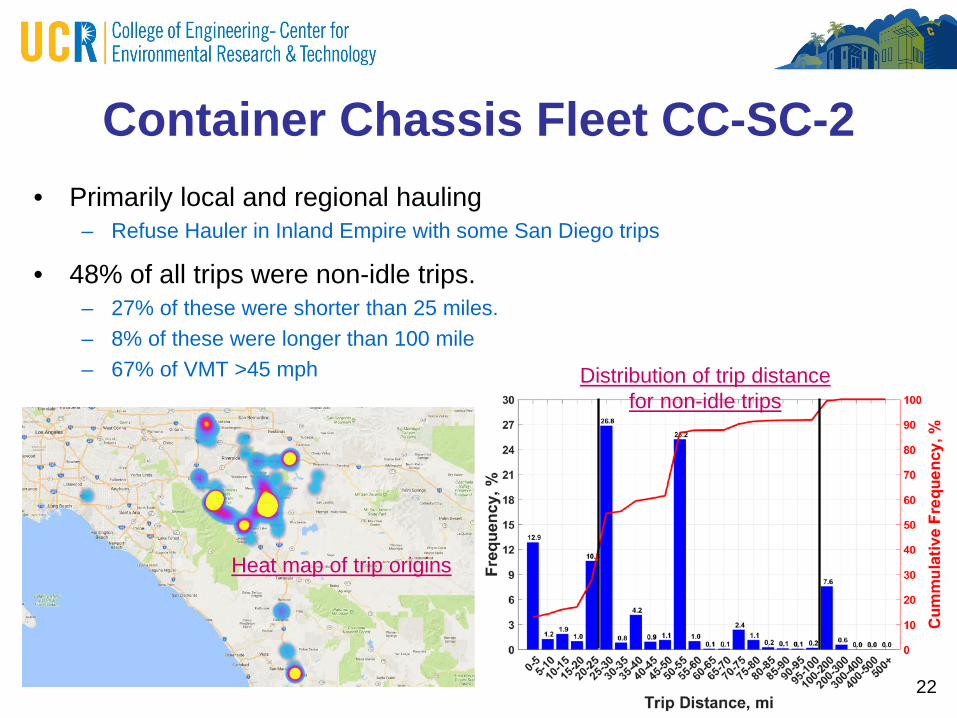
Container Chassis Fleet CC-SC-2• Primarily local and regional hauling
– Refuse Hauler in Inland Empire with some San Diego trips
• 48% of all trips were non-idle trips.– 27% of these were shorter than 25 miles.– 8% of these were longer than 100 mile– 67% of VMT >45 mph
22
Heat map of trip origins
Distribution of trip distance for non-idle trips
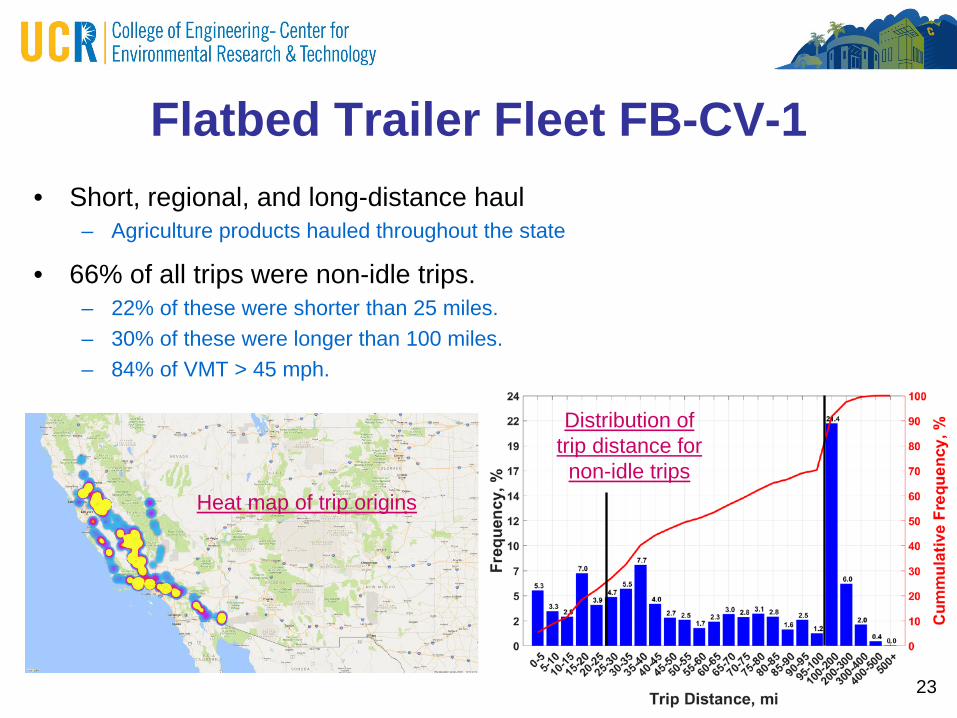
Flatbed Trailer Fleet FB-CV-1• Short, regional, and long-distance haul
– Agriculture products hauled throughout the state
• 66% of all trips were non-idle trips.– 22% of these were shorter than 25 miles.– 30% of these were longer than 100 miles.– 84% of VMT > 45 mph.
23
Heat map of trip origins
Distribution of trip distance for
non-idle trips
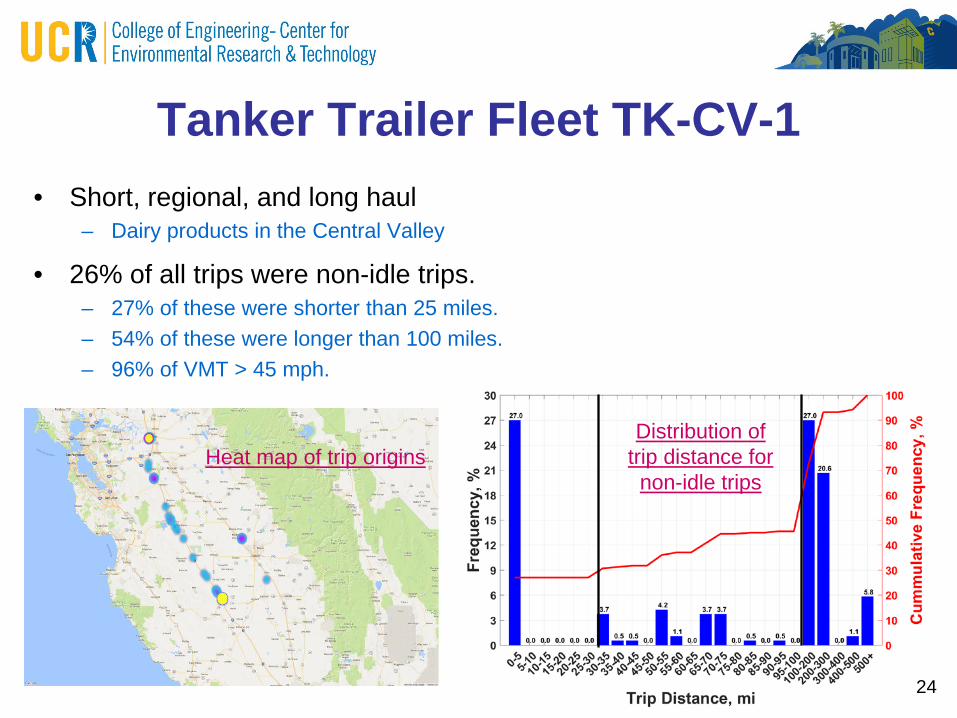
Tanker Trailer Fleet TK-CV-1• Short, regional, and long haul
– Dairy products in the Central Valley
• 26% of all trips were non-idle trips.– 27% of these were shorter than 25 miles.– 54% of these were longer than 100 miles.– 96% of VMT > 45 mph.
24
Heat map of trip originsDistribution of
trip distance for non-idle trips
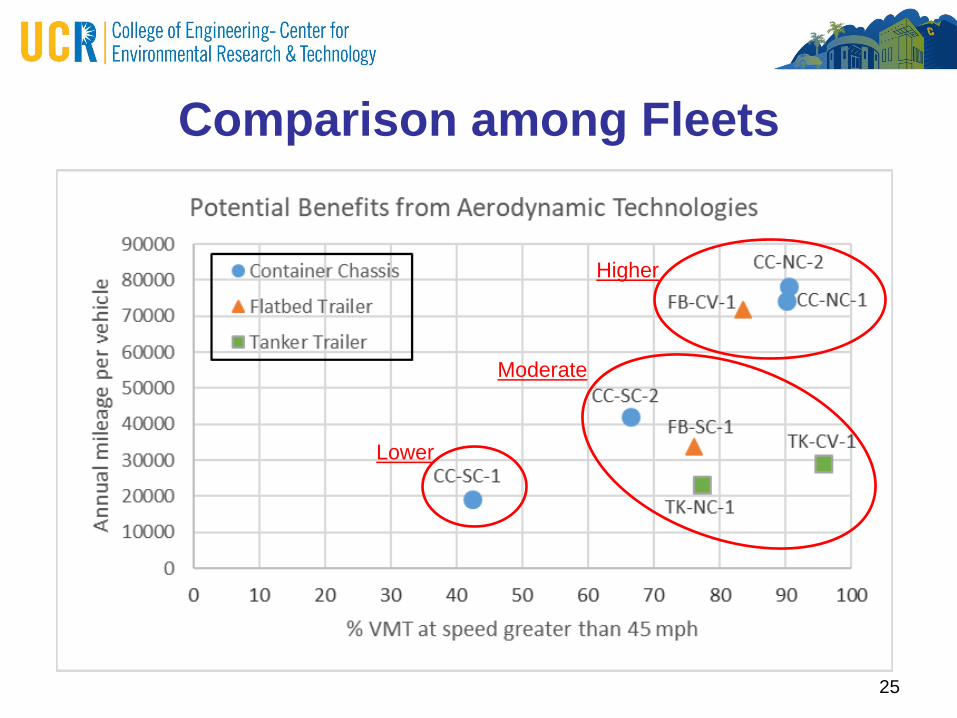
Comparison among Fleets
25
Higher
Moderate
Lower
Concluding Remarks• Vehicle activity of 153 tractor-trailers data logged in this
study varies.– By trailer type and also by fleet within the same trailer type
• For the 8 fleets included in this study:– Projected annual mileage per vehicle ranges from 19k to 78k.– Fraction of VMT faster than 45 mph ranges from 42% to 96%.– Most fleets had ≥66% of VMT >45 mph
• Results indicate that:– On average, most fleets would potentially gain significant benefits
from aerodynamic technologies on their trailers.– Expansion of the Tractor-Trailer GHG regulation may include
exemption for fleets or tractor-trailers with low annual mileage traveling mostly at speeds lower than 45 mph.
26
Acknowledgements• Funding from the California Air Resources Board
– Under contract 14-302
• U.S. Environmental Protection Agency– Funding under EPA CRADA– Carl Fulper
• Eastern Research Group– Sandeep Kishan, Michael Sabisch, and Doug Jackson
• Participating fleets
27