Embed Size (px)
Citation preview
8/13/2019 Reality of Trade - The WTO and Developing Countries
http://slidepdf.com/reader/full/reality-of-trade-the-wto-and-developing-countries 1/106
The Reality of Trade:
The WTO and Developing Countries
8/13/2019 Reality of Trade - The WTO and Developing Countries
http://slidepdf.com/reader/full/reality-of-trade-the-wto-and-developing-countries 2/106
The North-South Institute
The North-South Institute is a charitable corporation established in 1976 to provide professional, policy-relevant research on relations between industrialized and developing countries. The results of thisresearch are made available to policy-makers, interested groups, and the general public to help generategreater understanding and informed discussion of development questions. The Institute is independentand cooperates with a wide range of Canadian and international organizations working in relatedactivities.
The contents of this study represent the views and the findings of the author alone and not necessarilythose of The North-South Institute’s directors, sponsors, or supporters or those consulted during its
preparation.
8/13/2019 Reality of Trade - The WTO and Developing Countries
http://slidepdf.com/reader/full/reality-of-trade-the-wto-and-developing-countries 3/106
8/13/2019 Reality of Trade - The WTO and Developing Countries
http://slidepdf.com/reader/full/reality-of-trade-the-wto-and-developing-countries 4/106
Part III: Southern Perspectives on the WTO
Chapter 6: Technical Assistance as a Political Instrument 62
Rationale for Building the Developing Countries’ Capacity 62
The Evolution of Capacity Building: From WTO’s Compliance Focus toThird World Collective Self-Reliance 63
Limitations of Technical Assistance 65Building Negotiating Capacity and Moving Toward Alternative Modes of
Capacity Building and Developing Country Self-Reliance 65Why Donor-Driven Technical Assistance Tends to Under-Perform 70Conclusions and Recommendations 71
Chapter 7: Implementation of the WTO Agreement on Agriculture in India 75
WTO Agreement on Agriculture 75
WTO Agreements Related to Agriculture 77Indian Agricultural Trade: A Brief Overview 77India’s Obligations under AoA and Implementation Status 78
Impact of AoA and Trade Liberalization on India 81Future Strategy 81
Chapter 8: Implementation of WTO Agreements in Southern Africa 85
SADC Region 85Implementing Uruguay Round Commitments 86Obstacles to Effective Participation 88
Part IV: Conclusions
Chapter 9: The Doha Round: What Role for Bilateral Development Agencies? 91
Prospects for Improved Market Access in the New Round 91Trade Policy-making: What Role for Bilateral Donors? 94
Chapter 10: Lessons for the Doha Round 98
Contributors 100
8/13/2019 Reality of Trade - The WTO and Developing Countries
http://slidepdf.com/reader/full/reality-of-trade-the-wto-and-developing-countries 5/106
Part I: The Great North-South Bargain?
The Uruguay Round and Developing Countries

8/13/2019 Reality of Trade - The WTO and Developing Countries
http://slidepdf.com/reader/full/reality-of-trade-the-wto-and-developing-countries 6/106
8/13/2019 Reality of Trade - The WTO and Developing Countries
http://slidepdf.com/reader/full/reality-of-trade-the-wto-and-developing-countries 7/106
The Reality of Trade: The WTO and Developing Countries 1
Introduction
Chantal Blouin*
The 146 member countries of the World Trade Organization (WTO) are currently engaged in a round oftrade negotiations. This new round is meant to focus on the needs of developing countries. Indeed, at thelast meeting of trade ministers in Qatar in 2001, WTO members agreed to a development agenda, inresponse to the growing sense among many developing countries that the organization and its agreementswere not supportive of their economic and human development. This book addresses one of the sources ofthis “discontent”: the agreements negotiated at the last round of trade talks, the Uruguay Round (UR)agreements.
The Uruguay Round was supposed to be a great “North-South bargain” (Ostry 2000). Industrial countrieswere to decrease their barriers to exports from the South, especially in the most important sectors (i.e., in
textiles and clothing and in agriculture). In exchange for better market access, developing countries wouldagree to several new trade agreements which would mainly benefit industrial countries. The mostimportant ones are the agreements on intellectual property and on services.
However, there have been increasing signs of the asymmetrical value of the North-South bargain. On onehand, it appears that the costs of implementing agreements such as Trade-Related Aspects of IntellectualProperty Rights (TRIPS) are very high, even higher than expected. On the other hand, it is not clear thatthe promises of greater access to Northern markets have materialized yet for many developing countries.In agriculture, this was mostly expected, as the core of the Northern piece of the bargain was acommitment to further liberalization in new negotiations starting in 2000. Still, the Uruguay Roundincluded commitments from industrial countries to decrease agricultural subsidies; but in the UnitedStates and the European Union, such subsidies have actually increased. In textiles, developing countries
have complained of implementation tactics used to delay the opening of markets.
In order to document the value of this exchange of concessions and the trends in North-South trade, we brought together a group of researchers from the South and the North. The authors come from various backgrounds: academia, non-governmental research organizations or think tanks, and governments. Theyoffer a diversity of perspectives. Given the wide range of issues now part of the WTO’s domain, theauthors were asked to focus on one specific aspect of the new regime or its impact on one region/country.
The Uruguay Round was the first of its kind in terms of developing country participation. Indeed, inearlier multilateral trade negotiations, developing countries were allowed to pick and choose whichagreements they would sign. Developing countries were generally not very active in what was then calledthe General Agreements on Tariffs and Trade (GATT). With the Uruguay Round, in the so-called single
undertaking, all members had to be signatories to all the agreements. In a way, developing countries became full-fledged members of the organization. For the actors involved in the current round ofmultilateral trade negotiations, there are many lessons to be learned from the earlier experiences, toensure that the trade arrangements that are being discussed contribute to development and povertyreduction.
8/13/2019 Reality of Trade - The WTO and Developing Countries
http://slidepdf.com/reader/full/reality-of-trade-the-wto-and-developing-countries 8/106
2 The North-South Institute
Overview
The first chapter by Pranav Kumar provides a succinct background paper on the WTO and an overview ofthe content of the Uruguay Round agreements. The author also reviews the recent institutional changescreated by the new agreements and highlights key problems in their implementation.
The second part of the book examines to what extent the promise of greater access made to developingcountries during the Uruguay Round has materialized. We scrutinize the trade policy of the four largestindustrial economies, the so-called “Quad.” Our objective is to highlight whether and how the UruguayRound has improved market access. Which trade barriers have been removed and which remain? Whatkind of preferential access do Canada, the European Union, Japan, and the United States offer todeveloping countries? These evaluations also include information about trade-related technical assistance.The Uruguay Round agreements frequently refer to the technical assistance industrial countries should
provide to developing countries to help with the implementation of the multiple WTO agreements. Howwell is the Quad doing on this commitment? In addition to providing detailed information on the regionaland sectoral composition of North-South trade, each chapter offers insights into the trade issues peculiarto that WTO member. Thus, the chapter on the European Union by Stephanie Pfahl highlights howenvironmental labeling can raise trade barriers for developing countries. The chapter on Japan by Horimi
Ohki and Shuichiro Nishioka discusses the issues of intellectual property protection in China, whereasagricultural subsidies receive extra attention in the chapter on the United States by Chantal Blouin. Thechapter on Canada discusses the impact of the principle of reciprocity in North-South trade arrangements.
In the third part of this book, Southern researchers examine the Uruguay Round agreements from the point of view of developing countries. Yash Tandon evaluates the trade-related technical assistance provided to developing countries to fill the “capacity gap” within the multilateral trading system. Heargues that this gap in trade policy capacity to negotiate and implement agreements is actually increasing,not decreasing. He underlines the limits of technical assistance and stresses that this is not a politicallyneutral activity: the policy preferences of industrial countries are embedded in the trade advice providedto developing countries.
The next two chapters focus on the domestic consequences of the implementation of the Uruguay Roundagreements. Pranav Kumar’s examination of the implementation of the WTO Agreement on Agriculturein India argues that trade liberalization did not have the expected negative effects in terms of a surge inand dumping of agricultural imports. The author also stresses the importance of domestic reforms and
public investment to improve the Indian agricultural sector. Multilateral trade agreements, albeitimportant, are only one piece of a very complex puzzle. The third chapter in this section looks at the
problems linked to the implementation of the Uruguay Round agreements in Southern Africa. KennedyMbekeani explains that these new obligations to implement reforms in standards, intellectual property, orcustoms require large investments from countries with very limited resources. He identifies the limitedcapacity to participate in WTO activities and negotiations as the main cause of this problem. The chapterconcludes with recommendations on how to ensure that Southern African countries are involved indesigning the rules of the trade regime.
What can we learn from the experience of the Uruguay Round for the new round? The book concludeswith an outline of the policy recommendations drawn from the contributors. This last section alsoincludes a chapter from Nizar Assanie on the role of development agencies in trade policy in general andin the Doha Round in particular. He suggests coalition building as a key function of developmentagencies working for a pro-development trade regime. Informed views and analytical discussions of trade
policy are critical as the WTO members enter a new round, because information is a key resource whennegotiators are at the table. To go beyond the “Development Round” rhetoric to concrete actions and
8/13/2019 Reality of Trade - The WTO and Developing Countries
http://slidepdf.com/reader/full/reality-of-trade-the-wto-and-developing-countries 9/106
The Reality of Trade: The WTO and Developing Countries 3
policy changes, the North and the South need to rethink the current trade arrangements. This book aims tomake a contribution to such rethinking.
* The editor would like to thank all the authors for their generous collaboration as well as Kristina MaudBergeron, Lois Ross and Ann Weston for their assistance in this project.
References
Ostry, S. “The Uruguay Round North-South Grand Bargain: Implications for Future Negotiations,” paper presented at conference The Political Economy of International Trade Law, University of Minnesota,September 2000.
8/13/2019 Reality of Trade - The WTO and Developing Countries
http://slidepdf.com/reader/full/reality-of-trade-the-wto-and-developing-countries 10/106
4 The North-South Institute
Chapter 1
Impact of the Uruguay Round on the Multilateral Trading System
Pranav Kumar
The Uruguay Round (Uruguay Round) of multilateral trade negotiations (1986-94) was an importantmilestone in over fifty years of GATT/WTO history. In the seven previous General Agreements onTariffs and Trade (GATT) rounds of trade negotiations, discussions were mainly focused on tariffreductions. Developing countries focused most of their attention on obtaining preferential access toindustrial country markets. Only a few developing countries participated actively in the core business ofthe negotiations — the exchange of market access concessions.
By contrast, many developing countries were very active participants in the Uruguay Round bothindividually and in coalitions with industrial countries. Not only did they participate in formulating new
rules for the world trading system, but they also made important market access offers in the conventionalarea of reducing tariff protection on manufactures trade and in new areas, such as trade in services andtrade in agricultural products.
The Uruguay Round trade negotiations, which went on for nearly 8 years, brought a sea change in themultilateral trading system. Its impact could be seen in the increase in participation and number of areascovered. While the early rounds of multilateral trade negotiations, up to the Dillon Round in 1961,typically involved some 20 to 30 countries, the Kennedy Round (1964-67) involved over 60 countries, theTokyo Round (1973-79) involved more than 100 countries, and the Uruguay Round (1986-94) had 125
participants. The WTO’s membership stands at 146 countries today, and this could potentially grow toover 160 in the next few years. With the accession of China as the 143
rd member, the WTO members now
account for more than 90% of world merchandise trade. Significant traders that are still outside the
multilateral trading system, but in the process of accession to the WTO, are the Russian Federation andSaudi Arabia.
This chapter tries to examine the overall impact of the Uruguay Round on the multilateral trading system.Section 1 briefly highlights the results of the Uruguay Round. Section 2 discusses its institutional impact.Institutional reforms were one of the major tasks of Uruguay Round. In Section 3, we analyze the impactin terms of actual growth in exports of world merchandise and commercial services over the last decade.How much have developing and poor countries been able to increase their share in world trade and todiversify their exports? In Section 4, the paper highlights some major market access impediments faced
by many developing and poor countries. How are developed and even some middle- income developingcountries manipulating the provisions of the WTO to their own advantage? Finally, Section 5 concludesthe paper with some policy implications.
8/13/2019 Reality of Trade - The WTO and Developing Countries
http://slidepdf.com/reader/full/reality-of-trade-the-wto-and-developing-countries 11/106
The Reality of Trade: The WTO and Developing Countries 5
Outcomes of the Uruguay Round
Unfinished business from the previous Tokyo Round was only a small part of the Uruguay Roundnegotiating agenda. Despite difficulties in launching the Uruguay Round, the negotiating agenda finallyadopted in 1986 was wide-ranging and ambitious. The round encompassed traditional tariff cutting, andtackled long-standing and intractable issues such as textiles and clothing and agriculture. It also
refurbished the dispute settlement system, instituted the trade policy review mechanism for examining thetrade policies of individual countries, transformed aspects of the institution and the GATT’s legal status,and took on the entirely new issues of trade in services and trade-related intellectual property rights.
In view of the extraordinary comprehensiveness of this agenda, it is not surprising that the UruguayRound proved nearly as difficult to close as it was to launch. In December 1993, some decisions wereadopted by the Trade Negotiations Committee. Even then, a few loose ends had to be tied up, andnegotiations in various areas, most notably services, continued. The Uruguay Round really ended in April1994, eight years after the negotiations had begun. The negotiations had proved challenging precisely
because governments were seeking far-reaching agreement in difficult areas. No government could agreeeasily to such a wide-ranging package, knowing that important commitments were at stake which wouldinvolve significant policy changes.
The Uruguay Round is a complex agreement that covers six broad areas:
1. Tariff reductions in manufactured products.2. The tariffication of non-tariff barriers in agriculture, as well as binding commitments to reduce
the level of agricultural protection.3. The elimination of voluntary export restraints (VERs) and of quotas in textiles and clothing.4. Institutional and rule changes, such as the creation of the WTO and safeguards, anti-dumping,
and countervailing duty measures.5. New areas such as Trade-Related Investment Measures (TRIMs), Trade-Related Aspects of
Intellectual Property Rights (TRIPS), and the General Agreement on Trade in Services (GATS).6. Areas receiving greater coverage than earlier, such as customs valuation.
In the field of tariffs, the Uruguay Round saw average cuts of 40% on industrial products. Prior to theUruguay Round, developing countries had on average only bound 21% of their tariff lines. This figurerose to 73% after the Uruguay Round. Developed countries and transition economies increased theirshares of bindings in total tariff lines from 78% and 73% to 99% and 98% respectively. Thesecommitments added significantly to security and predictability in world trade (WTO 1998).
After more than four decades of futile efforts to bring trade liberalization to the agricultural sector, theUruguay Round finally put in place a comprehensive program of reform, encompassing liberalizationcommitments with respect to tariffs, domestic supports, and export subsidies. All quantitative restrictionsand other non-tariff measures used against imports were replaced by tariffs. In textiles, following years ofspecial arrangements entailing discriminatory restrictions maintained by most developed countries against
developing country exports, an agreement was reached to phase out these arrangements. Under theAgreement on Textiles and Clothing (ATC), country-specific quotas are to be phased out in three phasesover a period of ten years, ending in 2005.
A new safeguards agreement was established in the Uruguay Round — an achievement that had eludednegotiators for many years. This new agreement instituted strengthened procedures and publicaccountability, combined with greater flexibility to allow governments to take the necessary temporarymeasures to deal with pressing adjustment problems. Its adoption entailed the elimination of “grey area”measures, such as voluntary export restrictions. Provisions relating to trade remedy measures such as anti-
8/13/2019 Reality of Trade - The WTO and Developing Countries
http://slidepdf.com/reader/full/reality-of-trade-the-wto-and-developing-countries 12/106
8/13/2019 Reality of Trade - The WTO and Developing Countries
http://slidepdf.com/reader/full/reality-of-trade-the-wto-and-developing-countries 13/106
The Reality of Trade: The WTO and Developing Countries 7
Trade Policy Review Mechanism
The first major result of Uruguay Round negotiations was the decision to establish a trade policy reviewmechanism. Participants agreed to start the reviews at the December 1988 ministerial meeting that wasintended to be the mid-way assessment of the Uruguay Round. Initially, these reviews took place underthe GATT, and like the GATT, they focused on trade in goods only. With the creation of the WTO in
1995, their scope was extended, like the WTO, to include services and intellectual property. The objectivewas to increase the transparency and understanding of countries’ trade policies and practices, throughregular monitoring, as well as to improve the quality of public and intergovernmental debate on the issuesand to enable a multilateral assessment of the effects of policies on the world trading system. While thereviews focus on a member’s own trade policies and practices, they also take into account countries’wider economic and developmental needs, their policies and objectives, and the external economicenvironment.
Di spute Settl ement System
No review of the institutional achievements of the Uruguay Round would be complete without mention ofthe dispute settlement system. The dispute settlement procedures of the WTO are substantially stronger
than those of the GATT. A procedure for settling disputes existed under the GATT too, but it had no fixedtimetables, and rulings were easily blocked. Many cases dragged on over several months inconclusively.The Uruguay Round agreement introduced a more structured process with more clearly defined stages inthe procedure. It introduced greater discipline for the length of time a case should take to be settled, withflexible deadlines set in various stages of the procedure, all on the understanding that prompt settlementwas essential if the WTO was to function effectively. The Uruguay Round agreement also made itimpossible for countries losing a case to block the adoption of a ruling, a complete reversal from the
previous GATT provisions for settling disputes. Under the previous GATT procedure, rulings could only be adopted by consensus, meaning that a single objection could block the ruling. Now, a ruling isautomatically adopted unless there is a consensus to reject it.
The new WTO system is stronger, more automatic , and more credible than its GATT predecessor. This is
reflected in the diversity of countries now using it. In 2000, the number of complaints filed under theWTO’s Dispute Settlement Understanding (DSU) since the start of the WTO had reached 200 (WTO2001a). This indicates a continued heavy use of the dispute settlement procedures by WTO members. Incontrast, only some 300 cases were brought before the GATT during its entire life span.
Technical Cooperation
Technical assistance to developing countries, least developed countries (LDCs) and countries in transitionfrom centrally-planned economies is an integral part of WTO work. The objective is to help build thenecessary institutions and to train officials. It aims to improve the understanding of the agreements andfacilitate implementation of obligations. At the same time, emphasis is increasingly being placed onenhancing the capacity of countries to integrate into the world economy in order to realize the benefits of
the market access opportunities that are available to them as a result of being WTO members.
Despite their vital nature, technical assistance and cooperation activities in 1999 and 2000 have beensustained only by the generous extra-budgetary voluntary donations of certain WTO members, given thatthe regular budget for such activities has remained inadequate to respond to needs, funding just 10% ofactivities in 1999 (WTO 2001a). Increased funding for technical assistance in the core budget of the WTOwould create a more permanent basis for such activities. In the fourth Ministerial Conference at Doha,members agreed that there is a need for technical assistance to receive secure and predictable funding.Pursuant to this, in December 2001 the WTO’s Committee on Budget, Finance and Administration agreed
8/13/2019 Reality of Trade - The WTO and Developing Countries
http://slidepdf.com/reader/full/reality-of-trade-the-wto-and-developing-countries 14/106
8 The North-South Institute
to the establishment of a “Doha Development Agenda Trust Fund” of at least 15 million Swiss Francs(CHF) — approximately US$9.1 million. This proposed amount would go toward the implementation oftechnical assistance commitments as mandated by the Doha Ministerial Declaration. The existing WTOGlobal Trust Fund was established in July 1999 to receive extra-budgetary donations from WTOmembers to finance technical cooperation activities carried out by the WTO.
M inisteri al Conference
Negotiators also paid attention to other important institutional aspects of the multilateral trading system.In order to ensure an adequate degree of high-level political involvement in the WTO, it was agreed thatmembers would meet at the ministerial level at least once every two years. The Ministerial Conference isthe highest WTO body. So far, four WTO Ministerial Conferences have been held since 1995.
Impact on World Trade
The real success of the eight years of intensive Uruguay Round trade negotiations, followed by overseven years of implementation of WTO agreements, can be judged in terms of their contributions toward
establishing a free and fair trade regime, and in terms of how far the integration of poor countries,especially LDCs, into the multilateral trading system has advanced. Potential indicators are the share ofdeveloping countries in world merchandise exports and the composition of their export basket.
World Exports of Merchandise
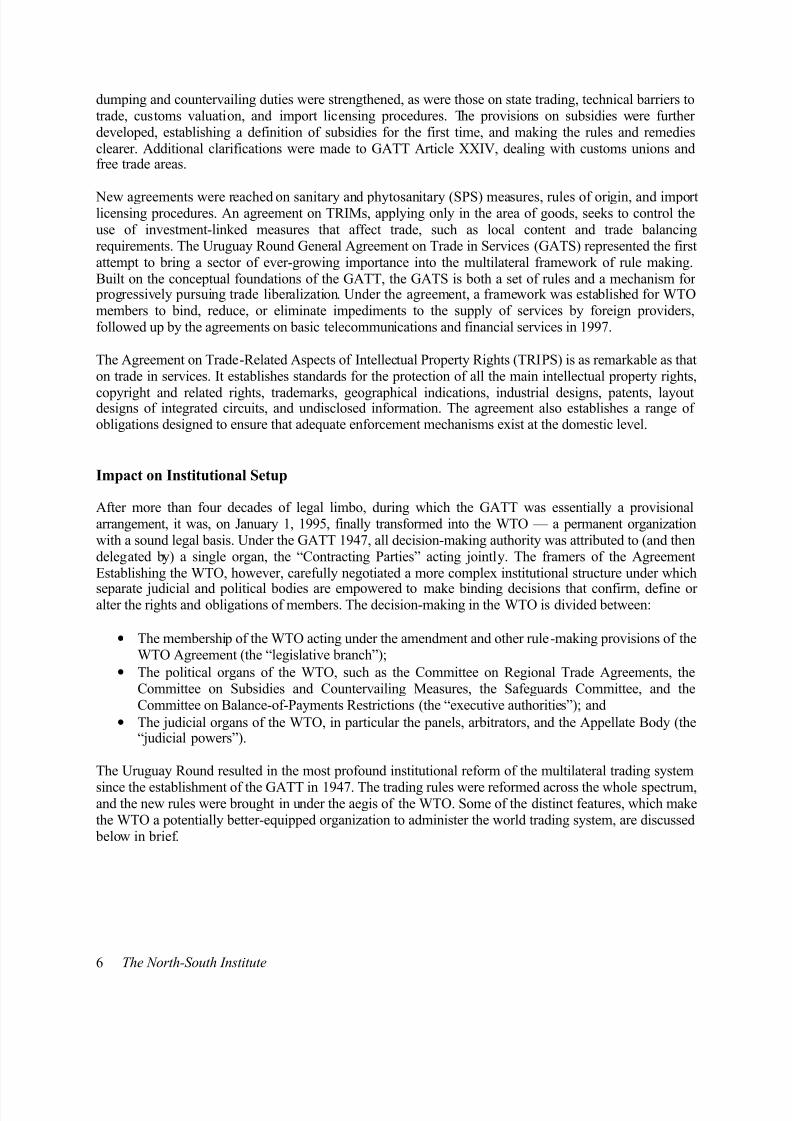
The 1990s witnessed a boom in world trade, with an average annual increase of 6.3% in the volume ofglobal merchandise trade (1990-99). It outpaced global gross domestic product (GDP) growth by anaverage of 4.2% per year over the same time period. Exports grew faster than output in every majorregion (World Bank 2001). Developing countries made a significant contribution to the vigorousexpansion of world trade in the last decade. The share of developing countries in global export marketsrose by almost seven percentage points, to about 25% of world non-energy merchandise trade, primarily
based on superior performance in manufacturing. They accounted for 27% of world exports ofmanufactures in 2000, a remarkable increase from their 17% share in 1990. However, the details behindthese headlines reveal divergent trends. Some countries enjoyed exceptional growth, while othersremained stagnant (Table 1).
Table 1: Share in World Merchandise Exports by Region, 2000
Share in 1990 (%) Share in 2000 (%)
North America 15.4 17.1
Latin America 4.3 5.8
Western Europe 48.3 39.5
Central/Eastern
Europe/Baltic States/CIS
3.1 4.1
Africa 3.1 2.3
Middle East 4.0 4.2
Asia 21.8 26.7Source: WTO, 2001b.
Developing countries as a whole improved their penetration of world markets, but the export share of the49 LDCs shrank from 3% in the 1950s to around 0.5% in the early 1980s, and has hovered around this
8/13/2019 Reality of Trade - The WTO and Developing Countries
http://slidepdf.com/reader/full/reality-of-trade-the-wto-and-developing-countries 15/106
The Reality of Trade: The WTO and Developing Countries 9
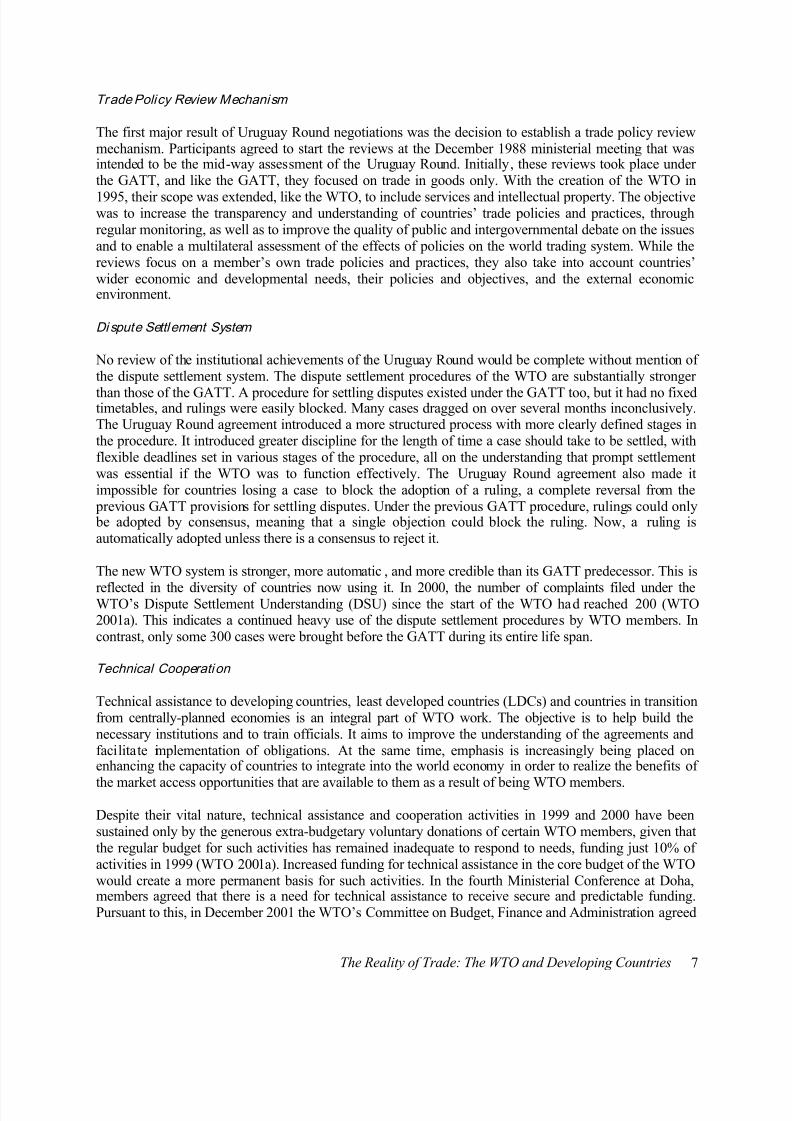
very low level over the last two decades (UNCTAD 2001). In the year 2000, aggregate merchandiseexports from the LDCs were at a record level ($34 billion), while at the same time more than one-third ofthe LDCs saw their exports decline. The LDCs continue to depend on agriculture and labour-intensivemanufactures, which together account for about 70% of their exports. The share of manufactures in totalexports of Africa, where 33 of the 49 LDCs are located, is only 24.6% (Table 2). This is significantlylower than the world’s share of 74.9%. The expansion of trade volumes in these sectors did not keep pace
with world trade growth, which has undermined the LDCs’ growth prospects and hindered their battleagainst poverty.
Table 2: Share of Manufactures in Total Merchandise Trade by Region, 2000
Exports (%) Imports (%)
World 74.9 74.9
North America 78.0 80.0
Latin America 60.5 76.9
Western Europe 80.3 75.4
Central/Eastern
Europe/Baltic States/CIS
54.2 72.0
Africa 24.6 68.4Middle East 21.7 74.6
Asia 84.2 70.5Source: WTO, 2001b.
Further, progress in lowering trade barriers has lagged in agriculture and labour-intensive manufactures(such as textiles and clothing) — the two sectors with the most impact on poverty. Both these sectors arehighly protected. Agriculture and other labour-intensive products matter to the world’s poor because theyrepresent more than half of the low-income countries’ exports, and about 70% of the least-developedcountries’ export revenues.
World Exports of Commercial Servi ces
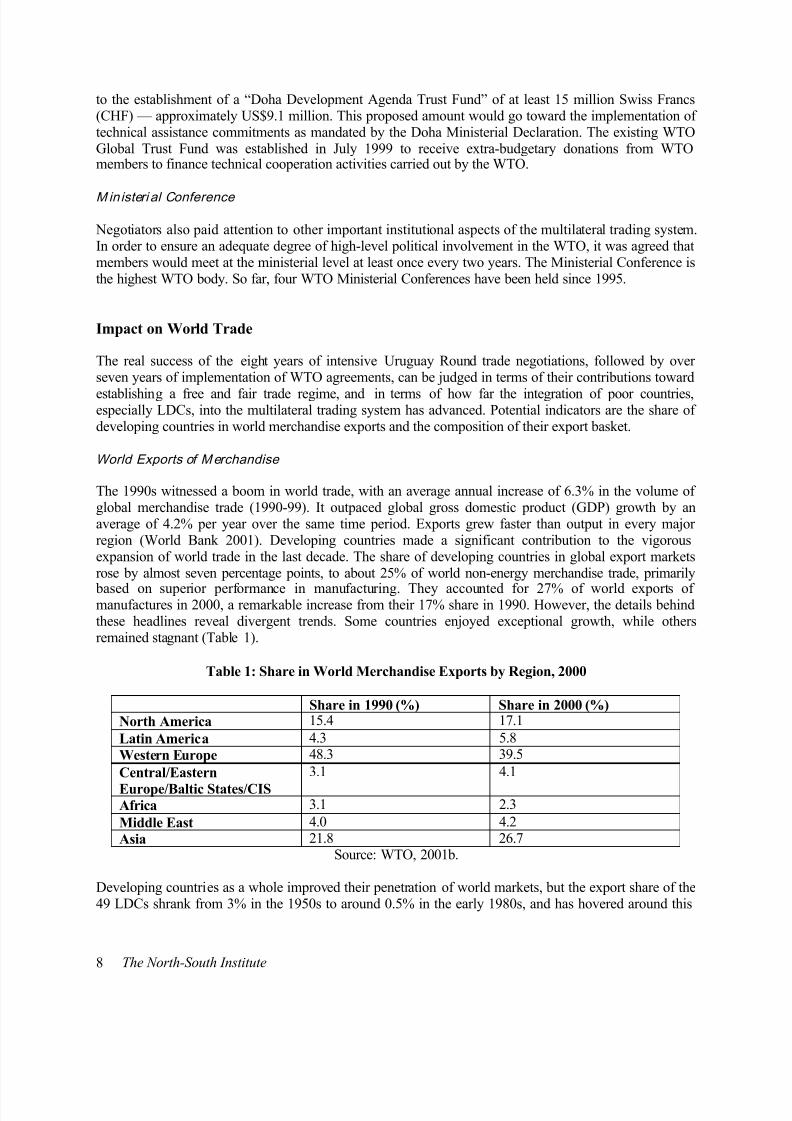
Although the GATS commitments are of relatively recent vintage, a number of WTO members haveactively pursued unilateral liberalization in the services sector. World exports of commercial servicesgrew at the rate of 6% per annum from 1990 to 2000, reaching US$1.4 trillion. Western Europe aloneaccounted for almost 45% of world services trade in 2000. North America, Latin America, and Asiaincreased their share in world exports of services over the 1990s. Once again the share of Africa, whichincludes most LDCs, decreased to 2.1% in 2000 from 2.4% in 1990 (Table 3).
Table 3: World Exports of Commercial Services by Region, 2000
Share in 1990 (%) Share in 2000 (%)
North America 19.3 21.7
Latin America 3.8 4.2
Western Europe 53.0 45.0
Africa 2.4 2.1
Asia 16.8 21.1Source: WTO, 2001b.
8/13/2019 Reality of Trade - The WTO and Developing Countries
http://slidepdf.com/reader/full/reality-of-trade-the-wto-and-developing-countries 16/106
10 The North-South Institute
Some Serious Concerns
There is no doubt that the Uruguay Round of trade negotiations made a significant contribution towardlowering global barriers to merchandise trade on two fronts: improving market access, thanks to thereduction of tariffs and quantitative restrictions on a number of products; and extending multilateraldisciplines to previously excluded sectors, particularly agriculture, and textiles and clothing.
However, the poor countries have still not been able to penetrate the markets of developed countries.Many tariff bindings are at levels much higher than the applied tariffs, creating a degree of uncertainty forexporters wishing to access these markets. While the overall use of non-tariff measures has declined, theuse of certain trade remedy measures such as anti-dumping and countervailing measures is on the rise.Moreover, there is growing evidence of the difficulties faced by developing countries, especially LDCs,in implementing the WTO commitments in new areas such as TRIPS, SPS (the Agreement on theApplication of Sanitary and Phytosanitary Measures), and TBT (the Agreement on Technical Barriers toTrade).
Slow Pace of El imination of Quotas on Textil es and Clothing
For more than 30 years, an important part of world trade in textiles and clothing was governed by aspecial regime known as the Multi-Fibre Arrangement (MFA), which provided for waivers from GATTrules. The Uruguay Round Agreement on Textiles and Clothing (ATC) provides for the gradual phase-outof the country-specific quotas over a 10-year period ending in 2005. The ATC was an important step toimprove developing countries’ access to high-income countries’ markets, because it made it very difficultfor importers to introduce new quotas. However, the effectiveness of the ATC in freeing up markets has
been limited by two main drawbacks. First, scheduled quota integration is “back-loaded,” with quota-freemarket access for nearly half of all imports due only at the end of the transition (i.e., in 2005).
Second, the ATC rules for the removal of quotas are framed in terms of overall import shares in textilesand clothing, rather than in terms of the number of existing quotas. This allows importing countries theleeway to select the products to be freed of quota restrictions at each step, which slows the pace of
liberalization. Up to 2000, more than 33% of trade was integrated, fulfilling the minimum ATCrequirements. But products that were freed of quotas by the EU and the US at that time represented onlysmall shares of their total textile and clothing imports — about 6% of 1995-97 imports for the US and lessthan 5% for the EU (ITCB 1999).
Distortions in Agricul ture Trade
The WTO Agreement on Agriculture (AoA) marked an important step in improving access to shelteredagricultural markets in high-income countries. A wide range of non-tariff barriers were abolished andconverted to ordinary tariffs (tariffication). Existing and new tariffs were bound, and these bindings weresubject to reduction. Developing countries were allowed more flexibility through longer implementation
periods and lower reduction commitments.
Even seven years following the implementation of the Uruguay Round Agreement on Agriculture(URAA), the agriculture market was still highly protected. Developed countries continued to applyseveral measures to protect their farm sectors. Some of them are discussed below in brief. Since theinternational agricultural prices in the base period for the URAA (1986-88) were way below highdomestic prices supported by quotas, the conversion of quotas into tariff equivalents resulted in high ratesof tariff protection (OECD 2001a). Tariff peaks in agriculture occur frequently on processed products and
8/13/2019 Reality of Trade - The WTO and Developing Countries
http://slidepdf.com/reader/full/reality-of-trade-the-wto-and-developing-countries 17/106
The Reality of Trade: The WTO and Developing Countries 11
temperate commodities. They are less common on unprocessed fruits and vegetables and tropicalcommodities, which are not produced in high-income countries but are major export crops of LDCs.
At an estimated $245 billion in 2000 (which was about five times the level of annual internationaldevelopment assistance), support to agricultural producers in high-income countries remained sizeable(OECD 2001b). Total support to agriculture (as defined by the Organisation for Economic Co-operation
and Development (OECD)) was even higher, at about $327 billion in 2000 (i.e., 1.3% of OECDcountries’ GDP). Export subsidies in agriculture allow countries to export production surpluses to theworld market at prices below the high prices prevailing in their domestic markets. In 1995-98, exportsubsidies were about $7 billion, on average, of which 95% was granted by the EU.
Rising Game of Anti -dumping and Countervail ing Measures
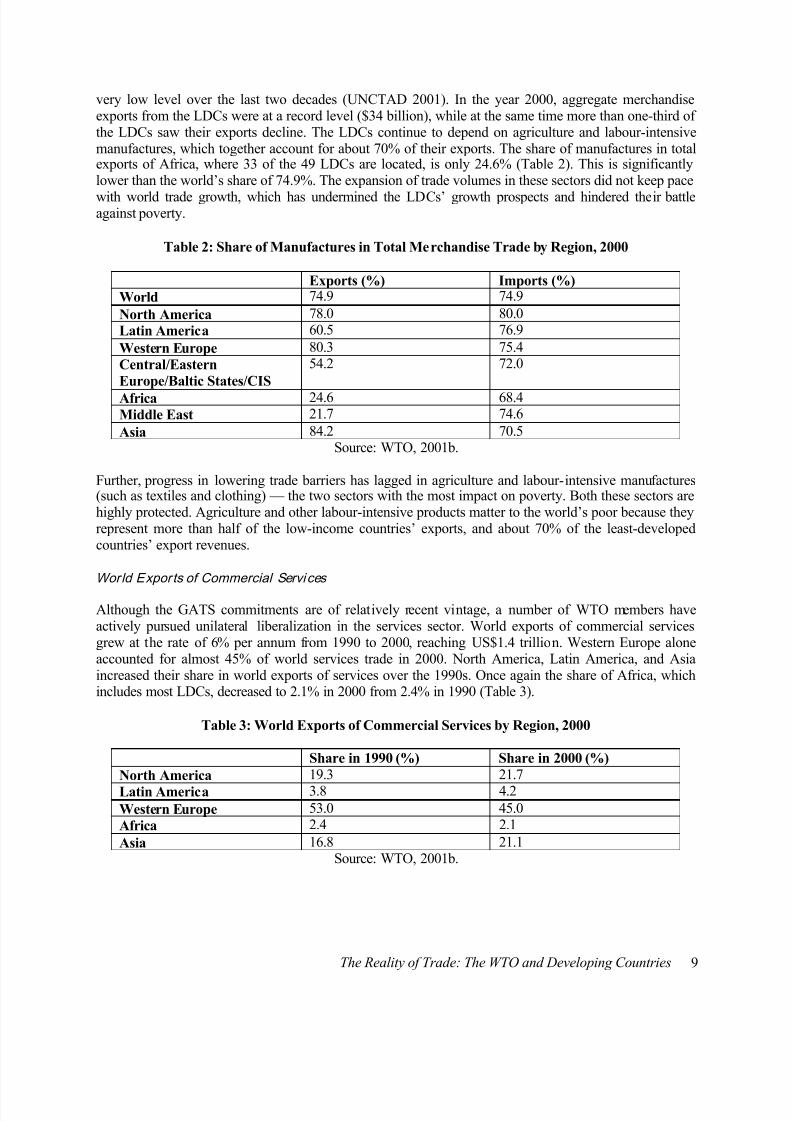
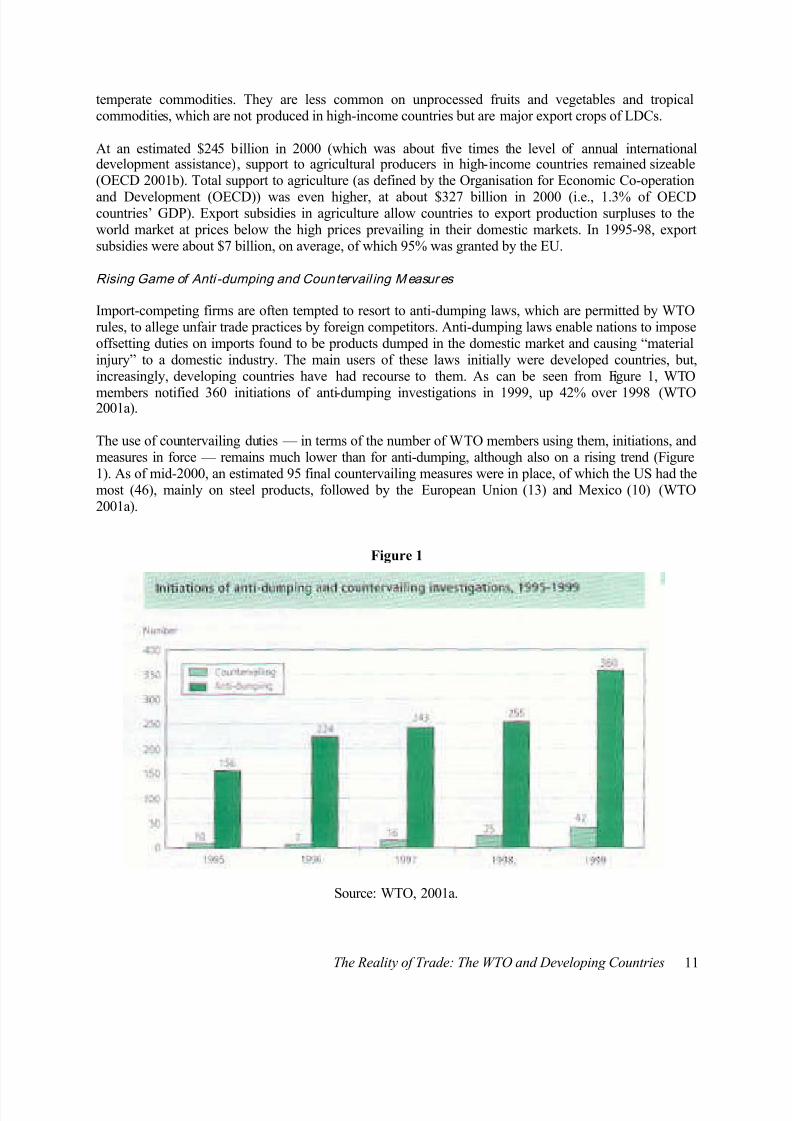
Import-competing firms are often tempted to resort to anti-dumping laws, which are permitted by WTOrules, to allege unfair trade practices by foreign competitors. Anti-dumping laws enable nations to imposeoffsetting duties on imports found to be products dumped in the domestic market and causing “materialinjury” to a domestic industry. The main users of these laws initially were developed countries, but,increasingly, developing countries have had recourse to them. As can be seen from Figure 1, WTO
members notified 360 initiations of anti-dumping investigations in 1999, up 42% over 1998 (WTO2001a).
The use of countervailing duties — in terms of the number of WTO members using them, initiations, andmeasures in force — remains much lower than for anti-dumping, although also on a rising trend (Figure1). As of mid-2000, an estimated 95 final countervailing measures were in place, of which the US had themost (46), mainly on steel products, followed by the European Union (13) and Mexico (10) (WTO2001a).
Figure 1
Source: WTO, 2001a.
8/13/2019 Reality of Trade - The WTO and Developing Countries
http://slidepdf.com/reader/full/reality-of-trade-the-wto-and-developing-countries 18/106
12 The North-South Institute
Growing Threats from Standards and Techni cal Barr iers
While traditional trade barriers in agriculture, such as tariffs, continue to decline, technical and regulatory barriers are increasingly subject to debate. In recent years, Sanitary and Phytosanitary (SPS) measures andTechnical Barriers to Trade (TBT) have emerged as the greatest threat for poor countries’ exports. BothWTO agreements in this area, by their very nature, may result in restrictions on trade. All governments
accept the fact that some trade restrictions may be necessary and appropriate in order to ensure foodsafety and animal and plant health protection. However, arbitrary use of these measures by developedcountries has been increasing. In developed countries, consumer groups, environmental protectionagencies, and food safety enforcement agencies are increasingly prescribing stricter and stricter standardsfor cleanliness, microbial loads, aflatoxin, and pesticide residues. For instance, Japan insists on a DDTresidues level of 0.4 PPM on unmanufactured tobacco, while the international standard is as high as 6PPM.
Developing countries are vulnerable to regulatory changes in developed countries because of a relativescarcity of public resources to finance compliance with new and more restrictive SPS and TBT standards.While middle-income developing countries have shifted their export to processed food to avoidcomplying with high SPS standards (though even here they can be onerous), countries in the lowest
income regions (such as Africa) still largely depend on raw food exports. The cost of compliance withWTO Agreements on SPS and TBT in the LDCs can exceed total government budgets. Fast technologicalchanges have enhanced inspection capacities in developed countries and allowed them to adopt
progressively more restrictive SPS and TBT standards. Securing sales in these major markets is expectedto become more challenging and costly over time.
Besides these major impediments to developing and poor countries’ exports, some other equally serious barriers in market access, which have surfaced in the post-WTO period, are tariff escalation and tariff peaks. Tariffs often rise significantly with the level of processing (tariff escalation) in many high-incomeand developing countries. This has the potential of reducing demand for processed imports fromdeveloping countries, hampering diversification into higher value-added exports. Low average dutiesconceal high tariffs in place for major agricultural and industrial export products of developing countries.
Extremely high and often prohibitive peak tariffs of 100-900% continue to be applied by many developedcountries for such major agricultural products as sugar, rice, cereals, dairy products, and meat as well asfor food industry products and footwear (Supper 2001).
Conclusions and Policy Implications
The overall impact of the Uruguay Round trade negotiations on the multilateral trading system is mixed.It brought some really significant institutional changes, which have resulted in relatively bettergovernance of the world trading system under the aegis of the WTO. The Uruguay Round did alsoadvance the integration of the world economy, especially the integration of developing countries into themultilateral trading system. It has contributed to the liberalization of developing countries’ own trade
regimes and improvements in the conditions affecting access to the major markets for their export products.
However, unilateral liberalization is not enough to integrate any economy into the world unless it isreciprocated. So far, the integration process has been especially impressive for only 15-20 middle- andhigher-income countries in Latin America and Asia. For many others, especially LDCs, progress has beenslower. The implementation record of Uruguay Round agreements is still very poor. Until the fourthMinisterial Conference at Doha, some 90 implementation issues raised by developing countries were
8/13/2019 Reality of Trade - The WTO and Developing Countries
http://slidepdf.com/reader/full/reality-of-trade-the-wto-and-developing-countries 19/106
The Reality of Trade: The WTO and Developing Countries 13
unresolved. At Doha, trade ministers issued a separate declaration on implementation, addressing half ofthese issues.
Openness to trade has long been seen as an important element of good economic policy. Certainly,empirical evidence indicates that trade liberalization can be a positive contributor to poverty alleviation. Ifthe international community is serious about establishing a free and fair multilateral trading system and
sharing the fruits of global trade expansion with the poor countries, the factors enhancing their tradingopportunities must be addressed on a priority basis. For the world’s 2.8 billion poor, reducing barriers toagricultural products, textiles and clothing, apparel, and several other labour-intensive manufactures arecrucial. Both the high- and middle-income countries will have to reduce their levels of protection inagriculture.
References
International Textiles and Clothing Bureau. Agreement on Textiles and Clothing: Evaluation of Implementation. Geneva: ITCB, 1999.
Organisation for Economic Cooperation and Development. The Uruguay Round Agreement on Agriculture: An Evaluation of its Implementation in OECD Countries. Paris: OECD, 2001a.
Organisation for Economic Cooperation and Development. Agricultural Policies in OECD Countries: Monitoring and Evaluation. Paris: OECD, 2001b.
Supper, E. Is There Effectively a Level Playing Field for Developing Country Exports? Policy Issues inInternational Trade and Commodities Study Series No.1. New York and Geneva: UNCTAD, 2001.
United Nations Conference on Trade and Development. Trade and Development Report 2001. New Yorkand Geneva: United Nations, 2001.
World Bank. Global Economic Prospects and the Developing Countries 2002 . Washington, DC: WorldBank, 2001.
World Trade Organization. The Multilateral Trading System: 50 Years of Achievement . Geneva: WTO,1998.
World Trade Organization. Annual Report 2001. Geneva: WTO, 2001a.
World Trade Organization. International Trade Statistics 2001. Geneva: WTO, 2001b.
8/13/2019 Reality of Trade - The WTO and Developing Countries
http://slidepdf.com/reader/full/reality-of-trade-the-wto-and-developing-countries 20/106
14 The North-South Institute
Part II: Promises, promises?
Access to industrial markets
8/13/2019 Reality of Trade - The WTO and Developing Countries
http://slidepdf.com/reader/full/reality-of-trade-the-wto-and-developing-countries 21/106
The Reality of Trade: The WTO and Developing Countries 15
Chapter 2
Canada
Chantal Blouin
This paper presents an overview of Canada’s trade relationship with developing countries. It examineswhether and how the Uruguay Round agreements translated into greater access to Canadian markets fordeveloping countries. What are the remaining obstacles faced by imports from the South? The paper alsodiscusses the main orientations of Canadian trade policy vis-à-vis developing countries and examines howcoherent they are with Canada’s international development objectives.
Canadian Trade with the South
Trade with developing countries constitutes a small part of Canada’s external trade. Trade with the UnitedStates, from which 67% of imports originate and where 87% of Canadian exports are sold, predominantlydefines Canada’s trade policy priorities. Since Canada’s signature of a free-trade agreement with itsneighbour in 1988, the importance of exports for the Canadian economy grew from 25% to 43% of theGDP in 1999. The adoption of the free-trade agreement contributed to the acceleration of integration withthe American economy.
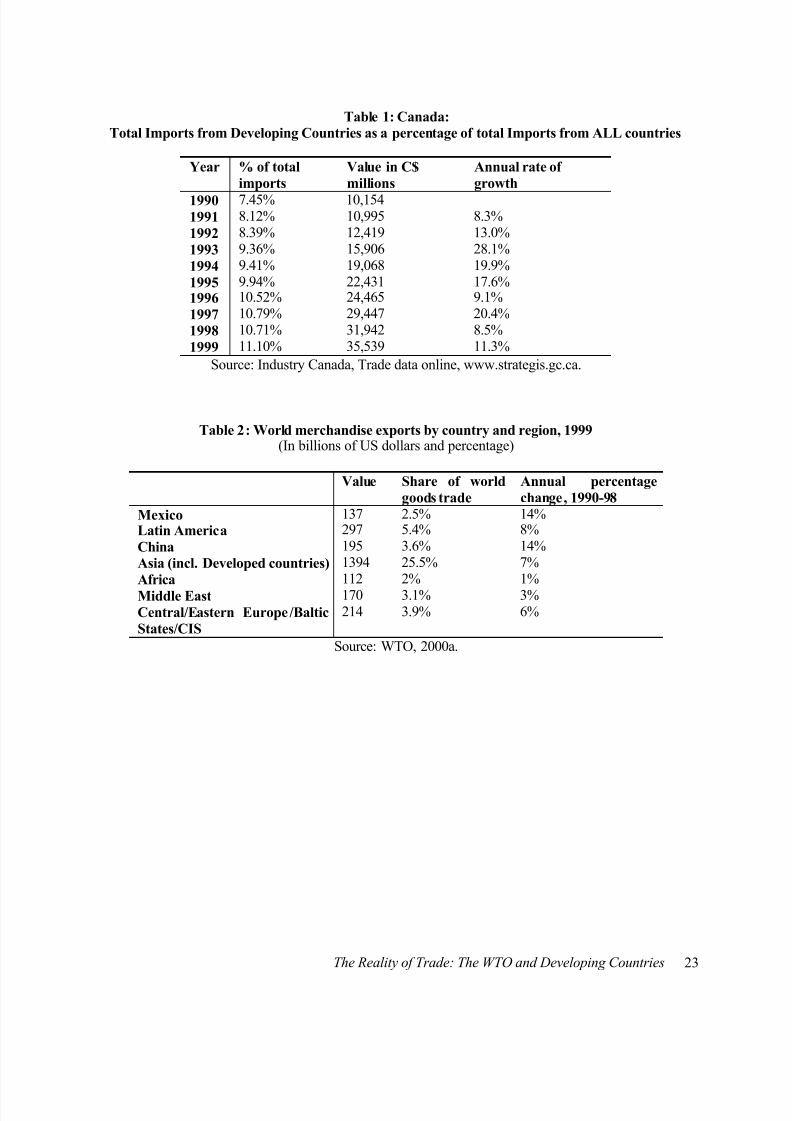
Nevertheless, some developing countries are becoming more important trade partners for Canada. Theshare of imports into Canada originating from developing countries grew from 7.4% in 1990 to 11.1% in1999 (see Table 1). This growth is highly concentrated and mostly reflects Canada’s increasing trade withtwo countries: Mexico and China.
1 The rising share of these two countries reflects the growing integration
of Mexico and China into the world economy. Between 1990 and 1999, they both experienced averageannual export growth of 14%, one of the highest in their regions, and their share of world exports in 1999reached 2.5% and 3.6% respectively (see Table 2). Therefore, if one compares the relative weight of thesecountries in the world economy to their importance for Canada’s external trade, one should note thatMexico has become especially important, ranking as the third largest source of imports (supplying 3% ofall Canadian imports, up from 1% ten years ago). China now ranks as the fourth largest source of importsfor Canada (2.8% of all imports).
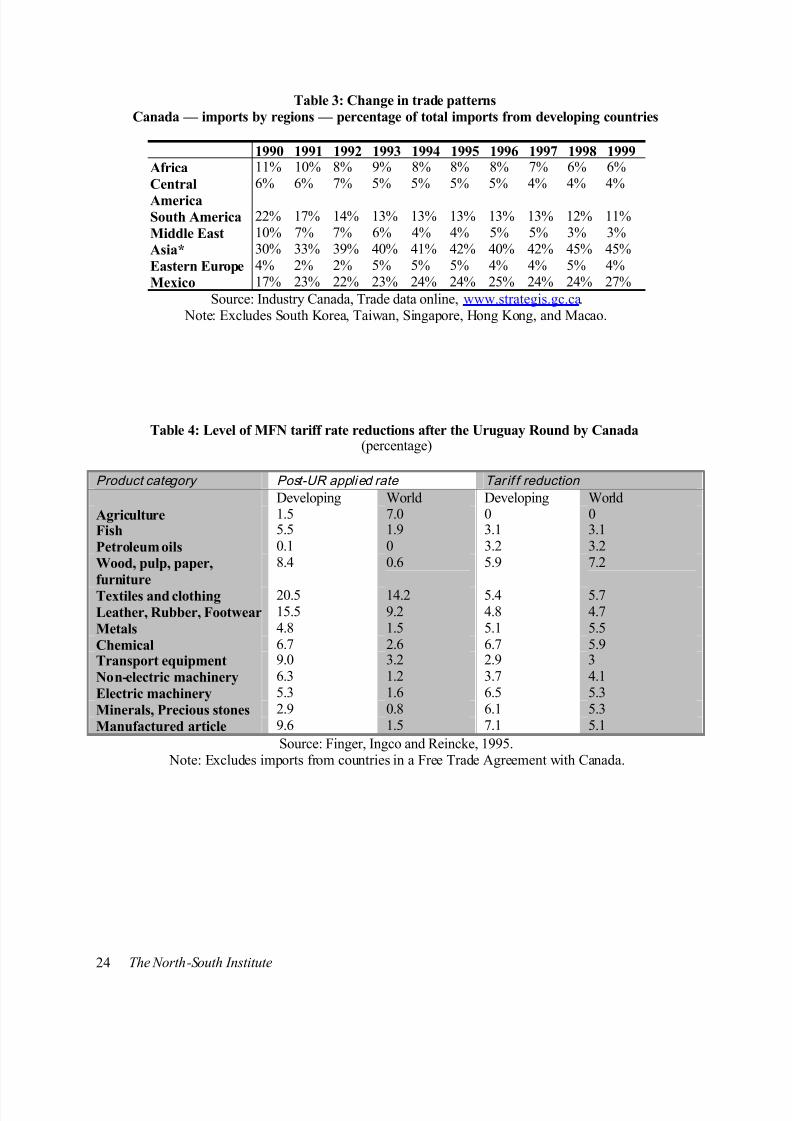
At a regional level, Asia represents the biggest source of imports from the developing world to Canada,with more than 45% of developing countries’ imports into Canada, compared to only 30% less than 10years ago. This trend reflects the growth of Asia in world merchandise trade in the last decade.Meanwhile, other developing regions (such as Africa, the Middle East, and South America) became less
important trading partners for Canada. For instance, the share of imports from South America slippedfrom 22% of Southern imports in 1990 to 11% in 1999 (see Table 3).
It is also important to highlight how the African continent, more specifically Sub-saharan Africa, is
weakly integrated into the global economy. The total of Canadian imports from Africa reflects thisdecreasing importance of Africa in the world exchange of goods and services. The level of African import
1 Together, Mexico and China represented 52% of all imports from developing countries coming to Canada in 1999
(from 44% in 1994).
8/13/2019 Reality of Trade - The WTO and Developing Countries
http://slidepdf.com/reader/full/reality-of-trade-the-wto-and-developing-countries 22/106
16 The North-South Institute
participation in the total of developing countries for 1999 was approximately five percentage points lowerthan in 1990, decreasing from 11% at the beginning of the period, to 6% during the last two years (seeTable 3). (The major suppliers were Algeria, South Africa, Nigeria, Namibia, and Morocco, whichaccounted for 84% of Canadian imports from Africa in 1999.)
At the aggregate level, there are no clear signs yet that the Uruguay Round agreements have considerably
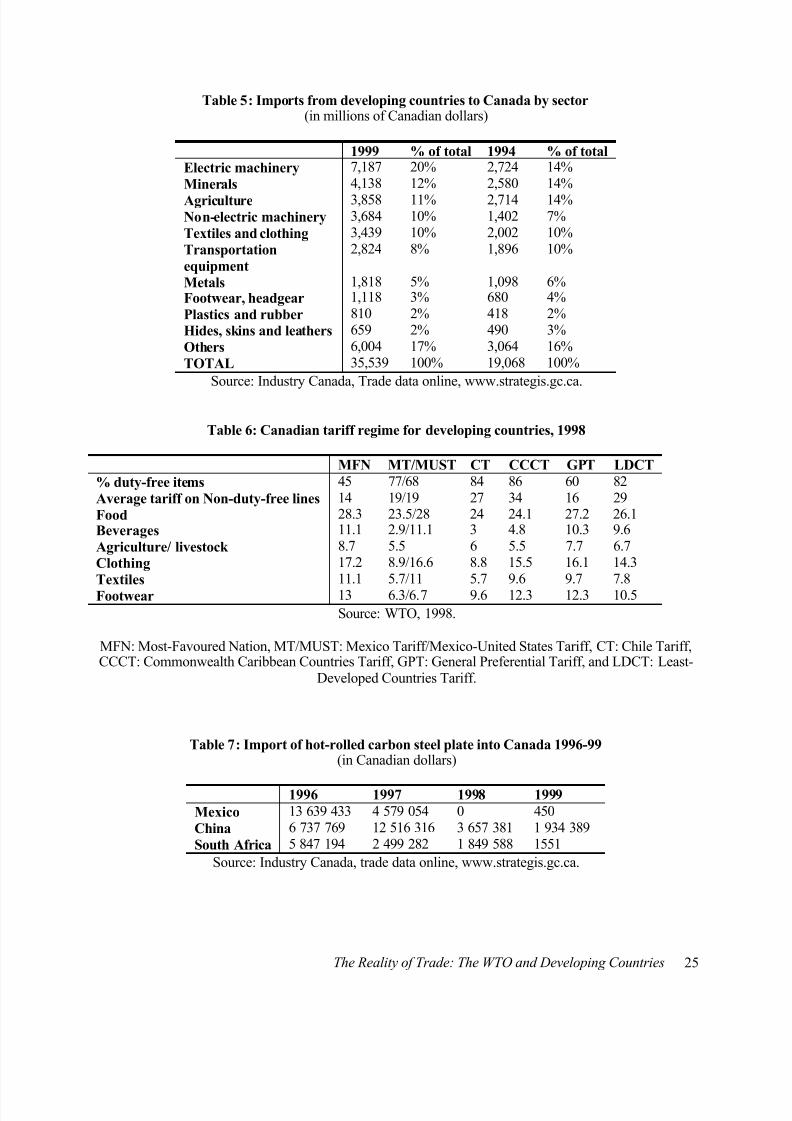
improved access to the Canadian market for developing countries. More than 60% of the total growth ofdeveloping countries’ imports into Canada since 1995 is attributable to two countries: China and Mexico.What type of goods does Canada buy from developing countries? Are primary commodities still the maintypes of merchandise imported from the South? Table 5 shows that, as a group, developing countries haveincreased their exports of manufactured goods to Canada. Indeed, machinery and transportationequipment alone amounted to 38% of their sales to Canada in 1999. Sales of electric machinery (whichcovers a wide range of manufactured goods: television sets, domestic appliances, printed circuits,electrical tools, and so on) have particularly accelerated in the last years. Is this an indication that theSouth is finally out of the vicious circle of selling primary commodities or goods with low levels ofvalue-added in exchange for manufactured merchandise, often with declining terms of trade?
Strong regional distinctions emerge here again. Imports from Mexico and Asia (China, Malaysia, and the
Philippines especially) represent 95% of the electrical, electronic, and non-electric machinery equipmentsold to Canada in 1999. For transportation equipment, Mexico alone is the source of 85% of imports,suggesting it has benefited from its membership in NAFTA. This confirms research findings recently
presented by the World Bank that, if a developing country is to join a regional integration arrangement,the most beneficial arrangement is to join with one or several high-income countries. Developingcountries’ comparative advantage in labour-intensive manufacturing can lead to industry relocation andincrease in the total income of a country. There is substantial evidence that such relocation ofmanufacturing firms took place between Mexico and the USA, boosting Mexico’s production and exportcapacity (World Bank 2000).
Otherwise, the traditional patterns of trade in terms of the types of goods bought from Southern countriesremain very strong. The textiles and clothing sector remains very important, especially in Asia, from
where more than 77% of the textiles and clothing imports to Canada originate. Agricultural products alsorepresents more than 10% of all imports to Canada; this sector being dominated by Latin America (withmore than 55% when Mexico is included) with imports such as coffee, sugar, bananas, and other fruits.For Africa, the sectoral patterns have not changed. Imports have been highly concentrated in minerals,and to a lesser extent in agricultural products. Crude petroleum oils and oils obtained from bituminousminerals represented 46% of the total imports from the region in 1999. Other products imported arenatural uranium, preparations of non-crude petroleum oils, and agricultural products such as oranges,other citrus fruits, and cocoa.
Barriers to Trade and Preferential Access
In general, imports to Canada from developing countries are subjected to higher tariffs than imports fromdeveloped countries, even if the United States is not included in the calculation (see Table 4)
2. The
reduction in tariffs resulting from the Uruguay Round did not change this state of affairs, as the reductionsoffered to developing countries were usually similar to those offered to industrial countries. Nevertheless,Canada offers a number of binding and non-binding preferential tariff regimes to developing countries.The most significant binding preferential access regime is the one for Mexico. As a member of NAFTA,
2 In 2001, Canada collected almost $1.3 billion of tariff revenues on imports from developing countries, almost 45%
of all its tariff revenues. See The North-South Institute, 2003, pp. 98-101.
8/13/2019 Reality of Trade - The WTO and Developing Countries
http://slidepdf.com/reader/full/reality-of-trade-the-wto-and-developing-countries 23/106
The Reality of Trade: The WTO and Developing Countries 17
Mexico enjoyed duty-free treatment on 77% of its exports to Canada in 1998. All remaining duties,except duties on agricultural goods subjected to quota, were to be abolished by 2003. The free tradeagreement signed with Chile is also very favourable, with the elimination of 99% of tariffs by 2003.
Besides these free trade agreements with developing countries, Canada has begun to negotiate free tradeagreements (FTAs) with a number of other countries: El Salvador, Guatemala, Honduras, Nicaragua and
Costa Rica which was completed at the beginning of 2001. For the moment, most developing countriesare eligible for the General Preferential Tariff (GPT), which provides duty-free treatment for 60% of tariffitems. About 15% of imports from GPT-eligible countries benefited from this preferential treatment(WTO 1998, p.40). Canada also offers a preferential tariff regime for the Least Developed countries(LDC). This regime was improved in 2000 by increasing the number of duty-free items for LDCs from82% to 90% of all item lines. In 2003, all remaining tariffs and quotas were removed on all imports fromLDCs except poultry, eggs, and dairy products. For other developing countries, however, there are stilltariff constraints. As a recent research report from the World Bank noted: “although tariff preferencesgranted to developing countries through different schemes tend to be relatively generous on average, thisis not the case for tariff peak items, as ‘sensitive’ products are excluded from these schemes or some typeof quantitative limitation is imposed” (Hoekman et al. 2001, 1). For Canada, these tariff peak items areconcentrated in the apparel sector.
Indeed, there is one sector in which many developing countries have a comparative advantage, thanks totheir plentiful labour supply, and where barriers for imports are especially high: the textiles and clothingsector. This is one of the few sectors where Canada maintains high tariffs. It is also subjected to tariffescalation, with clothing and made-up textiles being subjected to an average rate of 16.1% (see Table 4),whereas textiles are subjected to an average rate of 9.7%. Canada imposes quotas on textiles and clothingimports from 41 countries, most of them developing countries (until 2002, five of them were LDCs:Bangladesh, Laos, Cambodia, Lesotho, and Nepal).
The WTO’s Agreement on Textiles and Clothing (ATC), which came into force in 1995 aims at thegradual elimination of quotas, a process due to end in 2005. This agreement was hailed as “the mostsignificant set of market access changes” for developing countries in the Uruguay Round (Blackhurst,
Enders and Francois 1995). However, the first stages of the process of integrating textiles and clothing inthe WTO in 1995 and 1998 have been the target of several criticisms. In the case of Canada, the criticsnoted that clothing (which involves more processing and value-added) constituted a very small fraction ofthe products integrated in the ATC. This caused the share of “integrated products” (on which no quotascan be imposed) to be 3% lower than the target, if the share is expressed in dollar value of the imports andnot in volume (Bhattacharya and Rahman 2000, p.15). Moreover, most of the products (86%) Canadaincluded in its early implementation of the ATC had not been subject to quotas (Finger and Schuknecht1999, p.22).
In December 2000, when Canada notified the WTO Secretariat of the details of the third phase of quotaelimination under the ATC, the majority (25 out of 40) of the products included were subject to quotas.Moreover, most (22 out of 40) were clothing, not fabrics or textiles. One important question remains: did
the quotas eliminated on January 1, 2002, pose a real restraint on imports from developing countries? Forinstance, in 2000, Bangladesh only used 55% of its quotas on babies’ garments, and the Philippines, 6%of its quotas on swimwear (DFAIT, annual). Removing quotas on these products will not make a bigdifference, as they did not constitute a meaningful barrier to trade in the first place. However, on severalother products, quotas are fully or almost fully utilized by the exporters. For example, in 1999, the quotasallocated on jackets were filled up to 96% by Bangladesh, 100% by China, and 98% by Indonesia. OnCanada’s list of quotas eliminated in 2002, only one was clearly a “restrictive quota” for severalcountries: woven blouses and shirts (for women, girls, men, and boys). In 2000, Bangladesh used 93% ofthat quota, China, 90%, Hong Kong, 96%, the Philippines, 90%, and Thailand, 96%. Otherwise, only the
8/13/2019 Reality of Trade - The WTO and Developing Countries
http://slidepdf.com/reader/full/reality-of-trade-the-wto-and-developing-countries 24/106
8/13/2019 Reality of Trade - The WTO and Developing Countries
http://slidepdf.com/reader/full/reality-of-trade-the-wto-and-developing-countries 25/106
The Reality of Trade: The WTO and Developing Countries 19
In recent years, several developing countries have complained that industrial countrie s have been usinganti-dumping duties and countervailing duties to limit access to their markets. Developing countries fearthat this instrument is being used for protectionist purposes. Canada frequently resorts to anti-dumpingmeasures.
3 The United States and the European Union have been the usual targets of these measures.
Nevertheless, many cases are now aimed at imports from developing countries. As of January 2001, 14 of
the 32 Canadian active anti-dumping cases involved at least one developing country, with a total of 16economies in transition or development being the target. The steel industry in particular often resorts toanti-dumping actions against a wide range of countries, including China, Brazil, India, Argentina,Mexico, Indonesia, Thailand, South Africa, Russia, and Romania (Canada Customs and Revenue Agency2001). Antidumping duties are usually high and have a direct, visible impact on the import of thespecified goods. For instance, in 1997, Canada imposed anti-dumping duties of 18% to 26% on steel plateoriginating from Mexico, China, and South Africa; the import of these products from these three countriesdropped abruptly, completely stopping in 1998 in the case of Mexico (see Table 7). An earlier study ofCanadian anti-dumping actions confirmed the strong negative impact of these initiatives on the marketshares of the targeted exporters (Kim and Weston 1993). What is the relative importance of these anti-dumping actions on trade with developing countries? The supporters of anti-dumping measures highlightthat a very small fraction of trade flows is affected by these measures: in 1998, Canadian anti-dumping
measures affected about $1 billion of imports, which is less than 1% of all imports. However, theopponents of this instrument stress that the impact is not as insignificant as it seems. Because themeasures are concentrated in very specific sectors, they can have a strong impact in these industries.
Finally, several developing countries have raised the problem of technical standards as barriers toindustrialized markets. Up to now, this discussion has focused on standards put forward by the EuropeanUnion. Indeed, Europe has adopted standards on food products that are above the internationally setstandards and its trade partners have complained that these costly measures offer little health protection.The World Bank has recently published an evaluation of the cost of a proposal for a higher Europeanstandard for aflatoxins on cereals, dried fruits, and nuts exports from African countries. The study revealsthat “the EU standard, which would reduce health risk by approximately 1.4 deaths per billion a year, willdecrease these African exports [from nine countries] by 64% or US$670 million in contrast to regulation
set at an international standard” (Otsuki, Wilson and Sewadeh 2000). The trade-off between human health protection and the economic costs of technical standards is a controversial issue. Nevertheless, thedevelopment of international standards needs to take into account the fact that these standards can becomean effective barrier to trade for developing countries. The WTO Agreement on Sanitary and PhytosanitaryMeasures (SPS) measures provides some guidance, as it encourages members to adopt internationalstandards and codes. Members are free to adopt measures stricter than the international standards, “ifthere is scientific justification” and they are based on risk assessment methods. When the measuresconcern only plant or animal health/life, this assessment should include the economic costs of thestandards. In assessing risks for human health or the like, it is not required to do so; but in establishing theappropriate level of protection, WTO members should try to minimize negative trade effects.
Empirical research on the cost of standards for developing countries is still limited, but a recent study
from the University of Reading (Henson et al. 2000) provides some preliminary documentation on theimpact of standards in the agricultural sector. Based on case studies from ten developing countries and ona survey of 65 governments in developing countries, SPS requirements are identif ied as the main factorinfluencing the ability to export agricultural and food products to the European Union, ahead of otherfactors such as tariffs, quotas, and transport costs. One example is the European Directive 92/46/EECwhich requires dairy products to be manufactured from milk derived from cows that have been
3 Canada imposed 114 anti-dumping measures between 1987 and 1997, ranking fourth behind the United States
(269), the European Union (185) , and Australia (120) (WTO 1998, p.50).
8/13/2019 Reality of Trade - The WTO and Developing Countries
http://slidepdf.com/reader/full/reality-of-trade-the-wto-and-developing-countries 26/106
20 The North-South Institute
mechanically milked. “Given the predominance of hand milking in India, this effectively precludessmallholder producers and much of India ’s milk output from exports to the EU” (Henson 2000, p.15). Onthe other hand, the survey revealed that SPS requirements were not perceived to be a major obstacle toexporting to Canada (Henson 2000, p.13). Indeed, when asked how much of an impediment CanadianSPS requirements were in terms of the export of agricultural products, no respondent from developingcountry governments ranked them as important or very important. This result does not automatically
mean that there are no technical barriers to trade in Canada, but could reflect the low level of agriculturaltrade with many developing regions — compared to the European Union, with whom developingcountries, especially the former colonies, have a long history of trading experiences.
Is reciprocity good for development?
How can we assess Canadian trade relations with developing countries? The first question to ask is: havethe benefits of the Uruguay Round for the South materialized? Have developing countries gained betteraccess to the Canadian market? If not, what seem to be the main obstacles? From this overview, it seemsthat the benefits have yet to materialize. Canada did reduce tariffs in the last round of multilateralnegotiations, but tariffs and quotas remain important barriers for imports from developing countries. This
holds especially true for the two sectors of key interest to them: clothing and agriculture. Antidumpingmeasures can also be identified as barriers to Canadian markets, but only in some sectors. As forCanadian technical standards and sanitary measures, the preliminary evidence tells us that this is not amajor issue for developing countries. In conclusion, despite its generally open borders, Canada stillmaintains significant barriers for imports from developing countries. Except for recent changes in textiles,the Uruguay Round has yet to make a significant contribution to access to the Canadian market.
A broader question to ask is whether Canada’s trade policy is coherent with its development assistancestrategy to reduce poverty. To answer this question, one has to identify the principles that guide its trade
policy toward developing countries. Recent developments indicate the nature of the Canadianexpectations toward trade partners in the South. The key word is reciprocity: Canada is interested insigning trade agreements with developing countries if they do not request special and differential
treatment. The Uruguay Round was a precursor to this new approach to developing countries, as it did notallow developing countries to pick and choose the agreements they wanted to sign (as they had done in
previous rounds). The measures targeting developing countries focused on longer implementation periodsand, as discussed earlier, promises of technical assistance to support the implementation of theseagreements.
NAFTA was another important step toward this new vision of North-South trade relationships ofcomplete reciprocity. Indeed, Mexico is treated as an equal partner in NAFTA. The subsequentnegotiations with small economies such as El Salvador , Guatemala, Honduras, Nicaragua, and Costa Ricaindicate that Canada prefers this approach to a differentiated treatment of developing countries
4. This
issue was raised early during the negotiations of the FTAA, as small countries were demanding specialand differential treatment, and a consultative group on smaller economies was created. For now, the
discussions of this group have focused on trade-related technical assistance. Otherwise, the negotiationstake place on the basis of reciprocity, as all members are expected to be party to all the sections of theagreement.
4 The Canada-Costa Rica Free Trade Agreement entered into force on November 1, 2002. The only special treatment
for Costa Rica is in the speed of the market liberalization. “For example, in market access, Costa Rica will eliminateits tariffs immediately on some 67 percent of its tariff lines, and over a period of up to 14 years for the remaininggoods. For its part, Canada will provide immediate duty-free access for some 86 percent of its tariff lines, the
remaining goods being subject to tariff elimination over a period of up to eight years.”
8/13/2019 Reality of Trade - The WTO and Developing Countries
http://slidepdf.com/reader/full/reality-of-trade-the-wto-and-developing-countries 27/106
The Reality of Trade: The WTO and Developing Countries 21
The literature on trade and development can contribute to the question of whether this principle ofreciprocity is coherent with the Canadian development strategy of poverty reduction. Are special anddifferential treatment provisions in trade arrangements still needed to achieve development objectives?What types of special and differential (S&D) measures should be maintained? Historically, S&Dtreatment meant that developing countries received preferential tariffs on their imports and were not
required to lower their tariffs and barriers to imports. Now that trade agreements go much beyond bordermeasures to cover a range of domestic measures such as subsidies, intellectual property laws, andinvestment rules, reciprocity has far-reaching implications.
A large part of mainstream economics would argue that it is in developing countries’ own interests toremove trade barriers, to eliminate export subsidies and reduce other type of subsidies, and to removedomestic content requirements and other trade-distorting measures (see Box 1 on trade and developmentdebate). According to this perspective, allowing them to keep these protections and antiquatedinterventionist measures simply slows economic development. In a recent essay based on earlier work,Dani Rodrik (2001, 1999) reminded these advocates that the oft-quoted example of the Asian Tigers isnot only about openness. Indeed, “these countries combined their outward orientation with unorthodox
policies: high levels of tariff and non-tariff barriers, public ownership of large segments of banking and
industry, export subsidies, domestic-content requirements, patent and copyright infringements, andrestrictions on capital flows” (Rodrik 2001, p.59). A long-term strategy for economic development
producing high growth needs to include a mobilization of domestic institutions and investors. Taking thisinto account, trade agreements based on the principle of reciprocity may not be coherent withdevelopment objectives of strong economic growth and poverty reduction. Trade rules can, and alreadydo, preclude the use of a number of economic tools.
Export subsidies are one example of an instrument widely used by developing countries that can have a positive influence on export performance and growth. For instance, Helleiner’s (1994) review of fourteencase studies of developing country trade policy highlighted that even though exchange rate policy is themost important variable to explain export performance and industrialization, direct and indirect exportsubsidies have “worked” in several instances. The trade regime of East Asia and other successful
developing countries mixed moderate tariffs on consumer goods, low tariffs on capital goods, and avariety of export incentives (see Buffie 2001). The actual benefits of using export subsidies will varyfrom one case to another. But past experiences show that they can be a useful tool of a trade regime fordeveloping countries trying to stimulate export and economic growth. However, the WTO Agreement onSubsidies and Countervailing Measures prohibits the use of export subsidies starting in 2003 for alldeveloping countries, except the LDCs, thereby removing this potentially useful instrument from thedevelopment toolbox.
Another example of the impact of the reciprocity policy on developing countries’ economic policy tools isthe WTO Agreement on Trade-Related Investment Measures (TRIMs). This agreement is often describedas very limited in coverage. Nevertheless, it prohibits the use of domestic content requirements (i.e.measures that require an investor to purchase inputs of domestic origin). In the past, this type of measure
has been used with some success, even by industrial countries. The Canada-US Autopact of 1965, oftencredited for the modernization of the industrial sector in Canada, was based on such local contentrequirements: American car manufacturers received duty-free treatment on automotive products against aminimum and growing “Canadian value-added” content on cars produced in Canada. This type of policyis now prohibited.
Defenders of WTO agreements stress the importance of trade agreements as lock-in mechanisms, i.e. binding commitments at the WTO that prevent policy reversals. It becomes very difficult to change yourtrade and industrial policy regime once it is “constitutionalized” in a trade agreement. The “insurance
8/13/2019 Reality of Trade - The WTO and Developing Countries
http://slidepdf.com/reader/full/reality-of-trade-the-wto-and-developing-countries 28/106
22 The North-South Institute
policy” aspect of trade agreements may provide certainty for investors, but one key problem remains:economic policy-making often functions on a trialand error basis. Several governments that were usingextremely high and non-uniform tariffs in the 1960s and 1970s recognized the problems linked to such
policy and decided to unilaterally decrease their tariffs. If a developing country decides now to basicallyeliminate all tariffs and reduce its interventions at a minimum, but decides later that moderate protectionand investment incentives would be more helpful to boost its economic growth, it cannot attempt this
route. Lock-in mechanisms such as a democracy clause for trade agreement membership may be a goodidea, however, when it comes to economic policy-making, greater flexibility is needed for developingcountries searching for effective ways to generate economic growth and reduce poverty.
If Canada wishes to ensure that its trade policy is coherent with international development objectives, aserious and informed debate is needed on the impact of trade agreements on the capacity of developingcountry governments. Industrial countries such as Canada may want to forsake economic instruments theydeem trade-distorting. However, developing countries many not have this luxury; pragmatism dictatesthat all tools with economic growth and poverty reduction potential remain within their reach. During thelast round of trade negotiations, developing countries gave up some of these tools voluntarily, presumablyin exchange for better access to industrial markets. If development needs were to be the focal point oftrade agreements, instead of being based on reciprocal concessions, the results of negotiations would
certainly be very different. The Canadian government should make the first step toward “development-friendly” trade policy by supporting greater flexibility in the application of the current agreements in alldeveloping countries, not only the least-developed countries, and by making sure that future agreementsdo not make their governments impotent as economic actors.
8/13/2019 Reality of Trade - The WTO and Developing Countries
http://slidepdf.com/reader/full/reality-of-trade-the-wto-and-developing-countries 29/106
The Reality of Trade: The WTO and Developing Countries 23
Table 1: Canada:Total Imports from Developing Countries as a percentage of total Imports from ALL countries
Year % of total
imports
Value in C$
millions
Annual rate of
growth
1990 7.45% 10,1541991 8.12% 10,995 8.3%
1992 8.39% 12,419 13.0%
1993 9.36% 15,906 28.1%
1994 9.41% 19,068 19.9%
1995 9.94% 22,431 17.6%1996 10.52% 24,465 9.1%
1997 10.79% 29,447 20.4%
1998 10.71% 31,942 8.5%
1999 11.10% 35,539 11.3%
Source: Industry Canada, Trade data online, www.strategis.gc.ca.
Table 2: World merchandise exports by country and region, 1999 (In billions of US dollars and percentage)
Value Share of world
goods trade
Annual percentage
change, 1990-98
Mexico 137 2.5% 14%Latin America 297 5.4% 8%
China 195 3.6% 14%
Asia (incl. Developed countries) 1394 25.5% 7%
Africa 112 2% 1%
Middle East 170 3.1% 3%
Central/Eastern Europe/Baltic
States/CIS
214 3.9% 6%
Source: WTO, 2000a.
8/13/2019 Reality of Trade - The WTO and Developing Countries
http://slidepdf.com/reader/full/reality-of-trade-the-wto-and-developing-countries 30/106
24 The North-South Institute
Table 3: Change in trade patterns
Canada — imports by regions — percentage of total imports from developing countries
1990 1991 1992 1993 1994 1995 1996 1997 1998 1999
Africa 11% 10% 8% 9% 8% 8% 8% 7% 6% 6%
Central
America
6% 6% 7% 5% 5% 5% 5% 4% 4% 4%
South America 22% 17% 14% 13% 13% 13% 13% 13% 12% 11%
Middle East 10% 7% 7% 6% 4% 4% 5% 5% 3% 3%
Asia* 30% 33% 39% 40% 41% 42% 40% 42% 45% 45%
Eastern Europe 4% 2% 2% 5% 5% 5% 4% 4% 5% 4%
Mexico 17% 23% 22% 23% 24% 24% 25% 24% 24% 27%
Source: Industry Canada, Trade data online, www.strategis.gc.ca. Note: Excludes South Korea, Taiwan, Singapore, Hong Kong, and Macao.
Table 4: Level of MFN tariff rate reductions after the Uruguay Round by Canada(percentage)
Product category Post-UR applied rate Tar if f reduction
Developing World Developing World
Agriculture 1.5 7.0 0 0Fish 5.5 1.9 3.1 3.1
Petroleum oils 0.1 0 3.2 3.2
Wood, pulp, paper,
furniture
8.4 0.6 5.9 7.2
Textiles and clothing 20.5 14.2 5.4 5.7
Leather, Rubber, Footwear 15.5 9.2 4.8 4.7
Metals 4.8 1.5 5.1 5.5
Chemical 6.7 2.6 6.7 5.9Transport equipment 9.0 3.2 2.9 3
Non-electric machinery 6.3 1.2 3.7 4.1
Electric machinery 5.3 1.6 6.5 5.3
Minerals, Precious stones 2.9 0.8 6.1 5.3
Manufactured article 9.6 1.5 7.1 5.1
Source: Finger, Ingco and Reincke, 1995. Note: Excludes imports from countries in a Free Trade Agreement with Canada.
8/13/2019 Reality of Trade - The WTO and Developing Countries
http://slidepdf.com/reader/full/reality-of-trade-the-wto-and-developing-countries 31/106
The Reality of Trade: The WTO and Developing Countries 25
Table 5: Imports from developing countries to Canada by sector(in millions of Canadian dollars)
1999 % of total 1994 % of total
Electric machinery 7,187 20% 2,724 14%
Minerals 4,138 12% 2,580 14%
Agriculture 3,858 11% 2,714 14%Non-electric machinery 3,684 10% 1,402 7%
Textiles and clothing 3,439 10% 2,002 10%
Transportation
equipment
2,824 8% 1,896 10%
Metals 1,818 5% 1,098 6%Footwear, headgear 1,118 3% 680 4%
Plastics and rubber 810 2% 418 2%
Hides, skins and leathers 659 2% 490 3%
Others 6,004 17% 3,064 16%
TOTAL 35,539 100% 19,068 100%
Source: Industry Canada, Trade data online, www.strategis.gc.ca.
Table 6: Canadian tariff regime for developing countries, 1998
MFN MT/MUST CT CCCT GPT LDCT
% duty-free items 45 77/68 84 86 60 82
Average tariff on Non-duty-free lines 14 19/19 27 34 16 29
Food 28.3 23.5/28 24 24.1 27.2 26.1Beverages 11.1 2.9/11.1 3 4.8 10.3 9.6
Agriculture/ livestock 8.7 5.5 6 5.5 7.7 6.7
Clothing 17.2 8.9/16.6 8.8 15.5 16.1 14.3
Textiles 11.1 5.7/11 5.7 9.6 9.7 7.8
Footwear 13 6.3/6.7 9.6 12.3 12.3 10.5
Source: WTO, 1998.
MFN: Most-Favoured Nation, MT/MUST: Mexico Tariff/Mexico-United States Tariff, CT: Chile Tariff,CCCT: Commonwealth Caribbean Countries Tariff, GPT: General Preferential Tariff, and LDCT: Least-
Developed Countries Tariff.
Table 7: Import of hot-rolled carbon steel plate into Canada 1996-99(in Canadian dollars)
1996 1997 1998 1999
Mexico 13 639 433 4 579 054 0 450
China 6 737 769 12 516 316 3 657 381 1 934 389
South Africa 5 847 194 2 499 282 1 849 588 1551
Source: Industry Canada, trade data online, www.strategis.gc.ca.
8/13/2019 Reality of Trade - The WTO and Developing Countries
http://slidepdf.com/reader/full/reality-of-trade-the-wto-and-developing-countries 32/106
26 The North-South Institute
References
Bhattacharya, Debapriya and Mustafizur Rahman. Experience with Implementation of WTO-ATC and Implications for Bangladesh. Dhaka: Centre for Policy Dialogue , 2000.
Blackburst, Richard, Alice Enders, and Joseph Francois. “The Uruguay Round and Market Access:
Opportunities and Challenges for Developing Countrie s,” in The Uruguay Round and the Developing Economies: A World Bank Conference. Washington, DC: World Bank, 1995.
Buffie, Edward. Trade Policy in Developing Countries. Cambridge:Cambridge University Press, 2001.
Canada Customs and Revenue Agency. Anti-dumping and Countervailing Directorate. http://ccra-adrc.gc.ca/customs/business/sima. Accessed 2001.
Department of Foreign Affairs and International Trade. “Restraint Utilization by Country.” http://dfait-maeci.gc.ca/~eicb/textiles/textiles-e.htm. Annual.
Finger, Michael J., Melinda Ingco, and Ulrich Reincke. The Uruguay Round: Statistics on Tariff
Concessions Given and Received . Washington, DC: The World Bank, 1996.
Finger, Michael J. and Ludger Schuknecht. “Market Access Advances and Retreats: The Uruguay Roundand Beyond,” World Bank Policy Research Working Paper. Washington, DC: World Bank, 1999.
Frankel, J.A. “Assessing the Efficiency Gain from Further Liberalization,” paper delivered at theconference Efficiency, Equity and Legitimacy: The Multilateral Trading System at the Millennium,Harvard University, June 1-2, 2000.
Helleiner, G.K. (ed.) Trade Policy and Industrialisation in Turbulent Times. London: Routledge, 1994.
Henson, Spencer et al. Impact of Sanitary and Phytosanitary Measures on Developing Countries.
Reading: Center for Food Economics Research, University of Reading, 2000.
Hoekman, Bernard, Francis Ng, and Marcello Olarreaga. Tariff Peaks in the Quad and Least DevelopedCountries Exports. Washington, DC: Development Research Group, 2001.
Industry Canada. Trade data online: http://strategis.ic.gc.ca/sc_mrkti/tdst/engdoc/tr_homep.html.
Kim, Han Soo and Ann Weston. “Anti-Dumping Measures and Regional Trade Agreements: AnotherSource of Trade Diversion?”, unpublished paper. Ottawa: The North-South Institute, 1993.
The North-South Institute. Canadian Development Report 2003. Ottawa: The North-South Institute, 2003.
Otsuki, Tsunehiro, John S. Wilson, and Mirvat Sewadeh. “A Race to the Top? A Case Study of FoodSafety Standards and African Exports,” working paper. Washington, DC: World Bank, 2000.
Rodrik, Dani. “Trading in Illusions,” Foreign Policy: March-April, 2001.
Rodrik, Dani. The New Global Economy and the Developing Countries: Making Openness Work .Washington, DC: Overseas Development Council, 1999.
8/13/2019 Reality of Trade - The WTO and Developing Countries
http://slidepdf.com/reader/full/reality-of-trade-the-wto-and-developing-countries 33/106
The Reality of Trade: The WTO and Developing Countries 27
World Bank. Trade Blocs: A World Bank Policy Research Report . Oxford: Oxford University Press,2000.
World Trade Organisation. Market Access: Unfinished Business: Post-Uruguay Round Inventory and Issues. Geneva: WTO Secretariat, 2001.
World Trade Organization. International Trade Statistics. Geneva: WTO Secretariat, 2000a.
World Trade Organization. Trade Policy Review: Canada. Geneva: WTO Secretariat, 2000b.
World Trade Organization. Trade Policy Review: Canada. Geneva: WTO Secretariat, 1998.
8/13/2019 Reality of Trade - The WTO and Developing Countries
http://slidepdf.com/reader/full/reality-of-trade-the-wto-and-developing-countries 34/106
28 The North-South Institute
Chapter 3
The European Union
Stefanie Pfahl
The European Union’s trade policy toward developing countries differs from that of other developedcountries in so far as it has encompassed a set of distinct policies aimed at increasing exports ofdeveloping and least developed countries. However, the EU only grants preferential market access inthose sectors where the competitive advantage of EU producers has not been threatened by increasingimports from developing countries. This policy approach came under pressure in the run-up to the WTOMinisterial Conference in Seattle (1999) where developing countries contributed to the failure of theconference and effectively blocked the EU’s wish to launch a comprehensive round of trade negotiations.Developing countries felt that the economic benefits of past trade liberalization measures did notoutweigh the economic disadvantages. Above all, they pointed to the remaining barriers to markets in
developed countries.
Although the Seattle meeting did not only fail because of the opposition of developing countries, the EU became aware of the need to improve market access and technical capacities of developing countries. TheWTO Ministerial Conference in Doha in November 2001 emphasized the special needs of developingcountries as well as their importance to the WTO by calling the new round of trade liberalization the“Doha Development Agenda.” Yet, it remains to be seen whether this title is mere rhetoric or if this newround of trade negotiations will substantially reduce market access barriers to EU markets in traditionallyclosed, but important sectors such as agriculture. As far as the negotiating agenda is concerned,developing countries were able to secure some concessions regarding the clarification of rules related tointellectual property rights and technical assistance for the implementation of existing and future tradeagreements. To what extent these concessions will support the integration of developing countries into the
international trading system and support sustainable development by facilitating social and environmentalgoals, depends on the support of the Doha Development Agenda by the EU and other developed WTOmembers.
The following chapter starts with a brief overview of the composition and level of trade between the EUand developing countries. The chapter then proceeds with a description of three different trade policiesthe EU designed to improve the access of specific developing countries to the EU market. These are theGeneralized System of Preferences (GSP), the trade arrangements for African, Caribbean, and Pacificcountries (ACP), and the “Everything But Arms” (EBA) initiative for LDCs. The GSP enables developedWTO members to grant developing countries market access beyond the most-favoured nation (MFN)market access rules within the GATT/WTO-system. The ACP trading arrangements grew out of thespecial relationship between the EC/EU members and their former colonies, and the EBA initiative was a
direct reaction to the failure of the Seattle WTO Ministerial and a first concrete step to facilitate improvedmarket access for the poorest countries.
Despite these policies, significant barriers remain. We examine the examples of intellectual propertyrights, trade barriers in the agricultural sector, and non-tariff barriers such as labeling standards. Finally,the chapter briefly addresses the technical assistance the EU grants to developing countries in the contextof international trade, before it concludes with an outline of the future challenges for EU trade policytoward developing countries.
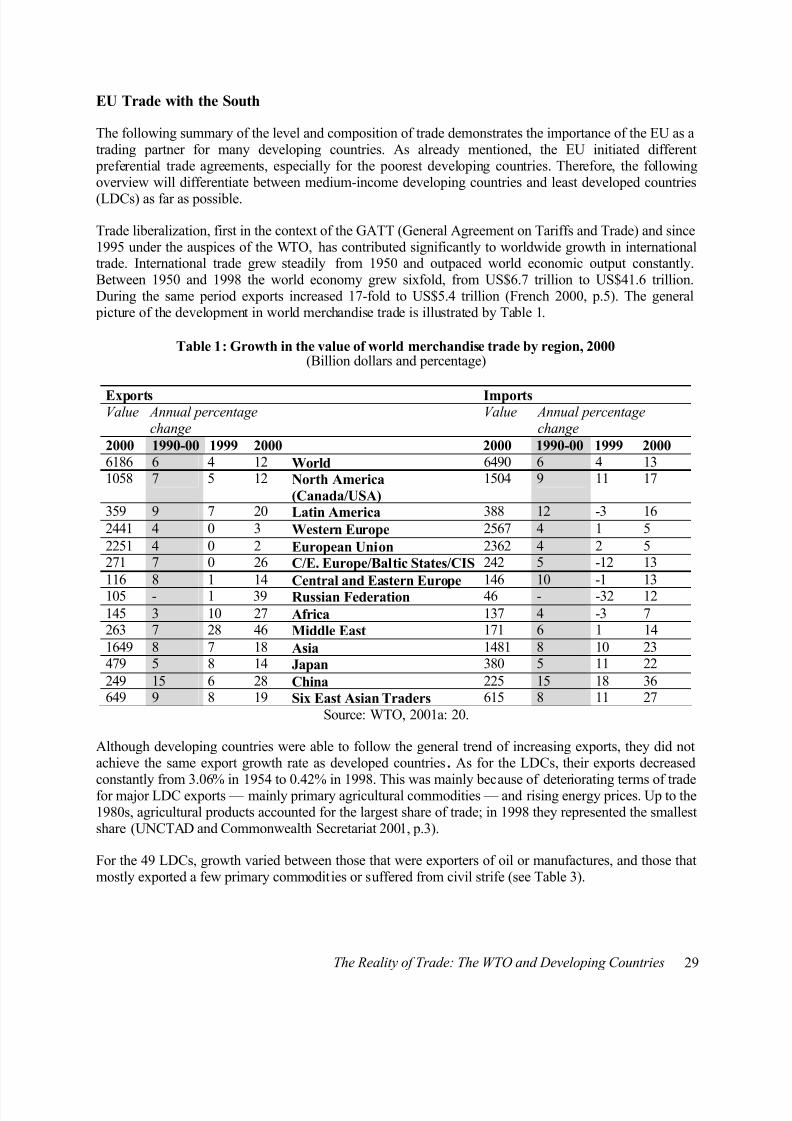
8/13/2019 Reality of Trade - The WTO and Developing Countries
http://slidepdf.com/reader/full/reality-of-trade-the-wto-and-developing-countries 35/106
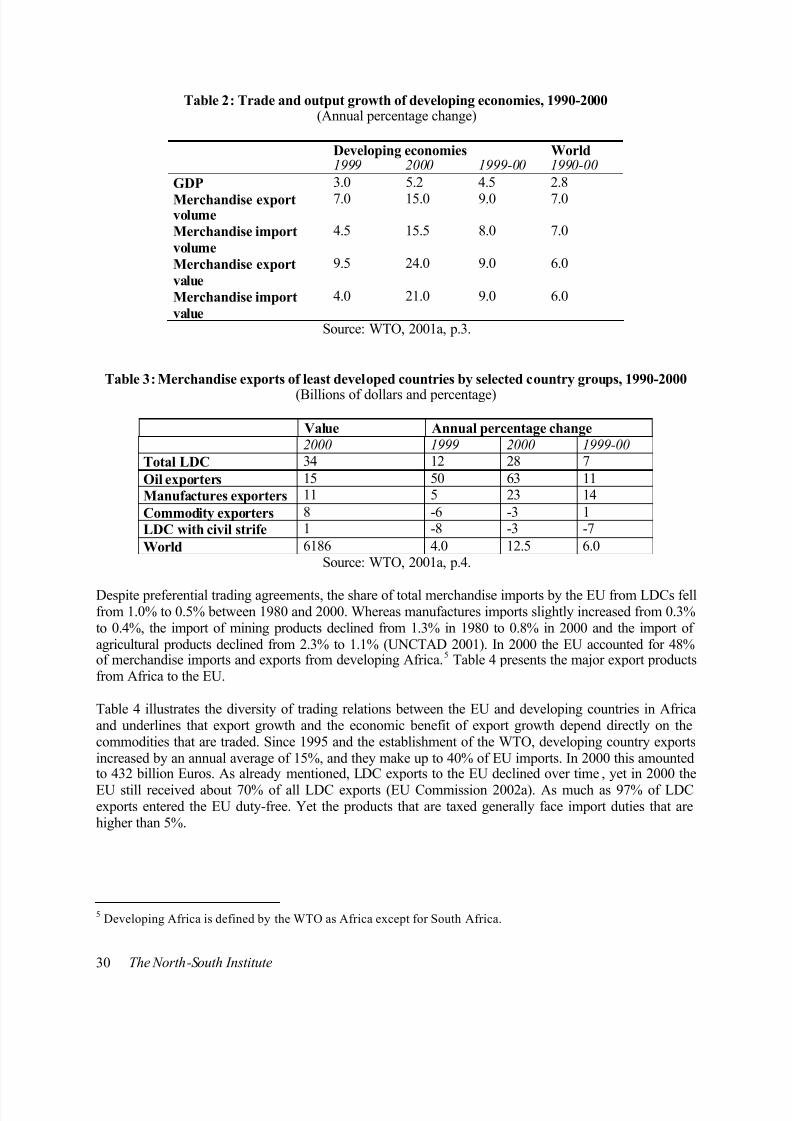
8/13/2019 Reality of Trade - The WTO and Developing Countries
http://slidepdf.com/reader/full/reality-of-trade-the-wto-and-developing-countries 36/106
30 The North-South Institute
Table 2: Trade and output growth of developing economies, 1990-2000(Annual percentage change)
Developing economies World1999 2000 1999-00 1990-00
GDP 3.0 5.2 4.5 2.8
Merchandise exportvolume
7.0 15.0 9.0 7.0
Merchandise import
volume
4.5 15.5 8.0 7.0
Merchandise export
value
9.5 24.0 9.0 6.0
Merchandise import
value
4.0 21.0 9.0 6.0
Source: WTO, 2001a, p.3.
Table 3: Merchandise exports of least developed countries by selected country groups, 1990-2000
(Billions of dollars and percentage)
Value Annual percentage change
2000 1999 2000 1999-00
Total LDC 34 12 28 7
Oil exporters 15 50 63 11
Manufactures exporters 11 5 23 14
Commodity exporters 8 -6 -3 1
LDC with civil strife 1 -8 -3 -7
World 6186 4.0 12.5 6.0Source: WTO, 2001a, p.4.
Despite preferential trading agreements, the share of total merchandise imports by the EU from LDCs fellfrom 1.0% to 0.5% between 1980 and 2000. Whereas manufactures imports slightly increased from 0.3%to 0.4%, the import of mining products declined from 1.3% in 1980 to 0.8% in 2000 and the import ofagricultural products declined from 2.3% to 1.1% (UNCTAD 2001). In 2000 the EU accounted for 48%of merchandise imports and exports from developing Africa.
5 Table 4 presents the major export products
from Africa to the EU.
Table 4 illustrates the diversity of trading relations between the EU and developing countries in Africaand underlines that export growth and the economic benefit of export growth depend directly on thecommodities that are traded. Since 1995 and the establishment of the WTO, developing country exportsincreased by an annual average of 15%, and they make up to 40% of EU imports. In 2000 this amountedto 432 billion Euros. As already mentioned, LDC exports to the EU declined over time , yet in 2000 the
EU still received about 70% of all LDC exports (EU Commission 2002a). As much as 97% of LDCexports entered the EU duty-free. Yet the products that are taxed generally face import duties that arehigher than 5%.
5 Developing Africa is defined by the WTO as Africa except for South Africa.
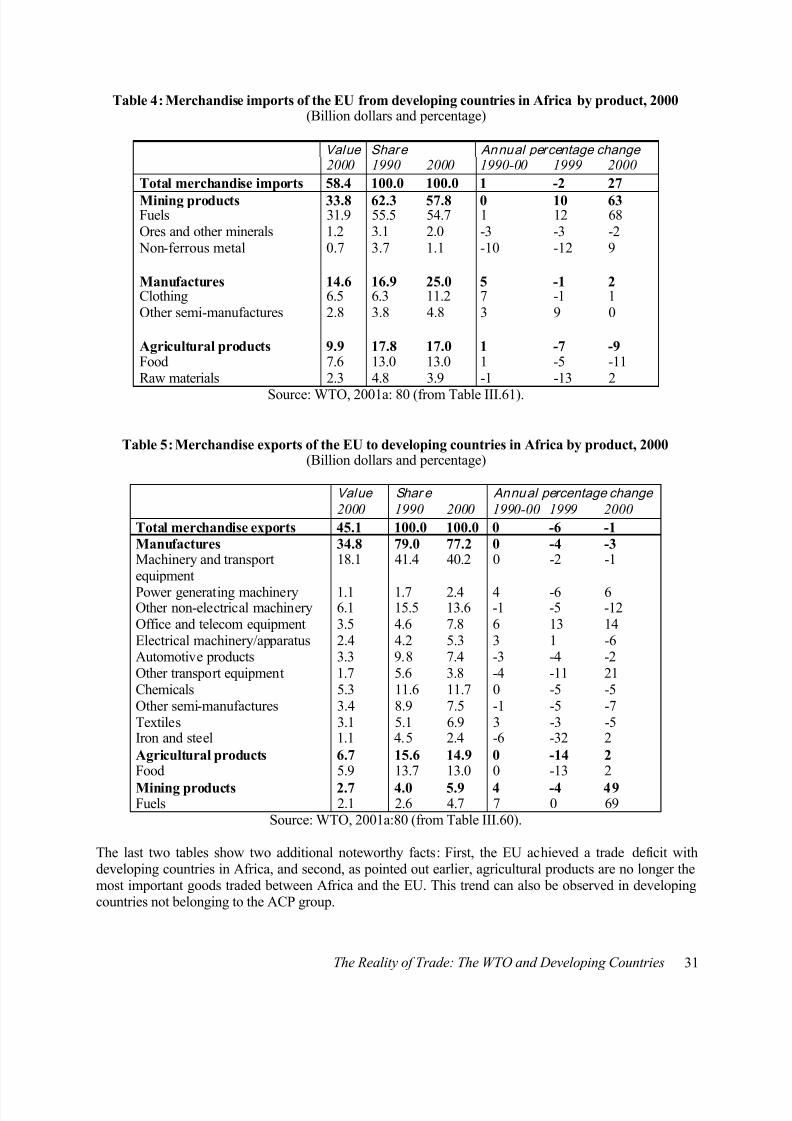
8/13/2019 Reality of Trade - The WTO and Developing Countries
http://slidepdf.com/reader/full/reality-of-trade-the-wto-and-developing-countries 37/106
The Reality of Trade: The WTO and Developing Countries 31
Table 4: Merchandise imports of the EU from developing countries in Africa by product, 2000(Billion dollars and percentage)
Value Share Annual percentage change
2000 1990 2000 1990-00 1999 2000
Total merchandise imports 58.4 100.0 100.0 1 -2 27
Mining products 33.8 62.3 57.8 0 10 63Fuels 31.9 55.5 54.7 1 12 68Ores and other minerals 1.2 3.1 2.0 -3 -3 -2
Non-ferrous metal 0.7 3.7 1.1 -10 -12 9
Manufactures 14.6 16.9 25.0 5 -1 2Clothing 6.5 6.3 11.2 7 -1 1Other semi-manufactures 2.8 3.8 4.8 3 9 0
Agricultural products 9.9 17.8 17.0 1 -7 -9Food 7.6 13.0 13.0 1 -5 -11Raw materials 2.3 4.8 3.9 -1 -13 2
Source: WTO, 2001a: 80 (from Table III.61).
Table 5: Merchandise exports of the EU to developing countries in Africa by product, 2000(Billion dollars and percentage)
Value Shar e Annual percentage change
2000 1990 2000 1990-00 1999 2000
Total merchandise exports 45.1 100.0 100.0 0 -6 -1
Manufactures 34.8 79.0 77.2 0 -4 -3Machinery and transportequipment
18.1 41.4 40.2 0 -2 -1
Power generating machinery 1.1 1.7 2.4 4 -6 6Other non-electrical machinery 6.1 15.5 13.6 -1 -5 -12Office and telecom equipment 3.5 4.6 7.8 6 13 14Electrical machinery/apparatus 2.4 4.2 5.3 3 1 -6Automotive products 3.3 9.8 7.4 -3 -4 -2Other transport equipment 1.7 5.6 3.8 -4 -11 21Chemicals 5.3 11.6 11.7 0 -5 -5Other semi-manufactures 3.4 8.9 7.5 -1 -5 -7Textiles 3.1 5.1 6.9 3 -3 -5Iron and steel 1.1 4.5 2.4 -6 -32 2
Agricultural products 6.7 15.6 14.9 0 -14 2Food 5.9 13.7 13.0 0 -13 2
Mining products 2.7 4.0 5.9 4 -4 49Fuels 2.1 2.6 4.7 7 0 69
Source: WTO, 2001a:80 (from Table III.60).
The last two tables show two additional noteworthy facts: First, the EU achieved a trade deficit withdeveloping countries in Africa, and second, as pointed out earlier, agricultural products are no longer themost important goods traded between Africa and the EU. This trend can also be observed in developingcountries not belonging to the ACP group.
8/13/2019 Reality of Trade - The WTO and Developing Countries
http://slidepdf.com/reader/full/reality-of-trade-the-wto-and-developing-countries 38/106
32 The North-South Institute
Preferential Access
The various schemes of trade preference are a major feature of the EU’s trade policy toward developingcountries. In addition, the EU has negotiated a number of bilateral agreements with specific countries likeSouth Africa or Russia and economic entities like MERCOSUR (the common market for Latin America)and ASEAN (Association of Southeast Asian Nations) that also entail specific preferential trading
arrangements. Thus, the EU’s external trade policy is quite complex and a comprehensive analysis is not possible here. These preferential trading arrangements evolved from international trade policies in theGATT/WTO context (like the GSP) and from development policies targeted at former European colonies(as in the case of the Lomé Agreements with African, Caribbean and Pacific (ACP) countries). In 2000the Lomé Agreement was replaced by the Cotonou Agreement, which yet again significantly changed thetrading relations between the EU and ACP countries, as it moved from a non-reciprocal to a reciprocalapproach.
The different degrees of preference for different groups of developing countries are not always related totheir level of development. Moreover, the tariff levels keep changing according to product groups andquantities and because of the implementation of liberalization agreements during the Uruguay Round(Stevens and Kennan 2000, p.16). The following section will introduce the most important EU
preferential trading schemes for developing countries (i.e., the GSP, the ACP and the “Everything ButArms” (EBA) initiative) in order to give an overview of the context and scope of these arrangements. TheEU has always tried to increase its own economic benefits through trade agreements. Nevertheless, itmust be noted that, so far, it has been the major actor at the nexus of trade and development by removingimport barriers and developing trade agreements with developing country partners that entailed asignificant degree of non-reciprocity (UNCTAD and Commonwealth Secretariat 2001, p.17).
6
Generalized System of Preferences (GSP)
In 1971, the GATT Contracting Parties agreed upon an “enabling clause” that allowed exceptions fromthe MFN principle and provided the basis for countries to grant others even more favourable tradingconditions than those they agreed to within the GATT. The EU implemented its first GSP in 1971, and it
has been renewed annually. After the Uruguay Round, quantitative limitations (tariff quotas on a product/country basis) within the GSP were fully phased out. The EU GSP has been mostly relevant forthose nine LDCs and some developing countries that are not part of the ACP group.
7 Preferences under
the GSP are granted for exports of specific products from individual countries. The GSP preferences aregranted for a given product as a percentage reduction of general MFN rates. The reduction depends on the“sensitivity” of a product (i.e., on the extent to which the product competes with EU products, theeconomic situation of that industry or sector, and competition with the manufacturing sector in the EU).
Products can fall into one out of four categories of sensitivity. Each of the categories applies a different preferential margin (this is called modulation). The four groups are:
• Very sensitive products (preferential margin : 15%)
6 The trading arrangements with ACP countries under the Lomé Agreements are also non-reciprocal. However, since
these agreements violate WTO rules (because they do not cover all developing countries) they required a waivergranted by the WTO members. The new Cotonou Agreement includes reciprocal trading arrangements in the
framework of regional or bilateral economic partnership agreements because most non -ACP WTO memberssignaled that they were not willing to extend the Lomé waiver much longer.7 These LDCs are Yemen, Afghanistan, Bangladesh, Maldives, Nepal, Bhutan, Myanmar, Laos, and Cambodia.
However, with the new “Everything But Arms” (EBA) initiative, the GSP is likely to lose its importance.
8/13/2019 Reality of Trade - The WTO and Developing Countries
http://slidepdf.com/reader/full/reality-of-trade-the-wto-and-developing-countries 39/106
The Reality of Trade: The WTO and Developing Countries 33
• Sensitive products (preferential margin: 30%)
• Semi-sensitive products (preferential margin : 35%)
• Non-sensitive products (duty-free entry)
Countries and products may be “graduated” from these groups as they become more competitive.Examples of sensitive products are rice, bananas, sugar, manioc, and beef. The EU considers these
products sensitive because developing countries are already quite competitive and domestic producersmay come under economic pressure if the EU import regime is further liberalized. Thus, the sensitivesectors can be protected with a two-tier mechanism: variable tariff margins and a discontinuation of
preferences in cases of serious market disruption (EU Commission 1998).
In January 2002, the Commission tabled a proposal for the GSP scheme for 2002-04 to simplify theapplication of the GSP by deleting the sensitive and semi-sensitive categories (Lamy 2001). The proposalalso included additional tariff reductions for countries that comply with international social andenvironmental standards.
8 Similarly, Latin and Central American countries can achieve additional tariff
reductions if they comply with the anti-drug-trafficking arrangements of the Andean Pact. However, the
conditions to qualify for additional preferences based on compliance with specific social, environmental,and anti-drug trade standards are complex and it remains to be seen whether the preferences are incentiveenough for countries to engage in these procedures.
Afri can, Cari bbean, and Pacif ic Countr ies (ACP)
Since 1975, the Lomé Agreements shaped the trading relations between the EU and up to 77 developingcountries (2002), according them better access to the European market. Roughly 94% of total ACPexports, 100% of industrial products, and 80% of agricultural products entered the EU on a duty-free
basis (UNCTAD and Commonwealth Secretariat 2001, p.18). In addition, the agreements also guaranteedexport earnings to a certain extent within the framework of stabilization agreements for raw materials(STABEX) and minerals (SYSMIN). Important exceptions to this favourable treatment are agricultural
products and food products imported by the EU from ACP countries. These are subject to the marketingrules of the Common Agricultural Policy (CAP). Some product categories have low tariff preferences andalso face high tariff peaks once they reach a certain export volume. To buffer the negative economicimpacts of these measures for some exporters, the Lomé Agreements contained four commodity protocolsthat granted some countries access for selected sensitive products (beef, bananas, sugar, and rum). In thecase of beef and sugar the exporters under the protocols benefited from the high prices in the EUCommon Market.
After the fourth Lomé Convention expired in 2000, the ACP agreed to negotiate a post-Lomé regime thatwill be built upon reciprocal trading arrangements. In July 2000, the new Cotonou Agreement wasfinalized as a cooperation agreement that will be in force until 2020. It has been agreed that newreciprocal trading arrangements, within regional or bilateral economic partnership agreements (EPAs)
between the EU and groups of ACP countries or single ACP countries, will be negotiated until 2008. Thecurrent Lomé arrangements are valid until then. Once new EPAs have been agreed, there will be atransitional implementation period of 12 years. During this period the EU will provide financial supportto offset any export losses. One major goal of the Cotonou Agreement is the development of regional
8 Many non-governmental organizations (NGOs) and other critics see these standards as inadequate and not suitableas a real incentive for sustainable development, because the additional tariff concessions are too low to offset the
costs of complying with the additional rules of origin and labeling regulations.
8/13/2019 Reality of Trade - The WTO and Developing Countries
http://slidepdf.com/reader/full/reality-of-trade-the-wto-and-developing-countries 40/106
34 The North-South Institute
economic integration within the ACP regions to stabilize their position in the world market (EUCommission 2001a).
Everything But Arms (EBA)
In March 2001, the European Commission enacted the “Everything But Arms” (EBA) initiative, a
package of trade measures that grants 48 LDCs special access to the EU market for all their products,except arms, by 2009 (EU Commission 2001b). This initiative followed the announcement in June 2000to grant duty-free access for essentially all products from LDCs, at the latest by 2005. The EBA packagecovers products in 919 tariff lines and also includes access for the most sensitive products — sugar, rice,and bananas. However, whereas products such as fruits and vegetables, meat, beverages, and dairy
products are granted full duty- and quota-free access, the most sensitive products will gain this status onlyat a later stage and after several tariff reductions. The principal elements of EBA are:
• Full duty- and quota-free access for all goods except arms;
• Flexible longer phase-in periods for bananas (starting on January 1, 2002, with completion at thelatest on January 1, 2006), sugar (starting on July 1, 2006, with completion at the latest on July 1,
2009), and rice (starting on October 1, 2006, with completion at the latest on October 1, 2009);
• As compensation for possible delays on sugar and rice, the creation of a duty-free quota to ensureincreased market access in an interim period. The quota will be based on the LDCs’ best exportfigures in the 1990s and increased annually by a cumulative growth rate of 15%.
EBA was adopted as an amendment to the existing GSP scheme in order to ensure its compatibility withWTO rules under the GATT/WTO enabling clause. Its functioning is going to be reviewed by the EUCommission in 2005. In the meantime specific safeguard measures enable the EU to suspend the duty-free access of specific products in case of serious market disruptions. For example, the Commissionannounced that whenever LDC imports of rice, sugar, and bananas exceed, or are likely to exceed, the
previous year’s level of imports by more than 25%, it will automatically examine whether the conditions
for applying the safeguard measures are met (EU Commission 2001c).
Summary of Preferential Trading Arrangements
Although the EU grants a number of preferential trading conditions to developing countries, they have not been successful in significantly increasing exports from developing countries. Apart from generallydeteriorating terms of trade for primary products, the main reason for this result is that the preferentialarrangements served only a very small number of developing countries. The preferences in the GSP infact covered only a quarter of the products facing import duties. Only 12 countries benefited from 80% ofthe preferences in the EU’s GSP scheme. Often the margin between general GATT/WTO MFNarrangements and the GSP preferences was too low for exporters to bother to comply with the strict rulesof origin and administrative obstacles (UNCTAD 1998, p.14).
The ACP countries were able neither to expand their exports nor to diversify their range of export products. Only 13 ACP countries export about 70% of all ACP exports to the EU (OECD 1997, p.20).Because most of the trade restrictions in the Lomé Agreements referred to agricultural products and mostACP countries are highly dependent on the export of these products, they were unable to significantlyimprove their export earnings. It remains to be seen whether the EBA scheme will help to improve theirexport record. A modeling exercise undertaken by the United Nations Conference on Trade andDevelopment (UNCTAD) and the Commonwealth Secretariat (2001) showed that such uniform levels of
preference are more beneficial to LDCs than other, more fragmented GSP arrangements.
8/13/2019 Reality of Trade - The WTO and Developing Countries
http://slidepdf.com/reader/full/reality-of-trade-the-wto-and-developing-countries 41/106
The Reality of Trade: The WTO and Developing Countries 35
At the same time, however, the reduction of MFN tariffs on industrial and agricultural products within theWTO framework has eroded tariff preferences. In general, with the implementation of the UruguayRound agreements, the preferences granted by the EU decreased by 26%; for non-tropical agricultural
products, they decreased by 29% (OECD 1997). Moreover, as general tariff levels are already quite low,especially for LDCs, the erosion of trade preferences is hardly significant, especially since only a small
number of countries actually benefited from tariff preferences.
Main Trade Barriers
Tariffs are no longer the most significant barriers to increasing the exports of developing countries andtheir integration into the world trading system. Developing countries’ access to the markets ofindustrialized countries remains restricted, despite wide-ranging tariff reductions under the UruguayRound. Apart from delays in and incomplete implementation of relevant arrangements in sectors such astextiles and agricultural products, their exports have been impeded increasingly by non-tariff barriers,technical standards, and complex administrative procedures related among other things to national healthand safety norms. These became more comprehensive as trade in specific products became more open.
For example in March 2002, textile exporters such as Hong Kong, China, India, Egypt, Brazil,Bangladesh, and Guatemala pointed out that after seven years, developing countries have seen only a fewquotas removed on their textile and clothing exports, despite the WTO Agreement on Textiles andClothing, while new restrictions such as anti-dumping measures have been imposed (Bridges 2002).
Although the failure of the Seattle Ministerial Conference in 1999 was not only attributable to developingcountry opposition, this was a major factor, and by naming the trade negotiations launched in November2001 in Doha the “Doha Development Agenda,” the industrialized WTO members acknowledged thatthey have to take the concerns of developing countries increasingly into account.
9 Developing countries
finally agreed to a new round of trade negotiations despite remaining united in their scepticism about the potential benefits of the Doha Development Agenda. The EU pushed through a number of subjects —such as investment, competition policies, and trade and environment issues — which developing
countries strongly opposed. There had been allegations that countries were threatened that futuredevelopment aid might be withheld in case they did not agree to a new round of trade negotiations.
10 Yet,
many countries were also quite aware of the potential dangers associated with another failure of theMinisterial Conference. A failure would have weakened the WTO significantly. Developing countries are
probably more dependent on a functioning WTO and its enforcement of trade agreements than powerfulindustrialized countries or the EU. Moreover, the WTO provides them with a framework where they cantry to negotiate generally better market access conditions than they would be able to negotiate on a
bilateral basis.
9
As this article does not provide space for a detailed analysis of the Seattle and Doha WTO MinisterialConferences, it should be mentioned that Seattle failed mostly because the industrialized countries were unable toagree on common goals for future trade negotiations. The massive protests by civil society groups reinforced the
reservations voiced by many WTO members about the goals and impacts of further trade liberalization. Thesereservations were only partly resolved in the run-up to Doha and the agreement to launch a new comprehensiveround of trade negotiations can be attributed to changes in the economic and political environment. Apart from the
US, most WTO members suffered from economic stagnation, and after the terrorist attacks of September 11, 2001and subsequent fears of a major world wide economic recession, further trade liberalization was seen as essential.10 Martin Khor. [E-mail message to NGOs.] Third World Network after Doha. November 19, 2001 (on file with the
author).
8/13/2019 Reality of Trade - The WTO and Developing Countries
http://slidepdf.com/reader/full/reality-of-trade-the-wto-and-developing-countries 42/106
36 The North-South Institute
Because space is limited, a few examples will be highlighted, focusing on the main barriers of the EU tothe exports by developing countries in the agricultural sector, intellectual property rights, and somespecific non-tariff barriers related to health and environmental issues.
Agriculture
European trade restrictions in the agricultural sector are one of the most contentious issues in the WTO aswell as in regional and bilateral trade relations, despite the fact that the importance of this sector for theEU has decreased in the last thirty years. Yet, the EU justifies its restrictions by arguing that it needs tosupport its farmers for social, cultural, and environmental reasons. According to the EU, agriculture
performs a multifunctional role by providing food, preservation, management, and enhancement of therural landscape, protection of the environment, including protection against natural hazards, andenhancement of the viability of rural areas (EU Commission 2001d, p.17). Many developing countries in
principle support the argument of basing import restrictions on the multifunctional role of agriculture. Intheir case, they stress the need to resort to trade restrictions to ensure food security and protect local foodcrops. At the same time, they want to be able to restrict imports not least to prevent the EU from dumpingsubsidized surplus production onto their markets, destroying local production structures, and putting local
producers out of business (Einarsson 2000).
The current structure of international trade in agricultural products is an example of a highly complex andnon-transparent system that evolved from the WTO Agreement on Agriculture. Although the Agreementaimed to transform quantitative restrictions into a more transparent and open tariff-based system, thespecific rules still allow countries to effectively protect their agricultural producers. First, the method of
prescribing appropriate tariff levels for products that were formerly protected by quantitative restrictionsled to prohibitively high tariffs, as many countries reported equivalents unrelated to the protective effectsof those restrictions. In the case of the EU, it had been assumed that this “dirty tariffication” led to tariffequivalents that were 60% higher than the actual protection of former quantitative restrictions (Andersonet al. 1999, p.9). Moreover, despite the fact that the EU had to reduce its tariffs on average by 36%
between 1986 and 2000, it could retain high tariff levels for sensitive products by spreading tariffreductions unevenly, according to the sensitivity of the products. For example it is possible to lower the
tariff of three products from 100% by 15% and still arrive at a general tariff reduction of 36%, if a tariffof, say 4% on a fourth product is abolished completely (i.e., reduced by 100%) (Fritz 2000, p.9).
To soften the impact of the high tariff equivalents, it is possible to grant a fixed minimum access forspecific products on a preferential tariff basis. In addition to these preferential tariffs, it is possible to basetariffs on the monetary value of goods, or on a specific amount or volume of a specific good, or thesemethods can both be applied at the same time. In addition, the Agreement on Agriculture provides specialsafeguard measures allowing additional tariffs if imports of a specific product exceed a specific quantityor undermine domestic prices. This complex system also foresees tariff peaks (additional tariffs on
products that have a relatively high import rate, exceed minimum access quotas, and reduce price levels).For example, the EU applies 96.8% of its tariff peaks on agricultural and fishing products (UNCTAD1999). And lastly, tariff escalation (i.e., tariffs that increase with the manufacturing process) remains a
significant barrier. In the EU, the average tariff escalation between raw and manufactured goods lies atabout 17% (Lindland 1997, p.14).
Apart from this non-transparent tariff system and high tariffs, the main problem of European agriculturaltrade policy is the subsidies to European producers, which come in a variety of forms, such as directincome support and export subsidies (compensating for price differences on the world market). In recentyears, more and more support to European agricultural producers was granted within the framework of“green box measures” that were explicitly exempted from the phase-out of support measures by theAgreement on Agriculture. Such measures include, for example, subsidies for environmental protection,
8/13/2019 Reality of Trade - The WTO and Developing Countries
http://slidepdf.com/reader/full/reality-of-trade-the-wto-and-developing-countries 43/106
The Reality of Trade: The WTO and Developing Countries 37
rural development, and animal welfare. In Doha, the EU agreed for the first time to “substantialimprovements in access; reduction of, with a view to phasing out, all forms of export subsidies; andsubstantial reductions in trade-distorting domestic support” (WTO 2001b, p.3). Thus, if developingcountries are able to keep up their coordinated approach to the negotiation, they might achieveconsiderable concessions within the Doha Development Agenda from the EU.
Non-Product Related Non-Tari ff Barr iers
In recent years, the relationship between social and environmental standards addressing processes and production methods (PPMs) and WTO rules has been a cause for concern in developing countries, asthese standards can impede the access of their products to the markets of developed countries. Unilateraltechnical standards addressing the social and environmental impacts of the processes and productionmethods, rather than the product itself, create very high obstacles to market entry for many developingcountries. For example, they are either not aware of the environmental impacts of specific production
processes, such as toxic feedstock agents involved in the production of flexible foams or other plastic products, or lack the financial and technical resources for more environmentally benign productionmethods. This problem became particularly evident in the case of eco-labeling which can have
protectionist impacts, especially when exporters cannot participate in the development of specific labeling
criteria (Appleton 1999).
However, in the run-up to the Doha WTO Ministerial Conference, the EU was pushing for clarification ofthe relationship between environmental labeling schemes and WTO rules, with a view to confirming themas a legitimate instrument to satisfy consumer concerns. Since the EU was successful in including theenvironment and eco-labeling in the Doha Development Agenda, the WTO Committee on Trade andEnvironment (CTE) has been forced to address this issue. Since the negotiations on how to treat non-
product-related environmental processes and production methods are a cross-cutting issue that also affectsthe existing Agreement on Technical Barriers to Trade (TBT) and the Agreement on Sanitary andPhytosanitary Measures (SPS), these negotiations will be conducted in the respective negotiation bodiesand not the CTE. The question for the WTO in this context is whether two products, both of which areindistinguishable as end products, can be treated differently if their processes and production methods are
different.
In the absence of direction from earlier discussions in the CTE on the issue, WTO dispute panels havehad to develop their own tests on a case-by-case basis. The results have not been helpful. Various criteriahave been developed and applied, which affirm that “like” is not “identical.”
11 However, it remains
ambiguous as to whether PPM distinctions on the basis of multilateral environmental agreements (MEAs)are permissible. A recent WTO decision on Article III, concerning European import restrictions forasbestos-containing products,
12 broadened the concept of “likeness” by ruling that it is appropriate to take
account of health risks in determining “likeness.” The Appellate Body also affirmed that “the extent towhich consumers are — or would be — willing to choose one product instead of another to perform” thesame end-uses is highly relevant evidence in assessing “likeness” (Tarasofsky and Pfahl 2001).
The issue will not be fully resolved until Article III is broadened to permit processes and productionmethods, at the very least those derived from MEAs. This can only happen in a political negotiation andnot in the context of a particular dispute. Such negotiations are likely to be extremely contentious as
11 See, for example, Japan — Taxes on Alcoholic Beverages; Spain — Tariff Treatment of Unroasted Coffee, 28
th
Supp. BISD 102 (1982, Japan — Customs Duties, Taxes and Labelling Practices on Imported Wines and AlcoholicBeverages, 34th Supp. BISD 83 (1988), Belgian Family Allowances (Allocations Familiales), GATT, 1st Supp. BISD59-62, 1953.12 European Communities — Measures Affecting Asbestos and Asbestos -containing Products
8/13/2019 Reality of Trade - The WTO and Developing Countries
http://slidepdf.com/reader/full/reality-of-trade-the-wto-and-developing-countries 44/106
38 The North-South Institute
developing countries have justified concerns that this will impede their exports by creating additionaltechnical requirements and requiring investments in modernizing their production processes. They arealso concerned that the labeling processes remain non-transparent and that developed countries do not
provide them with the technology necessary to achieve these standards (CUTS 1999).
Outlook
This brief overview of EU trade policy toward developing countries illustrated that on the one hand, theEU introduced a number of specific development-oriented trade policies. On the other hand, the EU —mostly within the scope of WTO rules — effectively protected its domestic markets where developingcountries had a significant competitive advantage over European producers. This ambivalent policy meantthat the EU had to provide more incentives to developing countries in order to gain their support for anew and comprehensive round of WTO trade negotiations. The experience with the implementation of theUruguay Round since 1995 has not been positive for developing countries. Therefore, they are reluctantto agree to new trade agreements. To gain their support, the EU and other developed country WTOmembers were willing to grant developing countries some trade-related concessions that culminated in afairly detailed program for technical assistance.
As the Doha Ministerial Conference demonstrated, there are deep divisions and frictions betweendeveloped and developing WTO members about the scope and pace of further trade liberalization.
Nevertheless, the future of the WTO is likely to depend directly on the success of this program.Subsequently, the EU Commission, especially the Directorate General for Development, must take carethat the development-oriented goals of the program will not again be pushed aside by the overriding goalof trade liberalization and opening markets in developing countries. Rather than merely focusing ontechnical, implementation-related assistance, the EU and other industrialized WTO members must linktheir assistance to the goal of spreading the economic benefits of trade liberalization more equally acrossdeveloping country societies and balance economic goals with social and environmental aspects to enablemore sustainable trade reforms. This, however, can only be achieved if the EU and other developed WTOmembers complement their technical assistance with the effective phase-out of production subsidies, non-transparent tariff structures, technical standards, and other market access barriers.
References
Anderson, K. and M. Ingco. “Integrating Agriculture into the WTO: The next phase.” WTO/World Bankconference Developing Countries in a Millennium Round , Geneva, September 20-21, 1999.
Appleton, Arthur E. “Environmental Labelling Schemes: WTO Law and Developing CountryImplications,” in Gary P. Sampson and W. Bradnee Chambers (eds.), Trade, Environment, and the
Millennium. Tokyo, New York, Paris: United Nations University Press, 1999, pp. 195-222.
Bridges Weekly Trade News Digest. “CTG Discusses Trade In Hazardous Materials, Waivers And
Textiles,” March 26, 2002.
CUTS. Trade and the Environment — An Agenda for Developing Countries. Briefing Paper No. 2/1999.Jaipur: CUTS, 1999.
Einarsson, Peter. Agricultural Trade Policy as if food security and ecological sustainability mattered Review and analysis of alternative proposals for the renegotiation of the WTO Agreement on Agriculture.Stockholm: Church of Sweden, Forum Syd, 2000.
8/13/2019 Reality of Trade - The WTO and Developing Countries
http://slidepdf.com/reader/full/reality-of-trade-the-wto-and-developing-countries 45/106
8/13/2019 Reality of Trade - The WTO and Developing Countries
http://slidepdf.com/reader/full/reality-of-trade-the-wto-and-developing-countries 46/106
40 The North-South Institute
WTO. International Trade Statistics 2000. Geneva: WTO, 2001a.
WTO. Ministerial Declaration. Adopted on November 14, 2001. WT/MIN (01)/DEC/1 (20 November2001). Geneva: WTO, 2001b.
8/13/2019 Reality of Trade - The WTO and Developing Countries
http://slidepdf.com/reader/full/reality-of-trade-the-wto-and-developing-countries 47/106
The Reality of Trade: The WTO and Developing Countries 41
Chapter 4
Japan
Hiromi Ohki and Shuichiro Nishioka
Developing countries are increasingly important trade partners for Japan. The share of Japanese exports tothe developing world rose from 41.3% in 1990 to 49.1% in 2000. Over the same period, the developingworld’s share of imports entering Japan rose from 49.6% to 60.9% (Charts 1 and 2). East Asia occupies a
prominent place within this North-South trade. Over the last 10 years, imports from East Asia climbedfrom 28.9% to 42.1%. Trade with East Asia, and particularly China, has powered the expansion ofJapan’s trade with developing countries since the end of the Uruguay Round.
The United States is still Japan’s biggest trading partner, but between 1990 and 2000 its share of exports
to Japan fell from 31.7% to 30.2% and its share of imports from Japan slipped from 22.5% to 19.2%(Table 1). Meanwhile, imports from East Asia have been growing rapidly, particularly from China, whoseshare was only 5.1% in 1990 but climbed to 10.7% in 1995 and 14.6% in 2000 (Table 2). The increase inimports from China resulted mainly from trade in manufactured goods, as their share of Japan’s purchasesfrom China rose from 50.8% in 1990 to 82.0% in 2000 (Chart 3). Manufactured imports from China werevalued at $45.7 billion in 1990, which exceeded the European Union and was second only to the UnitedStates (Chart 4). The rise was fuelled by imports of Chinese-made clothing as well as of goods produced
by Japanese manufacturers in China and by Chinese companies under contract. The latter two trends havesparked a sharp rise in imports of machinery products, such as consumer electronics and computer-relatedequipment. China is now a leading supplier to Japan in manufactured products such as color televisionsets, refrigerators, washing machines, vacuum cleaners, and irons.
Japan’s major import since the 1960s has been crude and partially refined oil, but manufactured productshave accounted for increasingly large shares since 1990. Automobiles and office equipment (includingcomputers) entered the top-10 product ranking in 1990, followed by electronic parts and devices,clothing, audio and video equipment, and optical equipment (Table 3). Reflecting the appreciation of theyen and the shift to offshore production by Japanese manufacturers in the wake of the 1985 Plaza Accord,the structure of Japan’s trade has shifted sharply. Previously, Japan imported raw materials from thedeveloping world and exported manufactured products, but now goods such as computers and clothingare manufactured in East Asia and imported into Japan. Much of the growth in imports from East Asiahas been because of offshore production by Japanese companies, an outgrowth of expanded directinvestment, and an important reminder of the links between international trade and investment.
Barriers to Trade and Preferential Access
The Uruguay Round (UR) resulted in tariff reductions on an unprecedented scale in Japan. In all,approximately 11,000 tariffs were revised. As a result, customs duties as a percentage of total importvalue fell from 3.4% in fiscal 1994 to 2.4% in fiscal 1999. Japan’s final average bound tariff rate declinedto 1.5%, much lower than the rates in the United States (3.5%), the EU (3.6%), and Canada (4.8%) (Table5). However, tariffs remain high for certain developing countries’ exports. The remaining barriers, tariff
peaks above 15%, are in textiles, footwear, and, most importantly, the agricultural sector. The post-
8/13/2019 Reality of Trade - The WTO and Developing Countries
http://slidepdf.com/reader/full/reality-of-trade-the-wto-and-developing-countries 48/106
42 The North-South Institute
Uruguay Round rate on agricultural imports from developing countries, even though it was reduced by26.7 points, remains at 42% (Finger, Ingco and Reincke 1996, p.32).
The Uruguay Round negotiations on agriculture focused on three elements: market access (bordermeasures), domestic support, and export competition. In market access, it was agreed that quotas would
be replaced with tariffs (a process called “tariffication”) and that tariff levels would be decreased on
average by at least 36% (and by at least 15% for each product) over a six-year period (1995-2000). Aspecial provision allows countries to defer “tariffication” for six years for some agricultural products, ifthe following conditions apply: (1) that the import volume for 1986-88 was less than 3% of domesticconsumption, (2) that no export subsidies were provided, and (3) that effective measures were taken torestrict production. In such cases, it is required that the level of minimum access opportunities be at least4% initially, rising to 8% at the end of the six-year period. In Japan’s case, this special provision wasapplied to rice, but tariffication was subsequently applied.
With respect to items on which import restraints were applied (wheat, barley, dairy products, starch, peasand beans, peanuts, konnyaku tubers, raw silk and silk cocoons, and pork), tariffs were raised in principleto a level corresponding to the difference between the domestic and foreign prices. A tariff quota systemwas introduced to apply tariffs at existing levels for amounts up to the previous volume of imports,
thereby maintaining existing access opportunities. The number of Japanese import restrictions had beensharply reduced with respect to agricultural products in the 1960s, so by 1974 the number of remainingitems was 22. Japan-US talks on beef and oranges in 1988, as well as other negotiations, led to partiallifting of these residual restrictions. Twelve import-restriction products remained in 1992, but theUruguay Round liberalized these as well through tariffication.
Japan offers two preferential tariff regimes to developing countries. The Generalized System ofPreferences (GSP), which offers duty-free access for imports from 162 developing countries, excludes anumber of agricultural products and some manufactured goods such as apparel and footwear (WTO2000). This regime gives, on average, a 48% preference to imports from developing countries (Hoekman,
Ng and Olarreaga 2001). Japan’s GSP system was enacted under a revision of the Temporary TariffMeasures Law in 1971 and was extended twice, in 1981 and 1991. It was due to expire on March 21,
2001, but a revision of the law in fiscal 2001 provided another 10-year extension. Except for China, arelatively small share of imports from beneficiaries receive GSP benefits (Table 4). In 1999, only 8.5% ofall imports from GSP eligible countries benefited from this preferential access.
The other Japanese preferential regime is for Least-Developed Countries (LDCs) and offers their exportsto Japan a 60% preference over imports from industrial countries, on average. The provisions of the 2001revision include new preferential tariffs for LDCs. The revision establishes preferential treatment for1,085 products, including 75 agricultural and fishery products. Japan’s Customs Tariff Council stated:“While noting progress of the new round of negotiations under the World Trade Organization and alsoconsidering the impact on domestic industries, Japan should enhance its preferential treatment of LDCimports by greatly expanding the list of such products.”
Safeguards and Antidumping Measur es
In the past, safeguard measures (import restraints in case of emergency such as import surges) and anti-dumping measures were virtually always directed at Japan by other countries. But in recent years, somedomestic Japanese industries have called for the imposition of safeguard restraints or anti-dumpingmeasures in regard to imports of textiles and agricultural products.
On April 23, 2001, Japan imposed provisional safeguard measures on three imports from China: leeks,fresh shiitake mushrooms, and rush mats for tatami flooring. Previously the Japanese government had
8/13/2019 Reality of Trade - The WTO and Developing Countries
http://slidepdf.com/reader/full/reality-of-trade-the-wto-and-developing-countries 49/106
The Reality of Trade: The WTO and Developing Countries 43
twice conducted investigations concerning the imposition of safeguards on textile imports, in 1995 and1996, but the restraints were not implemented. It had imposed special safeguard restraints on porkimports, but it had never implemented general safeguards. On June 22, China retaliated by imposing100% special tariffs on air conditioners, cellular phones, and automobiles. On December 21, the Japaneseand Chinese governments reached an agreement under which Japan refrained from formal imposition ofgeneral safeguards against these three items and China removed its special tariffs; the two governments
exchanged a memorandum under which they agreed to work to promote trade in an orderly fashion.
Antidumping measures are not a significant barrier to the Japanese market. As of the end of 1999, theUnited States was imposing 333 anti-dumping measures, the EU 192, South Africa 96, and Mexico 80.Japan, however, had only two anti-dumping tariffs. Japan conducted its first formal anti-dumpinginvestigation in 1991 with respect to imports of ferrosilicon manganese from China, South Africa, and
Norway. It was found that Chinese exporters were dumping and that this was causing losses for Japanesemanufacturers, so an anti-dumping levy was imposed in 1993. In another anti-dumping case, which beganin 1993, it was found that Pakistani cotton yarn was being dumped in Japan and causing losses fordomestic companies, so an anti-dumping levy was imposed in 1995. An anti-dumping case was also
brought against certain imports of polyester staple fibre from South Korea and Taiwan. Japan and manydeveloping countries have been pushing for anti-dumping measures to be taken up in the next round of
WTO negotiations, hoping to deal with the vagueness of the existing multilateral agreement and eliminatethe arbitrary application of anti-dumping measures. The goal is to impose firmer discipline and achievegreater clarity of use.
Friction with China Over Protection of Intellectual Property
The Uruguay Round also resulted in the conclusion of an Agreement on Trade-Related Aspects ofIntellectual Property Rights (TRIPS). The TRIPS Agreement applies to copyrights and related rights,trademarks, industrial designs, patents, trade secrets, layout designs of integrated circuits, and other formsof intellectual property produced through creative intellectual activity. It has broadened the scope andstrengthened the protections provided under earlier international agreements, such as the Paris
Convention for the Protection of Industrial Property and the Berne Convention for the Protection ofLiterary and Artistic Works, and it requires strict compliance by all WTO member countries and regions.It also enhances the protection of such property with further provisions including “national treatment”(non-discrimination between domestic and foreign holders of rights), most-favoured-nation treatment(application of preferential treatment granted to third countries), application of WTO dispute settlementmechanisms, and arrangements for the exercise of rights within countries.
On December 11, 2001, China officially joined the WTO. The Chinese government promised that itwould abide by the TRIPS Agreement from the date of its WTO accession, but there were variousoutstanding problems, such as illegal copying of trademarks and copyright violations, including the
particularly serious problem of counterfeit goods. According to a 1996 survey by Japan’s Patent Office,Japanese-affiliated companies had suffered 197.4 billion yen in damages from imitations worldwide, of
which China accounted for 34%. Counterfeit products made in China cover a wide variety of goods,including automobile parts, motorcycles, pharmaceuticals, and electrical goods. They extend to virtuallyevery type of intellectual property, including trademarks, registered designs, and patents. These include:the use of brands like “Hongda” to imitate the Honda logo on motorcycles; production of items virtuallyidentical to Japanese products in appearance and design; and unauthorized use of production technologies
patented by Japanese companies. The injury has extended to other countries through the export ofimitation goods from China to places such as Viet Nam and Indonesia. According to a recent survey ofJapanese affiliates in China conducted by Japan’s Ministry of Economy, Trade, and Industry and JETRO,Beijing, 54% of the 672 responding companies have suffered from imitations; 11% of the respondents
8/13/2019 Reality of Trade - The WTO and Developing Countries
http://slidepdf.com/reader/full/reality-of-trade-the-wto-and-developing-countries 50/106
44 The North-South Institute
reported that their damages during the year 2000 exceeded 1 billion yen. Some of the characteristics ofthe Chinese imitations are as follows: their quality is so high that they are virtually indistinguishable fromthe originals; the plants producing the imitations are small and numerous, and they are generally in
provincial locations, such as Guangdong; there are speedy manufacturing and sales systems that allowimitations of new and popular products to be sold very soon after the originals go on the market; andexports of imitations, especially motorcycles, are growing fast.
When Indonesia lowered its tariffs and eased other controls on imports of motorcycles, imports fromChina rose sharply. Imports of motorcycles in 2000 reached a record high of 173,834 units, mostly fromChina. Chinese motorcycles are extremely similar in appearance to Japanese models, and they arecompetitively priced, so their market share rose to 17%. But some of their parts infringe on patents held
by Japanese companies, so in July 2001 imports of Chinese motorcycles were halted under an agreementon patent violations reached between three importers and a Japanese manufacturer. In January 2001,Indonesia implemented three laws to protect intellectual property in terms of industrial designs, layoutdesigns of Integrated Circuits (ICs), and trade secrets. In June of the same year, the government startedaccepting applications for registration of industrial designs, thus enabling Japanese manufacturers to
protect themselves from counterfeit products from China.
Japan’s Trade-Related Technical Cooperation
Japanese technical cooperation carried out in connection with trade mainly takes the form of promotingimports from developing countries. The institution that implements this cooperation is the Japan ExternalTrade Organization (JETRO), a public-sector organization under the Ministry of Economy, Trade, andIndustry. JETRO was originally established in the 1950s to promote Japanese exports. Over the years,however, JETRO has adapted to the changing international economic situation by launching otheractivities, including the promotion of outward and inward investment, international cooperation betweenindustries, and import promotion. JETRO focuses its technical cooperation on investment and trade, withthe aim of promoting developing countries’ exports to Japan. Activities are aimed specifically at fosteringhuman resources, export industries, and supplier (“supporting”) industries. The activities reflect JETRO’s
understanding of the needs of developing countries, which the organization has acquired through itsnetwork of 80 offices around the world. The scope includes private-sector activities, such as technologicalguidance for foreign companies, support for companies that wish to export to Japan, and technical supportthrough direct investment by Japanese companies. Support is also provided through actual business, suchas trade fairs and “reverse exhibitions
13.”
JETRO began promoting exports to Japan in 1979, supporting export-promotion missions by arrangingmeetings and providing information. It has extended such operations to include the hosting of researcherswho visit Japan to study how to approach the market with particular products. JETRO also conductsstudies on market demand, distribution channels, and other matters for items that developing countries areinterested in exporting. In the 1990s, JETRO began to hold exhibitions of developing countries’ productsin Japan. These included exhibitions of product samples found by JETRO-dispatched specialists,
exhibitions of countries’ representative products, and trade fairs promoting international economic andtechnical cooperation. JETRO also started dispatching missions to promote exports to Japan, such asmissions of Japanese importers and buyers, and dispatching Japanese marketers and trade-systemspecialists to developing countries to look for products with potential for import into Japan, as well aseconomic policy experts to support the implementation of economic reforms.
13 Japanese companies display samples of products they wish to procure from local suppliers overseas.
8/13/2019 Reality of Trade - The WTO and Developing Countries
http://slidepdf.com/reader/full/reality-of-trade-the-wto-and-developing-countries 51/106
The Reality of Trade: The WTO and Developing Countries 45
In financial terms, the amount of Japan’s official development assistance that is directed at the promotionof developing-country trade and investment is not that large, accounting for only 0.4% of Japan’s totalODA budget and 1.5% of its appropriations for technical cooperation. In fiscal 1999, however, even asthe total ODA budget was being cut, this amount was increased by 11.4% from the previous year to 5,533million yen, and in fiscal 2000 it grew by another 2.5% to 5,669 million yen (Table 6).
In March 2001, following the Group of Eight summit held in Okinawa the preceding July, Japan hostedthe Okinawa Workshop on Trade-Related Capacity Building in conjunction with the WTO, the United
Nations Development Program (UNDP), and the Development Assistance Committee of the Organisationfor Economic Co-operation and Development (OECD). Participants included trade and foreign aidofficials from industrial countries, developing countries, and international institutions. The workshopserved as a forum for an exchange of views on how developing countries can implement and strengthenrelated activities. At the end of the Asia-Pacific Economic Cooperation trade ministers’ meeting in Juneof that same year, the official statement declared that WTO negotiations should reflect developingcountries’ interests and concerns and that continued emphasis should be placed on human resourcedevelopment.
Future Issues
The point of view of the Japanese private sector on the new WTO round of negotiations and developingcountries was presented in Keidanren’s (Japan Federation of Economic Organizations) proposal entitled“Challenges for the Upcoming WTO Negotiations and Agendas for Future Japanese Trade Policy” inMay 1999. This document contains several key recommendations concerning developing countries. First,developing countries still impose high tariffs on a wide range of products, obstructing exports of productsin areas where Japanese companies are highly competitive, such as transportation equipment, constructionequipment, electrical machinery, steel, and chemicals. These high tariff rates should be reducedsubstantially. A relatively high proportion of developing countries’ tariffs are not “bound”— meaning thatthe countries can raise tariff rates on many products. Sudden tariff hikes have obstructed many Japanese
exports, so the private sector would like Japan to work toward more tariff bindings, in order to increase predictability. At the same time, however, consideration must be given to the economic conditions andstage of development of individual countries when seeking to reduce or eliminate tariff barriers; sufficienttime frames should be allowed for the implementation of tariff cuts.
Second, counterfeit products and patent systems that do not conform to international norms haveadversely affected the intellectual property rights of Japanese companies. In the next round of multilateraltrade negotiations, the private sector would like to see the Japanese government take the initiative tostrengthen intellectual property rights protection in developing countries and to standardize international
patent systems. Keidanren suggests that the Japanese government increase its level of cooperation in building appropriate intellectual property systems and in training the necessary personnel. Theorganization claims that strengthening intellectual property rights protection in developing countries will
also benefit developing countries themselves by promoting the transfer of technology from industrialcountries.
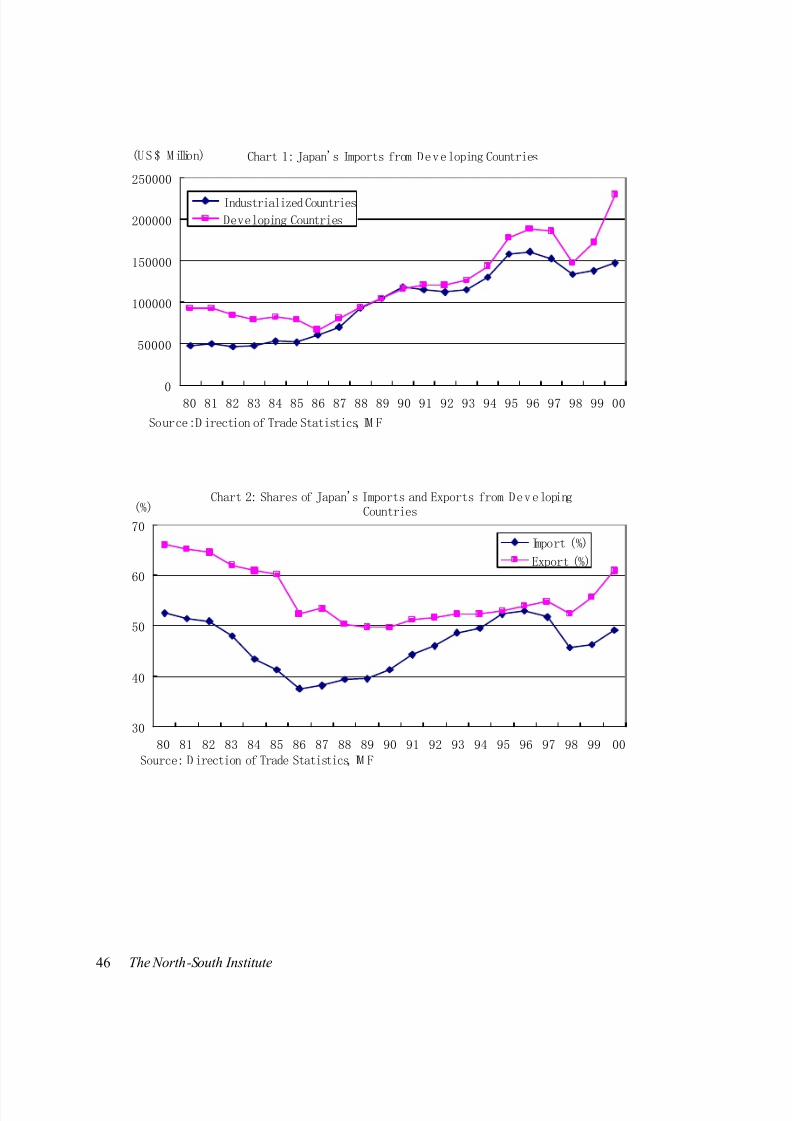
8/13/2019 Reality of Trade - The WTO and Developing Countries
http://slidepdf.com/reader/full/reality-of-trade-the-wto-and-developing-countries 52/106
46 The North-South Institute
Chart 1: Japan's Imports from Developing Countries
0
50000
100000
150000
200000
250000
80 81 82 83 84 85 86 87 88 89 90 91 92 93 94 95 96 97 98 99 00
(US$ Million)
Industrialized Countries
Developing Countries
Source:D irection of Trade Statistics, IM F
Chart 2: Shares of Japan's Imports and Exports from DevelopingCountries
30
40
50
60
70
80 81 82 83 84 85 86 87 88 89 90 91 92 93 94 95 96 97 98 99 00
(%)
Import (%)
Export (%)
Source: D irection of Trade Statistics, IM F
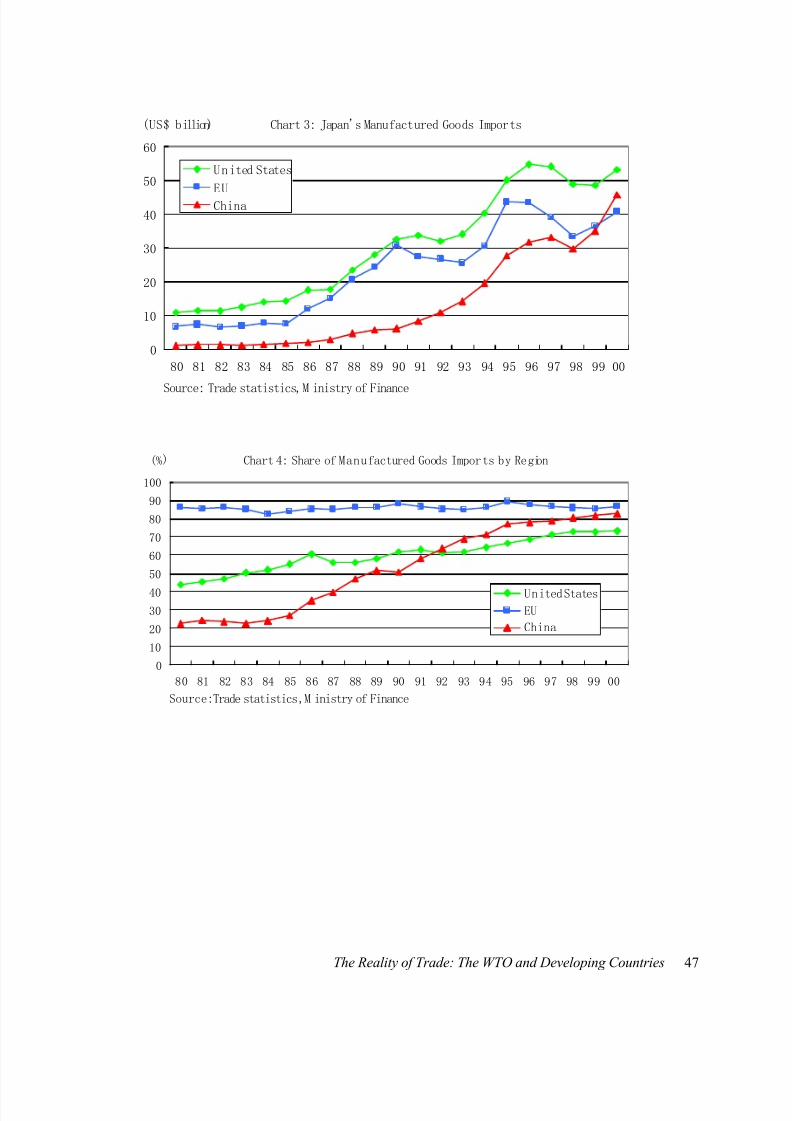
8/13/2019 Reality of Trade - The WTO and Developing Countries
http://slidepdf.com/reader/full/reality-of-trade-the-wto-and-developing-countries 53/106
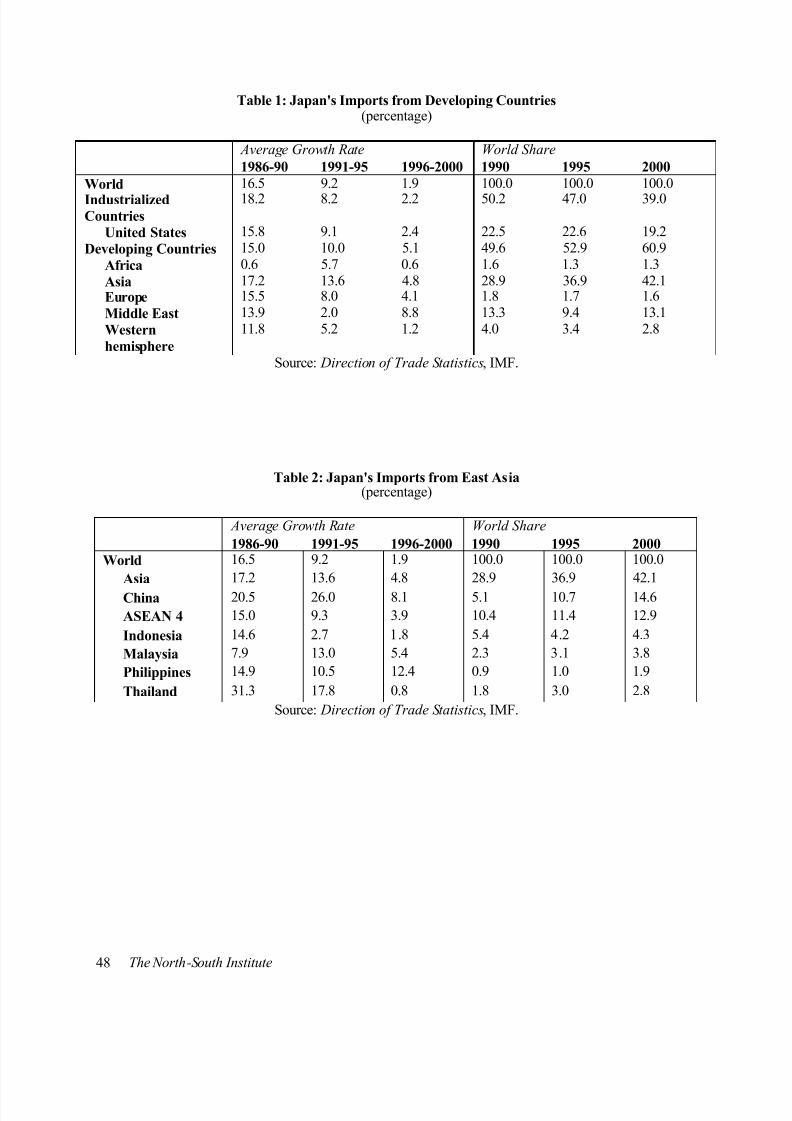
8/13/2019 Reality of Trade - The WTO and Developing Countries
http://slidepdf.com/reader/full/reality-of-trade-the-wto-and-developing-countries 54/106
48 The North-South Institute
Table 1: Japan's Imports from Developing Countries(percentage)
Average Growth Rate World Share
1986-90 1991-95 1996-2000 1990 1995 2000
World 16.5 9.2 1.9 100.0 100.0 100.0
IndustrializedCountries
18.2 8.2 2.2 50.2 47.0 39.0
United States 15.8 9.1 2.4 22.5 22.6 19.2
Developing Countries 15.0 10.0 5.1 49.6 52.9 60.9
Africa 0.6 5.7 0.6 1.6 1.3 1.3
Asia 17.2 13.6 4.8 28.9 36.9 42.1Europe 15.5 8.0 4.1 1.8 1.7 1.6
Middle East 13.9 2.0 8.8 13.3 9.4 13.1
Western
hemisphere
11.8 5.2 1.2 4.0 3.4 2.8
Source: Direction of Trade Statistics, IMF.
Table 2: Japan's Imports from East Asia(percentage)
Average Growth Rate World Share
1986-90 1991-95 1996-2000 1990 1995 2000
World 16.5 9.2 1.9 100.0 100.0 100.0
Asia 17.2 13.6 4.8 28.9 36.9 42.1
China 20.5 26.0 8.1 5.1 10.7 14.6
ASEAN 4 15.0 9.3 3.9 10.4 11.4 12.9
Indonesia 14.6 2.7 1.8 5.4 4.2 4.3
Malaysia 7.9 13.0 5.4 2.3 3.1 3.8
Philippines 14.9 10.5 12.4 0.9 1.0 1.9
Thailand 31.3 17.8 0.8 1.8 3.0 2.8
Source: Direction of Trade Statistics, IMF.
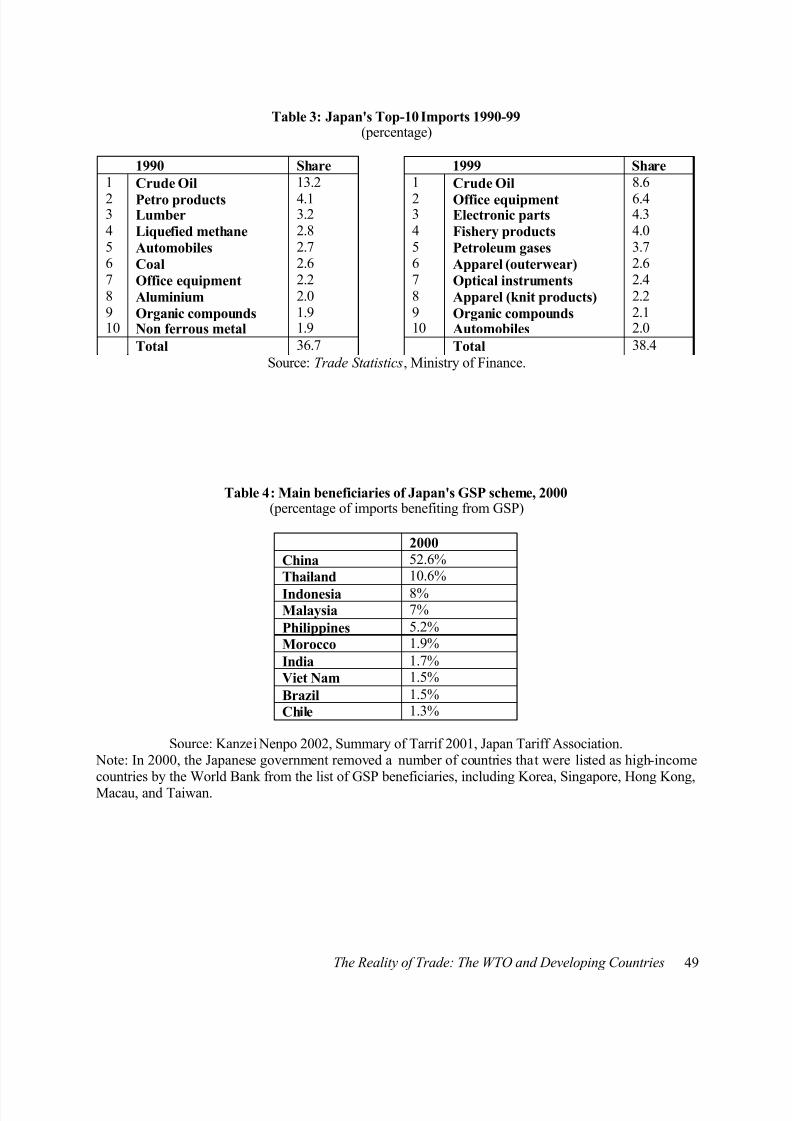
8/13/2019 Reality of Trade - The WTO and Developing Countries
http://slidepdf.com/reader/full/reality-of-trade-the-wto-and-developing-countries 55/106
The Reality of Trade: The WTO and Developing Countries 49
Table 3: Japan's Top-10 Imports 1990-99(percentage)
1990 Share 1999 Share
1 Crude Oil 13.2 1 Crude Oil 8.6
2 Petro products 4.1 2 Office equipment 6.43 Lumber 3.2 3 Electronic parts 4.34 Liquefied methane 2.8 4 Fishery products 4.05 Automobiles 2.7 5 Petroleum gases 3.76 Coal 2.6 6 Apparel (outerwear) 2.67 Office equipment 2.2 7 Optical instruments 2.48 Aluminium 2.0 8 Apparel (knit products) 2.29 Organic compounds 1.9 9 Organic compounds 2.110 Non ferrous metal 1.9 10 Automobiles 2.0
Total 36.7 Total 38.4
Source: Trade Statistics, Ministry of Finance.
Table 4: Main beneficiaries of Japan's GSP scheme, 2000(percentage of imports benefiting from GSP)
2000
China 52.6%
Thailand 10.6%
Indonesia 8%Malaysia 7%
Philippines 5.2%
Morocco 1.9%
India 1.7%
Viet Nam 1.5%
Brazil 1.5%
Chile 1.3%
Source: Kanzei Nenpo 2002, Summary of Tarrif 2001, Japan Tariff Association. Note: In 2000, the Japanese government removed a number of countries that were listed as high-incomecountries by the World Bank from the list of GSP beneficiaries, including Korea, Singapore, Hong Kong,Macau, and Taiwan.
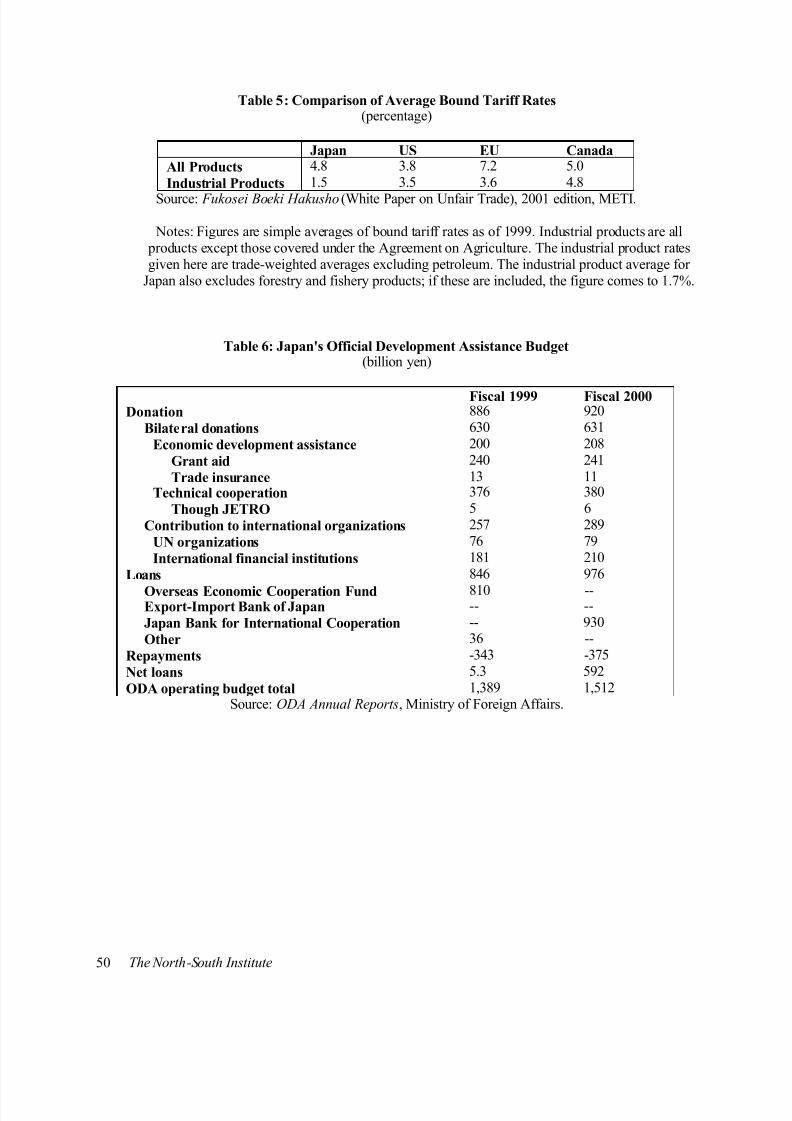
8/13/2019 Reality of Trade - The WTO and Developing Countries
http://slidepdf.com/reader/full/reality-of-trade-the-wto-and-developing-countries 56/106
50 The North-South Institute
Table 5: Comparison of Average Bound Tariff Rates(percentage)
Japan US EU Canada
All Products 4.8 3.8 7.2 5.0
Industrial Products 1.5 3.5 3.6 4.8
Source: Fukosei Boeki Hakusho (White Paper on Unfair Trade), 2001 edition, METI.
Notes: Figures are simple averages of bound tariff rates as of 1999. Industrial products are all products except those covered under the Agreement on Agriculture. The industrial product ratesgiven here are trade-weighted averages excluding petroleum. The industrial product average for
Japan also excludes forestry and fishery products; if these are included, the figure comes to 1.7%.
Table 6: Japan's Official Development Assistance Budget(billion yen)
Fiscal 1999 Fiscal 2000Donation 886 920
Bilateral donations 630 631
Economic development assistance 200 208
Grant aid 240 241
Trade insurance 13 11Technical cooperation 376 380
Though JETRO 5 6
Contribution to international organizations 257 289
UN organizations 76 79
International financial institutions 181 210
Loans 846 976
Overseas Economic Cooperation Fund 810 --Export-Import Bank of Japan -- --
Japan Bank for International Cooperation -- 930
Other 36 --
Repayments -343 -375
Net loans 5.3 592
ODA operating budget total 1,389 1,512Source: ODA Annual Reports, Ministry of Foreign Affairs.
8/13/2019 Reality of Trade - The WTO and Developing Countries
http://slidepdf.com/reader/full/reality-of-trade-the-wto-and-developing-countries 57/106
The Reality of Trade: The WTO and Developing Countries 51
References
Finger, Michael J., Melinda Ingco and Ulrich Reincke. The Uruguay Round: Statistics on TariffConcessions Given and Received . Washington, DC: The World Bank, 1996.
Fujimoto, S. Nippon No Kanzei (Japan’s tariff). Tokyo: Zaikeisenpou-sya, 1997.
Hoekman, Bernard, Francis Ng and Marcello Olarreaga. Tariff Peaks in the Quad and Least DevelopedCountries Exports. Washington, DC: Development Research Group, 2001.
IMF. Direction of Trade Statistics Handbook 2000. Washington, DC: IMF, 2000.
Japan Tariff Association. Kanzei Nenpou (Annual Reports on Tariff). Tokyo: Japan Tariff Association,2001 and 2002.
Japan External Trade Organization (JETRO). White paper on International Trade. Tokyo: JETRO, 2000.
Japan, Ministry of Economy, Trade and Industry. External Economic Policy home page.http://www.meti.go.jp/english/policy/index_externaleconomicpolicy.html.
Japan, Ministry of Economy, Trade and Industry. Hukousei Boueki Hakusyo (Report on the WTOConsistency of Trade Policies by Major Trading Partners). Tokyo: Research institute of economy, tradeand industry, 2001.
Japan-China Economic Association. “China’s IP Rights” China IP Newsletter , 2000.
Japan, Ministry of Finance. Statistics home page. http://www.mof.go.jp/english/files.htm.
Japan, Ministry of Foreign Affairs. White Paper on ODA. Tokyo: APIC, 2001.
Japan, Ministry of Economy, Trade and Industry. Economic Cooperation of Japan. Tokyo: ResearchInstitute of Economy, Trade and Industry, 2001.
Japan, Ministry of Economy, Trade and Industry. ODA home page.http://www.meti.go.jp/policy/index.html.
Mizoguchi, M and M. Matsuo. Uruguay Round . Tokyo: NHK books, 1994.
Nakamura, Y. WTO Ga Boueki O Kaeru (WTO Will Change Trade). Tokyo: Touyoukeizai-Sinposya,1994.
Takase, T. GATT and Uruguay Round . Tokyo: Touyoukeizai-Sinpusya, 1993.
WTO. Trade Policy Review 2000: Japan. Geneva: WTO, 2000.
8/13/2019 Reality of Trade - The WTO and Developing Countries
http://slidepdf.com/reader/full/reality-of-trade-the-wto-and-developing-countries 58/106
52 The North-South Institute
Chapter 5
The United States
Chantal Blouin
Since the 1970s, the US [trade] policy has become increasingly schizophrenic. On onehand, there has been support for successive GATT rounds and other trade-liberalizingmeasures. At the same time, however, the United States has increasingly resorted torestrictive trade measures both in practice and rhetoric and is no longer unswerving in itssupport of multilateralism (Krueger 1995, p.30).
The co-existence of trade liberalization policy and protectionism within American trade policy is not anew issue. For decades now, this policy has shifted from multilateral liberalization to aggressiveunilateralism, with detours through old-fashioned protectionism and creative subsidization of agriculture.
US trade policy toward developing countries parallels this general pattern. On one hand, the Americanmarket offers great opportunities for imports from developing countries and several have taken advantageof this openness. Yet a number of important barriers still block the US market. These can take the form oftariffs and non-tariffs barriers, contingent protection such as anti-dumping duties and “unfair practice”
provisions , and subsidies to the agricultural sector.
This chapter will show that the Uruguay Round had only modest impacts on the barriers faced bydeveloping country imports when entering the American market. First, we will review tariffs and non-tariff barriers and then, the anti-dumping measures used to protect the American markets from imports. Akey element in the North-South trade deal struck during the Uruguay Round was the reduction ofagricultural subsidies, seen by many as one of the ma in distortions in global trade. We will examine howthe Uruguay Round did not significantly affect US agricultural subsidies and their impact on farmers in
developing countries.
Market Access and Market Barriers
The level of international trade is still relatively small in the United States, in comparison to otherindustrialized nations. Exports represent only 10% of the US GDP, whereas in the EU and Canada theyamount respectively to 26% and 43% of GDP. However, because of the sheer size of the Americaneconomy, it is the largest importer in the world. It is the destination for 23.6% of world merchandise trade(excluding intra-EU trade) (WTO 2000, p.20). Since the end of the Uruguay Round, developingcountries’ imports into the US have increased, and they now represent a bit more than 38% of all USimports (see Table 1). This growth is not shared by all countries, as some developing countries were able
to capture an important part of this market. Mexico and China have, by far, become the most importanttrade partners for the United States in the developing world. These two countries provide a wide range ofmanufactured products to the American market. Besides the traditional sectors of textiles and footwear inwhich developing countries often specialize, they sell transportation equipment (cars and auto parts),electronic equipment, and toys. Therefore, one would be hard-pressed to say that the changes triggered bythe Uruguay Round are important factors underlying the growth of imports from the South into the UnitedStates, as other factors such as the signature of the North American Free Trade Agreement (NAFTA) andthe growth of Chinese production capacity appear as key variables.
8/13/2019 Reality of Trade - The WTO and Developing Countries
http://slidepdf.com/reader/full/reality-of-trade-the-wto-and-developing-countries 59/106
The Reality of Trade: The WTO and Developing Countries 53
The tariffs on imports to the United States from developing countries are generally low, but they arehigher than the tariffs applied on imports from deve loped countries (see Table 4). The most restrictive
barriers to the American market for Southern products are concentrated in sectors such as textiles andclothing and agriculture. As we can see in Table 2, the average tariff on imports from developingcountries under the Generalized System of Preferences is only 4%. However, in textiles, footwear and
agri-food, these tariffs climb beyond the 10% mark. The Uruguay Round tariff reductions in these keysectors were modest in most sectors, ranging from 0.9% in transport equipment to over 5% inmanufactured and chemical products (see Table 4). In sectors of particular interest to developing countiessuch as agriculture, textiles and clothing, the reductions were under 2%. Tariff peaks (more than 15%tariffs) against developing countries’ imports also remain relatively frequent; for instance, more than 15%of imports from the least-developed countries face tariffs above 15% (Hoekman and al. 2001).
In addition to tariffs, the United States uses an extensive system of quotas to limit developing countries’access to its domestic market in the textile and clothing sector. In 2005, all these quotas must be removedgiven the commitments taken by the US during the Uruguay Round negotiations. As in Canada (seeChapter 2), the first phases of the gradual removal of quotas focused on the least sensitive products (i.e.,the products on which no quotas were actually imposed or products for which there were few domestic
competitors) (WTO 2001). Some countries have expressed concerns that once the quotas are removed in2005, the use of anti-dumping and other contingent protections measures by the US may increase in orderto continue protection for the textiles and clothing industry. Close monitoring will be needed in thefollowing years to ensure that the benefits of the Uruguay Round actually become a reality in this sector.
A discussion on market access should note that the US maintains varied preferential tariff regimes fordeveloping countries (see Table 3). The best-known is the North American Free Trade Agreement(NAFTA), which offers zero tariff access for most products from Mexico. The exceptions to duty-freetreatment are in the agricultural sectors as well as in clothing and footwear, where diminishing levels of
protection apply. Since the adoption of NAFTA, imports from Mexico have increased steadily, and nowrepresent 30% of developing countries’ imports into the US. NAFTA has created many headaches for theCaribbean region. Indeed, thanks to the lower tariffs imposed on its products, Mexico became more
attractive than the Caribbean for investors in the manufacturing sectors. Such trade and investmentdiversion has been observed in Jamaica (WB 2000). This may have contributed to the gradual decline inCaribbean Community (CARICOM) manufacturing exports from 1995, when they peaked at $531 million(up from $284 million in 1990) (CARICOM 2000). In order to prevent further trade diversion, especiallyin the garment industry, the Caribbean countries requested “NAFTA parity” from the US government(i.e., access to the US markets on terms similar to Mexico. Only in May 2000 did the US Congress adoptlegislation expanding trade preferences to include textiles and clothing, and all other previously excluded
products, subject to strict rules of origin. However, this new Caribbean Basin Trade Partnership Act(CBTPA), in effect since October 2000, does not amount to NAFTA parity (Leon and Salazar-Xirinachs2001), as the duty-free treatment for some of these products is limited by a tariff-rate quota. Also, it willexpire in 2008 or when the FTAA enters into force.
Another preferential regime of the US is the Andean Trade Preference Act (ATPA), which was adopted in1991 as an economic tool to combat illegal drug trade in Colombia, Peru, Ecuador, and Bolivia. Thistreatment helped these countries to increase their exports to the US by 97% (WTO 2001). However, the
program lapsed for a year or so, as it was linked to the renewal of the President’s fast-track authority. Thedelay caused important economic problems in the region and highlights the problems linked to
preferential tariff regimes, which are not binding commitments and can be eliminated at any time.
The most recent US preferential regime focused on Sub-saharan Africa. The African Growth andOpportunity Act of 2000 (AGOA) allows all products, including clothing, to enter the United States duty-
8/13/2019 Reality of Trade - The WTO and Developing Countries
http://slidepdf.com/reader/full/reality-of-trade-the-wto-and-developing-countries 60/106
54 The North-South Institute
free and quota-free until 2008. However, this regime imposes several conditions on exporters: notably,the clothes have to be manufactured with American or African textiles. This condition does not apply tothe least-developed countries. To be eligible for this regime, each country has to be certified by theAmerican government, on the basis of a long list of criteria which includes progress toward theestablishment of a free market economy and the rule of law, elimination of barriers to Americaninvestments and exports, adoption of poverty reduction policies, and adoption of polic ies to reduce
corruption and to respect labour rights. To be certified, the country cannot be engaged in activities thatthreaten US national security or interests, and cannot commit grave violations of human rights or supportterrorist activities. Ten countries have been evaluated as non-eligible: Angola, Burkina Faso, Burundi,Ivory Coast, Republic of Congo, Guinea, the Gambia, Liberia, Togo, and Zimbabwe. What has been theimpact of this initiative? Before its adoption in 2000, the US International Trade Commission predictedan increase of 25-45% in Sub-saharan African exports. The International Trade Commission identified 16countries, such as Mauritius, South Africa, and Lesotho, as having the industrial infrastructure or the
potential to take advantage of this preferential access to the US market. It is too early to determinewhether they have indeed benefited, but the new regime is a good example of an important feature ofAmerican trade policy (i.e., strong linkages between trade policy and broader foreign policyconsiderations).
Antidumping Duties
Dumping is defined as the sale of a good in an export country at a price below the one charged in thecountry of origin. If the product in question is not sold in the domestic market, dumping will occur whenthe sale price is below the cost of production. In principle, anti-dumping duties are set by the governmentin the receiving countries to protect local competitors from this unfair competition. However, in the realworld, anti-dumping duties have become tools to protect domestic producers against foreign competition,and authorities have adopted a very broad definition of dumping. The use of anti-dumping duties in theUnited States is a good example of this tendency. “The manner in which US trade law remedies areadministered gives them protectionist content beyond what might reasonably be defended on economicgrounds. […] Those procedures clearly have a bias against importers and in favour of domestic producers.
As the anti-dumping and countervailing duty tests have become easier, American firms seeking protectionfrom imports have increasingly used those provisions” (Krueger 1995, p.49).
A domestic firm or group of firms can petition the US government to initiate an investigation against aforeign competitor. Once the petition is filed, the Department of Commerce (DOC) has to determinewhether and to what level there has been dumping on the American market. The preliminarydetermination by the Commerce Department provides an estimate of the margin of dumping andtemporary duties are applied. Meanwhile, the International Trade Commission has to determine whetherthere is a reasonable likelihood of injury to the US industry. If the findings of the International TradeCommission and the DOC are both positive, the Department of Commerce engages in the second phaseand makes the final determination. If dumping and injury are found, the International Trade Commissionimposes duties at a level equivalent to the margin of dumping on the contested import. Given the criteria
used to establish dumping, the preliminary determinations usually lead to the imposition of temporaryduties on foreign imports (Krueger 1995). Therefore, even for those cases that do not end with a dutyorder (53% of cases between 1987 and 2000), the temporary duties affect the exporter’s performance and
position on the US market.
Antidumping measures are an important obstacle for developing countries’ access to the Americanmarket, and the Uruguay Round did not significantly improve this state of affairs. Table 5 shows a slightdecrease in the number of anti-dumping investigations and measures imposed during the period before theconclusion of the Uruguay Round and between 1995 and 1999. The Uruguay Round Agreement included
8/13/2019 Reality of Trade - The WTO and Developing Countries
http://slidepdf.com/reader/full/reality-of-trade-the-wto-and-developing-countries 61/106
The Reality of Trade: The WTO and Developing Countries 55
minor changes to anti-dumping laws, such as an obligation for members to include sunset clauses in theiranti-dumping laws. This slight decrease may reflect those changes. The difference between these two
periods could also be explained by macroeconomic conditions. During a recession, such as the one in1991-92, one tends to see more firms file dumping cases against foreign competitors (Leidy 1997). TheUnited States may have slightly moderated its use of anti-dumping measures since the adoption of theUruguay Round agreements, but the US “remains one of the most aggressive users of anti-dumping laws
in the world. The duties it imposes are a substantial impediment to trade in the goods at issue” (CBO2001). Indeed, the US is still the country with the highest number of active anti-dumping measures (267on January 1, 2000) and, with an average duty rate of 47%, these anti-dumping duties are real barriers totrade.
Of the 267 anti-dumping measures in effect on January 1, 2000, 36% were targeting imports fromdeveloping countries. China was the first target in that group, with 40 measures aiming at its exports(CBO 2001). Given the high level of US imports from China, it is not surprising to see that it now standsas one of the main targets of anti-dumping measures, just behind the EU, which faced 55 active cases inthe US. The majority of these cases related to steel products, but a wide variety of goods were alsoaffected, such as textiles and clothing, chemical products, vegetable products, and other foodstuffs (WTO2001).
The number of anti-dumping measures against developing countries is only part of the picture when onewants to understand the impact of such protection. For instance, research published by the NationalBureau of Economic Research calculated that the mere act of investigating anti-dumping complaintsresults in an important drop in the level of trade (Prusa 1999). Moreover, “frequent investigations, even ifthe complaints are rejected in the end by the agency, amount to a kind of harassment of the defendants
because of the uncertainty and expenses such actions create” (Tharakan 1999, p.183). The legal andadministrative costs of the procedures can be particularly heavy for smaller or developing countries. Thevalue of the Southern imports directly affected by anti-dumping measures may be less than 1% of thetotal value of developing countries’ sale to the US. However, the threat of such contingent protection is animportant problem in the current trade regime, as it is against one of the basic principles of tradeagreements: predictability. When a tariff for a product is bound at a specific level at the WTO, traders
know what barriers to expect. Uncertainty has increased now that many developing countries have createdanti-dumping laws based on the protectionist American model.
Domestic Support in Agriculture
The United States is the largest agricultural exporter and its production has a significant impact onagricultural world prices. The agri-food sector is the largest recipient of subsidies in the US. During thefiscal year 2000, the US Department of Agriculture distributed a record US$28 billion in direct assistanceto farmers and ranchers (USDA 2000). Figures on total government support for agriculture varyaccording to the way one measures it. For instance, the WTO uses a different way to measure supportthan the OECD, based on the classification of the types of support in the Agreement on Agricult ure (see
Chapter 1 in this book). The OECD’s Producer Support Estimate (PSE) measures transfers to producers,which exceeded US$50 billion in the US for the crop year 1999.
14 This was about half of what the
European Union governments provided to their farmers that year. However, unlike the EU and other
14 If one includes all US government support to the sector, including marketing and promotion services, the level of
support reached US$93 billion for the 1999 crop year (WTO 2001). In 2002, the US Congress adopted legislationthat will further increase the level of subsidies in this sector: the Farm Security and Rural Investment Act of 2002.The new law was received with disappointment and outrage around the world.
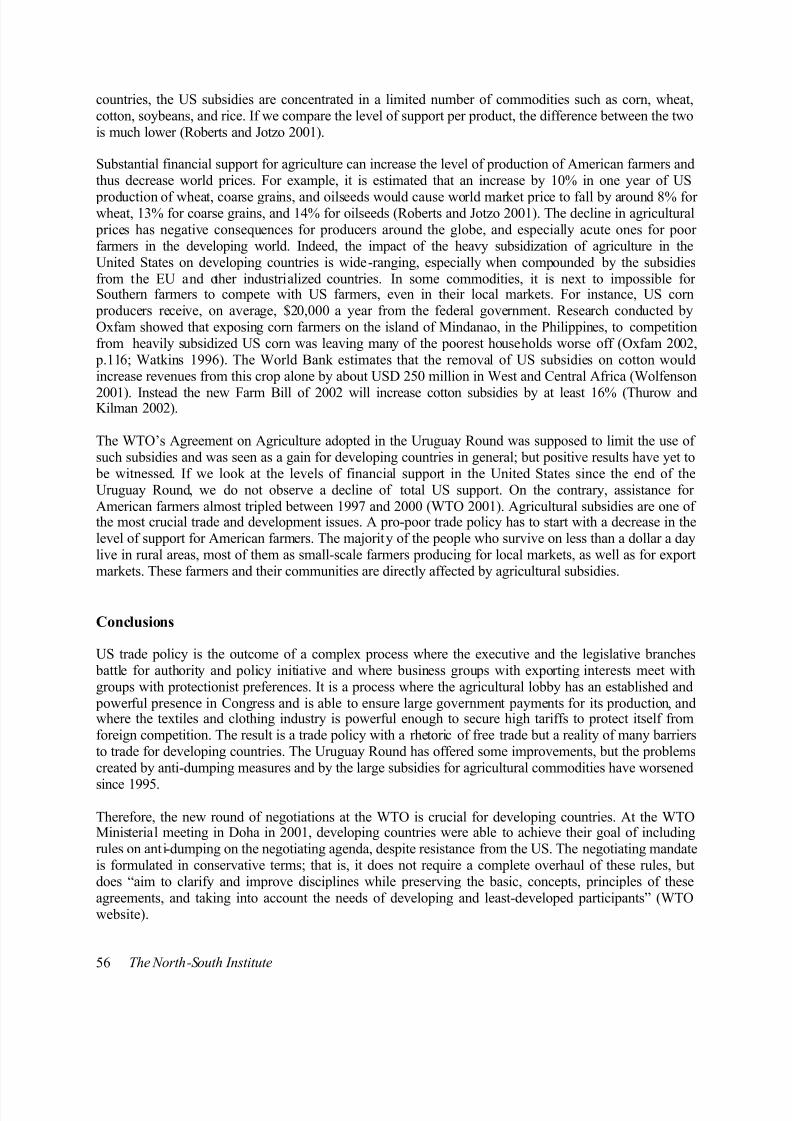
8/13/2019 Reality of Trade - The WTO and Developing Countries
http://slidepdf.com/reader/full/reality-of-trade-the-wto-and-developing-countries 62/106
56 The North-South Institute
countries, the US subsidies are concentrated in a limited number of commodities such as corn, wheat,cotton, soybeans, and rice. If we compare the level of support per product, the difference between the twois much lower (Roberts and Jotzo 2001).
Substantial financial support for agriculture can increase the level of production of American farmers andthus decrease world prices. For example, it is estimated that an increase by 10% in one year of US
production of wheat, coarse grains, and oilseeds would cause world market price to fall by around 8% forwheat, 13% for coarse grains, and 14% for oilseeds (Roberts and Jotzo 2001). The decline in agricultural
prices has negative consequences for producers around the globe, and especially acute ones for poorfarmers in the developing world. Indeed, the impact of the heavy subsidization of agriculture in theUnited States on developing countries is wide-ranging, especially when compounded by the subsidiesfrom the EU and other industrialized countries. In some commodities, it is next to impossible forSouthern farmers to compete with US farmers, even in their local markets. For instance, US corn
producers receive, on average, $20,000 a year from the federal government. Research conducted byOxfam showed that exposing corn farmers on the island of Mindanao, in the Philippines, to competitionfrom heavily subsidized US corn was leaving many of the poorest households worse off (Oxfam 2002,
p.116; Watkins 1996). The World Bank estimates that the removal of US subsidies on cotton wouldincrease revenues from this crop alone by about USD 250 million in West and Central Africa (Wolfenson
2001). Instead the new Farm Bill of 2002 will increase cotton subsidies by at least 16% (Thurow andKilman 2002).
The WTO’s Agreement on Agriculture adopted in the Uruguay Round was supposed to limit the use ofsuch subsidies and was seen as a gain for developing countries in general; but positive results have yet to
be witnessed. If we look at the levels of financial support in the United States since the end of theUruguay Round, we do not observe a decline of total US support. On the contrary, assistance forAmerican farmers almost tripled between 1997 and 2000 (WTO 2001). Agricultural subsidies are one ofthe most crucial trade and development issues. A pro-poor trade policy has to start with a decrease in thelevel of support for American farmers. The majority of the people who survive on less than a dollar a daylive in rural areas, most of them as small-scale farmers producing for local markets, as well as for exportmarkets. These farmers and their communities are directly affected by agricultural subsidies.
Conclusions
US trade policy is the outcome of a complex process where the executive and the legislative branches battle for authority and policy initiative and where business groups with exporting interests meet withgroups with protectionist preferences. It is a process where the agricultural lobby has an established and
powerful presence in Congress and is able to ensure large government payments for its production, andwhere the textiles and clothing industry is powerful enough to secure high tariffs to protect itself fromforeign competition. The result is a trade policy with a rhetoric of free trade but a reality of many barriersto trade for developing countries. The Uruguay Round has offered some improvements, but the problemscreated by anti-dumping measures and by the large subsidies for agricultural commodities have worsened
since 1995.
Therefore, the new round of negotiations at the WTO is crucial for developing countries. At the WTOMinisterial meeting in Doha in 2001, developing countries were able to achieve their goal of includingrules on anti-dumping on the negotiating agenda, despite resistance from the US. The negotiating mandateis formulated in conservative terms; that is, it does not require a complete overhaul of these rules, butdoes “aim to clarify and improve disciplines while preserving the basic, concepts, principles of theseagreements, and taking into account the needs of developing and least-developed participants” (WTOwebsite).
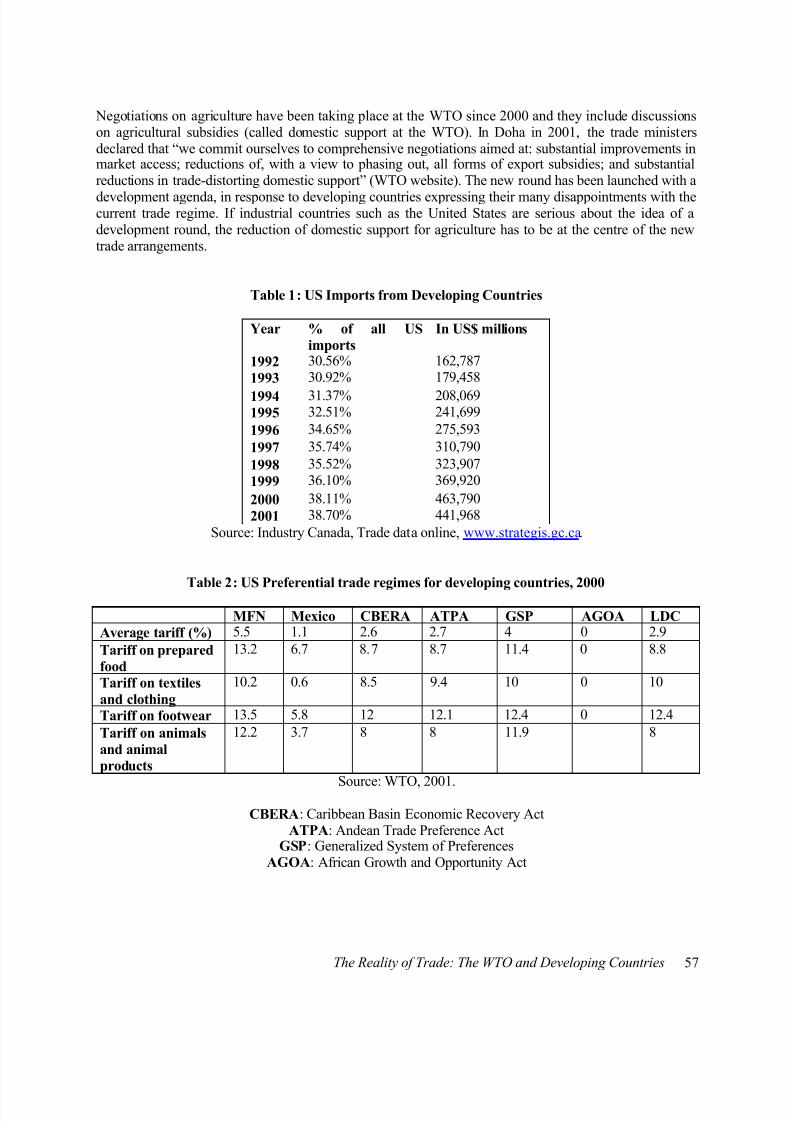
8/13/2019 Reality of Trade - The WTO and Developing Countries
http://slidepdf.com/reader/full/reality-of-trade-the-wto-and-developing-countries 63/106
The Reality of Trade: The WTO and Developing Countries 57
Negotiations on agriculture have been taking place at the WTO since 2000 and they include discussionson agricultural subsidies (called domestic support at the WTO). In Doha in 2001, the trade ministersdeclared that “we commit ourselves to comprehensive negotiations aimed at: substantial improvements inmarket access; reductions of, with a view to phasing out, all forms of export subsidies; and substantialreductions in trade-distorting domestic support” (WTO website). The new round has been launched with a
development agenda, in response to developing countries expressing their many disappointments with thecurrent trade regime. If industrial countries such as the United States are serious about the idea of adevelopment round, the reduction of domestic support for agriculture has to be at the centre of the newtrade arrangements.
Table 1: US Imports from Developing Countries
Year % of all US
imports
In US$ millions
1992 30.56% 162,787
1993 30.92% 179,458
1994 31.37% 208,0691995 32.51% 241,699
1996 34.65% 275,593
1997 35.74% 310,790
1998 35.52% 323,907
1999 36.10% 369,920
2000 38.11% 463,790
2001 38.70% 441,968
Source: Industry Canada, Trade data online, www.strategis.gc.ca.
Table 2: US Preferential trade regimes for developing countries, 2000
MFN Mexico CBERA ATPA GSP AGOA LDC
Average tariff (%) 5.5 1.1 2.6 2.7 4 0 2.9
Tariff on prepared
food
13.2 6.7 8.7 8.7 11.4 0 8.8
Tariff on textiles
and clothing
10.2 0.6 8.5 9.4 10 0 10
Tariff on footwear 13.5 5.8 12 12.1 12.4 0 12.4
Tariff on animals
and animal
products
12.2 3.7 8 8 11.9 8
Source: WTO, 2001.
CBERA: Caribbean Basin Economic Recovery ActATPA: Andean Trade Preference Act
GSP: Generalized System of PreferencesAGOA: African Growth and Opportunity Act
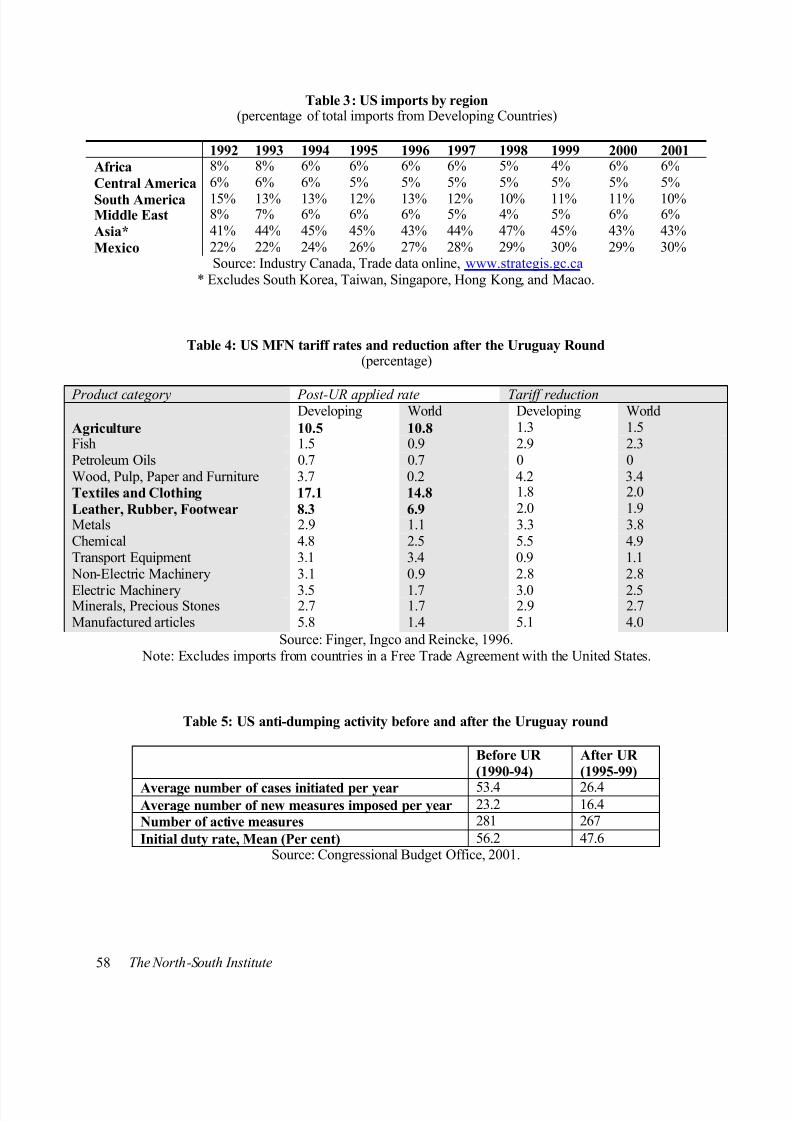
8/13/2019 Reality of Trade - The WTO and Developing Countries
http://slidepdf.com/reader/full/reality-of-trade-the-wto-and-developing-countries 64/106
58 The North-South Institute
Table 3: US imports by region(percentage of total imports from Developing Countries)
1992 1993 1994 1995 1996 1997 1998 1999 2000 2001
Africa 8% 8% 6% 6% 6% 6% 5% 4% 6% 6%
Central America 6% 6% 6% 5% 5% 5% 5% 5% 5% 5%
South America 15% 13% 13% 12% 13% 12% 10% 11% 11% 10%Middle East 8% 7% 6% 6% 6% 5% 4% 5% 6% 6%
Asia* 41% 44% 45% 45% 43% 44% 47% 45% 43% 43%
Mexico 22% 22% 24% 26% 27% 28% 29% 30% 29% 30%Source: Industry Canada, Trade data online, www.strategis.gc.ca
* Excludes South Korea, Taiwan, Singapore, Hong Kong, and Macao.
Table 4: US MFN tariff rates and reduction after the Uruguay Round(percentage)
Product category Post-UR applied rate Tariff reductionDeveloping World Developing World
Agriculture 10.5 10.8 1.3 1.5Fish 1.5 0.9 2.9 2.3Petroleum Oils 0.7 0.7 0 0Wood, Pulp, Paper and Furniture 3.7 0.2 4.2 3.4Textiles and Clothing 17.1 14.8 1.8 2.0
Leather, Rubber, Footwear 8.3 6.9 2.0 1.9Metals 2.9 1.1 3.3 3.8Chemical 4.8 2.5 5.5 4.9Transport Equipment 3.1 3.4 0.9 1.1
Non-Electric Machinery 3.1 0.9 2.8 2.8
Electric Machinery 3.5 1.7 3.0 2.5Minerals, Precious Stones 2.7 1.7 2.9 2.7Manufactured articles 5.8 1.4 5.1 4.0
Source: Finger, Ingco and Reincke, 1996. Note: Excludes imports from countries in a Free Trade Agreement with the United States.
Table 5: US anti-dumping activity before and after the Uruguay round
Before UR
(1990-94)
After UR
(1995-99)
Average number of cases initiated per year 53.4 26.4Average number of new measures imposed per year 23.2 16.4
Number of active measures 281 267
Initial duty rate, Mean (Per cent) 56.2 47.6Source: Congressional Budget Office, 2001.
8/13/2019 Reality of Trade - The WTO and Developing Countries
http://slidepdf.com/reader/full/reality-of-trade-the-wto-and-developing-countries 65/106
The Reality of Trade: The WTO and Developing Countries 59
References
CARICOM. Caribbean Trade and Investment Report 2000.http://www.caricom.org/archives/citeresceerpts.htm.
Congressional Budget Office. Antidumping Action in the United States and Around the World: An
Update . 2001.
Finger, Michael J., Melinda Ingco and Ulrich Reincke. The Uruguay Round: Statistics on TariffConcessions Given and Received . Washington, DC: The World Bank, 1996.
Hoekman, Bernard, Francis Ng and Marcello Olarreaga. Tariff Peaks in the Quad and Least DevelopedCountries Exports. Washington, DC: Development Research Group, 2001.
Industry Canada. Trade data online. http://strategis.ic.gc.ca/sc_mrkti/tdst/engdoc/tr_homep.html.
Krueger, Anne. American trade policy: a tragedy in the making . Washington: EAI, 1995.
Leidy, Micheal. “Macroeconomic Conditions and Pressures for Protection under Antidumping andCountervailing duty Laws: Empirical Evidence from the United States,” International Monetary FundStaff Papers 44:1, March 1997, pp. 132-144.
León, René and José Manuel Salazar-Xirinachs. “The New Caribbean Basin Initiative: Impact andOpportunities,” Integration and Trade 13: 2001, pp. 113-125.
Oxfam. Rigged Rules and Double Standards. London: Oxfam International, 2002.
Prusa, Thomas. On the Spread and Impact of Antidumping , National Bureau of Economic Research,Working Paper no. 7404, 1999.
Roberts, I. and F. Jotzo. 2002 US Farm Bill: Support and Agricultural Trade. Canberra: AustralianBureau of Agricultural and Resource Economics, 2001.
Tharakan, P.K.M. “Is Anti-Dumping Here to Stay?” The World Economy 22:2, March 1999.
Thurow, Roger and Scott Kilman. “Hanging by a thread: In US, cotton farmers thrive, in Africa, theyfight to survive,” The Wall Street Journal, June 26, 2002.
USDA. USDA Providing Record Assistance to Farmers, News Release no.348. Washington DC, October2, 2000. www.usda.gov/news/releases/2000/10/0348.htm.
Watkins, K. Trade Liberalization as a Threat to Livelihoods: The Corn Sector in the Philippines. Oxford:
Oxford University Press, Oxfam, 1996.
World Bank. Trade Blocs, A World Bank research report. Oxford: Oxford University Press, 2000.
Wolfensohn, James. “Africa: An Urgent Agenda,” speech delivered at the InterAction Forum, 2002.www.worldbank.org.
WTO. Trade Policy Review 2001: United States. Geneva: WTO Secretariat, 2001.
8/13/2019 Reality of Trade - The WTO and Developing Countries
http://slidepdf.com/reader/full/reality-of-trade-the-wto-and-developing-countries 66/106
60 The North-South Institute
WTO. International Trade Statistics 2000. Geneva: WTO Secretariat, 2000.
WTO website: www.wto.org/english/tratop_e/dda_e/dohaexplained_e.htm#anti-dumping.
8/13/2019 Reality of Trade - The WTO and Developing Countries
http://slidepdf.com/reader/full/reality-of-trade-the-wto-and-developing-countries 67/106
The Reality of Trade: The WTO and Developing Countries 61
Part III: Southern Perspectives on the WTO
8/13/2019 Reality of Trade - The WTO and Developing Countries
http://slidepdf.com/reader/full/reality-of-trade-the-wto-and-developing-countries 68/106
62 The North-South Institute
Chapter 6
Technical Assistance as a Political Instrument
Yash Tandon
There is a generally recognized “capacity gap” within the multilateral trading system between the moredeveloped and less developed countries. The developing countries have a lesser capacity to negotiatetrade agreements and to implement them. There is a gap between what they commit themselves to andwhat they are effectively able to implement. In the agreements of the Uruguay Round and at everyconference of the World Trade Organisation (WTO) since 1995, rich countries have promised to addressthe issue of building the capacity of developing countries to fully integrate into the global trading system.The objective of this paper is to examine the extent to which these objectives have been achieved, the
problems encountered, and some possible ways to move the process forward. Having examined evidenceon the ground, the paper concludes that, if anything, the capacity gap is increasing, not decreasing . There
are three principal reasons for this. One is the speed with which matters are moving within the WTO. New issues are constantly added to the negotiating agenda even before developing countries have hadtime to adjust to the demands of the previous negotiations. In other words, the capacity-building effortslag behind. The second is that the developed countries regularly use the offer of technical assistance as ameans of expanding the mandate of the WTO. In other words, developing countries are persuaded toaccept the expanded agenda on the promise that they will be given adequate technical assistance to copewith the new situation. The third main reason that the capacity gap is increasing is the fact that mosttechnical assistance programs are supply-driven. Contrary to their stated objectives, the real intent oftechnical assistance programs is not to develop developing country capacity to negotiate but to get thedeveloping countries to conform to the expanded trading agenda of the OECD countries. In other words,capacity building is not a politically neutral process. It is a tool to advance the interests of those whosupply funds and technical experts. The paper ends by making some recommendations on how trade-
related technical assistance may be genuinely improved.
Rationale for Building the Developing Countries’ Capacity
One of the more serious anomalies of the contemporary global trading system is the lopsided,asymmetrical negotiating capacity of developing countries in relation to industria lized countries. Exceptfor some large countries among them, such as India, developing countries generally do not have thecapacity to respond adequately to the increasing demands of the multilateral trading system. The basicrationale for building the trade negotiating and implementing capacity of developing countries, then, isthat, in a fast-globalizing world, they need to catch up with industrialized countries, for otherwise theyrisk being even further marginalized, and left out of the development process. There are several
assumptions behind this proposition that are not necessarily valid, but it is not essential for the purpose ofthis paper to question them here. There is a widely recognized capacity deficit in developing countries’ability both to negotiate trade agreements and to fulfil their obligations. This is especially the case withcountries in Africa and the Least Developed Countries (LDCs), most of which also happen to be withinAfrica. So Africa tends to be the major target for trade (and other related) capacity-building efforts.
There is yet another reason for bringing the developing countries and LDCs to the level of theindustrialized countries, or as near their level as possible, in matters of trade negotiation and
8/13/2019 Reality of Trade - The WTO and Developing Countries
http://slidepdf.com/reader/full/reality-of-trade-the-wto-and-developing-countries 69/106
The Reality of Trade: The WTO and Developing Countries 63
implementation. No system can sustain itself without a minimal confidence in the system by those whoare supposed to benefit from it. Without such confidence, the system loses legitimacy. This is widelyrecognized. For example, at a Farming Conference in Oxford¸ England on January 4, 2001, the EC’sTrade Commissioner, Pascal Lamy, said that “capacity building” for developing countries “will make ourlife difficult for us, but that’s good for us; it improves WTO’s legitimacy.”
15
The Evolution of Capacity Building: From the WTO’s Compliance Focus to Third World
Collective Self-Reliance
In the early years of the WTO, and until recently, “capacity building” was conceived narrowly in terms of“compliance.” The objective of “technical assistance” was to assist the developing countries in complyingwith the obligations they had undertaken on signing the Uruguay Round Agreements. Amongst thesecompliance demands, the most numerous and mind-numbing were the so-called “notificationrequirements.” These were to enable the WTO to monitor the extent to which members were fulfillingtheir obligations under the Uruguay Round Agreements. Annex 1A of the Uruguay Round Agreementslisted some 175 notification obligations, 26 of which were classified as of the “regular” type — those thatwere made at semi-annual, annual, or biennial intervals. To these were added another 40 notificationobligations under the General Agreement on Trade in Services (GATS), the Agreement on Trade-RelatedAspects of Intellectual Property Rights (the TRIPS Agreement), and some others, making a total of about215 notification agreements (UNCTAD 1998, p.64). An analysis of these, some 22 months after theUruguay Round Agreements came into force, revealed that only 50% of the members (both developed aswell as developing countries) had completed their notification obligations (WTO 1996, p.13). Thecompliance rate of the LDCs was below 16%, and in several cases there had been no response from theLDCs at all (UNCTAD 1998, p.64). Falling behind compliance entailed a cost. For example, those notcomplying would not then be able to take advantage of the transitional provisions in specific agreements.Also, they could theoretically be subject to the disputes settlement system of the WTO.
Included among the compliance demands of the WTO was the implementation of specific agreements.One of these involved enacting new legislation in order to bring domestic law into conformity with the
WTO provisions. This meant not only eliminating trade measures and practices that were inconsistentwith the Uruguay Round Agreements, but also setting up new institutions, or restructuring old ones. In thecase of TRIPS, for example, it meant not only changing existing laws (e.g., on geographical indications,and on plant varieties), but also changing judicial procedures, and putting in place administration (e.g.,customs administration) where none existed previously.
In early years, most of the technical assistance took the form of short courses (from one week to sixmonths) either in Geneva or in the capitals of the developing countries. These were provided by a varietyof organizations, including the WTO, the United Nations Conference on Trade and Development(UNCTAD), and the International Trade Centre (ITC). Mainly bureaucrats and trade officials fromdeveloping countries and LDCs attended these courses. The six-month WTO courses included a visit toone of the OECD countries for the participants to see how things were done in industrialized countries.
However, these workshops had severe limitations. Apart from raising the awareness of the participantsabout the multilateral trading system and their countries’ obligations under the Uruguay RoundAgreements, these courses did not help very much. The courses did not, for example, analyze for the
participants how the Uruguay Round Agreements, as negotiated, prejudiced their countries, and how theymight negotiate a better deal for themselves at subsequent rounds of negotiations. On the contrary, they
15 From notes taken at the meeting.
8/13/2019 Reality of Trade - The WTO and Developing Countries
http://slidepdf.com/reader/full/reality-of-trade-the-wto-and-developing-countries 70/106
64 The North-South Institute
were told, generally, that it was in the interest of the developing countries to “integrate” into themultilateral trading system, an argument that often left the developing country participants dissatisfied,since no debate was encouraged on this issue.
16
There were, furthermore, difficulties about applying what they learned from these workshops to theircountries. The problems lay primarily within the countries, where there were serious administrative,
financial, and staffing problems. Poorly staffed and regulated administrative machinery, an absence ofspecialized legal and administrative skills, and a general lack of social infrastructure, meant that the valueof much of these courses was wasted. In relation, for example, to investment possibilities, an IMF officialhad this to say: “The huge amount of resources required for building up the necessary administrativecapacities to ensure effective protection of intellectual property rights in LDCs with weak administrativecapacities will almost certainly absorb investment capital and create or worsen financial imbalances,which will in turn depress private investment and economic growth” (Vocke 1997, p.7). Keith Maskus, aneconomist at the University of Colorado, reckoned that it cost a poor country roughly $1.5-2 million justto build a bare-bones infrastructure to implement TRIPS (The Economist 2001).
In other words, no serious effort was made to properly analyze the infrastructure and other requirementsfor technical assistance programs to be effective in the home countries of the participants. The courses
tended to be largely formalistic exercises, aimed mainly to give the impression that “something was beingdone” to provide the developing countries with “capacity building.” This was no fault of those whoactually administered these courses (the staff of the WTO and invited consultants). The fault lay in thevery conceptualization of the program by those who negotiated the inclusion of technical assistance as ameans of reaching trade agreements. Looking back at the way the Uruguay Round Agreements werenegotiated, it is clear that the industrialized country negotiators used promises of technical assistance as ameans of persuading developing countries to sign the Uruguay Round Agreements. Once this was done, itthen became a formalistic exercise to execute the technical assistance program, and this is what the WTOseminars did.
Compliance with the requirements of the WTO was only one (and in the early years perceived as the mosturgent) matter for technical assistance. It was soon realized that this was not enough. Something more
was needed if developing countries were to take advantage of the opportunities that globalization andmarket liberalization were supposed to offer to them. And so, many of the above institutions startedlooking into market access possibilities for the developing countries that the Uruguay Round Agreementswere supposed to open up, for example, in agriculture and textiles. The United Nations IndustrialDevelopment Organization (UNIDO), as well as the ITC and UNCTAD undertook several studies toexplore exporting possibilities for developing countries. So did several bilateral lending and development-oriented institutions, such as CIDA in Canada and the Department for International Development (DFID)in the UK. Some of these studies were useful. By and large, however, they were not. Once again, withcompliance training, it was soon understood that the major problem lay with supply constraints withinthese countries, and not much could be done unless these constraints were addressed.
16 The author was asked to speak at one of these course visits in Helsinki. In talking with the participants from
Africa, Asia, and Latin America, he gathered that they benefited from these courses by increasing their knowledgeabout the WTO; but very few had concrete ideas on how they would apply this knowledge once they got back totheir respective countries. Also they confirmed that no debate was encouraged on the inequities of the system, or
how they might negotiate for better terms for their countries in future trade negotiations.
8/13/2019 Reality of Trade - The WTO and Developing Countries
http://slidepdf.com/reader/full/reality-of-trade-the-wto-and-developing-countries 71/106
The Reality of Trade: The WTO and Developing Countries 65
Limitations of Technical Assistance
Thus, barely three years into the birth and functioning of the WTO, it was becoming abundantly clear thatthe provision of “technical assistance” by the various agencies of the UN (UNCTAD, UNIDO, ITC) and
by the WTO itself, as well as by several bilateral intergovernmental programs meant, in effect, very little.They helped to increase the individual knowledge of the participants who attended the various courses
organized by these agencies, but they did very little to help build the infrastructural capacity of thesecountries, nor to develop their supply capacity, nor to overcome the many hurdles the industrializedcountries erected against imports from the developing countries.
It became clear, in other words, that the technical assistance programs of the WTO, and also in manyinstances those of UNCTAD and the ITC (created, essentially, to help the developing countries), werereally programs to assist the industrialized countries rather than the developing countries. They wereformal exercises that served the purpose of proving that the industrialized countries were fulfilling theirobligations to the developing countries. In fact, they were largely donor-driven exercises that served theinterest of the donors more than they did those of the recipients.
Oddly, years after the OECD and UN systems had changed their language from technical “assistance” to
technical “cooperation,” on the grounds that the word “assistance” denoted a top-down process, one inwhich the donors were assumed to possess all knowledge and the recipients were simply passive agents,the WTO stuck to the term “technical assistance.”
17 This was not accidental. The vocabulary of
“assistance” was indeed the top-down ethos indicative of the patronizing and overbearing style of muchof the “technical assistance” that was offered by the WTO to the developing countries.
It also became clear that the developing countries could not take full advantage of the globalization process unless industrialized countries fulfilled their part of the deal, especially in relation to the provisionof special and differential treatment to the developing countries and the LDCs. In other words, the
problems did not lie solely with the “capacity gap” of the developing countries to implement theirobligations. Nor did they lie solely in the supply constraints within these countries. An important area thathad to be looked into was the “capacity gap” within industrialized countries as well, for evidently they
lacked the capacity, or the will, to fulfil their part in creating an enabling environment in which thedeveloping countries could benefit from the process of globalization. It also became clear that for thedeveloping countries to take full advantage of the multilateral trading system, they needed to preparethemselves better in the art and skills of negotiation.
Building Negotiating Capacity and Moving Toward Alternative Modes of Capacity
Building and Developing Country Self-Reliance
Once a critical mass of developing country negotiators in Geneva became aware that they needed to prepare better for future negotiations, it was clear that it was not enough to adapt and conform to thecompliance demands of the Uruguay Round Agreements, ex post . It was also necessary, ex ante, to
prepare to negotiate on matters of concern to them. And once it became evident that the WTO could not be counted on to provide support that was genuinely needed by developing countries, Third WorldIntergovernmental Organizations (IGOs) and NGOs began to address this matter for themselves.
17 In 1991 the DAC/OECD [The Organisation for Economic Co-operation and Development’s (OECD)Development Assistance Committee] issued “Principles for New Orientations in Technical Co-operation,” adocument that emphasized local control and capacity development rather than a top-down approach to what was
until then called technical “assistance.”
8/13/2019 Reality of Trade - The WTO and Developing Countries
http://slidepdf.com/reader/full/reality-of-trade-the-wto-and-developing-countries 72/106
66 The North-South Institute
Foremost among these was the Third World Network (TWN), an NGO based in Penang, Malaysia, thatstarted out as a consumer association and branched into issues of the environment and trade. The TWN
began by organizing briefing sessions with trade negotiators based in Geneva, and developing close linkswith a number of Third World countries that were later to form the “Like-Minded Group” (LMG). TheLMG became an important nucleus of a few countries from the South (the numbers varied from 13 to 20,depending on personalities and circumstances) whose Geneva-based delegations sought to provide an
independent analysis of trade-related issues, and to develop collective negotiating positions.
UNCTAD soon saw a niche role in the process. It took the initiative for developing a “positive list” ofitems that developing countries could advance in future negotiations as a way of proactively engaging inthe negotiations rather than waiting for the industrialized countries to dictate the agenda to them. In 1997,it issued an important new initiative called, “Uruguay Round and its Follow-up: Building a PositiveAgenda for Developing Countries.” Concurrently, the South Centre, a centre created at the end of the
Nyerere-led South Commission, started a program of training and analysis of trade-related issues ofconcern to developing countries. Not much later came an initiative from Southern Africa. Called theSouthern and Eastern African Trade Information and Negotiations Initiative (SEATINI), it aimed atfacilitating the creation of real capacity for trade analysis and negotiations among African countries.
UNCTAD, TWN, the South Centre and SEATINI are mentioned here because they are best known to theauthor, but they were not the only bodies that provided alternative sources of information and analysis tothose provided by the WTO and other mainstream “technical assistance” providers. The WTO and tradeissues were becoming major issues of concern for an increasing number of civil society organizations,locally and globally, which began to question the presumed benefits of globalization and liberalization.The movement received encouragement and an inspiring boost when they were able, collectively, todefeat the OECD-shepherded attempt to negotiate the Multilateral Agreement on Investment (MAI),which could have freed the movement of capital from all national regulatory and control mechanisms.The French government finally relented under pressure and the MAI died — only, however, to beresurrected la ter at the WTO Doha Ministerial.
Among the civil society organizations and movements, there were those that were opposed to the
capitalist system as a whole, and there were others that were single-issue oriented, focusing on issues suchas agriculture, TRIPS, health, environment, labour standards, women’s rights, human rights, and so on.The various actors were not necessarily in agreement on several of these issues. The important point isthat the developing country negotiators in Geneva and in the capitals now had access to a plethora oforganizations and initiatives other than the mainstream bodies such as the WTO, the ITC, the IMF, theWorld Bank, and the official bilateral donor agencies. Among these alternative sources wereorganizations such as the International Centre for Trade and Sustainable Development (ICTSD), theCentre for International Environmental Law (CIEL), Médecins sans frontières, Oxfam, the Institute forAgriculture and Trade Policy (IATP), the Development Gap, ActionAid, World Development Movement(WDM), the World Council of Churches (WCC), Environnement et développement du tiers monde(ENDA), Women's Environment and Development Organization (WEDO), Lawyers for Human Rights,and scores of others.
All these developments were converging just as the WTO was preparing for the third WTO MinisterialConference in Seattle, USA, in November 1999. Before proceeding further, it would be useful torecapitulate and summarize some of the developments that had direct bearing on the capacity-buildingefforts of the developing countries:
• The increasing awareness of the limitations and futility of the compliance-focused technicalassistance program of mainstream technical assistance agencies, especially the WTO.
8/13/2019 Reality of Trade - The WTO and Developing Countries
http://slidepdf.com/reader/full/reality-of-trade-the-wto-and-developing-countries 73/106
The Reality of Trade: The WTO and Developing Countries 67
• The assumed benefits of globalization without debate or discussion in the WTO, UNCTAD, theITC, and other bilateral organized technical assistance programs.
• The supply and infrastructural constraints within developing countries, especially LDCs.
• The non-tariff barriers, subsidies, and other anomalies in the system that prevented developingcountries from making full gains from the system.
• The capacity deficit, or lack of will, on the part of the industrialized countries to fulfil their
commitments to the developing countries within the Uruguay Round Agreements.• The need for developing countries to better prepare for future negotiations, ex ante rather than
adjust to the industrialized country-dominated agenda ex post .
• The emergence on the scene of independent efforts by Geneva-based developing countryambassadors and by IGOs and NGOs from the developing countries to develop methods based oncollective self-reliance.
• The global movement against globalization and the appearance on the scene of a plethora ofindependent bodies concerned about the inequities of the WTO and the Bretton Woods system.
As indicated earlier, matters came to a head just before the third WTO Ministerial Conference. Theincreasing awareness, especially among African trade negotiators about the inequities of the system, aswell as institutional support from bodies that could provide an alternative analysis, created the possibility,for the first time, for a real challenge to the industrialized countries. This possibility was aided,furthermore, by the fact that, fortuitously, the Tanzanian Ambassador to Geneva, Ali Mchumo, held thechairmanship of the General Council at the time. The combination of these factors enabled the developingcountries to put upfront not only a list of their own “positive agenda” for the Seattle Ministerial, but also alist of over 200 issues left over from Marrakech and Singapore that needed to be implemented.
These “Implementation Issues” arose as a result of identifying the asymmetries and imbalances in theUruguay Round Agreements, and the discovery that industrialized countries lacked the will to play theirown part in making the system work so that the developing countries could derive legitimate benefitsfrom the WTO and the multilateral trading system. The developing countries argued that theseasymmetries within the system should be remedied without reciprocal concessions from the developingcountries because they were inherent anomalies in the system. The industrialized countries, on the other
hand, argued that they could not do so, and that the “implementation issues” formed part of the packagethat was to be negotiated at Seattle. They insisted on a “new round”. So the technical assistance programsmounted by the mainstream organizations (especially the WTO) and donor-financed technical assistance
programs began to concentrate on persuading developing country negotiators that the best solution lay in placing implementation issues within the context of a new round of trade negotiations, expected to belaunched at Seattle.
The controversy between “new round” versus “implementation issues” became the central focus of debateand of “technical assistance” programs preceding Seattle. The story of what happened at Seattle is wellknown. Of relevance to this paper is the manner in which the promise of “technical assistance” became,once again, a ploy to get the developing countries to agree to a new round of negotiations. The CanadianMinister of Trade, for example, was chair of one of the six committees that were set up at Seattle in order
to carry out “hearings” from the delegates whilst, behind-the-scenes, hard negotiations were proceeding inthe so-called “green” rooms, from which most of the developing countries were excluded. In thecommittee chaired by the Canadian minister, developing country members raised several issues onimplementation. But every time such an issue was raised, the chairman turned it into an issue for technicalassistance. His point, which he pursued doggedly, was that the Committee should endorse negotiations fora “new round” because the implementation issues could always be taken care of by asking the WTO andthe donors to provide “technical assistance” to the developing countries. In other words, he either
8/13/2019 Reality of Trade - The WTO and Developing Countries
http://slidepdf.com/reader/full/reality-of-trade-the-wto-and-developing-countries 74/106
68 The North-South Institute
completely missed the point made by the developing country delegates, or was consciously manipulatingthe process away from the concerns of the developing countries.
18
While developing countries, through their own initiatives, shifted toward collective self-reliance onmatters of analysis and in preparing for negotiations, the WTO remained within its old paradigm of
providing “technical assistance” to enable the developing countries to comply with and conform to the
demands of the Uruguay Round Agreements. However, at the Second Ministerial Conference inSingapore in November 1996, the developed countries agreed to hold a special conference to examine thespecial needs of the Least Developed Countries (LDCs) in an integrated manner. It was becoming clearthat the LDCs faced serious supply-side and institutional problems, and that technical assistance that waslimited to compliance issues was not good enough. In October 1997, the WTO organized a High-LevelMeeting for LDCs, where it was decided that six agencies — the ITC, the IMF, UNCTAD, the UNDP,the World Bank, and the WTO — would take joint responsibility for the implementation of an integratedframework (IF) for delivering trade-related technical assistance to the Least Developed Countries.
The integrated framework, however, did not function as well as expected. According to a July 6, 2000 press release, the heads of the six agencies met in New York “to discuss better ways of delivering trade-related technical assistance to the world’s poorest countries.” WTO Director-General Mike Moore, who
chaired the meeting, said: “We all know the IF has not been working as well as it should and we are putting in place new arrangements to rectify the situation. We have a responsibility, shared withgovernments and other agencies and institutions, to do better in assisting the LDCs to integrate into theworld economy.” In a joint statement, the six heads set out the following new points for the IF:
Agree to seek donor support for and voluntary contributions to an Integrated FrameworkTrust Fund (IFTF) for the purpose of mainstreaming trade and trade-related assistanceinto development architecture. The IFTF would finance: i) the formulation by countriesof trade integration strategies as part of their Poverty Reduction Strategy Papers (PRSPs);ii) project preparation and design of trade capacity-building projects in areas that areidentified as priorities in the PRSP; iii) regional projects that do not fall within the scopeof the CG/RT process; and, iv) limited and urgent capacity-building activities for LDCs
for which no PRSP will be prepared or where CGs/UNDP Round Tables are not taking place (including in an appropriate time-frame). The funding objective for the period2001-2003 is set at US$20 million.
In other words, trade was now seen as part of the broader framework of “poverty reduction.”
Another development that the main agencies undertook was the JITAP — Joint Integrated TechnicalAssistance Programme. Whilst the IF was directed at the 49 LDCs, the JITAP was initially targeted ateight countries — four LDCs and four developing countries. It set itself five objectives:
1. Develop national capacity to understand and manage WTO Agreements;2. Strengthen trade and export policy and negotiating capabilities;
3. Improve institutional mechanisms to carry out the WTO Agreements;4. Develop supply-side response to multilateral trading system opportunities;5. Improve access to export business services and performance tools.
JITAP set up a Common Trust Fund of US$10 million, to be disbursed under two windows. Window Iwas for unearmarked contributions, which would be used to finance national needs assessments, project
18 The author, then a member of the Zimbabwe delegation, was an eye-witness to the above scenario.
8/13/2019 Reality of Trade - The WTO and Developing Countries
http://slidepdf.com/reader/full/reality-of-trade-the-wto-and-developing-countries 75/106
The Reality of Trade: The WTO and Developing Countries 69
development and advisory missions, activities for the collective benefit of participating countries, andcomplementary or full financing of country projects. Window II, for earmarked contributions, would beallocated to specific country projects. Managed by the ITC, the Fund would be guided by a SteeringGroup consisting of donors, beneficiary countries, and the secretariats of the ITC, the WTO andUNCTAD.
JITAP, like the IF, has not done as well as expected. An independent evaluation of JITAP undertaken in2000 analyzed, among the reasons for its poor performance, the excessive centralization of decision-making in Geneva. Since then efforts have been made to make JITAP more sensitive to the local andregional environment, but a new evaluation is awaited to see if the new arrangements have made anydifference.
As we move into the present period, it is necessary to acknowledge that at the Doha Ministerial in November 2001, the industrialized countries managed to regain control over the process that they had lostat Seattle. Through a skilful use of pre-Doha seminars (heavily funded by the donors), massive publicrelations work energetically carried out by the WTO’s Mike Moore and the EC’s Pascal Lamy (amongothers), and skilful manipulation of the processes at Doha itself, the industrialized countries were able tosecure more or less what they had wanted at Seattle. They have also been able to get the consensus of the
developing country trade ministers on a new program of action in the name of a “development round.”
On the question of technical assistance, as in all previous Ministerial conferences, the promise of“technical assistance” became, once again, one of the means of securing the consensus of developingcountry ministers on a new round. For example, the same Canadian trade minister who had chaired one ofthe committees at Seattle was, once again, one of the six “facilitators” appointed by the Chair at the DohaConference. He used exactly the same methods to secure compliance of the African ministers with regardto a new round, that is, promising that matters that worried them would be “taken care of” under technicalassistance programs.
19 Technical assistance provisions are included in paragraphs 16, 22, 25-27, 33, 38-
40, 42, and 43 of the Doha Ministerial Declaration (WTO 2001). Two observations need be made aboutthis. One is that paragraphs 16, 22, and 25-27 deal with the “new issues” (the so-called Singapore issuesof investment policy, competition policy, government procurement and trade facilitation) that were
strongly opposed by a bulk of the developing countries as items for future negotiations. Consensus wasderived at the last minute by the Chairman of the Conference by clarifying, at the insistence of India, thatnegotiations on these issues would begin only if there was “explicit consensus” on them at the nextMinisterial. The other measure that apparently enabled to secure developing country, especially African,compliance was the offer of technical assistance in these issues. Technical assistance, then, becomes avital part of these paragraphs as a means of ensuring that by the time the next Ministerial takes place (inMexico in September 2003), the industrialized countries are in a position to argue that the developingcountries have been given ample “technical assistance” in these matters, and so they cannot now refuse tonegotiate on them. Following the Doha Conference, the WTO/UNCTAD set up the Doha DevelopmentAgenda Global Trust Fund of about US$17.5 million for technical assistance. Two-thirds of the fund isreserved for technical assistance on the four Singapore issues — 50% on the issue of investment alone(Patel 2002).
The second observation about the provisions of technical assistance in the Doha declaration is that theWTO has gone back to the IF and the JITAP as the “models” for technical assistance, even thoughindependent evaluators have been critical of these models, and the agencies know this. Paragraph 39 ofthe Doha Declaration reads:
19 The author was in attendance at the particular meeting chaired by the Canadian minister, this time as an official in
the Uganda delegation.
8/13/2019 Reality of Trade - The WTO and Developing Countries
http://slidepdf.com/reader/full/reality-of-trade-the-wto-and-developing-countries 76/106
70 The North-South Institute
39. We underscore the urgent necessity for the effective coordinated delivery of technicalassistance with bilateral donors, in the OECD Development Assistance Committee and relevant
international and regional intergovernmental institutions, within a coherent policy framework andtimetable. In the coordinated delivery of technical assistance, we instruct the Director-General toconsult with the relevant agencies, bilateral donors and beneficiaries, to identify ways of
enhancing and rationalizing the Integrated Framework for Trade-Related Technical Assistance toLeast-Developed Countries and the Joint Integrated Technical Assistance Programme (JITAP).
Before drawing conclusions, it may be instructive to analyze why donor-driven programs, such as those inthe WTO itself, the IF, and JITAP, have not performed as well as programs that are in the control of thedeveloping countries themselves.
Why Donor-Driven Technical Assistance Tends to Under-Perform
In the mid-1980s, the UNDP initiated a recipient-driven exercise in evaluating technical cooperationcalled NaTCAPs — National Technical Cooperation Assessment and Programmes. Based on some 15African country studies, the final report came out as “Rethinking Technical Cooperation: Reforms forCapacity Building in Africa,” (UNDP 1993. Berg Report). In its conclusions it made this very importantobservation:
Two generations ago, technical cooperation was universally esteemed. Early students ofeconomic development and all who were concerned with world poverty believed it to bea straightforward and powerful device … Quite suddenly, all this has changed. In the1980s, technical cooperation has been subjected to a growing barrage of criticism (UNDP1993, pp.243-44).
Almost a decade later, the UNDP brought out another study — “Capacity for Development: NewSolutions to Old Problems” (UNDP 2002). In summarizing the past experience of technical cooperation,it stated that donor-driven technical assistance is frequently criticized for the following:
Undermining local capacity: Rather than helping to build sustainable institutions and othercapabilities, technical cooperation tends to displace or inhibit local alternatives.
Distorting priorities: The funding for technical cooperation generally bypasses normal budgetary processes, escaping the priority-setting disciplines of formal reviews.
Choosing high-profile activities: Donors frequently cherry-pick the more visible activities thatappeal to their home constituencies, leaving recipient governments to finance the other routine
but necessary functions as best they can.
Fragmenting management: Each donor sends its own package of funds and other resources for
individual programs, and demands that recipients follow distinctive procedures, formats andstandards for reporting, all of which absorb scarce time and resources.
Using expensive methods: Donors often require that projects purchase goods and hire expertsfrom the donor country, although it would be far cheaper to source them elsewhere.
Ignoring local wishes: The donors pay too little attention either to the communities who aresupposed to benefit from development activities, to the local authorities, or to NGOs, all of whomshould comprise the foundation on which to develop stronger local capacity.
8/13/2019 Reality of Trade - The WTO and Developing Countries
http://slidepdf.com/reader/full/reality-of-trade-the-wto-and-developing-countries 77/106
The Reality of Trade: The WTO and Developing Countries 71
Fixating on targets: Donors prefer activities that display clear profiles and tangible outputs.Successful capacity development, on the other hand, is only intrinsically included.
Another study by a Tanzanian economist argues along similar lines. In a keynote address to the AfricanCapacity Building Foundation (ACBF) conference in Bamako, Mali, in October 2001, he had this to say
on the question of “Sources of Donor Assistance Failures”:
The problem with donor assistance can be summed up as being rooted in supply-drivenapproaches to capacity building. Much donor-financed capacity building has been basedon donor analysis rather than country demand as their starting point and has consisted oftransfer models and approaches developed by outsiders. …. Most African governmentsdo not play a meaningful role in the analysis of capacity problems and in the design ofsolutions to address them. The “African Voice” in designing capacity building projectsand programs is often muted or unheard and as a result, there is a tendency to reproducedonor notions and preferences for capacity, and subvert local ownership. Most effortstherefore end up as supply driven exercises, which are unsuccessful (Wangwe 2001).
In the landmark UNDP 2002 study, an intergovernmental agency, for the first time, tried to go below thesurface and identify the reasons why the problems of technical assistance continue to persist. This is whatit says:
The old model has been based on two mistaken assumptions in particular. The first is thatit is possible simply to ignore existing capacities in developing countries and replacethem with knowledge and systems produced elsewhere — a form of development asdisplacement, rather than development as transformation. The second assumptionconcerns the asymmetric donor-recipient relationship — the belief that it is possible fordonors ultimately to control the process and yet consider the recipients to be equal
partners.
To put it bluntly, it is essentially the lack of ownership that explains the poor performance of donor-driven technical assistance. Underlying the ownership issue are the asymmetrical power relations betweenthe donor and the recipient. “The asymmetry issue,” the UNDP study says, “is inevitable. Donors willalways ultimately control the funds and where they are disbursed. The recipient’s final recourse is the exitoption — simply to reject any assistance with which it is dissatisfied.” That, however, is not always easy.There is a strong inclination on the part of the recipients to conform to what the donors desire. In the
process, however, the recipients receive the money, the consultants, and much else in the technicalassistance “baggage” that is not really necessary for the success of the project. And so the old problems
persist.
Conclusions and Recommendations
One lesson that emerges from a close analysis of technical assistance provision under the dominant WTO(and Bretton Woods) system is that “technical assistance” is not a value-free project. It is, in fact, a deeply
political project. The industrialized countries that provide the funds and the technical experts drive the process and consciously use “technical assistance” to secure a certain politically motivated agenda. In thecase of the WTO, the industrialized countries have consciously, and deliberately, used the promise oftechnical assistance both to divert the attention of the developing countries from issues of central concernto them, and to get them to agree to the agenda set by industrialized countries.
8/13/2019 Reality of Trade - The WTO and Developing Countries
http://slidepdf.com/reader/full/reality-of-trade-the-wto-and-developing-countries 78/106
72 The North-South Institute
The second interesting observation to make specifically about the WTO is that it has learned nothing fromthe previous experience of the UNDP and other bilateral and multilateral providers of technicalassistance. Strangely, even the donor countries that, under other structures such as those of theDAC/OECD (The Organisation for Economic Co-operation and Development’s (OECD) DevelopmentAssistance Committee) and the UNDP, have recognized and moved away from top-down approaches to
the provision of technical assistance, and have recognized the importance of ownership when it comes tothe WTO are strangely oblivious to the obvious contradictions in their own positions. The WTO appearsto be an odd animal that continues to feed on outdated, and failed, concepts of technical assistance.
The only answer to this dilemma is for developing countries to create their own capacity, with or withoutdonor assistance. After all, as the 2002 UNDP study argues, capacity building is not a means tosomething else; it is an end in itself. The developing countries must build their capacity for their ownsake. Only then can they own the process of developing independent skills and institutions for tradenegotiations and for the larger development effort itself. In other words, capacity building cannot bereduced to “human resource” development. Developing individual skills is important. But it is alsonecessary to develop sustainable institutional structures, and societal resources that sustain both theindividuals and the institutions.
Where do the mainstream provisions of technical assistance, such as those provided for in the WTO, andthe UNCTAD/WTO post-Doha “Plan” for technical assistance to the developing countries, fit into this
paradigm? In fact, they do not. They are anomalies in the context of the knowledge we already have aboutthe futility of donor-driven technical assistance programs. Nonetheless, they are a reality. Rightly orwrongly, those are the programs where the money is. All that the developing countries can hope for is thatat least some of the donors recognize the fact that it is not in their interest to put money into concepts thathave failed. Also, within the context of the WTO, the developing country representatives in Geneva andin capitals could seek to influence the allocation of the Doha-promised Trust Fund so that it is directedinto processes and projects that arise out of their own needs rather than out of the needs of the donors.
The other alternative for the developing countries is to take advantage of the scores of NGOs and civil
society alternative movements that have accumulated knowledge, done analysis , and gained experiencethrough activist work. Many of them are located within industrialized countries, and share the general
perception of the developing countries that the WTO is an unjust system and needs to be put right. Butthere are many that are based in the developing countries themselves, and which now have some expertiseon trade-related issues and modes of negotiation.
We end with one final word for EC Trade Commissioner Pascal Lamy. He was earlier quoted to say thatthe rich countries must help develop developing countries’ build capacity to negotiate in the WTO, evenif this goes against the immediate interests of the industrialized countries, because it would help improvethe WTO’s legitimacy. He is right. But the way the WTO is going about it is not the right way to build itslegitimacy. There are better ways. Pascal Lamy might want to exercise his considerable influence to pointthe WTO in the right direction.
8/13/2019 Reality of Trade - The WTO and Developing Countries
http://slidepdf.com/reader/full/reality-of-trade-the-wto-and-developing-countries 79/106
The Reality of Trade: The WTO and Developing Countries 73
References
Canadian International Development Agency (CIDA). “The Impact of the Uruguay Round on theDeveloping Countries,” final report on 19-country study undertaken for CIDA by the Centre for the Studyof International Economic Relations, University of Western Ontario, London, Canada, 1996.
Agosin, Tussie and Crespi. “Developing Countries and the URA: evaluation and issues for the future,”UNCTAD, International Monetary and Financial Issues for the 1990s. Vol. VI. Geneva: UNCTAD,1995.
Correa, C. “The TRIPS Agreement: Implementation Problems in Developing Countries”, paper presentedat the Third World Network seminar on the WTO and Developing Countries, Geneva, September 10-11,1996.
Das, B.L. “Implementing the Uruguay Agreements: What Next?”, paper presented at the Third World Network seminar on the WTO and Developing Countries, Geneva, September 10-11, 1998.
Michalopoulos, C. “Developing countries’ participation in the World Trade Organization,” Policy
Research Working Paper 1906. Washington, DC: World Bank and WTO, 1998.
Patel, K. “UNCTAD’s post-Doha Plan of technical assistance and capacity building,” SUNS, 2002.
South Centre. Challenge to the South, Report of the South Commission, OUP, 1990.
South Centre. “The Uruguay Round Agreements and the WTO Work Programme: Tasks for DevelopingCountries.” Geneva: South Centre, 1998.
The Economist. June 23, 2001.
UNCTAD. International Monetary and Financial Issues for the 1990s Vol.VI . Geneva: UNCTAD, 1995.
UNCTAD. “Strengthening the Participation of Developing Countries in World Trade and the MultilateralSystem”, TD/375, Geneva, May 1996.
UNCTAD. Uruguay Round and its Follow-up: Building a Positive Agenda for Developing Countries.Geneva: UNCTAD, 1997.
UNCTAD. The Least Developed Countries 1998 Report . Geneva: UNCTAD, 1998.
UNDP. Rethinking Technical Cooperation: Reforms for Capacity Building in Africa (The Berg Report). New York, 1993.
UNDP. Sakiko Fukuda-Parr, Carlos Lopes and Khalid Malik. Capacity for Development: New Solutionsto Old Problems. New York: Earthscan, 2002.
Vocke, M. “Investment implications of selected Uruguay Round agreements and the proposed multilateralagreement on investment,” IMF Working Papers (WP/97/60). Geneva: IMF, 1997.
Wangwe, S. “Human Resource and Institutional Development in Africa,” Keynote Address at the AfricanCapacity Building Foundation Conference, Bamako, Mali, October 22-24, 2001.
8/13/2019 Reality of Trade - The WTO and Developing Countries
http://slidepdf.com/reader/full/reality-of-trade-the-wto-and-developing-countries 80/106
74 The North-South Institute
Weston, A. “Uruguay Round: Unravelling the Implications for the LDCs,” International Monetary and Financial Issues for the 1990s Vol.VI . Geneva: UNCTAD, 1995.
WTO. Report of the General Council to the 1996 Ministerial Conference, vols. I and II.(WT/MIN/(96)/2). Geneva: WTO, 1996a.
WTO. “Implementation of the Uruguay Round Provisions in Favour of Developing Country Members,”(WT/COMTD/W/16). Geneva: WTO, 1996.
WTO. “Inventory of Trade-Related Technical Assistance Activities Conducted by the IMF, UNCTAD,UNDP, World Bank and WTO,” paper presented for the High-Level Meeting on Integrated Initiatives forLeast Developed Countries Trade and Development. (WT/LDC/HL/9). Geneva: WTO, 1997.
WTO. “Implementation of the Uruguay Round Provisions in Favour of Developing Country Members,”Committee on Trade and Development (WT/COMTD/W/35). Geneva: WTO, 1998a.
WTO. “Report of the Director General to WTO Ministers on the High-Level Meeting on IntegratedInitiatives for Least Developed Countries’ Trade Development.” (WT/COMTD/W/40). Geneva: WTO,
1998b.
WTO. “Report on Technical Cooperation and Training: 1997.” Committee on Trade and Development(WT/COMTD/W/36). Geneva: WTO, 1998c.
WTO. The Results of the Uruguay Round of Multilateral Trade Negotiations: The Legal Texts.Cambridge: Cambridge University Press, 1999.
WTO. Doha Ministerial Declaration. (WT/MIN(01)/DEC/W/1). Geneva: WTO, November 14, 2000.
8/13/2019 Reality of Trade - The WTO and Developing Countries
http://slidepdf.com/reader/full/reality-of-trade-the-wto-and-developing-countries 81/106
The Reality of Trade: The WTO and Developing Countries 75
Chapter 7
Implementation of the WTO Agreement on Agriculture in India
Pranav Kumar
The Uruguay Round (UR) of multilateral trade negotiations was completed in 1994 with the signing ofthe Marrakesh Declaration. Among the most significant accomplishments of the Uruguay Round was itsfocus on agricultural trade and the resulting new disciplines on agricultural trade policy. Up to 1995, therules of the General Agreement on Tariffs and Trade (GATT) were largely ineffective in disciplining keyaspects of agricultural trade. In particular, export and domestic subsidies came to dominate many areas ofworld agricultural trade, while the stricter disciplines on import restrictions were often flouted. TheUruguay Round negotiations went a long way toward changing all that. This chapter will first outline theresults of these negotiations, the WTO Agreement on Agriculture (AoA). Next, it will examine theimplementation and the impact of this agreement on the agricultural sector in India.
Agriculture trade is now firmly established within the multilateral trading system. Under the Agreementon Agriculture, member countries agreed to reduce agricultural support and protection substantially byestablishing disciplines in the areas of market access, domestic support, and export subsidies. Undermarket access, countries agreed to open markets by prohibiting non-tariff barriers, converting existingnon-tariff barriers to tariffs, and reducing tariffs. Members also agreed to reduce expenditures on exportsubsidies and the quantity of agricultural products exported with subsidies. Domestic support reductionswere realized through commitments to reduce the Aggregate Measure of Support (AMS), a numericalmeasure of the value of most trade-distorting domestic policies. The agreement was implemented over a6-year period, to 2000.
Though the original GATT 1947 applied to trade in agriculture, it allowed various exceptions to the rules,
which led to severe distortions in world agricultural trade. For instance, the GATT 1947 allowedcountries to use export subsidies on agricultural primary products, whereas export subsidies on industrial
products were prohibited. The GATT rules also allowed countries to resort to import restrictions (e.g.import quotas) in the agricultural sector under certain conditions, notably when these restrictions werenecessary to enforce measures to effectively limit domestic production. The result of all this was a
proliferation of impediments to world agricultural trade. When the Uruguay Round of trade negotiationsstarted in 1986, one of the most important goals was to remove trade distortions in the agricultural sectorresulting from different levels of input subsidies, price and market support, export subsidies, and otherkinds of trade-distorting support across countries.
WTO Agreement on Agriculture
Prior to the Uruguay Round Agreement on Agriculture (URAA), GATT rules on trade in agricultural products were limited and often ineffective. A number of exceptions exempted agricultural products frommost of the disciplines applying to manufactured goods. As a result, countries often resorted to measuressuch as export subsidies, which are not permitted in other sectors, as well as a multitude of non-tariff
barriers that restricted agricultural trade. The URAA was a turning point in the reform of the agriculturaltrade system. Countries agreed to reduce agricultural support and protection substantially by establishing
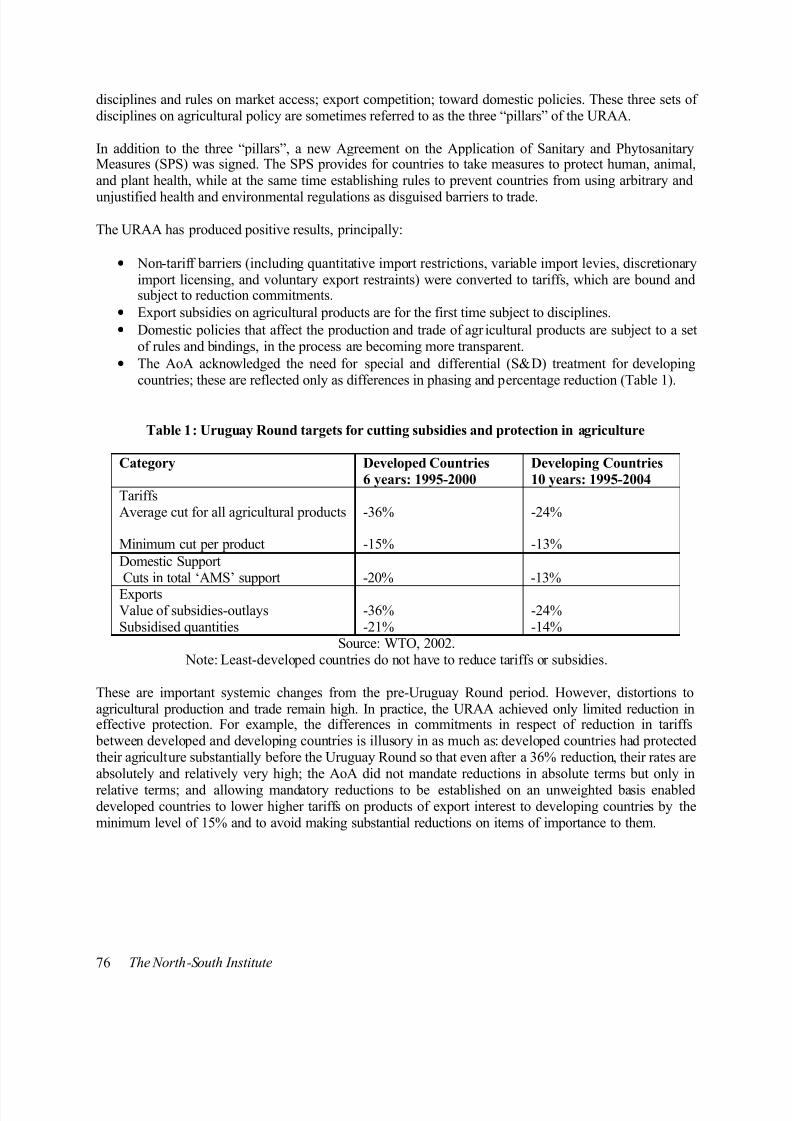
8/13/2019 Reality of Trade - The WTO and Developing Countries
http://slidepdf.com/reader/full/reality-of-trade-the-wto-and-developing-countries 82/106
76 The North-South Institute
disciplines and rules on market access; export competition; toward domestic policies. These three sets ofdisciplines on agricultural policy are sometimes referred to as the three “pillars” of the URAA.
In addition to the three “pillars”, a new Agreement on the Application of Sanitary and PhytosanitaryMeasures (SPS) was signed. The SPS provides for countries to take measures to protect human, animal,and plant health, while at the same time establishing rules to prevent countries from using arbitrary and
unjustified health and environmental regulations as disguised barriers to trade.
The URAA has produced positive results, principally:
• Non-tariff barriers (including quantitative import restrictions, variable import levies, discretionaryimport licensing, and voluntary export restraints) were converted to tariffs, which are bound andsubject to reduction commitments.
• Export subsidies on agricultural products are for the first time subject to disciplines.
• Domestic policies that affect the production and trade of agr icultural products are subject to a setof rules and bindings, in the process are becoming more transparent.
• The AoA acknowledged the need for special and differential (S&D) treatment for developingcountries; these are reflected only as differences in phasing and percentage reduction (Table 1).
Table 1: Uruguay Round targets for cutting subsidies and protection in agriculture
Category Developed Countries
6 years: 1995-2000
Developing Countries
10 years: 1995-2004TariffsAverage cut for all agricultural products
Minimum cut per product
-36%
-15%
-24%
-13%
Domestic SupportCuts in total ‘AMS’ support -20% -13%
ExportsValue of subsidies-outlaysSubsidised quantities
-36%-21%
-24%-14%
Source: WTO, 2002. Note: Least-developed countries do not have to reduce tariffs or subsidies.
These are important systemic changes from the pre-Uruguay Round period. However, distortions toagricultural production and trade remain high. In practice, the URAA achieved only limited reduction ineffective protection. For example, the differences in commitments in respect of reduction in tariffs
between developed and developing countries is illusory in as much as: developed countries had protectedtheir agriculture substantially before the Uruguay Round so that even after a 36% reduction, their rates areabsolutely and relatively very high; the AoA did not mandate reductions in absolute terms but only in
relative terms; and allowing mandatory reductions to be established on an unweighted basis enableddeveloped countries to lower higher tariffs on products of export interest to developing countries by theminimum level of 15% and to avoid making substantial reductions on items of importance to them.
8/13/2019 Reality of Trade - The WTO and Developing Countries
http://slidepdf.com/reader/full/reality-of-trade-the-wto-and-developing-countries 83/106
The Reality of Trade: The WTO and Developing Countries 77
WTO Agreements Related to Agriculture
The AoA is only one of 28 Uruguay Round agreements. There are other WTO agreements that influencefree and fair trade in agriculture. The agreement on Sanitary and Phytosanitary (SPS) measures is one thathas direct bearing on agricultura l trade. In other agreements, a few provisions influence trade inagriculture. The issue of patenting plant varieties, as per the Agreement on Trade-Related Aspects of
Intellectual Property Rights (TRIPS), is an example. Some of these WTO agreements are briefly presented below:
Agreement on Sanitary and Phytosanitary M easures (SPS)
The agreement on SPS recognizes the right of a government to take measures to ensure food safety and to protect animal and plant health. The agreement requires that such measures be applied only to the extentnecessary to meet these ends. The measures must be based on scientific criteria and not serve as disguised
protectionist measures. A number of relevant international standards are provided by specializedinstitutions, such as the Codex Alimentarius Commission for Human Health, the Office International desEpizooties (OIE, World Organisation for Animal Health), and the International Plant ProtectionConvention (IPPC). These standards are recognised by the WTO and the protection measures pertaining
to them are accepted. On the other hand, any national legislation leading to a stricter protection of trademust be justified scientifically.
Agreement on Technical Barr iers to Trade (TBT)
The agreement on TBT is another amongst the WTO agreements that have indirect bearing on trade inagriculture. It covers all technical regulations and procedures to evaluate conformity other than thoseconcerning human, animal, and plant health covered by the SPS agreement. The agreement requires thattechnical standards and regulations should not be drawn up with the aim of restricting trade. It encouragesthe use of international standards and calls for national testing and certifying bodies to avoiddiscrimination against imports, and as far as possible, recognition of other countries’ tests and certificates.It also includes elaborate procedures for notification and consultation, and provisions for technical
assistance to developing countries and for greater flexibility for these countries.
Agreement on Trade-Related Aspects of I ntellectual Property Rights (TRIPS)
This is a very important agreement because it incorporates the trade in “ideas” within the sphere of theWTO’s activities. It obliges signatory countries to define in their national legislation the minimalstandards for protecting intellectual property, as well as the means to ensure compliance with thesenorms. Agriculture in developing countries is very much affected, since this agreement covers all livingorganisms (animals, plants, micro-organisms, genes, etc.). It clearly addresses the question of theappropriation of seeds, biological resources, or traditional knowledge and, in exchange, the cost of accessto them and their use. In a country like India where a significant proportion of the population is still living
below the poverty line, farmers losing rights over seeds will adversely affect food security for millions of
poor people.
Indian Agricultural Trade: A Brief Overview
A major proportion of Indian farm produce goes toward supplying food for the country’s population andraw materials for industry. Seventy-five per cent of the country’s population is still in rural areas and hillyterrain and 60-70% of GDP from agriculture comes from subsistence agriculture. Although agriculturecontributes about 25% of GDP, India’s share in total world merchandise trade is not significant. Overall,
8/13/2019 Reality of Trade - The WTO and Developing Countries
http://slidepdf.com/reader/full/reality-of-trade-the-wto-and-developing-countries 84/106
78 The North-South Institute
with a negligible 0.7% share in world imports and 0.6% in exports, India is not very visible in the arena ofinternational trade. For the last few years, India has experienced record foodgrains production. The year1999-2000 registered foodgrains output of 208.9 million tonnes, which included 89.5 million tonnes ofrice and 75.6 million tonnes of wheat. Commercial crops too did fairly well, except for oilseeds andcotton. But at the same time, more than 200 million people are living below the poverty line and go to bedhungry.
Liberalization of world trade in agriculture has opened up new vistas of growth. India has a competitiveadvantage in several agricultural commodities because of near self-sufficiency of inputs, relatively lowlabour costs and diverse agro-climatic conditions. These factors have enabled the export of severalagricultural commodities over the years, such as cereals, cashews, tea, coffee, spices, oil meals, fruits andvegetables, castor, and tobacco. For certain commodities, like basmati rice, India has a niche marketaccess in spite of competition. Agricultural exports have a sizeable share of about 18-20% in India’s totalexports. Agricultural imports are about 5-6% of total imports in the country. Only a few commodities,like edible oil, cotton, pulses, and wood and wood products, are imported.
In the post-WTO period, raising the level of productivity and quality standards to internationallycompetitive levels is one of the major challenges before the Indian agriculture sector. As per the WTO
AoA, India has also dismantled quantitative restrictions on nearly all items during 1990-2001, with a viewto enabling better market access for the rest of the world and also to making its products competitive. At
present, for several commodities, India’s national productivity is less than the world average.
Pursuant to the Uruguay Round agreements, India has also undertaken many steps toward reforming itsagricultural sector. India has dismantled quantitative restrictions in five phases to enable better marketaccess and provide quality and cheap products to domestic consumers. This step was taken to fulfill thecommitments under the AoA market access clause. As shown below, the Aggregate Measurement ofSupport (AMS) has already been proven negative in the case of India. Therefore, India does not need toreduce its subsidies. On the export subsidy front, not many significant measures were required from India,as Indian exporters do not get any direct export subsidy. Apart from these measures, India also took someunilateral steps to liberalize its agricultural sector. For example, in January 1994, the government
abolished the minimum export price of basmati rice; in March 1994, import controls on sugar and cottonwere removed; in February 1995, a major decision was taken to put almost all edible oils (except coconutoil) under open general license.
India’s Obligations Under AoA and Implementation Status
Market Access
All member countries are required to convert non-tariff barriers into tariff barriers and submit ceilingtariff bindings for all commodities. In other words, the AoA states that there can be no restrictions onfarm trade except through tariffs. Tariffs resulting from this “tariffication process” as well as other tariffs
are to be reduced by a simple average of 36% over 6 years in the case of developed countries and 24%over 10 years in the case of developing countries.
India has submitted high tariff bindings of 100%, 150%, and 300% respectively for primary products, processed products and edible oils, except for certain items (comprising about 119 tariff lines), whichwere historically bound at a lower level in the earlier negotiations. Out of these low-bound tariff lines,
bindings on 15 tariff lines, which included skimmed milk powder, spelt wheat, corn, paddy, rice, maize,millet, sorghum, rape, colza and mustard oil, fresh grapes, and other items, were successfully negotiated
8/13/2019 Reality of Trade - The WTO and Developing Countries
http://slidepdf.com/reader/full/reality-of-trade-the-wto-and-developing-countries 85/106
The Reality of Trade: The WTO and Developing Countries 79
under GATT Article XXVIII in December 1999 and the binding levels were revised upward to provideadequate protection to the domestic producers.
India has maintained quantitative restrictions for balance of payment reasons. It has followed a consistent policy of gradual removal of restrictions on imports since 1991, when the domestic economic reformswere initiated. The process of removing import restrictions on balance of payment grounds has been
completed with the removal of restrictions on 715 remaining items in the Export-Import Policyannounced on March 31, 2001. Quantitative restrictions are, however, still being maintained on about 5%of tariff lines (538 items), as permissible under Article XX and XXI of GATT, on grounds of health,safety, and moral conduct. Most of them are agricultural products (GOI 2002).
Out of the 715 items on which quantitative restrictions were removed, there were 342 textile products,147 agricultural products including alcoholic beverages, and 226 other manufactured products, includingautomobiles. Imports of agricultural products like wheat, rice, maize, other coarse cereals, copra, andcoconut oil were placed in the category of State Trading. The nominated State Trading Enterprise willconduct the imports of these commodities according to commercial considerations (GOI 2001a). India hasnot made any commitment to provide minimum market access opportunities. Other countries that hadtariffied their quantitative restrictions had to offer minimum access to the extent of 3% of their domestic
consumption, going up to 5% at the end of the implementation period. India is not entitled to use theSpecial Safeguard Mechanism of the Agreement, as only countries that have tariffied can use it. India can,however, take safeguard action under the WTO Agreement on Safeguards if there is a surge in importscausing serious injury or if there is a threat of serious injury to domestic producers.
Domestic Support
The AoA distinguishes between three types of production support, grouped into “boxes”: green(permitted), amber (to be reduced, with an upper limit), and blue (subsidies that are tied to programs thatlimit production). There are also exemptions for developing countries in the form of special anddifferential (S&D) treatment.
Domestic support measures, according to the agreement, are meant to identify acceptable measures ofsupport to farmers and curtail unacceptable trade-distorting support to farmers. Trade-distorting domesticsupport is measured in terms of what is called the “Total Aggregate Measurement of Support,” which isexpressed as a percentage of the total value of agricultural output and includes both product-specific andnon-product-specific support. The AoA stipulates a reduction commitment of total AMS by 20% fordeveloped countries in six years (1995-2000) and by 13-1/3% for developing countries in 10 years (1995-2004), taking 1986-88 as the base period. However, domestic support given to the agricultural sector isallowed — up to 10% of the total value of agricultural produce in developing countries and 5% indeveloped countries. In other words, AMS within this limit is not subject to any reduction commitment.
India has basically two types of support operation for farmers. First, market price support, which takes theform of minimum support prices announced every year by the government for different commodities. In
1998, 24 important crops were covered by the price control measures (WTO 1998). These measures havetwo policy goals. First, they aim at ensuring that farmers receive a minimum remunerative price. But also,traditionally, prices were maintained at lower than market prices, to ensure low costs of food
procurement. Because domestic prices are below international prices, India’s total product-specific AMSis negative. In India, the level of product specific support in the year 1995-96 (the year for which thelatest official information from WTO is available) was negative to the extent of 38.5% (Gulati 2001).
The second support is in the form of input subsidies on inputs like fertilizers, irrigation, electricity, credit,and seeds, which amounted to US$5.8 billion in 1995-96. Direct payments are not given to farmers in
8/13/2019 Reality of Trade - The WTO and Developing Countries
http://slidepdf.com/reader/full/reality-of-trade-the-wto-and-developing-countries 86/106
80 The North-South Institute
India. Since non-product specific support, such as, power, irrigation, fertilizers, etc., amounts to 7.5% ofthe value of agricultural production, the AMS to Indian agriculture could still be well below the level of10% in terms of Uruguay Round stipulations. A negative AMS exempts India from reducing its domesticsupport levels either in aggregate terms or for any individual crops.
In its proposals on the negotiations on AoA, India has suggested that the AMS, as the term suggests, be
calculated as a sum of the product-specific and non-product specific support (WTO 2001). If the product-specific support is still negative in the case of India, then the AMS would be below 7.5% of the value ofagricultural production. As it is, input subsidies to help poor farmers, which come under non-productspecific support, are exempt from reduction commitments under the WTO provisions. If India avails ofthis, the non-product specific support may come down further, to less than half of what is being showntoday (Gulati 2001). In view of this, it may not be in India's interest to fight within the WTO for greaterdomestic support to agriculture, especially if this blunts India’s opposition to farm support and itscriticism of inadequate access to markets in industrialized countries.
Export Subsidies
Export subsidies were subject to a reduction commitment under the AoA, though several kinds of direct
payment were exempted. The export subsidy commitment was in the form of a cut either in budgetaryoutlay or in export quantity. Export subsidy budgets were to be reduced by 36% for developed countriesand 24% for developing countries. The volume of exports receiving subsidies was to be reduced by 21%
per product or group of products for developed countries and by 16% for developing countries. The LDCswere not subject to any reduction commitments. The commitments were defined over commodityaggregates rather than individual tariff lines.
Indian exporters of agricultural commodities do not get direct export subsidy. The only subsidiesavailable to exporters of agricultural commodities are in the form of: income tax exemptions on profitsfrom export sales, and subsidies on freight costs for certain products like fruits, vegetables, andfloricultural products.
Since these payments are exempt from reduction commitments by developing countries during theimplementation period, they will not cause any adverse impact on agricultural exports from India, at leastduring this period. Therefore, India is making use of these subsidies in certain schemes of the Agriculturaland Processed Food Products Export Development Authority (APEDA), especially for facilitatinghorticultural exports. Once the export supplies become self-sustaining, the subsidies will be withdrawn.
Thus, it appears that, of the three commitments that India has made under the URA, at least two areunlikely to have any impact on Indian agriculture because: India is not required to reduce its domesticsubsidy levels, as its AMS is below the cut-off point of 10% (being in fact negative); and India has notsubsidized its exports of agricultural commodities, and hence it remains unaffected by the export subsidyreduction commitments. So the only commitment that can affect Indian agriculture is that of marketaccess or tariffication of quantitative restrictions for balance of payments reasons. However, the balance
of payments justification for India's continued use of quantitative restrictions has come under increasing pressure recently because of the increase in its foreign exchange reserves.
8/13/2019 Reality of Trade - The WTO and Developing Countries
http://slidepdf.com/reader/full/reality-of-trade-the-wto-and-developing-countries 87/106
The Reality of Trade: The WTO and Developing Countries 81
Impact of AoA and Trade Liberalization on India
The momentum to open up Indian agriculture to world markets has mostly come from India’s own program of economic liberalization, initiated in July 1991. In the beginning, agricultural tradeliberalization was never a part of the liberalization agenda. The focus of the structural adjustment programwas on industry, which was increasingly exposed to foreign competition. But the real policy changes on
the agricultural front came only when India signed the WTO AoA. Steps to liberalize agricultural tradewere initiated in early 1994, followed by a number of bolder reforms during 1995 and 1996.
With exchange rate liberalization and an opening up of the economy, the terms of trade for agriculturehave shown a significant improvement. As a result, private investment in agriculture registered a steeprise in the post-reform period. At 1993-94 prices, private investment in agriculture was over 50% higherin 1999-2000 when compared to 1993-94. Exports of agricultural commodities, particularly foodgrains,accelerated in this period. For example, for the first time since independence, India has been a netexporter of foodgrains consecutively for the last six years — net exports amounting, on an average, toaround 1.8mn tonnes per annum (GOI 2001b).
The Export-Import (Exim) Policy 2001 completed the process of dismantling quantitative restrictions on
balance on payments grounds on the remaining 715 items from April 1, 2001. There was concern that theremoval of quantitative restrictions might result in a surge and dumping of imports in the country, thusaffecting adversely the domestic industry. However, these apprehensions were not borne out by actualimport growth over this period. Import data for the full financial year 2000-01 on 714 items, on whichrestrictions were removed with effect from March 31, 2000, do not reveal any surge in their imports (GOI2002). In the light of this evidence, the fears being expressed in certain quarters that foodgrain importsunder the new liberalized trade regime would dampen foodgrain prices in the country were misplaced.
In the post-WTO era, although private investment in agriculture was stepped up in response to theliberalization of the economy and favourable terms of trade, real public investment continued to decline
because of fiscal compression. As a result, the development of infrastructure like irrigation, ruralelectrification, roads, and markets was a major casualty. These shortfalls in public investment and in the
provision of agricultural services account for the failure of agricultural supplies to respond to thefavourable incentive framework created by macroeconomic reforms, including trade liberalization, in the1990s. The average annual growth of GDP in agriculture and allied sectors slowed down in the 1990swhen compared to the preceding decade, while the growth of crop output, especially foodgrains,decelerated (GOI 2001b). The experience of the 1990s clearly demonstrates that, far from tradeliberalization dampening the performance of agriculture, the failure of public investment was responsiblefor the inability to increase and diversify agricultural output in a cost-effective way, and thus, the inabilityto benefit from trade liberalization (Rao 2001).
Future Strategy
India’s stand on agriculture in the WTO has to be an integral part of the overall position it takes on tradeliberalization. Domestic policy changes must follow the developments taking place at the WTO. On theexternal front, the major challenge to the viability of agriculture of most developing countries, includingIndia, is posed by developed countries’ high domestic support, export subsidies, and denial of marketaccess through various tariff and non-tariff barriers. India has been fighting in league with otherdeveloping countries in the WTO for the removal of such barriers. In the Doha Declaration, membersonce again committed themselves to comprehensive negotiations on substantial improvement in marketaccess, as well as reductions of, with a view to phasing out, all forms of export subsidies and towarddomestic support.
8/13/2019 Reality of Trade - The WTO and Developing Countries
http://slidepdf.com/reader/full/reality-of-trade-the-wto-and-developing-countries 88/106
82 The North-South Institute
There is also a need for extreme vigilance so as to be able to take timely measures, within the existingtariff bindings, to arrest large imports of certain commodities. Also, since the philosophy behind tradeliberalization is the maximization of global welfare through efficiency gains, mapping out comparativeadvantages across countries for different commodities in a dynamic setting is necessary as a basis formeaningful negotiations in the WTO. The developed countries are very well equipped with technical and
legal expertise, even though these capabilities are used to advance their case for the perpetuation ofdomestic support to agriculture and the restriction of market access, both of which are quite untenable. Onthe other hand, the capabilities of developing countries, including India, are poor in this respect.Therefore, there is a need to give a high priority to the development of these skills in the country (Rao2001).
On the domestic front, a major effort is required raise farm sector productivity by stepping up publicinvestment, by accelerating the evolution and adoption of cost-reducing technologies, and by removingrestrictions on agricultural trade, and marketing processing within the country. All this needs to beachieved through major reforms in governance and institutions, particularly at the state level (Rao 2001).
In September 2000, the Government of India appointed a Task Force on Agriculture (TFA) to assess the
impact of WTO commitments on Indian agriculture and to suggest steps to safeguard the interests of thesector, while exploiting the opportunities presented by this treaty. The TFA, in its final report submittedin August 2001, came out with some very interesting findings. It highlighted the practical difficulties(Box 1) in the form of structural defects and deficiencies of the Indian economy that are hampering the
prospects of farm exports. The TFA also identified some other areas where India can reap advantages inthe international market (Box 2).
Stepping up public investment, bringing timely changes in domestic policy, in tune with development atthe international level, and identifying unexplored markets should be the focus of policy-making in India.Further, in the post-quota-free regime, it has become essential for the Indian government to monitor theinflow of imports and fluctuations in international prices of farm products and take desirable action to
protect the interests of farmers and consumers. The TFA has already listed a few virgin fields where India
can reap a considerable comparative advantage. The national agricultural policy should take this intoaccount and diversify cropping patterns accordingly. Production of organic agricultural products and eco-friendly products has to be encouraged.
At the WTO, India should further step up pressure on developed countries to reduce and phase out theirtrade-distorting domestic support measures and export subsidies. India , in its submission to the WTO, hascalled for a “food security box” or a “Development Box” to address the livelihood and food securityconcerns of developing and poor countries. But it also must be ensured that livelihood and food securityconcerns should not be equated with non-trade concerns, such as the “multifunctionality of agriculture,”used by some developed countries to provide legitimacy to their trade-distorting practices.
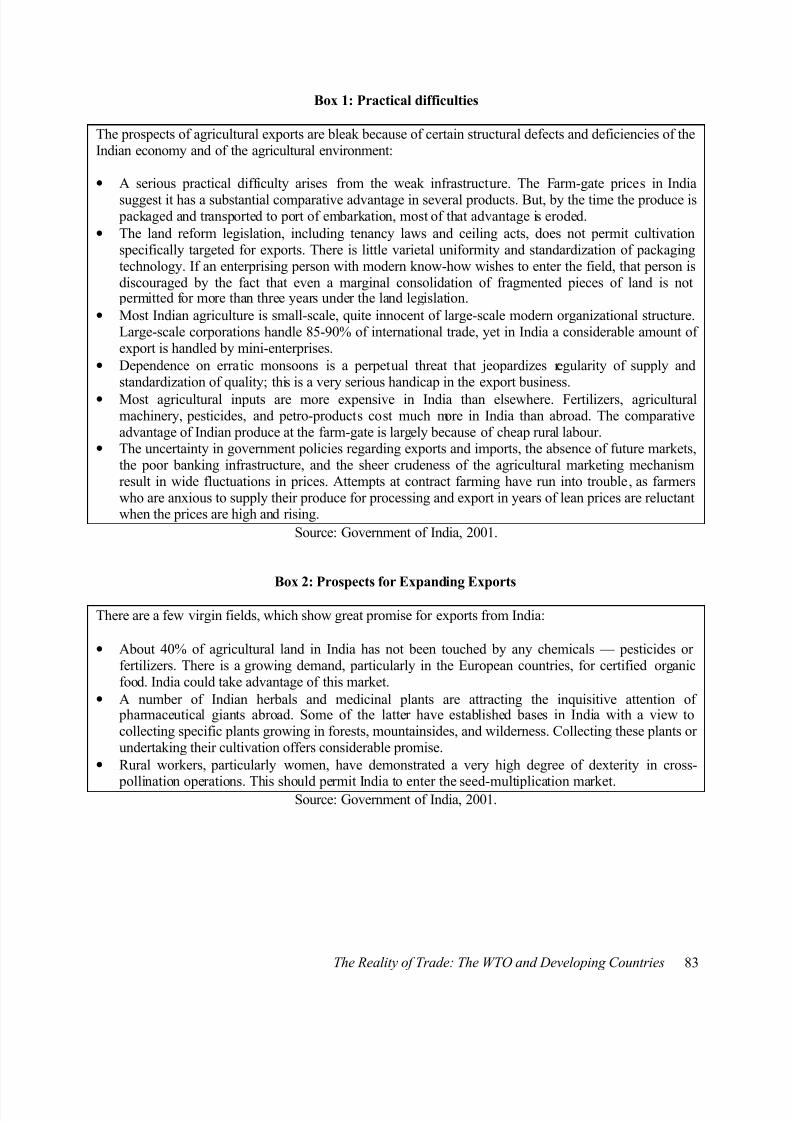
8/13/2019 Reality of Trade - The WTO and Developing Countries
http://slidepdf.com/reader/full/reality-of-trade-the-wto-and-developing-countries 89/106
The Reality of Trade: The WTO and Developing Countries 83
Box 1: Practical difficulties
The prospects of agricultural exports are bleak because of certain structural defects and deficiencies of theIndian economy and of the agricultural environment:
• A serious practical difficulty arises from the weak infrastructure. The Farm-gate prices in India
suggest it has a substantial comparative advantage in several products. But, by the time the produce is packaged and transported to port of embarkation, most of that advantage is eroded.
• The land reform legislation, including tenancy laws and ceiling acts, does not permit cultivationspecifically targeted for exports. There is little varietal uniformity and standardization of packagingtechnology. If an enterprising person with modern know-how wishes to enter the field, that person isdiscouraged by the fact that even a marginal consolidation of fragmented pieces of land is not
permitted for more than three years under the land legislation.
• Most Indian agriculture is small-scale, quite innocent of large-scale modern organizational structure.Large-scale corporations handle 85-90% of international trade, yet in India a considerable amount ofexport is handled by mini-enterprises.
• Dependence on erratic monsoons is a perpetual threat that jeopardizes regularity of supply andstandardization of quality; this is a very serious handicap in the export business.
• Most agricultural inputs are more expensive in India than elsewhere. Fertilizers, agriculturalmachinery, pesticides, and petro-products cost much more in India than abroad. The comparativeadvantage of Indian produce at the farm-gate is largely because of cheap rural labour.
• The uncertainty in government policies regarding exports and imports, the absence of future markets,the poor banking infrastructure, and the sheer crudeness of the agricultural marketing mechanismresult in wide fluctuations in prices. Attempts at contract farming have run into trouble, as farmerswho are anxious to supply their produce for processing and export in years of lean prices are reluctantwhen the prices are high and rising.
Source: Government of India, 2001.
Box 2: Prospects for Expanding Exports
There are a few virgin fields, which show great promise for exports from India:
• About 40% of agricultural land in India has not been touched by any chemicals — pesticides orfertilizers. There is a growing demand, particularly in the European countries, for certified organicfood. India could take advantage of this market.
• A number of Indian herbals and medicinal plants are attracting the inquisitive attention of pharmaceutical giants abroad. Some of the latter have established bases in India with a view tocollecting specific plants growing in forests, mountainsides, and wilderness. Collecting these plants orundertaking their cultivation offers considerable promise.
• Rural workers, particularly women, have demonstrated a very high degree of dexterity in cross-
pollination operations. This should permit India to enter the seed-multiplication market.Source: Government of India, 2001.
8/13/2019 Reality of Trade - The WTO and Developing Countries
http://slidepdf.com/reader/full/reality-of-trade-the-wto-and-developing-countries 90/106
84 The North-South Institute
References
Chand, R. and L.M. Phillip. “Subsidies and Support in Agriculture: Is WTO Providing Level PlayingField?” Economic and Political Weekly XXXVI: 32 (Mumbai, India ) 2001.
Government of India. Exim Policy 2001-2002, Ministry of Commerce and Industry. New Delhi, 2001a.
Government of India. Economic Survey 2000-2001, Ministry of Finance. New Delhi, India, 2001b.
Government of India . Report of the Task force on Agriculture, Ministry of Agriculture, August 10, 2001. New Delhi, India, 2001.
Government of India. Economic Survey 2001-2002, Ministry of Finance. New Delhi, India, 2002.
Gulati, A. Trade Liberalization and Food Security: Challenges to Indian Policy Makers , Washington,DC: International Food Policy Research Institute, 2001.
Gulati, A. and T. Kelley. Trade Liberalization and Indian Agriculture. New Delhi: Oxford University
Press, 1999.
Jha, B. Indian Agriculture and the Multilateral Trading System. New Delhi: Bookwell, 2000.
Rao, C.H.H. “WTO and Viability of Indian Agriculture,” Economic and Political Weekly XXXVI: 36(Mumbai, India) 2001.
Thamarajakshi, R. “Doha Declaration and Agriculture in Developing Countries,” Economic and PoliticalWeekly XXXVII: 1 (Mumbai, India) 2002.
World Trade Organization. Negotiations on WTO Agreement on Agriculture: Proposals by India, January15, 2001.
World Trade Organization. WTO Agriculture Negotiations: The Issues, and Where We are Now. March1, 2002.
World Trade Organization. Trade Policy Review. Geneva: WTO, 1998.
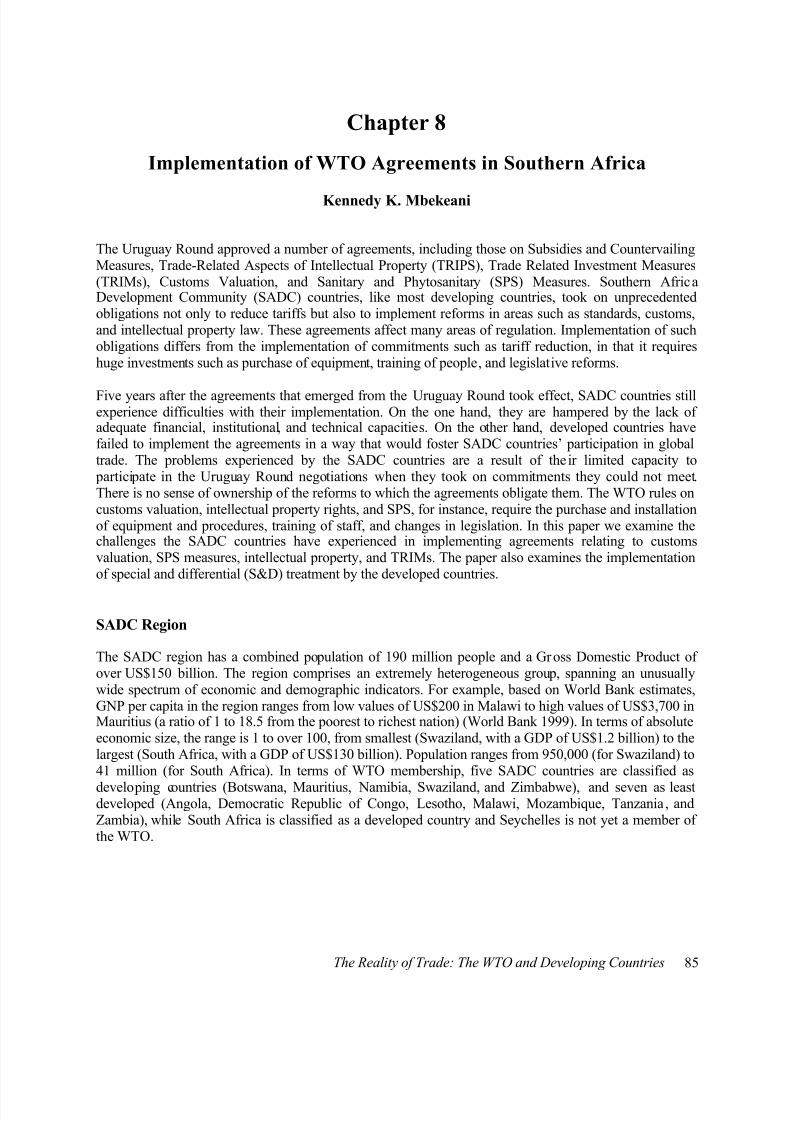
8/13/2019 Reality of Trade - The WTO and Developing Countries
http://slidepdf.com/reader/full/reality-of-trade-the-wto-and-developing-countries 91/106
The Reality of Trade: The WTO and Developing Countries 85
Chapter 8
Implementation of WTO Agreements in Southern Africa
Kennedy K. Mbekeani
The Uruguay Round approved a number of agreements, including those on Subsidies and CountervailingMeasures, Trade-Related Aspects of Intellectual Property (TRIPS), Trade Related Investment Measures(TRIMs), Customs Valuation, and Sanitary and Phytosanitary (SPS) Measures. Southern AfricaDevelopment Community (SADC) countries, like most developing countries, took on unprecedentedobligations not only to reduce tariffs but also to implement reforms in areas such as standards, customs,and intellectual property law. These agreements affect many areas of regulation. Implementation of suchobligations differs from the implementation of commitments such as tariff reduction, in that it requireshuge investments such as purchase of equipment, training of people, and legislative reforms.
Five years after the agreements that emerged from the Uruguay Round took effect, SADC countries stillexperience difficulties with their implementation. On the one hand, they are hampered by the lack ofadequate financial, institutional, and technical capacities. On the other hand, developed countries havefailed to implement the agreements in a way that would foster SADC countries’ participation in globaltrade. The problems experienced by the SADC countries are a result of the ir limited capacity to
participate in the Uruguay Round negotiations when they took on commitments they could not meet.There is no sense of ownership of the reforms to which the agreements obligate them. The WTO rules oncustoms valuation, intellectual property rights, and SPS, for instance, require the purchase and installationof equipment and procedures, training of staff, and changes in legislation. In this paper we examine thechallenges the SADC countries have experienced in implementing agreements relating to customsvaluation, SPS measures, intellectual property, and TRIMs. The paper also examines the implementationof special and differential (S&D) treatment by the developed countries.
SADC Region
The SADC region has a combined population of 190 million people and a Gross Domestic Product ofover US$150 billion. The region comprises an extremely heterogeneous group, spanning an unusuallywide spectrum of economic and demographic indicators. For example, based on World Bank estimates,GNP per capita in the region ranges from low values of US$200 in Malawi to high values of US$3,700 inMauritius (a ratio of 1 to 18.5 from the poorest to richest nation) (World Bank 1999). In terms of absoluteeconomic size, the range is 1 to over 100, from smallest (Swaziland, with a GDP of US$1.2 billion) to thelargest (South Africa, with a GDP of US$130 billion). Population ranges from 950,000 (for Swaziland) to41 million (for South Africa). In terms of WTO membership, five SADC countries are classified as
developing countries (Botswana, Mauritius, Namibia, Swaziland, and Zimbabwe), and seven as leastdeveloped (Angola, Democratic Republic of Congo, Lesotho, Malawi, Mozambique, Tanzania, andZambia), while South Africa is classified as a developed country and Seychelles is not yet a member ofthe WTO.
8/13/2019 Reality of Trade - The WTO and Developing Countries
http://slidepdf.com/reader/full/reality-of-trade-the-wto-and-developing-countries 92/106
86 The North-South Institute
Implementing Uruguay Round Commitments
SADC countries have identified several difficulties they face in implementing the WTO agreements. Themain ones are the Agreement on Trade-Related Aspects of Intellectual Property Rights (TRIPS), theAgreement on Trade-Related Investment Measures (TRIMs), the Agreement on the Application of
Sanitary and Phytosanitary Measures (SPS), and Customs Valuation. They also have problems with howthe Special and Differential provisions are applied.
TRIPS
The SADC developing countries (Botswana, Mauritius, Namibia, Swaziland, and Zimbabwe) were givenuntil January 1, 2000 to implement the TRIPS Agreement; the least-developed SADC countries (Angola,Democratic Republic of Congo, Lesotho, Malawi, Mozambique, Tanzania , and Zambia) have, since theDoha Declaration, until January 1, 2016 to provide patent protection for pharmaceuticals. The agreementrequires each WTO member to adhere to the provisions (with a few provisions excepted) of internationalintellectual property rights conventions, whether or not the member is party to those conventions. This isa major burden for most SADC countries, as it means amending or introducing new intellectual propertylegislation and new or more effective means of enforcement. The technical complexity and specificity ofmany intellectual property rights issues requires training of judges, customs officials, and others involvedin enforcing these rights.
Because of the difficulties with the TRIPS Agreement, SADC countries are proposing that, instead of thearbitrary five-year implementation period granted to developing countries, they should be allowed toapply different degrees of intellectual property protection, depending on the ir level of development. Theyshould be allowed more time and greater flexibility to implement the Agreement until detailed studies areconducted to determine how long it will take and how much it will cost to do so. They recommendstrengthening the technology transfer provisions (Articles 7 and 8), and tightening the obligations fordeveloped countries to provide incentives for their enterprises and institutions to transfer technology toleast-developed countries (Article 66.2).
Trade Related Investment Measures (TRI Ms)
The Trade-Related Investment Measures (TRIMs) Agreement specifies which policies are nowconsidered inconsistent with WTO rules such as minimum local content and trade balancingrequirements. Developing countries had to eliminate inconsistent measures by January 1, 2000, leastdeveloped countries by January 1, 2002. SADC countries would like to retain the flexibility to chooseinvestment promotion policies that they consider necessary to fulfil their developmental needs, includingsome of those listed as inconsistent with the GATT. The TRIMS Agreement poses problems with respectto the short transitional period which should be extended to allow review of the provisions on local-content requirements.
The SADC countries have proposed a reaffirmation that the TRIMs Agreement recognizes the trade,development, and financial needs of developing countries (Article 5.3) , noting that the mandated reviewof the agreement shall entail inter alia an examination of the effects of this Agreement on thedevelopment prospects of developing countries. They propose also that the prohibition on domesticcontent requirements should be removed. Requiring an investor to use a certain minimum amount ofdomestic inputs may be necessary to encourage the expansion of industrial activity, and also to enhancethe beneficial impact of the investment on domestic economic activities.
8/13/2019 Reality of Trade - The WTO and Developing Countries
http://slidepdf.com/reader/full/reality-of-trade-the-wto-and-developing-countries 93/106
The Reality of Trade: The WTO and Developing Countries 87
SPS Measur es
SPS measures deal with animal and plant health and safety, and food safety standards. The WTO does notset standards; rather, the SPS Agreement encourages member countries to use standards set byinternational organizations, but it also allows countries to set their own standards. These standards can behigher than the internationally agreed ones, but the agreement says they should be based on scientific
evidence, should not discriminate between countries, and should not be a disguised restriction to trade.Industrial countries have been leaders in establishing these international conventions, the conventions
being, in significant part, generalizations of industrial country practices and standards. The agreement,therefore, places a heavier burden on developing than on industrial countries. It means standards alreadyin place in the industrial countries were established as the standards to which the developing countriesmust comply.
For SADC countries to use the WTO agreement effectively to defend their export rights or justify theirimport restrictions, they will have to upgrade their SPS system to international standards. This willrequire upgrading veterinary services; laboratories; quarantine stations; disease and pest eradication
programs; training, facilities, and equipment for seed certifications and registration; training, facilities,and equipment control for certification to ensure the absence of chemical residues in exported meat; and
staff and equipment for research aimed at reducing chemical residues. The SPS Agreement requiresmembers to take into account the special needs of developing countries when they prepare theseregulations. However, SADC countries feel they are excluded from the creation of international standardsand are often expected to comply with standards that go beyond their technical ability or financialcapacity. The SADC countries have proposed that technical and financial assistance commitments made
by developed countries, such as those under Article 9 of the SPS Agreement, should be operationalized toallow them more flexibility in applying food, animal, and plant health and safety measures to their
products.
Customs Valuation
The Customs Valuation Agreement establishes the transaction value of the shipment in question as the
primary basis for customs value. In order to achieve the goals of the Customs Valuation Agreement, thereis need for an overall customs reform. Customs valuation is a just a small part of customs reform processrequired to meet the objectives of the agreement. The agreement assumes that already well-functioningand automated customs systems exist, as they do in developed countries. It did not take into account theexisting infrastructure in developing countries, even though it provided for delayed application (untilJanuary 1, 2000) by those countries that were not signatories to the Tokyo Round customs valuation code.Customs processes in most SADC countries exhibit excessive procedures that are not codified, lack ofequipment, poorly trained officials, and low-paid staff. Customs reforms will require technical assistance,training, computerization, reform of administrative and valuation procedures, and legal reforms. Suchreforms are very costly.
Special and Di fferential Treatment
The TRIPS, Customs Valuation, and SPS Agreements, as well as several others, suggest that developedcountry members provide technical assistance to developing country members that request it. The
provisions are designed both to help developing countries implement the Uruguay Round agreements andto accentuate the benefits they might enjoy. The provisions are in two broad categories:
• More flexible terms within specified time limits (for example, longer transition periods andsmaller commitments); and
8/13/2019 Reality of Trade - The WTO and Developing Countries
http://slidepdf.com/reader/full/reality-of-trade-the-wto-and-developing-countries 94/106
88 The North-South Institute
• Clauses that say in broad terms that developed countries should help developing countries inspecific areas (such as technology transfer under intellectual property protection) but withoutdefining exactly what action is needed.
Nevertheless, in the seven years after the Uruguay Round Agreements were adopted, special anddifferential (S&D) provisions have failed to serve the purposes of developing countries. The more
specific S&D provisions of category (a) are usually insufficient and that the broader requirements ofcategory (b) are too vague and often ignored. In most of the WTO provisions, S&D provisions are
phrased only as best endeavour clauses, the implementation of which has remained ineffectual. All S&D provisions should be converted into binding commitments, especially to help developing countriesaddress their supply-side constraints.
Obstacles to Effective Participation
The problems experienced by the SADC countries in implementing these agreements are a result of thelimited capacity to partic ipate in WTO negotiations. The “WTO process” is complex. It has a number ofvery different dimensions, such as: involvement in designing the rules of the multilateral trading system
itself; participation in multilateral trade negotiations; implementation of measures necessary to meet acountry’s obligations to the system as a whole and to its trading partners; and use of the rules andinstitutions of the system to ensure a country’s trading partners respect its rights.
For effective participation in the WTO, a country must have the capacity to fully understand andinternalize the contents, implications and constraints imposed by WTO Agreements. It must alsoarticulate national trade objectives and pursue them effectively in multilateral negotiations; formulate and
pursue trade and development strategies consistent with the country’s WTO obligations; and assert anddefend its trade-related rights against infringements. Participation in the WTO process involves a varietyof national institutions: staff in the home capital responsible for formulating national trade policy; theGeneva delegation (if the country has one) responsible for negotiating trade agreements; and staff in thehome country responsible for implementing trade policy agreements.
In principle, WTO membership allows SADC countries to participate fully in the WTO process and indecisions about the future development of the global trading system. In practice, however, the SADCcountries (like other developing countries) face a number of obstacles to effective participation in theWTO process. These obstacles make it difficult for the SADC countries to draft appropriate legislationand regulations, to meet the requirements for procedural notifications, to staff government institutionswith technical personnel able to implement the policies and commitments undertaken, to monitor trading
partners’ implementation of WTO obligations in order to assess whether market access has been unfairlydenied or trade rights infringed, and to prepare appropriate responses to such infringements.
SADC policy-makers have identified a number of problems that prevent them from participatingeffectively in the WTO process. Many of these countries are very small: as a result, in the researchcommunity there are relatively few economists who are familiar with modern trade theory, empiricaltrade analysis, and the global trading system. There are severe constraints on the availability of funds tosupport the research necessary to underpin high-quality analytical and technical work. There is acorrespondingly limited capacity to absorb research and analysis within the policy community. There aretypically only a small number of well-trained economists in government and even fewer who areknowledgeable on trade issues. Few of these countries participated directly in the Uruguay Round. If theydid provide input into the negotiations, it was typically channelled through a developing countries’coalition rather than through active participation in the negotiations. As a result, there are few officials inthe SADC countries with any extensive personal experience of multilateral trade negotiations. Many
8/13/2019 Reality of Trade - The WTO and Developing Countries
http://slidepdf.com/reader/full/reality-of-trade-the-wto-and-developing-countries 95/106
The Reality of Trade: The WTO and Developing Countries 89
SADC countries are not properly represented in Geneva, if indeed they are represented at all.20
Only eightof the fourteen SADC countries (Botswana, Angola, Lesotho, Mauritius, Mozambique, South Africa,Zambia, and Zimbabwe) have some form of representation at the WTO. Even their representation isinadequate, since the delegations must also cover other UN agencies in Geneva.
There is limited availability and quality of up-to-date trade statistics, let alone suitable computing
equipment giving access to information available in electronic format (in a number of countries theofficers responsible for external trade share a single computer).
21 Responsibility for trade policy
formulation is concentrated in one ministry (the ministry responsible for commerce and industry).22
Thereis no satisfactory mechanism to coordinate work on WTO issues with other ministries, the Genevadelegation, the private sector , and the research and academic communities. There are few if anymechanisms and modalities to link the activities of the academic and research institutions with the policy-makers. The private sector and civil society more generally are not effective participants in trade policyformulation, and do not play a role in articulating negotiating interests.
The SADC countries are constantly engaged in “catching up.” The developed countries pack the WTOnegotiating agenda with issues of concern to them, introducing new issues such as investment andcompetition policy, before the developing countries have learned enough to discuss them meaningfully.
Policy-makers argue that these problems make it difficult to prepare for WTO negotiations and toeffectively participate in the workings of the system. The SADC countries lack the capacity (within bothgovernment and the research community) to do analytical work that will assist the negotiators in dealingwith the many complex WTO issues. The policy-makers have identified the key issues that they wish tosee addressed in the next round of multilateral negotiations. They are of the view, however, that eventhough the issues may have been identified, much more analytical work and training is needed to support
policy-makers during the actual negotiations and to ensure that they have a thorough understanding of theimplications and potential impact of the agreements under discussion at the WTO.
20 The countries have, on average, four professionals in Geneva. Only South Africa has one professional workingspecifically on WTO issues.21 Communication between SADC capitals and Geneva is mostly by fax or letters.22 Only Swaziland and Mauritius combine commerce and industry with foreign affairs.
8/13/2019 Reality of Trade - The WTO and Developing Countries
http://slidepdf.com/reader/full/reality-of-trade-the-wto-and-developing-countries 96/106
90 The North-South Institute
Part IV:Conclusions
8/13/2019 Reality of Trade - The WTO and Developing Countries
http://slidepdf.com/reader/full/reality-of-trade-the-wto-and-developing-countries 97/106
The Reality of Trade: The WTO and Developing Countries 91
Chapter 9
The Doha Round: What Role for Bilateral Development Agencies?
Nizar Assanie
The Doha WTO Ministerial Conference launched a new round of multilateral trade negotiations that, forthe first time, are intended to have development issues at the core of the WTO’s Work Programme (seeWTO 2001). Success of these negotiations will, therefore, depend on the ability of the membership of theWTO to advance the interests of developing countries. In part, this recognition by ministers at Doha is theresult of the growing importance of developing countries in international trade. As a group, thesecountries represented 35% of world trade in 2000 and three-quarters of WTO membership. At the sametime, the consensus reached at Doha is also an acknowledgement by developing countries themselves thatinternational trade is an important tool to further their economic development.
The Doha Work Programme is ambitious in its scope. It not only includes the traditional areas of tradenegotiations (industrial tariffs, agriculture, WTO rules), but also will involve relatively newer areas suchas services, investment, competition policy, government procurement, and trade facilitation. Given thisambitious agenda, the key question that we try to answer here is: What can bilateral donor agencies do tofurther development goals through involvement in trade policy development during the Doha Round?
This question is very pertinent from a public administration perspective. At one level, donor agenciesneed to get involved in the trade policies of their own countries in a substantial manner. This type of
policy engagement is new to most donor agencies that tend to have relatively small policy departmentsfocused on corporate functions. Therefore, greater engagement in this area would involve allocating morestaff resources in the policy units of donor agencies to trade issues. Perhaps more importantly, donor
agencies’ involvement in trade policies implies a shift in the “policy dynamic” in capitals where moreinfluential departments such as Finance, Industry, Trade, and Agriculture, traditionally hold the “policystrings.” At another level, involvement by donor agencies means accelerating their efforts in TradeCapacity Building (TCB) in partner countries. The ultimate objective of TCB is to develop the“machinery of government” in the area of trade policy as a means by which partner countries can developsustainable trade policies that are consistent with their domestic interests.
The remainder of this chapter is organized as follows: Section 1 provides details on the constraints andopportunities that shape industrial countries’ trade policies and negotiating positions vis-à-vis developingcountries, focusing on the Canadian example ; Section 2 highlights the constraints and opportunities faced
by bilateral donors such as the Canadian International Development Agency (CIDA) in trade policy-making. Given these constraints, we provide recommendations on future roles for bilateral donors.
Prospects for Improved Market Access in the New Round
Residual Protectionism
That trade policies of developed countries matter to economic growth in poor countries is no longer anempirical question. Nowhere is this clearer than in the area of market access for goods. In addition to
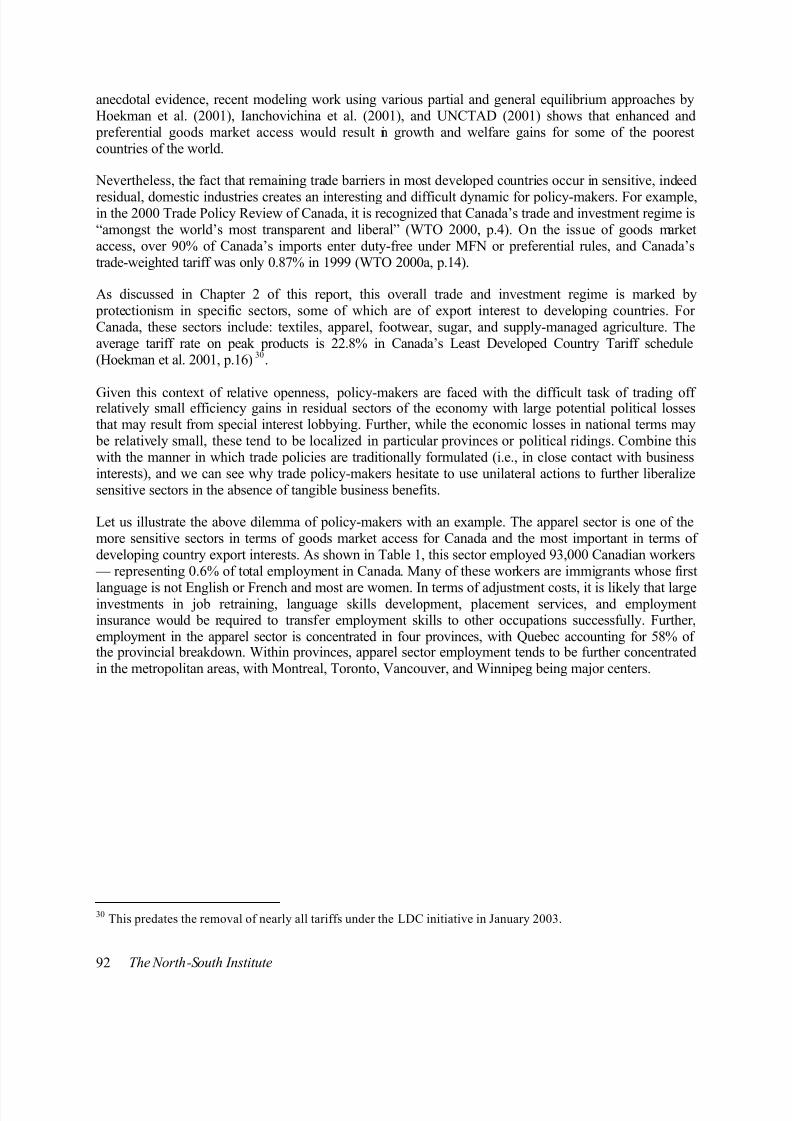
8/13/2019 Reality of Trade - The WTO and Developing Countries
http://slidepdf.com/reader/full/reality-of-trade-the-wto-and-developing-countries 98/106
92 The North-South Institute
anecdotal evidence, recent modeling work using various partial and general equilibrium approaches byHoekman et al. (2001), Ianchovichina et al. (2001), and UNCTAD (2001) shows that enhanced and
preferential goods market access would result in growth and welfare gains for some of the poorestcountries of the world.
Nevertheless, the fact that remaining trade barriers in most developed countries occur in sensitive, indeed
residual, domestic industries creates an interesting and difficult dynamic for policy-makers. For example,in the 2000 Trade Policy Review of Canada, it is recognized that Canada’s trade and investment regime is“amongst the world’s most transparent and liberal” (WTO 2000, p.4). On the issue of goods marketaccess, over 90% of Canada’s imports enter duty-free under MFN or preferential rules, and Canada’strade-weighted tariff was only 0.87% in 1999 (WTO 2000a, p.14).
As discussed in Chapter 2 of this report, this overall trade and investment regime is marked by protectionism in specific sectors, some of which are of export interest to developing countries. ForCanada, these sectors include: textiles, apparel, footwear, sugar, and supply-managed agriculture. Theaverage tariff rate on peak products is 22.8% in Canada’s Least Developed Country Tariff schedule(Hoekman et al. 2001, p.16)
30.
Given this context of relative openness, policy-makers are faced with the difficult task of trading offrelatively small efficiency gains in residual sectors of the economy with large potential political lossesthat may result from special interest lobbying. Further, while the economic losses in national terms may
be relatively small, these tend to be localized in particular provinces or political ridings. Combine thiswith the manner in which trade policies are traditionally formulated (i.e., in close contact with businessinterests), and we can see why trade policy-makers hesitate to use unilateral actions to further liberalizesensitive sectors in the absence of tangible business benefits.
Let us illustrate the above dilemma of policy-makers with an example. The apparel sector is one of themore sensitive sectors in terms of goods market access for Canada and the most important in terms ofdeveloping country export interests. As shown in Table 1, this sector employed 93,000 Canadian workers
— representing 0.6% of total employment in Canada. Many of these workers are immigrants whose first
language is not English or French and most are women. In terms of adjustment costs, it is likely that largeinvestments in job retraining, language skills development, placement services, and employmentinsurance would be required to transfer employment skills to other occupations successfully. Further,employment in the apparel sector is concentrated in four provinces, with Quebec accounting for 58% ofthe provincial breakdown. Within provinces, apparel sector employment tends to be further concentratedin the metropolitan areas, with Montreal, Toronto, Vancouver, and Winnipeg being major centers.
30 This predates the removal of nearly all tariffs under the LDC initiative in January 2003.
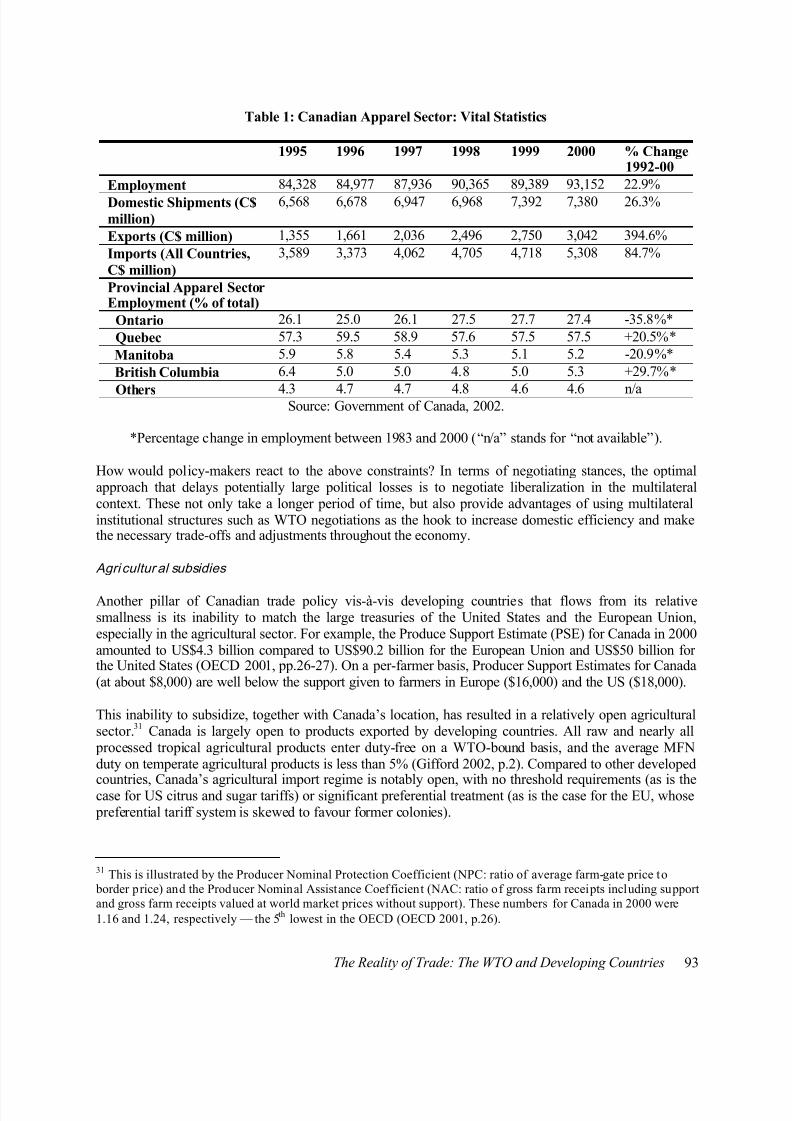
8/13/2019 Reality of Trade - The WTO and Developing Countries
http://slidepdf.com/reader/full/reality-of-trade-the-wto-and-developing-countries 99/106
8/13/2019 Reality of Trade - The WTO and Developing Countries
http://slidepdf.com/reader/full/reality-of-trade-the-wto-and-developing-countries 100/106
94 The North-South Institute
However, pockets of residual protectionism remain — notably in the supply-managed sectors (dairy, poultry, and eggs). Here again, increasing market access outside the multilateral context would erode asystem based on import and production controls and cost-plus pricing (Gifford 2002, p.6). It would alsolead to an erosion of farm values that have been capitalized as a result of production quotas (Gifford2002, p.6).
32
How have Canadian policy-makers reacted to the above constraints? Again, like the apparel sector,multilateral negotiations rather than unilateral action provide significant advantages to Canadianagricultural interests. As pointed out by Gifford, on the export side, Canadian grain, oilseeds, meat, and
processed food producers are internationally competitive and would benefit significantly from furthermarket openings and reduction in subsidies. This emphasis on multilateral negotiations is complemented
by the building of strategic partnerships with like-minded countries, such as members of the Cairns Groupof agricultural exporting countries. These export interests are balanced by interests on the import side, forwhich multilateral negotiations offer the best chance of maintaining a much cherished and politicallysensitive outcome.
Trade Policy-making: What Role for Bilateral Donors?
Given the importance of trade and development issues in the ongoing Doha Round of trade negotiations,what is the role of bilateral donors in the trade policy-making of their own countries? How can bilateraldonors influence those trade policies that, on the one hand, may have a negative impact on development;while on the other, are in the interests of domestic businesses?
In answering these questions, it is useful to keep in mind that trade polic y-making is a dynamic processinvolving many players. As new trade issues (such as environment, health, government procurement, anddevelopment) begin to receive negotiating attention, various government organizations and various levelsof government not previously involved in trade policy will engage on trade issues. For example, in thearea of intellectual property and its relationship to health outcomes of Canadians, we have seen increasinginvolvement by Health Canada (the Canadian federal health ministry) and can also expect provincial
governments to take a keen interest, since health is primarily a provincial area of responsibility in Canada.
Relative to other government departments, however, bilateral donor agencies are in a particularly difficult position when it comes to their role in trade policy-making. Two reasons may be given for this. First,since their mandate is primarily international, bilateral donors do not have an established domestic policyconstituency on trade issues. Continuing on our intellectual property example, Health Canada may have amandate to ensure that the intellectual property rights of innovators are balanced by the health needs ofthe population. In this sense, a Ministry of Health has various definable domestic constituencies that havestanding on intellectual property issues — domestic innovators, generic drug manufacturers, provinces,and citizens — with the “national” interest emerging from the dynamic between these players andgovernment. Donor agencies, however, have a more general mandate of ensuring good health outcomes indeveloping countries — one aspect of which is the global intellectual property regime. As such, they have
no clear domestic constituency, outside perhaps of domestic NGOs engaged in intellectual property andhealth issues in developing countries. While this lack of a domestic constituency and mandate does not
preclude bilateral donor agencies from advocating sound development thinking within the policy-making process, it is clear that such advocacy functions will need to be sustained over a long period of time forthem to be recognized within policy circles.
32 The current estimated value of production quotas is now more than double that of the $7 billion estimated at the
end of the Uruguay Round.
8/13/2019 Reality of Trade - The WTO and Developing Countries
http://slidepdf.com/reader/full/reality-of-trade-the-wto-and-developing-countries 101/106
The Reality of Trade: The WTO and Developing Countries 95
The second reason why bilateral donors are in a particularly difficult position when it comes to their roleon trade policy issues is the internal government policy dynamic in developed countries. Traditionally (asin developing countries), the more powerful ministries in developed countries tend to be the centralministries (like Finance) or those with a large, established, and prominent domestic/international portfolio(like Industry, Agriculture, International Trade, and Foreign Affairs). At the helm of these ministries arerelatively more powerful politicians and bureaucrats wielding considerable influence over the shape that
government policy takes. In short, the “policy strings” on trade policy issues lie with ministries other thandevelopment agencies.
Given this context, what is the role of development agencies in trade policy-making? On the domesticside, there is one broad function — “coalition building.” By this, we mean that even if bilateral donoragencies do not have a clearly defined domestic constituency and even if policy strings lie with otherministries; bringing the development dimension into the policy dialogue provides opportunities to balancethis process and give it more coherence with development policies.
Given the nature of globalization, there will always be some domestic interests that are congruent with pro-development policies. So, for example, on the issue of agriculture subsidies, there is a significantCanadian constituency that opposes the subsidy policies of the United States and the European Union.
This constituency has been successful at translating its interests into Canadian negotiating stances —which happen to be broadly congruent with the demands of developing countries at the WTO. The role ofCIDA, as a bilateral donor agency involved in the domestic policy-making process, is to highlight thedevelopment dimensions of these stances and seek to build domestic coalitions of like-minded interests toimprove upon such negotiating stances, at the margins.
This “coalition building” role can also extend to other, more controversial, issues. Using the intellectual property example once again, there is a domestic Canadian consensus on the importance of intellectual property protection and need for strong multilateral intellectual property laws. This may change in thefuture, particularly if it is determined by key stakeholders (such as citizens’ groups and provinces) thatintellectual property protection comes at high costs (such as lack of access for medicines within Canadafor the poor or inflating health care costs for the provinces). Here again, the role of bilateral donors should
be to push the envelope and continue to build upon existing synergies between good developmentoutcomes and domestic interests.
This requires significant commitment by bilateral donors to dedicate staff resources over a long period oftime in capitals to engage in the policy-making process. Such engagement has public administrationopportunities and risks for bilateral donors. On the one hand, it gives donor agencies a say in the policy-making process as it evolves in capitals. On the other hand, the linkages between such policy functionsand their impact on development are not clear at this stage. Let us take the example of Canadianagricultural trade policy. Here, even if Canadian interests were perfectly aligned with developmentinterests (they are quite close at this stage), it does not necessarily mean that desired outcomes will beachieved in regional or multilateral negotiations, either for Canada or for developing countries. This is
because outcomes in such negotiations involve many countries — with any single country influencing
directions of negotiations at the margins. How much influence bilateral donor agencies have to change thedirections of multilateral negotiations to achieve good development outcomes is, therefore, not clear,
particularly for the vast majority of donor agencies in Europe, where the European trade policy-making process is even more layered than those of other single trading entities like Canada.
On the international side, there is a strong role for bila teral donors to support trade policy development in poor countries. This falls well within the traditional mandates of donor aid agencies, and allowsdeveloping countries to develop policies and negotiating stances that they deem to be in their bestinterests.
8/13/2019 Reality of Trade - The WTO and Developing Countries
http://slidepdf.com/reader/full/reality-of-trade-the-wto-and-developing-countries 102/106
96 The North-South Institute
The much more prominent role played by developing countries in the mandated negotiations onAgriculture and Services at the WTO, and at the Doha Ministerial itself , is a testament not only to theincreased importance that developing countries are attaching to defending their interests at the WTO, butalso to the success of past efforts by donor agencies in helping developing countries formulate their trade
policies — both in capitals and in Geneva. Of course, the overall result in a negotiating environment is
that the trade policies of developed countries are nuanced by the development dimension as expressed bydeveloping countries at the WTO.
We provide two examples here from CIDA programming in this area. Over the past few years, CIDA hasspent or approved more than $9 million to help Caribbean countries develop policies and mechanisms tomeet the growing challenges of trade liberalization. With the erosion of preferential trade agreements, andthe launch of new trade negotiations, the stakes are high for the island economies of the Caribbean. Inorder to meet this challenge, CIDA provided early support to help in the start-up of the Regional
Negotiating Machinery (RNM), which is responsible for preparing the region to participate ininternational trade negotiations. To further develop the region’s capacity to undertake internationalnegotiations, the RNM will also receive $2.5 million in direct support through the five-year, $5 millionRegional Trade Policy Responsive Fund. This new project will further assist the RNM to participate in
international negotiation forums such as the WTO and the Free Trade Agreement of the Americas(FTAA). The RNM also has links with the Organisation of Eastern Caribbean States (OECS) TradePolicy Project funded by CIDA. This five-year, $3 million project builds the capacity of member statesand the OECS Secretariat to participate in and benefit from regional and international trade liberalization.The project will help develop an international trade strategy for the OECS subregion; strengthen thecapacity of OECS member states to meet their obligations under regional and international tradeagreements such as the WTO; and increase their ability to participate in hemispheric trade liberalization,in particular the FTAA. The project also encourages the secretariat, individual government ministries, andsubregional institutions to work more effectively with local private sector players and labour groups.
As key players in the international community’s commitment to halve world poverty by 2015, bilateralaid agencies have a role to play in shaping the trade policies of their own countries and ensuring that these
policies make an important contribution to achieving this goal. While we see significant inroads that can be made by bilateral donor agencies in shaping trade policies, the process will require significantincreases in staff resources and a sustained commitment to engage in the policy-making process. At anygiven time, it would seem that the development impact is a function more of global political economyconsiderations than of the trade policies of any single country. However, a sustained effort by donoragencies over the longer term — both in their domestic policy-making processes and in helpingdeveloping countries formulate their trade policies — should yield better development outcomes frommultilateral trade negotiations.
References
Gifford, Michael. “Agriculture in a New Trade Agenda” in Trade and Development in the New WTOTrade Negotiations. Gerry Shannon and Associates: Ottawa, 2002.
Government of Canada. “Improving Access for the Products of the Least Developed Countries (LDCs) tothe Canadian Market,” Discussion Paper by Government of Canada: March 27, 2002. http://www.dfait-maeci.gc.ca/tna-nac/ldc-dis02-e.asp.
Hoekman, B., F. Ng and M. Olarreaga. Eliminating Excessive Tariffs on Exports of Least DevelopedCountries. World Bank Working Paper 2604: Washington, DC, 2001.
8/13/2019 Reality of Trade - The WTO and Developing Countries
http://slidepdf.com/reader/full/reality-of-trade-the-wto-and-developing-countries 103/106
The Reality of Trade: The WTO and Developing Countries 97
Ianchovichina, E., A. Mattoo and M. Olarreaga . Unrestricted Market Access For Sub-Saharan Africa: How Much Is It Worth and Who Pays? World Bank Working Paper 2595: Washington, DC, 2001.
OECD. Agricultural Policies in OECD Countries: Monitoring and Evaluation 2001, Highlights. OECD:Paris, 2001.
UNCTAD. Duty and Quota Free Market Access for LDCs: An Analysis of Quad Initiatives. UNCTAD:Geneva, 2001.
World Trade Organization. Trade Policy Review of Canada. First Press Release. Document No:PRESS/TPRB/151. 2000.
World Trade Organization. Trade Policy Review of Canada. Report by the Secretariat. Document No:WT/TPR/S/78. 2000a.
World Trade Organization. Ministerial Declaration of the Fourth Session. Document No:WT/MIN(01)/DEC/W/1. 2001.
8/13/2019 Reality of Trade - The WTO and Developing Countries
http://slidepdf.com/reader/full/reality-of-trade-the-wto-and-developing-countries 104/106
98 The North-South Institute
Chapter 10
Lessons for the Doha Round
Chantal Blouin
This book aimed at evaluating the exchange of concessions as it took place between the North and theSouth during the Uruguay Round of multilateral trade negotiations in the late 1980s and early 1990s.
Our assessment points to the asymmetrical nature of the Uruguay Round deal. Industrial countries slightlyimproved access to their markets, but in the important sectors such as agriculture and apparel, barriersremain for imports from developing countries. In the chapters on Canada, the European Union, Japan andthe United States, the authors highlight how the impact of the Uruguay Round in terms of market accessis very limited and describe the key instruments used to restrain Southern imports in some sectors. As forthe Southern part of the deal, the implementation of several of WTO agreements ended up being muchmore costly than expected, beyond the resources and capacity of many developing countries, especially
the poorest ones.
Beyond this assessment, the papers collected here also offer a number of lessons and recommendationsfor the new Doha round of WTO negotiations. Yash Tandon underlines the importance of the capacity of
policy-makers: capacity to participate, to negotiate, and to defend one’s interests. In order not to repeatthe mistakes of the past, he stresses the need to build self-reliant policy capacity. The example of the roleof the loose network of non-governmental organizations (NGOs) and intergovernmental organizationslike UNCTAD, as sources of information for trade negotiators from developing countries, shows thatalternative modes of capacity building can be effective. Trade-related technical assistance was promisedto developing countries in the Uruguay Round; in the new round, the question should be: What type ofcapacity building is being offered?
Kennedy Mbekeani also draws attention to the importance of capacity building to improve the participation of developing countries at the WTO and in various international bodies now involved intrade-related issues through standard-setting. The poorest countries are especially disadvantaged heregiven the very small size of their research and policy community. Many of these countries in Africa, forinstance, did not participate actively in the Uruguay round and did not gain experience in multilateraltrade negotiations as larger developing countries did. Even now, many of them are not represented inGeneva. Moreover, industrial countries keep adding new issues onto the negotiation agenda, adding to thecomplexity facing African and other smaller developing countries. In Cancún in September 2003, WTOministers are considering whether negotiations should be launched on new issues such as investment
protection and antitrust policy. If the Quad is serious about the participation of developing countries,including the smaller and poorer countries, these issues should not be included in the Doha Roundnegotiations.
Another conclusion from our contributors is the central role that agricultural subsidies need to have in thenext North-South deal. Agricultural subsidies in Europe and in the United States not only block access tothese markets but also strongly distort world markets in a number of commodities. Developing countries’own domestic markets become overwhelmed with highly subsidized grains and foodstuffs against whichthe local farmers can hardly compete. These same farmers cannot compete in third markets with suchartificially cheap exports from the North. Moreover, the world prices are depressed, given the increase insupply caused by domestic support; indeed, subsidies create incentives for Northern farmers to increase
8/13/2019 Reality of Trade - The WTO and Developing Countries
http://slidepdf.com/reader/full/reality-of-trade-the-wto-and-developing-countries 105/106
The Reality of Trade: The WTO and Developing Countries 99
production. The depressed world prices have disastrous effects on Southern farmers whose livelihoodsrely on export crops. The new round of WTO negotiations needs to address this problem urgently.
The Uruguay Round presented an important case of asymmetrical negotiations. The “North-South grand bargain” was struck between actors of very different levels of economic development. Traditionally,international relations theorists predict that in negotiations where one country or group of countries has
much more power than the other, the outcome will be in favour of the most powerful actor. In theRealpolitik of trade negotiations, the most powerful actors will have more influence on the content of theagreements. According to this perspective, the asymmetrical outcome of the Uruguay Round was
predictable: Americans, with their Quad allies, were able to convince developing countries through bilateral pressures to sign agreements that involve high costs and relatively little benefits for them. Theinclusion of intellectual property, services, and investment was strongly pushed onto the multilateralagenda by the United States government. Indeed, in the two-level game involved in internationalnegotiations, the American domestic arena was dominated by very active and vocal business groupsasking for the protection of the intellectual property rights on their computer software, movie productions,and genetically-modified seeds in foreign markets. Services firms in telecommunication, transportation,and financial sectors also mobilized to create a powerful political force pushing for the inclusion ofinternational services transactions to be subjected to the disciplines of the GATT and to open new markets
abroad.
Nevertheless, there are many instances of international negotiations where weaker states achieved their preferences, or at least some of their preferred outcomes. Critics of international relations theory stressthat aggregate structural power is not a good variable to explain the outcome of international negotiations.Rather, the key variable is “issue-specific” power. A state can be smaller or weaker overall than the stateon the other side of the negotiating table, but have more resources in one specific area, and thereforesucceed in attaining its objectives in this issue area. The other variable that has been proposed in theliterature to help explain trade negotiations is the tactical variable. It is not sufficient to possess issue-specific power; also critical are the strategies to deploy and use one’s resources. Some studies haveexamined trade negotiations between partners of differential economic strength to evaluate thesevariables, for instance, how Mexico and Canada succeeded in achieving several of their goals in
negotiating free trade agreements with the United States (Robert 2000). Why did such a scenario nothappen at the GATT at the beginning of the 1990s? How can we ensure that this experience does notrepeat itself in the Doha Round of WTO negotiations? Through coalition-building and improvement oftactical capacity, developing countries have already been much more active at the WTO. This processneeds to continue and broaden to include not only the large developing countries like India or Brazil, butalso smaller and poorer economies, especially those in Africa. Allies in developed countries, such ascitizens’ groups and aid agencies, will also be important players by applying pressure from inside toachieve real change in the global trade regime.
References
Robert, Maryse. Negotiating NAFTA: Explaining the Outcome in Culture, Textiles, Autos, and Pharmaceuticals. Toronto: University of Toronto Press, 2000.
8/13/2019 Reality of Trade - The WTO and Developing Countries
http://slidepdf.com/reader/full/reality-of-trade-the-wto-and-developing-countries 106/106