Embed Size (px)
Citation preview
Recommended Practice for the Calibration of Mass SpectrometersJames A. Basford, Mark D. Boeckmann, Robert E. Ellefson, Albert R. Filippelli, David H. Holkeboer, LasloLieszkovsky, and Catherine M. Stupak Citation: Journal of Vacuum Science & Technology A 11, A22 (1993); doi: 10.1116/1.4755937 View online: http://dx.doi.org/10.1116/1.4755937 View Table of Contents: http://scitation.aip.org/content/avs/journal/jvsta/11/3?ver=pdfcov Published by the AVS: Science & Technology of Materials, Interfaces, and Processing Articles you may be interested in High-efficiency cross-beam magnetic electron-impact source for improved miniature Mattauch-Herzog massspectrometer performance Rev. Sci. Instrum. 83, 064101 (2012); 10.1063/1.4729115 Miniature focal plane mass spectrometer with 1000 - pixel modified-CCD detector array for direct ionmeasurement Rev. Sci. Instrum. 76, 025103 (2005); 10.1063/1.1840291 A self-calibrating programable mobility spectrometer for atmospheric ion measurements Rev. Sci. Instrum. 72, 3467 (2001); 10.1063/1.1382634 Mass spectrometer calibration of Cosmic Dust Analyzer AIP Conf. Proc. 505, 967 (2000); 10.1063/1.1303629 Time delay spectrometry for hydrophone calibrations below 1 MHz J. Acoust. Soc. Am. 106, L41 (1999); 10.1121/1.427181
Redistribution subject to AVS license or copyright; see http://scitation.aip.org/termsconditions. Download to IP: 134.71.135.134 On: Sun, 23 Nov 2014 22:42:58
American Vacuum Society Recommended Practice
Recommended Practice for the Calibration of Mass Spectrometers for Partial Pressure Analysis
James A. Basford Martin Marietta Energy Systems, Inc., Oak Ridge, Tennessee 37831
Mark D. Boeckmann Vacuum Technology, Inc., Oak Ridge, Tennessee 37830
Robert E. Ellefson EG&G Mound Applied Technologies, Miamisburg, Ohio 45343
Albert R. Filippelli National Institute of Standards and Technology, Gaithersburg, Maryland 20899
David H. Holkeboer Leybold Injicon Inc., East Syracuse, New York 13057
Laslo Lieszkovszky Tungsram Ltd., Budapest, Hungary
Catherine M. Stupak VG Instruments, Camarillo, California 93011
(Received 1 October 1991; accepted 9 January 1993)
This Recommended Practice addresses issues involved in the use of partial pressure analyzers (PPAs) for quantitative analysis and describes recommended apparatus and procedures for determining resolution and sensitivity of a PPA so that the instrument can be used quantitatively for partial pressure, partial flow and gas composition analysis. This updates previous material in the AVS Standard 2.3-1972 (tentative) by including reference to current pressure transfer standards and computer controlled PP As. This document presents an introduction to PPAs and how they work, definitions pertinent to the use of PP As, equipment needed for calibration, instrument setup prior to calibration and the measurement of sensitivity and linearity by various methods. Four methods of calibration of a PP A are described as follows: (1) the direct comparison of the PP A output with a transfer standard pressure gauge, (2) the indirect comparison of PP A readings with readings of a transfer standard pressure gauge separated by a flow restriction (pressure divider method), (3) comparison of the PPA output with the calculated pressure generated in an orifice~flow system, and (4) calibration of the PPA response to known gas flow rates. The first three methods may be carried out on a test stand of suitable design or in situ. The fourth method requires that the pumping speed during calibration be the same as the pumping speed during use, and normally implies that the PP A is calibrated in situ, Discussion on gas interactions, sources of nonlinearity, stability of sensitivity and quality assurance methods is given.
CONTENTS
I. INTRODUCTION A. Forward B. Disclaimer C. Scope D. Background
n. DEFINITIONS III. APPARATUS
A Partial pressure analyzers and their operation B. Precautions to be observed before calibration C. Systems for calibration D. Gas supply and introduction E, Pressure measurement
IV, MIQ SCALE, RESOLVING POWER, AND BACKGROUND
A. M I Q scale calibration
14.22 J. Vac. Sci. Technoi. A 11(3), May/Jun 1993
B. Measurement of resolving power C. Background scan
V. SENSITIVITY AND LINEARITY MEASUREMENT A Direct pressure comparison B. Pressure divider method C. Orifice flow method D. In situ calibration of a PPA in a process
application VI. DISCUSSION
A. Gas interactions B. Linearity C. Sensitivity D. Stability E. Operator controls and software F. Quality assurance of calibration and analysis
©1993 American Vacuum Society 1.22
Redistribution subject to AVS license or copyright; see http://scitation.aip.org/termsconditions. Download to IP: 134.71.135.134 On: Sun, 23 Nov 2014 22:42:58
A23 Basford et sl.: American Vacuum Society Recommended Practice A23
I. INTRODUCTION
A. Forward
This publication recommends procedures for preparation and calibration of partial pressure analyzers (PPAs) by establishing the correspondence, between the change in ion signal and the corresponding change in partial pressure of the gas from which the ion is produced. This updates previous material in the AVS Standard 2.3-1972 (tentative) by including reference to current pressure transfer standards and computer controlled PP As.
The text was developed by a subcommittee of the A VS Recommended Practices Committee. Subcommittee members are the authors. This material is presented to encourage comment from a wider audience before the text is submitted for A VS Board approval by the Recommended Practices Committee.
B. Disclaimer
This Recommended Practice is based on sources and information believed to be reliable, but the American Vacuum Society and the authors disclaim any warranty or liability based on or relating to the contents of this Recommended Practice.
The American Vacuum Society does not endorse products, processes, manufacturers, and suppliers. Nothing in this publication should be interpreted as implying such endorsement.
C.Scope
This Recommended Practice has two purposes. First, to familiarize users of PP As with the issues involved in the use of these instruments for quantitative analysis. Second, to describe recommended apparatus and procedures for determining resolution and sensitivity of a PP A so that the instrument can be used quantitatively for partial pressure, partial flow and gas composition analysis.
This document is divided into five sections. An introduction to PP As and how they work is given in the present section. Section II contains definitions pertinent to the use of PP As. Equipment needed for calibration is described in Sec. III. Section IV deals with instrument setup prior to calibration. Measurement of sensitivity and linearity by several methods is described in Sec. V.
D. Background
A mass spectrometer is an analytical instrument which separates and detects ions according to their mass-tocharge ratio. A PPA is a mass spectrometer in which the ionizer is immersed in the gas to be analyzed, and the ionizer is characterized by an open construction in which the gas may enter and leave in all directions. It is assumed that the gas is homogeneous and that changes in the gas density with time occur slowly enough that the instrument is always in equilibrium with the gas. Analysis of molecular beams or fast transient events are beyond the scope of this document. A PP A can be used to identify the kinds of molecules present in the gas and, when calibrated. can be
J. Vac. Sci. Technol. A, Volo 11, No.3, May/Jun 1993
......... -'····-.. '<····.·.·.·.·.~.·.·,"7'.· .. ;·.·.:.·.·.7.-.-.-.-.-.'-.•.•.... , ..•
used to determine their concentrations or absolute partial pressures. Except where noted otherwise, this recommended practice applies to all types of PPAs, although PP As based upon the electric quadrupole :filter or the magnetic sector filter are by far the most common. General accounts of PPAs may be found in the literature. 1-3
A partial pressure analyzer is composed of three basic parts: the ionizer, the mass-to-charge ratio filter, and the detector. These three parts are mounted as an assembly on a vacuum flange, which connects to a mating flange on a vacuum vessel containing the gas to be analyzed. In this document, this assembly will be referred to as the measuring head of the PP A. The associated electronic units supply power to the measuring head via cables and electrical feedthroughs on the flange of the measuring head.
The function of the ionizer is to ionize some of the gas atoms or molecules. Commercial instruments usually employ an electron-impact type of ionizer, in which electrons from a hot filament are accelerated through a potential difference of, typically, 70 V. Some gas atoms and molecules will ionize by interaction with the fast electrons. Generally such ionizing collisions will yield positive ions (one or more electrons removed from the target atom or molecule). At very low electron energies (below the threshold for positive ion formation) negative ions can be formed by the process of electron attachment. For each type (species) of gas atom or molecule and depending on the electron energy, electron impact excitation will yield the parent atom or molecule ionized with a charge of plus one or more, and (in the case of molecules) molecular fragment ions with a charge of plus one or more. This characteristic set of positive ions is called the cracking pattern and is often useful in the identification of species and analysis of gas mixtures. The A VS monograph on PP As and partial pressure analysis has a more detailed discussion of this subject.!
The mass filter determines which ions reach the detector at any given time. In the magnetic sector instrument, the ions of different mass-to-charge ratio are separated spatially because of the different trajectories they follow in a magnetic field. In the electric quadrupole filter, which is the type most commonly employed in commercial PPAs, the filtering action is based upon a mass-to-charge ratio dependent orbit stability of the ions as they travel through the transverse rf and dc fields of the filter. Comprehensive accounts of quadrupole theory and applications may be found in the literature.4-6 Both the magnetic sector instruments and the quadrupole-based instruments allow continuous measurement of a specified group of ions. The timeof-flight based instruments on the other hand do not operate continuously. Bunches of ions of equal kinetic energy are injected into a field-free flight tube. The ions are distinguished according to their mass-to-charge ratio by differences in arrival time at the detector.
The detector produces an output signal dependent on the flux of the selected ions. The simplest detector employs an electrometer to directly measure the ion flux or charge reaching the Faraday cup or plate collector. To increase the size of the measured current and to reduce measuring
Redistribution subject to AVS license or copyright; see http://scitation.aip.org/termsconditions. Download to IP: 134.71.135.134 On: Sun, 23 Nov 2014 22:42:58
A24 Basford et til.: American Vacuum Society Recommended Practice A24
time, secondary electron multipliers are often used in place of the Faraday collector. Where stability as well as speed is of importance, pulse counting is used in conjunction with secondary electron multiplication.
If the PP A is to be used only to detect the presence of a particular species, it may be sufficient to calibrate only the mass-to-charge ratio scale of the instrument and to use published cracking pattern data for identification of the species. On the other hand, if one wishes to measure partial pressures or concentrations, a calibration of the instrument's response to the species of interest is necessary.7-12 This is true even if one is only interested in the ratio of pressures of two or more gases in a mixture, because the response of a PP A is species dependent. An underlying, but often unstated, assumption in using a PP A is that there is a linear relation between the partial pressure and the corresponding PP A signal. Calibration also serves to make clear the pressure range over which such a linear relationship holds.
II. DEFINITIONS
The definitions, symbols, and descriptive terminology given below are intended to facilitate discussion of calibration and analytical procedures and to aid in comparing the performance of partial pressure analyzers.
(1) Atomic mass unit (amu). A unit of mass equal to one twelfth the mass of a neutral carbon atom having six protons and six neutrons ( 12e); equivalent to 1.660 540 X 10- 27 kg.
(2) Mass number. M. The mass number M is the sum of the number of protons and the number of neutrons in an atom and, by extension, the number of protons and neutrons in a molecule. As defined here, the mass number is a very convenient and, for most applications a very accurate, approximation to the mass of an ion in atomic mass units (amu).
(3) Charge, Q. The electron charge of an ion. Ion charge occurs in integer multiples of the electron charge e and, in this recommended practice, Q shall be expressed in units of electron charge (e= 1.602177 3xlO- 19 e). For example, Q(A~+) = + 2.
(4) Mass-to-charge ratio, MIQ. The ratio of the mass number M of an ion to its charge Q, measured in units of the electron charge e. For example, doubly charged ions of argon isotope 40 (40A~+) have a nominal MIQ=40/2 =20.
(5) Partial pressure analyzer. PPA. A partial pressure analyzer, also called a residual gas analyzer (RGA), is a gas analysis system composed of three main parts: 0) an ionizer, which produces ions from the gas to be analyzed and directs these ions to (ii) an analyzer or filter, which separates the ions on the basis of mass-to-charge ratio and directs the ions into (iii) a detector, which yields an output signal dependent on the fiux of ions reaching it from the analyzer. Supporting these three main parts are the power supplies, control electronics, electrometer, and cables required for operation.
( 6) Mass range. The range of mass numbers defined by the mass numbers of the lightest and the heaviest singly
J. Vee. Set Technol. A, Vol. 11, No.3, May/Jun 1993
-c ; S .. c
.:=
78 80 82 83 84
M/Q (a mule)
86
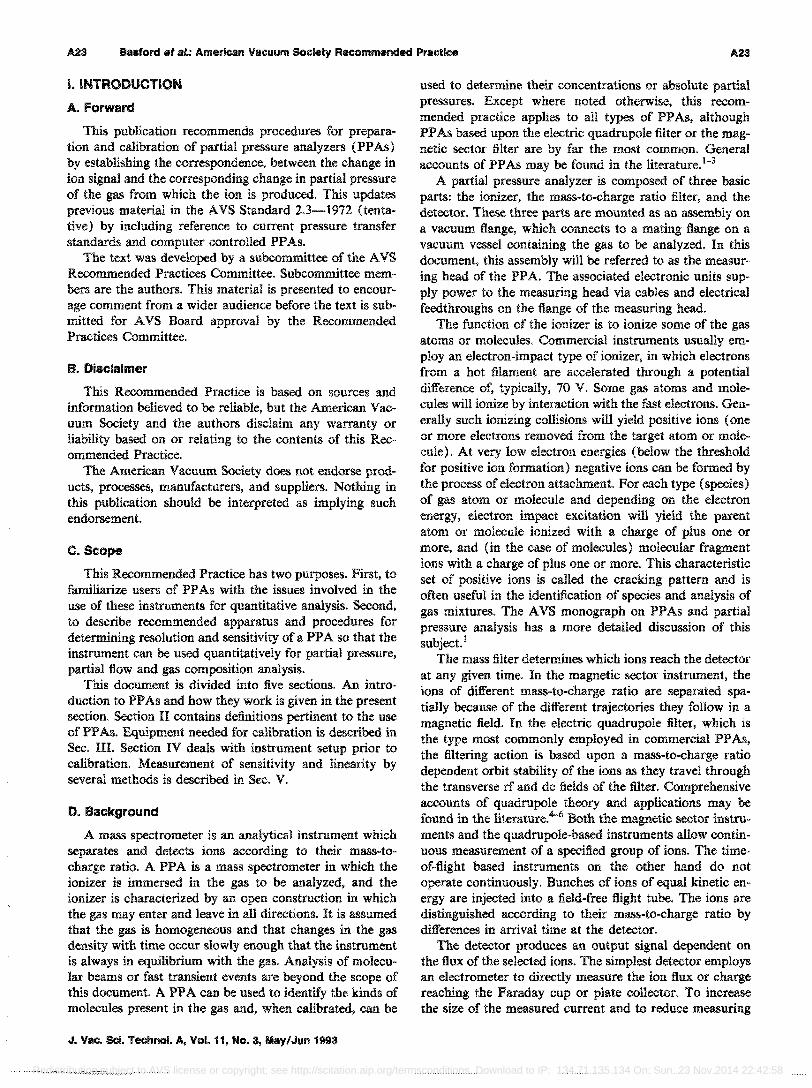
FIG. 1. A mass scan of krypton showing isotopic masses MIQ = 78-86.
charged ions which can be detected by a particular mass spectrometer. It can also specify a range of MIQ values in a scan for reference in discussion of the spectrum.
(7) Scan parameter, X. In a partial pressure analyzer, an instrumental parameter such as voltage, frequency, magnetic field strength, or time delay which is varied so as to vary the mass-to-charge ratio of the ions which reach the detector. This term may also be used interchangeably with some output quantity derived from the scan parameter, such as oscilloscope x-axis drive voltage or a digital display number.
(8) Scan. 0) Any kind of display, analog or digital, generated by the PPA which shows the signals of ions developed as a function of the scanning parameter. Synonyms are mass scan or mass spectrum. Figure 1 shows a scan of the singly charged isotopes of krypton. Oi) The act or process of varying the scanning parameter (s) over all or part of the mass range of the partial pressure analyzer.
(9) Cracking pattern or fragmentation factor. (a) Cracking pattern: The characteristic species of ions which are produced by and unique to the ionization process. For example, electron impact excitation of Nz produces N/, N 2+ 2, N + , and N + 2 ions. This definition is also intended to include the case of multiple ionization of an atomic gas; e.g., the Ar+ and Ar+2 ions from Ar. (b) Fragmentation factor, f: The relative signal strengths of detected ions which are produced from a given chemical species in a partial pressure analyzer under specified conditions of pressure, gas composition and instrument operating parameters. For example, electron impact excitation of CO can produce eo+, C+, C+ 2, 0+ and 0+ 2 ions. If the ion signal peak heights are H[CO+], H[C+], H[C + 2], H[O +], and H[O + 2] and the sum of these peak heights is H*, then the corresponding fragmentation
Redistribution subject to AVS license or copyright; see http://scitation.aip.org/termsconditions. Download to IP: 134.71.135.134 On: Sun, 23 Nov 2014 22:42:58

A25 Basford et al.: American Vacuum Society Recommended Practice A25
-c 1111 IE! ::I .. -.. c
.-:::; -c e ... ::I o c .2
r ~ n
I
H
H"1 1'1 44
, \
I G. )' I i II r ' i ,I' I I,i \ x 100
", ....... ~ ,!. ,,f \ I'\, j,..J k C-IA, .. ,,,,I, ",,'J-~,,.,...- I"' I ",
" ,1"I"~'>",,,X,l '"I ii, i I Ii, iii,. i I I, I i 1'1'", i, 1 iii I I I.", I, i 1
1.0 20 30 40 50
M/Q (smuts)
FIG. 2. A mass scan of an air sample from a computer-controlled PP A. Major components are shown with area under the curve shaded. Minor components are shown with ion current multiplied by 100. Baseline noise is indicated as (1. and peak heights Hi are shown referenced to the appropriate baseline.
factors would be j[eo +] = H[CO + ]/H*, IrC +] = H[C+]/H*, etc. Fragmentation factors are not unique, since they depend on the instrument's properties as well as on the cracking pattern. This is the reason why published "cracking pattern" data is so variable. It is in fact fragmentation factor data, and therefore, instrument dependent.
(10) MIQ peak or mass peak. The complete record or profile, not just the maximum value, of the output signal measured relative to the baseline versus the scan parameter developed from ions of mass-to-charge ratio MIQ. The term "mass peak" refers to the signal developed from sin~ gly charged ions (see Fig. 2), The signal developed from singly charged ions with mass-to-charge ratio 28 for instance, is referred to as the "mass 28 peak."
( 11) Baseline. The output signal from the gas analyzer when no ions are arriving at the detector. This is the ref~ erence level from which peak height [definition (14)] is measured. The baseline is frequently approximated by tuning the instrument to an MIQ value for which the ion signal is negligibly small.
(12) Background signal, Ho. Output signal, measured with respect to baseline, which is obtained before the introduction of any sample or calibration gas. This term may refer to the output signal at a particular MIQ value. When referred to a scan • the term background scan is used.
(13) Background pressure, Po. Total pressure before introduction of the calibration or the sample gas. Usually, background pressure is the lowest pressure achieved in the apparatus in which the partial pressure analyzer operates. However this definition does not restrict background pressure to low values.
J. Vac. Sci. Techno!. A, Vol. 1t, No.3, May/Jun 1993
78 80 82 83 84 86
MIa (amll/e}
FIG. 3. Peak width f1{M2IQ2) 10 defined at 10% peak height and the associated scan parameter 'Ividth X 2 and distance f1X between the MIQ = 84 and 86 (2 amule).
(14) Peak height, H. For a given MIQ peak, the maximum ion signal developed in the partial pressure analyzer (labeled as H in Fig. 2). Peak height is measured with respect to the baseline. Use of arbitrary units for H requires consistency throughout calibration and use.
(15) Peak width, MMIQ)u or aMv' For a given peak, the difference in units of MIQ between the MIQ values on either side of the peak at which the signal has dropped to v% of the peak height H. V is frequently taken as 10. If the mass peak is such that the signal does not drop to v% or less of peak height, this indicates overlapping of adjacent peaks. This peak should not be used for determination of peak width. For the peak labeled M'],IQ in Fig. 3, the arrows denote the 10% of peak height points. Note that other definitions of peak width exist.
(16) Tailing contribution, t±.. The ion signal at the po~ sition (MIQ) ± 1, resulting from the nonzero width of the peak at MIQ. Evidence of tailing can be seen in Fig. 2 at MIQ = 27 due to MIQ = 28. Tailing contribution can be expressed as a percent of the peak height at MIQ. Since peaks are not, in general, perfectly symmetrical, the + and - subscripts are to distinguish values of t obtained at (MIQ) + 1 and (MIQ) - 1 respectively. Examples of this asymmetry can be seen by careful examination of MIQ 40 and 44 in Fig. 2. As a way to characterize a peak shape, this definition is an alternative to that given in definition (15). Tailing contribution is also referred to as "contribution to neighboring peak." Tailing contribution is inversely related to the old term "abundance sensitivity."
(17) Peak separation, II The difference between the values of the scan parameter [definition (7)] corresponding to the peak heights of two known peaks (see Fig. 3). The peak separation establishes an M I Q scale [definition (18)]
Redistribution subject to AVS license or copyright; see http://scitation.aip.org/termsconditions. Download to IP: 134.71.135.134 On: Sun, 23 Nov 2014 22:42:58
A26 Basford fit sl.: American Vacuum Society Recommended Practice A26
which may be used for determining peak width. ( 18) },f/Q scale. The correspondence between the value
of the scan parameter and the MIQ value to which the instrument is tuned. This correspondence is established by scanning over peaks of known MIQ value. For certain types of instruments such as the magnetic sector (with either ion energy scanning or magnetic field scanning), the scan parameter-MIQ relation is inherently nonlinear. For others such as the quadrupole, a nearly linear relation is obtained. The peak separation AX [definition (17)] between two known peaks can be used to establish a linear approximation to the MIQ scale in the interval between the two known peaks.
(19) Resolving power. R. A measure of the ability of a partial pressure analyzer to separate ions according to their mass-to-charge ratio. The width .6.(MIQho of a peak is one measure of this ability. In keeping with long established and widespread usage, the value of R at a particular M I Q is defined in this recommended practice as the dimensionless ratio of MIQ to the peak width .6.(MIQho at that MIQ
R = (MIQ)/.6.(MIQ)lQ'
(20) Number density, n. The number of gas particles per unit volume.
(21) Mole fraction. fr In a mixture, mole fraction of the gas species i is the ratio of the number density ni of the species i to the total number density l:.nj of the mixture.
(22) Partial pressure, In a mixture of gases, the partial pressure of a component is defined as the product of the total pressure of the mixture and the mole fraction of the component. For the range of total pressures in which partial pressure analyzers are useful, a gas mixture behaves as a perfect gas mixture, in which the partial pressure Pi of the ith component is independent of the other components of the mixture. The partial pressure of the jth component of the mixture is the same as the pressure exerted by the ith component acting alone. The partial pressure Pi and the number density ni are related as Pi = nikT, where k = 1.38 X 10 - 23 J/K is Boltzmann's constant, and T is the absolute gas temperature (K). This independence of partial pressures of gas components is the basis for using a PPA, calibrated with pure, single-component gases to analyze mixtures in terms of the partial pressure of each component. An additional assumption is that the PP As response to a given component of the gas mixture depends only on the number density, nj of that component (see Sec. VI).
(23) Calibration. The correspondence, or the act of establishing the correspondence, between the change in ion signal and the corresponding change in partial pressure of the gas from which the ion is produced. This correspondence may be presented graphically as in the graph shown in Fig. 4, or as a table of values of change in ion signal versus change in partial pressure. These changes of signal with partial pressure are computed with reference to background values.
(24) Sensitivity, S. The sensitivity to a particular gas species is defined as the ratio of the change (H - Ho) in
J. Vac. Sci. Technol. A. Vol. 11, No.3, May/Jun 1993
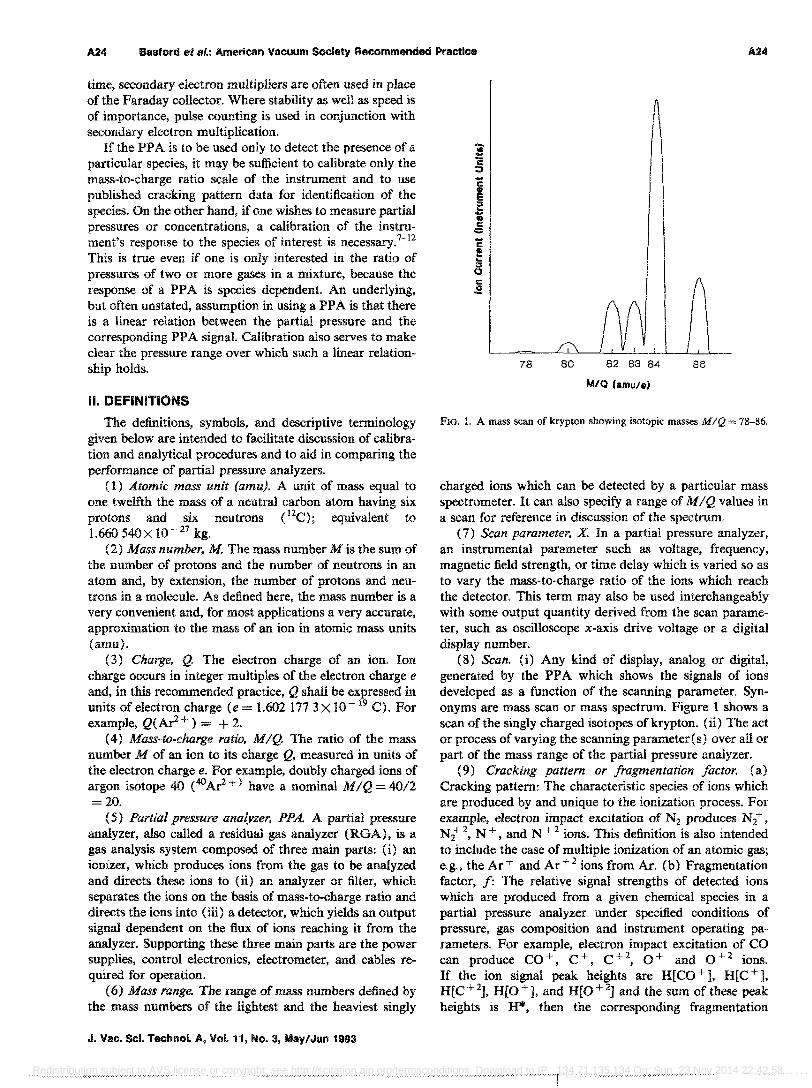
FIG. 4. PPA response (ion current) vs ion source pressure. A linear response is indicated by the dotted line
peak height to the corresponding change (P - Po) in total pressure due to a change in partial pressure of a particular gas species. Ho and Po are background values [see definitions (12) and (13)]
S(P,Po) = (H - Ho)/(P - Po).
The units for sensitivity are ion current per unit pressure (A/Torr, for example). The sensitivity is obtained from the basic calibration data [see definition (23)].
(25) Incremental sensitivity. L The incremental sensitivity is defined as the rate of change of ion signal with the partial pressure at specific total pressure and gas composition. It is expressed in the same units as sensitivity and is the slope dHI dPi of the tangent line at a particular point (Hi,Pi ) on the curve of ion signal Hi versus partial pressure Pi' The essential distinction between sensitivity and incremental sensitivity is that for sensitivity [definition (24)], pressure and ion current are referenced to the background values (Ho,Po) whereas for the incremental sensitivity, these changes are referenced to an operating point (Hi,Pi )
where the instrument is being used. In the linear response region of a PP A, the sensitivity and incremental sensitivity are equal. Incremental sensitivity is an alternate representation of the basic calibration data [see definition (24)J. Incremental sensitivity is only useful in interpreting small changes t:J/i in ion signal in terms of small changes aPi' in partial pressure.
(26) Mass discrimination. The variation of ion transmission through the mass filter and the detection efficiency as a function of mass-to-charge ratio is called mass discrimination. Because the sensitivity of a given instrument depends on factors such as ionization cross section, ionizer parameters, gas pressure, gas composition, cracking pattern, as well as mass discrimination, it is necessary to calibrate each instrument for each chemical species to be analyzed. In isotope analysis it is essential to know the instrument's mass discrimination. Methods for determining mass discrimination are outside the scope of this document. References to such methods can be found in Sec. VI of this document.
Redistribution subject to AVS license or copyright; see http://scitation.aip.org/termsconditions. Download to IP: 134.71.135.134 On: Sun, 23 Nov 2014 22:42:58
A27 Basford et ai.: American Vacuum Society Recommended Practice A27
4r-------------------------------------~
3
"- 2'
:] ... o Dlm.x)' 30 ..
* Dlmax)· 16"
O~~~~~~~~~~~~~~~~~~~~~
tOE-OS 1.I)E-07 tOe--Qe 1.0£0-06 1.0E-04 1.0E-03 1.0E-02
P(Torr)
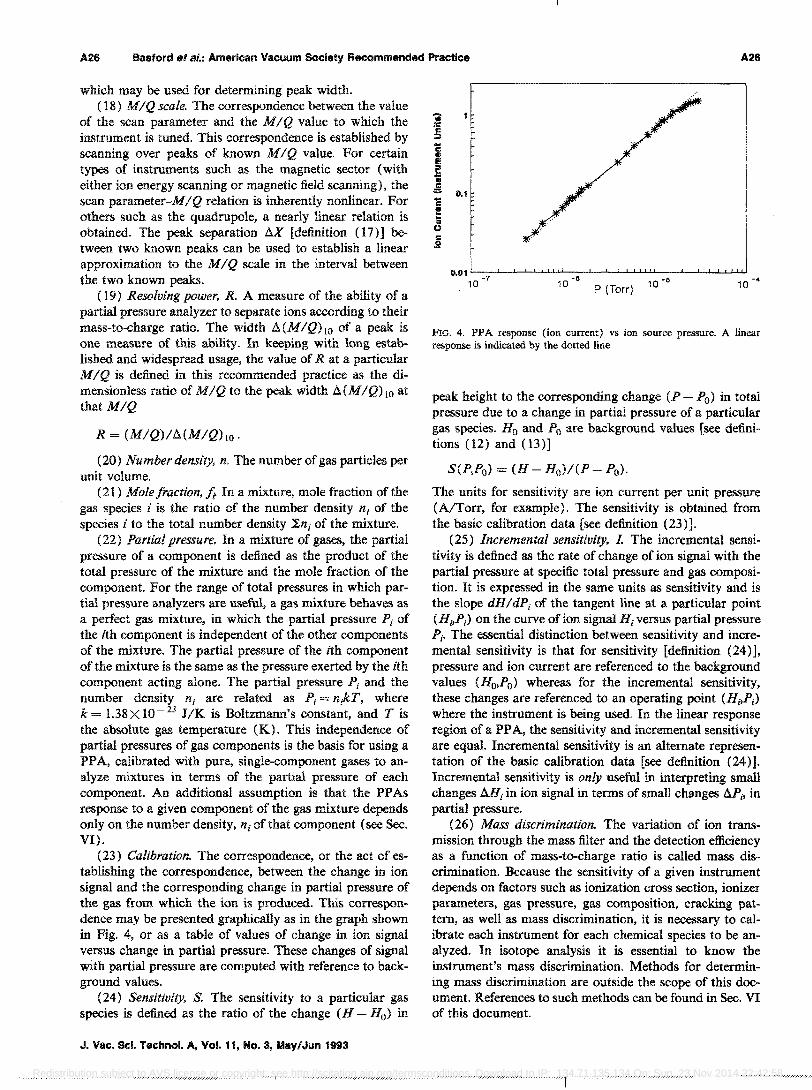
FIG. 5. Relative sensitivity vs ion source pressure for a PPA exhibiting different nonlinear response depending on ion energy (Ref. 11). Linearity for ion energy of3 eV (D) is 30% and for 8 eV Col') ids 15% for pressures less than 2X 10- 4 Torr (3 X 10 -2 Pa).
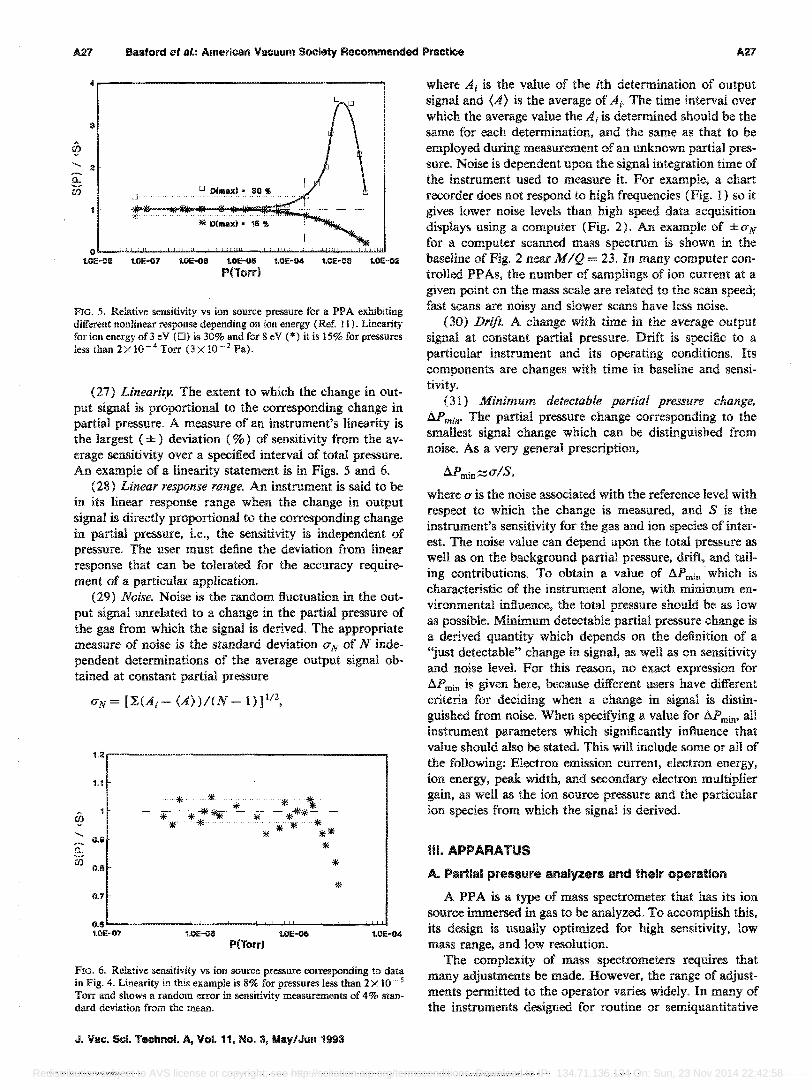
(27) Linearity. The extent to which the change in output signal is proportional to the corresponding change in partial pressure. A measure of an instrument's linearity is the largest (±) deviation (%) of sensitivity from the average sensiti.vity over a specified interval of total pressure. An example of a linearity statement is in Figs. 5 and 6.
(28) Linear response range. An instrument is said to be in its linear response range when the change in output signal is directly proportional to the corresponding change in partial pressure, i.e., the sensitivity is independent of pressure. The user must define the deviation from linear response that can be tolerated for the accuracy requirement of a particular application.
(29) Noise. Noise is the random fluctuation in the output signal unrelated to a change in the partial pressure of the gas from which the signal is derived. The appropriate measure of noise is the standard deviation (TN of N independent determinations of the average output signal obtained at constant partial pressure
1.2
1.1
8] "- O.!! 11.
ro 0.1i *
* 0.7
0.11 1.0E-07 1.0E-OII tOE-OS 1.0E-04
P(Torr)
FrG. 6. Relative sensitivity vs ion source pressure corresponding to data in Fig. 4. Linearity in this example is 8% for pressures less than 2 X 10 _. 5
Torr and shows a random error in sensitivity measurements of 4% standard deviation from the mean.
J. Vac. Sci. Technol. A, Vol. 11, No.3, May/Jun 1993
where Ai is the value of the ith determination of output signal and (A) is the average of Ai' The time interval over which the average value the Ai is determined should be the same for each determination, and the same as that to be employed during measurement of an unknown partial pressure. Noise is dependent upon the signal integration time of the instrument used to measure it. For example, a chart recorder does not respond to high frequencies (Fig. 1) so it gives lower noise levels than high speed data acquisition displays using a computer (Fig. 2). An example of ±aN for a computer scanned mass spectrum is shown in the baseline of Fig. 2 near MIQ = 23. In many computer controlled PP As, the number of samplings of ion current at a given point on the mass scale are related to the scan speed; fast scans are noisy and slower scans have less noise.
(30) Drift, A change with time in the average output signal at constant partial pressure. Drift is specific to a particular instrument and its operating conditions. Its components are changes with time in baseline and sensitivity.
(31) Minimum detectable partial pressure change, f:.P min' The partial pressure change corresponding to the smallest signal change which can be distinguished from noise. As a very general prescription,
aPmin:::::uIS,
where a is the noise associated with the reference level with respect to which the change is measured, and S is the instrument's sensitivity for the gas and ion species of interest. The noise value can depend upon the total pressure as well as on the background partial pressure, drift, and tailing contributions. To obtain a value of ap min which is characteristic of the instrument alone, with minimum environmental influence, the total pressure should be as low as possible. Minimum detectable partial pressure change is a derived quantity which depends on the definition of a "just detectable" change in signal, as well as on sensitivity and noise level. For this reason, no exact expression for ap min is given here, because different users have different criteria for deciding when a change in signal is distinguished from noise. When specifying a value for .6.P min' all instrument parameters which significantly influence that value should also be stated. This will include some or all of the following: Electron emission current, electron energy, ion energy, peak width, and secondary electron multiplier gain, as well as the ion source pressure and the particular ion species from which the signal is derived.
III. APPARATUS A. Partial pressure analyzers and their operation
A PP A is a type of mass spectrometer that has its ion source immersed in gas to be analyzed. To accomplish this, its design is usually optimized for high sensitivity, low mass range, and low resolution.
The complexity of mass spectrometers requires that many adjustments be made. However, the range of adjustments permitted to the operator varies widely_ In many of the instruments designed for routine or semiquantitative
Redistribution subject to AVS license or copyright; see http://scitation.aip.org/termsconditions. Download to IP: 134.71.135.134 On: Sun, 23 Nov 2014 22:42:58
A28 Basford et alo: American Vacuum Society Recommended Practice A28
applications, most of these adjustments are set at the factory while more stringent applications may require field alignment. Operator tuning of scan speed, electrometer damping, peak location, resolution, rf tuning [in the case of a quadrupole mass spectrometer (QMS)], and the ion source voltages and emission current are included in instruments meant for higher precision analyses. These adjustments by a knowledgeable user permit optimized instrument performance. Adjustment of these parameters affects the quantitative output of the instrument and they must be set to suitable values long enough before calibration is commenced that thermal and electronic stability is reached. In a properly operating instrument, the magnitude of the output will be independent of the mode of scanning and consistent in all forms of display. Any such data that are proven to be consistent and repeatable are acceptable for calibration, provided that the operating conditions are identical for calibration and sampling procedures.
Many electronics units are computer operated and feature a variety of scanning modes and forms of data presentation in addition to a simple spectral scan. Many instruments can do bar graphs and single- or multiple-ion monitoring. Output may be digital rather than analog and displays may be numerical rather than graphical. Some instruments also apply a variety of correction factors and some even include spectrum analysis programs using matrix inversion techniques. The user should be aware that some data reduction can give erroneous results if, e.g., library sensitivities and cracking patterns are not updated by the most recent calibration of the instrument.
B. Precautions to observe before calibration
( 1) The sensing head must be clean and in good condition. Inspect the ion source for heavy accumulations of dark material, although some discoloration or distortion of the filament is normal. Mild contamination can be removed by vacuum baking according to the manufacturers instruction. Do not attempt to calibrate an instrument if the sensing head is obviously contaminated. Removal and disassembly for cleaning are required for very contaminated ionizers. Glow discharge cleaning (GDC) has been shown effective for in situ reduction of hydrocarbons and water vapor13
•14 when normal bakeout l5 is not sufficient.
Coating ion source electrodes with Cr followed by baking and GDC offers further reduction hydrocarbons and water released. 16
(2) The instrument must be properly installed and grounded. Verify that excessive instrument noise is not present at the anticipated operating level, due to faulty connections, electrical interference or mechanical vibration. Ground loops, a frequent cause of power line noise, can sometimes be reduced by assuring that the vacuum system and electronics have a common ground.
(3) Verify that peak shapes are suitable for measurement. Instruments that produce an irregular or jagged peak shape at the top where peak height will be measured should be adjusted, or the sensing head should be serviced to provide ion current signals which vary smoothly with
J, Vaco Sci. Technol. A, Vol. 11, Noo 3, May/Jun 1993
mass. With a QMS, ion energy and focus controls have the greatest effect on peak shape. Contamination in the head is a frequent cause of irregular peak top structure.
( 4) Verify that ion current signals are stable. Signal amplitUdes should be repeatable from one to five percent for a given scan rate. If peak heights measured by continuous monitoring of a single peak are greater than those measured by scanning the same peak, fault probably lies in use of too fast a scan speed and/or too long an electrometer time constant (damping) for that electrometer range. The faster the scan rate the smaller the peak amplitude due to the effect of time constant of the electrometer. Scan speeds in Faraday cup mode are typically slower than those when a secondary electron multiplier (SEM) is used. SEM gain instabilities will sometimes give different peak heights between scanning and monitoring modes. It is important that peak heights measured for sensitivity calibration be measured in the same manner as application measurements are made. Unstable Faraday cup or SEM signals are usually due to contaminated sensing heads or defective electronics. Sometimes baking the sensing head under vacuum will correct contamination problems.
(5) The instrument should be warmed up (filament and electronics) to a stable operating condition. The degree of stabilization required depends on the accuracy required and on the inherent stability of the specific instrument. However, as several hours are required for a sensing head to warm up from an off condition to normal operating temperature, PP As should be left on unless use is not anticipated for extended periods. Likewise, cooldown from a bakeout at 350 or 400 ·C takes as long as 6 h.
( 6) Make any necessary tuning adjustments following the manufacturer's recommended adjustment sequence. It should not be assumed that an instrument will operate well over the entire range of parameter values achievable. Unless there are reasons to the contrary, instruments which are designed to permit the user to adjust operating param~ eters of the ionizer and the analyzer should be operated at the manufacturer's specified values. The values specified for one instrument are usually not suitable for another model. Quadrupole instruments in which the rf drive must be tuned to resonance should be tuned before calibration. Adjustments which affect resolution of quadrupole PP As should be changed prior to calibration. For quadrupole instruments, the position of peaks in the mass scale is adjustable by varying the rf amplitUde and the resolution is adjustable by varying the ratio of rf to dc voltage applied to the analyzer rods. A 10% valley between adjacent peaks, as shown in Fig. 3, is frequently recommended. The procedure for determining the resolving power is given in Sec. IV B. Other adjustments, including ionizer settings, scan speed, and damping, once selected must not be changed after calibration. Subsequent changes in resolution and other QMS parameters will require a new calibration. In nearly all instruments, adjustments are made at two points in the mass scale; suitable test gases are required to get mass peaks in the right mass ranges. A final check should be made to verify that all adjustment requirements have been met.
Redistribution subject to AVS license or copyright; see http://scitation.aip.org/termsconditions. Download to IP: 134.71.135.134 On: Sun, 23 Nov 2014 22:42:58
.0.29 Basford et af.: American Vacuum Society Recommended Practice A29
c. Systems for calibration
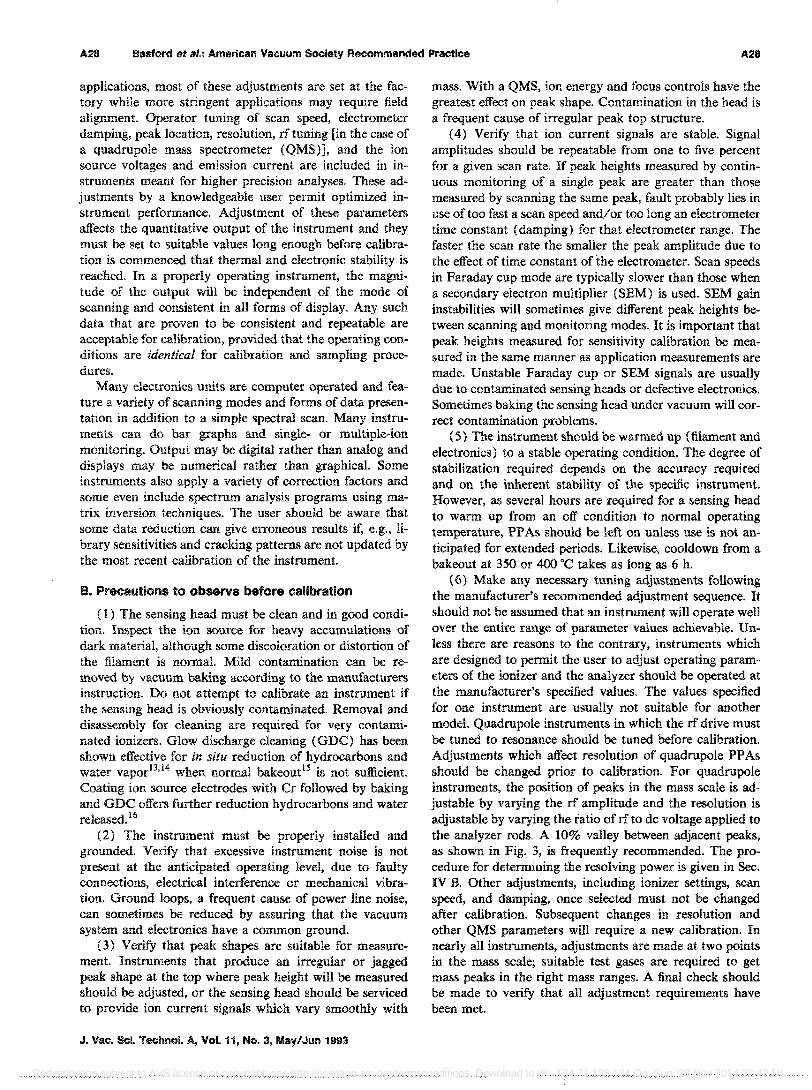
Four methods of calibration of a PPA are described: (1) the direct comparison of the PP A output with a transfer standard pressure gauge, (2) the indirect comparison of PP A readings with readings of a transfer standard pressure gauge separated by a flow restriction (pressure divider method), (3) comparison of the PP A output with the calculated pressure generated in an orifice-flow system, and ( 4) calibration of the PP A response to known gas flow rates. The first three methods may be carried out on a test stand of suitable design as described below. The fourth method requires that the pumping speed during calibration be the same as the pumping speed during use, and normally implies that the PPA is calibrated in situ.
The vacuum chamber for test stand calibrations has the function of presenting a known pressure of test gas to the ionizer of the PPA. To accomplish this, the chamber geometry, gas entry point and pumping port must have a symmetry that produces points of equivalent pressure in the measuring region. Background gases due to outgassing and other sources should be minimized. The following are recommended practices to meet these requirements.
The test chamber should be a right circular cylinder having a length-to-diameter ratio between 0.5 and 2.0. A spherical test chamber is also acceptable. The test chamber is continously pumped through an orifice located at the center of one end off the chamber. The orifice diameter should not be greater than 0.1 times the chamber diameter or length, whichever is less. The conductance of the orifice should not be less than 10 Lis for nitrogen at room temperature. If it is not convenient to use a single orifice, a set of orifices having the same total area as the single orifice described above and located symmetrically around the axis at a radius not exceeding 0.1 of the diameter of the chamber is acceptable. The ports for the PP A sensing head and reference gauge (if used) should be located in the cylinder waH at a distance of at least 5 orifice diameters from the pumping orifice. Where more than one port is used, it is very important that the interaction of measurement devices be prevented. Often locating the ports at right angles to each other will be sufficient but it may be necessary to install electrically grounded baffies or screen. It is good practice to have the axes of the ports in the same plane perpendicular to the axis of the cylinder, but this arrangement is not a requirement if the pumping aperture is small.
An economical realization of a calibration chamber with good pressure uniformity can be achieved by using a standard UHV fitting such as a four or six-way cross. The PPA and reference pressure gauges are mounted symmetrically on the arms of the cross. The gas inlet would be on top and the pump at the bottom. A pump orifice can be part of the gasket joining the lower chamber and pump.
The test chamber should be constructed of metal, preferably stainless steel with welded joints. Demountable seals should be metal to minimize local outgassing. Provisions for bakeout of the chamber to lower background pressure is not required for all applications but is frequently usefuL Ifbakeout is used, the chamber and instruments to be used in calibration should be uniformly heated to avoid local-
J. Vac. Sci. Techno!. A, 'lot 11, No.3, May/Jun 1993
FIG. 7. System for calibration of PPAs by direct comparison of the PPA ion signal with a pressure reading on a calibrated MDO or IO.
ized outgassing sources. The temperature and duration of the bakeout depend on the base pressure required and are not specified in this recommended practice. However it is essential that the apparatus be stabilized at an equilibrium operating temperature with the instruments running before calibration measurements are undertaken.
The test gas input to the chamber should be directed along the axis. Since the gas flow pattern emitted by a long tube is concentrated into a relatively narrow beam, some means of scattering the gas molecules at the entry point should be employed. A baffle placed in front of the gas entry as shown in Fig. 7 induces scattering of gas molecules with the walls to randomize motion. For a comparison system, the gas stream can be directed into the pump orifice, using the backscattered molecules as the input to the test chamber. This method is not acceptable in the pressure generator where pumping speed must be calculated.
The pump used to evacuate the test chamber should have a pumping speed at least 10 times as large as the orifice conductance for all gases used in calibration. Users are cautioned to remember that orifice conductance for each gas species varies inversely with the square root of molecular weight of the gas. Systems used for calibration with relatively light gases such as hydrogen and helium must be supplied with relatively large pumping capacities. In addition to the capacity, the pumping system must be capable of evacuating the test chamber to a base pressure at least one decade lower than the lowest test pressure to be used. The pumping system should also be of a type which does not introduce contaminants harmful to the instruments into the vacuum environment. A turbomolecular pump of adequate capacity is often a good choice for the primary pump but other types can be successfully used.
Four different calibration system designs are described below, The first three are for calibration stands on which the PP A is to be calibrated before transfer to the process system. The fourth discusses issues involved in PP A calibration while on the process system"
Redistribution subject to AVS license or copyright; see http://scitation.aip.org/termsconditions. Download to IP: 134.71.135.134 On: Sun, 23 Nov 2014 22:42:58
A30 Basford et sl.: American Vacuum Society Recommended Practice A30
Va Gas ~<F::~~F===~><~==~ Inlet
Flow Restrlotion
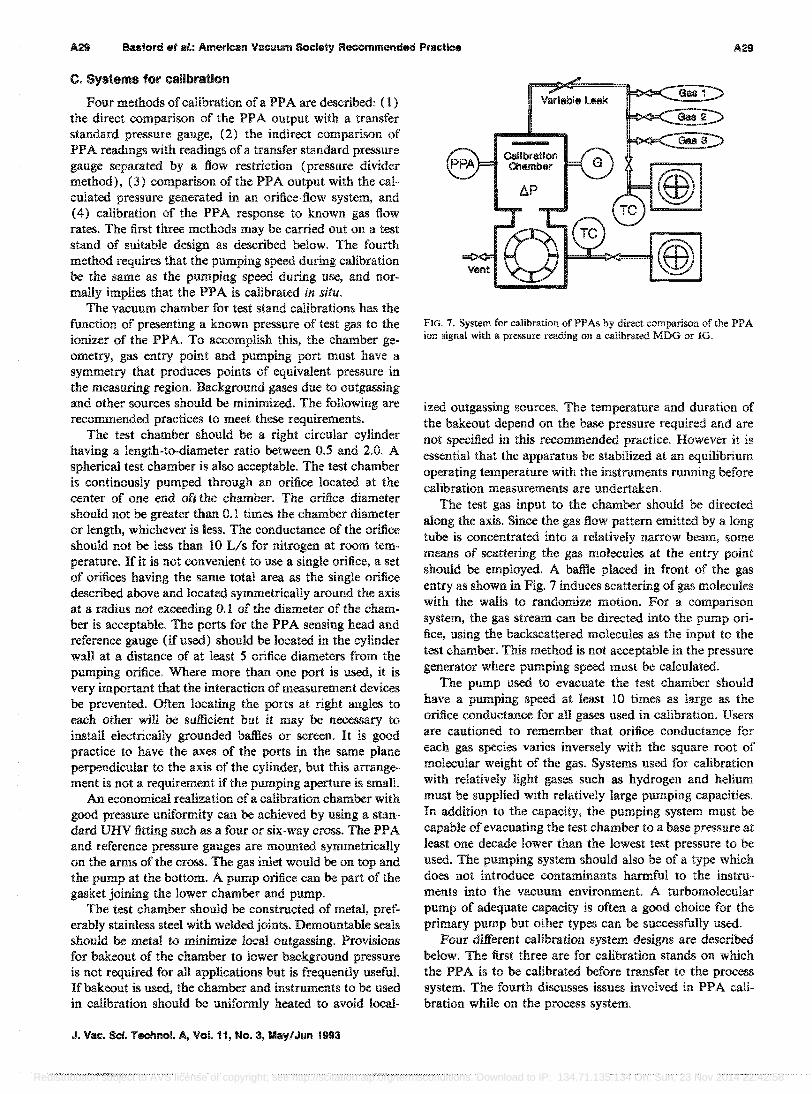
FIG. 8. Pressure-divider calibration system. Pressure gauge G is a MDG or eM transfer standard gauge,
1. Direct pressure comparison system
The direct pressure comparison system is shown in Fig. 7. It uses a gas inlet system with a valve to control flow. Known gas flow rates are not required for this technique. The calibration system contains the PPA sensor and a calibrated pressure gauge. Two recommended transfer standard gauges are the molecular drag gauge (MDG) and calibrated ion gauge (I G). The operating pressure ranges of the MDG and PPAs have limited, but sufficient overlap, allowing this to be the preferred method. Because both transfer standards are total pressure gauges and both have species-dependent sensitivities, only those pure gases for which calibrations have been performed can be used. The PP A and the pressure transfer standard should be mounted in a manner that ensures the same pressure at the two gauges. See the appropriate A VS Recommended Practices for proper use of these gauges.
2. Pressure divider calibration system
The pressure divider systemll,17 is shown in Fig. 8. The gas inlet system uses the valve Vo to control flow of gas to the chamber. Known gas flow rates are not required for this technique. This system requires a pressure transfer standard gauge, such as a capacitance manometer or a molecular drag gauge. A calibrated ion gauge, however, is not recommended for use with this technique because of the ion gauge's nonlinearity for pressures above 10 - 4 Torr. See the appropriate A VS Recommended Practices for proper use of these gauges.
In parallel between the gas inlet and the calibration system are valve VI and a restricted bypass. VI is open for initial outgassing only. To maintain the transfer standard within its operating pressure range and allow PP A calibration over much lower pressures, valves V2 and V3 are used to allow the pressure transfer standard to be valved into the chamber or into the gas inlet system, respectively. Calibrations are performed with constant gas flow rates. With VI and V3 closed and V2 open, direct comparison of PPA and the calibrated gauge readings are performed. Lower cali-
J. Vac. Sci. Technol. A, Vol. 11, No.3, May/Jun 1993
.-_..w._ .... F1ow Standards -
Vent
Flow Meter
Gaa Inlet Vaouum System
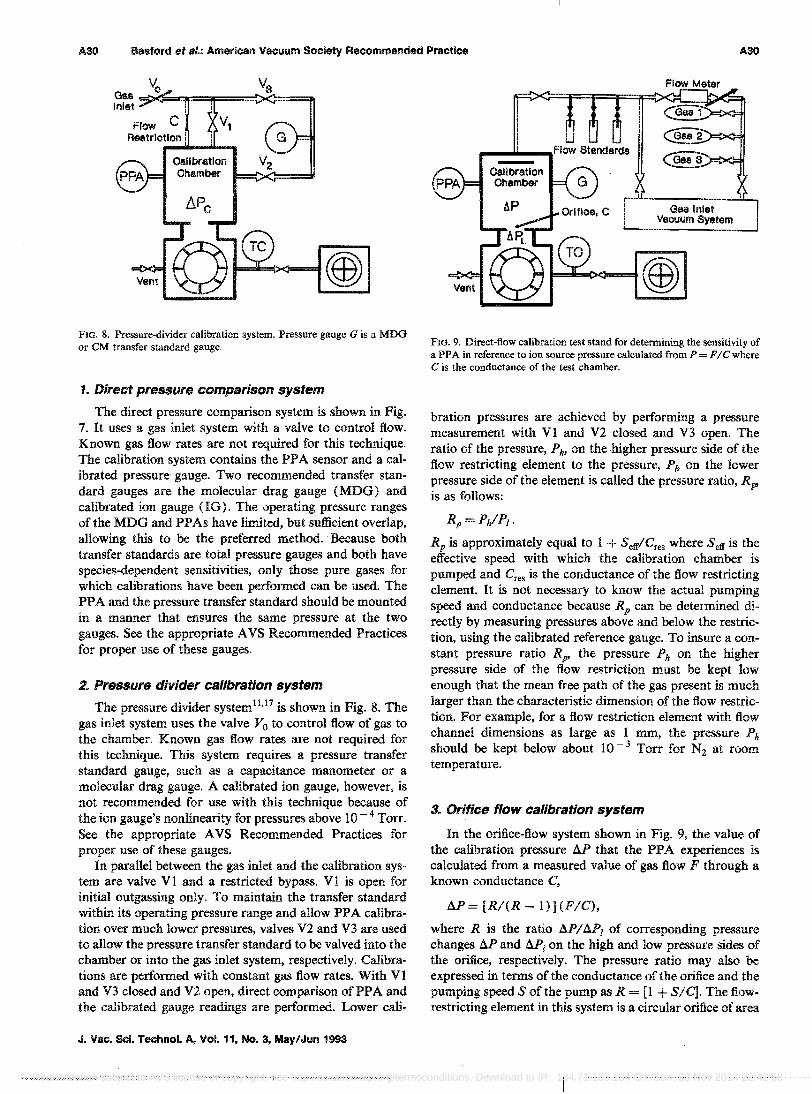
FIG. 9, Direct-flow calibration test stand for determining the sensitivity of a PPA in reference to ion source pressure calculated from P= FICwhere C is the conductance of the test chamber.
bration pressures are achieved by performing a pressure measurement with VI and V2 closed and V3 open. The ratio of the pressure, Ph' on the higher pressure side of the flow restricting element to the pressure, PI> on the lower pressure side of the element is called the pressure ratio, Rp, is as follows:
Rp=PhIP/.
Rp is approximately equal to 1 + SerriCres where Self is the effective speed with which the calibration chamber is pumped and Cres is the conductance of the flow restricting element. It is not necessary to know the actual pumping speed and conductance because Rp can be determined directly by measuring pressures above and below the restriction, using the calibrated reference gauge. To insure a constant pressure ratio Rp' the pressure Ph on the higher pressure side of the flow restriction must be kept low enough that the mean free path of the gas present is much larger than the characteristic dimension of the flow restriction. For example, for a flow restriction element with flow channel dimensions as large as 1 mm, the pressure Ph should be kept below about 10 - 3 Torr for N2 at room temperature.
3. Orifice flow calibration system
In the orifice-flow system shown in Fig. 9, the value of the calibration pressure tlP that the PP A experiences is calculated from a measured value of gas flow F through a known conductance C,
tlP= [RI(R -l)](FIC),
where R is the ratio aPll1P, of corresponding pressure changes aP and aPt on the high and low pressure sides of the orifice, respectively. The pressure ratio may also be expressed in terms of the conductance of the orifice and the pumping speed S of the pump as R = [1 + SIC]. The flowrestricting element in this system is a circular orifice of area
Redistribution subject to AVS license or copyright; see http://scitation.aip.org/termsconditions. Download to IP: 134.71.135.134 On: Sun, 23 Nov 2014 22:42:58
A31 Basford et alo: American Vacuum Society Recommended Practice A31
A, fabricated in such a way that its molecular flow conductance can be calculated with sman uncertainty. In the first approximation,
C:::::;Co =3.64(TIM) 1I2A (l'/s) ,
where T is the gas temperature (K), M is the gas molecular weight, and A is the orifice area (cm2
). The exact value of the conductance may be expressed as
C=KCo•
where K is a correction factor. 18-
21 A thin circular orifice 1 cm in diameter will have a molecular conductance of about 9.4 t'ls for N2 at room temperature. Compared with the pressure comparator or pressure divider systems described previously, the orifice-flow system is more demanding in its construction and operation because of the requirement to know the conductance and to measure the flow. More details on the orifice flow system can be found in Refs. 18-22.
4. Calibration of PPAs In situ
To assure the best performance of the PPA installed in a process vacuum system, the analyzer must be located at a process point that samples the composition of interest but also does not exceed the pressure range for linear response of the analyzer. Where possible, the ion source should be immersed in the UHV chamber to avoid confusing wall outgassing with the main atmosphere. Often the PP A is connected as an appendage unit to the main vacuum cham~ ber to keep it out of the way of the process. This can have the beneficial effect of shielding the PP A from electrons, ions, and fields produced by the process. Isolation is assured by having a grounded, conductive screen attached in front of the pumping duct of the PPA or an elbow. If attached on an appendage, the conductance of the PP A appendage should be high enough that the gas at the ionizer reflects changes in the process chamber with a short time constant (volume/conductance), typically less than 0.05 s. This assures that the gas being analyzed is representative of that in the system and is not a local atmosphere in which components created in the appendage appear in the mass spectrum. If more rapid sampling of process changes is desired, then a higher conductance is needed to reduce the time constant. For measurements in UHV systems, a PP A with an open ion source should be used and the conductance to the appendage should be very high. For higher pressure processes, up to 10 Torr, a selected orifice for sampling from the process together with a separate pump for the analyzer can be used to reduce the pressure of the process to obtain linear analyzer response. For pressures up to one atmosphere, sampling systems with differential pumping are commercialIy available.
If an ionization gauge or a molecular drag gauge is used as the reference pressure sensor for calibration, it should be located at an equivalent pressure point with a high conductance to the chamber so that it and the PPA are exposed to the same pressure. If such a location is not possible, the gauge should be located near enough to the PP A that its reading has a fixed relation to the pressure at the PPA by the pumping system geometry. The reference pres-
J. Vee. Sci. Technol. A, Vol. 11, No.3, May/Jun 1993
sure sensor for calibrating the partial pressure response of the PPA can also be a capacitance manometer located on the high-pressure side of an orifice leak. 9,14
The preferred method for introducing calibration gases is through the same line that process gases enter the PP A region so that the calibration gas flow duplicates the gas flow of normal process gases. Ideally the process sampling point is downstream from the gas introduction point so that sampling is by back diffusion rather than by a directed molecular beam. Three ways to introduce gases for in situ calibration are as follows.
( 1) Introduction of pure gases or a standard mixture through a fixed or controlled leak with composition similar to that of the process gas. An alternate to a leak is pulsed gas injection with a steady pulse rate.23
(2) Introduction of low pressure selected gases via a molecular leak; pressures are measured by a capacitance manometer.9,14
(3) A single or combination of flow standards with a gas supply.
D. Gas supply and introduction
Vacuum systems designed for PPA calibration will have attached to them one or more gas sources. For considerations of system geometry, see Sec. III C. Sources of calibration gases fall into two categories: (I) controlled but unknown flow rates to produce a measured pressure and (2) calibrated leaks with known flow rates. Methods for using these two types of sources are described in the following paragraphs. All of the methods are applicable to single-component gas introduction, but some of the methods can be influenced by transition flow behavior in the leak element, and consequently may not deliver the various components of a gas mixture with the simple predictability obtained under molecular or viscous flow operation. Care must be given to assure that the gas at the ionizer represents the gas in the process or standard mixture. 8,9,27
1. Gas supply with variable leak
A flow diagram for gas inletting with a variable leak is shown in Fig. 7. The supply gases are connected to a common manifold. The manifold is evacuated, the gas of choice is expanded into the manifold, and the variable leak is adjusted to allow the gas to flow into the chamber to produce the pressure desired. A given chamber pressure can be produced from combinations of manifold pressure and variable valve settings. In general, the gas flow is more stable if a valve is set and the manifold pressure is adjusted to produce the calibration chamber pressures desired. The flow control device should be designed to maintain a constant flow over times longer than are required for measure~ ment, typicaHy on the order of an hour. Table] gives a description of some variable leaks and their flow rate and driving pressure ranges. The devices listed mechanically change the dimensions of a flow channel to control the flow rate. The elements are usually operated in the transition flow regime where the admixture of molecular and viscous flow character changes with the dimensions of most of these leaks. The pulsed gas injection valve controls flow
Redistribution subject to AVS license or copyright; see http://scitation.aip.org/termsconditions. Download to IP: 134.71.135.134 On: Sun, 23 Nov 2014 22:42:58
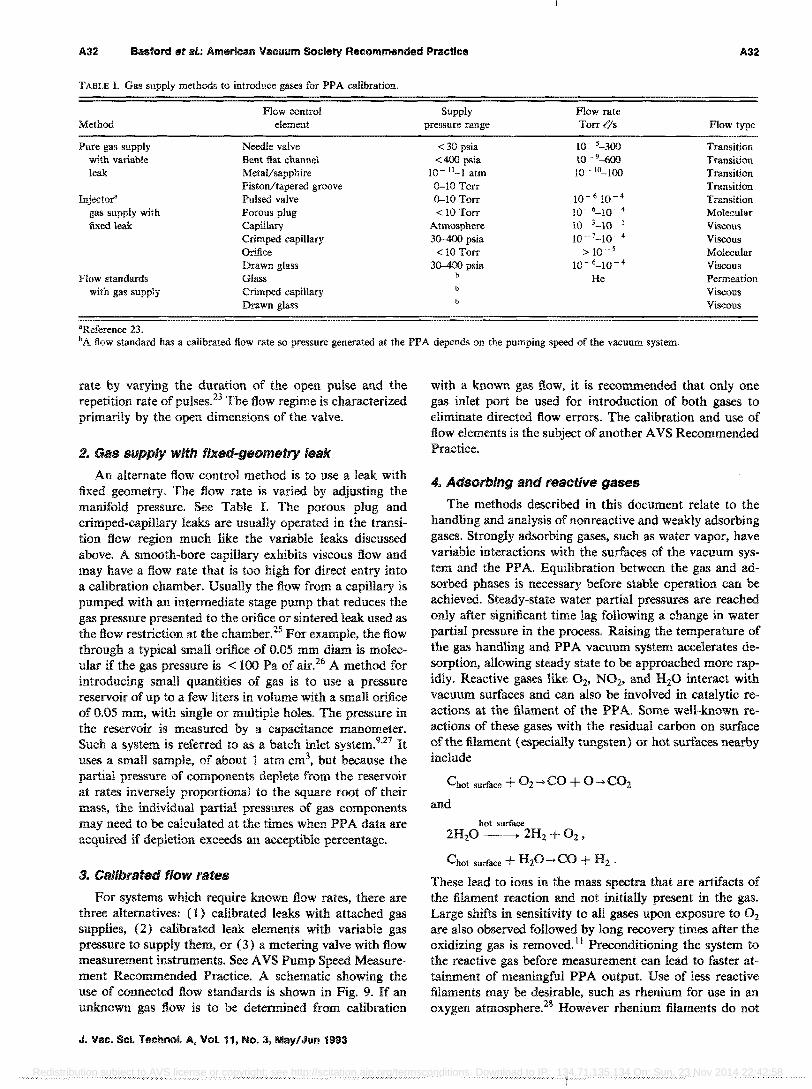
A32 Basford et al.: American Vacuum Society Recommended Practice A32
TABLE I. Gas supply methods to introduce gases for PP A calibration.
Method
Pure gas supply with variable leak
Injector" gas supply with fixed leak
Flow standards with gas supply
aReference 23.
Flow control element
Needle valve Bent fiat channel Metal/sapphire Piston/tapered groove Pulsed valve Porous plug Capillary Crimped capillary Orifice Drawn glass Glass Crimped capillary Drawn glass
Supply pressure range
<30 psia <400 psia
10- 11_1 atm
0-10 Torr 0-10 Torr < 10 Torr
Atmosphere 30-400 psia
< 10 Torr 30-400 psia
b
b
Flow rate Torr t'/s Flow type
10 5_300 Transition 10- 9-600 Transition 10 - l!l_lOO Transition
Transition 10- 610- 4 Transition 10 6_10 4 Molecular \0-3_10- 1 Viscous 10-7_10 4 Viscous
> 10 -5 Molecular 10- 6_10- 4 Viscous
He Permeation Viscous Viscous
b A flow standard has a calibrated flow rate so pressure generated at the PP A depends on the pumping speed of the vacuum system.
rate by varying the duration of the open pulse and the repetition rate of pulses. 23 The flow regime is characterized primarily by the open dimensions of the valve.
2. Gas supply with fixed-geometry leak
An alternate flow control method is to use a leak with fixed geometry. The flow rate is varied by adjusting the manifold pressure. See Table I. The porous plug and crimped-capillary leaks are usually operated in the transition flow region much like the variable leaks discussed above. A smooth-bore capillary exhibits viscous flow and may have a flow rate that is too high for direct entry into a calibration chamber. Usually the flow from a capillary is pumped with an intermediate stage pump that reduces the gas pressure presented to the orifice or sintered leak used as the flow restriction at the chamber.z5 For example, the flow through a typical small orifice of 0.05 mm diam is molecular if the gas pressure is < 100 Pa of air.26 A method for introducing small quantities of gas is to use a pressure reservoir of up to a few liters in volume with a small orifice of 0.05 mm, with single or multiple holes. The pressure in the reservoir is measured by a capacitance manometer. Such a system is referred to as a batch inlet system.9,27 It uses a small sample, of about 1 atm cm3
, but because the partial pressure of components deplete from the reservoir at rates inversely proportional to the square root of their mass, the individual partial pressures of gas components may need to be calculated at the times when PPA data are acquired if depletion exceeds an acceptible percentage.
3. Calibrated flow rates
For systems which require known flow rates, there are three alternatives: (1) calibrated leaks with attached gas supplies, (2) calibrated leak elements with variable gas pressure to supply them, or (3) a metering valve with flow measurement instruments. See A VS Pump Speed Measurement Recommended Practice. A schematic showing the use of connected flow standards is shown in Fig. 9. If an unknown gas flow is to be determined from calibration
J. Yac. Sci. Techno!. A, Yol. 11, No.3, May/Jun 1993
with a known gas flow, it is recommended that only one gas inlet port be used for introduction of both gases to eliminate directed flow errors. The calibration and use of flow elements is the subject of another A VS Recommended Practice.
4. Adsorbing and reactive gases
The methods described in this document relate to the handling and analysis of nonreactive and weakly adsorbing gases. Strongly adsorbing gases, such as water vapor, have variable interactions with the surfaces of the vacuum system and the PP A. Equilibration between the gas and adsorbed phases is necessary before stable operation can be achieved. Steady-state water partial pressures are reached only after significant time lag following a change in water partial pressure in the process. Raising the temperature of the gas handling and PP A vacuum system accelerates desorption, allowing steady state to be approached more rapidly. Reactive gases like O2, NOz• and H 20 interact with vacuum surfaces and can also be involved in catalytic reactions at the filament of the PPA. Some well-known reactions of these gases with the residual carbon on surface of the filament (especially tungsten) or hot surfaces nearby include
Chot surface + O2 -- CO + 0 -+ CO2
and hot surface
2H20 _____ 2H2 + O2 ,
Chot surface + H 20 -+ CO + Hz .
These lead to ions in the mass spectra that are artifacts of the filament reaction and not initially present in the gas. Large shifts in sensitivity to all gases upon exposure to O2
are also observed followed by long recovery times after the oxidizing gas is removed. I! Preconditioning the system to the reactive gas before measurement can lead to faster attainment of meaningful PPA output. Use of less reactive filaments may be desirable, such as rhenium for use in an oxygen atmosphere.z8 However rhenium filaments do not
Redistribution subject to AVS license or copyright; see http://scitation.aip.org/termsconditions. Download to IP: 134.71.135.134 On: Sun, 23 Nov 2014 22:42:58
ASS Basford et sl.: American Vacuum Society Recommended Practice AS3
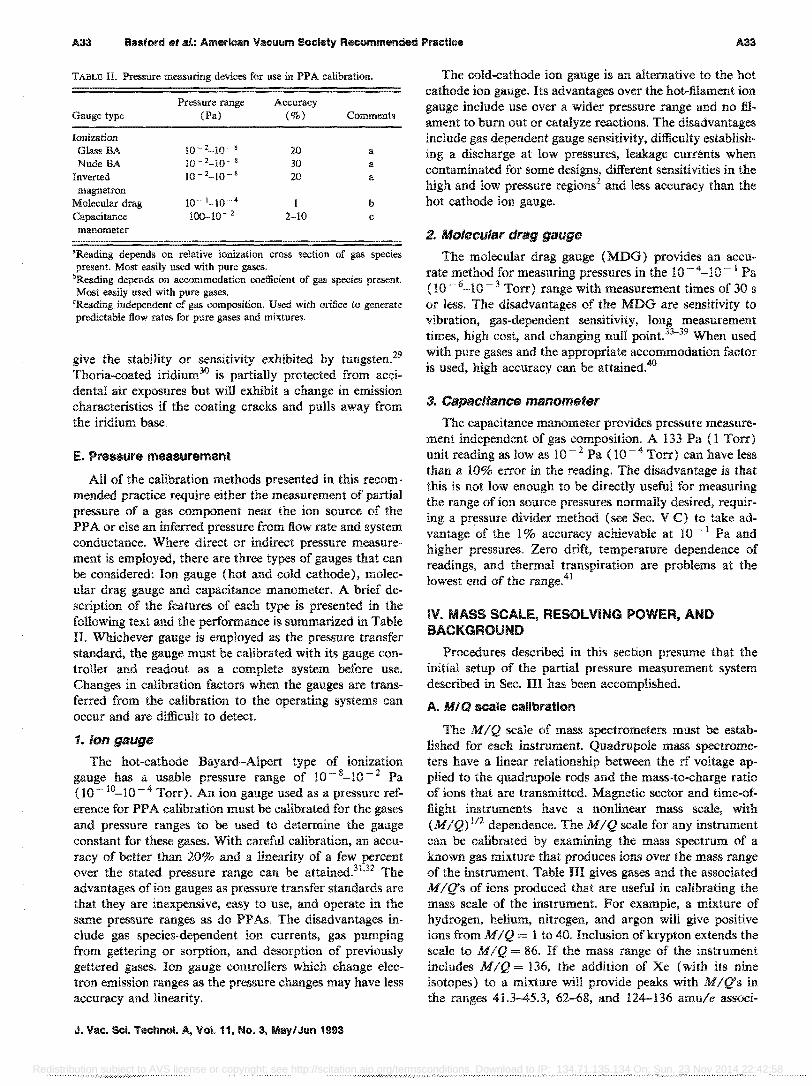
TABLE II. Pressure measuring devices for use in PP A calibration.
Pressure range Accuracy Gauge type (Pa) (%) Comments
Ionization Giass BA 10- 2_10 8 20 a Nude BA 10- 2-10- g 30 II
Inverted 10- 2_10- 8 20 II
magnetron Molecular drag 10- 1_10 4 b Capacitance 100-10- 2 2-10 c manometer
"Reading depends on relative ionization cross section of gas species present. Most e<lSily used with pure gases.
bReading depends on accommodation coefficient of gas species present. Most easily used with pure gases.
<Reading independent of gas composition. Used with orifice to generate predictable flow rates for pure gases and mixtures.
give the stability or sensitivity exhibited by tungsten. 29
Thoria-coated iridium30 is partially protected from acqidental air exposures but will exhibit a change in emission characteristics if the coating cracks and pulls away from the iridium base.
E. Pressure measurement
An of the calibration methods presented in this recommended practice require either the measurement of partial pressure of a gas component near the ion source of the PP A or else an inferred pressure from flow rate and system conductance. Where direct or indirect pressure measurement is employed, there are three types of gauges that can be considered: Ion gauge (hot and cold cathode), molec~ ular drag gauge and capacitance manometer. A brief description of the features of each type is presented in the following text and the performance is summarized in Table II. Whichever gauge is employed as the pressure transfer standard, the gauge must be calibrated with its gauge controller and readout as a complete system before use. Changes in calibration factors when the gauges are transferred from the calibration to the operating systems can occur and are difficult to detect.
1. Ion gauge
The hot-cathode Bayard-Alpert type of ionization gauge has a usable pressure range of 10 - 8_10 - 2 Pa (10-- 1°_10- 4 Torr). An ion gauge used as a pressure reference for PP A calibration must be calibrated for the gases and pressure ranges to be used to determine the gauge constant for these gases. With careful calibration, an accuracy of better than 20% and a linearity of a few percent over the stated pressure range can be attained.31
,32 The advantages of ion gauges as pressure transfer standards are that they are inexpensive, easy to use, and operate in the same pressure ranges as do PPAs. The disadvantages in~ elude gas species-dependent ion currents, gas pumping from gettering or sorption, and desorption of previously gettered gases. Ion gauge controllers which change electron emission ranges as the pressure changes may have less accuracy and linearity.
J. Vac. Sci. Techno!. fit, Vol. 11, No.3, May/Jun 1993
The cold-cathode ion gauge is an alternative to the hot cathode ion gauge. Its advantages over the hot-filament ion gauge include use over a wider pressure range and no filament to bum out or catalyze reactions. The disadvantages include gas dependent gauge sensitivity, difficulty establishing a discharge at low pressures, leakage currents when contaminated for some designs, different sensitivities in the high and low pressure regions2 and less accuracy than the hot cathode ion gauge.
2. Molecular drag gauge
The molecular drag gauge (MDG) provides an accurate method for measuring pressures in the 10- 4-10- 1 Pa (10 - 6_10 - 3 Torr) range with measurement times of 30 s or less. The disadvantages of the MDG are sensitivity to vibration, gas-dependent sensitivity, long measurement times, high cost, and changing null point. 33
-39 When used
with pure gases and the appropriate accommodation factor is used, high accuracy can be attained.40
3. CapaCitance manometer
The capacitance manometer provides pressure measurement independent of gas composition. A 133 Pa (1 Torr) unit reading as low as 10 - 2 Pa (10 - 4- Torr) can have less than a 10% error in the reading. The disadvantage is that this is not low enough to be directly useful for measuring the range of ion source pressures normally desired, requiring a pressure divider method (see Sec. V C) to take advantage of the 1 % accuracy achievable at 10 -- 1 Pa and higher pressures. Zero drift, temperature dependence of readings, and thermal transpiration are problems at the lowest end of the range.41
IV. MASS SCALE, RESOLVING POWER, AND BACKGROUND
Procedures described in this section presume that the initial setup of the partial pressure measurement system described in Sec. III has been accomplished.
A. MIQ scale calibration
The I'JJQ scale of mass spectrometers must be estab~ lished for each instrument. Quadrupole mass spectrometers have a linear relationship between the rf voltage applied to the quadrupole rods and the mass-to-charge ratio of ions that are transmitted. Magnetic sector and time-offlight instruments have a nonlinear mass scale, with (MIQ) 1/2 dependence. The MIQ scale for any instrument can be calibrated by examining the mass spectrum of a known gas mixture that produces ions over the mass range of the instrument. Table III gives gases and the associated MIQ's of ions produced that are useful in calibrating the mass scale of the instrument. For example, a mixture of hydrogen, helium, nitrogen, and argon will give positive ions from MIQ = 1 to 40. Inclusion of krypton extends the scale to MIQ = 86. If the mass range of the instrument includes MIQ = 136, the addition of Xe (with its nine isotopes) to a mixture will provide peaks with MIQ's in the ranges 41.3-45.3, 62-68, and 124-136 amu/e associ-
Redistribution subject to AVS license or copyright; see http://scitation.aip.org/termsconditions. Download to IP: 134.71.135.134 On: Sun, 23 Nov 2014 22:42:58
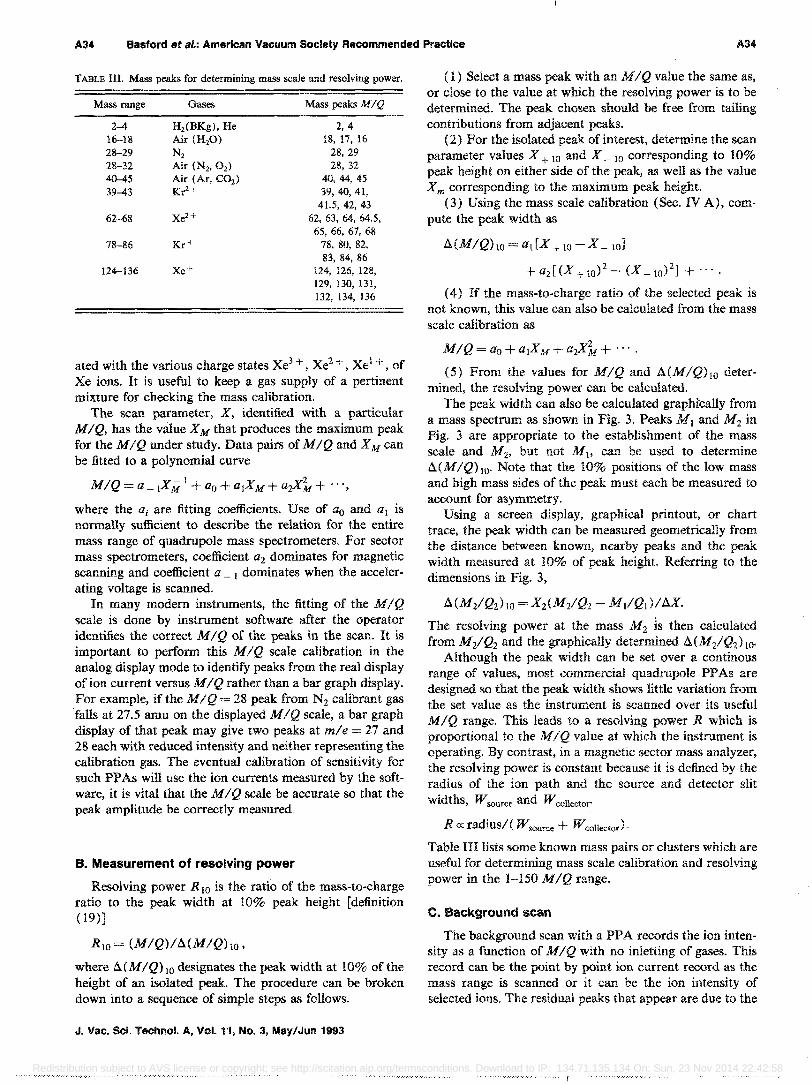
A34 Basford et al.: American Vacuum Society Recommended Practice A34
TABLE III. Mass peaks for determining mass scale and resolving power.
Mass range Gases Mass peaks MIQ
2-4 H2(BKg), He 2,4 16-18 Air (H2O) 18, 17, 16 28-29 N2 28,29 28-32 Air (N2, 02) 28,32 40--45 Air (Ar, CO2 ) 40,44,45 39-43 K~; 39,40,41,
41.5, 42, 43 62-68 Xe2+ 62, 63, 64, 64.5,
65, 66, 67, 68 78-86 Kr+ 78,80,82,
83, 84, 86 124-136 Xe+ 124, 126, 128,
129, 130, 131, 132, 134, 136
ated with the various charge states Xe3 + , Xe2 + , Xe1 + , of Xe ions. It is useful to keep a gas supply of a pertinent mixture for checking the mass calibration.
The scan parameter, X, identified with a particular MJQ, has the value X M that produces the maximum peak for the MIQ under study. Data pairs of MIQ and X M can be fitted to a polynomial curve
M IQ = a _ IX M 1 + aD + alX M + a2Xi, + "', where the 0i are fitting coefficients. Use of ao and al is normally sufficient to describe the relation for the entire mass range of quadrupole mass spectrometers. For sector mass spectrometers, coefficient a2 dominates for magnetic scanning and coefficient a_I dominates when the accelerating voltage is scanned.
In many modern instruments, the fitting of the MIQ scale is done by instrument software after the operator identifies the correct M I Q of the peaks in the scan. It is important to perform this MIQ scale calibration in the analog display mode to identify peaks from the real display of ion current versus M I Q rather than a bar graph display. For example, if the llflQ = 28 peak from N2 calibrant gas falls at 27.5 amu on the displayed MIQ scale, a bar graph display of that peak may give two peaks at ml e = 27 and 28 each with reduced intensity and neither representing the calibration gas. The eventual calibration of sensitivity for such PP As will use the ion currents measured by the software, it is vital that the MIQ scale be accurate so that the peak amplitude be correctly measured.
B. Measurement of resolving power
Resolving power RIO is the ratio of the mass-to-charge ratio to the peak width at 10% peak height [definition ( 19)]
RIO = (MIQ)/tl(MIQho,
where tl(MIQho designates the peak width at 10% of the height of an isolated peak. The procedure can be broken down into a sequence of simple steps as follows.
J. Vac. Sci. Technol. A, Vol. 11, No.3, May/Jun 1993
(1) Select a mass peak with an MIQ value the same as, or close to the value at which the resolving power is to be determined. The peak chosen should be free from tailing contributions from adjacent peaks.
(2) For the isolated peak of interest, determine the scan parameter values X + 10 and X _ 10 cortesponding to 10% peak height on either side of the peak, as wen as the value X m corresponding to the maximum peak height.
(3) Using the mass scale calibration (Sec. IV A), compute the peak width as
a (MIQho = 01[X + 10 - X -10]
+ az[ (X + 10)2 - (X _10)2] + .... (4) If the mass-to-charge ratio of the selected peak is
not known, this value can also be calculated from the mass scale calibration as
MIQ=aO+a 1X M +a2X i,+· ...
(5) From the values for MIQ and b.(MIQho determined, the resolving power can be calculated.
The peak width can also be calculated graphIcally from a mass spectrum as shown in Fig, 3. Peaks M, and M2 in Fig. 3 are appropriate to the establishment of the mass scale and M 2, but not M I , can be used to determine tl(MIQ) '0' Note that the 10% positions of the low mass and high mass sides of the peak must each be measured to account for asymmetry.
Using a screen display, graphical printout, or chart trace, the peak width can be measured geometrically from the distance between known, nearby peaks and the peak width measured at 10% of peak height. Referring to the dimensions in Fig. 3,
A(M1IQ2)1Q = X 2(M2/Q2 - M,/QdlilX.
The resolving power at the mass 1lf2 is then calculated from M21Q2 and the graphically determined a (M2IQ2) !D'
Although the peak width can be set over a continous range of values, most commercial quadrupole PP As are designed so that the peak width shows little variation from the set value as the instrument is scanned over its useful MIQ range. This leads to a resolving power R which is proportional to the MIQ value at which the instrument is operating. By contrast, in a magnetic sector mass analyzer, the resolving power is constant because it is defined by the radius of the ion path and the source and detector slit widths, Wsource and Wcollector'
R 0:: radiusl ( W source + Wcollector)'
Table III lists some known mass pairs or clusters which are useful for determining mass scale calibration and resolving power in the 1-150 M I Q range.
c. Background scan
The background scan with a PPA records the ion intensity as a function of MIQ with no inletting of gases. This record can be the point by point ion current record as the mass range is scanned or it can be the ion intensity of selected ions. The residual peaks that appear are due to the
Redistribution subject to AVS license or copyright; see http://scitation.aip.org/termsconditions. Download to IP: 134.71.135.134 On: Sun, 23 Nov 2014 22:42:58
ASS Basford tit al.: American Vacuum Society Recommended Practice ASS
outgassing from surfaces within the vacuum system. The normal presumption is that the background spectrum is constant over the short term and can be subtracted from a scan taken with a test gas present to give the spectrum of the test gas only. Usually this has sufficient accuracy but two other situations can occur: The background can increase due to the active desorption of wall contaminants (e.g., H20 and hydrocarbons) by some active gases (e.g., H2• 02' NO) 13,14 or the background can decrease by blanketing of the surface by test gas, thus lowering the outgassing rate.
V. SENSITIVITY AND LINEARITY MEASUREMENT
To relate quantitatively the ion signals of a PPA to partial pressures or partial flow rates, it is necessary to perform a calibration. To establish this relation, the basic calibration data required are: change tliI in PP A ion signal of the gas species versus the corresponding change b.P in partial pressure or change b.F in flow rate. The basic calibration data emphasized in this document, are the partial pressure sensitivity or partial flow sensitivity plotted or tabulated as a function of the change in partial pressure, f:..P. The partial pressure sensitivity S = f:..H/ b.P or the partial flow sensitivity SF = I:lH /!::.F must be determined for each gas of interest. Once this relation is established, the partial pressure change of a species i at the ionizer corresponding to some measured ion signal change can be calculated using
b.Pj = i::J.H/Sj
or the flow rate change of a gas species i into a specific pumping system using
!::.F. = AH/S1;" . I t"' j
To perform the calibration (I.e., determining the requisite Si)' it is necessary to produce a known pressure change at the ionizer of the PP A or introduce a known flow rate either in a controlled test chamber for evaluation and calibration of the PPA or in the process apparatus itself, in situ. The relationships between flow rate, pumping speed and pressure at the ion source of a PPA used for calibration have been previously reported. 8,9
The apparatus and operating principles pertaining to three test stand calibration procedures are described in Sec. III C. The calibration procedures to be used with these test stands are described in Secs. V A-V C below. In situ calibration procedures are described in Sec. V D.
A. Direct pressure comparison method
1. Preparation
The calibration system for this method is shown in Fig. 7 as described in Sec. HI. Evacuate the calibration chamber. Ensure that there is no flow from the flow device. Turn on the PP A and the transfer standard pressure gauge when within their respective operating ranges and allow them to warm up. Because the background level determines the lowest pressure at which calibration can be performed, care should be exercised in evacuation procedures, performing a
J. Vac. Sci. Techno!. It, Vol. 11, No.3, May/Jim 1993
.~~ ••••• , •• , r, • ',' •• ' •• -.;.;0;.;.:.;.:-: •.• -•••••••.•.. '.'.' •• ,_, •• . .-.-.-...•.•• ~-. •• • ••. -•.•••.•.• ',r,' •• -••••• -.-.-.·,: • ..-.;.;.;.--:.7 ••••••••••• T.r •••••••••••••••• -.~.:.:.:.: ••••• : •••••••••• ; •••••• ' ••••••• >; •••••••••• -.;.-.-.-•••••• ,-.
vacuum bakeout if necessary. Continue evacuation to a stable background level at least ten times lower than the lowest pressure to be used for PPA calibration. For high accuracy, gas of high purity must be i.ntroduced, starting with a source> 99.9% pure and performing the necessary purging or purge/evacuation of gas supply lines to assure that purity is maintained in the connecting lines.
2. Pressure calibration of PPA
After the preceding criteria have been met, perform a background scan using the PP A over the mass range to be used for process gas analysis. [The peak chosen to represent the partial pressure of a gas component is usually the molecular ion of the gas (e.g., Nl at MIQ= 28 for N z). There are times when the parent peak cannot be used due to interferences. Thus, CH3+ is used instead of CH4+ in the presence of water or oxygen.] The PPA response in whatever units given (voltage, current, "pressure" value) is a representation of the background ion current that will be used for calibration [e.g., Ho(28) for MIQ= 28 for N/].
Measure the background pressure using the transfer standard gauge. This background pressure Po reading represents the pressure of all gas components before the calibrating gas is introduced, even though the response of the gauge is species dependent. It is presumed that this background pressure remains constant when calibration gas is introduced.
Close the inlet manifold evacuation valve and set up a flow into the calibration chamber to produce the desired calibration pressure or flow rate. Anow the flow to stabilize in the calibration chamber. If desired, a full mass scan can be performed using the PP A to determine if the purity of the inlet gas is sufficient to provide the required measurement accuracy.
Using the PPA, scan the peaks of interest. Record the PPA response in the same units as Ho (voltage, current, "pressure" value) to representation of the total ion current H that will be used for the sensitivity calculation. Using the pressure transfer standard, measure the chamber pressure with calibration gas present and call it P. The PP A sensitivity S as defined in definition (24) (Sec. II) is then
S = (H - Ho)!(P - Po).
Repeat the sensitivity measurements at a sufficient number of different pressures to determine if the PP A is linear (i.e., constant S) over the range of interest. Typically, at least a two-decade pressure range is needed.
The PP A sensitivity must be determined for each gas of interest.
So Pressure divider method
1. Preparation
The calibration system for this method, shown in Fig. 8, is prepared as follows. Begin evacuation of the calibration chamber with valves V1, V2• and V3 open. Also to insure that no gas is flowing to the chamber from the gas supply system, close the leak valve Vo and begin evacuation of the gas manifold to a pressure at least 1000 times lower than
Redistribution subject to AVS license or copyright; see http://scitation.aip.org/termsconditions. Download to IP: 134.71.135.134 On: Sun, 23 Nov 2014 22:42:58
A36 Basford et sl.: American Vacuum Society Recommended Practice A36
the lowest fill pressure at which it will be used. The PPA and gauge (if present) may then be turned on when the chamber pressure has fallen to less than 10 - 4 Torr. Continue evacuation until a stable base pressure, at least 10 times lower than the lowest calibration pressure step, is attained. It may be necessary to bake the chamber to achieve the desired base pressure.
2. Pressure calibration of PPA
Assuming that the preparations described above have been completed and the system pressures are all at acceptibly low base values, the calibration procedures to be followed next depend on the range of pressures over which one wishes to calibrate the PP A.
C. Normal direct comparison method
If the calibration pressure range of interest lies within the pressure directly measureable with the calibration transfer gauge G (e.g., 10 - 6-10 - I Torr for the molecular drag gauge) then close valves VI and V3 but leave V2 open. The system is then basically the same as the direct comparison system shown in Fig. 7 and the procedures are the same.
D. Indirect method using pressure ratio Rp
( 1) With the chamber and gas inlet each at their respective base pressures, close VI and V2 but leave V3 open. Record the base pressure (zero) reading P iO on gauge G while it is connected to the inlet side of C.
(2) Close V3 and open V2, and record the base pressure (zero) reading P <fJ on the gauge G while it is connected to the calibration chamber. Also record the corresponding peak height H<fJ from a background scan with the PPA for the M/Q of interest.
(3) Start a flow of gas through C to the chamber and adjust the flow rate until the pressure in the calibration chamber becomes large enough to produce a reading on the most sensitive range of gauge G.
( 4) Record the pressure reading Pc on gauge G while it is connected to the calibration chamber. Also record the corresponding peak height He yielded by the PP A at the M / Q of interest.
( 5) Leaving the flow to the chamber undisturbed, close V2 and open V3• Record the pressure reading Pi on gauge G while it is connected to the inlet side of C.
(6) Using the data obtained in steps (1)-(5), calculate a value for pressure ratio as follows:
Rp = (Pi - PiO)/(Pc - P <fJ).
(7) Continue incrementing the flow to the chamber and repeating steps (1 )-( 6) until sufficient data are obtained to show the range of (P1PiO ) over which the pressure ratio is constant and to yield a reliable average value for this ratio.
Once the value of the pressure ratio Rp has been established for the system with a particular calibration gas, then this value, together with measurement of the calibration gas pressure change (Pi - PiO ) on the high pressure (inlet) side of the conductance C, can be used to calculate the
J. Vac. Sci. Technol. A, Vol. 11, No.3, May/Jun 1993
corresponding pressure change in the calibration chamber for those cases in which (Pc - P <fJ) is too small to be measured directly by the calibration transfer gauge G:
(Pc - P <fJ) = (Pj - PiO)/(Rp ) ,
where (Rp) is the average value determined for the pressure ratio. The pressure ratio will be slightly gas speciesdependent because its value depends on the ratio of pump speed to conductance of the flow restricting element.
To determine the sensitivity of a PPA using the pressure divider method, scan the peak of interest and record the peak height He' The PPA sensitivity S, adapted from definition (24), is
S = (He - H<fJ)/(Pc - P <fJ),
where the pressure change in the calibration chamber (Pc - P <fJ) is read directly or calculated using the pressure ratio Rp. Repeat sensitivity measurements at a sufficient number of pressures to determine if the PP A is linear (i.e., constant S) over the range of interest.
E. Orifice-flow method
1. Preparation
The orifice flow system is shown in Fig. 9. The preparation of the vacuum system, gas supply and PPA is described in Sec. III.
Evacuate the calibration chamber ensuring that there is no flow from the flow control/measurement device. Turn on the PPA when within its specified operating ranges and allow it to warm up. Continue evacuation to a stable background level at least ten times lower than the lowest calibration pressure to be used for the PP A. Perform a vacuum bakeout, if necessary. Evacuate the inlet manifold to a pressure one thousand times lower than its normal operating pressure. Ensure that the chamber ion gauge has been thoroughly degassed and is acting as neither a significant gas source nor a gas sink.
2. Pressure calibration of PPA
After the previous criteria have been met, perform a background scan using the PP A at the peak of interest. Call the peak height H o.
Set up a known flow F into the calibration chamber using flow standards or a flow measurement device. Anow the flow to stabilize in the calibration chamber. If desired, a full mass scan can be performed using the PP A to determine if the purity of the inlet gas is sufficient for the required level of accuracy.
Using the PPA, scan the peak of interest. Call the peak height H. The pressure of the pure gas in the calibration chamber is found using chamber orifice conductance C,
P=F/C.
The PPA sensitivity for the ith peak S;. in units of ion current per unit pressure, is
Sf = (H - Ho)/P,
.............. \ ... Redistribution subject to AVS license or copyright; see http://scitation.aip.org/termsconditions. Download to IP: 134.71.135.134 On: Sun, 23 Nov 2014 22:42:58
AS? Basford et 81.: Amer!can Vacuum Society Recommended Practice AS1
where Hand Ho were determined as above and P is determined by the known or measured flow rates and the conductance of the orifice. Similarly, a flow sensitivity can be calculated
where Pi is the value of flow rate introduced into the vacuum system. This calibration of ion current related to flow rate can be useful in the measurement of permeation or outgassing rates.
Close the leak and allow the chamber to reach its background. Repeat this sensitivity measurement process at different pressures (from different flow rates) until the number of points are gathered to characterize the linearity of the PP A over the pressure range of interest.
F. In situ calibration of a PPA in a process application
1. Adaption of a PPA to process vacuum systems
A PP A used to monitor conditions in a process vacuum system or test apparatus can be calibrated in situ by the introduction of known gas pressures or flow rates using one or more of the test stand calibration methods in the previous sections. Adaptation of these calibration methods to process vacuum systems is discussed in Sec. III.
2. Partla/Mpressure sensitivity calibration
A common application of a PP A is to measure the partial pressures of gas components in the process. To do this, the sensitivity of the mass spectrometer for each component near the pressure of interest must be determined. If the sensitivities were previously determined on the test stand, a remeasurement of at least a few sensitivity values should be made to check the effects of moving the PP A to the process system, such as air exposure during transit.
The sensitivity is determined by using the test stand procedure that is appropriate to the method chosen for producing known pressures at the PP A. Refer to the appropriate procedure to gather the data needed for determining sensitivity over the range of pressures needed for the application. Repeat this sensitivity measurement process at different pressures (from different flow rates) until the number of points are gathered to characterize the linearity of the PPA over the pressure range of interest.
3. Partial flowmrate sensitivity determination
If the process quantity of interest is the flow rate of a gas component, a flow-rate sensitivity can be determined using flow rates generated by methods described in Sec. III. Gather the data of ion current versus flow rate needed to cover the range of flow rates to be measured in the process. Repeat this flow-rate sensitivity measurement process at different flow rates until a number of points are gathered to characterize the linearity of the PPA over the flow-rate range of interest.
J. Vae. Set Techno!. A, Vol. 11, No.3, May/Jun 1993
VI. DISCUSSION
A. Gas interactions
There are instances in which the major peak of one constituent has the same MIQ as a peak of another. For example, with a mixture of N2 and CO2 there is at MIQ = 28, the parent peak of nitrogen, Nt, and also CO + , a
fragment ion from ionization carbon dioxide. In this case, the quantities of nitrogen and carbon dioxide would have to be determined using the peaks N +, cot, and N 2/CO+ at MIQ= 14,44, and 28, respectively. Many other such interferences can be present in complex mixtures requiring matrix reduction techniques.
In this recommended practice, it has been assumed until now that the gas species in the ion source are independent of each other so that calibrating with a pure gas predicts the correct sensitivity for the species when other components are present. This is not always true. At higher pressures, space charge in the ion source can alter ion extraction efficiencies and ion-molecule collisions can alter ion species ratios and quantities. If the application involves measuring a minor impurity in the presence of major components, the ion source pressure is necessarily high to provide sufficient ions to measure the impurity. This high ion source pressure can lead to inaccurate measurement of the minor constituent. One way to test for such gas interference is to introduce a flow of one species and then add a separate flow of another gas of interest. If the ion intensity of the original gas component changes, either up or down, then some form of gas interference is occurring. If it is severe, it may negate the pure gas calibration. Some adjustments can be made to minimize the effect (e.g., reduce the electron emission current) or a calibration using a standard mixture with major and minor components present can be made, provided that the mole fraction of the minor components are near those expected in the process gas. If the standard mixture matches the process gas, this type of in situ calibration may be the only technique providing accurate results.
The peaks due to the background gases are not, in general, constant. Temperature fluctuations will cause the water peaks to change by large amounts. The hydrogen signal, due to wall outgassing, not only changes with temperature but also with pumping speed fluctuations. The background can increase due to the desorption of wall contaminants by some active gases (e.g., H 20 and hydrocarbons by H 2, 0z, NO) or by electron or ion stimulated desorption. The background could decrease by blanketing of the surface by test gas, thus lowering the outgassing rate, or it could increase by the occupation of surface adsorption sites by the test gas.
B. Linearity
The linearity [definition (27) in Sec. II] of the PPA is measured as the largest (±) percent deviation of the sensitivity from its average value over a specified pressure range. The average sensitivity will be approximated by the arithmetic average (S) of a discrete set of sensitivities mea-
Redistribution subject to AVS license or copyright; see http://scitation.aip.org/termsconditions. Download to IP: 134.71.135.134 On: Sun, 23 Nov 2014 22:42:58
A38 Basford et sl.: American Vacuum Society Recommended Practice A38
sured over the pressure range of interest. The largest deviation from the average is calculated from the sensitivity values in this discrete set of measurements
Dmax(%) = lOOISi- (S) imax/(S).
The value of Dmax ( %) describes the systematic error of sensitivity due to nonlinear processes in the ion source like those indicated in Fig. 5. For this PPA, a 30% increase in sensitivity is seen for the low ion energy data and a 15% decrease for higher ion energy at pressures less than 2 X 10 .- 4 Torr. This is contrasted by the 4% random error in sensitivity measurements indicated in Fig. 6 for a different PPA at pressures less than 2X 10- 5 Torr. Deviations from linearityll,42-46 are due to effects in the ionization of the sample gas and in the detection of the ions.
In the ionizer, at pressures higher than about 10 - 5
Torr, two types of events can occur. First, space charge due to large numbers of electrons and ions in an ionizer distort the field lines, leading to different distributions of ion velocities and ion fractions drawn out of the ionizer. Thus, higher emission currents of electron impact ionizers and higher gas pressures will not necessarily yield proportionately higher PP A signals. Indeed, as pressures or electron emissions are increased, sensitivities can actually increase or decrease (Fig. 5). Reduction of emission current at high pressures reduces space charge and generally improves linearity. A secondary source of nonlinearity can occur at higher pressures where the probabilities of ionmolecule collisions in mixtures, and ion-electron recombination increase proportional to pressure. An example of an ion-molecule reaction that is probable is charge exchange for He + and Xe:
He+ + Xe->He + Xe+.
Here, the sensitivity of He in the PP A would be reduced and that of Xe increased compared to sensitivities measured at much lower pressures. The efficiency of this charge exchange reaction depends on the partial pressures of the components and the difference in ionization potential of the colliding species.
The nonlinearities due to effects of detection are generally not as severe as those encountered in the ionizer. Most electrometers use high-value feedback resistors to change the gain range. Deviations of feedback resistors from the nominal values lead to apparent disagreement (up to several percent) between sensitivity values determined on adjacent electrometer range settings. In addition, an offset between ranges can be introduced if the detector amplifier circuit has not been properly zeroed. At high gain, electrometers experience much larger drifts and noise levels so that background and peak level changes can become large. Ion counting electronics have a dead time correction that can be significant with high ion currents which gives lower than expected sensitivities as the ion current is increased.
c. Sensitivity
The sensitivity of a PP A is the change in output signal per unit change in pressure of the species in the ionizer. It is thus the end product of many processes, including ion-
J. Vac. Sci. Technol. A, Vol. 11, No.3, May/Jun 1993
ization, transmission through the mass filter, detection efficiency, and signal amplification. To compare instruments, it would seem helpful to establish a standard set of conditions under which the sensitivity would be measured. The sensitivity measured at a pressure of 10 - 4 Pa with an electron energy of 70 V, and a resolution of 1 would seem to be useful. However, there are several other adjustable parameters, different for different PPA models, whose values can have significant effect on sensitivity. If all these parameters are adjusted to values that the manufacturer recommends for routine process gas analysis, then, and only then, can a basic sensitivity value be useful for comparison. It has been found, however, that instruments with the highest sensitivities do not necessarily have the lowest minimum detectable partial pressure ..
As shown in Figs. 5 and 6, the sensitivity is a function of pressure of the gas, and is in some cases affected by the total pressure of all gas components. The linear response range [see definition (28) in Sec. II] can be very clearly shown over a wide pressure range by displaying the sensitivity for a gas species as a function of pressure of the species.
However, to be most useful as an alternative representation of the basic calibration data [see (24) in Sec. II], the sensitivity determinations should be tabulated or graphed as a function of the corresponding change in ion signal, rather than in pressure. Under this procedure (and using linear interpolation where necessary in the table or graph of S versus MJ), measured ion signal changes can be accurately related to the correspondiug, but unknown, pressure changes, even in regions of nonlinear response. A statement of sensitivity should always be accompanied by the values of the parameters which significantly influence the sensitivity. These include resolution, electron emission current, electron energy, ion energy, peak width, scan speed, damping, and, if employed, the gain of a secondary electron multiplier. When stated without reference to the pressure, a sensitivity value will be understood to mean the value corresponding to the region of linear response to pressure.
D. Stability
Stability refers to the constancy of sensitivity over a period of time. Two periods can be considered as important to analysis. The change in sensitivity over the shortest interval which is required to perform both a calibration and a determination of an unknown defines short term stability of a PP A. It limits the repeatability, and thus the accuracy, of any analysis. Thus, an instrument with a short-term stability of 2% could not be used to measure samples with 1 % accuracy regardless of the care taken to ensure high accuracy of calibration. Long term stability would be determined over the interval between which calibrations are routinely performed. If, for example, the 24-h stability of a PP A was found to be 10% but the analysis accuracy required was 5%, the calibrations would have to be performed at least twice a day.
There are some things that the operator can do to obtain higher stability of a PPA. The operating temperature of an
······f········ . Redistribution subject to AVS license or copyright; see http://scitation.aip.org/termsconditions. Download to IP: 134.71.135.134 On: Sun, 23 Nov 2014 22:42:58
AS9 Basford et al.: American Vacuum Society Recommended Practice 1039
instrument is only slowly reached in a vacuum system, so that leaving the PP A on for extended periods is required. Exposure to some kinds of gases, such as water, oxygen, and fluorine, can change the characteristics of the ionizer. In some cases, pretreatment with process gases can dimin~ ish these problems. Electron multipliers are, by their nature, unstable since the gain depends on the composition of the active surface. The gain, changes with time as a result of changes in the surfaces caused by surface reactions and annealing. For highest accuracy, therefore, high-level signals should be detected with a Faraday cup and low-level signals should be measured by ion-counting techniques.
E. Operator controls and software
It has been stressed that the PP A parameters must be adjusted to give the optimum peak shape, peak position, sensitivity, scan speed, and damping. An inexperienced operator would do best to follow the recommendations of the manufacturer. The parameters, once adjusted, must not be changed between the calibration and use of the PPA for process monitoring. Likewise, data must be acquired and reduced in identical manners for calibration and use. Because of shifting sensitivities and because changes in the process may require different analytical approaches, in situ calibration is recommended where possible.
To understand the limitation of the software, in the case of software-controlled instruments, one must understand the algorithms that are used to acquire and analyze the ion currents and scan parameter data. Begin evaluation of the software with descriptions in the manufacturer's literature. The mass scale calibration is usually straightforward but the peak measurement may be inaccurate for some peak shape conditions due to limitations of the software. Some peak measurement algorithms choose the maximum ion current in a narrow mass range which could be a noise spike. More sophisticated programs do some averaging of ion intensities at a precise peak location or curve fit the peak data near the maxima. Some other problems encountered include inappropriate scan speed/damping/ electrometer range combinations, start of data acquisition before the electrometer or mass selection has settled, use of incorrect library cracking patterns, and use of cracking patterns and sensitivities which were not obtained for that specific instrument. There are even some instruments for which the updating of library data is not possible, leading to large errors. The user of computer controlled PP As is strongly urged to perform more complete calibrations in order to be assured that the data are acquired and reduced correctly.
F. Quality assurance of calibration and analysis
Partial pressure analyzers can be very useful for monitoring, and even controlling, processes based on levels of partial pressures of selected components. The reliability of the control is only as good as the accuracy of the measurements. To validate the accuracy of the measurement, some calibration check should be routinely performed. The frequency of calibration must be detennined by the user,
Jo Vac. ScI. Technol. A, Vol. 11, No.3, May/Jun 1993
based on variability of the calibration results, and the accuracy requirements of the process being controlled. Inclusion of one of the calibration gas introduction methods into the process hardware provides a convenient way to check calibration stability. Usually, if the sensitivity changes for one gas species, it changes for others in a correlated fashion. 9
,1l Thus, analyzing a representative gas (e.g., a selected single-component gas or a mixture that simulates the process composition) can check absolute and relative sensitivities. A control chart plotting the ratio QA versus time can indicate calibration stability or drift:
QA = [H/Si]/PTSG
where Hand S are the net ion current and sensitivity, respectively, for the check gas and PTSG is the corresponding reading of the transfer standard gauge. An ion gauge may not have sufficient stability to assure that important trends are due only to the PPA. Another, more stable, measurement related to the flow rate of a check gas can be substituted for the ion gauge value to produce a QA indicator. Drift of the QA indicator can be used to determine when recalibration is needed. If a mixture of gases is analyzed, the composition calculated from the partial pressures of the components measured can be plotted versus time and compared with the standard to monitor drifts in relative sensitivities.
ACKNOWLEDGMENTS
The authors thank many A VS members for their comments and input to the committee during the evolution of this document. We especially thank J. H. Batey, W. R. Blanchard, R. A. Grant, J. F. Loan, C. R. Tilford, M. A. Wilson, N. J. Wilson, and S. J. Wyrick for their contributions.
1M. J. Drinkwine and D. Lichtman, Partial Pressure Analysis and Analyzers, A VS Monograph Series.
2J. F. O'Hanlon, A User's Guide to Vacuum Technology (Wiley, New York, 1980). 'l H. Leek, Total and Partial Pressure Measurement in Vacuum Systems (Blackie, London, 1989).
4Quadrupole Mass Spectrometry and Its Applications, edited by P. H. Dawson (Elsevier, New York, 1976).
lp. H. Dawson, Radio Frequency Quadrupole Mass Spectrometers, in Applied Charged Particle Optics, edited by n. A. Septier (Academic, New York, 1980).
61. H. Batey, Vacuum 37,659 (1987). 7n. Angerth et at., Vacuum 34,749 (1984). gD. A. Santeier, J. Vac. Sci. Techno!. A 5, 129 (1987). 9R. E. Ellefson, D. Cain, and C. N. Lindsay, J. Vac. Sci. Techno!. AS, 134 (1987).
lOW. G. Bley, Vacuum 38, 103, (1988). ILL. Lieszkovszky and A. R. Filippelli, J. Vac. Sci. Techno!. A 8, 3838
(1990) 12D. 1. Mitchell, J. Vac. Sci. Techno!. A 3,52; (1984). DH. F. Dylla and W. D. Blanchard, J. Vac. Sci. Technoi. A 1, 129&
(1983). 14R. E. Ellefson, W. D. Moddeman, and H. F. Dylla, J. Vac. Sci. Tech
nol. 18,1062 (1981). 15C. A. Hoffman, Vacuum 24, 65 (1974). lOR, F. Dylla and W. D. Blanchard, J. Vac. Sci. Techno!. A 1, 1298
(1983). PC. F. Morrison, J. Vac. Sci. Techno!. 6, ;9 (1969). ISS. Dittmann, The High Vacuum Standard and Its Use (NIST, Gaith
ersburg, MD, 1989), NIST Special Publication 250-34.
Redistribution subject to AVS license or copyright; see http://scitation.aip.org/termsconditions. Download to IP: 134.71.135.134 On: Sun, 23 Nov 2014 22:42:58
A40 Basford et sl.: American Vacuum Society Recommended Practice A40
19K. F. Poulter, Vacuum 28, 135 (1978). 20C. R. Tilford, S. Dittmann, and K. E. McCulloh, J. Vac. Sci. TechnoL
A 6, 2853 (1988). 21K. F. Poulter, J. Phys. E 10, 112 (1977). 22c. R. Tilford, J. Vac. Sci. Techno!. A 1, 152 (1983). 23B, R. F. Kendall, J. Vac. Sci. Techno!. A 5, 143 (1987). 24J. H. Beynon, Mass Spectrometry and its Applications to Organic Chem
istry (Elsevier, New York, 1960), Chap. 5. 25p. H. Dawson, in Ref 4, p 310. 26S. Dushman, Scientific Foundations of Vacuum Technique, 2nd ed.,
edited by J. M. Lafferty (Wiley, New York, 1962), p 81. 27A. O. Nier, Adv. Mass Spectrom. 6, 212 (1981). 2Re. F. Robinson and A. G. Sharkey, Rev. Sci. lnstrum. 29, 250 (1958). 29W. R. Blanchard, P. J. McCarthy, H. F. Dylla, P. H. LaMarche, and
J. E. Simpkins, J. Vac. Sci. Techno!. A 4, 1715 (1986). 30e. E. Melton, Rev. Sci. lnstrum. 29, 250 (1958). 31K. E. McCulloh and C. R. Tilford, J. Vac. Sci. Techno!. 18, 994
(1981). 32C. R. Tilford, J. Vac. Sci. Technol. A 3,546 (1985). 33J. K. Fremerey, Vacuum 32,685 (1982).
J. Vac. Sci. Techno!. A, Vol. 11, No.3, May/Jun 1993
14S. Dittmann, B. E. Lindenau, and C. R. Tilford, J. Vac. Sci. Techno!' A 7, 3356 (1989).
35J. Setina, Vacuum 40,51 (1990). 36K. E. McCulloh, S. D. Wood, and e. R. Tilford, J. Vac. Sci. Technol.
A 3,1738 (1985). 37B, E. Lindenau, Vacuum 38,893 (1988). 38M. Hirata, h. Isogai, and M. Ono, J. Vac. Sci. Techno!. A 4, 1724
(1986). 39S._H. Choi, S. Dittmann, and C. R. Tilford, J. Vac. Sci. Techno!. A 8,
4079 (1990). 4OG. Comsa, J. K. Fremerey, B. Lindenau, G. Messer, and P. Rohl, J.
Vac. Sci. Techno!. 17, 642 (1980). 41R. W. Hyland and R. L. Shaffer, J. Vac. Sci. Technol. A 9, 2843
(1991). 42H, W. Werner and A. J. Linssen, J. Vac. Sci. Techno!. 11, 843 (1974). 43W. K. Huber and G. Rettinghaus, J. Vac. Sci. Techno!. 16, 681 (1979). 44B. Hu and J. Qiu, J. Vac. Sci. Techno!. A 5, 2657 (1987). 45W. E. Austin, F. M. Mao, Jin Man Yang, and J. H. Leek, J. Vac. Sci.
Technol. A 5, 2631 (1987). 46W. E. Austin, J. H. Leck, and J. H. Batey, J. Vac. Sci. TechnoL A 10,
3563 (1992).
Redistribution subject to AVS license or copyright; see http://scitation.aip.org/termsconditions. Download to IP: 134.71.135.134 On: Sun, 23 Nov 2014 22:42:58