Embed Size (px)
Citation preview
October 26, 2012
Presented at:
“Restructuring Financial Infrastructure to Speed
Recovery”
Brookings-Nomura-Wharton Conference on
Financial Markets 2012
Reconstructing and Revitalizing Japan's Financial Sector:
Policy Implications
Yuta Seki
Kei Kodachi
Hiroshi Yoshikawa
Nomura Institute of Capital Markets Research (Japan)
1
Major Concern: Containing System-Wide Shock and Rebuilding Confidence
Japanese Experiences
Removing Bad Assets Regarded as Critically Important Policy
Lack of Legal Framework and Practices for Transacting Distressed Assets/Businesses
Designing “Comprehensive” Policies for Reconstruction
Balancing Incentives of Senior Managers and Improved Transparency and Governance
Revitalizing Corporate Sector and Real Estate Market
Concerns and Issues
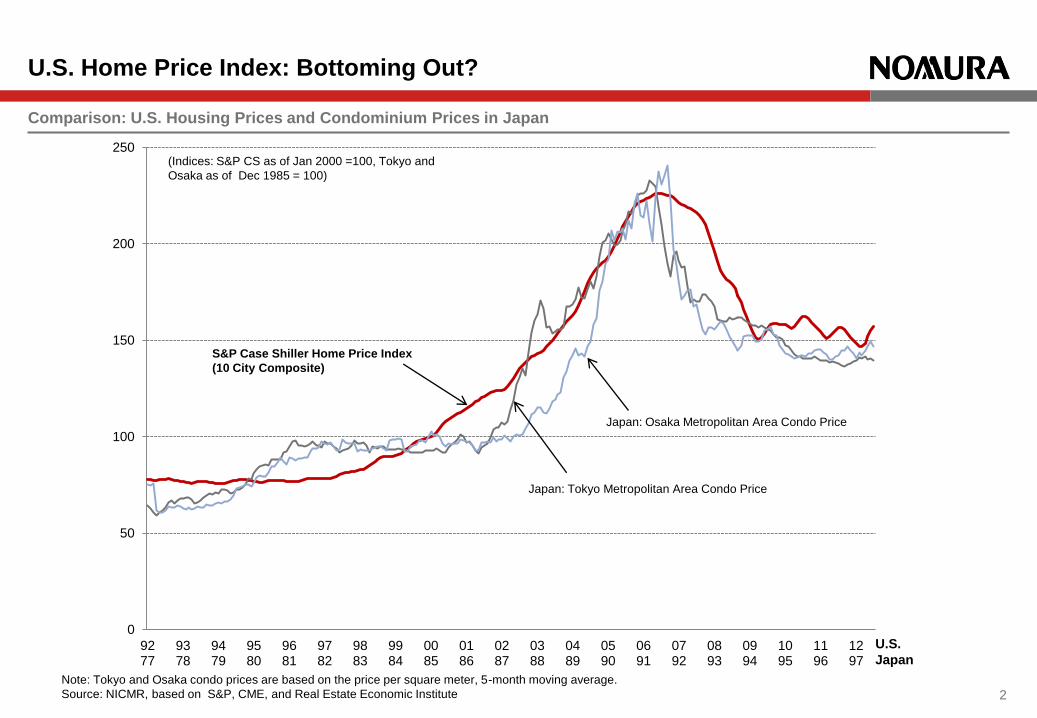
U.S. Home Price Index: Bottoming Out?
2
0
50
100
150
200
250
92 77
93 78
94 79
95 80
96 81
97 82
98 83
99 84
00 85
01 86
02 87
03 88
04 89
05 90
06 91
07 92
08 93
09 94
10 95
11 96
12 97
S&P Case Shiller Home Price Index
(10 City Composite)
Japan: Tokyo Metropolitan Area Condo Price
Japan: Osaka Metropolitan Area Condo Price
(Indices: S&P CS as of Jan 2000 =100, Tokyo and
Osaka as of Dec 1985 = 100)
Note: Tokyo and Osaka condo prices are based on the price per square meter, 5-month moving average.
Source: NICMR, based on S&P, CME, and Real Estate Economic Institute
Comparison: U.S. Housing Prices and Condominium Prices in Japan
U.S.
Japan
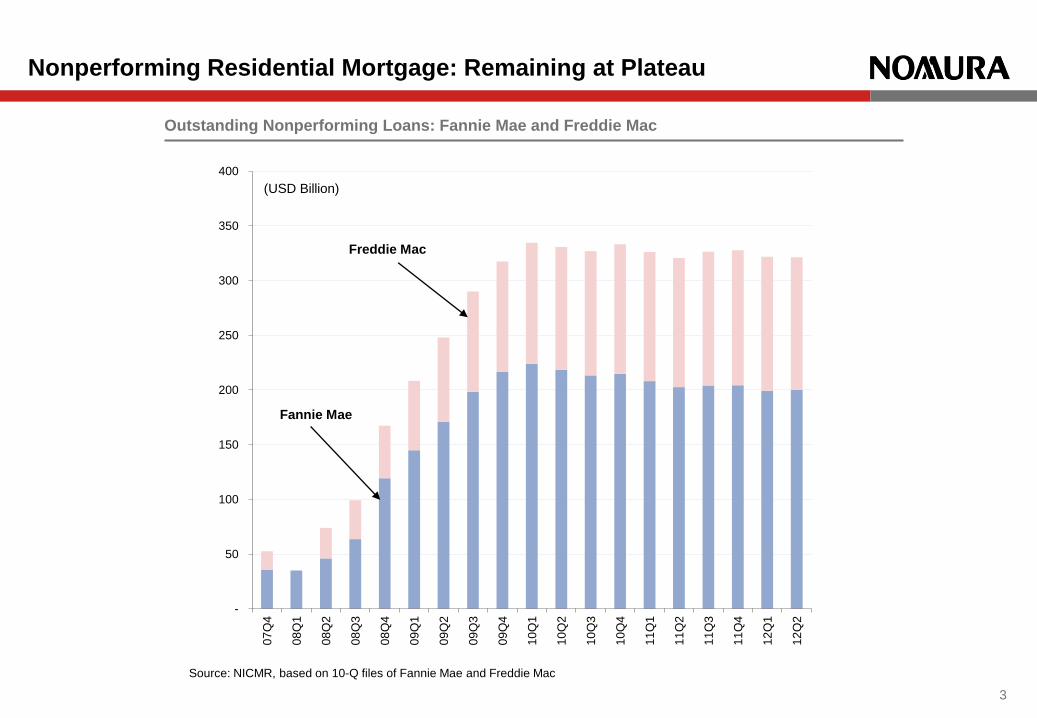
Nonperforming Residential Mortgage: Remaining at Plateau
3
Source: NICMR, based on 10-Q files of Fannie Mae and Freddie Mac
Outstanding Nonperforming Loans: Fannie Mae and Freddie Mac
-
50
100
150
200
250
300
350
400
07
Q4
08
Q1
08
Q2
08
Q3
08
Q4
09
Q1
09
Q2
09
Q3
09
Q4
10
Q1
10
Q2
10
Q3
10
Q4
11
Q1
11
Q2
11
Q3
11
Q4
12
Q1
12
Q2
(USD Billion)
Freddie Mac
Fannie Mae
0
50
100
150
200
250
300
350
400
0%
1%
2%
3%
4%
5%
6%
1984 1987 1990 1993 1996 1999 2002 2005 2008 2011
Noncurrent Loans and
Leases/ Total Loans and
Leases (%)
: Left Axis
Noncurrent Loans
and Leases Amount
(USD Billion): Right
Axis
0
50
100
150
200
250
0%
20%
40%
60%
80%
100%
120%
140%
160%
180%
200%
1984 1986 1988 1990 1992 1994 1996 1998 2000 2002 2004 2006 2008 2010 12Q2
Allowance for Losses
/ Noncurrent Loans
and Leases (%): Left
Axis
Provision for Loan and
Lease Losses (USD
Billion): Right Axis
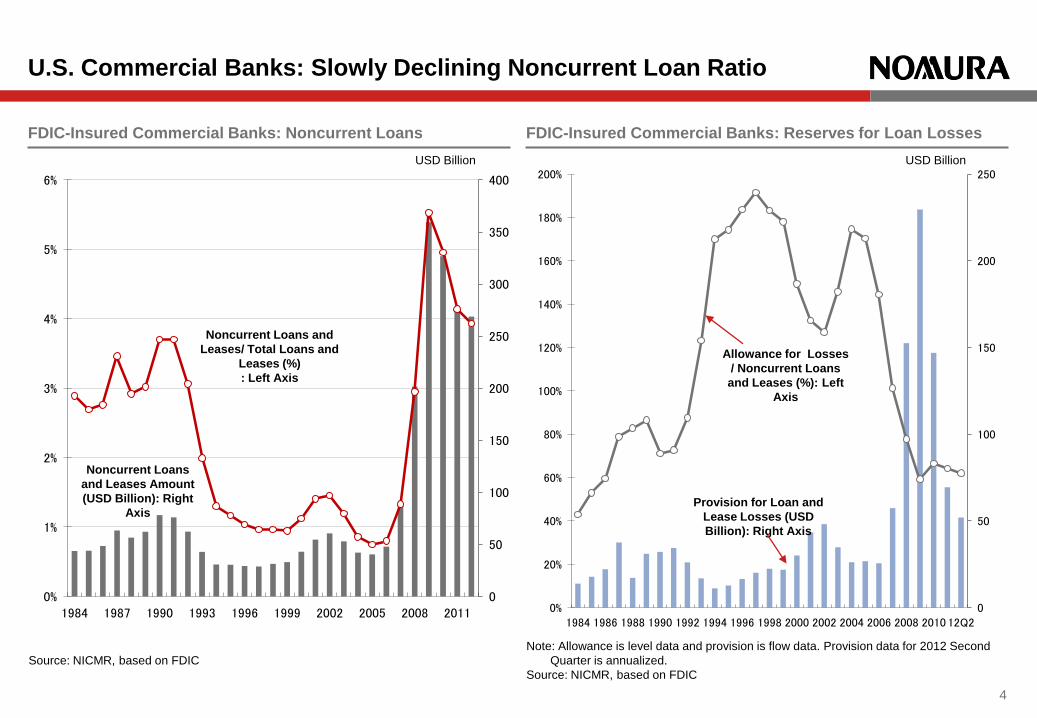
U.S. Commercial Banks: Slowly Declining Noncurrent Loan Ratio
4
FDIC-Insured Commercial Banks: Noncurrent Loans FDIC-Insured Commercial Banks: Reserves for Loan Losses
Source: NICMR, based on FDIC
Note: Allowance is level data and provision is flow data. Provision data for 2012 Second
Quarter is annualized.
Source: NICMR, based on FDIC
USD Billion USD Billion
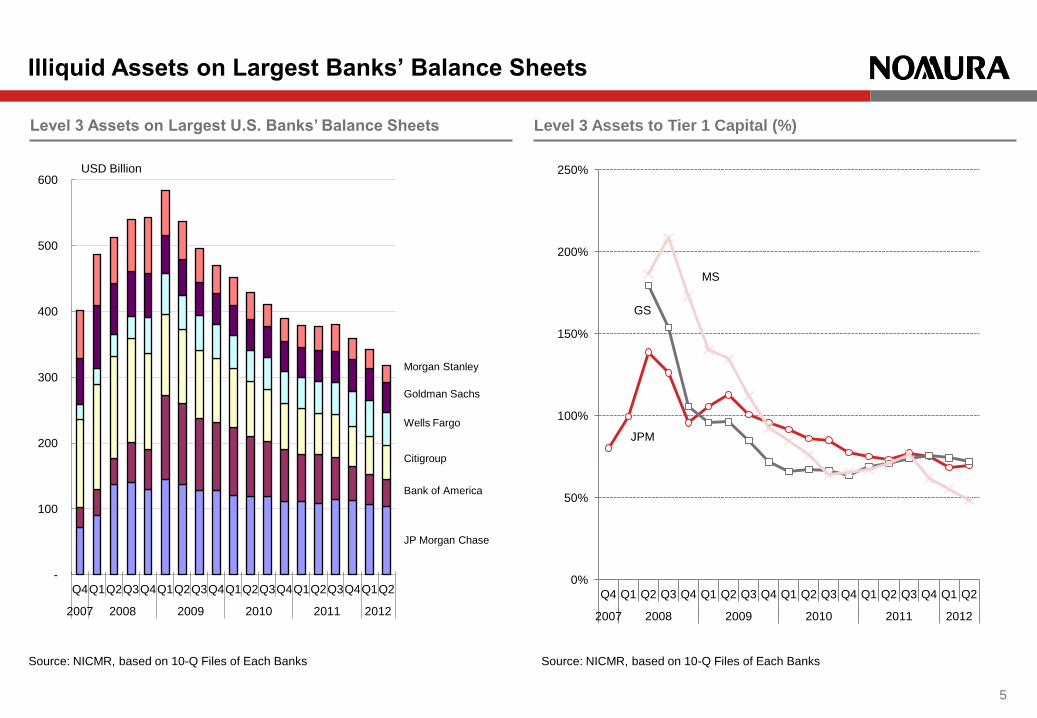
Illiquid Assets on Largest Banks’ Balance Sheets
Source: NICMR, based on 10-Q Files of Each Banks
5
Level 3 Assets on Largest U.S. Banks’ Balance Sheets Level 3 Assets to Tier 1 Capital (%)
Source: NICMR, based on 10-Q Files of Each Banks
-
100
200
300
400
500
600
Q4 Q1 Q2 Q3 Q4 Q1 Q2 Q3 Q4 Q1 Q2 Q3 Q4 Q1 Q2 Q3 Q4 Q1 Q2
2007 2008 2009 2010 2011 2012
USD Billion
JP Morgan Chase
Bank of America
Citigroup
Wells Fargo
Goldman Sachs
Morgan Stanley
0%
50%
100%
150%
200%
250%
Q4 Q1 Q2 Q3 Q4 Q1 Q2 Q3 Q4 Q1 Q2 Q3 Q4 Q1 Q2 Q3 Q4 Q1 Q2
2007 2008 2009 2010 2011 2012
JPM
MS
GS
0
100
200
300
400
500
600
700
Ja
n-0
4
Ju
n-0
4
No
v-0
4
Ap
r-0
5
Se
p-0
5
Fe
b-0
6
Ju
l-0
6
De
c-0
6
Ma
y-0
7
Oct-
07
Ma
r-0
8
Au
g-0
8
Ja
n-0
9
Ju
n-0
9
No
v-0
9
Ap
r-1
0
Se
p-1
0
Fe
b-1
1
Ju
l-1
1
De
c-1
1
Ma
y-1
2
Citi
BofA
JPM
Wells Fargo
GS
MS
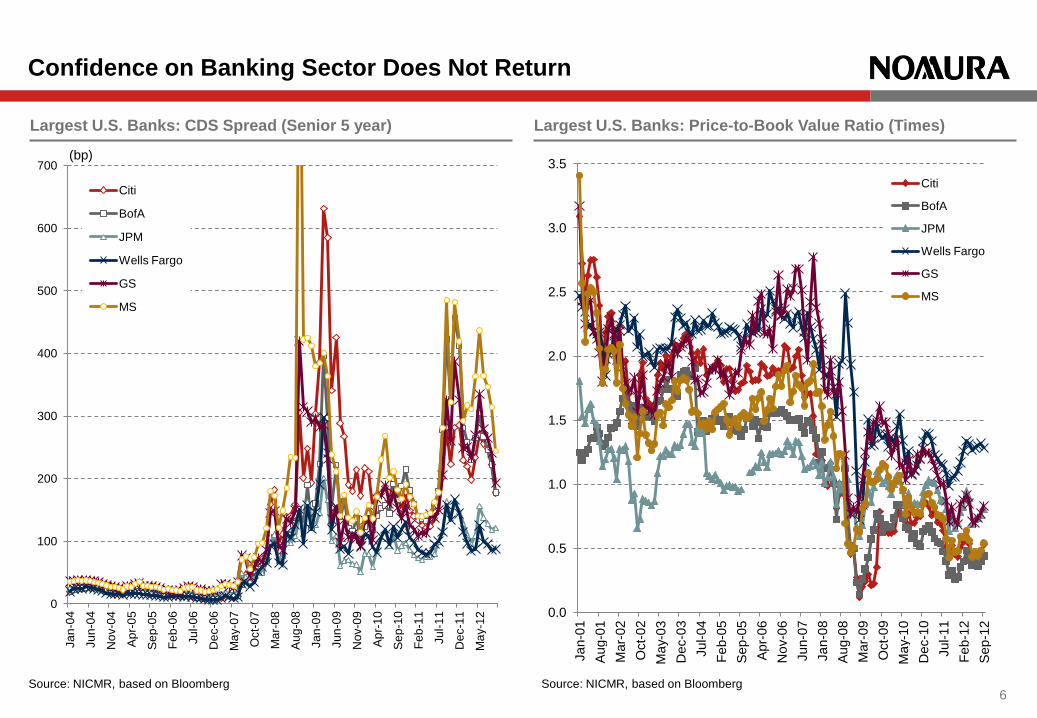
Confidence on Banking Sector Does Not Return
Source: NICMR, based on Bloomberg 6
Largest U.S. Banks: CDS Spread (Senior 5 year) Largest U.S. Banks: Price-to-Book Value Ratio (Times)
Source: NICMR, based on Bloomberg
0.0
0.5
1.0
1.5
2.0
2.5
3.0
3.5
Jan-0
1
Aug-0
1
Mar-
02
Oct-
02
Ma
y-0
3
Dec-0
3
Jul-04
Feb-0
5
Sep-0
5
Apr-
06
Nov-0
6
Jun-0
7
Jan-0
8
Aug-0
8
Mar-
09
Oct-
09
Ma
y-1
0
Dec-1
0
Jul-11
Feb-1
2
Sep-1
2
Citi
BofA
JPM
Wells Fargo
GS
MS
(bp)
7
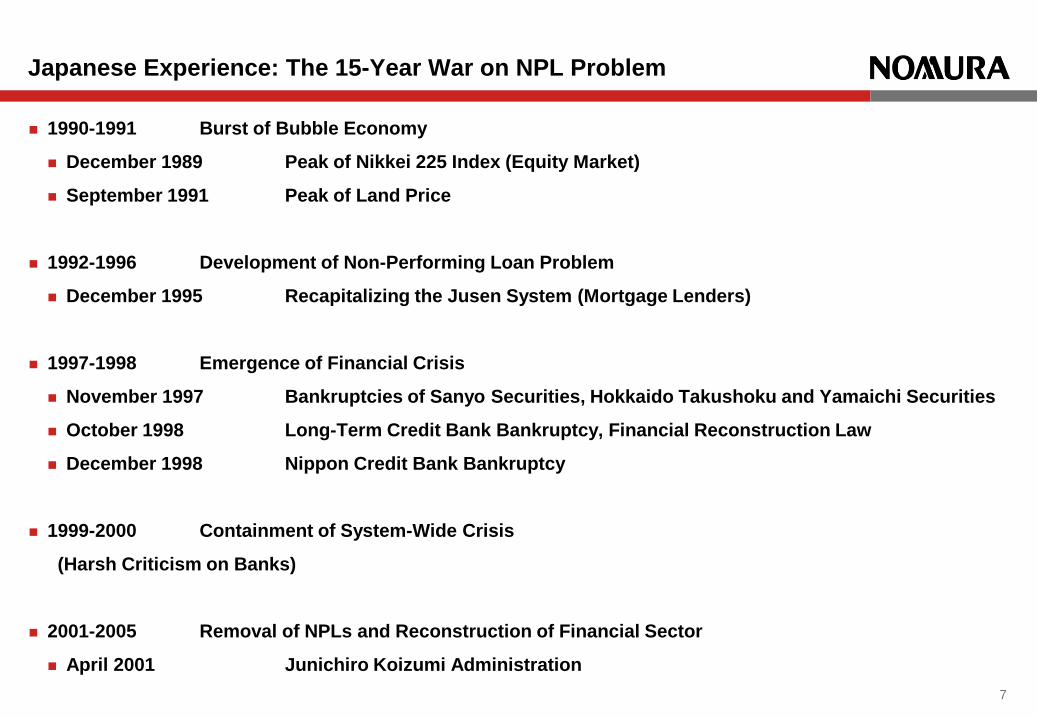
1990-1991 Burst of Bubble Economy
December 1989 Peak of Nikkei 225 Index (Equity Market)
September 1991 Peak of Land Price
1992-1996 Development of Non-Performing Loan Problem
December 1995 Recapitalizing the Jusen System (Mortgage Lenders)
1997-1998 Emergence of Financial Crisis
November 1997 Bankruptcies of Sanyo Securities, Hokkaido Takushoku and Yamaichi Securities
October 1998 Long-Term Credit Bank Bankruptcy, Financial Reconstruction Law
December 1998 Nippon Credit Bank Bankruptcy
1999-2000 Containment of System-Wide Crisis
(Harsh Criticism on Banks)
2001-2005 Removal of NPLs and Reconstruction of Financial Sector
April 2001 Junichiro Koizumi Administration
Japanese Experience: The 15-Year War on NPL Problem
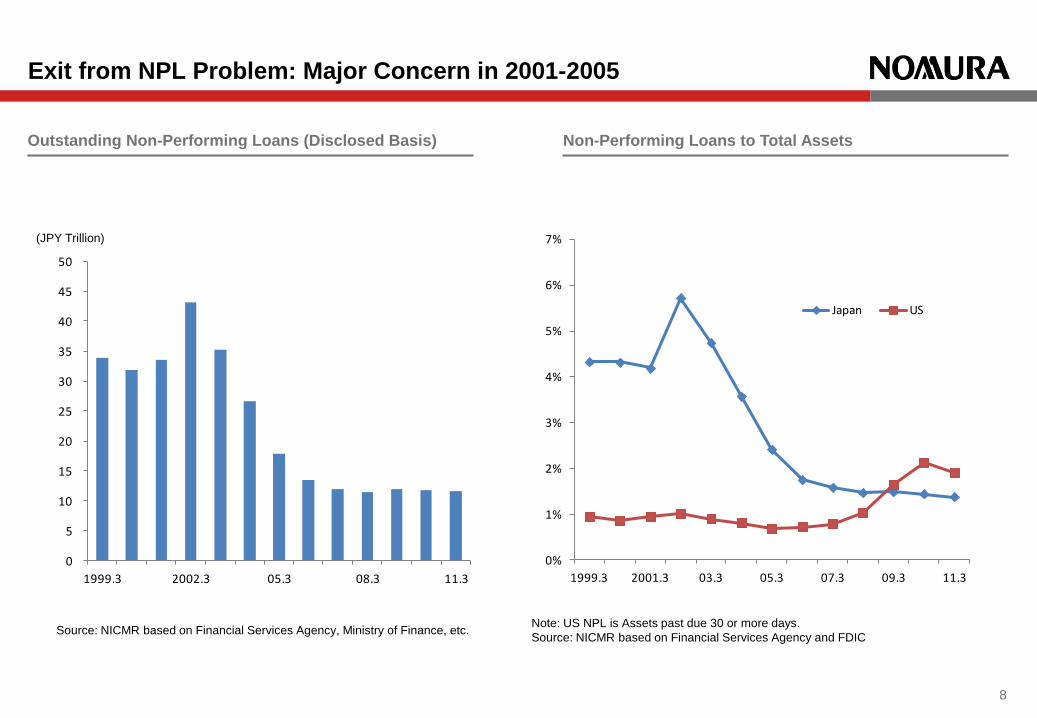
Outstanding Non-Performing Loans (Disclosed Basis)
Exit from NPL Problem: Major Concern in 2001-2005
8
Source: NICMR based on Financial Services Agency, Ministry of Finance, etc.
0
5
10
15
20
25
30
35
40
45
50
1999.3 2002.3 05.3 08.3 11.3
(JPY Trillion)
0%
1%
2%
3%
4%
5%
6%
7%
1999.3 2001.3 03.3 05.3 07.3 09.3 11.3
Japan US
Non-Performing Loans to Total Assets
Note: US NPL is Assets past due 30 or more days.
Source: NICMR based on Financial Services Agency and FDIC
9
“Too Many To Fail”
Depressed Macro Economy
Disorganization of Industrial Sector
“Kicking the Can Down the Road”
Painful Secondary Loss by Sales
Remote from Fair Value Accounting
Lack of Incentives for Bank Management
“Extend and Pretend”, “Zombie” Companies
Complicated Debtor-Creditor Relationships
Recourse Loans
Multiple Mortgages on Single Property
Why Japan’s Financial Sector Struggled for So Long?
Lack of Market for Distressed Assets
No Legal Framework for Corporate
Reorganization or Out-of-Court Workouts
Debtor-in-Possession (DIP) Financing
Stagnant Real Estate Market
SPC Laws for Securitization (Enacted in 1998)
J-REIT Market (Launched in 2001)
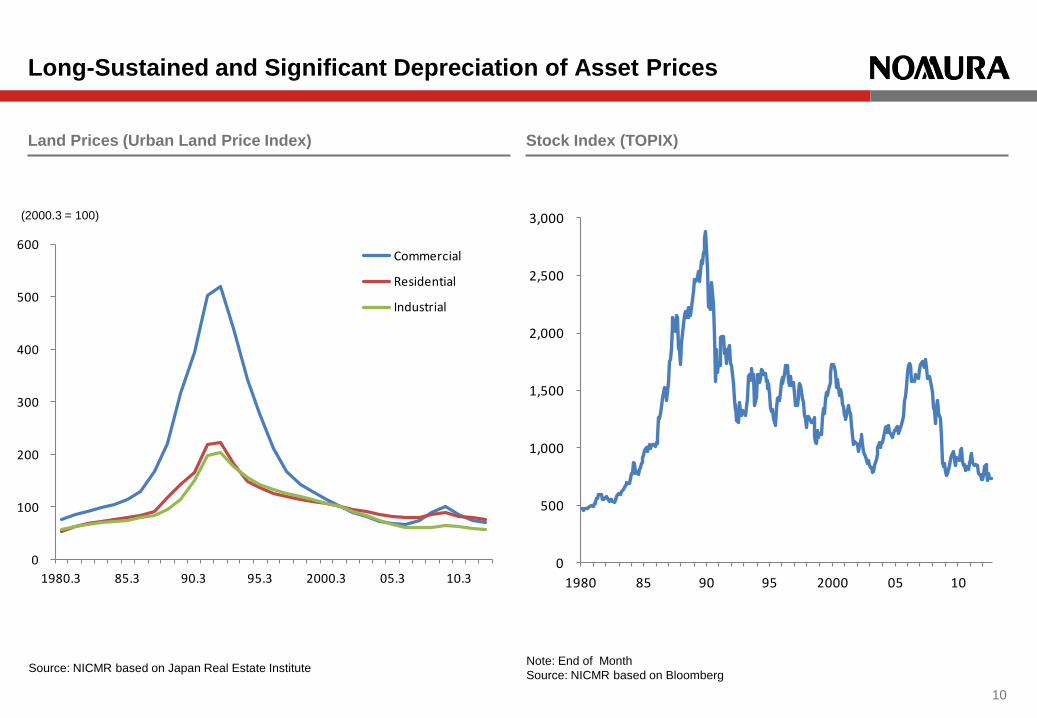
Long-Sustained and Significant Depreciation of Asset Prices
10
Land Prices (Urban Land Price Index) Stock Index (TOPIX)
Source: NICMR based on Japan Real Estate Institute Note: End of Month
Source: NICMR based on Bloomberg
(2000.3 = 100)
0
100
200
300
400
500
600
1980.3 85.3 90.3 95.3 2000.3 05.3 10.3
Commercial
Residential
Industrial
0
500
1,000
1,500
2,000
2,500
3,000
1980 85 90 95 2000 05 10
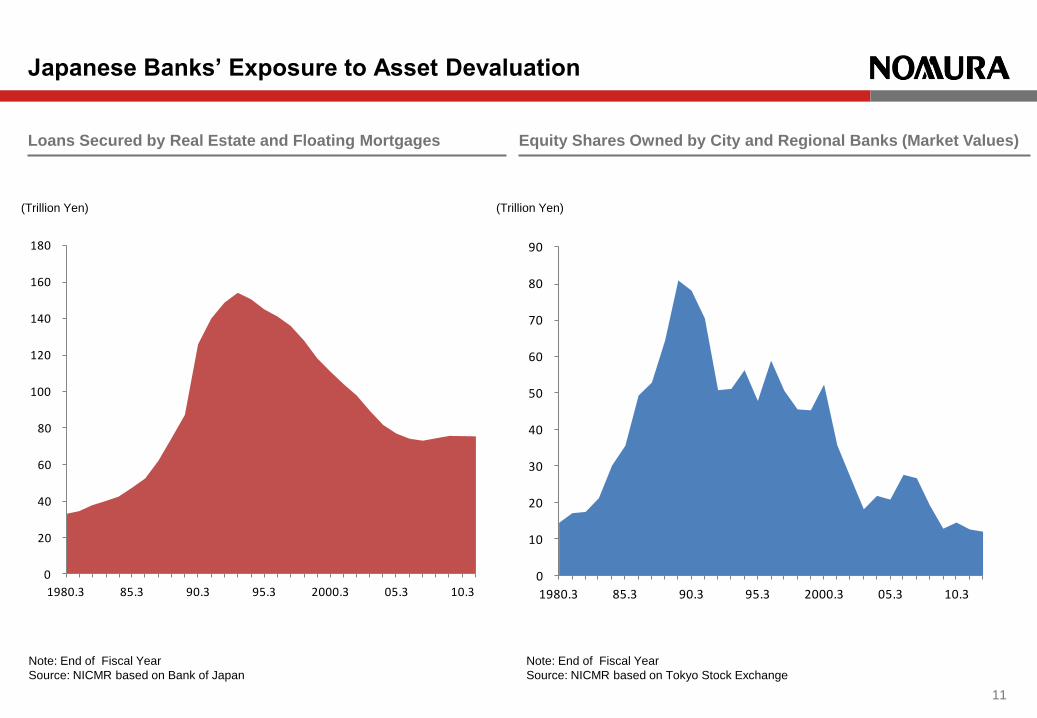
Japanese Banks’ Exposure to Asset Devaluation
11
Loans Secured by Real Estate and Floating Mortgages Equity Shares Owned by City and Regional Banks (Market Values)
Note: End of Fiscal Year
Source: NICMR based on Bank of Japan
Note: End of Fiscal Year
Source: NICMR based on Tokyo Stock Exchange
(Trillion Yen) (Trillion Yen)
0
20
40
60
80
100
120
140
160
180
1980.3 85.3 90.3 95.3 2000.3 05.3 10.30
10
20
30
40
50
60
70
80
90
1980.3 85.3 90.3 95.3 2000.3 05.3 10.3
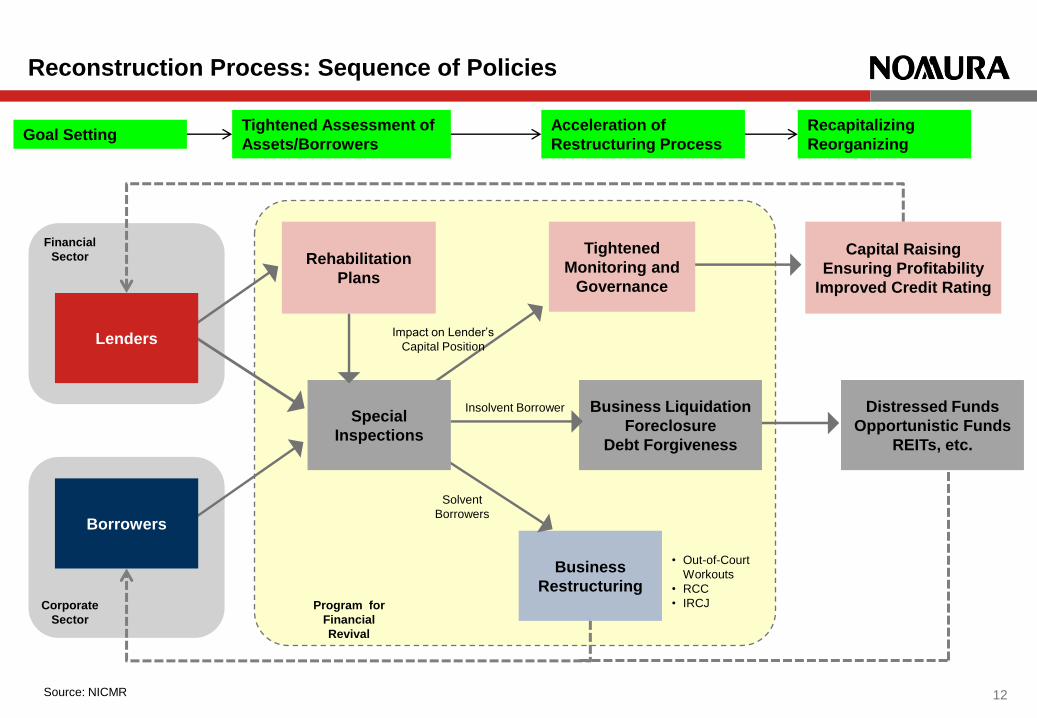
Tightened
Monitoring and
Governance
Reconstruction Process: Sequence of Policies
12
Goal Setting
Solvent
Borrowers Borrowers
Business
Restructuring
• Out-of-Court
Workouts
• RCC
• IRCJ
Source: NICMR
Business Liquidation
Foreclosure
Debt Forgiveness
Tightened Assessment of
Assets/Borrowers
Recapitalizing
Reorganizing
Capital Raising
Ensuring Profitability
Improved Credit Rating
Insolvent Borrower Distressed Funds
Opportunistic Funds
REITs, etc.
Acceleration of
Restructuring Process
Special
Inspections
Impact on Lender’s
Capital Position Lenders
Rehabilitation
Plans
Financial
Sector
Corporate
Sector
Program for
Financial
Revival
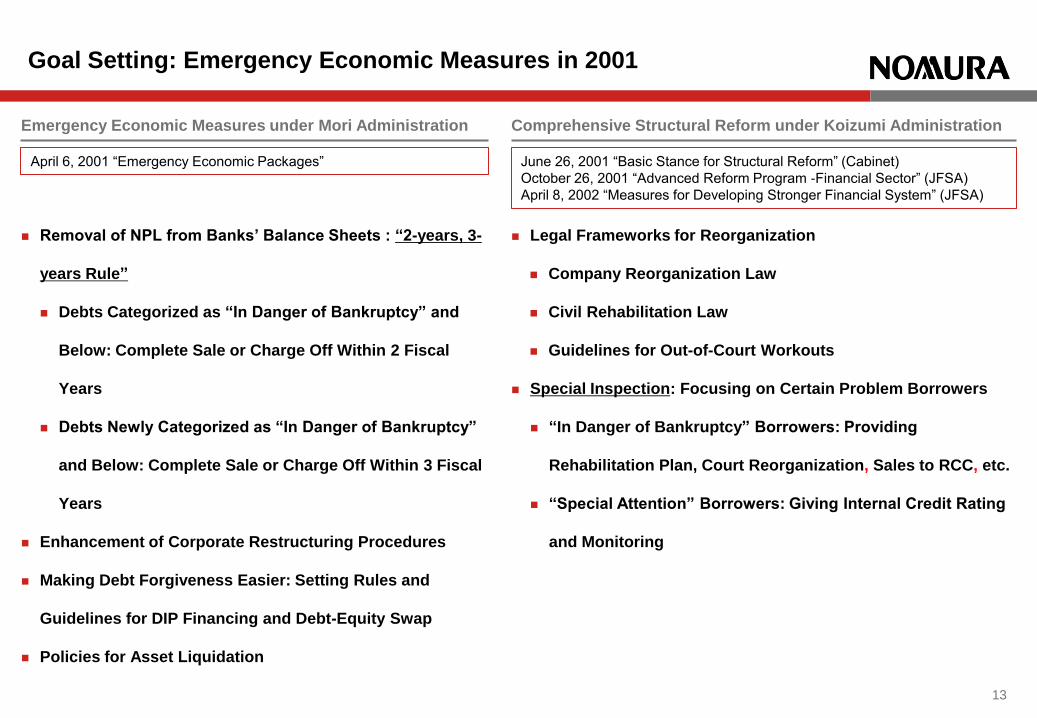
Removal of NPL from Banks’ Balance Sheets : “2-years, 3-
years Rule”
Debts Categorized as “In Danger of Bankruptcy” and
Below: Complete Sale or Charge Off Within 2 Fiscal
Years
Debts Newly Categorized as “In Danger of Bankruptcy”
and Below: Complete Sale or Charge Off Within 3 Fiscal
Years
Enhancement of Corporate Restructuring Procedures
Making Debt Forgiveness Easier: Setting Rules and
Guidelines for DIP Financing and Debt-Equity Swap
Policies for Asset Liquidation
Legal Frameworks for Reorganization
Company Reorganization Law
Civil Rehabilitation Law
Guidelines for Out-of-Court Workouts
Special Inspection: Focusing on Certain Problem Borrowers
“In Danger of Bankruptcy” Borrowers: Providing
Rehabilitation Plan, Court Reorganization, Sales to RCC, etc.
“Special Attention” Borrowers: Giving Internal Credit Rating
and Monitoring
Goal Setting: Emergency Economic Measures in 2001
Emergency Economic Measures under Mori Administration Comprehensive Structural Reform under Koizumi Administration
13
April 6, 2001 “Emergency Economic Packages” June 26, 2001 “Basic Stance for Structural Reform” (Cabinet)
October 26, 2001 “Advanced Reform Program -Financial Sector” (JFSA)
April 8, 2002 “Measures for Developing Stronger Financial System” (JFSA)
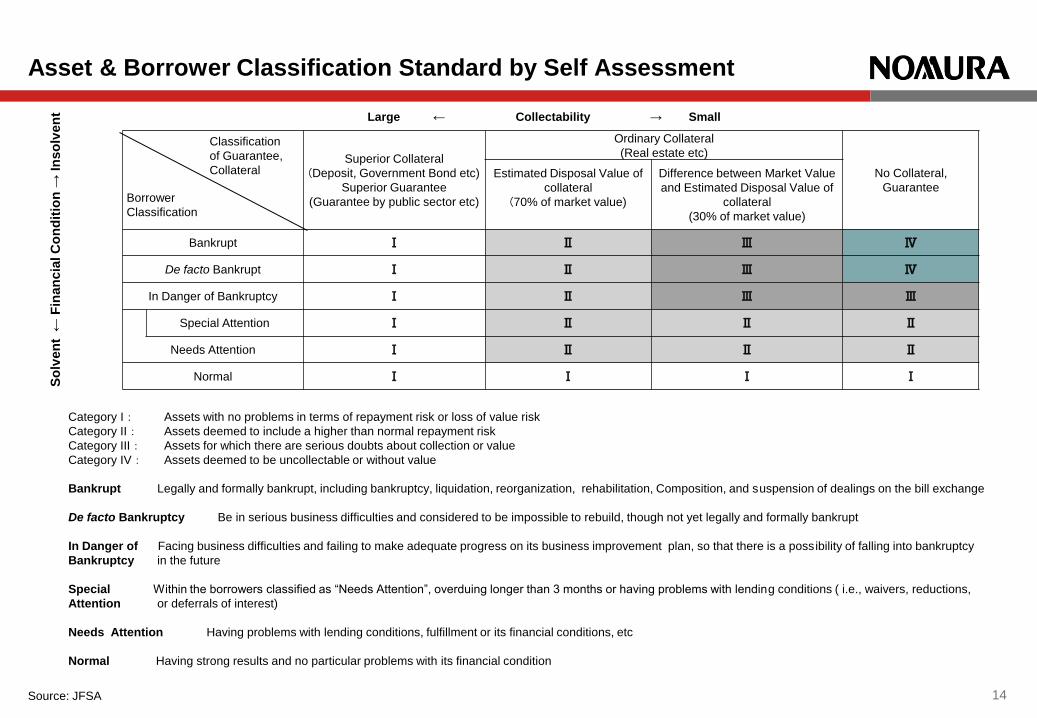
Superior Collateral
(Deposit, Government Bond etc)
Superior Guarantee
(Guarantee by public sector etc)
Ordinary Collateral
(Real estate etc)
No Collateral,
Guarantee
Estimated Disposal Value of
collateral
(70% of market value)
Difference between Market Value
and Estimated Disposal Value of
collateral
(30% of market value)
Bankrupt Ⅰ Ⅱ Ⅲ Ⅳ
De facto Bankrupt Ⅰ Ⅱ Ⅲ Ⅳ
In Danger of Bankruptcy Ⅰ Ⅱ Ⅲ Ⅲ
Special Attention Ⅰ Ⅱ Ⅱ Ⅱ
Needs Attention Ⅰ Ⅱ Ⅱ Ⅱ
Normal Ⅰ Ⅰ Ⅰ Ⅰ
Asset & Borrower Classification Standard by Self Assessment
14
Borrower
Classification
Classification
of Guarantee,
Collateral
So
lven
t ←
Fin
an
cia
l C
on
dit
ion
→ In
so
lven
t Large ← Collectability → Small
Category I: Assets with no problems in terms of repayment risk or loss of value risk
Category II: Assets deemed to include a higher than normal repayment risk
Category III: Assets for which there are serious doubts about collection or value
Category IV: Assets deemed to be uncollectable or without value
Bankrupt Legally and formally bankrupt, including bankruptcy, liquidation, reorganization, rehabilitation, Composition, and suspension of dealings on the bill exchange
De facto Bankruptcy Be in serious business difficulties and considered to be impossible to rebuild, though not yet legally and formally bankrupt
In Danger of Facing business difficulties and failing to make adequate progress on its business improvement plan, so that there is a possibility of falling into bankruptcy
Bankruptcy in the future
Special Within the borrowers classified as “Needs Attention”, overduing longer than 3 months or having problems with lending conditions ( i.e., waivers, reductions,
Attention or deferrals of interest)
Needs Attention Having problems with lending conditions, fulfillment or its financial conditions, etc
Normal Having strong results and no particular problems with its financial condition
Source: JFSA
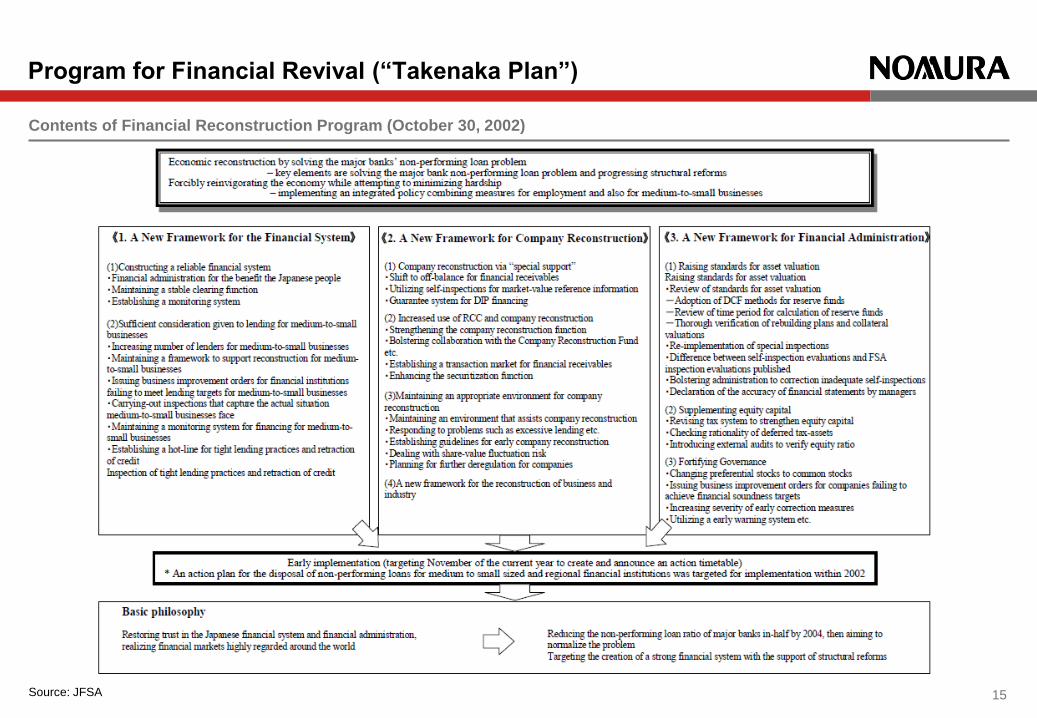
Program for Financial Revival (“Takenaka Plan”)
15 Source: JFSA
Contents of Financial Reconstruction Program (October 30, 2002)
16
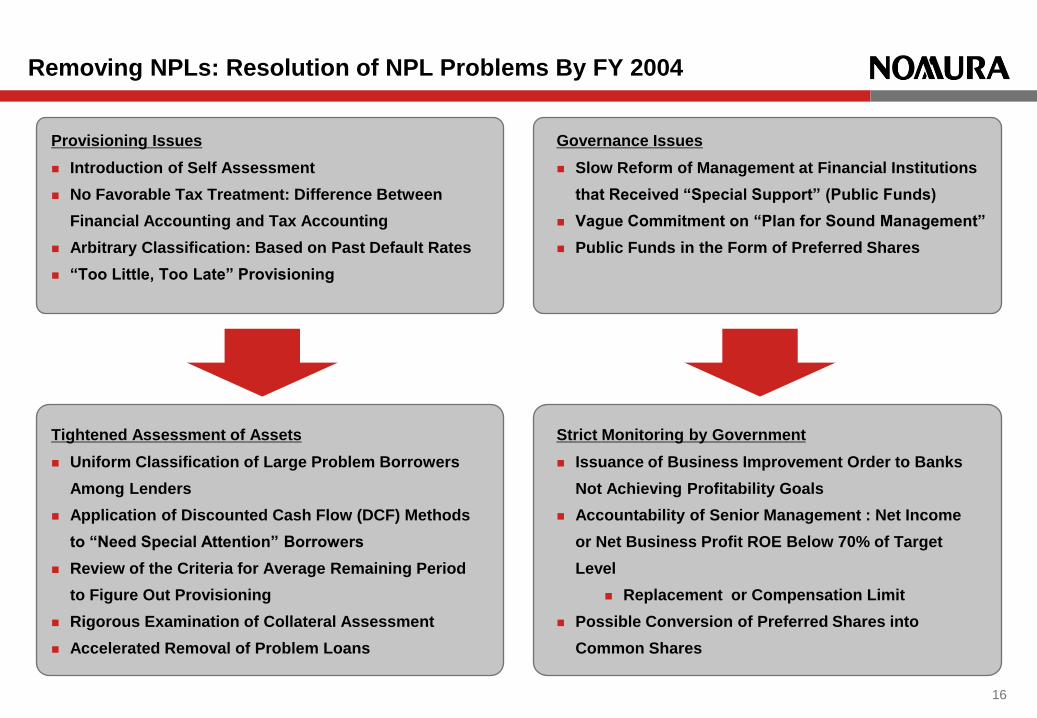
Removing NPLs: Resolution of NPL Problems By FY 2004
Governance Issues
Slow Reform of Management at Financial Institutions
that Received “Special Support” (Public Funds)
Vague Commitment on “Plan for Sound Management”
Public Funds in the Form of Preferred Shares
Strict Monitoring by Government
Issuance of Business Improvement Order to Banks
Not Achieving Profitability Goals
Accountability of Senior Management : Net Income
or Net Business Profit ROE Below 70% of Target
Level
Replacement or Compensation Limit
Possible Conversion of Preferred Shares into
Common Shares
Provisioning Issues
Introduction of Self Assessment
No Favorable Tax Treatment: Difference Between
Financial Accounting and Tax Accounting
Arbitrary Classification: Based on Past Default Rates
“Too Little, Too Late” Provisioning
Tightened Assessment of Assets
Uniform Classification of Large Problem Borrowers
Among Lenders
Application of Discounted Cash Flow (DCF) Methods
to “Need Special Attention” Borrowers
Review of the Criteria for Average Remaining Period
to Figure Out Provisioning
Rigorous Examination of Collateral Assessment
Accelerated Removal of Problem Loans
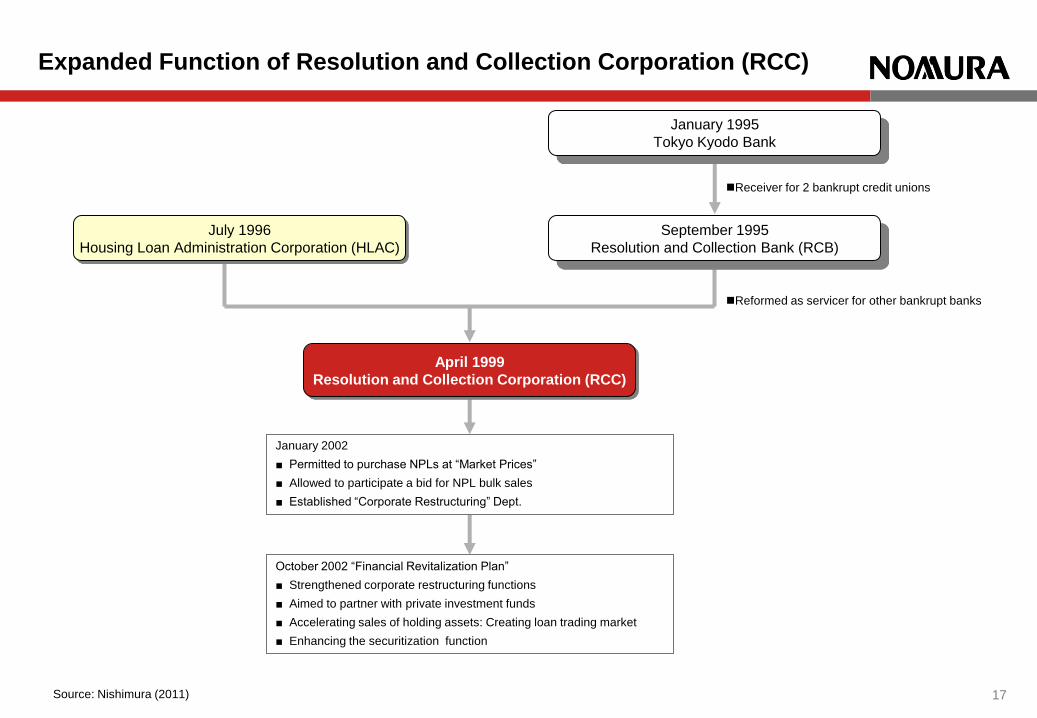
Expanded Function of Resolution and Collection Corporation (RCC)
Receiver for 2 bankrupt credit unions
September 1995
Resolution and Collection Bank (RCB)
April 1999
Resolution and Collection Corporation (RCC)
January 2002
■ Permitted to purchase NPLs at “Market Prices”
■ Allowed to participate a bid for NPL bulk sales
■ Established “Corporate Restructuring” Dept.
Source: Nishimura (2011) 17
January 1995
Tokyo Kyodo Bank
Reformed as servicer for other bankrupt banks
July 1996
Housing Loan Administration Corporation (HLAC)
October 2002 “Financial Revitalization Plan”
■ Strengthened corporate restructuring functions
■ Aimed to partner with private investment funds
■ Accelerating sales of holding assets: Creating loan trading market
■ Enhancing the securitization function
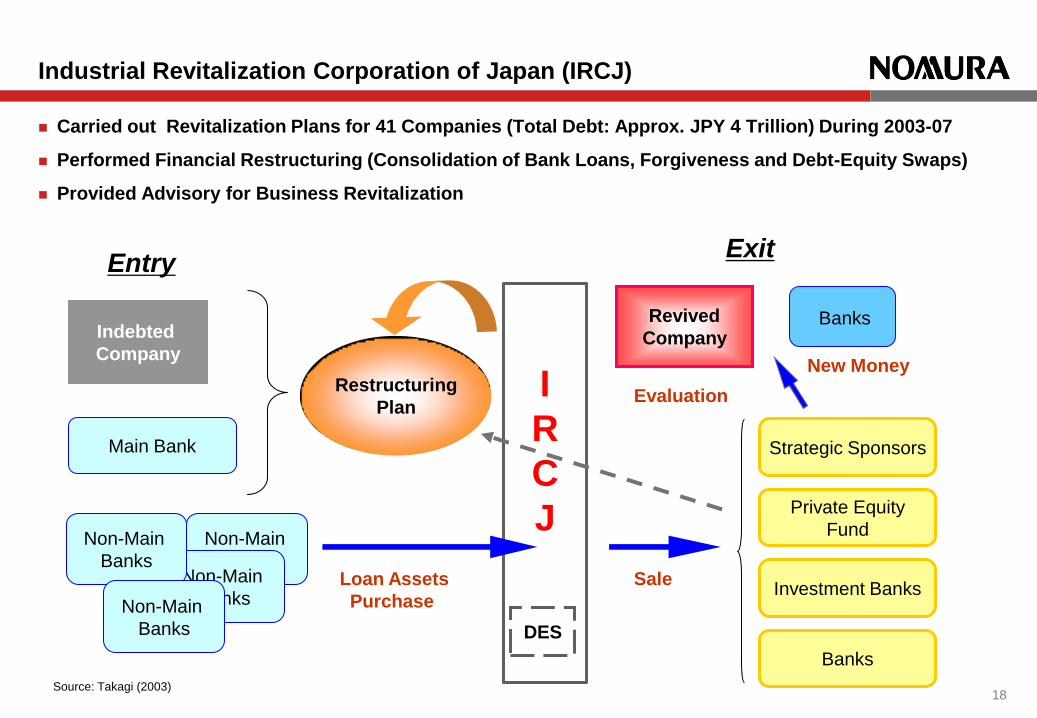
Industrial Revitalization Corporation of Japan (IRCJ)
18
Carried out Revitalization Plans for 41 Companies (Total Debt: Approx. JPY 4 Trillion) During 2003-07
Performed Financial Restructuring (Consolidation of Bank Loans, Forgiveness and Debt-Equity Swaps)
Provided Advisory for Business Revitalization
Non-Main
Banks Non-Main
Banks
I
R
C
J
Entry Exit
Indebted
Company
Main Bank
Non-Main
Banks
Restructuring
Plan
Revived
Company
Loan Assets
Purchase
Sale
DES
Evaluation
Banks
New Money
Private Equity
Fund
Investment Banks
Strategic Sponsors
Non-Main
Banks
Banks
Source: Takagi (2003)
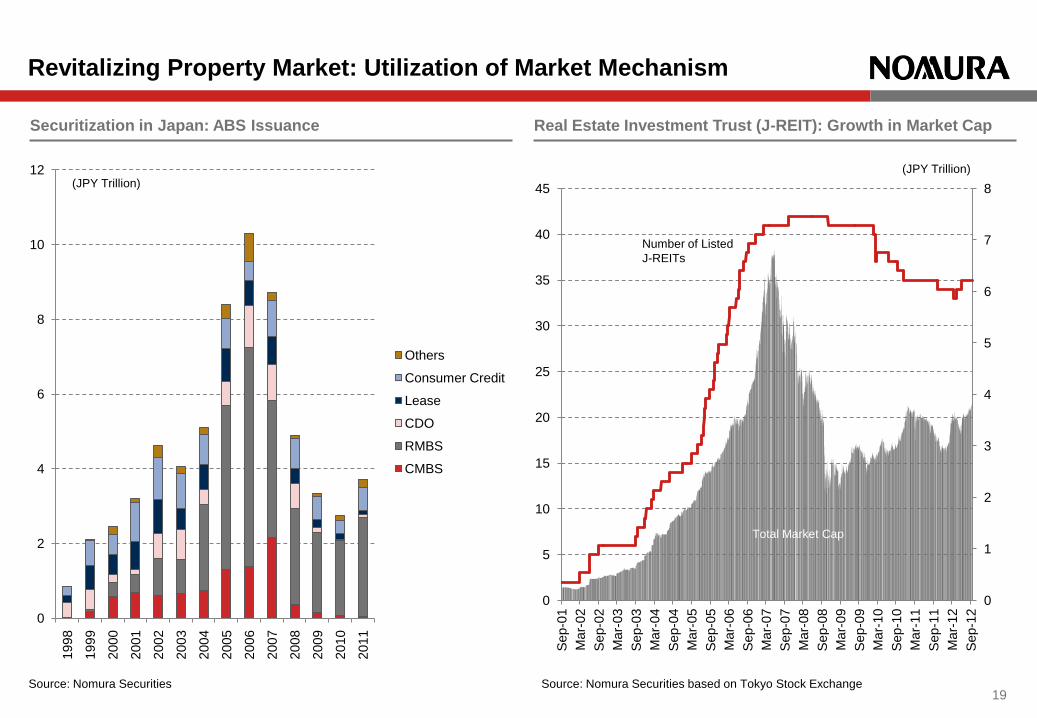
Revitalizing Property Market: Utilization of Market Mechanism
Source: Nomura Securities 19
Securitization in Japan: ABS Issuance Real Estate Investment Trust (J-REIT): Growth in Market Cap
Source: Nomura Securities based on Tokyo Stock Exchange
0
2
4
6
8
10
12
1998
1999
2000
2001
2002
2003
2004
2005
2006
2007
2008
2009
2010
2011
Others
Consumer Credit
Lease
CDO
RMBS
CMBS
(JPY Trillion)
0
1
2
3
4
5
6
7
8
0
5
10
15
20
25
30
35
40
45
Sep-0
1
Mar-
02
Sep-0
2
Mar-
03
Sep-0
3
Mar-
04
Sep-0
4
Mar-
05
Sep-0
5
Mar-
06
Sep-0
6
Mar-
07
Sep-0
7
Mar-
08
Sep-0
8
Mar-
09
Sep-0
9
Mar-
10
Sep-1
0
Mar-
11
Sep-1
1
Mar-
12
Sep-1
2
Number of Listed
J-REITs
Total Market Cap
(JPY Trillion)

Source: NICMR based on Japanese Bankers Association
Change in Capital Positions of Major Japanese Banks
Heterogeneity of Major Banks’ Responses to NPL Problems
20
0
3
6
9
12
15
0 3 6 9 12 150
3
6
9
12
15
0 3 6 9 12 15
0
3
6
9
12
15
0 3 6 9 12 15
0
3
6
9
12
15
0 3 6 9 12 15
0
3
6
9
12
15
0 3 6 9 12 15
2000.3 2001.3 2002.3
2004.3 2003.3
(NPL/Total assets, %) (NPL/Total assets, %) (NPL/Total assets, %)
(NPL/Total assets, %) (NPL/Total assets, %)
(Capital ratio, %) (Capital ratio, %) (Capital ratio, %)
(Capital ratio, %) (Capital ratio, %)
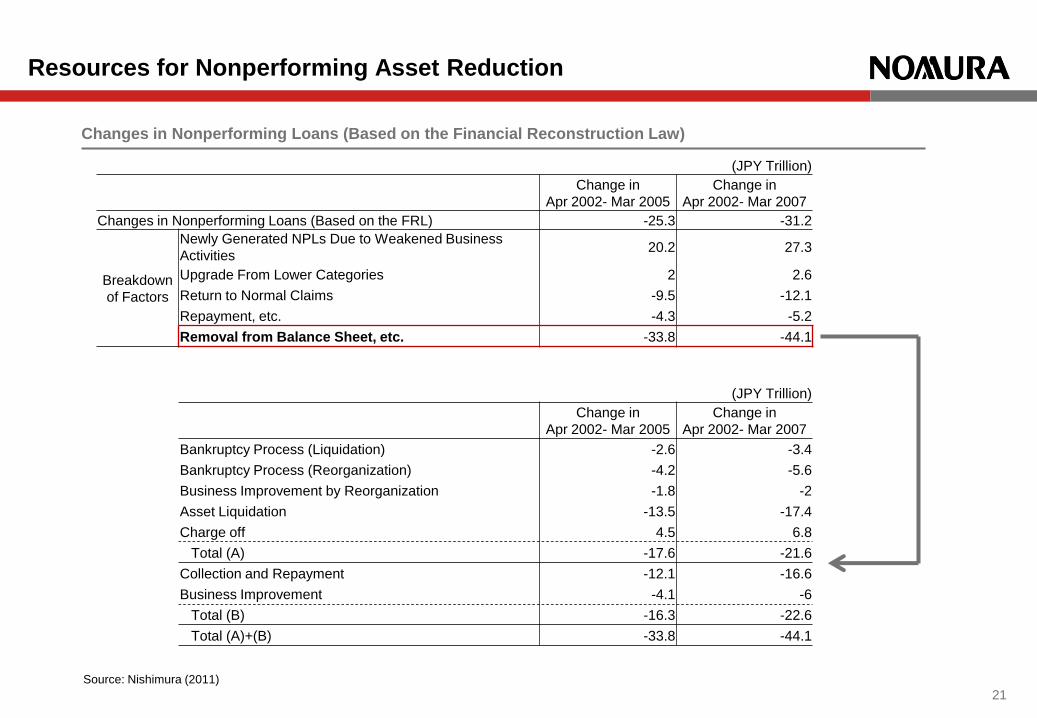
Changes in Nonperforming Loans (Based on the Financial Reconstruction Law)
Resources for Nonperforming Asset Reduction
21
(JPY Trillion)
Change in
Apr 2002- Mar 2005
Change in
Apr 2002- Mar 2007
Changes in Nonperforming Loans (Based on the FRL) -25.3 -31.2
Breakdown
of Factors
Newly Generated NPLs Due to Weakened Business
Activities 20.2 27.3
Upgrade From Lower Categories 2 2.6
Return to Normal Claims -9.5 -12.1
Repayment, etc. -4.3 -5.2
Removal from Balance Sheet, etc. -33.8 -44.1
(JPY Trillion)
Change in
Apr 2002- Mar 2005
Change in
Apr 2002- Mar 2007
Bankruptcy Process (Liquidation) -2.6 -3.4
Bankruptcy Process (Reorganization) -4.2 -5.6
Business Improvement by Reorganization -1.8 -2
Asset Liquidation -13.5 -17.4
Charge off 4.5 6.8
Total (A) -17.6 -21.6
Collection and Repayment -12.1 -16.6
Business Improvement -4.1 -6
Total (B) -16.3 -22.6
Total (A)+(B) -33.8 -44.1
Source: Nishimura (2011)

Consideration for Financial Stability During 2001-2005
22
Depository Institution Resolutions in Japan
Year Bank Shinkin Bank
(Credit
Association)
Credit Union Total
1991 1 0 0 1
1992 0 1 0 1
1993 0 1 1 2
1994 0 0 4 4
1995 2 0 4 6
1996 1 0 4 5
1997 3 0 14 17
1998 5 0 25 30
1999 5 10 29 44
2000 0 2 12 14
2001 2 13 41 56
2002 0 0 0 0
2003 1 0 0 1
2004 0 0 0 0
2005 0 0 0 0
Introduction of Deposit Protection Limits
Partially in Force in April 2002
Protection Limits on Savings Account:
Effective until April 2005 (initially scheduled to
end in April 2003, extended on October 8,
2002)
Resona Bank
Ashikaga Bank
Source: NICMR based on Deposit Insurance Corporation of Japan
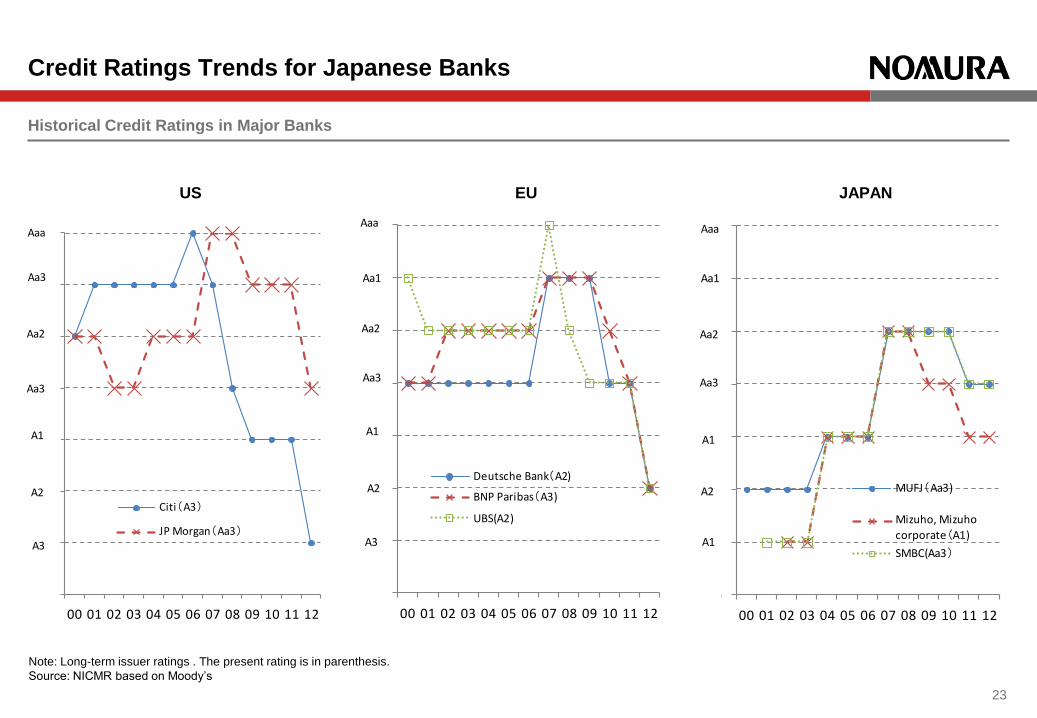
Historical Credit Ratings in Major Banks
Credit Ratings Trends for Japanese Banks
Note: Long-term issuer ratings . The present rating is in parenthesis.
Source: NICMR based on Moody’s
23
0
5
10
15
20
25
30
35
00 01 02 03 04 05 06 07 08 09 10 11 12
Deutsche Bank(A2)
BNP Paribas(A3)
UBS(A2)
Aaa
Aa1
Aa3
Aa2
A1
A2
A3
0
5
10
15
20
25
30
35
00 01 02 03 04 05 06 07 08 09 10 11 12
MUFJ(Aa3)
Mizuho, Mizuho
corporate(A1)
SMBC(Aa3)
Aaa
Aa1
Aa2
Aa3
A1
A2
A1
0
5
10
15
20
25
30
35
00 01 02 03 04 05 06 07 08 09 10 11 12
Citi(A3)
JP Morgan(Aa3)
Aaa
Aa1
A1
A2
A3
Aa3
Aa2
Aa3
US EU JAPAN
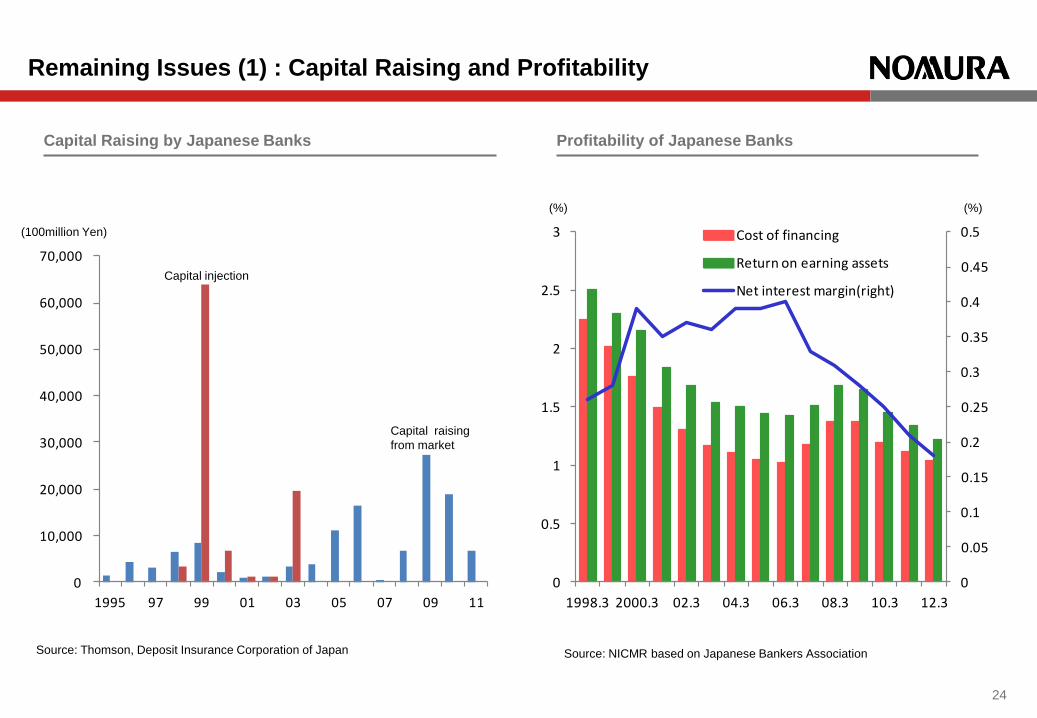
Remaining Issues (1) : Capital Raising and Profitability
Source: Thomson, Deposit Insurance Corporation of Japan
24
0
0.05
0.1
0.15
0.2
0.25
0.3
0.35
0.4
0.45
0.5
0
0.5
1
1.5
2
2.5
3
1998.3 2000.3 02.3 04.3 06.3 08.3 10.3 12.3
Cost of financing
Return on earning assets
Net interest margin(right)
(%) (%)
Source: NICMR based on Japanese Bankers Association
(100million Yen)
Capital Raising by Japanese Banks Profitability of Japanese Banks
0
10,000
20,000
30,000
40,000
50,000
60,000
70,000
1995 97 99 01 03 05 07 09 11
Capital injection
Capital raising
from market
50%
55%
60%
65%
70%
75%
80%
85%
90%
95%
300
350
400
450
500
550
600
650
1994 96 98 2000 02 04 06 08 10 12
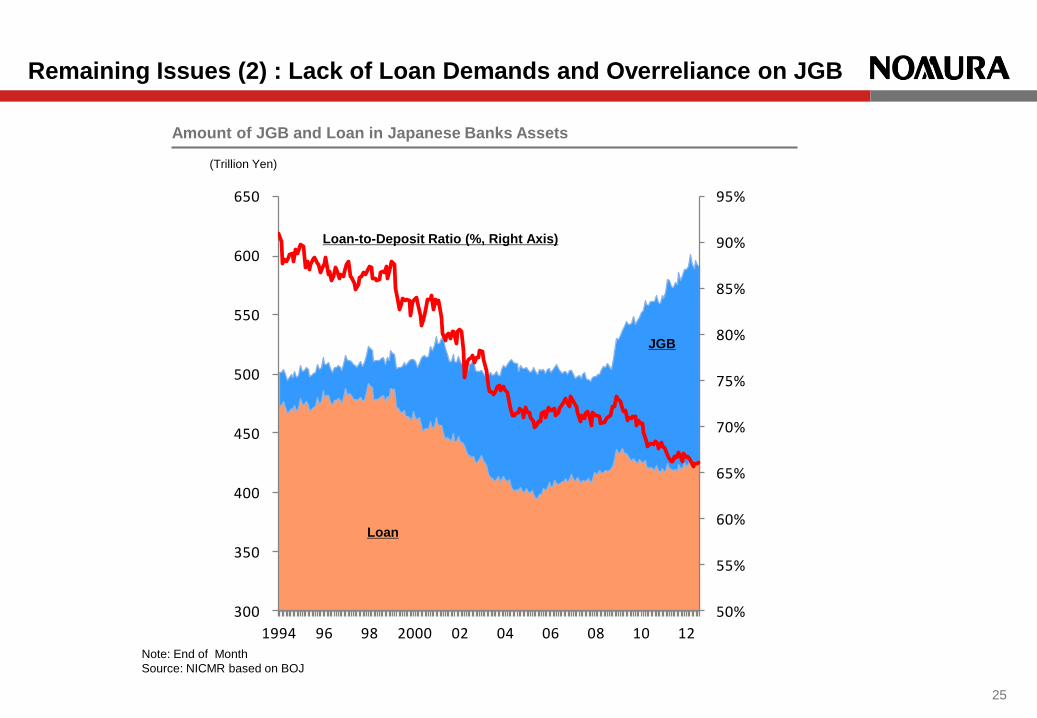
Amount of JGB and Loan in Japanese Banks Assets
Remaining Issues (2) : Lack of Loan Demands and Overreliance on JGB
25
Note: End of Month
Source: NICMR based on BOJ
(Trillion Yen)
Loan-to-Deposit Ratio (%, Right Axis)
Loan
JGB
26
Removal of Bad Assets: Speedy Policy Implementation by Political Leadership
“Convoy System” to “Segregation Policy”
Sequence of Policies: Appropriate Timing of Capital Raising?
Consideration for Borrowers: “Simultaneous” Reconstruction Needed?
Use of Market Mechanism: Benefit of Securitization
Implications for Asian Countries
Lessons from Japanese Experience
27
Financial Services Agency (2001) “The Advanced Reform Program –Financial Sector-”, October 26 2001
(http://www.fsa.go.jp/news/newse/e20011026-1.html)
Financial Services Agency (2002a) “Measures for Developing Stronger Financial System”, April 12 2002
(http://www.fsa.go.jp/news/newse/e20011026-1.html)
Financial Services Agency (2002b) “”Program for Financial Revival -Revival of the Japanese Economy through Resolving Non-
Performing Loans”, October 30 2002 (http://www.fsa.go.jp/news/newse/e20021030.pdf)
Kinoshita, Nobuyuki (2011) “Kin’yu Gyosei no Genjitsu to Riron (Facts and Theories of Financial Administration Policies)”, Kinzai
Institute for Financial Affairs (in Japanese)
Nishimura, Yoshimasa (2011) “Kin’yuu Sisutemu Kaikaku Gojunen no Kiseki (50 Years of Financial System Reform)”, Kinzai Institute
for Financial Affairs (in Japanese)
Okina, Yuri (2009) “Activity of IRCJ and Banking Crisis in Japan”, Public Policy Review, Vol. 5, No. 2, Policy Research Institute,
Ministry of Finance, November 2009
Omura, Keiichi and Shinji Mizukami (2007) “Kin’yu Saisei: Kiki no Honshitsu (Financial Reconstruction: Essence of the Crisis)”, Nikkei
Book (in Japanese)
Takagi, Shinjiro (2003a) “Maximizing Value of Non-Performing Assets”, Paper for Forum for Asian Insolvency Reform, November
2003
Takagi, Shinjiro (2003b) “Industrial Revitalization Corporation of Japan”, Presentation on Forum for Asian Insolvency Reform,
November 2003
References