Embed Size (px)
Citation preview
Griffith Research Online
https://research-repository.griffith.edu.au
Recreational trails are an importantcause of fragmentation in endangeredurban forests: A case-study fromAustralia
AuthorRunkowski, Mark, Gudes, Ori, Pickering, Catherine
Published2014
Journal TitleLandscape and Urban Planning
VersionPost-print
DOI https://doi.org/10.1016/j.landurbplan.2014.07.004
Copyright StatementCopyright 2014, Elsevier. Licensed under the Creative Commons Attribution-NonCommercial-NoDerivatives 4.0 International, which permits unrestricted, non-commercial use, distribution andreproduction in any medium, providing that the work is properly cited.
Downloaded fromhttp://hdl.handle.net/10072/67230

1
Recreational trails are an important cause of fragmentation in endangered urban forests: a case-study from Australia 1#BALLANTYNE, MARK; 2GUDES, ORI and 1PICKERING, CATHERINE, MARINA 1 Environmental Futures Research Institute, Griffith School of Environment, Griffith University, Queensland 4222, Australia. 2 Department of Spatial Sciences, Western Australian School of Mines, Curtin University, Perth, Western Australia 6845, Australia.
Author emails: [email protected]; [email protected]; [email protected]; # Corresponding author: [email protected]; +61 (0)405783604

2
Introduction
Recreational use of natural areas is increasing worldwide (Balmford et al., 2009; Monz et al.,
2010; Newsome et al., 2013). In urban regions, remnant natural areas are important resources
providing opportunities for people to engage with nature (Florgård, and Forsberg, 2006;
Swanwick et al., 2003). Benefits of this include health, education and social connectedness
with outdoor recreation largely viewed as a positive opportunity in areas otherwise lacking
natural experiences (Lee and Maheswaran, 2011; Shafer et al., 2000; Takano et al., 2002).
Recreational activities and the infrastructure provided for them, however, can also have
negative environmental impacts where they are not effectively designed or managed. Despite
rapid urbanisation globally, ecological research into the impacts of recreational activities and
infrastructure in urban natural areas has lagged in comparison to similar research in protected
and wilderness areas (Gaston, 2010).
Trails are among the most common forms of infrastructure provided for, or created by,
visitors to many natural areas (Marion and Leung, 2001; Marion and Wimpey, 2007). In
urban areas, recreational trails planned by management are often bordered by greenways of
linear natural or semi-natural vegetation and thus have perceived benefits for community
connectivity, varied recreational opportunities, alternative transportation, pollution reduction
and environmental protection (Conine et al., 2004; Shafer et al., 2000). In this light,
judiciously-planned urban trails can provide important benefits for local people and the local
environment and extensive planning has been undertaken in such areas to maintain their
sustainability (Conine et al., 2004; Gobster and Westphal, 2004). However, trails can become
important environmental threats where their construction, maintenance and use are
inadequately designed and managed causing a range of direct and indirect impacts on flora,
fauna, soils and water (Cole, 2004; Liddle, 1997; Monz et al., 2013) as well as on the user
experience itself (Lynn and Brown, 2003).

3
The environmental impacts of recreational trails have been comprehensively studied
worldwide (Liddle, 1997; Monz et al., 2010). Some of the most well-documented impacts
include reduced height and cover of vegetation and changes in composition as a result of
trampling (Bernhardt-Römermann et al., 2011; Hill and Pickering, 2009; Pescott and Stewart,
2014; Zhang et al., 2012), changes in soil compaction and erosion (Farrell and Marion, 2002;
Nepal and Nepal, 2004; Olive and Marion, 2009; Wilshire et al., 1978), increasing nutrient
leaching (Godefroid and Koedam, 2004; Müllerová et al., 2011), changes to soil
microbiology (Malmivaara-Lämsä et al., 2008), introduction of weed species and pathogens
(Baret and Strasberg, 2005; Barros et al., 2013; Dickens et al., 2005; Hemp, 2008) and
wildlife disturbance (Marzano and Dandy, 2012; Taylor and Knight, 2003). Other impacts
however have received less attention in the literature, particularly large scale processes such
as the extent to which trails may cause landscape fragmentation (Leung et al., 2011a;
Pickering et al., 2012).
Fragmentation is a process by which once-contiguous areas of habitat are physically
separated by human disturbance creating a network of isolated patches (Lindenmayer and
Fischer, 2006). Tourism and recreation can contribute to this process through the clearance of
vegetation for infrastructure such as resorts and hotels (Fenu et al., 2011; Peñas et al., 2011),
as well as internal fragmentation of remaining vegetation by trail networks (Pickering et al.,
2012). Trail networks are essentially complex linear arteries of disturbance with varying
geometry that contribute to fragmentation by decreasing the total amount of undisturbed
habitat in a given area (Geneletti, 2004; Leung et al., 2011a; Pickering et al., 2012).
Moreover they can act as barriers to the movement of native organisms and conduits aiding
the dispersal of invasive or feral ones (Benninger-Truax et al., 1992; Drayton and Primack,
1996). Trails also cause change at varying distances into adjacent vegetation, so-called edge
effects, that alter abiotic factors such as light, wind and nutrient levels and hence, important
4
facets of biodiversity such as community structure, function and composition (Pickering et
al., 2012). In high use areas with extensive networks of trails, the combined area of trail tread
and edge effect may even exceed that of undisturbed habitat (Barros et al., 2013). In urban
areas where natural land is already limited by development, recreational trails may exacerbate
this problem if their condition and spatial spread is not actively controlled and managed
(Pickering et al., 2012). Although formal planned trails do often concentrate damage to
limited areas (Marion and Leung, 2001), it is the proliferation of unauthorised, informal trails
that is often more responsible for trail-based fragmentation (Leung et al., 2011a; Wimpey and
Marion, 2011).
This research assesses how recreational trails can contribute to the fragmentation of an
endangered remnant forest type in urban areas. Specifically, we assessed trail networks using
geographic information systems (GIS) in 17 remnants of an endangered urban forest across
937 km2 of some of the most highly developed lowland regions of Australia. The aims of the
study were to: 1) assess the lineal extent and diversity of recreational trails in these remnants,
2) quantify the degree of trail-based fragmentation across remnants, 3) determine possible
human and environmental factors influencing fragmentation in these remnants, and 4) explore
possible relationships between these factors.
Methods
As a result of land clearing for agriculture and urbanisation along the east coast of Australia,
many ecosystems are at high risk of extinction, and now consist of small isolated remnants of
once much larger, contiguous ecosystems (Lindenmayer and Fischer, 2006). In the southeast
of the state of Queensland, expansion and urban infilling around the two largest cities,
Brisbane and the Gold Coast, have resulted in extensive clearing of coastal lowland habitats
(Bradshaw, 2012; McAlpine et al., 2007; Wilson et al., 2002). Over 100 (64%) of the 156

5
regional ecosystems in southeast Queensland are threatened (Queensland Government, 2013).
Many of these urban remnants are now popular destinations for recreational use (Queensland
Government, 2007; Rossi et al., 2012) including the endangered Tall Open Blackbutt Forest
ecosystem (Pickering et al., 2012).
This open dry forest is dominated by the tall hardwood Eucalyptus pilularis with a sparse
shrubby mid-storey and under-storey of graminoids and forbs (Queensland Government,
2013). It is state-listed as ‘Endangered’ once covering over 10,000 ha prior to urbanization,
but by 2006 only around 20% (2,024 ha) remained (State of Queensland, 2013). It is now
restricted to a series of around 226 small (circ. 8 ha) scattered remnants within urban areas.
Only 14 of these remnants are greater than 20 ha, some of which are protected under national
park or conservation area status while the rest are very small with many having been sold to
developers.
The forest provides habitat for a number of threatened fauna including the International
Union for the Conservation of Nature (IUCN) Red-listed Green-thighed Frog (Litoria
brevipalmata) and the Queensland state-listed Wallum Froglet (Crinia tinnula) and Glossy
Black Cockatoo (Calyptorhynchus lathami). It also forms a popular destination for
recreational use at least in part because most remnants are close to urban populations. The
forest has a mixed terrain and generally open structure facilitating trail creation and many of
the smaller remnants are unprotected.
Study Region
The study took place within a 937 km2 region between the Brisbane River and the New South
Wales border in southeast Queensland where the majority of extant Tall Open Blackbutt
Forest ecosystem remains (Figure 1). Soils in this region are characterised by coastal
Palaeozoic sediments that have been strongly metamorphosed and interbedded with igneous
6
strata (Queensland Government, 2013). The climate is sub-tropical with a mean annual
temperature of 21.3oC and mean annual rainfall of just over 1,000 mm (Australian Bureau of
Meteorology, 2013). Local topography is largely low-lying, under 100 m a.s.l., interspersed
with sedimentary foothills that rise to igneous hinterland ranges in the west of about 1,000 m
a.s.l. Within this region there are around 226 isolated remnants of Tall Open Blackbutt Forest
covering 2,024 ha.
Sampling the lineal extent and diversity of recreational trails
First we identified all suitable remnants for sampling: e.g. all those that were > 5 ha and
accessible to the public. Of the 226 remnants within the 937 km2 region, only 31 fit these
criteria based on data from the ‘Vegetation Management Act (VMA) 2006 Remnant Regional
Ecosystems of Queensland’ and spatial data from the ‘Land-use’ and ‘Land used for public
recreation 2011’ GIS layers (Queensland Government, 2013). When these 31 remnants were
assessed during site visits in 2013, it was found that only 17 of them still fit the criteria with
13 having been transferred to private land and one clear-felled.
Between January and May 2013 the perimeters (and therefore areas) of the 17 Blackbutt
forest remnants totalling 829 ha and all recreational trails within them were mapped.
Remnants were geographically clustered in two districts: one to the north of the 937km2 study
region in the rural Redlands, and the other in the south around the highly urbanised city of the
Gold Coast. Trail mapping was done using a Trimble Juno ST handheld GPS unit compatible
with ArcPad Version 7.0, with a sampling interval of 1 m and a measurement accuracy of 1-
10m. A trail was considered to be for recreational use where there were: 1) obvious signs
indicating a visitor attraction (e.g. national park), 2) formal mapping by management or
publication of trails on websites or blogs, 3) visible signs of recreational use (e.g. bike jumps,
tyre marks), and/or 4) information on use provided by management staff. Trails were not
7
mapped where: 1) they provided access to residences or other infrastructure, 2) they were
formal highways cutting through forest remnants, 3) they were obviously animal-made,
and/or 4) they appeared to be used primarily for access to forest land for dumping waste.
Recreational trails were mapped and divided into categories based on a visual survey method
similar to those commonly used for condition class assessments of trails (Farrell and Marion,
2001; Walden-Schreiner and Leung, 2013). Categories were based on average width,
formality and substrate; three important factors that can affect impacts (Cole, 2004; Marion
and Leung, 2004). Widths of trail tread, defined as the most heavily trafficked area of the trail
(Wimpey and Marion, 2010), were assessed to the nearest centimetre at the start of each new
segment and categorised (1-5m wide) with 1m width allowing passage of 1 person (Pickering
et al., 2012). Substrates were recorded as native (tempered bare soil or churned earth), mown
grass, hardened with a loose edge (e.g. gravel and hard-core) or hardened with a hard edge
(e.g. tarmac and concrete). Trails were also recorded as either formal or informal. Formal
trails were those with visible maintenance, signage and/or accessed infrastructure and/or
mapped by land-owners for public use. Informal trails were those that appeared to be both
created and maintained by trail-users for recreation outside of the formally-managed trail
system (Leung et al., 2002). The main type of recreational use per trail was also recorded
based on visual observations and consultation with park managers. For multi-use trails, we
recorded the main type of recreational use as the most popular activity based on ground
observations and discussions with managers. Multi-use trails were rather common but a
dominant use type was also apparent in most.
The overall loss of forest strata (litter, understorey, midstorey and trees) along trails was
assessed using a stratified random sampling approach at 60 randomised points distributed
amongst trail types in each surveyed remnant (n = 17) across the entire mapped trail network.
All trail types based on width, formality and substrate were more broadly categorised into
8
average widths for this analysis. As width of trail gap correlates directly with the loss of
forest we broadly categorised trails [small (0-1 m), medium (1-3 m) and large (>4 m) trails]
and applied 20 random points stratified within each using ET GeoWizards 10.2 in ArcMap
Version 10.1. (Pickering et al., 2012).
To ensure that all trails were mapped, the field data was compared with aerial images from
Google Earth, the ‘land used for publication recreation 2011’ GIS layers, online recreational
blogs such as MTB Dirt (http://www.mtbdirt.com.au) and private land-cover maps. Forest
perimeters in national park or conservation areas were not re-mapped unless they were
known to have changed since the original 2006 remnant vegetation boundaries or if visual
observations in the field indicated change.
Remnant forest perimeters and trail attributes were post-processed in ArcMap following
guidelines from Leung and Louie (2008) and Moskal and Halabisky (2010) and to improve
on any mapping errors from the GPS. The current and 2006 boundaries of the remnants were
overlaid in contrasting colours. Noise from satellite readings was cut and split to avoid
overlaps and miscalculations in distance measures. All trail sections belonging to a single
category were then merged for calculating total length. The ‘cleaned’ remnant forests and
trail layers were transformed from the default spheroid-based geographic coordinate system
‘GCS_WGS_1984’ used by the GPS to the ‘GCS_Australian Geodetic Datum_1984’ as the
new geographic coordinate system and then to ‘GDA_1994_MGA_Zone_56 Transverse
Mercator’ as the new local projected coordinate system. This allowed accurate measurement
of the current area of each remnant, total trail length and total length of each trail type across
the 17 remnants.
Quantifying trail-based fragmentation
9
Using ArcMap to assess the extent of internal fragmentation by trails within the 17 forest
remnants, all trails were first buffered using their average width; data collected during trail
mapping (Moskal and Halabisky, 2010). All trail buffers were merged across each trail
category and erased from the remnant layer to accurately show the non-trailed remnant area
only. Finally, the ‘Explode Multipart Feature’ tool was used to divide the remnant area into
multiple ‘patches’ (Leung and Louie, 2008). Patches were thus distinct polgyons separated
from other patches either entirely by trails and their area of edge effect, or by a
conglomeration of trails and a remnant’s actual edge/edges. The variation in the number and
size of these patches per remnant was then used to determine the degree of trail-based
fragmentation.
For each forest remnant, two specific measures of trail-based fragmentation were calculated;
the Weighted Mean Patch Index (WMPI) and the Largest 5 Patches Index (L5PI) (Leung et
al., 2011a). The former improves on work by McGarigal and Marks (1995) by accepting that
trails have a dimension of their own and so their linear proliferation reduces the proportion of
undisturbed habitat. Weighted Mean Patch Index adds a weighting related to the proliferation
of trailed areas in a remnant so that it is not just based on remnant-size (Leung et al., 2011a)
such that,
WMPI = wf * (∑ aij/n) * (1/10,000) (1)
where, wf (weighting factor) = (∑ aij/A); aij = area (m2) of patches ij; n = total number of
patches; A = remnant area (m2). Results are in hectares, with smaller values indicating higher
fragmentation (range 0 - ∞).
The L5PI differs to WMPI in that it sums the area of the largest five patches to evaluate the
proportion of the fragmented remnant occupied by relatively large, more undisturbed patches,
and not just assuming fragmentation occurs similarly across all remnants. This method
10
improves that of McGarigal and Marks (1995) by averaging the size of the largest five
patches rather than using the largest single patch and risking over-sensitivity to changes in its
area. The formula is,
L5PI = ∑ max5 / A *100% [2]
where, max5 = largest 5 patches within remnant x, A = area (m2) of remnant area. Results are
in percentages with smaller values showing higher degrees of fragmentation. Both indices
have been used in previous studies of fragmentation by recreational trails (Leung et al.,
2011b; Moskal and Halabisky, 2010). We also used a third, more general measure, median
patch size to compare its efficiency against WMPI and L5PI in analysing fragmentation.
To compare whether values for WMPI, L5PI and median patch size differed significantly
between northern (Redlands) and southern (Gold Coast) districts (possibly relating to
different levels of urbanisation) we used a simple One-way Analysis of Variance (ANOVA)
in SPSS Version 21. Values for all three measures were log-transformed to satisfy normality
and the assumptions of the ANOVA model.
The total loss of forest along trails across the 17 remnants was calculated using ArcMap. The
total area without litter, understorey, midstorey and tree vegetation was calculated by
buffering the previously-ascribed small, medium and large trail categories by the mean
distance to each of these four forest strata (calculated using the 60 randomised points),
dissolving any overlapping buffers (Pickering et al., 2012). This buffer was then erased from
each of the respective forest polygons and overall loss of each strata calculated for the total
17 remnants. This essentially showed an average loss of forest due to trail edge effects which
when combined with the loss of forest to the trail itself, provides a figure for total combined
loss.
11
Possible causes of fragmentation
To assess factors that could be contributing to the creation of trail networks and hence
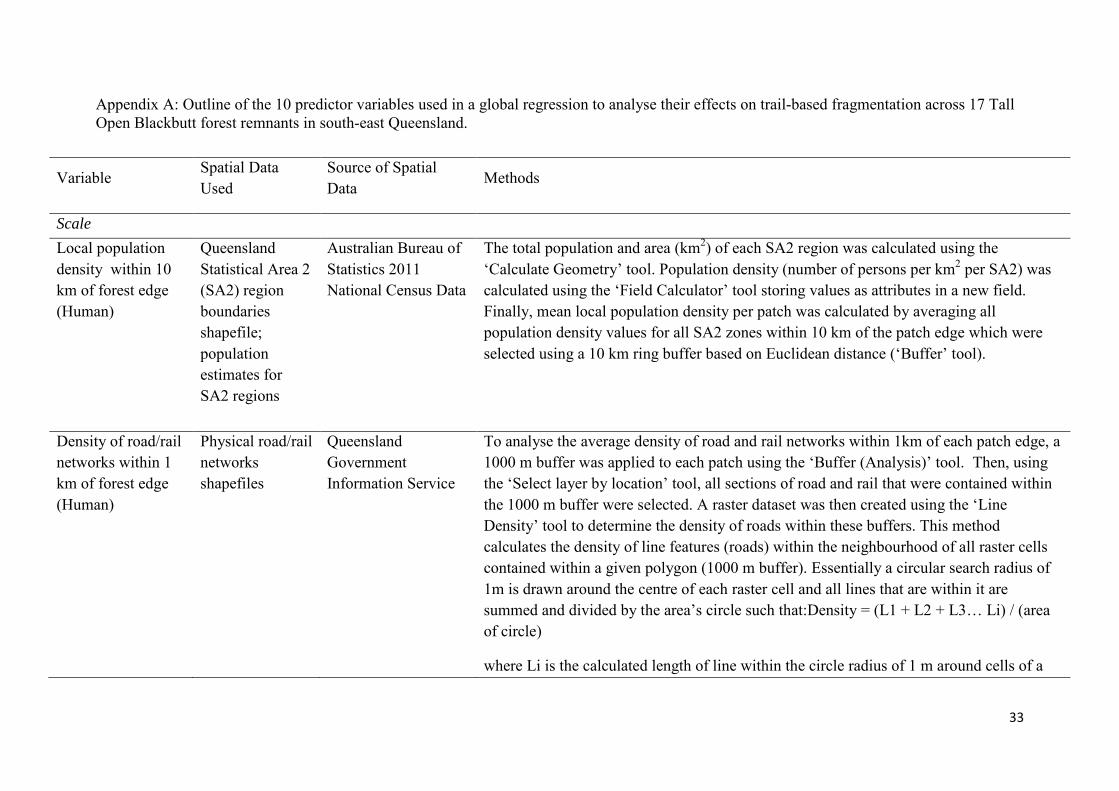
fragmentation, we identified 10 possible predictors (Appendix A). These were selected based
on a systematic review of academic literature on trail impacts, field assessments and
discussions with park management staff. The literature review used 153 references retrieved
from Google Scholar using the search terms ‘'Touris*', 'Fragment*', 'Trampl*', 'Bik*',
'Walk*', 'Disturb*', 'Hik*', 'Infrastructure', 'Climb*', 'Edge Effect*', 'Trail*', 'Network' in
multiple combinations. The 10 chosen predictors included 7 scale variables: 1) local
population density within 10 km of forest edge, 2) density of road/rail networks within 1 km
of forest edge, 3) density of water bodies within forests, 4) total number of entry points, 5)
percentage of trail network composed of native substrate, 6) percentage of forest on flat
ground (< 5% rise), and 7) average altitude. Added to this were 3 categorical variables: 1)
compatibility of surrounding land-use matrix, 2) status of forest, and 3) main trail-use
(Appendix A).
All scale variables were entered into a Multivariate Ordinary Least Squares (OLS) global
regression analysis using ArcMap 10.1 and assessed against the two indices of fragmentation
(WMPI and L5PI) as dependent variables in separate models. Such spatial regressions help
elucidate influential factors on spatial ecological patterns and highlight cases of
autocorrelation amongst variables (Lichstein et al., 2002). To satisfy the assumptions of this
type of analysis, variance inflation factors were maintained below 7 to avoid multicollinearity
and variable redundancy (where multiple variables are correlated). The Koenker’s
studentized Breusch-Pagan p-value (to check for variance in relationships across global study
area) and Jarque-Bera p-value (to check for model bias and non-normally distributed
residuals) both had to be non-significant (p >0.05). To check for spatial autocorrelation
amongst WMPI and L5PI values across the 17 patches, a Global Moran’s I test using the

12
residuals of each separate model was performed. For categorical variables, a main effects
multivariate ANOVA was used to detect significant effects on the same two indices of
fragmentation using SPSS Version 21. Values for both indices were log-transformed to
satisfy normality and thus the assumptions of the ANOVA model.
Correlations amongst factors
We tested whether there was correlation between fixed factors including the size of forest
remnants, total length of trails per remnant and any significant independent factors from the
OLS, as well as dependent variables including the area lost to trails and the fragmentation
indices. This was to determine whether there were underlying patterns between variables that
could not be explained by the OLS model, especially those relating to the spatial attributes of
each remnant. To do so, we eliminated one outlying remnant (at least 3 times greater in size
than other remnants) and then performed a Pearson correlation on log-transformed data for all
factors to determine correlations. We used a curve estimation function to determine the nature
of the relationship between correlated factors using SPSS Version 21.
Results
What is the extent and diversity of trails in this endangered forest?
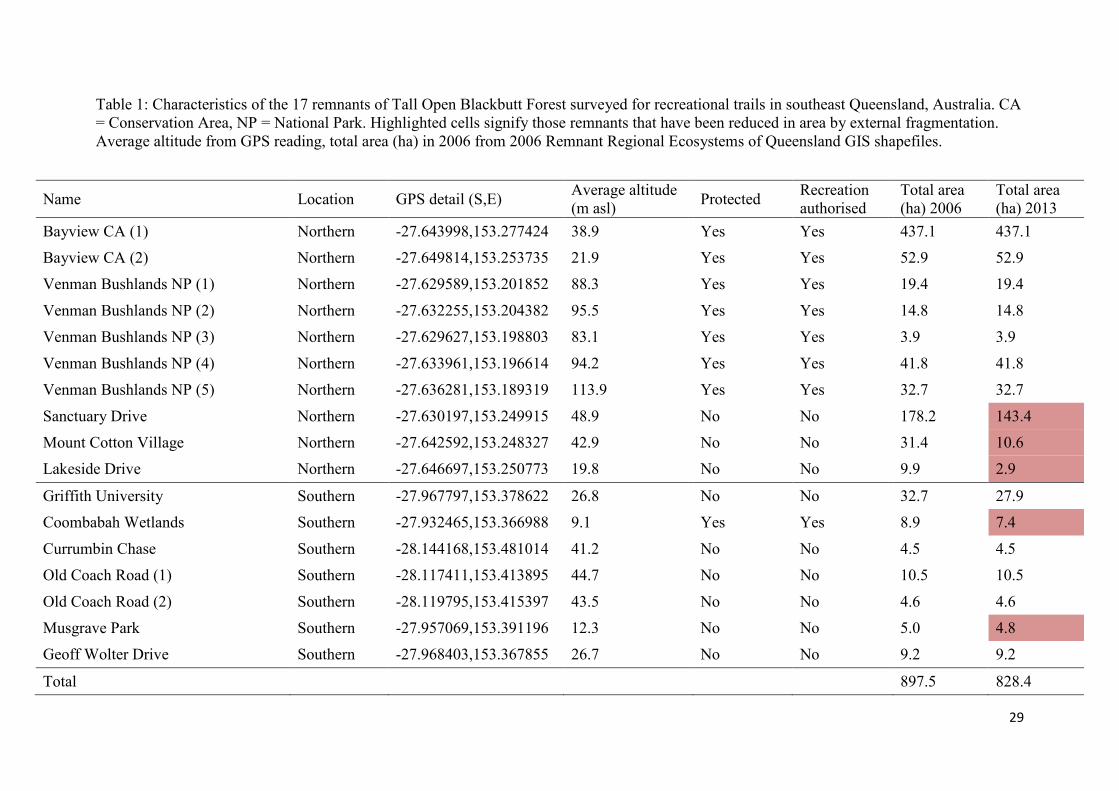
The current status of 17 remnants of Tall Open Blackbutt Forest, consisting of a total of 829
ha and ranging in size from 3 to 437 ha, was assessed. The area of forest within seven
remnants had declined since original mapping was done in 2006, some by as much as 77%
largely due to land clearance by developers (Table 1). This process has led to an overall
reduction of 69.3 ha (7.7%) over seven years from a total of 898 ha in 2006.
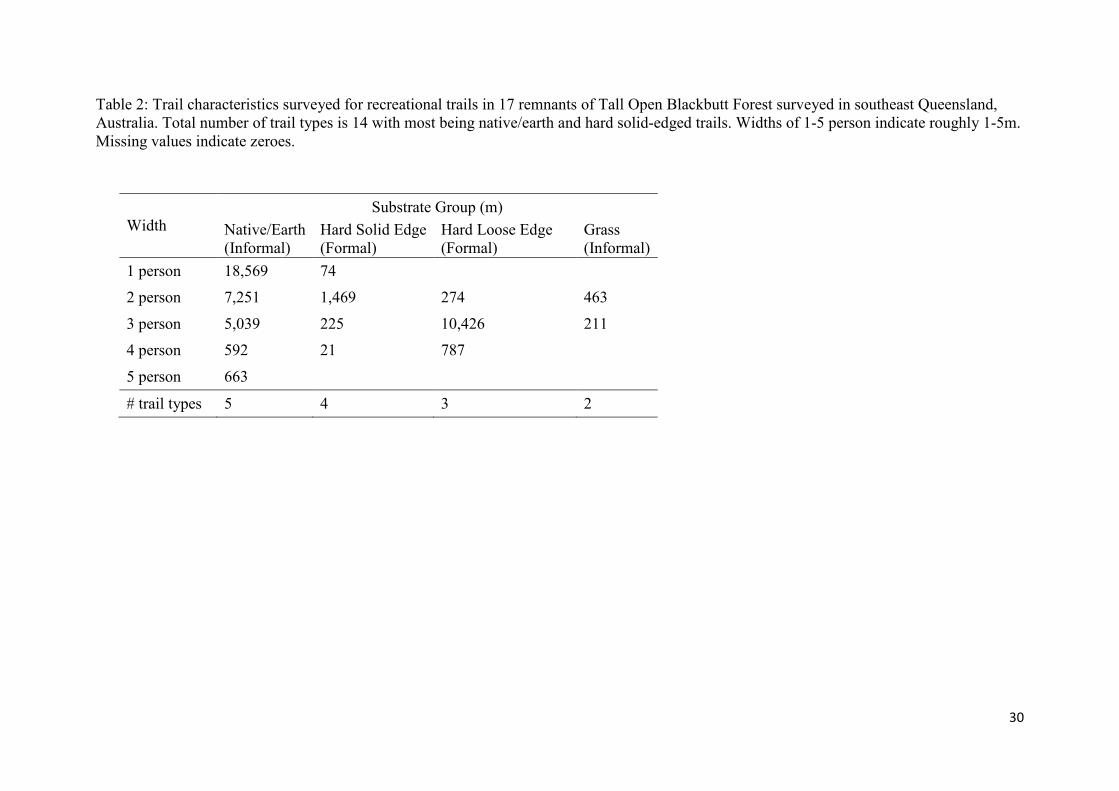
There was a total of 46.1 km of recreational trails within the remaining 829 ha of forest
consisting of 14 different trail types (Table 2). Over 57% (26.5 km) were informal trails

13
where the trail surface consisted of either tempered/churned earth or trampled/mown grass
(Figure 2). All the formal trails (43%; 19.6 km) were hardened and included hard solid-edged
(concrete and tarmac) and hard loose-edged trails (gravel) (Figure 2).
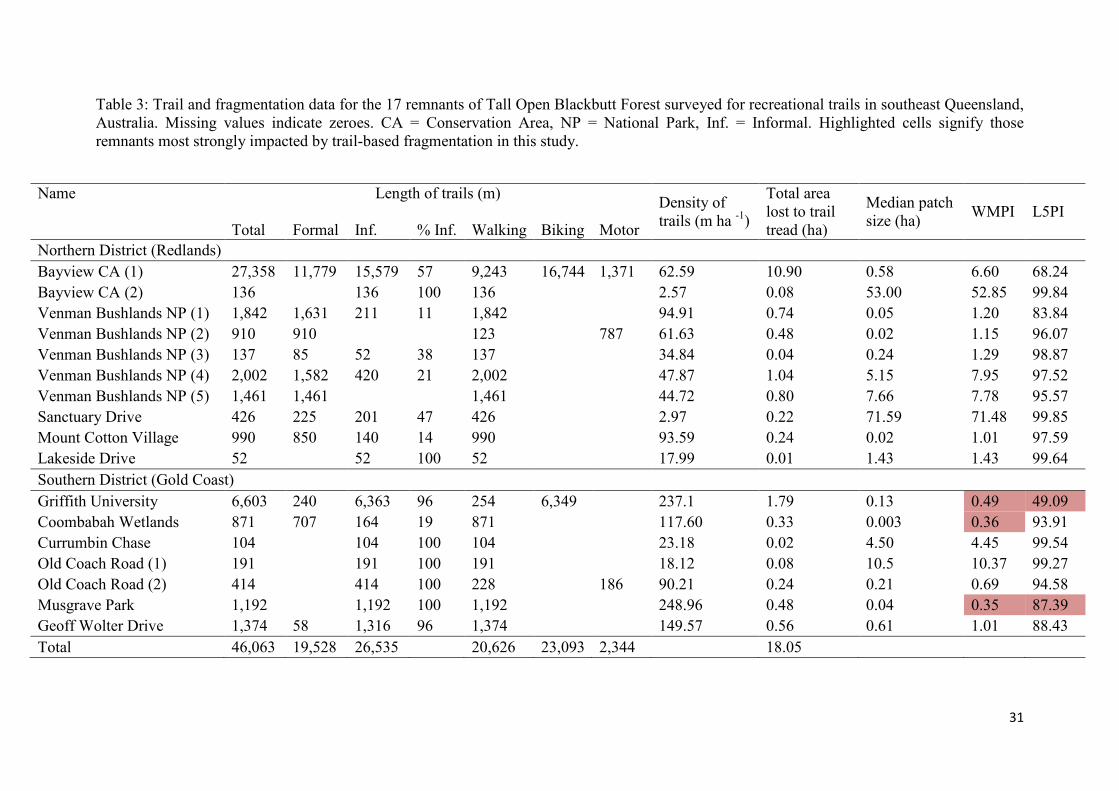
The trails were used for a range of activities, with biking (23.1 km; 50%) and hiking (20.6
km; 45%) trails the most common, while there were fewer dirt-biking (1.4 km; 3%), visitor
parking and entry (468 m; 1%) and 4x4 trails (186 m; 0.4%) (Table 3). The trails used for
motorised sports such as 4x4-driving and dirt-bikes tended to be wider than others averaging
3.9 m in width (range 2.6-7.1 m). The trails used for biking and hiking were considerably
narrower averaging 2.3 m in width (range 0.8-3.4 m).
How much have trails contributed to the loss of forest?
By combining average widths and lengths of each trail type, we found a total of 18 ha (2.2%)
of the 829 ha of forest had been cleared for recreational trails (Table 3). Based on the data
from 60 points measuring the distance from the edge of the trails to different structural
components of the forest, the network also caused the additional loss of 0.8 ha of the litter
strata, 5.7 ha of understorey, 17.8 ha of mid-storey and 29.2 ha of the tree strata, with wider
trails causing the greatest loss. Combining the direct loss of vegetation from the trail tread
itself with the loss of adjacent vegetative strata, a total of 47.2 ha (5.7%) of forest has been
directly affected by trail-based fragmentation.
Based on their contribution to the loss of forest from their tread and edge effect, particular
types of trails such as 4x4 trails and dirt-bike trails caused more severe localised damage
(Figure 2b) but as these trails were relatively uncommon their impact on forest loss was small
overall (0.3 ha lost overall). At the local scale however, these trails caused more severe
damage, affecting > 5% of smaller remnants. Generally, hiking and biking trails caused most
14
forest loss because they accounted for over 95% of the total lineal extent of all trails with
some remnants losing as much as 16% of forest due to this use (Figure 3).
How much have trails contributed to forest fragmentation?
When quantifying fragmentation using the WMPI and L5PI indices, we found that the most
fragmented remnants were in the highly urbanised southern district (Gold Coast). Around
97% of the trails in these seven remnants were informal biking and hiking trails whereas for
the northern district in the more rural Redlands area, only 39% of trails were informal and
they were mostly for biking (Table 3). There were differences in the average fragmentation
measures between the north and south, but none significant. The average WMPI in the south
was 2.53 compared to 15.27 for the north (F = 3.711, p = 0.073), while for L5PI it was 87.46
in the south compared to 93.9 in the north (F = 0.945, p = 0.346). The remnants in the
southern district also had a much lower median patch size of 2.28 ha, while for the northern
remnants it was 13.97 ha (F = 1.369, p = 0.260) (Table 3). Remnants themselves were on
average much smaller in the south (9.8 ± 8.2 ha) than the north (75.9 ± 133.5 ha). As part of
their small size, southern remnants had high average trail densities at 126.4 ± 92.7 m ha-1
compared to 46.4 ± 33.1 m ha-1 in the north. This disparity is also partly due to higher
proportions of trails per unit area across all remnants in the south, whereas in the north the
range of total trail lengths was much greater (27.3 km vs. 6.5 km for the southern district)
with only a few large remnants containing most of the trails.
The two indices WMPI and L5PI provide different information about fragmentation in the
remnants. The two most fragmented remnants were in the south according to the WMPI
index (Musgrave Park, 0.35 and Coombabah Wetlands, 0.36). However, according to the
L5PI index, the largest five sub-patches of each of these remnants comprised over 87% and
93% of total forest areas, respectively. A third remnant (Griffith University) in the south,
15
however, had both a low WMPI (0.49) and L5PI (49%) meaning that this remnant was the
most fragmented based on both indices likely a result of the rather uniform degree of
fragmentation across the whole remnant and that all patches created were similarly small.
What are the factors influencing fragmentation in remnants?
When we assessed factors that may contribute to trail-based fragmentation using Ordinary
Least Square regressions, the only significant passing model and predictor of fragmentation
was the number of entry points per remnant and this was only significant using L5PI. Using
this index, we found that fragmentation increased with the number of entry points and
subsequently lowered the L5PI value (Adjusted R2 = 0.67, p = <0.001, JB = 0.49, AIC =
161.68, Koenker = 0.74; Moran’s I z-value = -0.97, p = 0.33). A multivariate ANOVA on
categorical variables found that none of these factors significantly affected the level of
fragmentation either across remnants for both WMPI and L5PI indices (p > 0.05).
Are there correlations amongst factors?
Some of the factors we assessed were correlated with each other. For example, the size of
remnants, as expected, was correlated with WMPI (p = 0.003), but not the length of trails (p =
0.143), the total area lost to trails (p = 0.056) or the number of entry points (p = 0.646).
For the trails themselves, the total length was positively correlated with the number of entry
points (linear relationship, R2 = 0.51, p = 0.001). For the two fragmentation indices, the total
length of trails, the number of entry points and the area lost to trails were all negatively
correlated with L5PI (cubic relationships, R2 = 0.86, p = <0.001; R2 = 0.79, p = <0.001; R2 =
0.50, p = 0.025). The area of the remnant and median patch size were positively correlated
with WMPI (cubic relationships, R2 = 0.77, p = <0.001; R2 = 0.63, p = 0.004). We also found
16
that the WMPI and L5PI indices were not correlated with each other and hence appear to
explain different aspects of fragmentation well (p = 0.316).
Discussions
What is the extent and diversity of trails in this endangered forest?
We found that the majority of trails across the 17 remnants of endangered Tall Open
Blackbutt Forest were informal, especially in the highly urbanised south of the study region.
Informal trails are particularly problematic as they tend to be poorly planned and managed
and hence can traverse sensitive habitats including areas occupied by rare species and
ecosystems with limited tolerance to disturbance (Marion and Leung, 2011; Newsome and
Davies, 2009). They can also facilitate the use of these areas for a range of illegal activities
such as poaching and dumping (Baret and Strasberg, 2005; Matlack, 1993). The lack of trail-
design and regulation often leads to proliferation of trails deep into forest interiors. This
means entire forests can be exposed to an accumulation of complex geometrical networks of
trail edge effects (Pickering et al., 2012). Depending on the nature of the trail and level of
disturbance from the activities themselves, edge effects of forest clearing such as increased
wind-blow, UV and weed dispersal may occur up to 50 m into adjacent vegetation (Harper
and MacDonald, 2002; Harper et al., 2005) thus causing secondary biotic effects on
structural, compositional and functional components (Harper et al., 2005; Leung et al.,
2011b; Moxham and Turner, 2011; Stenhouse, 2004). For remnant forests, this can have
particularly severe effects as many remnants are small (< 150 m wide), and therefore, the
quality of the total area may be compromised as trails continue to dissect what is already
essentially a habitat ‘island’ (Matlack, 1993; Drayton and Primack, 1996).
As found in other studies (Pickering et al., 2010a; Rossi et al., 2012; Wing and Shelby, 1999),
mountain biking and hiking were the most common activities on trails accounting for over
17
95% of the total length of trails in the 17 remnants. On the trail itself, these activities can
cause contrasting levels of environmental damage. Some studies have found that plant height,
cover and soil erosion are less impacted under hiking and biking compared to other activities
such as horse-riding (Pickering et al., 2010b), however others have found they can be as
equally severe (Wilson and Seney, 1994). Across the 17 remnants, the hiking and biking
trails tended to be on relatively flat ground and rather narrow, so their edge effects per unit
area were small. However, because they are widespread and penetrate most of the remnants,
they caused the greatest cumulative forest loss overall. This diluted effect across the whole
landscape may be more damaging than the severe, but localised degradation caused by wide
trails created and used for motorised activities. As such, the per unit area edge effect of trails
may be surprisingly different to their overall contribution to forest loss. This area requires
further research.
Despite accounting for < 5% of the total length of trails, the trails created by heavy,
motorised recreation such as 4x4-driving and dirt-biking were much wider. This is likely to
be a direct result of the fast, heavy mass-load of these activities and often repetitious
accelerating and braking behaviour of users (Buckley, 2004; Liddle, 1997). As found in this
study, the trails themselves tend to be formed as runs up and down steep hills (Wilshire et al.,
1978). Such poorly designed, unsurfaced trails can result in large-scale soil erosion
sometimes exceeding 1 metric tonne m-2 (Wilshire et al., 1978). This soil loss is generally
seen as permanent with recovery/restoration difficult to implement (Olive and Marion, 2009).
Eroded substrate can also pollute water-courses (Hammitt and Cole, 1998) and compromise
visitor safety and experience (Marion and Leung, 2001). The repeated use of motorised
activities also disturbs local wildlife (Buckley, 2004) and the wide geometry of these trails
means that they can form similar barriers to the movement of animals across the trail as that
caused by highways and roads (Goosem, 2007) particularly for macro-invertebrates,

18
amphibians and small mammals (Baur and Baur, 1990; Gaines et al., 2003; Wilshire et al.,
1978).
More work is needed to address the biological effects of different trail types based on
activity. Such a quantification of associated impacts will allow managers to make decisions
on whether an extensive but narrower network of trails (hiking and biking) is of greater
ecological concern than small but more highly degraded areas such as those created for dirt-
bike and 4x4 trails.
What are the degrees and causes of forest loss and fragmentation across the remnants?
We found that 5.7% of the forests had been directly lost or damaged by trails. This means
that the level of forest loss caused by trails approaches that caused by external fragmentation
for urban development.
To date, the majority of fragmentation research worldwide has concentrated on external,
progressive clearance of vegetation as a result of development, agriculture and resource
extraction (Bayne and Hobson, 1998; Gehring and Swihart, 2003; Harper and MacDonald,
2002; Moxham and Turner, 2011). In this study, however, we found recreational trails
forming complex internal networks within forest remnants can cumulatively affect nearly as
much area (5.7%) as these better-recognised sources of fragmentation (7.7%) although the
time-frame and intensity at which these two processes operate is different. Despite these
caveats, it is important to emphasise that although the process itself may not be rapid blanket
clearing and thus biological effects may not be as severe, the arterial spread of multiple
cleared areas for trails may still have a strong capacity to cause forest loss and ultimately
result in long-term degradation of remnants across large areas. Many ecosystem responses
may have a lagged temporal effect such as alterations to above-below ground nutrient cycling
(Kissling et al., 2009) and plant dispersal (Broadhurst and Young, 2007) and may change as a
19
function of visitor use patterns. Trail-based fragmentation therefore may play an important
role in the persistence of these forests as functional ecosystems (Pickering et al., 2012).
Because forest remnants in the southern district of the study area had the most informal trails,
the highest density of trails per unit area and the smallest size of remnants, these forests were
the most fragmented, although not significantly different to the north (only marginally non-
significant for WMPI). When we compare indices of fragmentation found here with those for
heavily-visited national parks in the USA, we find the severity of fragmentation is of the
same order of magnitude (Leung et al., 2011b; Manning et al., 2005; Moskal and Halabisky,
2010). For example, the degree of fragmentation of alpine meadows in Yosemite National
Park, California was greater than in our study for only 15% of meadows; despite an annual
park visitation to Yosemite of over 3.7 million people (Leung et al., 2011b). It is likely that
these most fragmented remnants experience the greatest impacts in terms of biological
structure, composition and function.
GIS-based spatial regression models did not detect many predictors of trail-based
fragmentation which may be due to the reduced statistical power in this study (resulting from
only 17 replicate remnants). The only significant predictor was the number of entry points
which resulted in increasing fragmentation using the L5PI index. The number of entry points
was also positively correlated with the total length of trails. It is likely that entry points were
significant using L5PI due to its more accurate reflection of change to the largest patches
created by trails, instead of relying on the mean as in WMPI. Access points are both a cause
and product of trail-based fragmentation with studies showing that increased trail densities
are positively correlated with increasing numbers of access points (Priskin, 2003). Increased
visitor access also directly correlates with increased damage to vegetation (Farris et al.,
2013). Visitor access is therefore an important factor to monitor, especially in areas with high
visitor loads and easily-accessible terrain such as open urban forests.
20
On the other hand, we found no correlation between the size of forest remnants and the length
of trails, although there were relationships present with the actual degree of fragmentation
such that more trails and entry points caused a decline in the size of the largest five patches
while a larger initial remnant size buffered trail fragmentation with less severe effect on the
mean size of patches. This indicates that, although the resulting fragmentation is related
strongly to the size of these remnants and the amount and density of trails, the actual process
driving the creation of trails themselves between remnants may be rather idiosyncratic. In
other words, larger remnants are no more likely to be initially disturbed by trails than smaller
ones and that there are likely strong and variable socio-demographic influences on trail-based
fragmentation even within a single landscape.
We also corroborated previous work (Leung et al., 2011a) that the two fragmentation indices,
WMPI and L5PI, explain different aspects of the fragmentation and are useful metrics for
related research when compared to other indices such as median patch size. These indices
have the benefit that they are not over-sensitive to changes in the number of trails and patches
if the actual extent of the effect is similar (Leung et al., 2011a). These indices could therefore
be integrated into a ranking instrument to confidently monitor fragmentation over time
(Leung et al., 2011a).
The remnants in the southern area of the study were in proximity to over twice the population
found around the more rural northern remnants and nearly 3-times the density of roads and
other hard infrastructure (State of Queensland, 2013). Despite not finding any effects of these
urbanisation factors on trail-based fragmentation in this study or differences in fragmentation
between more and less urbanised districts, we postulate that they may still be strong causal
factors because they largely govern the amount of, and availability of access, for visitors
(Stenhouse, 2004). Urbanisation is an important factor contributing to the creation of trails,
especially informal ones which have a greater capacity to fragment (Ballantyne and
21
Pickering, 2012; Matlack, 1993; Newsome and Davies, 2009; Pickering et al., 2010a).
Additional research with a greater number of replicates (remnants) across an urbanisation
gradient may have greater statistical power, and hence, would provide clearer understanding
of the range of factors that may influence trail-based fragmentation in an urban context.
Recommendations
Due to the high conservation value of many urban remnant forests (Godefroid and Koedam,
2003; Tratalos et al., 2007) and their importance in maintaining local ecosystem services
(Niemalä et al., 2010; Tratalos et al., 2007), we emphasise the need for more sustainable
planning and recreational use of these areas. Poorly-designed and regulated, dense informal
networks of trails with numerous access points are primarily responsible for the trail-based
fragmentation we found. We propose that managing poorly-designed trail networks to reduce
forest loss and fragmentation should be the focus of a collaborative effort between
conservation and recreation stakeholders. The first step should be to remove, or at least
prevent the growth of, the most intrusive trail types such as used by informal motorised
recreation, and to encourage the relocation of these activities to less sensitive, formalised
areas (Newsome and Davies, 2009; Pickering et al., 2010a). Secondly, for areas traversed
primarily by dense networks of hiking and biking trails, prevention of further segments
developing should be prioritised using educational means such as stakeholder talks, signage,
trail bordering and hardening (International Mountain Biking Association, 2009; Marion and
Wimpey, 2007). In areas with the highest degrees of fragmentation and numerous entry
points, decisions should be made on how to centralise visitor flow and which entries and
trails to close. This will require additional stake-holder decision making and ranking of the
most popular trail routes as well as the most sensitive ones. Negotiations on how to best
stratify the network to maintain visitor satisfaction whilst limiting fragmentation could be
carried out using survey data and experimental trials.

22
Our study emphasises that recreational trails can cause extensive internal fragmentation of
endangered urban forest remnants. To our knowledge, this is the first study to apply a GIS-
based approach to investigating the extent and possible causes of this process across multiple
remnants at a landscape scale. We hope it will stimulate further investigation into how trail-
based fragmentation may affect the structure, composition and function of ecosystems,
especially those that are already threatened.
Acknowledgements
We would like to thank Griffith University for funding this research and acknowledge the
Redland City Council and Queensland Government Department of National Parks,
Recreation, Sport and Racing for permitting this research on areas of council and state land.
Thanks also to Dr. Clare Morrison for her comments on drafts of this manuscript and to Jon
Shuker for his assistance with GIS.
References
1. Australian Bureau of Meteorology. (2013). Climate statistics for Australian locations – monthly climate statistics Brisbane. Retrieved 24 September, 2013 from - http://www.bom.gov.au/climate/averages/tables/cw_040913.shtml.
2. Ballantyne, M., and Pickering, C.M. (2012). Impacts of trail networks on rare and threatened plant communities in Australia (extended abstract). Sixth international conference on monitoring and management of visitors in recreational and protected areas, August 21-24, 2012, Stockholm, Sweden. pp. 364-365.
3. Balmford, A., Beresford, J., Green, J., Naidoo, R., Walpole, M., and Manica, A. (2009). A global perspective of trends in nature-based tourism. PLoS Biology, 7(6), 1-6.
4. Baret, S., and Strasberg, D. (2005). The effects of opening trails on exotic plant invasion in protected areas on La Réunion island (Mascarene Archipelago, Indian Ocean). Revue d'Écologie, 60, 325-332.
5. Barros, A., Gonnet, J., and Pickering, C.M. (2013). Impacts of informal trails on vegetation and soils in the highest protected area in the Southern Hemisphere. Journal of Environmental Management, 127, 50-60.
6. Baur, A., and Baur, B. (1990). Are roads barriers to dispersal in the land snail Arianta arbustorum? Canadian Journal of Zoology, 68(3), 613-617.
23
7. Bayne, E.M., and Hobson, K.A. (1998). The effects of habitat fragmentation by forestry and agriculture on the abundance of small mammals in the southern boreal mixedwood forest. Canadian Journal of Zoology, 76(1), 62-69.
8. Benninger-Truax, M., Vankat, J.L., and Schaefer, R.L. (1992). Trail corridors as habitat and conduits for movement of plant species in Rocky Mountain National Park, Colorado, USA. Landscape Ecology, 6(4), 269-278.
9. Bernhardt-Römermann, M., Gray, A., Vanbergen, A.J., Bergés, L., Bohner, A., Brooker, R.W., De Bruyn, L., De Cinti, B., Dirnböck, T., Grandin, U., Hester, A.J., Kanka, R., Klotz, S., Loucougaray, G., Lundin, L., Matteucci, G., Mészáros, I., Oláh, V., Preda, E., Prévosto, B., Pykälä, J., Schmidt, W., Taylor, M.E., Vadineanu, A., Waldmann, T., and Stadler, J. (2011). Functional traits and local environment predict vegetation responses to disturbance: a pan-European multi-site experiment. Journal of Ecology, 99, 777-787.
10. Bradshaw, C.J.A. (2012). Little left to lose: deforestation and forest degradation in Australia since European colonisation. Journal of Plant Ecology, 5(1), 109-120.
11. Broadhurst, L., and Young, A. (2007). Seeing the wood and the trees – predicting the future for fragmented plant populations in Australian landscapes. Australian Journal of Botany, 55(3), 250-260.
12. Buckley, R. (2004). Environmental impacts of motorised off-highway vehicles. In R. Buckley (Ed.), Environmental impacts of ecotourism (pp. 83-98). CABI Publishing, Wallingford, UK.
13. Cole, D.N. (2004). Impacts of hiking and camping on soils and vegetation: a review. In R. Buckley (Ed.), Environmental Impacts of Ecotourism (pp. 41-61). CABI Publishing, Wallingford, UK.
14. Conine, A., Xiang, W.N., Young, J., and Whitley, D. (2004). Planning for multi-purpose greenways in Concord, North Carolina. Landscape and Urban Planning, 68, 271-287.
15. Dickens, S.J.M., Gerhardt, F., and Collinge, S.K. (2005). Recreational portage trails as corridors facilitating non-native plant invasions of the Boundary Waters Canoe Area Wilderness (USA). Conservation Biology, 19(5), 1653-1657.
16. Drayton, B., and Primack, R.B. (1996). Plant species lost in an isolated conservation area in metropolitan Boston from 1894 to 1993. Conservation Biology, 10(1), 30-39.
17. Farrell, T.A., and Marion, J.L. (2002). Trail impacts and trail impact management related to ecotourism visitation at Torres del Paine National Park, Chile. Journal of the Canadian Association for Leisure Studies, 26, 31-59.
18. Farris, E., Pisanu, S., Ceccherelli, G., and Filigheddu, R. (2013). Human trampling effects on Mediterranean coastal dune plants. Plant Biosystems, 147(4), 1043-1051.
19. Fenu, G., Mattana, E., and Bacchetta, G. (2011). Distribution, status and conservation of a Critically Endangered, extremely narrow endemic: Lamyropsis microcephala (Asteraceae) in Sardinia. Oryx, 45(2), 180-186.
20. Florgård, C., and Forsberg, O. (2006). Residents’ use of remnant natural vegetation in the residential area of Järvafältet, Stockholm. Urban Forestry and Urban Greening, 5(2), 83-92.
21. Gaines, W.L., Singleton, P.H., and Ross, R.C. (2003). Assessing the cumulative effects of linear recreation routes on wildlife habitats on the Okanogan and Wenatchee National Forests (General Technical Report PNW-GTR-586). U.S. Department of Agriculture, Forest Service, Pacific Northwest Research Station, Portland, USA. Retrieved from - http://www.fs.fed.us/pnw/pubs/gtr586.pdf.
22. Gaston, K.J. (2010). Urban ecology. Cambridge University Press, Cambridge, UK. 318 p. 23. Gehring, T.M., and Swihart, R.K. (2003). Body size, niche breadth, and ecologically
scaled responses to habitat fragmentation: mammalian predators in an agricultural landscape. Biological Conservation, 109(2), 283-295.
24
24. Geneletti, D. (2004). Using spatial indicators and value functions to assess ecosystem fragmentation caused by linear infrastructures. International Journal of Applied Earth Observation and Geoinformation, 5, 1-15.
25. Gobster, P.H., and Westphal, L.M. (2004). The human dimensions of urban greenways: planning for recreation and related experiences. Landscape and Urban Planning, 68(2-3), 147-165.
26. Godefroid, S., and Koedam, N. (2003). How important are large vs. small forest remnants for the conservation of woodland flora in an urban context? Global Ecology and Biogeography, 12, 287-298.
27. Godefroid, S., and Koedam, N. (2004). The impact of forest paths upon adjacent vegetation: effects of the path surfacing material on the species composition and soil compaction. Biological Conservation, 119, 405-419.
28. Goosem, M. (2007). Fragmentation impacts caused by roads through rainforests. Current Science, 93(11), 1587-1596.
29. Malmivaara-Lämsä, M., Hamberg, L., Haapamäki, E., Liski, J., Kotze, D.J., Lehvävirta, S., and Frtize, H. (2008). Edge effects and trampling in boreal urban forest fragments - impacts on the soil microbial community. Soil Biology and Biochemistry, 40(7), 1612-1621.
30. Hammitt, W.E., and Cole, D.N. (1998). Wildland Recreation: Ecology and Management – second edition. Wiley and Sons Publishing, Stafford, Australia. 376 p.
31. Harper, K.A., and MacDonald, S.E. (2002). Structure and composition of edges next to regenerating clear-cuts in mixed-wood boreal forest. Journal of Vegetation Science, 13(4), 535-546.
32. Harper, K.A., MacDonald, S.E., Burton, P.J., Chen, J., Brosofske, K.D., Saunders, S.C., Euskirchen, E.S., Roberts, D., Jaiteh, M.S., and Esseen, P.A. (2005). Edge influence on forest structure and composition in fragmented landscapes. Conservation Biology, 19(3), 768-782.
33. Hemp, A. (2008). Introduced plants on Kilimanjaro: tourism and its impact. Plant Ecology, 197(1), 17-29.
34. Hill, W., and Pickering, C.M. (2009). Differences in resistance of three sub-tropical vegetation types to experimental trampling. Journal of Environmental Management, 90(2), 1305-1312.
35. International Mountain Biking Association. (2009). Mountain biking resources. Retrieved January 5, 2013 from - http://www.imba.com.
36. Kissling, M., Hegetschweiler, K.T., Rusterholz, H.P., and Baur, B. (2009). Short-term and long-term effects of human trampling on above-ground vegetation, soil density, soil organic matter and soil microbial processes in suburban beech forests. Applied Soil Ecology, 42(3), 303-314.
37. Lee, A.C.K., and Maheswaran, R. (2011). The health benefits of urban green spaces: a review of the evidence. Journal of Public Health, 33(2), 212-222.
38. Leung, Y.F., Shaw, N., Johnson, K., and Duhaime, R. (2002). More than a database: integrating GIS data with the Boston Harbor Islands carrying capacity study. George Wright Forum, 19, 69-78.
39. Leung, Y.F., and Louie, J. (2008). Visitor experience and resource protection - Data Analysis Protocol: Social Trails. US National Park Service, Yosemite, USA. 17p.
40. Leung, Y.F., Newburger, T., Jones, M., Kuhn, B., and Woiderski, B. (2011a). Developing a monitoring protocol for visitor-created informal trails in Yosemite National Park, USA. Environmental Management, 47, 93-106.
25
41. Leung, Y.F., Bigsby, K., and Kollar, C. (2011b). Developing methods for integrated analysis of meadow condition and informal trail data in Yosemite National Park (Final Integrated Report), North Carolina State University, North Carolina, USA. 80 p.
42. Lichstein, J.W., Simons, T.R., Shriner, S.A., and Franzreb, K.E. (2002). Spatial autocorrelation and autoregressive models in Ecology. Ecological Monographs, 72(3), 445-463.
43. Liddle, M.J. (1997). Recreation Ecology. Chapman and Hall Publishing, London, UK. 664 p.
44. Lindenmayer, D., and Fischer, J. (2006). Habitat Fragmentation and Landscape Change: An Ecological and Conservation Synthesis. Island Press, Washington D.C., USA. 352 p.
45. Lynn, N.A., and Brown, R.D. (2003) Effects of recreational use impacts on hiking experiences in natural areas. Landscape and Urban Planning, 64(1-2), 77-87.
46. Manning, R.E., Leung, Y.F., and Budruk, M. (2005). Research to support management of visitor carrying capacity on Boston Harbour Islands. Northeastern Naturalist, 12(3), 201-220.
47. Marion, J.L., and Leung, Y.F. (2001). Trail resource impacts and an examination of alternative assessment techniques. Journal of Park and Recreation Administration, 19(3), 17-37.
48. Marion, J.L., and Leung, Y.F. (2004). Environmentally sustainable trail management. In R. Buckley (Ed.), Environmental impacts of ecotourism (pp. 229-244). CABI Publishing, Wallingford, UK.
49. Marion, J.L., and Wimpey, J. (2007). Environmental impacts of mountain biking: science review and best practises. In IMBA (Ed.), Managing mountain biking: IMBA’s guide to providing great riding (pp. 94-111). International Mountain Biking Association Publishing, Boulder, USA.
50. Marion, J.L., and Leung, Y.F. (2011). Indicators and protocols for monitoring impacts of formal and informal trails in protected areas. Journal of Tourism and Leisure Studies, 17(2), 215-236.
51. Marzano, M., and Dandy, N. (2012). Recreationist behaviour in forests and the disturbance to wildlife. Biodiversity and Conservation, 21(11), 2967-2986.
52. Matlack, G.R. (1993). Sociological edge effects: spatial distribution of human impact in suburban forest fragments. Environmental Management, 17(6), 829-835.
53. McAlpine, C.A., Spies, T.A., Norma, P., and Peterson, A. (2007). Conserving forest biodiversity across multiple land ownerships: lessons from the Northwest Forest Plan and the Southeast Queensland regional forests agreement (Australia). Biological Conservation, 134, 580-592.
54. McGarigal, K., and Marks, B.J. (1995). FRAGSTATS: Spatial pattern analysis program for quantifying landscape structure (General Technical Report PNW-GTR-351). U.S. Department of Agriculture, Forest Service, Pacific Northwest Research Station, Portland, USA. Retrieved from - http://www.umass.edu/landeco/pubs/mcgarigal.marks.1995.pdf.
55. Monz, C.A., Cole, D.N., Leung, Y.F., and Marion, J.L. (2010). Sustaining visitor use in protected areas: future opportunities in recreation ecology research based on the USA experience. Environmental Management, 45(3), 551-562.
56. Monz, C.A., Pickering, C.M., and Hadwen, W.L. (2013). Recent advances in recreation ecology and the implications of different relationships between recreation use and ecological impacts. Frontiers in Ecology and the Environment, 11(8), 441-446.
57. Moskal, L.M., and Halabisky, M. (2010). Analysis of social trails in Mt. Rainier National Park: a pilot study. Retrieved July 3, 2013 from - http://www.cfr.washington.edu/research.cesu/reports/J8W07090020_final_report.pdf.
26
58. Moxham, C., and Turner, V. (2011). The effect of fragmentation on the threatened plant community Coastal Moonah Woodland in Victoria, Australia. Urban Ecosystems, 14(4), 569-583.
59. Müllerová, J., Vítková, M., and Vítek, O. (2011). The impacts of road and walking trails upon adjacent vegetation: effects of road building materials on species composition in a nutrient poor environment. Science of the Total Environment, 409(19), 3839-3849.
60. Nepal, S.K., and Nepal, S.A. (2004). Visitor impacts on trails in the Sagarmatha (Mt Everest) National Park, Nepal. AMBIO, 33(6), 334-340.
61. Newsome, D., and Davies, C. (2009). A case study in estimating the area of informal trail development and associated impacts caused by mountain bike activity in John Forrest National Park, Western Australia. Journal of Ecotourism, 8(3), 237-253.
62. Newsome, D., Moore, S.A., and Dowling, D.K. (2013). Natural area tourism: ecology, impacts and management - second edition. Channel View Publishing, Bristol, UK. 480 p.
63. Niemalä, J., Saarela, S.R., Söderman, T., Kopperoinen, L., Yli-Pelkonen, V., Väre, S., and Kotze, D.J. (2010). Using the ecosystem services approach for better planning and conservation of urban green spaces: a Finland case study. Biodiversity and Conservation, 19, 3225-3243.
64. Olive, N.D., and Marion, J.L. (2009). The influence of use-related, environmental and managerial factors on soil loss from recreational trails. Journal of Environmental Management, 90, 1483-1493.
65. Peñas, J., Benito, B., Lorite, J., Ballesteros, M., Cañadas, E.M., and Martinez-Ortega, M. (2011). Habitat fragmentation in arid zones: a case study of Linaria nigricans under land use changes (SE Spain). Journal of Environmental Management, 48(1), 168-176.
66. Pescott, O.L., and Stewart, G.B. (2014) Assessing the impact of human trampling on vegetation: a systematic review and meta-analysis of experimental evidence. Peer J, 2, e360.
67. Pickering, C.M., Castley, J.G., Hill, W., and Newsome, D. (2010a). Environmental, safety and management issues of unauthorised trail technical features for mountain bicycling. Landscape and Urban Planning, 97(1), 58-67.
68. Pickering, C.M., Hill, W., Newsome, D., and Leung, Y.F. (2010b). Comparing hiking, mountain biking and horse riding impacts vegetation and soils in Australia and the United States of America. Journal of Environmental Management, 91(3), 551-562.
69. Pickering, C.M., Castley, J.G., and Richardt, K. (2012). Informal trails fragmenting endangered remnant vegetation in Australia (extended abstract). Sixth international conference on monitoring and management of visitors in recreational and protected areas, August 21-24, 2012, Stockholm, Sweden. pp 362-363.
70. Priskin, J. (2003). Physical impacts of four-wheel drive related tourism and recreation in a semi-arid, natural coastal environment. Ocean and Coastal Management, 46, 127-155.
71. Queensland Government. (2007). South-east Queensland outdoor recreation demand study. Queensland Government Publishing, Brisbane, Australia. Retrieved July 13, 2013 from - http://www.nprsr.qld.gov.au/recreation/pdf/outdoor-recreation/outdoor-recreation-study.pdf. 106 p.
72. Queensland Government. (2013). Regional Ecosystems Descriptions Database (REDD). Retrieved July 3, 2013 from - http://www.ehp.qld.gov.au/ecosystems/biodiversity/regional-ecosystems/index.php.
73. Rossi, S., Pickering, C.M., and Byrne, J. (2012). Differences among hikers, runners and mountain bikers in a peri-urban park (extended abstract). Sixth international conference on monitoring and management of visitors in recreational and protected areas, August 21-24, 2012, Stockholm, Sweden. pp 174-175.
27
74. Shafer, C.S., Lee, B.K., and Turner, S. (2000) A tale of three greenway trails: user perceptions related to quality of life. Landscape and Urban Planning, 49, 163-178.
75. State of Queensland. (2013). Shapefiles for local population, vegetation and land-use in south-east Queensland region. Queensland Government Data download service. Retrieved July 3, 2013 from - http://dds.information.qld.gov.au/dds/.
76. Stenhouse, R.N. (2004). Fragmentation and internal disturbance of native vegetation reserve in the Perth metropolitan area, Western Australia. Landscape and Urban Planning, 68, 389-401.
77. Swanwick, C., Dunnett, N., and Woolley, H. (2003). Nature, role and value of green space in towns and cities: an overview. Built Environment, 29(2), 94-106.
78. Takano, T., Nakamura, K., and Watanabe, M. (2002). Urban residential environments and senior citizens’ longevity in megacity areas: the importance of walkable green spaces. Journal of Epidemiol Community Health, 56, 913-918.
79. Taylor, A.R. and Knight, R.L., (2003) Wildlife responses to recreation and associated visitor perceptions. Ecological Applications, 13(4), 951-963.
80. Tratalos, J., Fuller, R.A., Warren, P.H., Davies, R.G., and Gaston, K.J. (2007). Urban form, biodiversity potential and ecosystem services. Landscape and Urban Planning, 83, 308-317.
81. Walden-Schreiner, C., and Leung, Y.F. (2013). Spatially characterising visitor use and its association with informal trails in Yosemite Valley Meadows. Environmental Management, 52(1), 163-178.
82. Wilshire, H.G., Nakata, J.K., Shipley, S., and Prestegaard, K. (1978). Impacts of vehicles on natural terrain at seven sites in the San Francisco Bay area. Environmental Geology, 2(5), 295-319.
83. Wilson, J.P., and Seney, J.P. (1994). Erosional impact of hikers, horses, motorcycles and off-road bicycles on mountain trails in Montana. Mountain Research and Development, 14(1), 77-88.
84. Wilson, B.A., Neldner, V.J., and Accad, A. (2002). The extent and status of remnant vegetation in Queensland and its implications for state-wide vegetation management and legislation. The Rangeland Journal, 24(1), 6-35.
85. Wimpey, J., and Marion, J.L. (2010). The influence of use, environmental and managerial factors on the width of recreational trails. Journal of Environmental Management, 91, 2028-2037.
86. Wimpey, J., and Marion, J.L. (2011). A spatial exploration of informal trail networks within Great Falls Park, VA. Journal of Environmental Management, 92(3), 1012-1022.
87. Wing, M., and Shelby, B. (1999). Using GIS to integrate information on forest recreation. Journal of Forestry, 97(1), 1-12.
88. Zhang, J.T., Xiang, C.L., and Li, M. (2012). Effects of tourism and topography on vegetation diversity in the subalpine meadows of the Dongling Mountains of Beijing, China. Environmental Management, 49(2), 403-411.
28
Table Captions
Table 1: Characteristics of the 17 remnants of Tall Open Blackbutt Forest surveyed for recreational trails in southeast Queensland, Australia. CA = Conservation Area, NP = National Park. Highlighted cells signify those remnants that have been reduced in area by external fragmentation. Average altitude from GPS reading, total area (ha) in 2006 from 2006 Remnant Regional Ecosystems of Queensland GIS shapefiles.
Table 2: Trail characteristics surveyed for recreational trails in 17 remnants of Tall Open Blackbutt Forest surveyed in southeast Queensland, Australia. Total number of trail types is 14 with most being native/earth and hard solid-edged trails. Widths of 1-5 person indicate roughly 1-5m. Missing values indicate zeroes.
Table 3: Trail and fragmentation data for the 17 remnants of Tall Open Blackbutt Forest surveyed for recreational trails in southeast Queensland, Australia. Missing values indicate zeroes. CA = Conservation Area, NP = National Park, Inf. = Informal. Highlighted cells signify those remnants most strongly impacted by trail-based fragmentation in this study.
29
Table 1: Characteristics of the 17 remnants of Tall Open Blackbutt Forest surveyed for recreational trails in southeast Queensland, Australia. CA = Conservation Area, NP = National Park. Highlighted cells signify those remnants that have been reduced in area by external fragmentation. Average altitude from GPS reading, total area (ha) in 2006 from 2006 Remnant Regional Ecosystems of Queensland GIS shapefiles.
Name Location GPS detail (S,E) Average altitude (m asl) Protected Recreation
authorised Total area (ha) 2006
Total area (ha) 2013
Bayview CA (1) Northern -27.643998,153.277424 38.9 Yes Yes 437.1 437.1
Bayview CA (2) Northern -27.649814,153.253735 21.9 Yes Yes 52.9 52.9
Venman Bushlands NP (1) Northern -27.629589,153.201852 88.3 Yes Yes 19.4 19.4
Venman Bushlands NP (2) Northern -27.632255,153.204382 95.5 Yes Yes 14.8 14.8
Venman Bushlands NP (3) Northern -27.629627,153.198803 83.1 Yes Yes 3.9 3.9
Venman Bushlands NP (4) Northern -27.633961,153.196614 94.2 Yes Yes 41.8 41.8
Venman Bushlands NP (5) Northern -27.636281,153.189319 113.9 Yes Yes 32.7 32.7
Sanctuary Drive Northern -27.630197,153.249915 48.9 No No 178.2 143.4
Mount Cotton Village Northern -27.642592,153.248327 42.9 No No 31.4 10.6
Lakeside Drive Northern -27.646697,153.250773 19.8 No No 9.9 2.9
Griffith University Southern -27.967797,153.378622 26.8 No No 32.7 27.9
Coombabah Wetlands Southern -27.932465,153.366988 9.1 Yes Yes 8.9 7.4
Currumbin Chase Southern -28.144168,153.481014 41.2 No No 4.5 4.5
Old Coach Road (1) Southern -28.117411,153.413895 44.7 No No 10.5 10.5
Old Coach Road (2) Southern -28.119795,153.415397 43.5 No No 4.6 4.6
Musgrave Park Southern -27.957069,153.391196 12.3 No No 5.0 4.8
Geoff Wolter Drive Southern -27.968403,153.367855 26.7 No No 9.2 9.2
Total 897.5 828.4
30
Table 2: Trail characteristics surveyed for recreational trails in 17 remnants of Tall Open Blackbutt Forest surveyed in southeast Queensland, Australia. Total number of trail types is 14 with most being native/earth and hard solid-edged trails. Widths of 1-5 person indicate roughly 1-5m. Missing values indicate zeroes.
Width Substrate Group (m)
Native/Earth (Informal)
Hard Solid Edge (Formal)
Hard Loose Edge (Formal)
Grass (Informal)
1 person 18,569 74
2 person 7,251 1,469 274 463
3 person 5,039 225 10,426 211
4 person 592 21 787
5 person 663
# trail types 5 4 3 2
31
Table 3: Trail and fragmentation data for the 17 remnants of Tall Open Blackbutt Forest surveyed for recreational trails in southeast Queensland, Australia. Missing values indicate zeroes. CA = Conservation Area, NP = National Park, Inf. = Informal. Highlighted cells signify those remnants most strongly impacted by trail-based fragmentation in this study.
Name Length of trails (m) Density of trails (m ha -1)
Total area lost to trail tread (ha)
Median patch size (ha) WMPI L5PI
Total Formal Inf. % Inf. Walking Biking Motor Northern District (Redlands) Bayview CA (1) 27,358 11,779 15,579 57 9,243 16,744 1,371 62.59 10.90 0.58 6.60 68.24 Bayview CA (2) 136 136 100 136 2.57 0.08 53.00 52.85 99.84 Venman Bushlands NP (1) 1,842 1,631 211 11 1,842 94.91 0.74 0.05 1.20 83.84 Venman Bushlands NP (2) 910 910 123 787 61.63 0.48 0.02 1.15 96.07 Venman Bushlands NP (3) 137 85 52 38 137 34.84 0.04 0.24 1.29 98.87 Venman Bushlands NP (4) 2,002 1,582 420 21 2,002 47.87 1.04 5.15 7.95 97.52 Venman Bushlands NP (5) 1,461 1,461 1,461 44.72 0.80 7.66 7.78 95.57 Sanctuary Drive 426 225 201 47 426 2.97 0.22 71.59 71.48 99.85 Mount Cotton Village 990 850 140 14 990 93.59 0.24 0.02 1.01 97.59 Lakeside Drive 52 52 100 52 17.99 0.01 1.43 1.43 99.64 Southern District (Gold Coast) Griffith University 6,603 240 6,363 96 254 6,349 237.1 1.79 0.13 0.49 49.09 Coombabah Wetlands 871 707 164 19 871 117.60 0.33 0.003 0.36 93.91 Currumbin Chase 104 104 100 104 23.18 0.02 4.50 4.45 99.54 Old Coach Road (1) 191 191 100 191 18.12 0.08 10.5 10.37 99.27 Old Coach Road (2) 414 414 100 228 186 90.21 0.24 0.21 0.69 94.58 Musgrave Park 1,192 1,192 100 1,192 248.96 0.48 0.04 0.35 87.39 Geoff Wolter Drive 1,374 58 1,316 96 1,374 149.57 0.56 0.61 1.01 88.43 Total 46,063 19,528 26,535 20,626 23,093 2,344 18.05

32
Appendices Captions
Appendix A: Outline of the 10 predictor variables used in a global regression to analyse their effects on trail-based fragmentation across 17 Tall Open Blackbutt forest remnants in south-east Queensland.
33
Appendix A: Outline of the 10 predictor variables used in a global regression to analyse their effects on trail-based fragmentation across 17 Tall Open Blackbutt forest remnants in south-east Queensland.
Variable Spatial Data Used
Source of Spatial Data
Methods
Scale Local population density within 10 km of forest edge (Human)
Queensland Statistical Area 2 (SA2) region boundaries shapefile; population estimates for SA2 regions
Australian Bureau of Statistics 2011 National Census Data
The total population and area (km2) of each SA2 region was calculated using the ‘Calculate Geometry’ tool. Population density (number of persons per km2 per SA2) was calculated using the ‘Field Calculator’ tool storing values as attributes in a new field. Finally, mean local population density per patch was calculated by averaging all population density values for all SA2 zones within 10 km of the patch edge which were selected using a 10 km ring buffer based on Euclidean distance (‘Buffer’ tool).
Density of road/rail networks within 1 km of forest edge (Human)
Physical road/rail networks shapefiles
Queensland Government Information Service
To analyse the average density of road and rail networks within 1km of each patch edge, a 1000 m buffer was applied to each patch using the ‘Buffer (Analysis)’ tool. Then, using the ‘Select layer by location’ tool, all sections of road and rail that were contained within the 1000 m buffer were selected. A raster dataset was then created using the ‘Line Density’ tool to determine the density of roads within these buffers. This method calculates the density of line features (roads) within the neighbourhood of all raster cells contained within a given polygon (1000 m buffer). Essentially a circular search radius of 1m is drawn around the centre of each raster cell and all lines that are within it are summed and divided by the area’s circle such that:Density = (L1 + L2 + L3… Li) / (area of circle)
where Li is the calculated length of line within the circle radius of 1 m around cells of a
34
size shorter than the width or height of the output extent, divided by 250.
Then, to calculate the average density of roads/rail within 1000 m buffer of each patch, the ‘Zonal Statistics’ tool was used based on values produced from the line density raster above per buffer zone. Values were recorded as metres per square kilometre.
See: ArcGIS 9.2 Desktop help – density calculations – line density calculations http://webhelp.esri.com/argisdesktop/9.2/index.cfm?TopicName=Density%20calculations.
Density of water bodies within forests (Biophysical)
Vegetation management watercourse map (1:25000) - version 1.2 shapefile
Queensland Government Information Service
To assess the average density of water bodies within each patch, all intersecting and contained water courses within each patch were selected using ‘Select layer by location’ in Vegetation management watercourse map (1:100000 and 1:250000) version 1.2. A raster was then created using ‘Line Density’ to determine density of watercourses within each patch, based on above formulae. Finally ‘Zonal Statistics’ were used to calculate average density per patch in metres per square kilometre based on raster cell values.
Total number of entry points (Human)
17 mapped forests
This study The number of entry points was totalled per patch. An entry point was defined as any fixed point where a recreational trail intercepted an external edge, except those formed solely by a natural change in vegetation.
% trail network with native substrate (Human)
17 mapped forests
This study The percentage of total trail network within each patch that was composed of native substrate was calculated by selecting all mapped native trails and using ‘Sum’.
Percentage of forest on flat ground (< 5% rise)
1 second SRTM derived 3-second smoothed Digital Elevation Model (DEM) raster
Australian Government Free Data Downloads
Slope was calculated from the DEM raster using the ‘Slope’ tool in ArcMap with degree of measurement in percent rise and Z-factor set at 1 displayed using nearest-neighbour pyramid sampling. Percent rise is calculated thus: 100 * rise / run, where rise is difference in vertical distance over a set horizontal distance (run). 100 m2 fishnet was created over the slope raster using the ‘Create Fishnet’ tool. Then the ‘Extract values to points’ tool was used with interpolation of values at point locations to assign cell values of the raster
35
layers to the centroid points of each fishnet cell. All resulting sampled data points within patches were selected and exported to an Excel database, where % of patch with < 5% rise was calculated as a mean.
Average altitude (Biophysical)
1 second SRTM derived 3-second smoothed Digital Elevation Model (DEM) raster
Australian Government Free Data Downloads
A 100 m2 fishnet was created over the DEM raster using the ‘Create Fishnet’ tool. Then the ‘Extract values to points’ tool was used with interpolation of values at point locations to assign cell values of the raster layers to the centroid points of each fishnet cell. All resulting sampled data points within patches were selected and exported to an Excel database, where average altitude per patch was calculated as a mean. The ‘Fishnet’ tool in ArcGIS is useful as it applies a stratified grid over the study area compartmentalising different parts of the forest and allowing for stratification of raster layers in order to analyse them statistically across each forest patch. It has been used in landscape-scale forest research in the past.
See: Ashutosh, S. (2012). Monitoring forests: a new paradigm of remote sensing and GIS-based change detection. Journal of Geographic Information Systems, 4, 470-478. AND Roush, W., Munroe, J.S., and Fagre, D.B. (2007). Development of a spatial analysis method using ground-based repeat photography to detect changes in the alpine treeline ecotone. Glacier National Park, Montana, USA. Arctic, Antarctic and Alpine Research 39(2), 297-308.
Categorical Compatibility of surrounding land-use matrix (Human)
Vegetation Management Act (VMA) 2006 Remnant Regional Ecosystems of Queensland;
Queensland Government Information Service
The compatibility of surrounding land-use matrix was visually calculated using a compatibility rating from 1-6 similar to that of Stenhouse (2004). The assessment was based on information obtained from the on-ground surveys combined with map consultation. Surrounding land parcels were included only if within 100 m abutting the forest edge. The ratings were:
1: other patches with at least 75% native vegetation
36
land-use 1999; land used for public recreation 2011 shapefiles
2: other patches with between 50-75% native vegetation
3: other patches with <50% native vegetation mixed with rural development
4: arable land and/or residential/parkland with mosaic vegetation
5: residential estates with <10% vegetation
6: hardened urban surfaces with industrial and transport infrastructure
Status of forest (Human)
Land-use 1999; land used for public recreation 2011 shapefiles
Queensland Government Information Service
Status of each forest patch was recorded as national park, conservation area, community or government reserve, freehold land or residential.
Main Trail-use (Human)
17 mapped forests
This study
Main trail use was noted based on observations made during on-ground surveillance or from discussions with local researchers and land managers.

37
LIST OF FIGURES
Figure 1: The location of 17 Tall Open Blackbutt forest remnants surveyed for recreational trails in south-east Queensland, Australia. Contour lines from the Australian Government Geoscience Australia Topography Contours 1:250,000 scale SG56-15 package and sub-set map of Australia from the Australian Government Geoscience Australia - National Dynamic Land Cover Dataset data package. Map created in ArcMap Version 10.1.
Figure 2: Examples of common trails that comprised 46.1km of trail across the 17 Tall Open Blackbutt forest remnants surveyed: (a) a hard-surfaced, loose-edged trail composed mainly of local gravel and hard-core substrates, (b) extreme trail widening caused by motorised recreation using straight, downhill runs, (c) segment of hard-surfaced, solid-edge trail made of concrete and (d) common narrow informal trail fragmenting a small patch of forest.
Figure 3: Examples of the most fragmented remnants of Tall Open Blackbutt forest from the south around the Gold Coast: (a) in this 27.8ha remnant > 6.4% of forest has been replaced by trails, resulting in extensive fragmentation (Weighted Mean Patch Index of 0.48 and Largest 5 Patches Index of 49.1), (b) a smaller 4.7ha remnant that has lost > 9.9% of forest to trails, and is highly fragmented (had the lowest Weighted Mean Patch Index of 0.35 and Largest 5 Patches Index of 87.4). Both remnants have multiple entry points facilitating access (black dots). Map created in ArcMap Version 10.1.
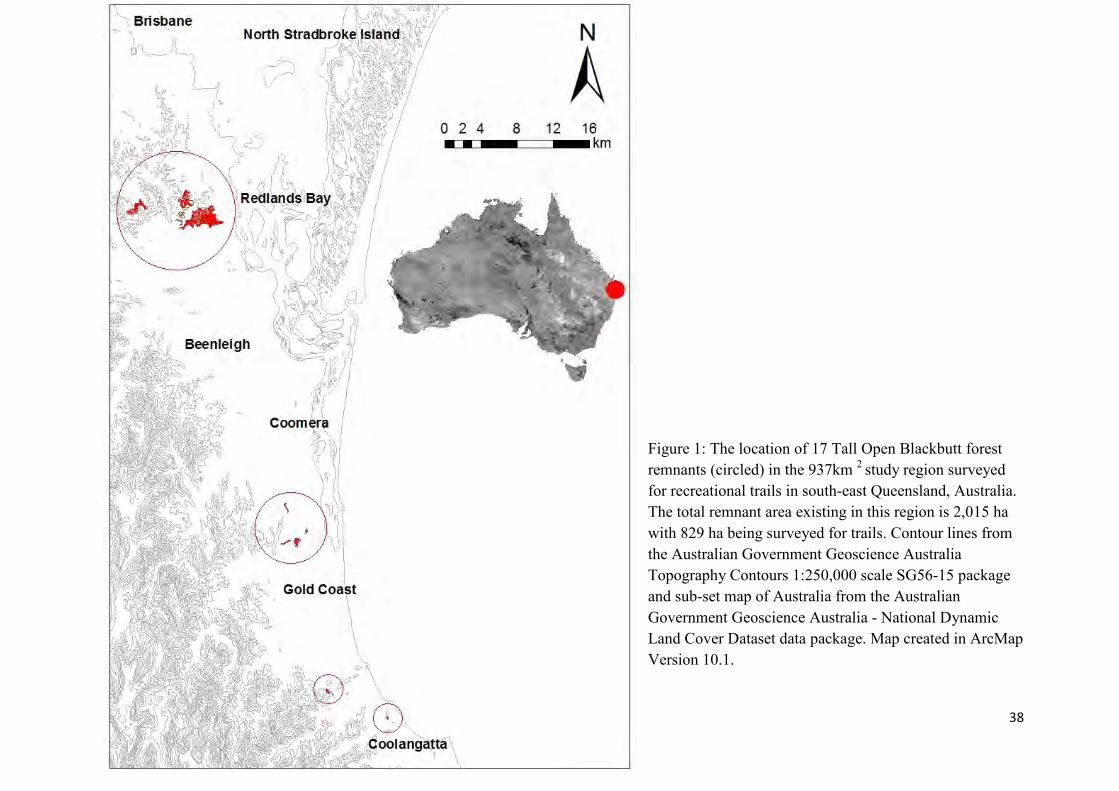
38
Figure 1: The location of 17 Tall Open Blackbutt forest remnants (circled) in the 937km 2 study region surveyed for recreational trails in south-east Queensland, Australia. The total remnant area existing in this region is 2,015 ha with 829 ha being surveyed for trails. Contour lines from the Australian Government Geoscience Australia Topography Contours 1:250,000 scale SG56-15 package and sub-set map of Australia from the Australian Government Geoscience Australia - National Dynamic Land Cover Dataset data package. Map created in ArcMap Version 10.1.
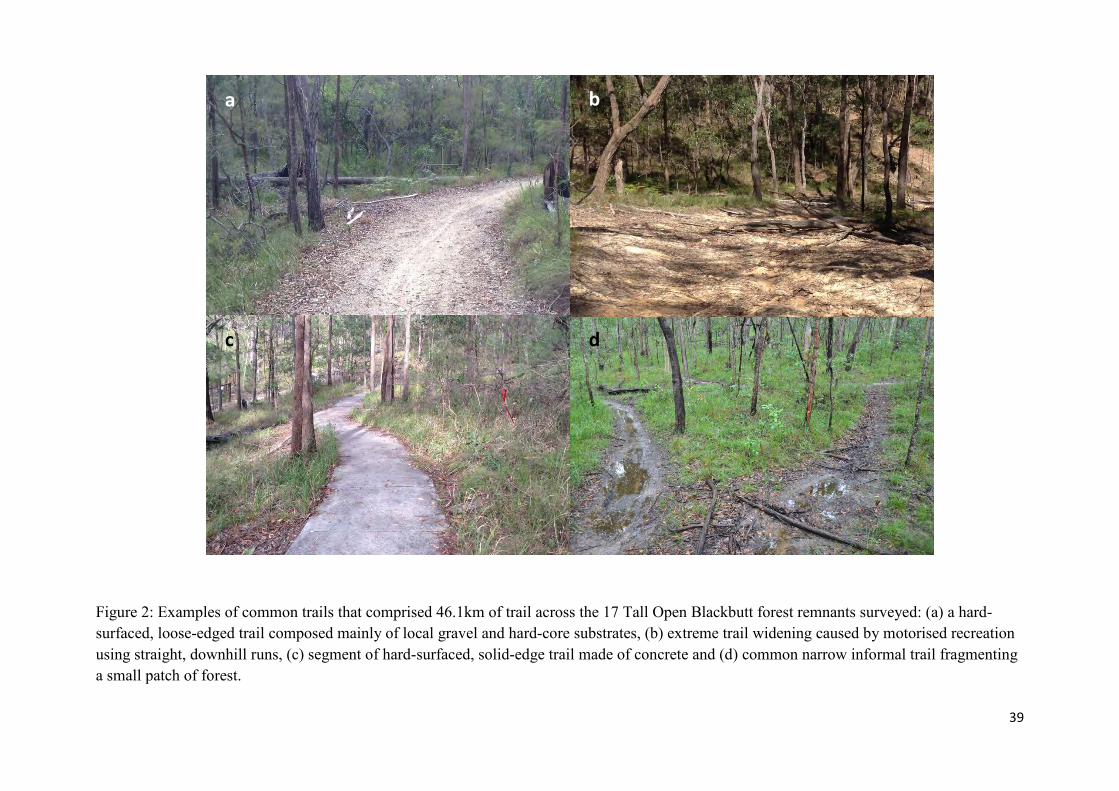
39
Figure 2: Examples of common trails that comprised 46.1km of trail across the 17 Tall Open Blackbutt forest remnants surveyed: (a) a hard-surfaced, loose-edged trail composed mainly of local gravel and hard-core substrates, (b) extreme trail widening caused by motorised recreation using straight, downhill runs, (c) segment of hard-surfaced, solid-edge trail made of concrete and (d) common narrow informal trail fragmenting a small patch of forest.
a b
c d
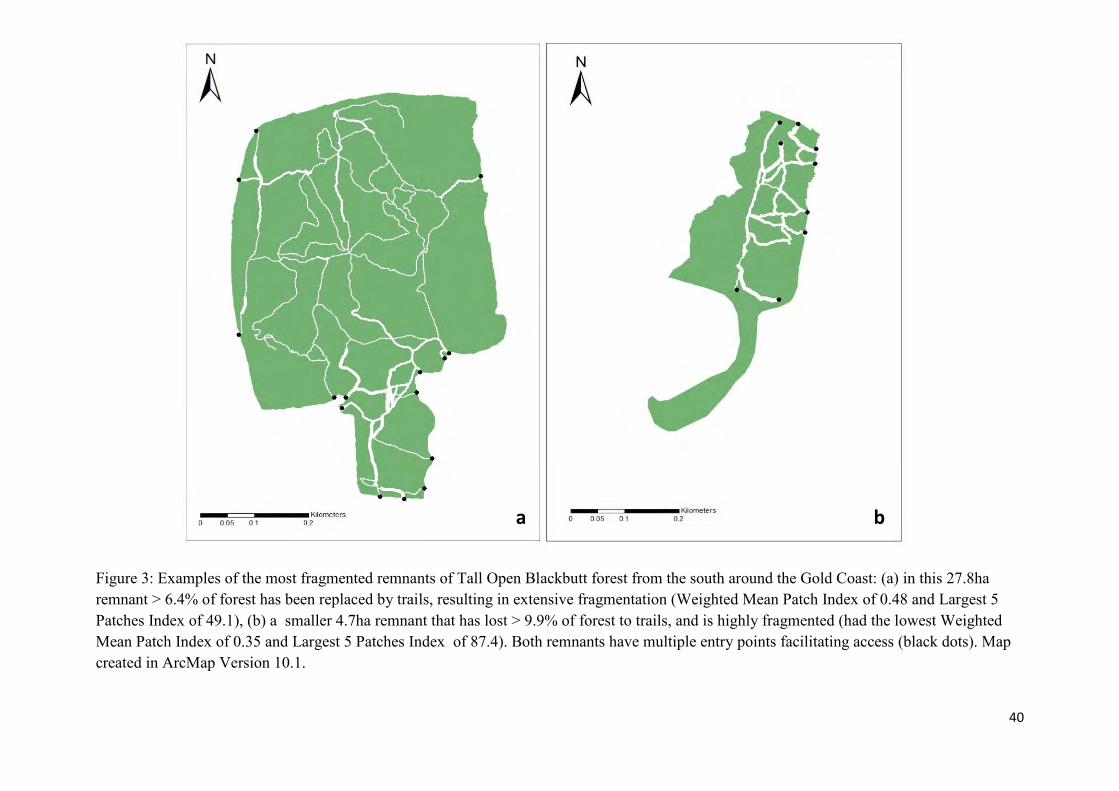
40
Figure 3: Examples of the most fragmented remnants of Tall Open Blackbutt forest from the south around the Gold Coast: (a) in this 27.8ha remnant > 6.4% of forest has been replaced by trails, resulting in extensive fragmentation (Weighted Mean Patch Index of 0.48 and Largest 5 Patches Index of 49.1), (b) a smaller 4.7ha remnant that has lost > 9.9% of forest to trails, and is highly fragmented (had the lowest Weighted Mean Patch Index of 0.35 and Largest 5 Patches Index of 87.4). Both remnants have multiple entry points facilitating access (black dots). Map created in ArcMap Version 10.1.
a b