Embed Size (px)
Citation preview
RECRUITING TRENDS 2015-16
45th Edition
Recruiting Trends 2015—2016 is published by Career Services and the Collegiate Employment Research Institute and copyrighted, © 2014-2015, by Michigan State University. All rights reserved. This electronic version is for individual use only. No part of this electronic report may be reproduced in any form by any electronic or mechanical means (including photocopying, recording, or information storage and retrieval) without written permission from the Institute. Users are not permitted to mount this file on any network servers or distribute this report by email without written permission from the Institute. Material from this report can be used in classrooms and newsletters with proper citation of Michigan State University and the Collegiate Employment Research Institute.
BRIEF 2Hiring Outlook by Industry Sector and Geographic Region
Key findings from 2015-16 are presented in this research brief. We have broken the release of employer information into a series of short briefs that will be made available over the next six weeks. You can download the briefs from the Collegiate Employment Research Institute.
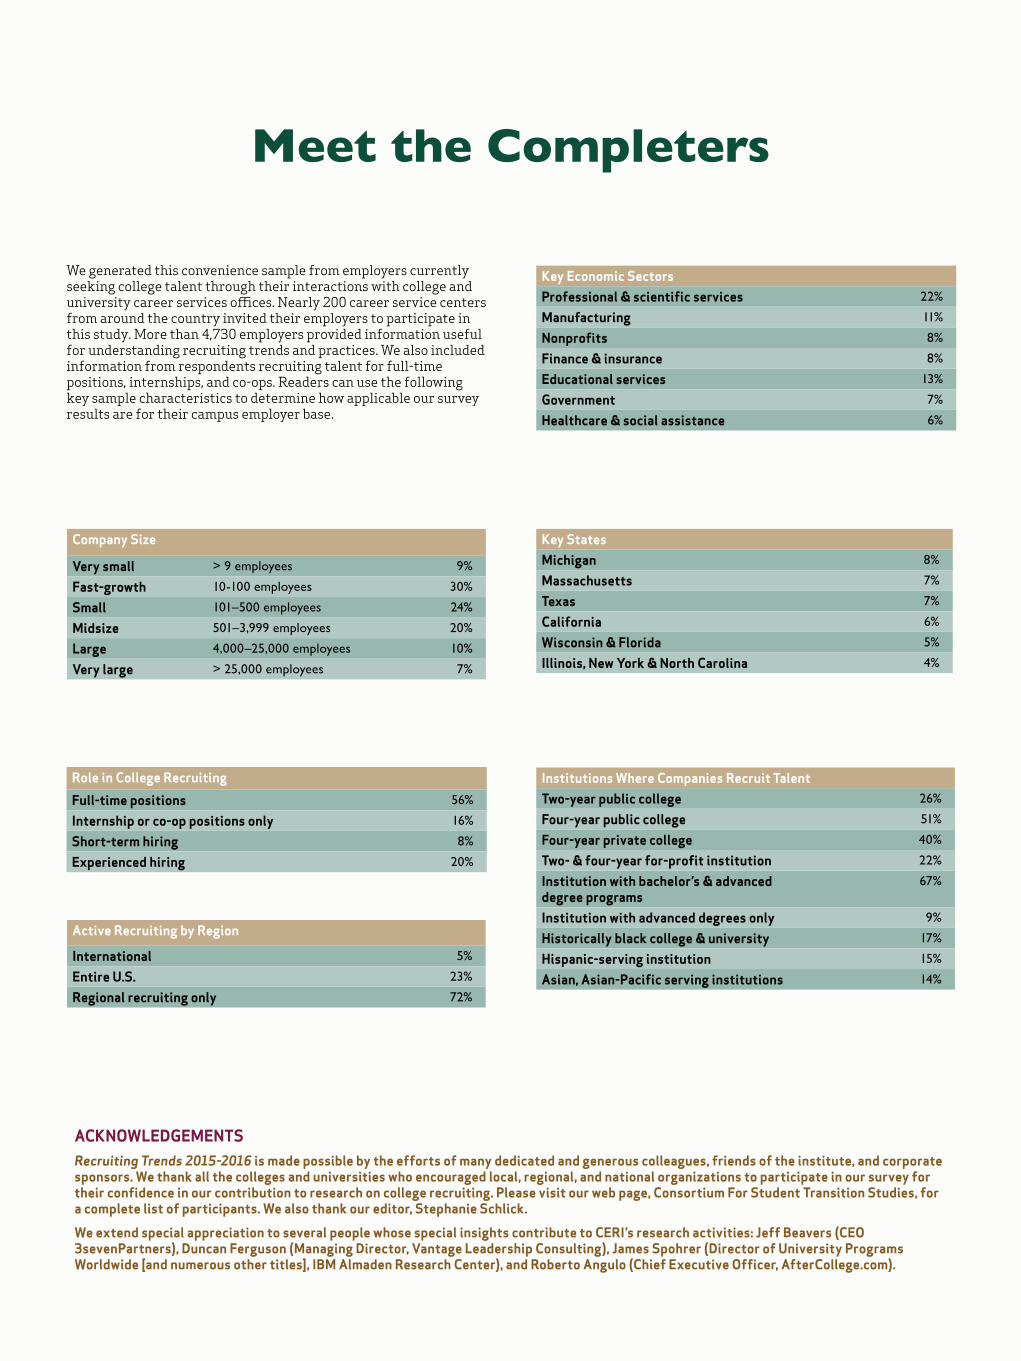
Role in College Recruiting
Full-time positions 56%
Internship or co-op positions only 16%
Short-term hiring 8%
Experienced hiring 20%
Company Size
Very small > 9 employees 9%
Fast-growth 10-100 employees 30%
Small 101–500 employees 24%
Midsize 501–3,999 employees 20%
Large 4,000–25,000 employees 10%
Very large > 25,000 employees 7%
Key Economic SectorsProfessional & scientific services 22%
Manufacturing 11%
Nonprofits 8%
Finance & insurance 8%
Educational services 13%
Government 7%
Healthcare & social assistance 6%
Key StatesMichigan 8%
Massachusetts 7%
Texas 7%
California 6%
Wisconsin & Florida 5%
Illinois, New York & North Carolina 4%
Institutions Where Companies Recruit TalentTwo-year public college 26%
Four-year public college 51%
Four-year private college 40%
Two- & four-year for-profit institution 22%
Institution with bachelor’s & advanced degree programs
67%
Institution with advanced degrees only 9%
Historically black college & university 17%
Hispanic-serving institution 15%
Asian, Asian-Pacific serving institutions 14%
Active Recruiting by Region
International 5%
Entire U.S. 23%
Regional recruiting only 72%
Meet the Completers
We generated this convenience sample from employers currently seeking college talent through their interactions with college and university career services offices. Nearly 200 career service centers from around the country invited their employers to participate in this study. More than 4,730 employers provided information useful for understanding recruiting trends and practices. We also included information from respondents recruiting talent for full-time positions, internships, and co-ops. Readers can use the following key sample characteristics to determine how applicable our survey results are for their campus employer base.
ACKNOWLEDGEMENTS Recruiting Trends 2015-2016 is made possible by the efforts of many dedicated and generous colleagues, friends of the institute, and corporate sponsors. We thank all the colleges and universities who encouraged local, regional, and national organizations to participate in our survey for their confidence in our contribution to research on college recruiting. Please visit our web page, Consortium For Student Transition Studies, for a complete list of participants. We also thank our editor, Stephanie Schlick.
We extend special appreciation to several people whose special insights contribute to CERI’s research activities: Jeff Beavers (CEO 3sevenPartners), Duncan Ferguson (Managing Director, Vantage Leadership Consulting), James Spohrer (Director of University Programs Worldwide [and numerous other titles], IBM Almaden Research Center), and Roberto Angulo (Chief Executive Officer, AfterCollege.com).
1Recruiting Trends 2015-16
Brief 2: Hiring by Industry and Region
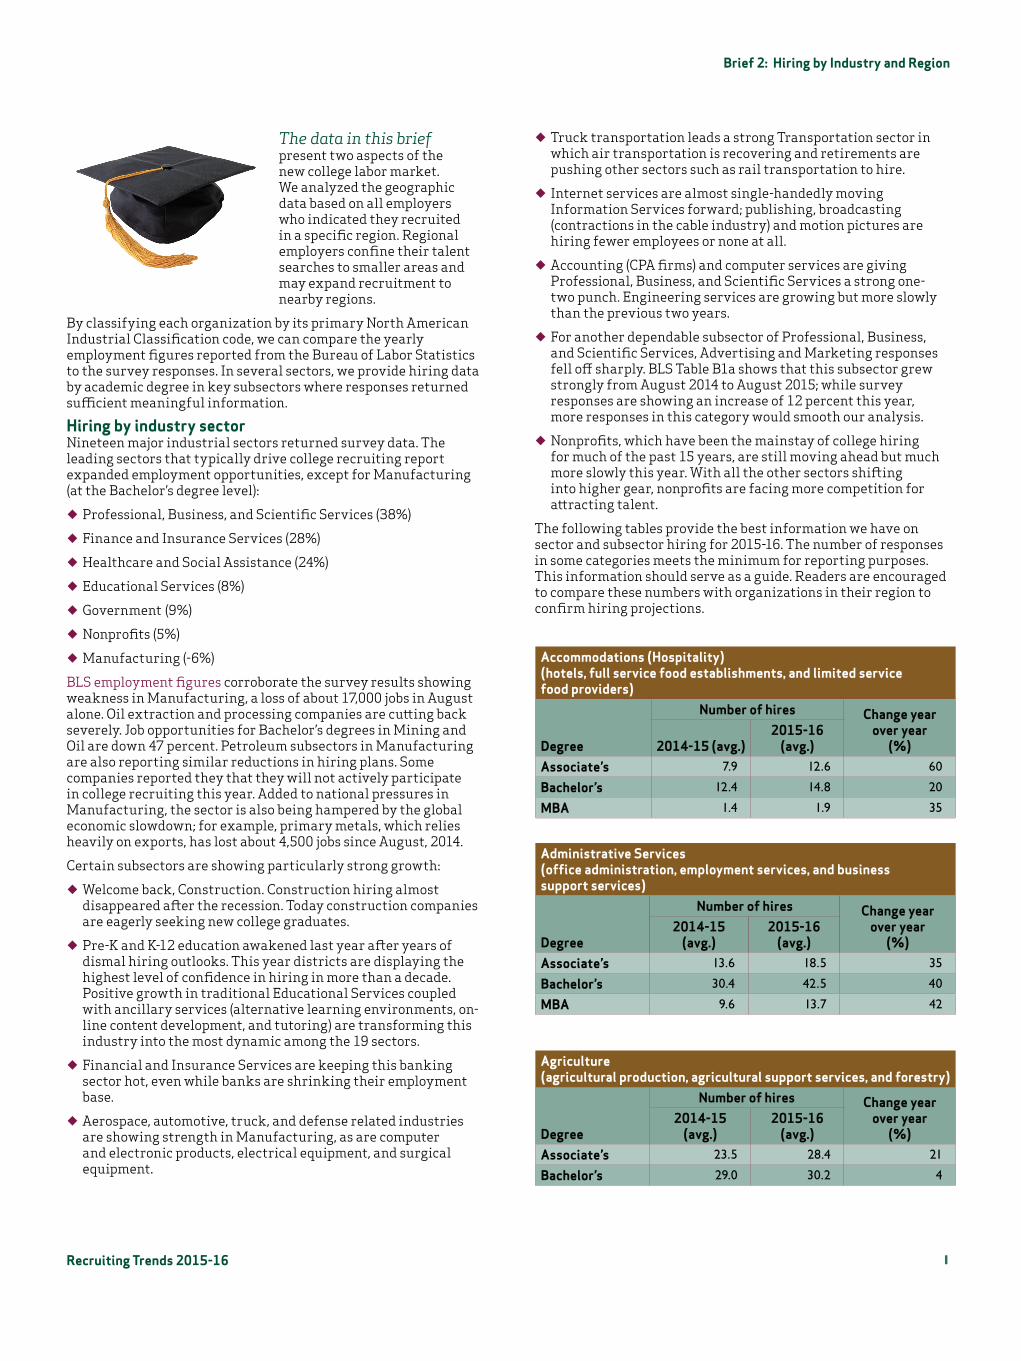
The data in this brief present two aspects of the new college labor market. We analyzed the geographic data based on all employers who indicated they recruited in a specific region. Regional employers confine their talent searches to smaller areas and may expand recruitment to nearby regions.
By classifying each organization by its primary North American Industrial Classification code, we can compare the yearly employment figures reported from the Bureau of Labor Statistics to the survey responses. In several sectors, we provide hiring data by academic degree in key subsectors where responses returned sufficient meaningful information.
Hiring by industry sectorNineteen major industrial sectors returned survey data. The leading sectors that typically drive college recruiting report expanded employment opportunities, except for Manufacturing (at the Bachelor’s degree level):
¿ Professional, Business, and Scientific Services (38%)
¿ Finance and Insurance Services (28%)
¿ Healthcare and Social Assistance (24%)
¿ Educational Services (8%)
¿ Government (9%)
¿ Nonprofits (5%)
¿ Manufacturing (-6%)
BLS employment figures corroborate the survey results showing weakness in Manufacturing, a loss of about 17,000 jobs in August alone. Oil extraction and processing companies are cutting back severely. Job opportunities for Bachelor’s degrees in Mining and Oil are down 47 percent. Petroleum subsectors in Manufacturing are also reporting similar reductions in hiring plans. Some companies reported they that they will not actively participate in college recruiting this year. Added to national pressures in Manufacturing, the sector is also being hampered by the global economic slowdown; for example, primary metals, which relies heavily on exports, has lost about 4,500 jobs since August, 2014.
Certain subsectors are showing particularly strong growth:
¿ Welcome back, Construction. Construction hiring almost disappeared after the recession. Today construction companies are eagerly seeking new college graduates.
¿ Pre-K and K-12 education awakened last year after years of dismal hiring outlooks. This year districts are displaying the highest level of confidence in hiring in more than a decade. Positive growth in traditional Educational Services coupled with ancillary services (alternative learning environments, on-line content development, and tutoring) are transforming this industry into the most dynamic among the 19 sectors.
¿ Financial and Insurance Services are keeping this banking sector hot, even while banks are shrinking their employment base.
¿ Aerospace, automotive, truck, and defense related industries are showing strength in Manufacturing, as are computer and electronic products, electrical equipment, and surgical equipment.
¿ Truck transportation leads a strong Transportation sector in which air transportation is recovering and retirements are pushing other sectors such as rail transportation to hire.
¿ Internet services are almost single-handedly moving Information Services forward; publishing, broadcasting (contractions in the cable industry) and motion pictures are hiring fewer employees or none at all.
¿ Accounting (CPA firms) and computer services are giving Professional, Business, and Scientific Services a strong one-two punch. Engineering services are growing but more slowly than the previous two years.
¿ For another dependable subsector of Professional, Business, and Scientific Services, Advertising and Marketing responses fell off sharply. BLS Table B1a shows that this subsector grew strongly from August 2014 to August 2015; while survey responses are showing an increase of 12 percent this year, more responses in this category would smooth our analysis.
¿ Nonprofits, which have been the mainstay of college hiring for much of the past 15 years, are still moving ahead but much more slowly this year. With all the other sectors shifting into higher gear, nonprofits are facing more competition for attracting talent.
The following tables provide the best information we have on sector and subsector hiring for 2015-16. The number of responses in some categories meets the minimum for reporting purposes. This information should serve as a guide. Readers are encouraged to compare these numbers with organizations in their region to confirm hiring projections.
Administrative Services (office administration, employment services, and business support services)
Degree
Number of hires Change year over year
(%)2014-15
(avg.)2015-16
(avg.)Associate’s 13.6 18.5 35
Bachelor’s 30.4 42.5 40
MBA 9.6 13.7 42
Agriculture (agricultural production, agricultural support services, and forestry)
Degree
Number of hires Change year over year
(%)2014-15
(avg.)2015-16
(avg.)Associate’s 23.5 28.4 21
Bachelor’s 29.0 30.2 4
Accommodations (Hospitality) (hotels, full service food establishments, and limited service food providers)
Degree
Number of hires Change year over year
(%)2014-15 (avg.)2015-16
(avg.)Associate’s 7.9 12.6 60
Bachelor’s 12.4 14.8 20
MBA 1.4 1.9 35
2Recruiting Trends 2015-16
Brief 2: Hiring by Industry and Region
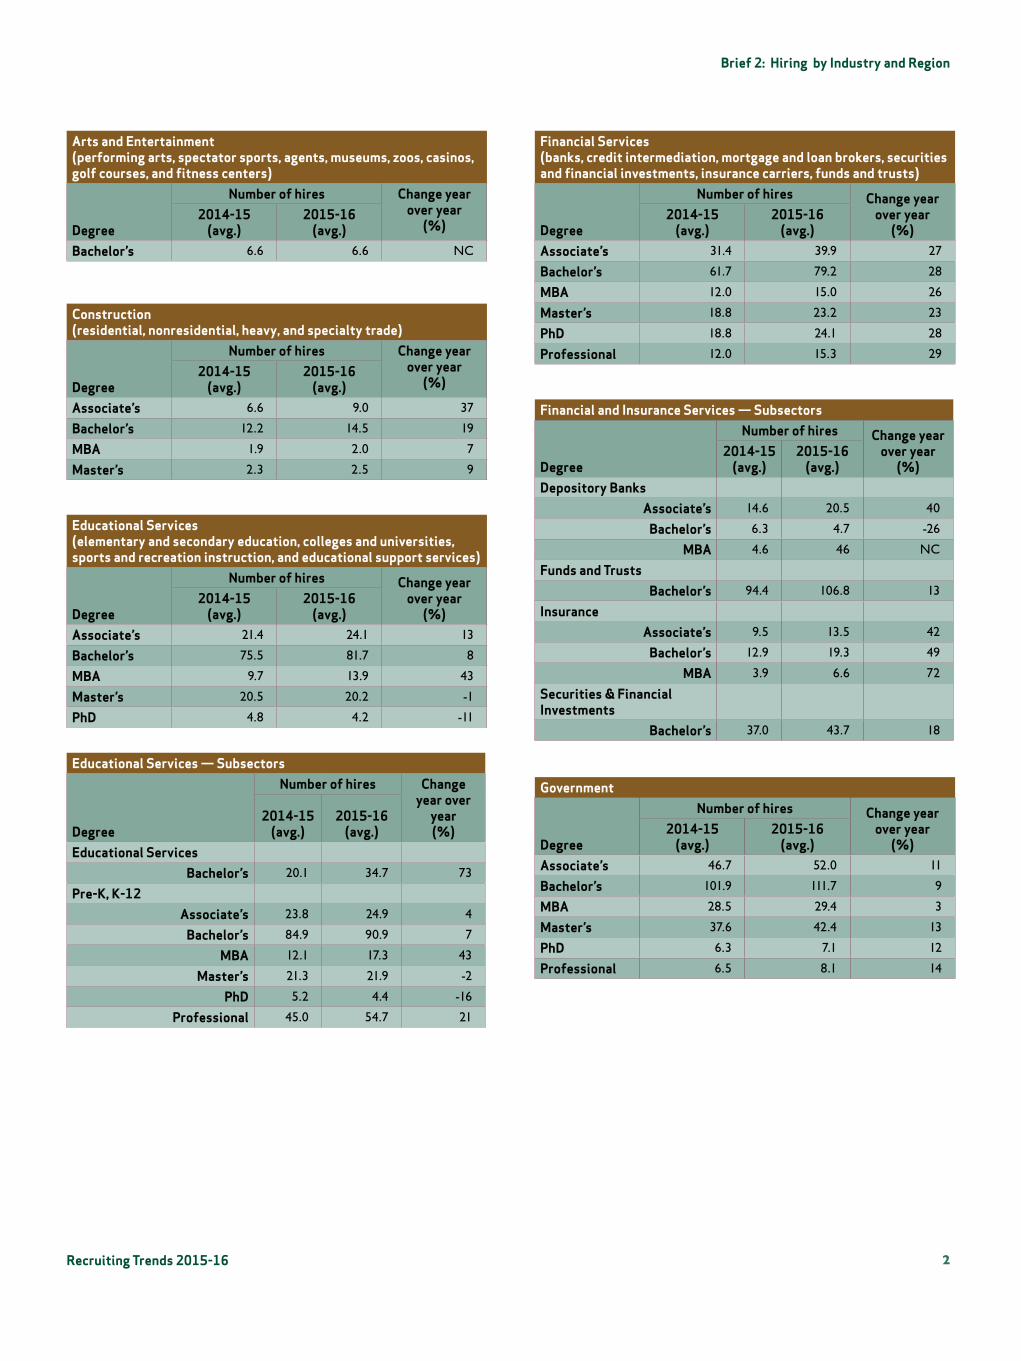
Arts and Entertainment (performing arts, spectator sports, agents, museums, zoos, casinos, golf courses, and fitness centers)
Degree
Number of hires Change year over year
(%)2014-15
(avg.)2015-16
(avg.)Bachelor’s 6.6 6.6 NC
Construction (residential, nonresidential, heavy, and specialty trade)
Degree
Number of hires Change year over year
(%)2014-15
(avg.)2015-16
(avg.)Associate’s 6.6 9.0 37
Bachelor’s 12.2 14.5 19
MBA 1.9 2.0 7
Master’s 2.3 2.5 9
Educational Services (elementary and secondary education, colleges and universities, sports and recreation instruction, and educational support services)
Degree
Number of hires Change year over year
(%)2014-15
(avg.)2015-16
(avg.)Associate’s 21.4 24.1 13
Bachelor’s 75.5 81.7 8
MBA 9.7 13.9 43
Master’s 20.5 20.2 -1
PhD 4.8 4.2 -11
Educational Services — Subsectors
Degree
Number of hires Change year over
year (%)
2014-15 (avg.)
2015-16 (avg.)
Educational ServicesBachelor’s 20.1 34.7 73
Pre-K, K-12Associate’s 23.8 24.9 4
Bachelor’s 84.9 90.9 7
MBA 12.1 17.3 43
Master’s 21.3 21.9 -2
PhD 5.2 4.4 -16
Professional 45.0 54.7 21
Financial Services (banks, credit intermediation, mortgage and loan brokers, securities and financial investments, insurance carriers, funds and trusts)
Degree
Number of hires Change year over year
(%)2014-15
(avg.)2015-16
(avg.)Associate’s 31.4 39.9 27
Bachelor’s 61.7 79.2 28
MBA 12.0 15.0 26
Master’s 18.8 23.2 23
PhD 18.8 24.1 28
Professional 12.0 15.3 29
Government
Degree
Number of hires Change year over year
(%)2014-15
(avg.)2015-16
(avg.)Associate’s 46.7 52.0 11
Bachelor’s 101.9 111.7 9
MBA 28.5 29.4 3
Master’s 37.6 42.4 13
PhD 6.3 7.1 12
Professional 6.5 8.1 14
Financial and Insurance Services — Subsectors
Degree
Number of hires Change year over year
(%)2014-15
(avg.)2015-16
(avg.)Depository Banks
Associate’s 14.6 20.5 40
Bachelor’s 6.3 4.7 -26
MBA 4.6 46 NC
Funds and TrustsBachelor’s 94.4 106.8 13
InsuranceAssociate’s 9.5 13.5 42
Bachelor’s 12.9 19.3 49
MBA 3.9 6.6 72
Securities & Financial Investments
Bachelor’s 37.0 43.7 18
3Recruiting Trends 2015-16
Brief 2: Hiring by Industry and Region
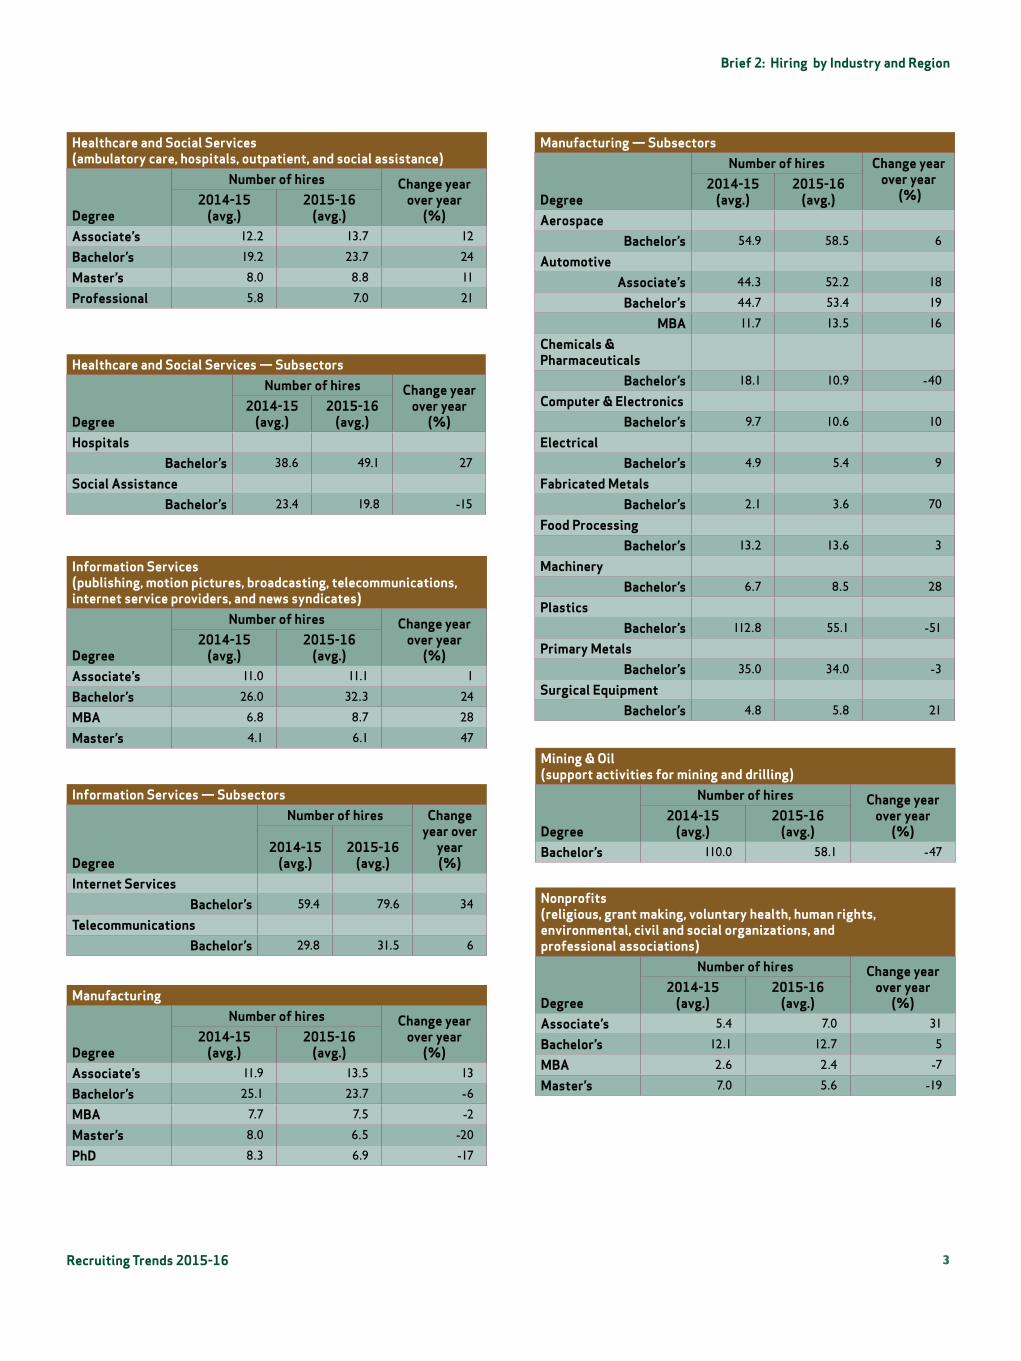
Healthcare and Social Services (ambulatory care, hospitals, outpatient, and social assistance)
Degree
Number of hires Change year over year
(%)2014-15
(avg.)2015-16
(avg.)Associate’s 12.2 13.7 12
Bachelor’s 19.2 23.7 24
Master’s 8.0 8.8 11
Professional 5.8 7.0 21
Healthcare and Social Services — Subsectors
Degree
Number of hires Change year over year
(%)2014-15
(avg.)2015-16
(avg.)Hospitals
Bachelor’s 38.6 49.1 27
Social AssistanceBachelor’s 23.4 19.8 -15
Information Services (publishing, motion pictures, broadcasting, telecommunications, internet service providers, and news syndicates)
Degree
Number of hires Change year over year
(%)2014-15
(avg.)2015-16
(avg.)Associate’s 11.0 11.1 1
Bachelor’s 26.0 32.3 24
MBA 6.8 8.7 28
Master’s 4.1 6.1 47
Information Services — Subsectors
Degree
Number of hires Change year over
year (%)
2014-15 (avg.)
2015-16 (avg.)
Internet ServicesBachelor’s 59.4 79.6 34
TelecommunicationsBachelor’s 29.8 31.5 6
Manufacturing
Degree
Number of hires Change year over year
(%)2014-15
(avg.)2015-16
(avg.)Associate’s 11.9 13.5 13
Bachelor’s 25.1 23.7 -6
MBA 7.7 7.5 -2
Master’s 8.0 6.5 -20
PhD 8.3 6.9 -17
Manufacturing — Subsectors
Degree
Number of hires Change year over year
(%)2014-15
(avg.)2015-16
(avg.)Aerospace
Bachelor’s 54.9 58.5 6
AutomotiveAssociate’s 44.3 52.2 18
Bachelor’s 44.7 53.4 19
MBA 11.7 13.5 16
Chemicals & Pharmaceuticals
Bachelor’s 18.1 10.9 -40
Computer & ElectronicsBachelor’s 9.7 10.6 10
ElectricalBachelor’s 4.9 5.4 9
Fabricated MetalsBachelor’s 2.1 3.6 70
Food ProcessingBachelor’s 13.2 13.6 3
MachineryBachelor’s 6.7 8.5 28
PlasticsBachelor’s 112.8 55.1 -51
Primary MetalsBachelor’s 35.0 34.0 -3
Surgical EquipmentBachelor’s 4.8 5.8 21
Mining & Oil (support activities for mining and drilling)
Degree
Number of hires Change year over year
(%)2014-15
(avg.)2015-16
(avg.)Bachelor’s 110.0 58.1 -47
Nonprofits (religious, grant making, voluntary health, human rights, environmental, civil and social organizations, and professional associations)
Degree
Number of hires Change year over year
(%)2014-15
(avg.)2015-16
(avg.)Associate’s 5.4 7.0 31
Bachelor’s 12.1 12.7 5
MBA 2.6 2.4 -7
Master’s 7.0 5.6 -19
4Recruiting Trends 2015-16
Brief 2: Hiring by Industry and Region
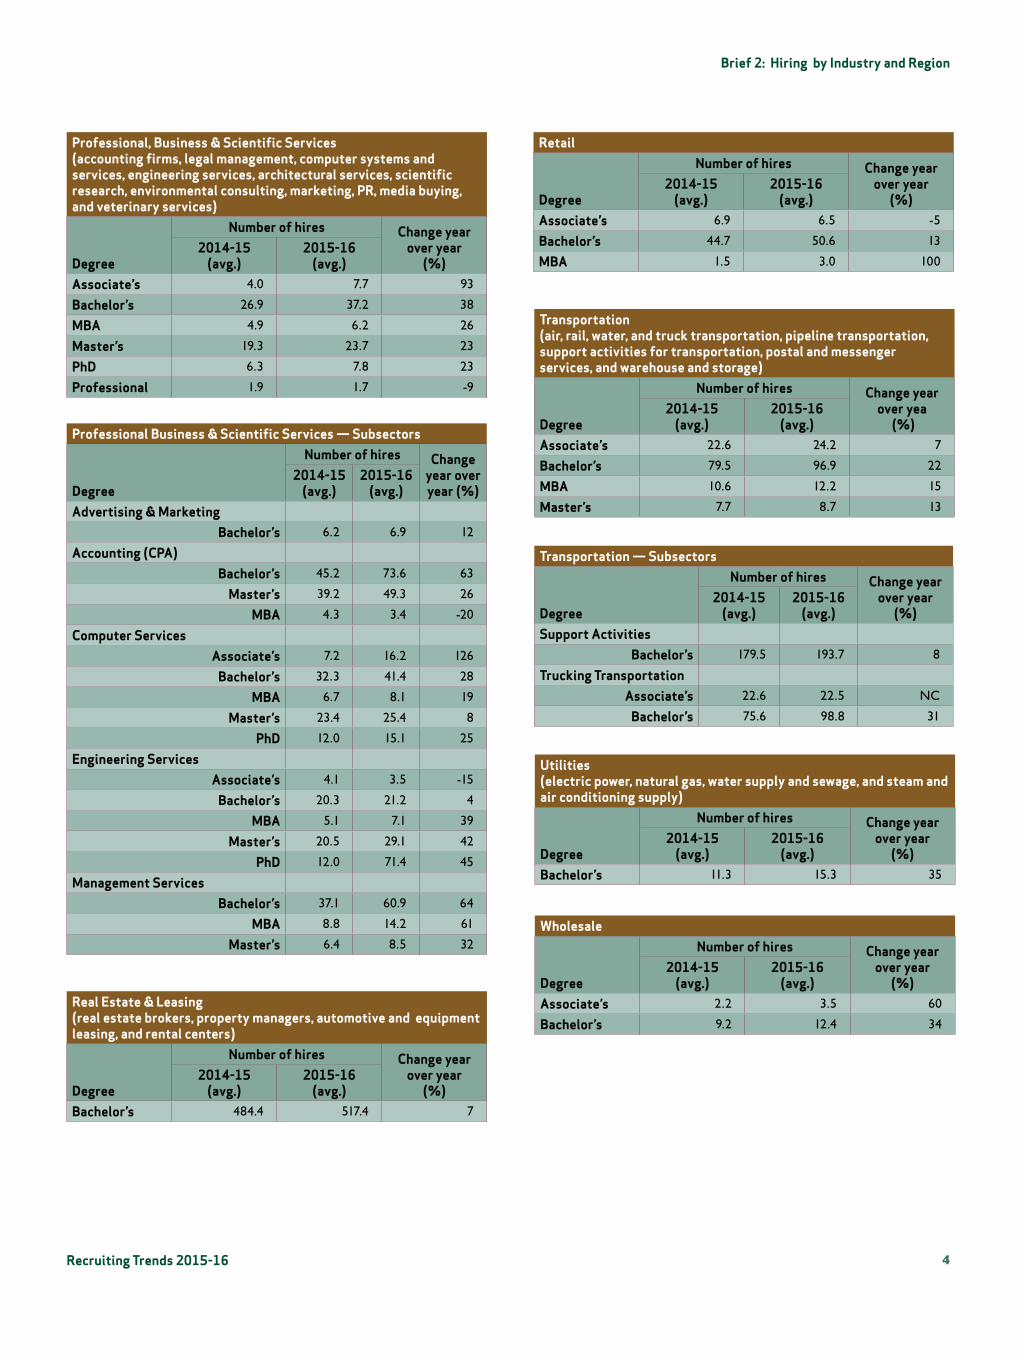
Professional, Business & Scientific Services (accounting firms, legal management, computer systems and services, engineering services, architectural services, scientific research, environmental consulting, marketing, PR, media buying, and veterinary services)
Degree
Number of hires Change year over year
(%)2014-15
(avg.)2015-16
(avg.)Associate’s 4.0 7.7 93
Bachelor’s 26.9 37.2 38
MBA 4.9 6.2 26
Master’s 19.3 23.7 23
PhD 6.3 7.8 23
Professional 1.9 1.7 -9
Professional Business & Scientific Services — Subsectors
Degree
Number of hires Change year over year (%)
2014-15 (avg.)
2015-16 (avg.)
Advertising & MarketingBachelor’s 6.2 6.9 12
Accounting (CPA)Bachelor’s 45.2 73.6 63
Master’s 39.2 49.3 26
MBA 4.3 3.4 -20
Computer ServicesAssociate’s 7.2 16.2 126
Bachelor’s 32.3 41.4 28
MBA 6.7 8.1 19
Master’s 23.4 25.4 8
PhD 12.0 15.1 25
Engineering ServicesAssociate’s 4.1 3.5 -15
Bachelor’s 20.3 21.2 4
MBA 5.1 7.1 39
Master’s 20.5 29.1 42
PhD 12.0 71.4 45
Management ServicesBachelor’s 37.1 60.9 64
MBA 8.8 14.2 61
Master’s 6.4 8.5 32
Real Estate & Leasing (real estate brokers, property managers, automotive and equipment leasing, and rental centers)
Degree
Number of hires Change year over year
(%)2014-15
(avg.)2015-16
(avg.)Bachelor’s 484.4 517.4 7
Retail
Degree
Number of hires Change year over year
(%)2014-15
(avg.)2015-16
(avg.)Associate’s 6.9 6.5 -5
Bachelor’s 44.7 50.6 13
MBA 1.5 3.0 100
Transportation (air, rail, water, and truck transportation, pipeline transportation, support activities for transportation, postal and messenger services, and warehouse and storage)
Degree
Number of hires Change year over yea
(%)2014-15
(avg.)2015-16
(avg.)Associate’s 22.6 24.2 7
Bachelor’s 79.5 96.9 22
MBA 10.6 12.2 15
Master’s 7.7 8.7 13
Transportation — Subsectors
Degree
Number of hires Change year over year
(%)2014-15
(avg.)2015-16
(avg.)Support Activities
Bachelor’s 179.5 193.7 8
Trucking TransportationAssociate’s 22.6 22.5 NC
Bachelor’s 75.6 98.8 31
Utilities (electric power, natural gas, water supply and sewage, and steam and air conditioning supply)
Degree
Number of hires Change year over year
(%)2014-15
(avg.)2015-16
(avg.)Bachelor’s 11.3 15.3 35
Wholesale
Degree
Number of hires Change year over year
(%)2014-15
(avg.)2015-16
(avg.)Associate’s 2.2 3.5 60
Bachelor’s 9.2 12.4 34
5Recruiting Trends 2015-16
Brief 2: Hiring by Industry and Region
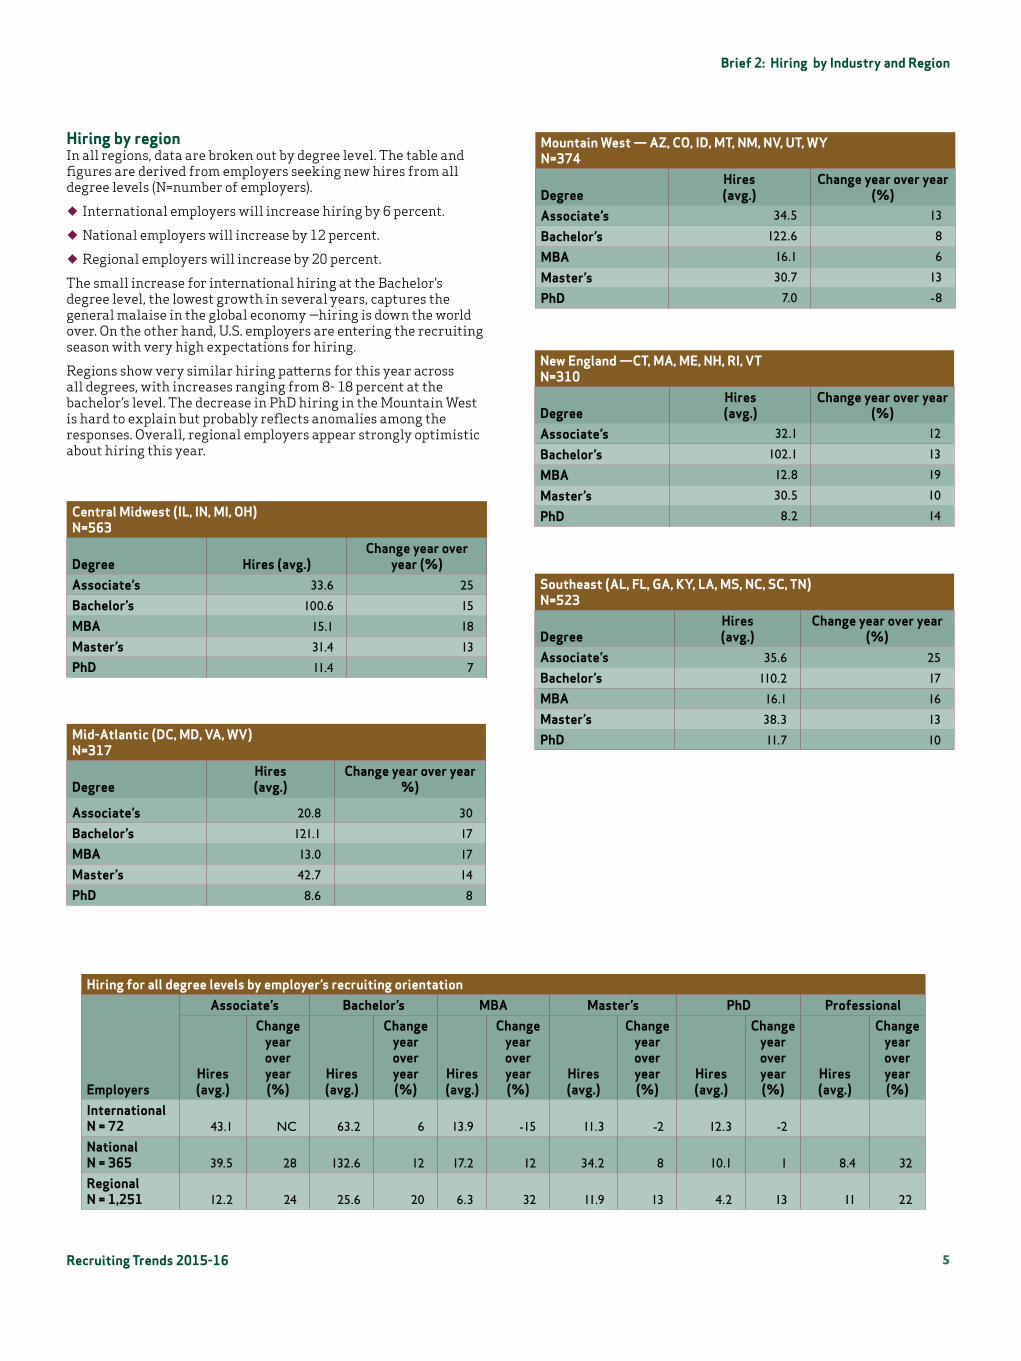
Hiring by region In all regions, data are broken out by degree level. The table and figures are derived from employers seeking new hires from all degree levels (N=number of employers).
¿ International employers will increase hiring by 6 percent.
¿ National employers will increase by 12 percent.
¿ Regional employers will increase by 20 percent.
The small increase for international hiring at the Bachelor’s degree level, the lowest growth in several years, captures the general malaise in the global economy —hiring is down the world over. On the other hand, U.S. employers are entering the recruiting season with very high expectations for hiring.
Regions show very similar hiring patterns for this year across all degrees, with increases ranging from 8- 18 percent at the bachelor’s level. The decrease in PhD hiring in the Mountain West is hard to explain but probably reflects anomalies among the responses. Overall, regional employers appear strongly optimistic about hiring this year.
Central Midwest (IL, IN, MI, OH) N=563
Degree Hires (avg.)Change year over
year (%)Associate’s 33.6 25
Bachelor’s 100.6 15
MBA 15.1 18
Master’s 31.4 13
PhD 11.4 7
Mid-Atlantic (DC, MD, VA, WV) N=317
DegreeHires (avg.)
Change year over year %)
Associate’s 20.8 30
Bachelor’s 121.1 17
MBA 13.0 17
Master’s 42.7 14
PhD 8.6 8
Mountain West — AZ, CO, ID, MT, NM, NV, UT, WY N=374
DegreeHires (avg.)
Change year over year (%)
Associate’s 34.5 13
Bachelor’s 122.6 8
MBA 16.1 6
Master’s 30.7 13
PhD 7.0 -8
Hiring for all degree levels by employer’s recruiting orientation
Employers
Associate’s Bachelor’s MBA Master’s PhD Professional
Hires (avg.)
Change year over year (%)
Hires (avg.)
Change year over year (%)
Hires (avg.)
Change year over year (%)
Hires (avg.)
Change year over year (%)
Hires (avg.)
Change year over year (%)
Hires (avg.)
Change year over year (%)
International N = 72 43.1 NC 63.2 6 13.9 -15 11.3 -2 12.3 -2
National N = 365 39.5 28 132.6 12 17.2 12 34.2 8 10.1 1 8.4 32
Regional N = 1,251 12.2 24 25.6 20 6.3 32 11.9 13 4.2 13 11 22
New England —CT, MA, ME, NH, RI, VT N=310
DegreeHires (avg.)
Change year over year (%)
Associate’s 32.1 12
Bachelor’s 102.1 13
MBA 12.8 19
Master’s 30.5 10
PhD 8.2 14
Southeast (AL, FL, GA, KY, LA, MS, NC, SC, TN) N=523
DegreeHires (avg.)
Change year over year (%)
Associate’s 35.6 25
Bachelor’s 110.2 17
MBA 16.1 16
Master’s 38.3 13
PhD 11.7 10
6Recruiting Trends 2015-16
Brief 2: Hiring by Industry and Region
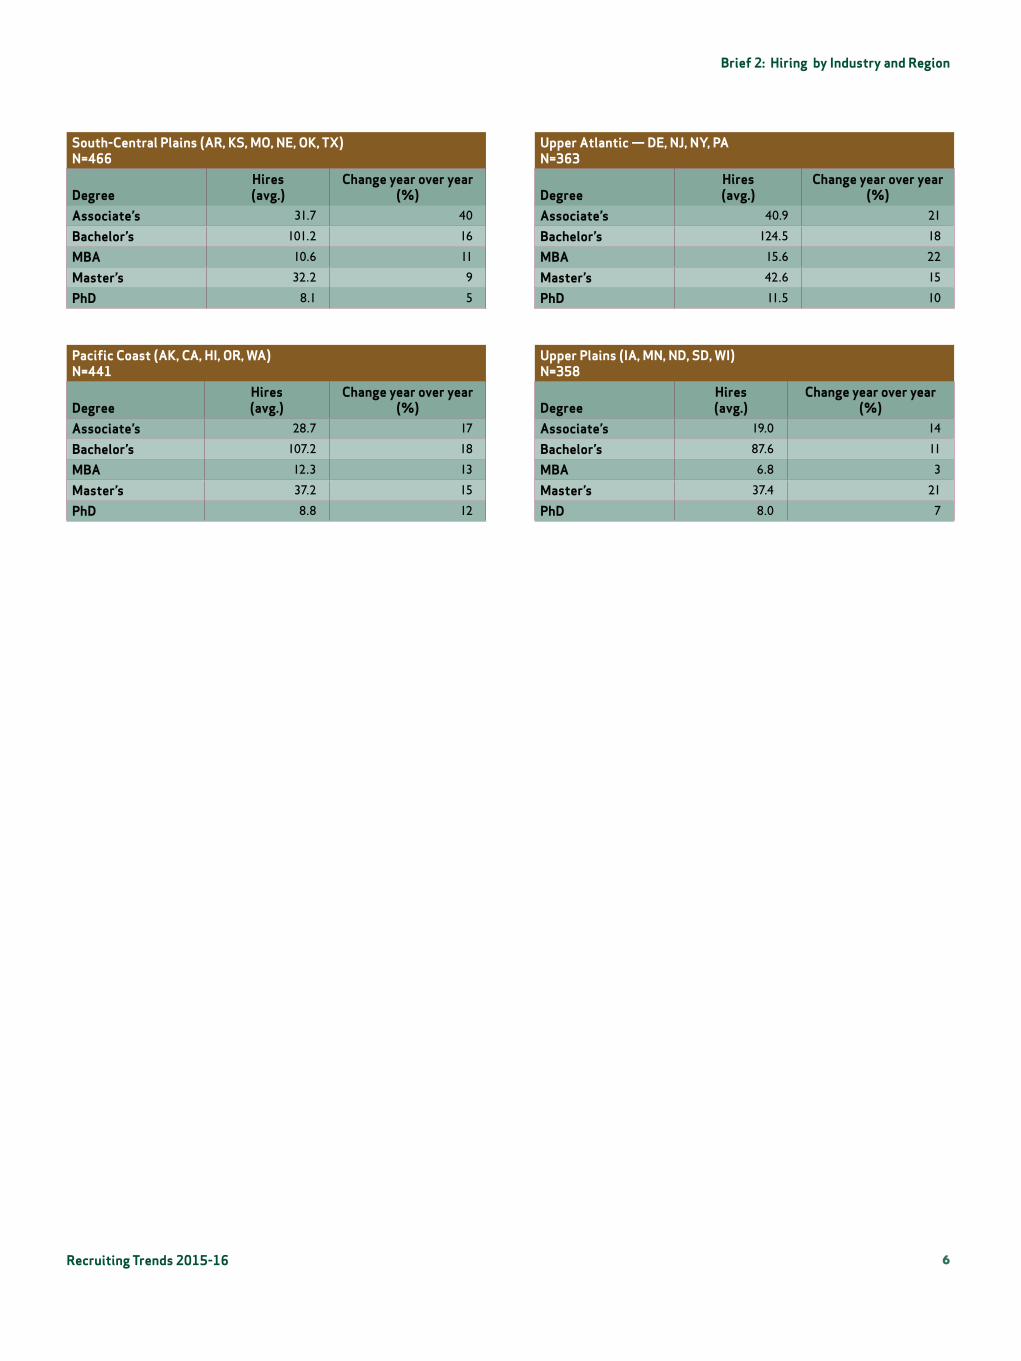
Upper Atlantic — DE, NJ, NY, PA N=363
DegreeHires (avg.)
Change year over year (%)
Associate’s 40.9 21
Bachelor’s 124.5 18
MBA 15.6 22
Master’s 42.6 15
PhD 11.5 10
Upper Plains (IA, MN, ND, SD, WI) N=358
DegreeHires (avg.)
Change year over year (%)
Associate’s 19.0 14
Bachelor’s 87.6 11
MBA 6.8 3
Master’s 37.4 21
PhD 8.0 7
South-Central Plains (AR, KS, MO, NE, OK, TX) N=466
DegreeHires (avg.)
Change year over year (%)
Associate’s 31.7 40
Bachelor’s 101.2 16
MBA 10.6 11
Master’s 32.2 9
PhD 8.1 5
Pacific Coast (AK, CA, HI, OR, WA) N=441
DegreeHires (avg.)
Change year over year (%)
Associate’s 28.7 17
Bachelor’s 107.2 18
MBA 12.3 13
Master’s 37.2 15
PhD 8.8 12