Embed Size (px)
Citation preview
INTERNATIONAL JOURNAL OF CLIMATOLOGYInt. J. Climatol. 32: 261–273 (2012)Published online 7 December 2010 in Wiley Online Library(wileyonlinelibrary.com) DOI: 10.1002/joc.2266
Recurrent daily rainfall patterns over South Africaand associated dynamics during the core
of the austral summer
Julien Cretat,a* Yves Richard,a Benjamin Pohl,a Mathieu Rouault,b Chris Reasonb
and Nicolas Fauchereauc
a Centre de Recherches de Climatologie, CNRS UMR 5210/Universite de Bourgogne, Dijon, Franceb Department of Oceanography, University of Cape Town, Cape Town, South Africa
c CSIR/NRE, Ocean Systems and Climate, CHPC, Rosebank, South Africa
ABSTRACT: This paper investigates the influence of some modes of climate variability on the spatio-temporal rainfallvariability over South Africa during the core of the rainy season, December to February (DJF). All analyses are baseddirectly on the rainfall field instead of atmospheric processes and dynamics. An original agglomerative hierarchicalclustering approach is used to classify daily rainfall patterns recorded at 5352 stations from DJF 1971 to DJF 1999.Five clusters are retained for analysis. Amongst them, one cluster looks most like the rainfall and circulation mean picture.Another one, representing 37% of the days, describes strong negative rainfall anomalies over South Africa resulting from aregional barotropic trough-ridge-trough wave structure and moisture divergence. These dry anomalies are more frequent inEl Nino years (with a 0.75 correlation between ENSO and the seasonal occurrences of that cluster) and are associated witha weakening and/or a regional shift of the Walker-type circulation and the subtropical jet stream. Three clusters, whichdescribe, respectively, a decrease, an increase, and a conservation of the seasonal mean eastward rainfall gradient, are allassociated with strong cyclonic moisture flux anomalies centred over Angola or northern Botswana and the anomalousconvergence located over the largest positive rainfall anomalies, suggesting the importance of thermal low pressures. Oneof them is clearly associated with tropical temperate troughs. The rainfall patterns of these three clusters tend to propagateeastward, and their seasonal frequencies tend to increase in La Nina years. Copyright 2010 Royal Meteorological Society
KEY WORDS atmospheric dynamics; daily rainfall patterns; ENSO; hierarchical clustering; South Africa
Received 10 November 2009; Revised 19 October 2010; Accepted 25 October 2010
1. Introduction
Southern Africa (SA), south of 15 °S, is a semi-aridregion mainly experiencing its larger rainfall amountsin austral summer between November and February.Because of the predominance of rain-fed agricultureover SA, large departures from the average seasonalcycle (either floods or droughts) may have detrimentaleffects on the economies and societies of the region. Thesouthern African rainfall field is known to show strongspatio-temporal variability at different scales, materialis-ing the influence of distinct rain-bearing processes thatthemselves depend on various modes of atmosphericvariability.
At the global scale, El Nino Southern Oscillation(ENSO) (Lindesay, 1988; Jury et al., 1994; Reason et al.,2000; Reason and Rouault, 2002; Rouault and Richard,2003, 2005) is known to impact South African rain-fall variability, especially since the late 1970s (Richardet al., 2000, 2001). As ENSO signal is phase locked to
* Correspondence to: Julien Cretat, Centre de Recherches de Clima-tologie, UMR 5210 CNRS/Universite de Bourgogne, 6 Bd Gabriel,21000 Dijon, France. E-mail: [email protected]
the annual cycle over most parts of SA (e.g. Camberlinet al., 2001), the peak of ENSO-associated atmospheric,oceanic, and rainfall anomalies typically occurs in aus-tral summer (Nicholson and Selato, 2000; Reason et al.,2000), i.e. the main rainy season over the region. In tropi-cal SA, wet (dry) conditions tend to prevail in La Nina (ElNino) years during austral summer. Nevertheless, corre-lations values remain generally weak (typically 0.4–0.5)and some El Nino years, like the strong 1997–1998event, are not accompanied by particularly dry conditions.
At a more regional scale, interannual rainfall fluctua-tions were also shown to be modulated by the Sea SurfaceTemperature (SST) variations in the south Atlantic andsouth Indian Oceans (Mason, 1995; Reason and Mulenga,1999; Reason, 2001, 2002; Rouault et al., 2003). SouthAtlantic SST partially influence moisture fluxes betweenthe south Atlantic Ocean and SA (Vigaud et al., 2007,2009). The Indian Ocean is known to be the majorsource of moisture for SA (Jury et al., 1996; Reason,2001, 2002; Rouault et al., 2003; Washington and Pre-ston, 2006). For instance, positive SST anomalies inthe southwest Indian Ocean are known to be associatedwith wetter conditions over eastern and central South
Copyright 2010 Royal Meteorological Society
262 J. CRETAT et al.
Africa (Reason, 2001, 2002; Washington and Preston,2006).
The high-frequency variability of South African rain-fall is mainly related to the so-called tropical-temperatetroughs (TTT), corresponding to synoptic-scale cloudbands that link a tropical disturbance over the sub-continent (typically, a lower-layer easterly wave) withan upper-tropospheric frontal system embedded in themid-latitude westerly circulation (Washington and Todd,1999; Todd and Washington, 1999; Todd et al., 2004;Hart et al., 2010). Although about 30–60% of summerrainfall over subtropical SA results from such TTT sys-tems, the factors influencing the rainfall spatial and tem-poral variability are very complex and still largely matterof debate. The remaining 40–70% of the summer rain-fall amounts are provided by rain-bearing mechanismsmainly linked with tropical convection (Harrison, 1984a,1984b), such as regional thermal low pressures (Tysonand Preston-Whyte, 2000; Reason et al., 2006) or theMadden-Julian Oscillation (MJO) (Pohl et al., 2007), butthese mechanisms remain poorly misunderstood.
Recently, Fauchereau et al. (2009, hereafter F09) andPohl et al. (2009, hereafter P09) investigated the inter-actions between TTT systems, the MJO and ENSO, byapplying clustering analyses on daily Outgoing Long-wave Radiation (OLR), a proxy for deep atmosphericconvection. They showed that (1) TTT events are themain rain-bearing system in austral summer and tend topropagate eastwards with time, and (2) MJO activity inthe tropics does not influence their probability of occur-rence. They also confirmed the relative weakness of linearcorrelations between usual ENSO descriptors and SouthAfrican rainfall, suggesting the implication of non-linearprocesses.
The respective influence of all these mechanisms on therainfall spatio-temporal variability remains to be assessedand quantified. This paper contributes to investigate thisissue, by using a method based on the analysis of the dailyspatial distributions of South African summer rainfallinstead of atmospheric processes and dynamics. Our goalhere is to verify whether a clustering technique appliedto a relatively dense network of daily rain-gauge recordsallows us to detect the recurrent gradients linked withthe main modes of South African climate variability, andto quantify them. To that end, an objective hierarchicalclustering technique is applied to daily rainfall amountsrecorded in a network covering the southern part of SAfor the 1971–1999 period.
The paper is organised as follows. Section 2 presentsthe data and methodology used in this study. Sections3 and 4 describe, respectively, the detected anomalousrainfall patterns, their persistence and evolution, and theassociated atmospheric dynamics at regional and near-global scales. Section 5 investigates the teleconnectionsbetween the interannual frequency of the rainfall patternsand SST patterns. Section 6 contains the summary anddiscussion.
2. Data and method
2.1. Daily rain-gauge records
Daily rainfall amounts are provided at high resolu-tion by the rain-gauge records compiled in the WaterResearch Commission database by Lynch (2003). Wehave extracted the 5352 stations receiving at least 40% ofthe annual rainfall during the DJF season from the total of7665 stations already used in Pohl et al. (2007). Thus, weonly focus on the summer rainfall regions because thisempirical threshold excludes the winter rainfall (west-ern Cape region of South Africa) or the all-year longrainfall (south coast of South Africa) regions. Over the1971–1999 DJF period, there are 29 summer (DJF) sea-sons representing 2610 days, without missing values. Wehave also excluded each 29th of February.
2.2. Atmospheric dynamics
We make use of the 12-hourly (00 UTC and 12UTC) ERA-40 reanalyses (Uppala et al., 2005) for the1971–1999 DJF period to describe the atmospheric circu-lation associated with the recurrent rainfall patterns. Theyare provided by the European Center for Medium-RangeWeather Forecasts (ECMWF) on a 2.5° × 2.5° regulargrid.
Within tropical and subtropical areas of southern andcentral Africa, rainfall regimes are largely dependent ondeep convective processes and moisture convergence atdifferent levels of the troposphere. The zonal (U) andmeridional (V) components of the wind and specifichumidity (Q) are used to compute daily moisture fluxes,vertically integrated between 1000 and 200 hPa. Thisproxy effectively captures the moisture transport in theatmosphere. We also compute moisture convergence fromthe integrated zonal and meridional daily moisture fluxes.The 500 hPa vertical velocity (W) describes the approxi-mate centre of mass of the troposphere and allows foran insight into large-scale vertical motion within thewhole troposphere, indicative of deep convective upwardmotion.
At the near-global scale, we examine the large-scalecomponents of the rotational and divergent 850 and200 hPa wind, depicted by the stream function (�)and velocity potential (�). These fields are respectivelydefined as ∇2� = ∇ × ν and ∇2� = ∇ × ν, where ν isthe two-dimensional wind vector (U and V). These fieldsare used to describe the large-scale circulations such asthe zonal Walker circulation in the tropics and the Hadleycell.
2.3. ENSO index and sea surface temperature
The Multivariate ENSO Index (MEI: Wolter and Timlin,1993) is used to measure the relationship between theinterannual frequency of each cluster and ENSO. Thisindex is provided by the Climate Diagnostic Center,and is available at the bimonthly timescale. As it isbased on both atmospheric and oceanic fields, it isparticularly suitable to describe the coupled nature of
Copyright 2010 Royal Meteorological Society Int. J. Climatol. 32: 261–273 (2012)
RECURRENT RAINFALL PATTERNS OVER SOUTH AFRICA 263
the ENSO phenomenon. In order to evaluate to whatextent the results are sensitive to the choice of the ENSOdescriptors, we correlate the MEI with more traditionalindices, such as the Southern Oscillation index and theNino3.4 index. Interannual DJF correlation coefficientsreach –0.93 and 0.98, respectively, indicating moderateuncertainties associated with this parameter. These smalldifferences could be partly explained by the presence ofpositive trends in SST indices, like Nino3.4, while noneis significant for atmospheric indices, such as the SOI.
Monthly SST provided by the United Kingdom Meteo-rological Office (HadISST: Rayner et al., 2003) are usedto document the background climate conditions favour-ing the seasonal occurrences of the successive rainfallpatterns. They are available on a 1° × 1° regular grid.
2.4. Clustering technique applied on daily rain-gaugerecords
The agglomerative hierarchical clustering (AHC) hasbeen successfully employed with rainfall data (e.g.Ramos, 2001; Tennant and Hewitson, 2002; Munoz-Diazand Rodrigo, 2004, 2006). Here, we use the AHC to clas-sify the raw daily rainfall patterns over the Republic ofSouth Africa as well as neighbouring Lesotho, Swazilandand southern Namibia. This procedure creates a nestedsequence of partitions of the patterns from a dissimi-larity matrix, and proceeds by series of fusions of then objects (the 2610 days here) into groups (Gong andRichman, 1995). The AHC produces a series of partitionsof the data, Pn, Pn−1, . . . , P1. In this study, Pn consistsof 2610 single object clusters, and P1 consists of a sin-gle group containing the 2610 days. At each stage, theAHC regroups the two clusters that are closest accord-ing to a Euclidean distance metrics. Consider a matrix X
containing 2610 days × 5352 rainfall stations, with daysdescribing the time dimension (observations) and rainfallstations describing the space dimension (variables), thenthe Euclidean distance between entities Xday1 and Xday2
is given by:
dday1,day2 =5352∑
sta=1
[(Xday1 − Xday2)′(Xday1 − Xday2)]
1/2.
(1)
For merging two clusters including more than one day, ora cluster of one day with a cluster including more thanone day, we use Ward’s method (Ward, 1963) becauseit minimises the within-group variance at each stage ofmerging and optimises an objective statistic. At each step,the intra-cluster sum of squares is minimised over allpartitions obtainable by merging two clusters from theprevious step. If CK and CL are two clusters that aremerged to form cluster CM , the combinatorial formulathat defines the distance between the new cluster andanother cluster CJ is:
dJ,M = (nJ + nK)dJK + (nJ + nL)dJL − nJ dKL
nJ + nM
, (2)
where nJ , nK , nL and nM are the number of objectsin clusters J , K , L and M , and dJK , dJL, dKL are thedistances between JK, JL and KL, respectively (Ramos,2001). Thus, Ward’s algorithm can be implementedthrough updating a stored Euclidean distance betweencluster centroids.
To sum up, the AHC procedure enables us to obtainpartitions of rainfall patterns based on objective distancecomputations. Anomalous rainfall (dynamic) patternsare computed by subtracting the mean seasonal rainfall(dynamic) field from cluster averages.
3. Results of the daily rainfall rain-gauge clustering
3.1. Description of the clusters
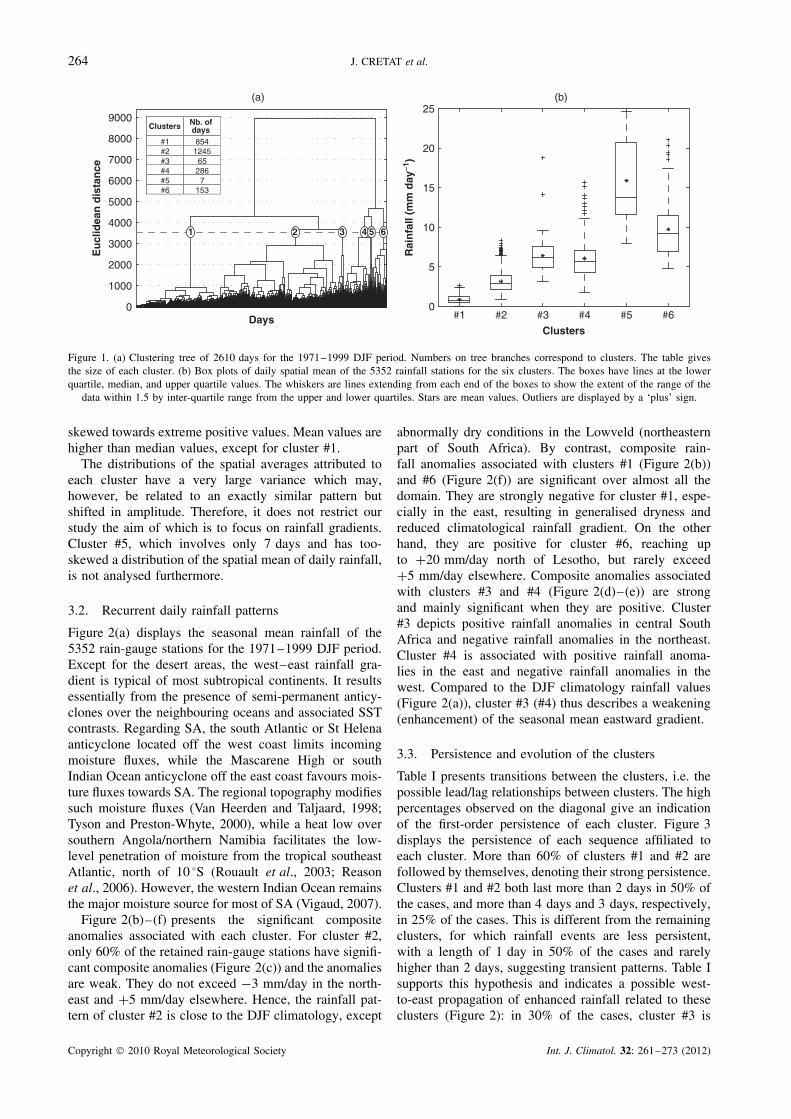
At the end of the AHC procedure, i.e. once the 2610 daysare regrouped into a single cluster, the number of clustersis subjectively chosen according to a clustering tree,also known as dendrogram (Figure 1(a)). A clusteringtree illustrates the fusions made at each successive stageof the partitioning. To limit intra-cluster heterogeneity,one needs to choose the number of clusters just beforethe distance between merged clusters increases strongly.Basing on Figure 1(a), we choose here to retain sixclusters. In order to validate their spatial and temporalrobustness, we applied the AHC method to 40, 50 and60% of the 5352 rain-gauge stations, randomly chosenand on the entire period. We also applied the AHC toall rain-gauge stations for the separated 1971–1984 and1985–1999 periods. It appears that the number of daysspent in cluster #2 varies noticeably compared to theother clusters, while cluster #1 is almost stationary. Therainfall patterns associated with the six clusters appears,nonetheless, to be relatively stable, which indicates arelatively high robustness.
The 2610 days are distributed unequally within thesix clusters (Figure 1(a)). This seems in accordance withthe temporal rainfall distribution of semi-arid regionswhere dry or light rainfall days predominate. For ourpurposes, this is an advantage of the AHC comparedto non-hierarchical clustering techniques such as the k-means algorithm which tends to generate equiprobableclusters.
Before analysing the rainfall patterns, we briefly com-pare the six clusters by examining their internal hetero-geneity. To this end, we compute the spatial average ofeach day spent in each cluster (Figure 1(b)). For cluster#1 (the most robust cluster in terms of sensitivity to thepartitioning), 80% of the 2610 days are rather dry with anaverage of 0.86 mm/day, versus 3.16 mm/day for cluster#2 (the most sensitive cluster). Other clusters are wetter.Rainfall averages reach 6 mm/day for clusters #3 and #4,19 mm/day for cluster #5 and 9 mm/day for cluster #6.Due to spatial averaging, there are few days without rain-fall (observed rarely in cluster #1) and extreme rainfallevents are smoothed (the maximum value does not exceed25 mm/day; cluster #5). Figure 1(b) also shows that thespatial averages have non-Gaussian distributions and are
Copyright 2010 Royal Meteorological Society Int. J. Climatol. 32: 261–273 (2012)
264 J. CRETAT et al.
#1 8541245
65286
7153
Clusters Nb. ofdays
#2#3#4#5#6
DaysClusters
0 0
5
10
15
20
25
1000
2000
3000
4000
5000
6000
7000
8000
9000
Eu
clid
ean
dis
tan
ce
Rai
nfa
ll (m
m d
ay−1
)
(a) (b)
1 2 3 4 5 6
#1 #2 #3 #4 #5 #6
Figure 1. (a) Clustering tree of 2610 days for the 1971–1999 DJF period. Numbers on tree branches correspond to clusters. The table givesthe size of each cluster. (b) Box plots of daily spatial mean of the 5352 rainfall stations for the six clusters. The boxes have lines at the lowerquartile, median, and upper quartile values. The whiskers are lines extending from each end of the boxes to show the extent of the range of the
data within 1.5 by inter-quartile range from the upper and lower quartiles. Stars are mean values. Outliers are displayed by a ‘plus’ sign.
skewed towards extreme positive values. Mean values arehigher than median values, except for cluster #1.
The distributions of the spatial averages attributed toeach cluster have a very large variance which may,however, be related to an exactly similar pattern butshifted in amplitude. Therefore, it does not restrict ourstudy the aim of which is to focus on rainfall gradients.Cluster #5, which involves only 7 days and has too-skewed a distribution of the spatial mean of daily rainfall,is not analysed furthermore.
3.2. Recurrent daily rainfall patterns
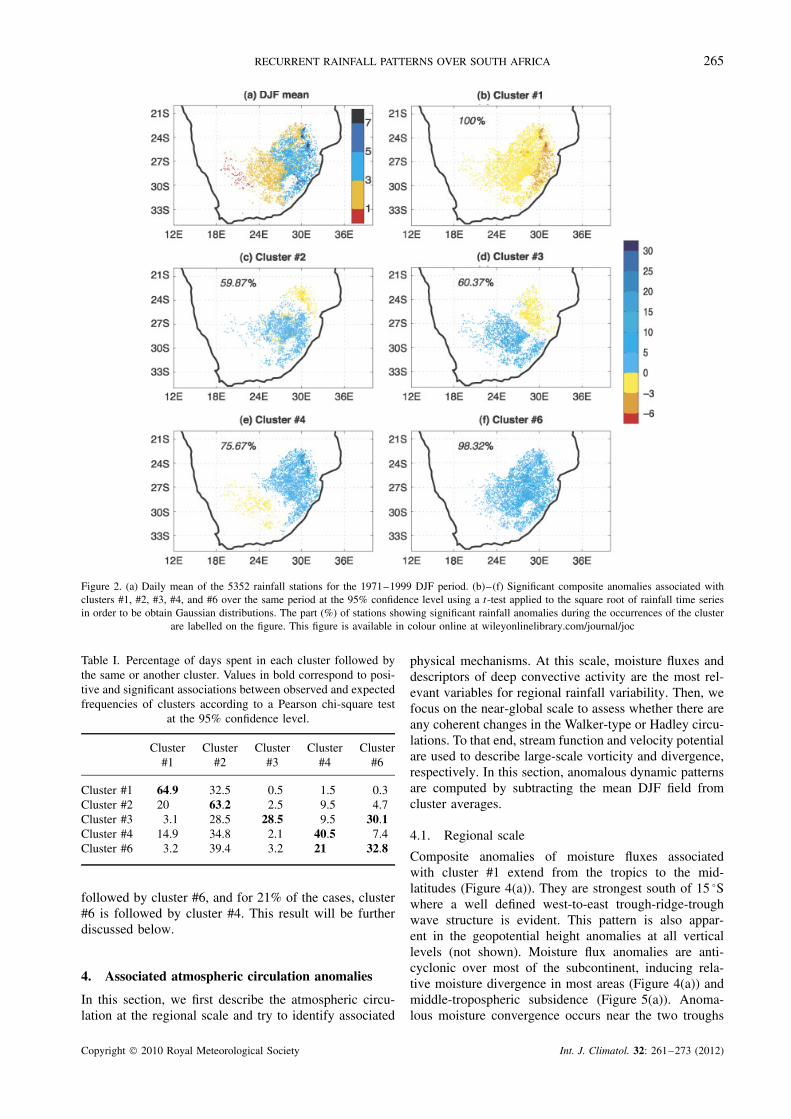
Figure 2(a) displays the seasonal mean rainfall of the5352 rain-gauge stations for the 1971–1999 DJF period.Except for the desert areas, the west–east rainfall gra-dient is typical of most subtropical continents. It resultsessentially from the presence of semi-permanent anticy-clones over the neighbouring oceans and associated SSTcontrasts. Regarding SA, the south Atlantic or St Helenaanticyclone located off the west coast limits incomingmoisture fluxes, while the Mascarene High or southIndian Ocean anticyclone off the east coast favours mois-ture fluxes towards SA. The regional topography modifiessuch moisture fluxes (Van Heerden and Taljaard, 1998;Tyson and Preston-Whyte, 2000), while a heat low oversouthern Angola/northern Namibia facilitates the low-level penetration of moisture from the tropical southeastAtlantic, north of 10 °S (Rouault et al., 2003; Reasonet al., 2006). However, the western Indian Ocean remainsthe major moisture source for most of SA (Vigaud, 2007).
Figure 2(b)–(f) presents the significant compositeanomalies associated with each cluster. For cluster #2,only 60% of the retained rain-gauge stations have signifi-cant composite anomalies (Figure 2(c)) and the anomaliesare weak. They do not exceed −3 mm/day in the north-east and +5 mm/day elsewhere. Hence, the rainfall pat-tern of cluster #2 is close to the DJF climatology, except
abnormally dry conditions in the Lowveld (northeasternpart of South Africa). By contrast, composite rain-fall anomalies associated with clusters #1 (Figure 2(b))and #6 (Figure 2(f)) are significant over almost all thedomain. They are strongly negative for cluster #1, espe-cially in the east, resulting in generalised dryness andreduced climatological rainfall gradient. On the otherhand, they are positive for cluster #6, reaching upto +20 mm/day north of Lesotho, but rarely exceed+5 mm/day elsewhere. Composite anomalies associatedwith clusters #3 and #4 (Figure 2(d)–(e)) are strongand mainly significant when they are positive. Cluster#3 depicts positive rainfall anomalies in central SouthAfrica and negative rainfall anomalies in the northeast.Cluster #4 is associated with positive rainfall anoma-lies in the east and negative rainfall anomalies in thewest. Compared to the DJF climatology rainfall values(Figure 2(a)), cluster #3 (#4) thus describes a weakening(enhancement) of the seasonal mean eastward gradient.
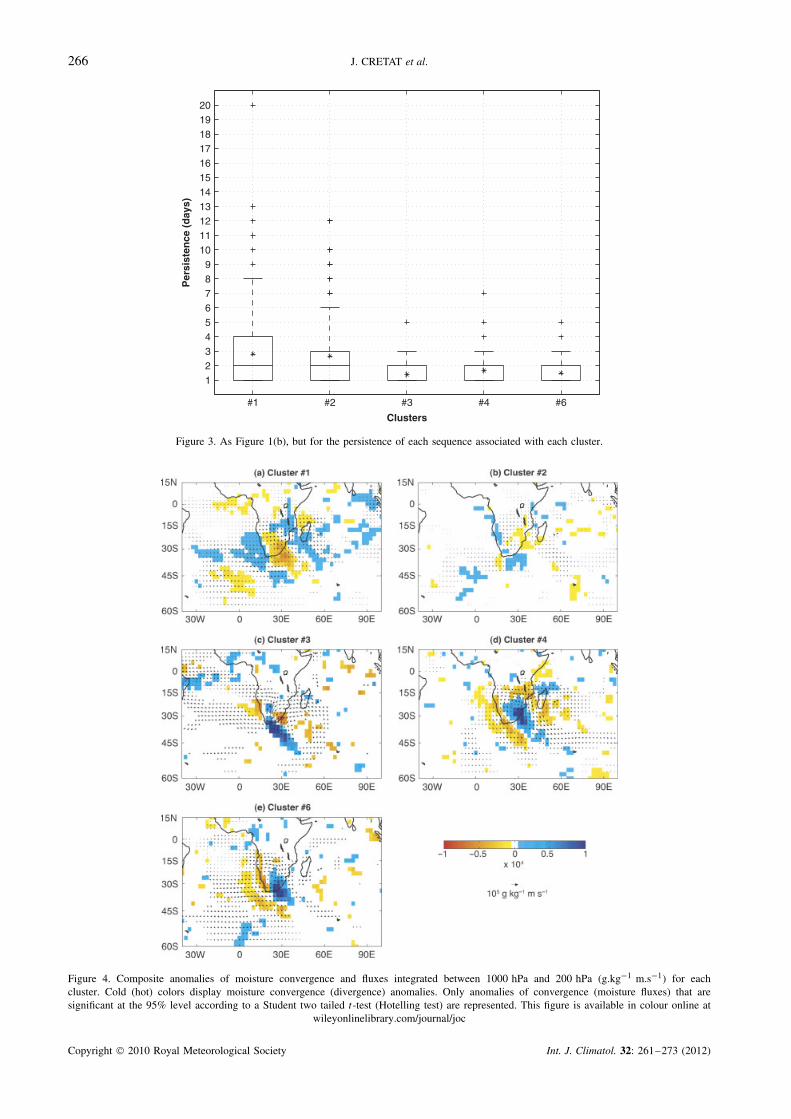
3.3. Persistence and evolution of the clusters
Table I presents transitions between the clusters, i.e. thepossible lead/lag relationships between clusters. The highpercentages observed on the diagonal give an indicationof the first-order persistence of each cluster. Figure 3displays the persistence of each sequence affiliated toeach cluster. More than 60% of clusters #1 and #2 arefollowed by themselves, denoting their strong persistence.Clusters #1 and #2 both last more than 2 days in 50% ofthe cases, and more than 4 days and 3 days, respectively,in 25% of the cases. This is different from the remainingclusters, for which rainfall events are less persistent,with a length of 1 day in 50% of the cases and rarelyhigher than 2 days, suggesting transient patterns. Table Isupports this hypothesis and indicates a possible west-to-east propagation of enhanced rainfall related to theseclusters (Figure 2): in 30% of the cases, cluster #3 is
Copyright 2010 Royal Meteorological Society Int. J. Climatol. 32: 261–273 (2012)
RECURRENT RAINFALL PATTERNS OVER SOUTH AFRICA 265
Figure 2. (a) Daily mean of the 5352 rainfall stations for the 1971–1999 DJF period. (b)–(f) Significant composite anomalies associated withclusters #1, #2, #3, #4, and #6 over the same period at the 95% confidence level using a t-test applied to the square root of rainfall time seriesin order to be obtain Gaussian distributions. The part (%) of stations showing significant rainfall anomalies during the occurrences of the cluster
are labelled on the figure. This figure is available in colour online at wileyonlinelibrary.com/journal/joc
Table I. Percentage of days spent in each cluster followed bythe same or another cluster. Values in bold correspond to posi-tive and significant associations between observed and expectedfrequencies of clusters according to a Pearson chi-square test
at the 95% confidence level.
Cluster#1
Cluster#2
Cluster#3
Cluster#4
Cluster#6
Cluster #1 64.9 32.5 0.5 1.5 0.3Cluster #2 20 63.2 2.5 9.5 4.7Cluster #3 3.1 28.5 28.5 9.5 30.1Cluster #4 14.9 34.8 2.1 40.5 7.4Cluster #6 3.2 39.4 3.2 21 32.8
followed by cluster #6, and for 21% of the cases, cluster#6 is followed by cluster #4. This result will be furtherdiscussed below.
4. Associated atmospheric circulation anomalies
In this section, we first describe the atmospheric circu-lation at the regional scale and try to identify associated
physical mechanisms. At this scale, moisture fluxes anddescriptors of deep convective activity are the most rel-evant variables for regional rainfall variability. Then, wefocus on the near-global scale to assess whether there areany coherent changes in the Walker-type or Hadley circu-lations. To that end, stream function and velocity potentialare used to describe large-scale vorticity and divergence,respectively. In this section, anomalous dynamic patternsare computed by subtracting the mean DJF field fromcluster averages.
4.1. Regional scale
Composite anomalies of moisture fluxes associatedwith cluster #1 extend from the tropics to the mid-latitudes (Figure 4(a)). They are strongest south of 15 °Swhere a well defined west-to-east trough-ridge-troughwave structure is evident. This pattern is also appar-ent in the geopotential height anomalies at all verticallevels (not shown). Moisture flux anomalies are anti-cyclonic over most of the subcontinent, inducing rela-tive moisture divergence in most areas (Figure 4(a)) andmiddle-tropospheric subsidence (Figure 5(a)). Anoma-lous moisture convergence occurs near the two troughs
Copyright 2010 Royal Meteorological Society Int. J. Climatol. 32: 261–273 (2012)
266 J. CRETAT et al.
#1 #2 #3 #4 #6
123456789
1011121314151617181920
Per
sist
ence
(d
ays)
Clusters
Figure 3. As Figure 1(b), but for the persistence of each sequence associated with each cluster.
Figure 4. Composite anomalies of moisture convergence and fluxes integrated between 1000 hPa and 200 hPa (g.kg−1 m.s−1) for eachcluster. Cold (hot) colors display moisture convergence (divergence) anomalies. Only anomalies of convergence (moisture fluxes) that aresignificant at the 95% level according to a Student two tailed t-test (Hotelling test) are represented. This figure is available in colour online at
wileyonlinelibrary.com/journal/joc
Copyright 2010 Royal Meteorological Society Int. J. Climatol. 32: 261–273 (2012)
RECURRENT RAINFALL PATTERNS OVER SOUTH AFRICA 267
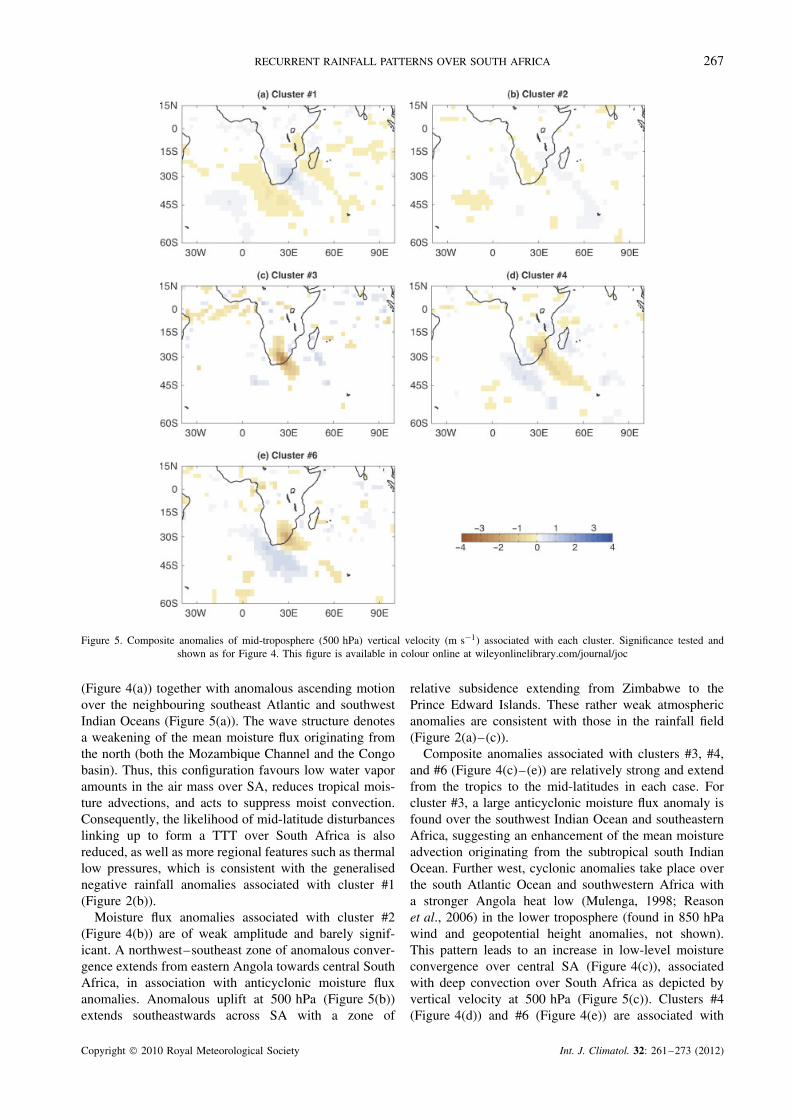
Figure 5. Composite anomalies of mid-troposphere (500 hPa) vertical velocity (m s−1) associated with each cluster. Significance tested andshown as for Figure 4. This figure is available in colour online at wileyonlinelibrary.com/journal/joc
(Figure 4(a)) together with anomalous ascending motionover the neighbouring southeast Atlantic and southwestIndian Oceans (Figure 5(a)). The wave structure denotesa weakening of the mean moisture flux originating fromthe north (both the Mozambique Channel and the Congobasin). Thus, this configuration favours low water vaporamounts in the air mass over SA, reduces tropical mois-ture advections, and acts to suppress moist convection.Consequently, the likelihood of mid-latitude disturbanceslinking up to form a TTT over South Africa is alsoreduced, as well as more regional features such as thermallow pressures, which is consistent with the generalisednegative rainfall anomalies associated with cluster #1(Figure 2(b)).
Moisture flux anomalies associated with cluster #2(Figure 4(b)) are of weak amplitude and barely signif-icant. A northwest–southeast zone of anomalous conver-gence extends from eastern Angola towards central SouthAfrica, in association with anticyclonic moisture fluxanomalies. Anomalous uplift at 500 hPa (Figure 5(b))extends southeastwards across SA with a zone of
relative subsidence extending from Zimbabwe to thePrince Edward Islands. These rather weak atmosphericanomalies are consistent with those in the rainfall field(Figure 2(a)–(c)).
Composite anomalies associated with clusters #3, #4,and #6 (Figure 4(c)–(e)) are relatively strong and extendfrom the tropics to the mid-latitudes in each case. Forcluster #3, a large anticyclonic moisture flux anomaly isfound over the southwest Indian Ocean and southeasternAfrica, suggesting an enhancement of the mean moistureadvection originating from the subtropical south IndianOcean. Further west, cyclonic anomalies take place overthe south Atlantic Ocean and southwestern Africa witha stronger Angola heat low (Mulenga, 1998; Reasonet al., 2006) in the lower troposphere (found in 850 hPawind and geopotential height anomalies, not shown).This pattern leads to an increase in low-level moistureconvergence over central SA (Figure 4(c)), associatedwith deep convection over South Africa as depicted byvertical velocity at 500 hPa (Figure 5(c)). Clusters #4(Figure 4(d)) and #6 (Figure 4(e)) are associated with
Copyright 2010 Royal Meteorological Society Int. J. Climatol. 32: 261–273 (2012)
268 J. CRETAT et al.
a wave structure oriented along a northwest–southeastdirection. This structure consists of a well defined ridge-trough-ridge structure with cyclonic wind anomalies overthe landmass (not shown) and anticyclonic moisture fluxanomalies over the neighbouring oceans. Over SouthAfrica, the cyclonic anomalies are linked with moistureconvergence (Figure 4(d)–(e)). This wave structure ismore or less opposite to that associated with cluster #1(Figure 4(a)). Anomalies in the OLR field (not shown)indicate enhanced atmospheric convection along thetrough. The wave structure is also noted in the mid-tropospheric vertical velocity (Figure 5(d)–(f)). Clusters#4 and, to a lesser extent #6, seem to be associated with atrough that extends roughly from Botswana (24 °S, 25 °E)to the Prince Edward Islands (46 °S, 38 °E) and which isapparent throughout the troposphere. Both these clusters,particularly cluster #4, are hypothesised to reflect TTTactivity over SA. The mean duration found for theseclusters (Figure 3) matches that of the TTT describedin F09 (i.e. between 3 and 6 days).
The main common feature between clusters #4 and#6 is the cyclonic moisture flux anomaly cell, centredover Botswana, which acts to reduce the export ofmoisture towards Namibia. It also leads to moistureconvergence over Mozambique and inputs of moistureinto the trough. The main difference consists of ageneralised eastward shift of the atmospheric patterns.For instance, anticyclonic anomalies cover almost thewhole south Atlantic Ocean for cluster #6 but areconfined to the southeastern Atlantic and the southwestIndian Ocean for cluster #4, where they are muchstronger. This difference is also noted in the 500 hPavertical velocity anomalies (Figure 5(e)). Thus, cluster#6 is less obviously a TTT feature than cluster #4, or itcould represent its decaying phase in accordance with,e.g., F09.
4.2. Near-global scale
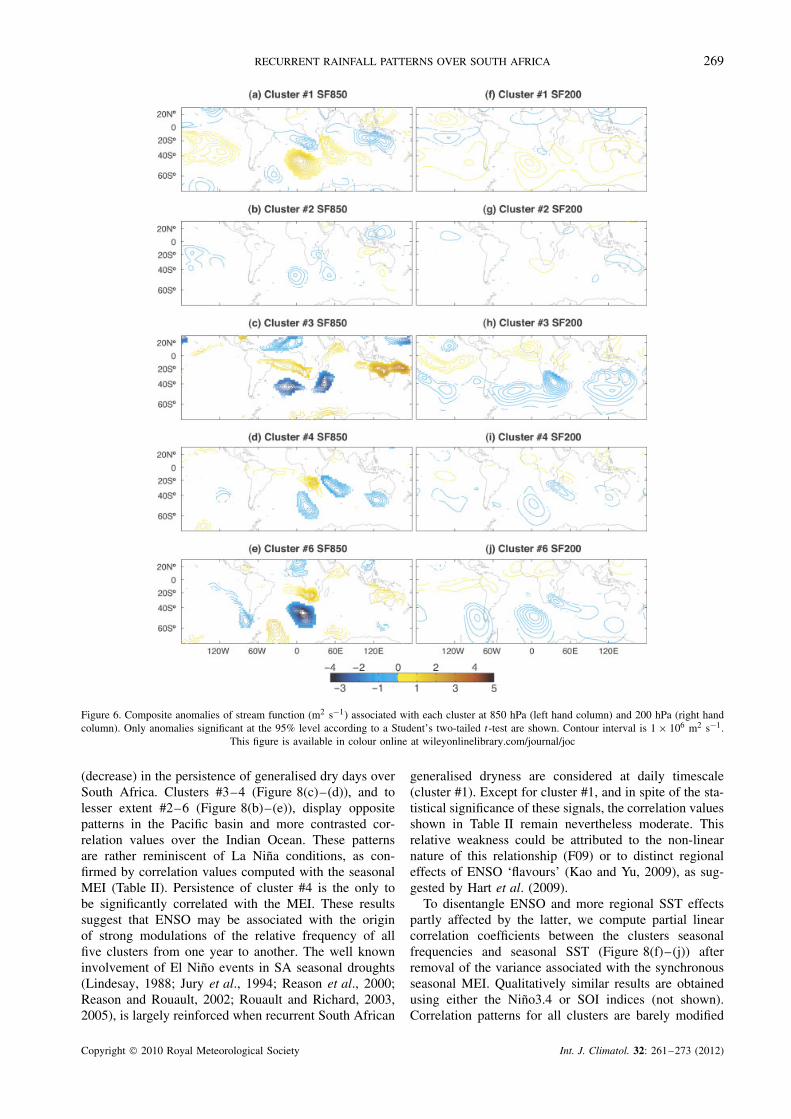
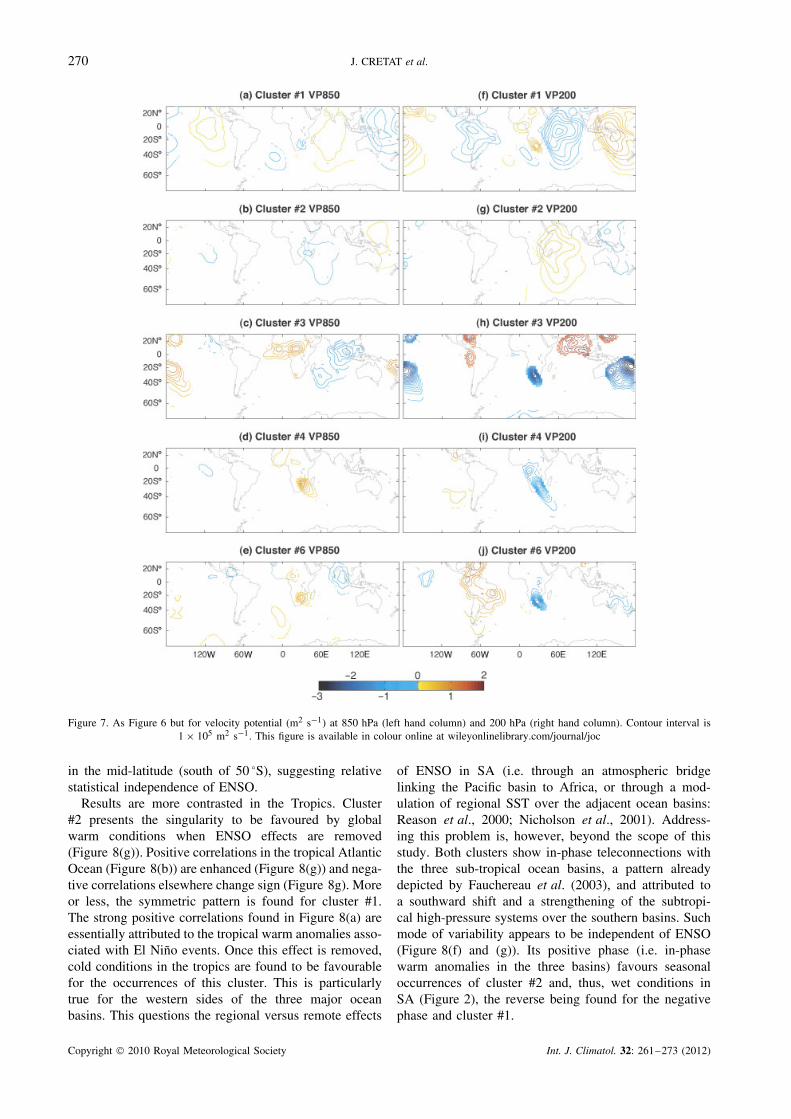
Cluster #2 shows very weak 850 hPa and 200 hPastream function and velocity potential anomalies (Figures6(b)–(g) and 7(b)–(g), respectively). Its main char-acteristics involve large-scale convergence (divergence)over the Indian Ocean in the lower (upper) layers(Figure 7(a)–(f)). Velocity potential anomalies are notsignificant elsewhere. This suggests little modification ofthe Hadley and Walker circulations.
Over South Africa and the surrounding oceans, streamfunction anomalies of cluster #1 present lower-layerpatterns that are relatively similar to moisture fluxesanomalies (Figure 4(a)), and that show a well-definedtrough-ridge-trough wave structure (Figure 6(a)). The lat-ter is still perceptible in the upper layers (Figure 6(f)),though with weaker values. Except for this near-barotropic structure, lower- and upper-troposphericanomalies are of reversed sign, indicative of baroclinicity.At 850 hPa, cyclonic (anticyclonic) prominent featuresdescribe anticyclonic (cyclonic) anomalies over Australia(the Philippines) together with cyclonic (anticyclonic)
anomalies in the southern tropical Pacific (north of theequator and south of 60 °S). At 200 hPa, clear cyclonicanomalies continuously prevail in the Southern Hemi-sphere between the subtropics and the mid-latitudes,while more regionalised anticyclonic anomalies are foundin the northern Tropics. Concomitant velocity poten-tial anomalies show regional scale divergence (conver-gence) in the lower (upper) troposphere, consistent withthe generalised dryness occurring in SA (Figure 2(b)).Large-scale patterns show upper-tropospheric divergence(convergence) over the Indian Ocean basin and the Amer-icas (the Maritime Continent and Africa). The reverseoccurs in the lower layers. These wavenumber-2 circu-lation anomalies demonstrate that the rainfall anomaliesassociated with cluster #1 are embedded in large-scaleclimate variability patterns. In particular, these resultssuggest that this cluster is related to large-scale weak-ening/reversal of the Walker circulation, suggestive of apossible connection with El Nino events.
Like cluster #1, the core of the anomalous streamfunction associated with clusters #3, 4 and 6 (Figure 6(c),(d) and (e)) is stronger in the lower troposphere. Thespatial extension of the anomalies is however generallywider in the upper layers (Figure 6(h), (i) and (j)), wherethey are mainly confined to the inter-tropical zone andthe southern mid-latitudes. Anomalies of stream functionand velocity potential patterns associated with these threeclusters are more or less reversed to those of cluster#1 (Figures 6(h), (i) and (j)) and (Figure 7(h), (i) and(j), respectively), especially over SA. Velocity potentialanomalies are both weaker and spatially more limited.Those associated with cluster #6 are compatible witha possible increase of the Walker-type circulation. Itshould nonetheless be noted that the strongest signalsassociated with these cluster are clearly regional bynature. They consist of lower (upper) layer convergence(divergence), consistent with associated wet anomaliesover SA (Figure 2(c) and (f)). This makes the possibleinvolvement of ENSO uncertain for these clusters.
5. SST teleconnections and possible ENSOconnections
This section aims to quantify to what extent the seasonaloccurrences of each rainfall pattern is modulated by thestate of ENSO and/or more regional SST anomalies.
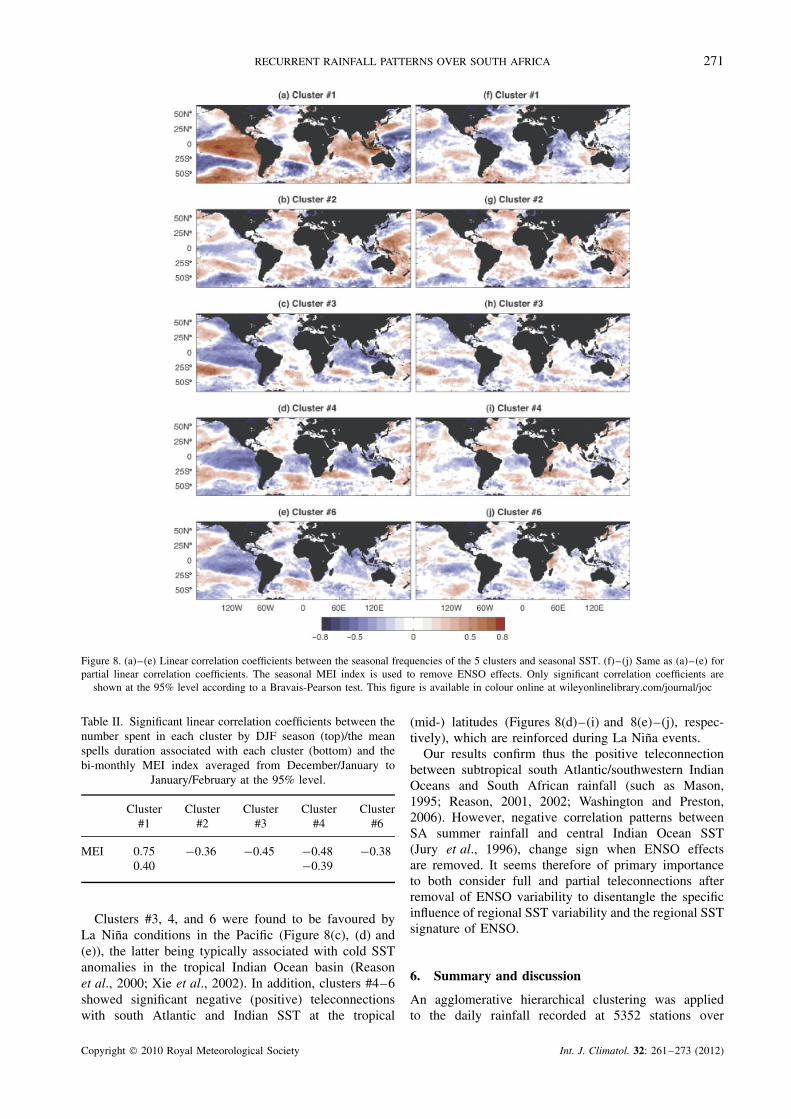
Figure 8(a) and (e) shows linear correlations betweenseasonal occurrences of each cluster and synchronousseasonal SST. In addition, Table II shows linear corre-lations between the clusters seasonal frequencies/meandurations and the MEI. For cluster #1, correlation pat-terns (Figure 8(a)) display strong positive (negative)correlations in the eastern (western) Pacific and positivecorrelations over the tropical Indian Ocean. Correlationcoefficients between this cluster and the MEI reach +0.75(for seasonal occurrences) and +0.4 (for the spell dura-tion), shown in Table II. El Nino (La Nina) events tendto be associated with an increase (decrease) of the occur-rence of cluster #1, and less clearly with an increase
Copyright 2010 Royal Meteorological Society Int. J. Climatol. 32: 261–273 (2012)
RECURRENT RAINFALL PATTERNS OVER SOUTH AFRICA 269
Figure 6. Composite anomalies of stream function (m2 s−1) associated with each cluster at 850 hPa (left hand column) and 200 hPa (right handcolumn). Only anomalies significant at the 95% level according to a Student’s two-tailed t-test are shown. Contour interval is 1 × 10⁶ m2 s−1.
This figure is available in colour online at wileyonlinelibrary.com/journal/joc
(decrease) in the persistence of generalised dry days overSouth Africa. Clusters #3–4 (Figure 8(c)–(d)), and tolesser extent #2–6 (Figure 8(b)–(e)), display oppositepatterns in the Pacific basin and more contrasted cor-relation values over the Indian Ocean. These patternsare rather reminiscent of La Nina conditions, as con-firmed by correlation values computed with the seasonalMEI (Table II). Persistence of cluster #4 is the only tobe significantly correlated with the MEI. These resultssuggest that ENSO may be associated with the originof strong modulations of the relative frequency of allfive clusters from one year to another. The well knowninvolvement of El Nino events in SA seasonal droughts(Lindesay, 1988; Jury et al., 1994; Reason et al., 2000;Reason and Rouault, 2002; Rouault and Richard, 2003,2005), is largely reinforced when recurrent South African
generalised dryness are considered at daily timescale(cluster #1). Except for cluster #1, and in spite of the sta-tistical significance of these signals, the correlation valuesshown in Table II remain nevertheless moderate. Thisrelative weakness could be attributed to the non-linearnature of this relationship (F09) or to distinct regionaleffects of ENSO ‘flavours’ (Kao and Yu, 2009), as sug-gested by Hart et al. (2009).
To disentangle ENSO and more regional SST effectspartly affected by the latter, we compute partial linearcorrelation coefficients between the clusters seasonalfrequencies and seasonal SST (Figure 8(f)–(j)) afterremoval of the variance associated with the synchronousseasonal MEI. Qualitatively similar results are obtainedusing either the Nino3.4 or SOI indices (not shown).Correlation patterns for all clusters are barely modified
Copyright 2010 Royal Meteorological Society Int. J. Climatol. 32: 261–273 (2012)
270 J. CRETAT et al.
Figure 7. As Figure 6 but for velocity potential (m2 s−1) at 850 hPa (left hand column) and 200 hPa (right hand column). Contour interval is1 × 105 m2 s−1. This figure is available in colour online at wileyonlinelibrary.com/journal/joc
in the mid-latitude (south of 50 °S), suggesting relativestatistical independence of ENSO.
Results are more contrasted in the Tropics. Cluster#2 presents the singularity to be favoured by globalwarm conditions when ENSO effects are removed(Figure 8(g)). Positive correlations in the tropical AtlanticOcean (Figure 8(b)) are enhanced (Figure 8(g)) and nega-tive correlations elsewhere change sign (Figure 8g). Moreor less, the symmetric pattern is found for cluster #1.The strong positive correlations found in Figure 8(a) areessentially attributed to the tropical warm anomalies asso-ciated with El Nino events. Once this effect is removed,cold conditions in the tropics are found to be favourablefor the occurrences of this cluster. This is particularlytrue for the western sides of the three major oceanbasins. This questions the regional versus remote effects
of ENSO in SA (i.e. through an atmospheric bridgelinking the Pacific basin to Africa, or through a mod-ulation of regional SST over the adjacent ocean basins:Reason et al., 2000; Nicholson et al., 2001). Address-ing this problem is, however, beyond the scope of thisstudy. Both clusters show in-phase teleconnections withthe three sub-tropical ocean basins, a pattern alreadydepicted by Fauchereau et al. (2003), and attributed toa southward shift and a strengthening of the subtropi-cal high-pressure systems over the southern basins. Suchmode of variability appears to be independent of ENSO(Figure 8(f) and (g)). Its positive phase (i.e. in-phasewarm anomalies in the three basins) favours seasonaloccurrences of cluster #2 and, thus, wet conditions inSA (Figure 2), the reverse being found for the negativephase and cluster #1.
Copyright 2010 Royal Meteorological Society Int. J. Climatol. 32: 261–273 (2012)
RECURRENT RAINFALL PATTERNS OVER SOUTH AFRICA 271
Figure 8. (a)–(e) Linear correlation coefficients between the seasonal frequencies of the 5 clusters and seasonal SST. (f)–(j) Same as (a)–(e) forpartial linear correlation coefficients. The seasonal MEI index is used to remove ENSO effects. Only significant correlation coefficients are
shown at the 95% level according to a Bravais-Pearson test. This figure is available in colour online at wileyonlinelibrary.com/journal/joc
Table II. Significant linear correlation coefficients between thenumber spent in each cluster by DJF season (top)/the meanspells duration associated with each cluster (bottom) and thebi-monthly MEI index averaged from December/January to
January/February at the 95% level.
Cluster#1
Cluster#2
Cluster#3
Cluster#4
Cluster#6
MEI 0.75 −0.36 −0.45 −0.48 −0.380.40 −0.39
Clusters #3, 4, and 6 were found to be favoured byLa Nina conditions in the Pacific (Figure 8(c), (d) and(e)), the latter being typically associated with cold SSTanomalies in the tropical Indian Ocean basin (Reasonet al., 2000; Xie et al., 2002). In addition, clusters #4–6showed significant negative (positive) teleconnectionswith south Atlantic and Indian SST at the tropical
(mid-) latitudes (Figures 8(d)–(i) and 8(e)–(j), respec-tively), which are reinforced during La Nina events.
Our results confirm thus the positive teleconnectionbetween subtropical south Atlantic/southwestern IndianOceans and South African rainfall (such as Mason,1995; Reason, 2001, 2002; Washington and Preston,2006). However, negative correlation patterns betweenSA summer rainfall and central Indian Ocean SST(Jury et al., 1996), change sign when ENSO effectsare removed. It seems therefore of primary importanceto both consider full and partial teleconnections afterremoval of ENSO variability to disentangle the specificinfluence of regional SST variability and the regional SSTsignature of ENSO.
6. Summary and discussion
An agglomerative hierarchical clustering was appliedto the daily rainfall recorded at 5352 stations over
Copyright 2010 Royal Meteorological Society Int. J. Climatol. 32: 261–273 (2012)
272 J. CRETAT et al.
South Africa and the neighbouring countries of Lesotho,Swaziland, and southern Namibia. The aims were toinvestigate the nature of recurrent rainfall patterns duringthe core of the rainy season (December to February)and to relate them with the atmospheric circulation.The clustering technique led to the identification of sixrecurrent rainfall patterns among which the weakest (towhich only 7 days were affiliated) was not analysed indetail.
One cluster (cluster #2), regrouping about 50% of thedays, shows a rainfall pattern close to the seasonal mean,i.e. a gradient from dry conditions in the west to wetterconditions in the east. This cluster is also associated withexcessively weak atmospheric anomalies on both regionaland global scales, consistent with the fact that it reflectsthe climatology.
Cluster #1 regroups about 37% of the days andis associated with strong negative rainfall anomaliesover South Africa, resulting from a regional trough-ridge-trough wave structure and moisture divergenceover the region. At the global scale, this cluster isclearly associated with El Nino events and correspondsto a reduction or a possible shift of the Walker-typecirculation and in the subtropical jet stream. The verystrong teleconnections between its seasonal frequencyand tropical SST are dramatically weakened when theinfluence of ENSO is removed, which confirms theimplication of the latter. Thus, this clustering approach ofthe rainfall patterns appears as a useful tool to extend theresults of Lindesay (1988) and Van Heerden et al. (1988)who found a covariance of 20% between ENSO and theSouth African summer rainfall amounts.
These two clusters (#1 and 2) are the most persistent.This is particularly true for cluster #1 whose persistenceis even increased during El Nino events. This is inagreement with Tennant and Hewitson (2002), whoshowed that wet austral summer seasons in SA are notnecessarily associated with a decrease in the persistenceof dry days.
Regrouping, respectively, about 2.5, 11 and 6% ofthe days, the three remaining clusters (#3, 4, and 6) areboth wetter and less persistent. They, respectively, corre-spond to a decrease, an increase, and maintenance of theseasonal mean eastward rainfall gradient. In each case,strong cyclonic moisture flux anomalies centred overAngola or northern Botswana and anomalous conver-gence located over the largest positive rainfall anomaliesexplain such wet conditions in SA. Among these clus-ters, two (clusters #3–6) are more or less all related totropical/extra-tropical interactions, and one (cluster #4)is clearly associated with TTT events. In addition, andconsistently with previous studies (F09, P09), the transi-tions between these clusters tends to depict an eastwardpropagation of heavy rainfall structures. Analysis of largescale circulation patterns associated with these clusterssuggests a weak but significant effect of La Nina. Theimplication of ENSO is again confirmed by full and par-tial teleconnections with tropical SST.
Like all classification algorithms, the AHC partitioninghas some limitations, and it cannot be considered asa satisfactory solution to discretise the spatio-temporalvariability of the rainfall field into five or six recurrentclasses. Nonetheless, it has the advantage of being con-cise and, in the present case, it allows us to demonstratethat the three wettest rainfall patterns could be linked tosome extent either to tropical convection anomalies (clus-ters #3–6) or to tropical–temperate interactions (cluster#4). Possible causes for regional rainfall variability mayalso include tropical perturbations such as easterly wavesor meso-scale convective systems, or the establishmentof semi-permanent thermal lows over the margins of theKalahari Desert (southern Angola, northern Namibia, andBotswana). Further work is still required to better under-stand how these different mechanisms interact or interfereat the synoptic timescale.
Acknowledgements
ECMWF ERA-40 data used in this study have been freelyobtained from the ECMWF Data Server (http://data-portal.ecmwf.int/data/d/era40 daily/). Monthly HadISSTis provided by the Hadley Center Meteorological Office.Calculations were performed using HPC resources fromDSI-CCUB (Universite de Bourgogne). Mathieu Rouaultthanks ACCESS, CNRS, Nansen Tutu Center, NRF,and WRC for funding. We thank the WRC for makingthe rainfall data available. Similarly, we thank the twoanonymous reviewers for their helpful comments.
References
Camberlin P, Janicot S, Poccard I. 2001. Seasonality and atmosphericdynamics of the teleconnection between African rainfall and tropicalSea-Surface Temperature: Atlantic VS ENSO. International Journalof Climatology 21: 973–1005.
Fauchereau N, Traska S, Richard Y, Roucou P, Camberlin P. 2003.SST co-variability in the Southern Atlantic and Indian Oceans andits connections with the atmospheric circulation in the SouthernHemisphere. International Journal of Climatology 23: 663–677.
Fauchereau N, Pohl B, Reason CJC, Rouault M, Richard Y. 2009.Recurrent daily OLR patterns in the Southern Africa/SouthwestIndian Ocean Region, implications for South African rainfall andteleconnections. Climate Dynamics 32: 575–591.
Gong X, Richman MB. 1995. On the application of cluster analysisto growing season precipitation data in North America East of theRockies. Journal of Climate 8: 897–931.
Harrison MSJ. 1984a. A generalized classification of South Africansummer rain-bearing synoptic systems. International Journal ofClimatology 4: 547–560.
Harrison MSJ. 1984b. Comparison of rainfall time series over SouthAfrica generated from real data and through principal componentanalysis. International Journal of Climatology 4: 561–564.
Hart NCG, Fauchereau N, Reason CJC. 2009. El Nino’s Flavors:implications for South African rainfall. Proceedings of the SouthAfrican Society for Atmospheric Sciences, 25 th annual conference,9-10 sept. 09, Tulbagh: South Africa: 19–20.
Hart NCG, Reason CJC, Fauchereau N. 2010. Tropical-extratropicalinteractions over southern Africa: three cases of heavy summerseason rainfall, Monthly Weather Review 138: 2608–2623.
Jury MR, Mc Queen C, Levey K. 1994. SOI and QBO signals in theAfrican Region. Theoretical and Applied Climatology 50: 103–115.
Jury MR, Pathack B, Rautenbach CJDW, Vanheerden J. 1996. Droughtover South Africa and Indian Ocean SST: statistical and GCMresults. The Global Atmosphere and Ocean System 4: 47–63.
Kao HY, Yu JY. 2009. Contrasting Eastern-Pacific and Central-Pacifictypes of ENSO. Journal of Climate 22: 615–632.
Copyright 2010 Royal Meteorological Society Int. J. Climatol. 32: 261–273 (2012)
RECURRENT RAINFALL PATTERNS OVER SOUTH AFRICA 273
Lindesay JA. 1988. South African rainfall, the Southern Oscillation anda southern hemisphere semi-annual cycle. International Journal ofClimatology 8: 17–30.
Lynch SD. 2003. Development of a raster database of annual, monthlyand daily rainfall for Southern Africa. Report No. 1156/1/04, WaterResearch Commission: Pretoria, South Africa; 78 pp.
Mason SJ. 1995. Sea-Surface Temperature – South African rainfallassociations, 1910-1989. International Journal of Climatology 15:119–135.
Mulenga HM. 1998. Southern African climatic anomalies, summerrainfall and the Angola low. PhD Thesis, University of Cape Town,Cape Town: South Africa; 232 pp.
Munoz-Diaz D, Rodrigo FS. 2004. Spatio-temporal patterns ofseasonal rainfall in Spain (1912-2000) using cluster andprincipal component analysis: comparison. Annales Geophysicae 22:1435–1448.
Munoz-Diaz D, Rodrigo FS. 2006. Seasonal rainfall variations in Spain(1912-2000) and their links to atmospheric circulation. AtmosphericResearch 81: 94–110.
Nicholson SE, Selato JC. 2000. The influence of La Nina on Africanrainfall. International Journal of Climatology 20: 1761–1776.
Nicholson SE, Leposo D, Grist J. 2001. The relationship between ElNino and drought over Botswana. Journal of Climate 14: 323–335.
Pohl B, Richard Y, Fauchereau N. 2007. Influence of the Madden-Julian oscillation on Southern African summer rainfall. Journal ofClimate 20: 4227–4242.
Pohl B, Fauchereau N, Richard Y, Rouault M, Reason CJC. 2009.Interactions between synoptic, intraseasonal and interannualconvective variability over Southern Africa. Climate Dynamics 33:1033–1050.
Ramos MC. 2001. Divisive and hierarchical clustering techniques toanalyse variability of rainfall distribution patterns in a MediterraneanRegion. Atmospheric Research 57: 123–138.
Rayner NA, Parker DE, Horton EB, Folland CK, Alexander LV,Rowell DP, Kent EC, Kaplan A. 2003. Global analyses of seasurface temperature, sea ice, and night marine air temperature sincethe late Nineteenth Century. Journal of Geophysical Research 108,DOI:10.1029/2002JD002670.
Reason CJC, Mulenga H. 1999. Relationships between AfricanRainfall and SST anomalies in the Southwest Indian Ocean.International Journal of Climatology 19: 1651–1673.
Reason CJC, Allan RJ, Lindesay JA, Ansell TJ. 2000. ENSO andclimatic signals across the Indian Ocean basin in the global context.Part I: Interannual composite patterns. International Journal ofClimatology 20: 1285–1327.
Reason CJC. 2001. Subtropical Indian Ocean SST dipole eventsand Southern African rainfall. Geophysical Research Letters 28:2225–2227.
Reason CJC. 2002. Sensitivity of the Southern African circulation todipole Sea-Surface Temperature patterns in the South Indian Ocean.International Journal of Climatology 22: 377–393.
Reason CJC, Rouault M. 2002. ENSO-like decadal variability andSouth African rainfall. Geophysical Research Letters 29: 16.1–16.4.
Reason CJC, Landman W, Tennant W. 2006. Seasonal to decadalprediction of Southern African climate and its links with variabilityof the Atlantic Ocean. Bulletin of the American MeteorologicalSociety 87: 941–955.
Richard Y, Trzaska S, Roucou P, Rouault M. 2000. Modification of theSouthern African rainfall variability/ENSO relationship since the late1960s. Climate Dynamics 16: 883–895.
Richard Y, Fauchereau N, Poccard I, Rouault M, Trzaska S. 2001.20th century droughts in Southern Africa: spatial and temporalvariability, teleconnections with oceanic and atmospheric conditions.International Journal of Climatology 21: 873–885.
Rouault M, Florenchie P, Fauchereau N, Reason CJC. 2003. SouthEast Tropical Atlantic warm events and Southern Africanrainfall. Geophysical Research Letters 30, DOI:10.1029/2002GL014840.
Rouault M, Richard Y. 2003. Intensity and spatial extension of droughtin South Africa at different time scales. Water S.A. 29: 489–500.
Rouault M, Richard Y. 2005. Spatial extent and intensity ofdroughts in Southern Africa, Geophysical Research. Letters 32,DOI:10.1029/2005GL022436.
Tennant WJ, Hewitson BC. 2002. Intra-seasonal rainfall characteristicsand their importance to the seasonal prediction problem.International Journal of Climatology 22: 1033–1048.
Todd MC, Washington R. 1999. Circulation anomalies with tropical-temperate troughs in Southern Africa and the South West IndianOcean. Climate Dynamics 15: 937–951.
Todd MC, Washington R, Palmer PI. 2004. Water vapour transportassociated with tropical-temperate trough systems over SouthernAfrica and the Southwest Indian Ocean. International Journal ofClimatology 24: 555–568.
Tyson PD, Preston-Whyte RA. 2000. The weather and climate ofSouthern Africa (2nd edition), Oxford University Press: Cap Town,South Africa; 396 pp.
Uppala SM, Kallberg PW, Simmons AJ, Andrae U, Bechtold VDC,Fiorino M, Gibson JK, Haseler J, Hernandez A, Kelly GA, Li X,Onogi K, Saarinen S, Sokka N, Allan RP, Andersson E, Arpe K,Balmaseda MA, Beljaars ACM, Van de Berg L, Bidlot J, BormannN, Caires S, Chevallier F, Dethof A, Dragosavac M, Fisher M,Fuentes M, Hagemann S, Holm E, Hoskins BJ, Isaksen L, JanssenPAEM, Jenne R, McNally AP, Mahfouf JF, Morcrette JJ, Rayner NA,Saunders RW, Simon P, Sterl A, Trenberth KE, Untch A, VasiljevicD, Vitterbo P, Woollen J. 2005. The ERA-40 re-analysis. QuartelyJournal of the Meteorological Society 131: 2961–3012.
Van Heerden J, Terblanche DE, Schulze GC. 1988. The Southernoscillation and South African summer rainfall. International Journalof Climatology 8: 577–597.
Van Heerden J, Taljaard JJ. 1998. Meteorology of the SouthernHemisphere. 1998. American Meteorological Society Monograph,Karoly DJ, Vincent DG (eds), Boston, Massachussetts; 307–336.
Vigaud N. 2007. Water Vapour Transport from the South Atlantic andIndian Oceans and Summer Rainfall in Southern Africa. PhD Thesis,University of Cape Town, Cape Town, South Africa; 222 pp.
Vigaud N, Richard Y, Rouault M, Fauchereau N. 2007. Water vapourtransport from the Tropical Atlantic and summer rainfall in TropicalSouthern Africa. Climate Dynamics 28: 113–123.
Vigaud N, Richard Y, Rouault M, Fauchereau N. 2009. Moisturetransport between the South Atlantic Ocean and Southern Africa:relationships with summer rainfall and associated dynamics. ClimateDynamics 32: 113–123.
Ward JH. 1963. Hierarchical grouping to optimize an objectivefunction. Journal of the American Statistical Association 58:236–244.
Washington R, Todd MC. 1999. Tropical-temperature links in SouthernAfrican and Southwest Indian Ocean satellite-derived daily rainfall.International Journal of Climatology 19: 1602–1616.
Washington R, Preston A. 2006. Extreme wet years over SouthernAfrica: role of Indian Ocean Sea Surface Temperatures. Journal ofGeophysical Research 111, DOI:10.1029/2005JD00672415.
Wolter K, Timlin MS. 1993. Monitoring ENSO in COADS witha seasonally adjusted principal component index. 17th ClimateDiagnostics Workshop Norman, OK; 52–57.
Xie SP, Annamalai H, Schott F, McCreary JP Jr. 2002. Structure andmechanisms of South Indian Ocean climate variability. Journal ofClimate 15: 864–878.
Copyright 2010 Royal Meteorological Society Int. J. Climatol. 32: 261–273 (2012)