Embed Size (px)
Citation preview
Policy Research Working Paper 5243
‘Red Flags of Corruption’ in World Bank Projects
An Analysis of Infrastructure Contracts
Charles Kenny Maria Musatova
The World BankSustainable Development DepartmentFinance, Economics and Urban DivisionMarch 2010
WPS5243P
ublic
Dis
clos
ure
Aut
horiz
edP
ublic
Dis
clos
ure
Aut
horiz
edP
ublic
Dis
clos
ure
Aut
horiz
edP
ublic
Dis
clos
ure
Aut
horiz
edP
ublic
Dis
clos
ure
Aut
horiz
edP
ublic
Dis
clos
ure
Aut
horiz
edP
ublic
Dis
clos
ure
Aut
horiz
edP
ublic
Dis
clos
ure
Aut
horiz
ed
Produced by the Research Support Team
Abstract
The Policy Research Working Paper Series disseminates the findings of work in progress to encourage the exchange of ideas about development issues. An objective of the series is to get the findings out quickly, even if the presentations are less than fully polished. The papers carry the names of the authors and should be cited accordingly. The findings, interpretations, and conclusions expressed in this paper are entirely those of the authors. They do not necessarily represent the views of the International Bank for Reconstruction and Development/World Bank and its affiliated organizations, or those of the Executive Directors of the World Bank or the governments they represent.
Policy Research Working Paper 5243
To examine the relationship between patient satisfaction and doctor performance, the authors observed 2,271 interactions between 29 “Red flags” are indicators of potential issues regarding governance failure, collusion or corruption in projects. While some specific red flags can be powerful indicators of issues to be addressed, the hypothesis of this paper is that many proposed red flags are potentially too ubiquitous and randomly distributed to be useful as indicators of significant governance failure. The paper examines project documentation from a small sample of World Bank water and sanitation projects in an attempt to collect data on the presence or absence of 13 commonly accepted red flags. This paper finds that: (i) almost every contract reviewed raised at least one of 13
This paper—a product of the Finance, Economics and Urban Division in the Sustainable Development Department—is part of a larger effort in the department to learn about approaches to improve governance and reduce corruption in construction. Policy Research Working Papers are also posted on the Web at http://econ.worldbank.org. The author may be contacted at [email protected].
red flags analyzed; (ii) potentially tainted contracts did not exhibit notably more red flags than control contracts; and (iii) the occurrence of multiple red flags in the same contract was rare enough to suggest that joint occurrence was largely by chance, not as a result of a strongly causal inter-relationship between flags. The ubiquity and apparent randomness of these red flags suggests that their roll-out as a monitoring tool requires additional thought as to interpretation, context and use. The paper examines an alternate tool for uncovering potential problem projects—supplier concentration. Across a very small sample, there does appear to be a relationship between such concentration and potential problem projects. 2 doctors and their patients in
‘Red Flags of Corruption’ in World Bank Projects: An Analysis of Infrastructure Contracts
Charles Kenny and Maria Musatova1
1 Finance, Economics and Urban unit, the World Bank. The views expressed are those of the authors and do not necessarily reflect those of the World Bank, its Executive Directors, or the countries that they represent. Thanks to Marisela Montoliu Munoz, Hartwig Schafer, Atsushi Iimi, Skip White, Cesar Calderon, Victoria Alexeeva, Snezana Mitrovic, Anders Agerskov, Meike van Ginneken, Tina Soreide, Steve Burgess and participants in a brown bag lunch on the paper for helpful comments and assistance.
2
Acronyms
BER Bid Evaluation Report CR Concentration Ratio HHI Herfindahl-Hirschmann Index PAD Project Appraisal Document INT Department of Institutional Integrity NCB National Competitive Bidding ICB International Competitive Bidding
3
Introduction ‘Red flags of corruption’ are one tool being utilized by World Bank task teams to attempt to uncover potential issues regarding governance failure, collusion or corruption in projects. They range from the specific –such as falsification of documents— to the indirect –long negotiation times or overruns. Other examples of red flag indicators include unsupported conclusions in recommendations to create a project, to decide specifications, or to shortlist or award a contract, very similar bids on contracts from different firms and slow processing of procurements and contract payments. It is becoming an increasingly common practice to include lists of red flags in project documents to be monitored during implementation. In many cases, ‘red flags’ are seen as a first-line indicator of potential corruption, and the triggering of the flag is presented as grounds for further investigation or a request for the involvement of the World Bank’s Integrity Department (INT) in an investigation. The red flag approach is utilized outside the World Bank, as well. For example, the Asian Development Bank, the Inter-American Development Bank and the European Bank for Reconstruction and Development have all developed red flag lists and methodologies, and Transparency International encourages the compilation of red flag lists as part of anti-corruption strategies. Red flag lists can be extensive, but the flags listed are often indirect measures. One recent publication contained 67 red flags that it proposed task teams looked out for during project preparation and implementation. Flags are often linked to procurement or implementation outcomes that can have multiple causes. Slow contract processing might be the result of extended negotiations over the corrupt division of rents from an inflated bid. Or it might be the result of limited capacity, competing priorities or the sheer complexity of the process itself. Given the inclusion of a range of indirect indicators, it is perhaps unsurprising that existing analyses suggest that red flags may be fairly ubiquitous in World Bank projects. An analysis of transport contracts from the Africa region regarding the distribution of twelve red flags found a total of 213 red flags across 185 contracts. It is also worth noting that, overall, red flags were about as common in contracts where there had been a complaint by stakeholders about the contracting process as where there had not. Contracts which had involved a complaint took considerably longer to negotiate, bidding competition was lower and costs per km2 were higher. On the other hand, procurement delays were comparatively rare on complaint contracts, more firms who bought bid documents actually bid, contract price variation from bid opening was lower and large variation orders were less frequent (Alexeeva et. al., 2008). The potential ubiquity of red flags suggests a concern with the idea of using the presence or number of red flags as an automatic trigger for operational decisions. Seeing some red flags in many projects might reflect the ubiquity of corrupt projects or
4
(more likely) that these particular red flags turn up many ‘false positives.’ Conversely, it may be that some red flags do not emerge in a number of projects that are in fact corrupt – they display ‘false negatives.’ Clearly, this would also be a worry if red flags are meant to be the primary trigger for an investigation of corruption. This paper examines project documentation from a small sample of past World Bank water and sanitation projects, to further analyze the efficacy of a red flag approach. The purpose is to identify the presence or absence of a number of commonly accepted red flags. It will compare the results with red flag reviews of documentation from a smaller sample of infrastructure projects where public (press) reports suggest that the Bank’s corruption watchdog, the Department of Institutional Integrity (INT), has been alerted to potential issues with the award process involving a/some contract(s) under the project. The aim of the paper is to evaluate the frequency, correlation and clustering of different red flag indicators, and the evidence that particular red flag indicators appear more frequently in projects subsequently labeled as victims of governance failure. The hypotheses to be tested are that (i) red flags as a whole are comparatively rare in occurrence (and so signal a significant, unusual contract status); (ii) red flags are concentrated in particular projects (as would be expected if they signaled the same problem); and (iii) concentration of contractors (one contractor winning multiple contracts in the same project) may be a comparatively effective indicator of potential problems. Three caveats and clarifications should be made up front:
The scale and method of the case study approach adopted by this paper will not allow for the generation of robust or statistically significant results. In particular, a desk review of a small sample of projects based on documentation available in Bank project files carried out by analysts who were not part of the project or country teams will produce conclusions that should be taken as highly preliminary. The modest hope of the paper is that it may signal strengths and potential issues with the red flag approach as it is being rolled out in the Bank, and signal any need for greater analysis and research prior to such a rollout.
This research is not an attempt to second-guess a system of red flags.
Significant INT experience suggests the utility of the red flag approach. And a number of more egregious flags, even if not easily uncovered during standard supervision, are nonetheless clear indicators of corruption. But it is hoped that the research might point towards potential refinements that would make the approach more practical and useful for Bank task teams. INT has largely developed red flags on the grounds that when there is already suspicion of corruption in a contract, looking at red flags related to particular forms of corruption can provide further assistance in determining ‘true’ problem contracts. This may be the better way for task teams to utilize many of the suggested red flags, as well. It is preferable to developing lists of red flags the emergence of which are immediate grounds for further probing with regard to the risk of corruption –an approach that has emerged in a number of ‘GAC Annexes’ to World Bank Project Appraisal Documents.
5
This research is not an attempt to substantiate corruption in particular Bank
projects. In order to ensure that the research is not misinterpreted in that way, and because it is based in considerable part on documentation that is for official use only, the individual projects studied will remain confidential.2
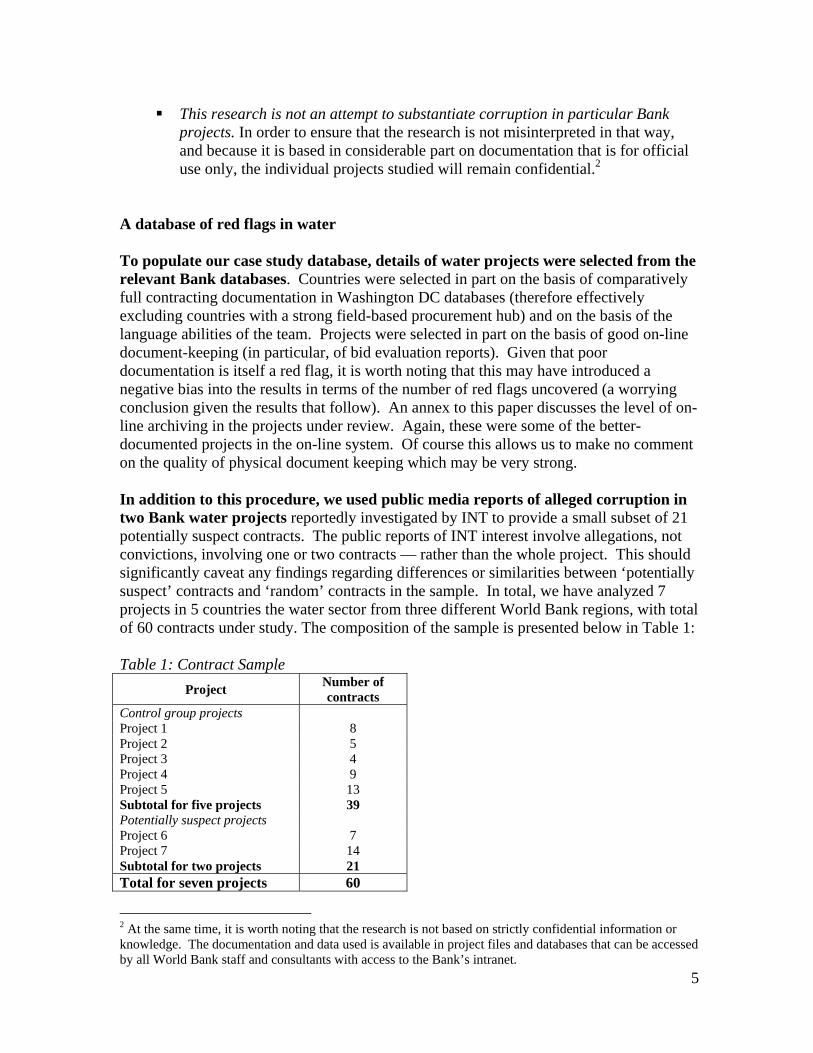
A database of red flags in water To populate our case study database, details of water projects were selected from the relevant Bank databases. Countries were selected in part on the basis of comparatively full contracting documentation in Washington DC databases (therefore effectively excluding countries with a strong field-based procurement hub) and on the basis of the language abilities of the team. Projects were selected in part on the basis of good on-line document-keeping (in particular, of bid evaluation reports). Given that poor documentation is itself a red flag, it is worth noting that this may have introduced a negative bias into the results in terms of the number of red flags uncovered (a worrying conclusion given the results that follow). An annex to this paper discusses the level of on-line archiving in the projects under review. Again, these were some of the better-documented projects in the on-line system. Of course this allows us to make no comment on the quality of physical document keeping which may be very strong. In addition to this procedure, we used public media reports of alleged corruption in two Bank water projects reportedly investigated by INT to provide a small subset of 21 potentially suspect contracts. The public reports of INT interest involve allegations, not convictions, involving one or two contracts — rather than the whole project. This should significantly caveat any findings regarding differences or similarities between ‘potentially suspect’ contracts and ‘random’ contracts in the sample. In total, we have analyzed 7 projects in 5 countries the water sector from three different World Bank regions, with total of 60 contracts under study. The composition of the sample is presented below in Table 1: Table 1: Contract Sample
Project Number of contracts
Control group projects Project 1 8 Project 2 5 Project 3 4 Project 4 9 Project 5 13 Subtotal for five projects 39 Potentially suspect projects Project 6 7 Project 7 14 Subtotal for two projects 21 Total for seven projects 60
2 At the same time, it is worth noting that the research is not based on strictly confidential information or knowledge. The documentation and data used is available in project files and databases that can be accessed by all World Bank staff and consultants with access to the Bank’s intranet.
6
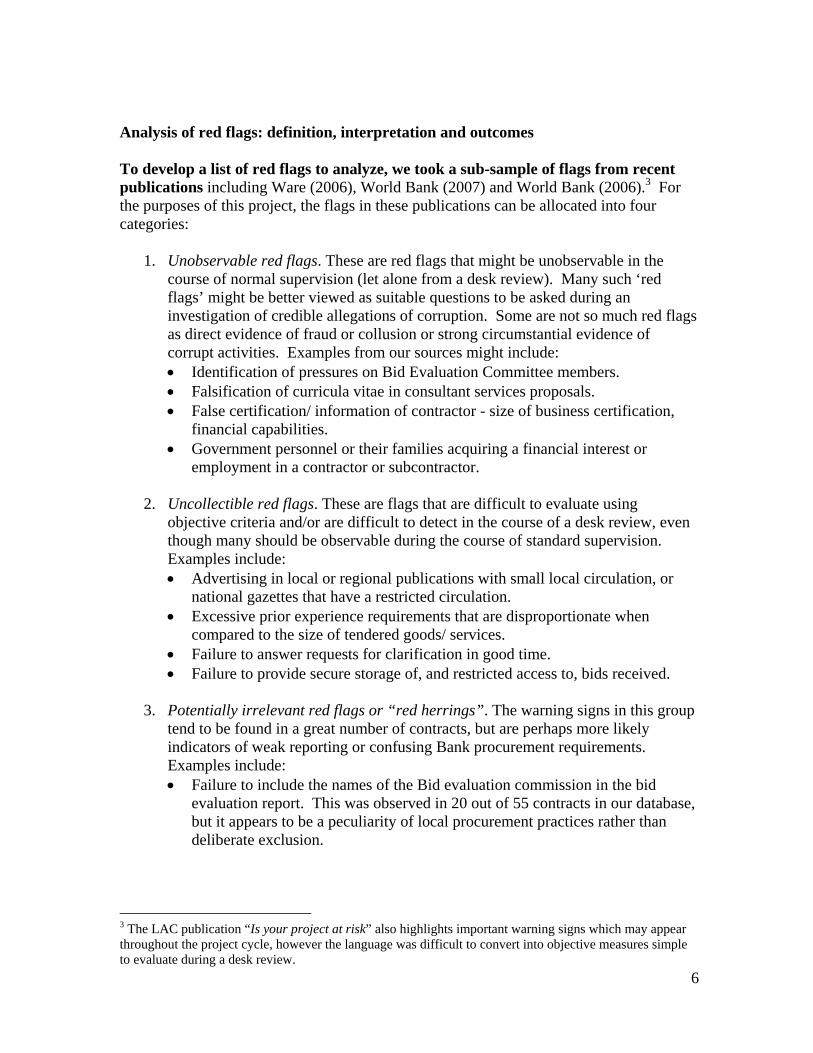
Analysis of red flags: definition, interpretation and outcomes To develop a list of red flags to analyze, we took a sub-sample of flags from recent publications including Ware (2006), World Bank (2007) and World Bank (2006).3 For the purposes of this project, the flags in these publications can be allocated into four categories:
1. Unobservable red flags. These are red flags that might be unobservable in the course of normal supervision (let alone from a desk review). Many such ‘red flags’ might be better viewed as suitable questions to be asked during an investigation of credible allegations of corruption. Some are not so much red flags as direct evidence of fraud or collusion or strong circumstantial evidence of corrupt activities. Examples from our sources might include: Identification of pressures on Bid Evaluation Committee members. Falsification of curricula vitae in consultant services proposals. False certification/ information of contractor - size of business certification,
financial capabilities. Government personnel or their families acquiring a financial interest or
employment in a contractor or subcontractor. 2. Uncollectible red flags. These are flags that are difficult to evaluate using
objective criteria and/or are difficult to detect in the course of a desk review, even though many should be observable during the course of standard supervision. Examples include: Advertising in local or regional publications with small local circulation, or
national gazettes that have a restricted circulation. Excessive prior experience requirements that are disproportionate when
compared to the size of tendered goods/ services. Failure to answer requests for clarification in good time. Failure to provide secure storage of, and restricted access to, bids received.
3. Potentially irrelevant red flags or “red herrings”. The warning signs in this group
tend to be found in a great number of contracts, but are perhaps more likely indicators of weak reporting or confusing Bank procurement requirements. Examples include: Failure to include the names of the Bid evaluation commission in the bid
evaluation report. This was observed in 20 out of 55 contracts in our database, but it appears to be a peculiarity of local procurement practices rather than deliberate exclusion.
3 The LAC publication “Is your project at risk” also highlights important warning signs which may appear throughout the project cycle, however the language was difficult to convert into objective measures simple to evaluate during a desk review.
7
Deliberate omission of the ranking of quotations received. It is rarely the case that the bids are exactly ranked in bid evaluation reports, but the ranking is apparent from the tables on read-out bids and evaluated bids.
4. Observable, collectible and relevant red flags. This group comprises thirteen red
flags that will be discussed in detail below. The information necessary for identification of these red flags could be easily located in the BER, bidding documents and minutes of bid opening. The red flags in this category can also be objectively stated either as a number or dichotomous variable (yes/ no), which makes the aggregation of outcomes and interpretation of results straightforward. Examples include: Whether the lowest bidder was considered non-responsive. Difference between cost estimate and winning bid. Proportion of actual bidders out of all companies that purchased bidding
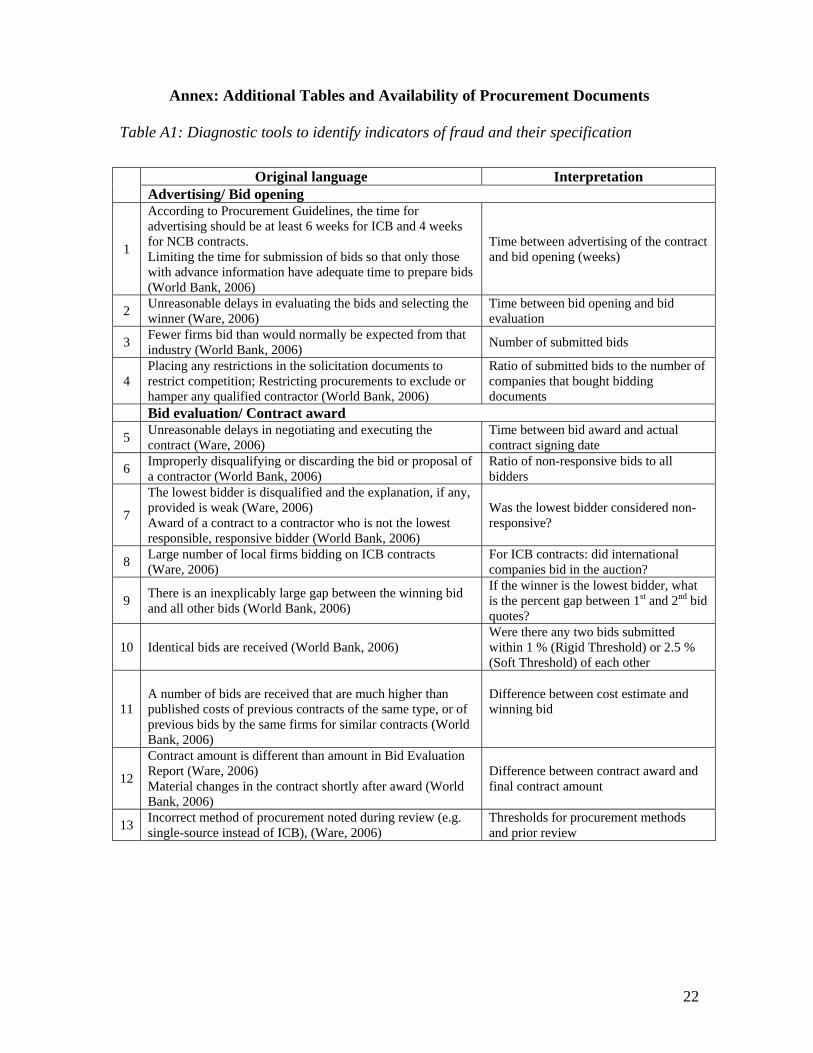
documents. We selected and specified 13 red flags out of the 67 warning signs suggested by Ware (2008, related to procurement and bidding stages of a project), and over 41 cited in World Bank (2007) (covering the phases from pre-solicitation to post-solicitation). Table 2 lists the red flags. Table A1 in the Annex compares the language regarding the flags used in the respective publications and the interpretation used in this analysis. We cannot cover the great majority of red flags proposed by any of the publications because we do not have necessary documentation or sources, we were not part of teams observing the projects as they rolled out, and/or red flags were not easily translated into objective measures comparable across projects. As generalists, we are also at some disadvantage compared either to sector experts in task teams who know the country and work on projects or INT investigators experienced in analyzing red flags. And the study examines possible red flags only at the project implementation stage (project identification and preparation stages lay beyond the scope of the study). It is therefore to be assumed that we will considerably under-identify red flags that would have been identified either by task teams who chose to look for them or by fraud and corruption investigators with greater access to files, staff and client records. We had to take varying approaches to measuring our selected red flags, as many of the indicators were open to subjective interpretation, or might vary according to circumstances:
For some indicators, an objective standard was applied if it appeared that this was relatively uncontroversial –for example, following World Bank procurement rules, the minimum period between public advertising and bid opening should be at least 6 weeks for ICB contracts
For others, the presence or absence of a red flag was based on a more subjective threshold decided by the team in consultation with procurement experts in the Bank (“unreasonable delays in evaluating bids and selecting a winner,” for example, was translated into a 3 month threshold).
8
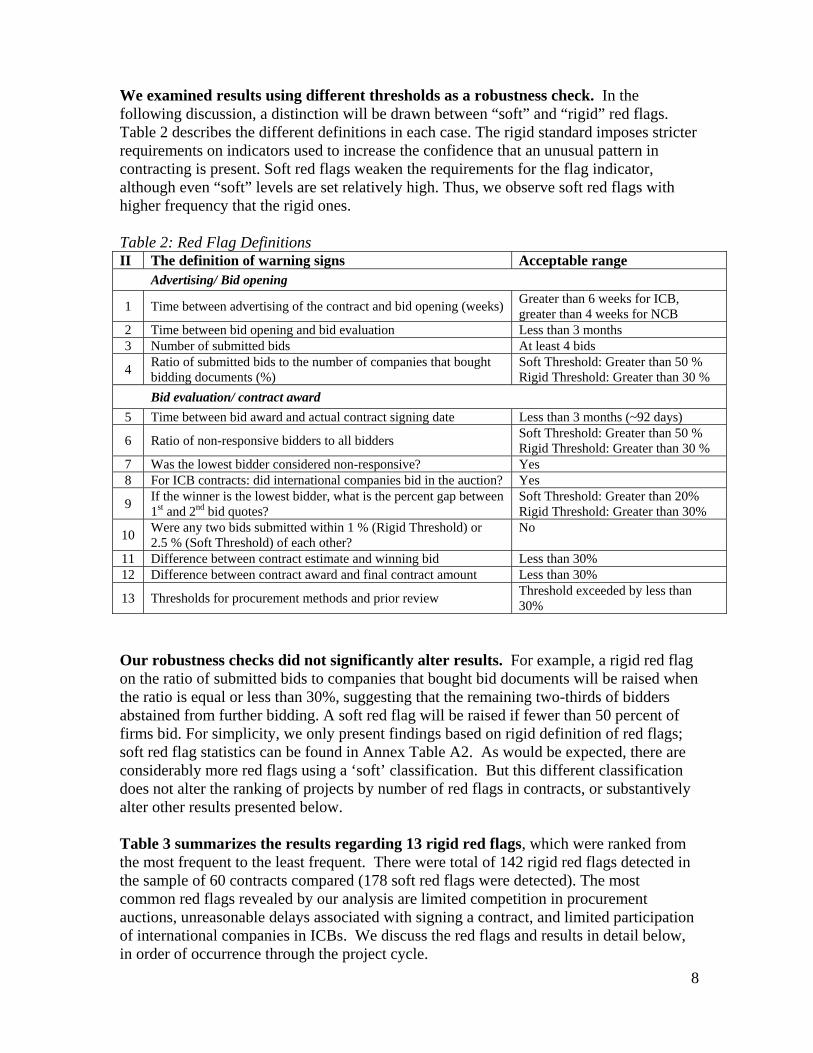
We examined results using different thresholds as a robustness check. In the following discussion, a distinction will be drawn between “soft” and “rigid” red flags. Table 2 describes the different definitions in each case. The rigid standard imposes stricter requirements on indicators used to increase the confidence that an unusual pattern in contracting is present. Soft red flags weaken the requirements for the flag indicator, although even “soft” levels are set relatively high. Thus, we observe soft red flags with higher frequency that the rigid ones. Table 2: Red Flag Definitions II The definition of warning signs Acceptable range Advertising/ Bid opening
1 Time between advertising of the contract and bid opening (weeks) Greater than 6 weeks for ICB, greater than 4 weeks for NCB
2 Time between bid opening and bid evaluation Less than 3 months 3 Number of submitted bids At least 4 bids
4 Ratio of submitted bids to the number of companies that bought bidding documents (%)
Soft Threshold: Greater than 50 % Rigid Threshold: Greater than 30 %
Bid evaluation/ contract award
5 Time between bid award and actual contract signing date Less than 3 months (~92 days)
6 Ratio of non-responsive bidders to all bidders Soft Threshold: Greater than 50 % Rigid Threshold: Greater than 30 %
7 Was the lowest bidder considered non-responsive? Yes 8 For ICB contracts: did international companies bid in the auction? Yes
9 If the winner is the lowest bidder, what is the percent gap between 1st and 2nd bid quotes?
Soft Threshold: Greater than 20% Rigid Threshold: Greater than 30%
10 Were any two bids submitted within 1 % (Rigid Threshold) or 2.5 % (Soft Threshold) of each other?
No
11 Difference between contract estimate and winning bid Less than 30% 12 Difference between contract award and final contract amount Less than 30%
13 Thresholds for procurement methods and prior review Threshold exceeded by less than 30%
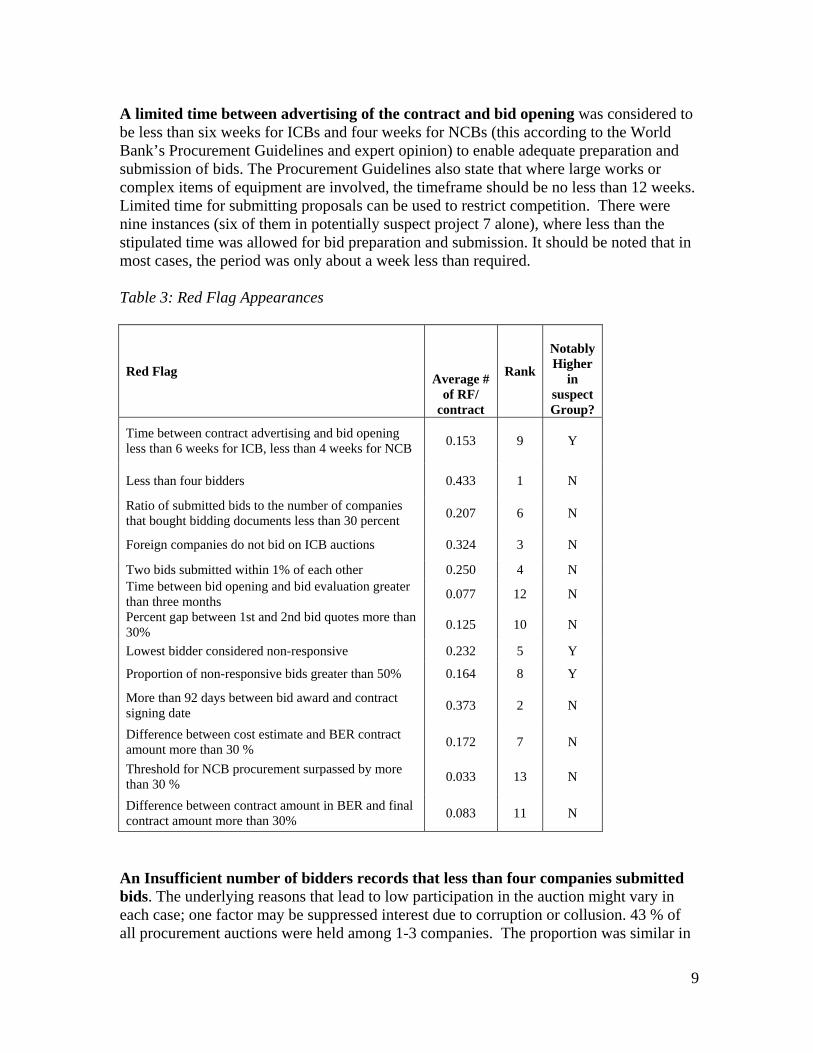
Our robustness checks did not significantly alter results. For example, a rigid red flag on the ratio of submitted bids to companies that bought bid documents will be raised when the ratio is equal or less than 30%, suggesting that the remaining two-thirds of bidders abstained from further bidding. A soft red flag will be raised if fewer than 50 percent of firms bid. For simplicity, we only present findings based on rigid definition of red flags; soft red flag statistics can be found in Annex Table A2. As would be expected, there are considerably more red flags using a ‘soft’ classification. But this different classification does not alter the ranking of projects by number of red flags in contracts, or substantively alter other results presented below. Table 3 summarizes the results regarding 13 rigid red flags, which were ranked from the most frequent to the least frequent. There were total of 142 rigid red flags detected in the sample of 60 contracts compared (178 soft red flags were detected). The most common red flags revealed by our analysis are limited competition in procurement auctions, unreasonable delays associated with signing a contract, and limited participation of international companies in ICBs. We discuss the red flags and results in detail below, in order of occurrence through the project cycle.
9
A limited time between advertising of the contract and bid opening was considered to be less than six weeks for ICBs and four weeks for NCBs (this according to the World Bank’s Procurement Guidelines and expert opinion) to enable adequate preparation and submission of bids. The Procurement Guidelines also state that where large works or complex items of equipment are involved, the timeframe should be no less than 12 weeks. Limited time for submitting proposals can be used to restrict competition. There were nine instances (six of them in potentially suspect project 7 alone), where less than the stipulated time was allowed for bid preparation and submission. It should be noted that in most cases, the period was only about a week less than required. Table 3: Red Flag Appearances
Red Flag Average #
of RF/ contract
Rank
Notably Higher
in suspect Group?
Time between contract advertising and bid opening less than 6 weeks for ICB, less than 4 weeks for NCB
0.153 9
Y
Less than four bidders 0.433 1 N
Ratio of submitted bids to the number of companies that bought bidding documents less than 30 percent
0.207 6 N
Foreign companies do not bid on ICB auctions 0.324 3 N
Two bids submitted within 1% of each other 0.250 4 N Time between bid opening and bid evaluation greater than three months
0.077 12 N
Percent gap between 1st and 2nd bid quotes more than 30%
0.125 10 N
Lowest bidder considered non-responsive 0.232 5 Y
Proportion of non-responsive bids greater than 50% 0.164 8 Y
More than 92 days between bid award and contract signing date
0.373 2 N
Difference between cost estimate and BER contract amount more than 30 %
0.172 7 N
Threshold for NCB procurement surpassed by more than 30 %
0.033 13 N
Difference between contract amount in BER and final contract amount more than 30%
0.083 11 N
An Insufficient number of bidders records that less than four companies submitted bids. The underlying reasons that lead to low participation in the auction might vary in each case; one factor may be suppressed interest due to corruption or collusion. 43 % of all procurement auctions were held among 1-3 companies. The proportion was similar in
10
control and potentially suspect projects. This contrasts with the African roads sample discussed in the introduction, where bids were lower amongst suspect contracts. A low ratio of submitted bids to the number of companies that bought bidding documents was considered 30 % or less. This can be a sign of the low quality of bidding documents, evidence of collusion, or suggest fears of corruption reduced firm interest in bidding. In our dataset, every fifth contract saw a 70 % non-submission rate. The ratio was the same for both potentially suspect and control projects. This matches evidence from the Africa transport sample. Foreign companies failing to bid on ICB auctions may be a sign of restricted competition or firm concerns with regard to corruption. This red flag appeared twelve times. Contracts in the potentially suspect group had just one instance of absence of international bidders, a lower ratio than the control group. The presence of two almost identical bids was considered to be two bids submitted within a 1% price range. This might signify potential problems with collusion or one bidder obtaining inside information from a government official. A small gap was revealed in a quarter of all cases. Submission of nearly identical bids occurred at similar rates in the control group and the potentially suspect group.4 A long lag between bid opening and bid evaluation was considered greater than three months. Longer periods of bid evaluation may allow for negotiation between corrupt bidders and officials to select a particular winner and agree post-award payments (or might merely represent competing priorities, limited capacity or the complexity of negotiations). In 39 cases from the sample (where relevant information was available), in only 3 instances did we note an extended bid evaluation period. All of these cases were in the control group. A considerable gap between 1st and 2nd bid quotes (in cases where the lowest bidder won) was measured as 30 percent or greater. As noted above, it is plausible to imagine that a favored company can substantially underbid its competitors in case of advance knowledge of confidential information or bribes that allow it to win with a non-responsive bid. Out of 40 contracts, for which this information was available, we detected 5 red flags of an unusually wide gap between the winning and the next lowest quote. Only one of these contracts was in the potentially suspect group. That the lowest bidder was considered non-responsive may in some circumstances be an indication of corruption influencing the selection procedure. In the study, we drew the conclusion with regard to the red flag of non-responsiveness based on read-out quotes, not on evaluated bids. Overall, in 13 procurement cases out of 60, the lowest (read out) 4 Collusion between bidders can also be detected by looking for evidence of obvious similarities between competing bids (e.g. format of bid, identical unit prices, identical spelling, grammatical and/ or arithmetic errors, photocopied documents); bid bonds acquired by competing bidders from the same financial institution; bid bonds with similar dates and/ or sequential serial numbers; bidders propose identical items; and documents from competing firms contain similar or identical company names, handwriting/ signatures, company stationary, invoice numbers, telephone numbers. However, the aforementioned warnings signs are much more difficult to detect and extract from procurement documents.
11
bidders were considered non-responsive, from which 9 were in the potentially suspect group of projects. A high proportion of non-responsive bids was considered 50 % or more. This may be a sign of (intentionally) poorly designed bid documents, attempts to weed out legitimate bids in favor of corrupt ones, or collusion in bidding. Based on the 50 % benchmark, there were 9 cases in the dataset, 6 of which were noted for the group of potentially suspect projects. A long period between bid award and contract signing dates was defined as greater than three months. This is a sign of extended negotiations between the counterparty and the company. Beyond their simple complexity, extended negotiations may arise due to side negotiations centering on kickbacks. Of course, depending on the corrupt activity being undertaken, a better red flag might be too rapid negotiation (perhaps suggesting a pre-cooked procurement result). The extended negotiation warning sign was observed in 22 contracts, which ranks this red flag second by the frequency of occurrence. But the proportion of red flags in suspect projects was lower than in non-suspect projects. A large difference between the cost estimate and BER contract amount was considered 30% or more. This may reflect inflated bid submissions and collusion, for example. Overall, there were 10 cases of such amount deviations observed in the sample, but only 2 out of 10 signs were noted in the group of potentially suspect projects. A project threshold for NCB procurement surpassed in the final contract was considered significant if it was by 30 percent or more. This may be a sign of weak procurement practices or an attempt to restrict competition via exclusion of international bidders. The thresholds defining maximum amounts for NCB bid processes for goods and services can be found in the project PAD. Manually comparing each contract in our sample to the PAD requirement, we found two instances where the PAD threshold for NCB was surpassed by 30 % or more, and yet the procurement method was not changed to ICB. Other procurement methods (shopping, direct contracting etc.) were not represented in the dataset. It is worth emphasizing that this red flag only applies to a subset of NCB contracts. This red flag was very rare, and the two cases were not bunched in the potentially suspect project group. A large difference between the initial contract amount and contract closure amount was considered (again) to be 30 percent or more. A possible scenario for corruption might be awarding a contract to a favored bidder at a low price, and then negotiating back payments to cover completion of the job alongside side payments. In the dataset, 8 % of the cases show substantial deviations of the final contract amounts over the original (BER) amount. It should be noted that most projects in the dataset are on-going, however, and so many contracts are yet to close. Out of 60 contracts, the contract overruns were noted only for 5 cases, including 1 in each of the potentially suspect projects –but this is not a significantly higher proportion than would be expected. In summary, all of our red flags appeared in at least two projects and as many as two-fifths of all contracts. With the exception of advertising times, non-responsive bids and, in particular, the exclusion of lowest bidders as non-responsive, potentially suspect
12
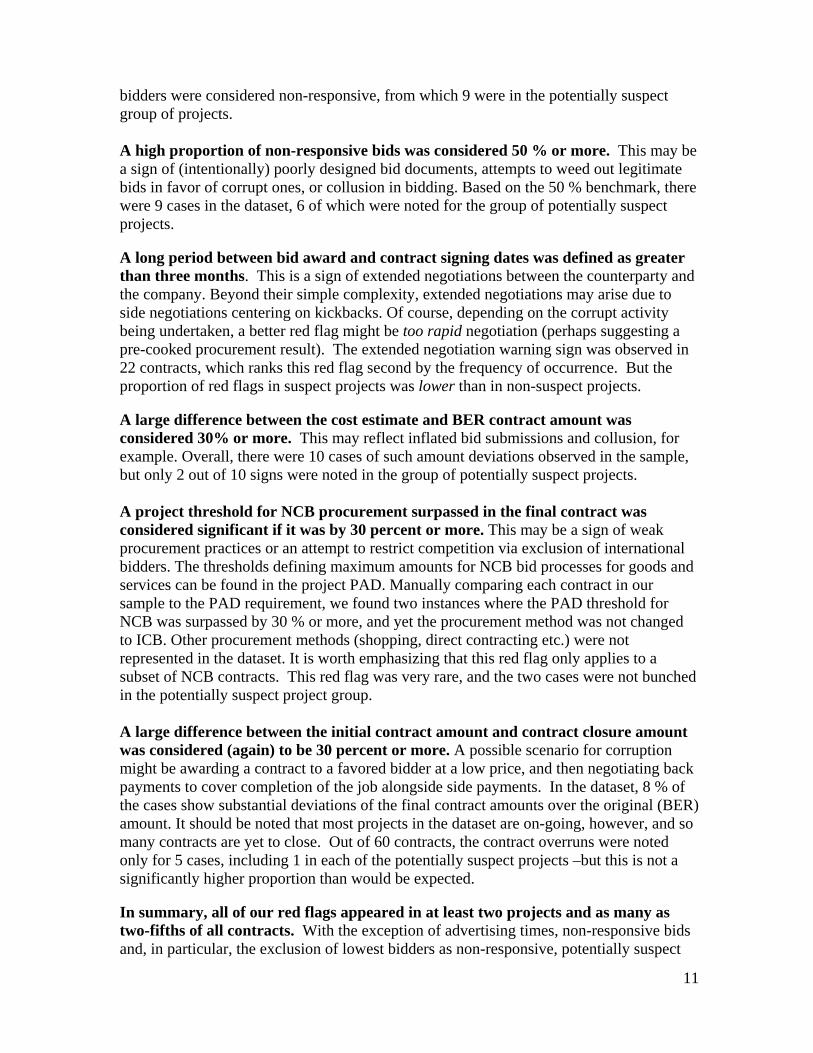
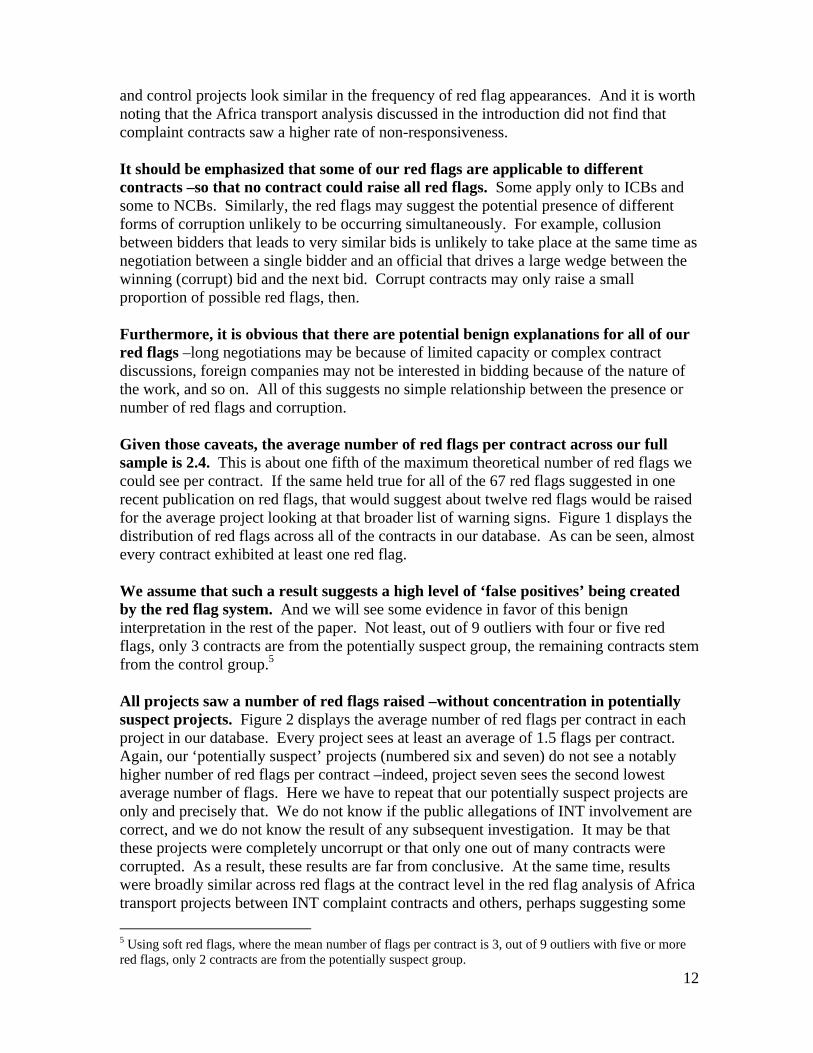
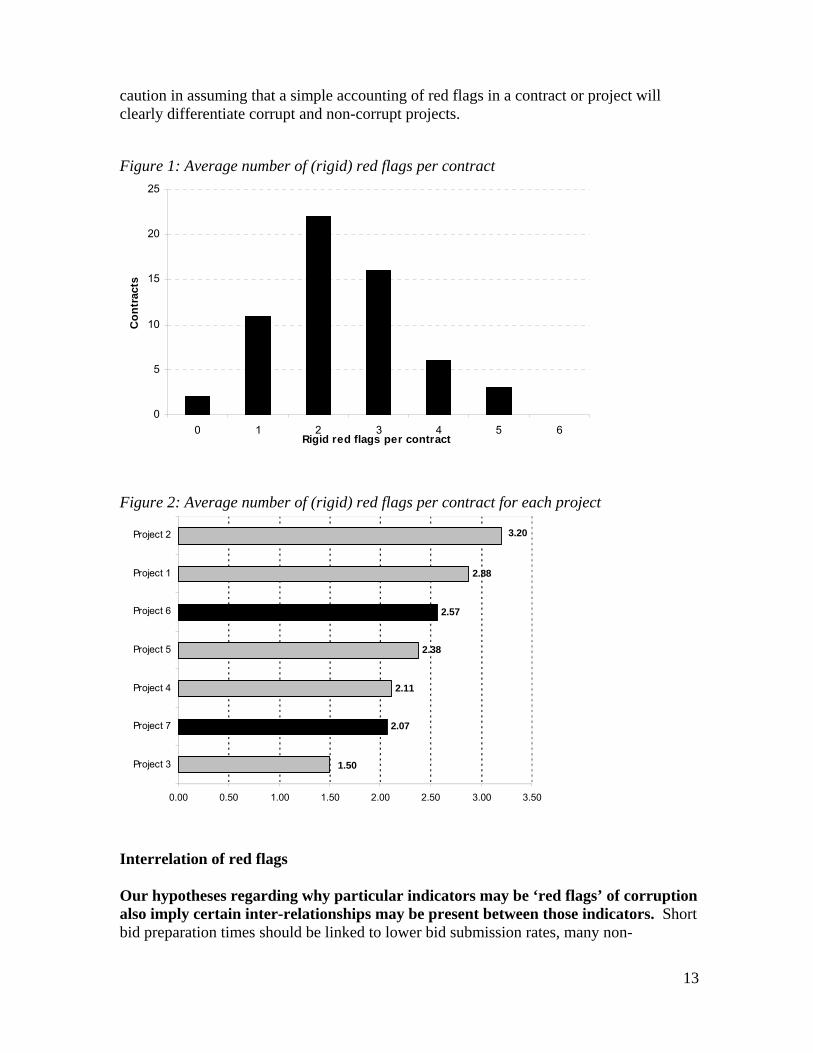
and control projects look similar in the frequency of red flag appearances. And it is worth noting that the Africa transport analysis discussed in the introduction did not find that complaint contracts saw a higher rate of non-responsiveness. It should be emphasized that some of our red flags are applicable to different contracts –so that no contract could raise all red flags. Some apply only to ICBs and some to NCBs. Similarly, the red flags may suggest the potential presence of different forms of corruption unlikely to be occurring simultaneously. For example, collusion between bidders that leads to very similar bids is unlikely to take place at the same time as negotiation between a single bidder and an official that drives a large wedge between the winning (corrupt) bid and the next bid. Corrupt contracts may only raise a small proportion of possible red flags, then. Furthermore, it is obvious that there are potential benign explanations for all of our red flags –long negotiations may be because of limited capacity or complex contract discussions, foreign companies may not be interested in bidding because of the nature of the work, and so on. All of this suggests no simple relationship between the presence or number of red flags and corruption. Given those caveats, the average number of red flags per contract across our full sample is 2.4. This is about one fifth of the maximum theoretical number of red flags we could see per contract. If the same held true for all of the 67 red flags suggested in one recent publication on red flags, that would suggest about twelve red flags would be raised for the average project looking at that broader list of warning signs. Figure 1 displays the distribution of red flags across all of the contracts in our database. As can be seen, almost every contract exhibited at least one red flag. We assume that such a result suggests a high level of ‘false positives’ being created by the red flag system. And we will see some evidence in favor of this benign interpretation in the rest of the paper. Not least, out of 9 outliers with four or five red flags, only 3 contracts are from the potentially suspect group, the remaining contracts stem from the control group.5 All projects saw a number of red flags raised –without concentration in potentially suspect projects. Figure 2 displays the average number of red flags per contract in each project in our database. Every project sees at least an average of 1.5 flags per contract. Again, our ‘potentially suspect’ projects (numbered six and seven) do not see a notably higher number of red flags per contract –indeed, project seven sees the second lowest average number of flags. Here we have to repeat that our potentially suspect projects are only and precisely that. We do not know if the public allegations of INT involvement are correct, and we do not know the result of any subsequent investigation. It may be that these projects were completely uncorrupt or that only one out of many contracts were corrupted. As a result, these results are far from conclusive. At the same time, results were broadly similar across red flags at the contract level in the red flag analysis of Africa transport projects between INT complaint contracts and others, perhaps suggesting some
5 Using soft red flags, where the mean number of flags per contract is 3, out of 9 outliers with five or more red flags, only 2 contracts are from the potentially suspect group.
13
caution in assuming that a simple accounting of red flags in a contract or project will clearly differentiate corrupt and non-corrupt projects. Figure 1: Average number of (rigid) red flags per contract
0
5
10
15
20
25
0 1 2 3 4 5 6Rigid red flags per contract
Co
ntr
acts
Figure 2: Average number of (rigid) red flags per contract for each project
2.07
2.11
2.38
2.57
2.88
1.50
3.20
0.00 0.50 1.00 1.50 2.00 2.50 3.00 3.50
Project 3
Project 7
Project 4
Project 5
Project 6
Project 1
Project 2
Interrelation of red flags Our hypotheses regarding why particular indicators may be ‘red flags’ of corruption also imply certain inter-relationships may be present between those indicators. Short bid preparation times should be linked to lower bid submission rates, many non-
14
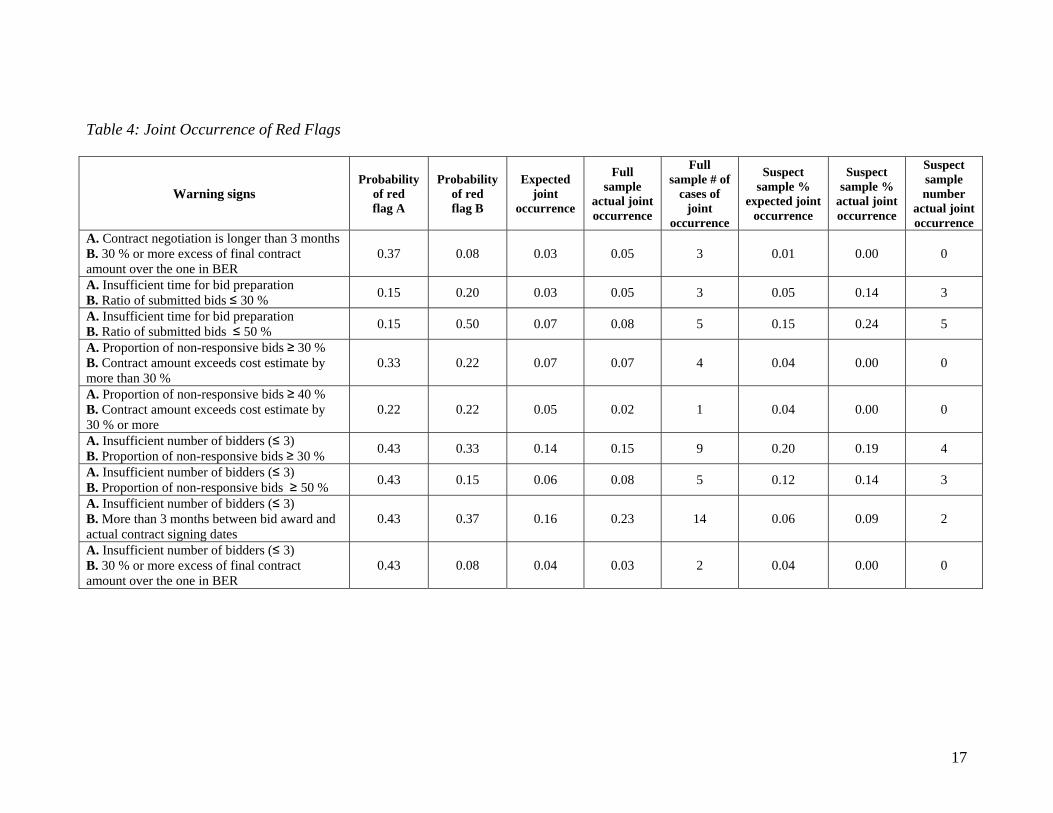
responsive bids (if linked to weak bidding documents) or few bidders might be linked to longer negotiation periods and/or contract escalation, for example. Our database is very small to study such joint occurrences. With two red flags that are individually rare, joint occurrences in a database of just 60 contracts would be expected in less than a handful of cases. With that caveat, we examine six such cases below. Table 4 lays out the probability of each red flag occurring individually and the random chance of joint occurrence assuming no relationship between the two. The next column lists the actual level of joint occurrence in the sample, and the statistics are repeated for suspect projects alone in subsequent columns. It is plausible to assume longer periods of negotiation between the auction winner and implementing agency might lead to an upward adjustment of the contract amount in cases where the contractor and official are negotiating the size of kickbacks and contract inflation needed to pay for them. In terms of the red flags in our database, the former is measured as the time difference between the date of bid evaluation report and the date of contract signature; while the latter is measured as the difference between contract amount in the bid evaluation report and in Client Connection. However, examination of the simultaneous occurrence of the red flags in question provides weak support for the hypothesis. Out of 21 cases in the database of long negotiation periods, only three also saw significant price inflation (although all cases of price inflation did see longer negotiation). And neither of the cases of long negotiation in the potentially suspect group of projects led to inflated contracts.6 We might assume that bid preparation time should be directly related to bid submission activity. The logic of the bid submission time red flag is that it suggests a potential effort to reduce competition. If insufficient time is allowed for bid submission, this deprives potential bidders of time to prepare necessary material to make a bid. Evidence for this is weak. For the control group, although we observe 3 violations of the Procurement Guidelines with regard to advertising time, and 8 cases of low turn out of submitted bids, none of these cases reveals a joint occurrence with low bid submission activity. For the two potentially suspect projects, only project 7 revealed some relationship between low turn out of submitted bids and insufficient time allowed for bid preparation. On the basis of one potentially suspect project, then, it may be corrupt projects do on occasion see limited bid times, but overall joint occurrence is only marginally more common than would be expected if there was no relationship between the flags. Again, a high proportion of non-responsive bids does not appear to be related to substantial cost overruns. This would occur if a high proportion of non-responsive bids was due to attempts to limit competition and/or produce vague bid documents which offer opportunities for padding contracts to a corrupt winning bidder. In cases involving either a thirty or a forty percent non-responsive bid rate, however, there is no evidence that joint
6 A great number of contracts have not yet been completed; thus the contract amounts can be subject to further modifications and amendments.
15
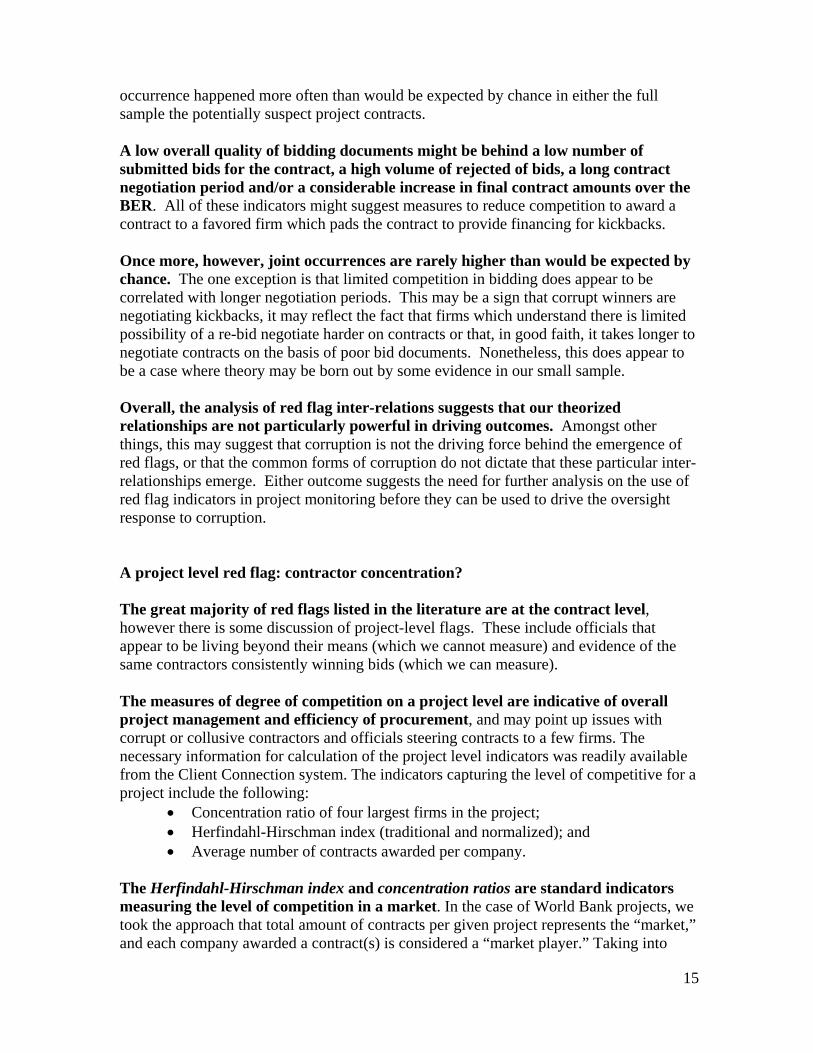
occurrence happened more often than would be expected by chance in either the full sample the potentially suspect project contracts. A low overall quality of bidding documents might be behind a low number of submitted bids for the contract, a high volume of rejected of bids, a long contract negotiation period and/or a considerable increase in final contract amounts over the BER. All of these indicators might suggest measures to reduce competition to award a contract to a favored firm which pads the contract to provide financing for kickbacks. Once more, however, joint occurrences are rarely higher than would be expected by chance. The one exception is that limited competition in bidding does appear to be correlated with longer negotiation periods. This may be a sign that corrupt winners are negotiating kickbacks, it may reflect the fact that firms which understand there is limited possibility of a re-bid negotiate harder on contracts or that, in good faith, it takes longer to negotiate contracts on the basis of poor bid documents. Nonetheless, this does appear to be a case where theory may be born out by some evidence in our small sample. Overall, the analysis of red flag inter-relations suggests that our theorized relationships are not particularly powerful in driving outcomes. Amongst other things, this may suggest that corruption is not the driving force behind the emergence of red flags, or that the common forms of corruption do not dictate that these particular inter-relationships emerge. Either outcome suggests the need for further analysis on the use of red flag indicators in project monitoring before they can be used to drive the oversight response to corruption. A project level red flag: contractor concentration? The great majority of red flags listed in the literature are at the contract level, however there is some discussion of project-level flags. These include officials that appear to be living beyond their means (which we cannot measure) and evidence of the same contractors consistently winning bids (which we can measure). The measures of degree of competition on a project level are indicative of overall project management and efficiency of procurement, and may point up issues with corrupt or collusive contractors and officials steering contracts to a few firms. The necessary information for calculation of the project level indicators was readily available from the Client Connection system. The indicators capturing the level of competitive for a project include the following:
Concentration ratio of four largest firms in the project; Herfindahl-Hirschman index (traditional and normalized); and Average number of contracts awarded per company.
The Herfindahl-Hirschman index and concentration ratios are standard indicators measuring the level of competition in a market. In the case of World Bank projects, we took the approach that total amount of contracts per given project represents the “market,” and each company awarded a contract(s) is considered a “market player.” Taking into
16
account only goods and works contracts, and excluding non-core contracts (procurement of laboratory furniture, supply and installation of information systems and so on), we calculated relative market shares of each company. We calculated both standard HHI and normalized HHI. The latter index takes into account the number of firms in the market, and ranges from 0 to 1 (instead of 1/N to 1 for traditional HHI). The concentration ratio measures the percentage of project expenditures accruing to the largest four firms involved in contracting on the project. In order to ensure we are capturing actual levels of competition rather than project design idiosyncrasies, some comparator statistics were also collected from Client Connection and bid evaluation reports of the contracts included in the sample:
Average number of bidders per contract; Percentage of project expenditures accounted for by the largest and largest
three contracts; Number of contracts; Unique bidders compared to all bidders across contracts.
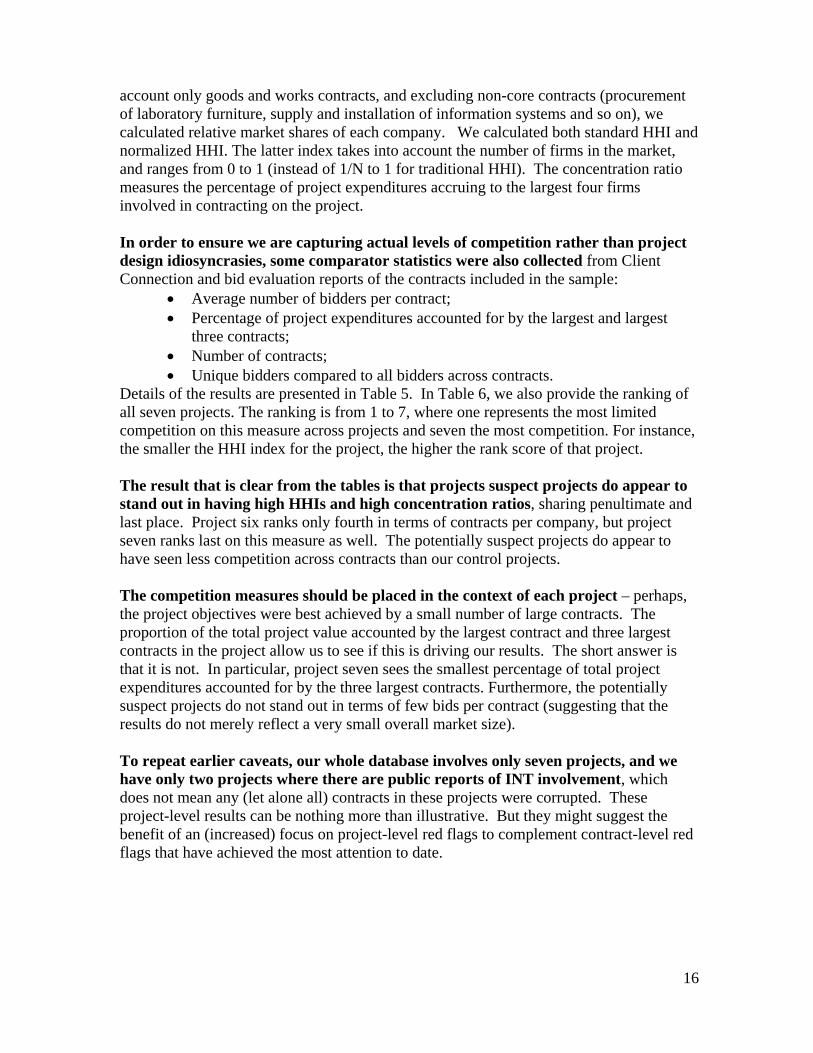
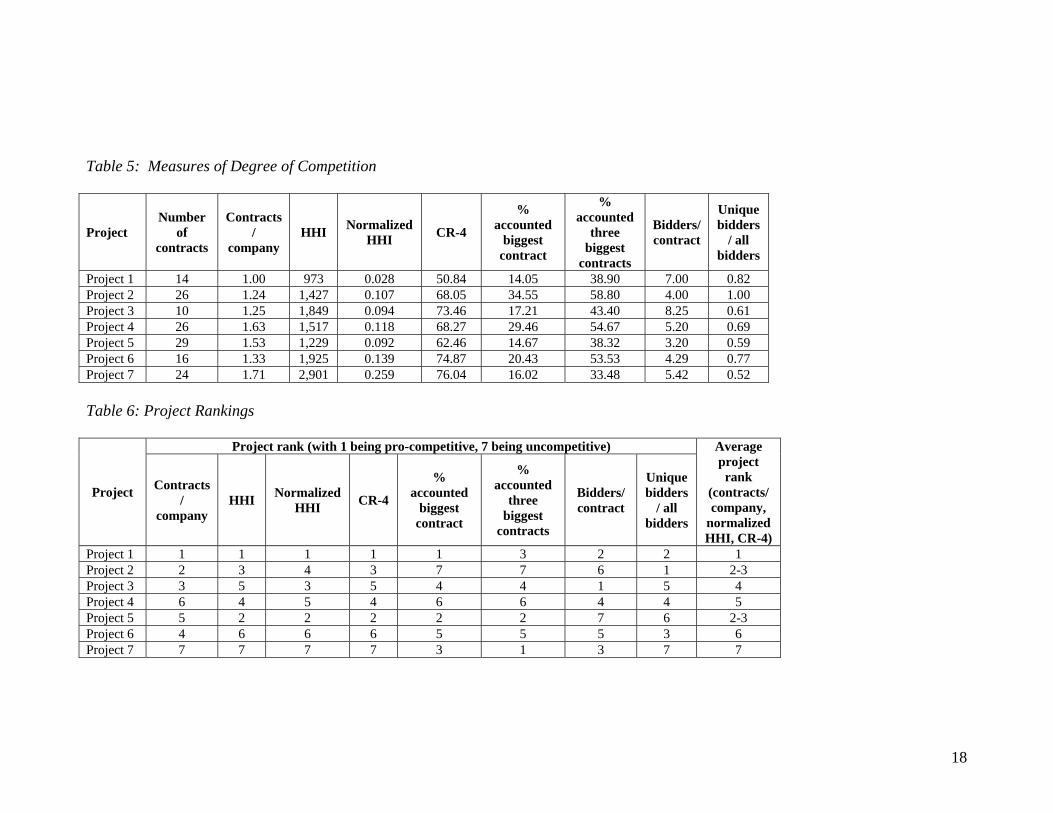
Details of the results are presented in Table 5. In Table 6, we also provide the ranking of all seven projects. The ranking is from 1 to 7, where one represents the most limited competition on this measure across projects and seven the most competition. For instance, the smaller the HHI index for the project, the higher the rank score of that project. The result that is clear from the tables is that projects suspect projects do appear to stand out in having high HHIs and high concentration ratios, sharing penultimate and last place. Project six ranks only fourth in terms of contracts per company, but project seven ranks last on this measure as well. The potentially suspect projects do appear to have seen less competition across contracts than our control projects. The competition measures should be placed in the context of each project – perhaps, the project objectives were best achieved by a small number of large contracts. The proportion of the total project value accounted by the largest contract and three largest contracts in the project allow us to see if this is driving our results. The short answer is that it is not. In particular, project seven sees the smallest percentage of total project expenditures accounted for by the three largest contracts. Furthermore, the potentially suspect projects do not stand out in terms of few bids per contract (suggesting that the results do not merely reflect a very small overall market size). To repeat earlier caveats, our whole database involves only seven projects, and we have only two projects where there are public reports of INT involvement, which does not mean any (let alone all) contracts in these projects were corrupted. These project-level results can be nothing more than illustrative. But they might suggest the benefit of an (increased) focus on project-level red flags to complement contract-level red flags that have achieved the most attention to date.
17
Table 4: Joint Occurrence of Red Flags
Warning signs Probability
of red flag A
Probability of red flag B
Expected joint
occurrence
Full sample
actual joint occurrence
Full sample # of
cases of joint
occurrence
Suspect sample %
expected joint occurrence
Suspect sample %
actual joint occurrence
Suspect sample number
actual joint occurrence
A. Contract negotiation is longer than 3 months B. 30 % or more excess of final contract amount over the one in BER
0.37 0.08 0.03 0.05 3 0.01 0.00 0
A. Insufficient time for bid preparation B. Ratio of submitted bids ≤ 30 %
0.15 0.20 0.03 0.05 3 0.05 0.14 3
A. Insufficient time for bid preparation B. Ratio of submitted bids ≤ 50 %
0.15 0.50 0.07 0.08 5 0.15 0.24 5
A. Proportion of non-responsive bids ≥ 30 % B. Contract amount exceeds cost estimate by more than 30 %
0.33 0.22 0.07 0.07 4 0.04 0.00 0
A. Proportion of non-responsive bids ≥ 40 % B. Contract amount exceeds cost estimate by 30 % or more
0.22 0.22 0.05 0.02 1 0.04 0.00 0
A. Insufficient number of bidders (≤ 3) B. Proportion of non-responsive bids ≥ 30 %
0.43 0.33 0.14 0.15 9 0.20 0.19 4
A. Insufficient number of bidders (≤ 3) B. Proportion of non-responsive bids ≥ 50 %
0.43 0.15 0.06 0.08 5 0.12 0.14 3
A. Insufficient number of bidders (≤ 3) B. More than 3 months between bid award and actual contract signing dates
0.43 0.37 0.16 0.23 14 0.06 0.09 2
A. Insufficient number of bidders (≤ 3) B. 30 % or more excess of final contract amount over the one in BER
0.43 0.08 0.04 0.03 2 0.04 0.00 0
18
Table 5: Measures of Degree of Competition
Project Number
of contracts
Contracts/
company HHI
Normalized HHI
CR-4
% accounted
biggest contract
% accounted
three biggest
contracts
Bidders/ contract
Unique bidders
/ all bidders
Project 1 14 1.00 973 0.028 50.84 14.05 38.90 7.00 0.82 Project 2 26 1.24 1,427 0.107 68.05 34.55 58.80 4.00 1.00 Project 3 10 1.25 1,849 0.094 73.46 17.21 43.40 8.25 0.61 Project 4 26 1.63 1,517 0.118 68.27 29.46 54.67 5.20 0.69 Project 5 29 1.53 1,229 0.092 62.46 14.67 38.32 3.20 0.59 Project 6 16 1.33 1,925 0.139 74.87 20.43 53.53 4.29 0.77 Project 7 24 1.71 2,901 0.259 76.04 16.02 33.48 5.42 0.52 Table 6: Project Rankings
Project
Project rank (with 1 being pro-competitive, 7 being uncompetitive) Average project rank
(contracts/ company,
normalized HHI, CR-4)
Contracts/
company HHI
Normalized HHI
CR-4
% accounted
biggest contract
% accounted
three biggest
contracts
Bidders/ contract
Unique bidders
/ all bidders
Project 1 1 1 1 1 1 3 2 2 1 Project 2 2 3 4 3 7 7 6 1 2-3 Project 3 3 5 3 5 4 4 1 5 4 Project 4 6 4 5 4 6 6 4 4 5 Project 5 5 2 2 2 2 2 7 6 2-3 Project 6 4 6 6 6 5 5 5 3 6 Project 7 7 7 7 7 3 1 3 7 7
19
Conclusion
This paper is exploratory and results cannot be seen as conclusive. The sample was small, and it involved only two projects where corruption was suspected (not proven). In the circumstances, strong results would not be expected.
But the results do suggest that red flags are ubiquitous. The average red flag in our sample was raised in one contract out of five. Almost every contract saw at least one red flag raised. Furthermore, the average suspect contract did not have notably more red flags than control contracts, and across the combined set of African transport projects and our water sample, no particular red flag was consistently and significantly more present in suspect contracts than control contracts.
Red flags of the type we could monitor do not, by any means, necessarily signal corruption. Indeed, the red flags we could evaluate can all be explained in terms of problems completely unrelated to corruption –lack of capacity, technical complexity or chance, for example. Given the lack of inter-relationships between the red flags we examined that we might expect to see if particular forms of corrupt relationships were occurring, and the overall ubiquity of red flags, these innocent explanations are probably the dominant drivers of red flag occurrence.
And only a sub-set of red flags is likely to be triggered in a corrupt project. The different red flags are clearly connected to different forms of corrupt activity. Collusion absent the involvement of an official will raise different flags from a corrupt official working with a favored bidder. Pre-cooked corrupt contracts may not need long negotiation periods. This suggests many red flags will not be triggered even by a completely corrupted project.
A high level of false positives and false negatives will occur with the less specific red flags, then, and this makes for considerable noise. It may be that corrupt projects will raise red flags, but they will raise only a few out of the many on offer in corruption warning signs publications, in an environment where many flags are raised for non-corrupt reasons.
This suggests the need for greater refinement before red flags are used by task teams to monitor corruption risk. One non-specific red flag is not necessarily a good corruption warning sign. Perhaps neither are multiple red flags –in that it does not necessarily take multiple non-specific red flags to corrupt a project. A ‘zero tolerance’ approach to red flags will involve investigating the vast majority of Bank-financed contracts. An ‘accounting approach’ which triggers enhanced oversight if the number of red flags on a particular contract climbs above some number X may uncover no more corruption than a randomized oversight approach. And the level of ubiquity and uncertainty surrounding flags may create incentives to ignore rather than act, which will have negative impacts in terms of both corruption monitoring and project progress.
Even non-specific red flags do have great utility, as demonstrated by their continued use in INT investigations. But it is worth noting that (with the partial exception of DIRs) they are used by INT to support investigations following an allegation of corruption. This allegation provides the initial impetus for investigation, and then the appropriate red flag measures linked to the type of corruption alleged can be used to support further analysis.
20
This is probably the better methodology for task teams to follow with non-specific red flags –if task teams are given reason to suspect corruption, they should examine the red flags associated with that particular form of corruption to see if they provide additional evidence in favor of the allegation (at which point, they would do well to call in INT).
More specific red flags –evidence of pressure on BER committee members, for example—are clearly significant. While less likely to be immediately apparent in the course of usual supervision, these specific red flags would alone justify greater oversight and further investigation. Task teams should be sensitized to be on the lookout for such flags –and to act on evidence if it is presented. Teams should also go to greater effort to monitor the more easily observed clear warning signs during supervision –bid securities with sequential numbers, bids from companies registered at the same address. They should also go to greater effort to look for physical signs of corruption and project mismanagement.
We may also want to take a closer look at project-level red flags. The very preliminary evidence presented here in favor of such flags is far from sufficient to justify rollout. However, it may be worth performing further analysis of such indicators to indicate projects facing ‘systemic risk’ of corruption.
Finally, even if multiple non-specific red flags of the sort we have measured do not necessarily point up corruption, they do point up issues with project implementation. Low levels of competition, slow evaluation and negotiation, contract price increases –all speak to sub-optimal project impact. That such problems appear ubiquitous in our sample should raise concerns beyond those of corruption. The problems suggest a role for wider collection and monitoring of ‘red flag’ indicators not necessarily as corruption warning signs, but as implementation warning signs. If some sectors or countries consistently trip more of such indicators in projects, this would suggest the need for capacity building and oversight, corruption or no.
21
References
Alexeeva, V., G. Padam and C. Queiroz (2008) Monitoring Road Works Contracts and Unit Costs in Sub-Saharan Africa for Enhanced Governance, mimeo, World Bank.
Casartelli, G. and E. Wolfstetter (2007) World Bank Policy on Selection and Employment of Consultants: Study of Its Effectiveness, mimeo, World Bank.
Davis, J. (2004) Corruption in public service delivery: experience from South Asia’s water and sanitation sector, World Development Vol. 32, No. 1
INT (World Bank Department of Institutional Integrity) (2008a) Annual Integrity Report FY 2007, Washington DC: World Bank
INT (World Bank Department of Institutional Integrity) (2008b) Detailed Implementation Review: India Health Sector, Washington DC: World Bank
INT (World Bank Department of Institutional Integrity) (2007) Annual Integrity Report 2005-2006, Washington DC: World Bank
Olken, B. (2004) Monitoring Corruption: Evidence from a Field Experiment in Indonesia, NBER Working Paper 11753.
Ware, T. Glenn. (2006) Addressing systematic and grand corruption at the local level: a guide for World Bank staff, Washington DC: World Bank.
_______________(2007) Corruption Warning Signs: Is Your Project at Risk? Good Practices in Latin America and the Caribbean Vol. 1, No. 1.Washington DC: World Bank
_______________.(2006) Project appraisal document on a proposed loan to the Republic of Paraguay for a Road maintenance project. Report No: 3642. Washington DC: World Bank.
22
Annex: Additional Tables and Availability of Procurement Documents Table A1: Diagnostic tools to identify indicators of fraud and their specification
Original language Interpretation Advertising/ Bid opening
1
According to Procurement Guidelines, the time for advertising should be at least 6 weeks for ICB and 4 weeks for NCB contracts. Limiting the time for submission of bids so that only those with advance information have adequate time to prepare bids (World Bank, 2006)
Time between advertising of the contract and bid opening (weeks)
2 Unreasonable delays in evaluating the bids and selecting the winner (Ware, 2006)
Time between bid opening and bid evaluation
3 Fewer firms bid than would normally be expected from that industry (World Bank, 2006)
Number of submitted bids
4 Placing any restrictions in the solicitation documents to restrict competition; Restricting procurements to exclude or hamper any qualified contractor (World Bank, 2006)
Ratio of submitted bids to the number of companies that bought bidding documents
Bid evaluation/ Contract award
5 Unreasonable delays in negotiating and executing the contract (Ware, 2006)
Time between bid award and actual contract signing date
6 Improperly disqualifying or discarding the bid or proposal of a contractor (World Bank, 2006)
Ratio of non-responsive bids to all bidders
7
The lowest bidder is disqualified and the explanation, if any, provided is weak (Ware, 2006) Award of a contract to a contractor who is not the lowest responsible, responsive bidder (World Bank, 2006)
Was the lowest bidder considered non-responsive?
8 Large number of local firms bidding on ICB contracts (Ware, 2006)
For ICB contracts: did international companies bid in the auction?
9 There is an inexplicably large gap between the winning bid and all other bids (World Bank, 2006)
If the winner is the lowest bidder, what is the percent gap between 1st and 2nd bid quotes?
10 Identical bids are received (World Bank, 2006) Were there any two bids submitted within 1 % (Rigid Threshold) or 2.5 % (Soft Threshold) of each other
11
A number of bids are received that are much higher than published costs of previous contracts of the same type, or of previous bids by the same firms for similar contracts (World Bank, 2006)
Difference between cost estimate and winning bid
12
Contract amount is different than amount in Bid Evaluation Report (Ware, 2006) Material changes in the contract shortly after award (World Bank, 2006)
Difference between contract award and final contract amount
13 Incorrect method of procurement noted during review (e.g. single-source instead of ICB), (Ware, 2006)
Thresholds for procurement methods and prior review
23
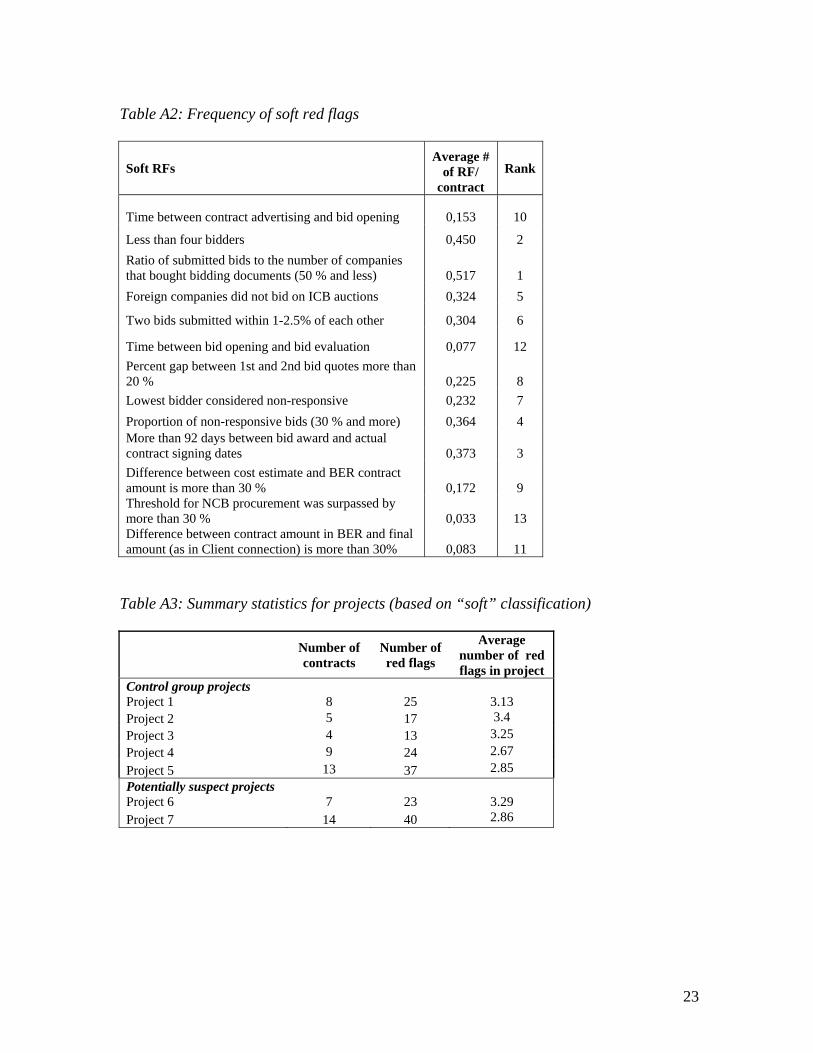
Table A2: Frequency of soft red flags
Soft RFs Average #
of RF/ contract
Rank
Time between contract advertising and bid opening 0,153 10
Less than four bidders 0,450 2
Ratio of submitted bids to the number of companies that bought bidding documents (50 % and less) 0,517 1
Foreign companies did not bid on ICB auctions 0,324 5
Two bids submitted within 1-2.5% of each other 0,304 6
Time between bid opening and bid evaluation 0,077 12
Percent gap between 1st and 2nd bid quotes more than 20 % 0,225 8
Lowest bidder considered non-responsive 0,232 7
Proportion of non-responsive bids (30 % and more) 0,364 4 More than 92 days between bid award and actual contract signing dates 0,373 3
Difference between cost estimate and BER contract amount is more than 30 % 0,172 9 Threshold for NCB procurement was surpassed by more than 30 % 0,033 13 Difference between contract amount in BER and final amount (as in Client connection) is more than 30% 0,083 11
Table A3: Summary statistics for projects (based on “soft” classification)
Number of contracts
Number of red flags
Average number of red flags in project
Control group projects Project 1
8 25
3.13
Project 2 5 17 3.4
Project 3 4 13 3.25
Project 4 9 24 2.67
Project 5 13 37 2.85
Potentially suspect projects Project 6 7 23
3.29
Project 7 14 40 2.86
24
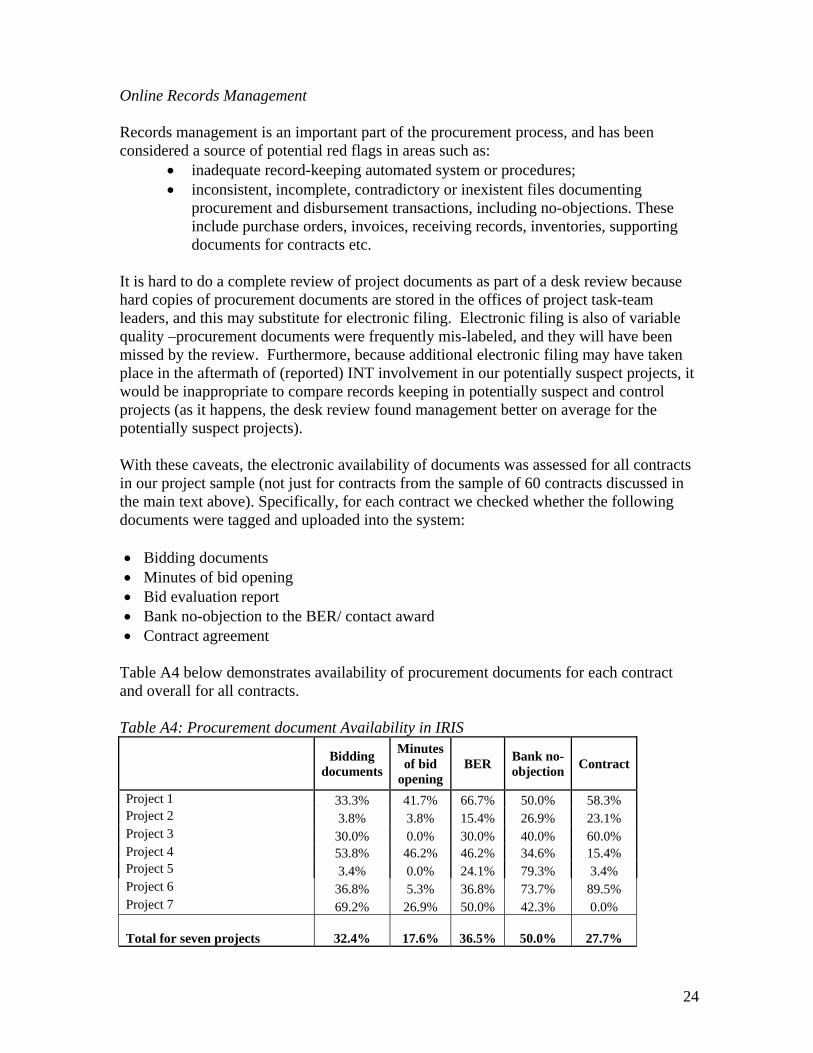
Online Records Management Records management is an important part of the procurement process, and has been considered a source of potential red flags in areas such as:
inadequate record-keeping automated system or procedures; inconsistent, incomplete, contradictory or inexistent files documenting
procurement and disbursement transactions, including no-objections. These include purchase orders, invoices, receiving records, inventories, supporting documents for contracts etc.
It is hard to do a complete review of project documents as part of a desk review because hard copies of procurement documents are stored in the offices of project task-team leaders, and this may substitute for electronic filing. Electronic filing is also of variable quality –procurement documents were frequently mis-labeled, and they will have been missed by the review. Furthermore, because additional electronic filing may have taken place in the aftermath of (reported) INT involvement in our potentially suspect projects, it would be inappropriate to compare records keeping in potentially suspect and control projects (as it happens, the desk review found management better on average for the potentially suspect projects). With these caveats, the electronic availability of documents was assessed for all contracts in our project sample (not just for contracts from the sample of 60 contracts discussed in the main text above). Specifically, for each contract we checked whether the following documents were tagged and uploaded into the system: Bidding documents Minutes of bid opening Bid evaluation report Bank no-objection to the BER/ contact award Contract agreement
Table A4 below demonstrates availability of procurement documents for each contract and overall for all contracts. Table A4: Procurement document Availability in IRIS
Bidding documents
Minutes of bid
opening BER
Bank no-objection
Contract
Project 1 33.3% 41.7% 66.7% 50.0% 58.3% Project 2 3.8% 3.8% 15.4% 26.9% 23.1% Project 3 30.0% 0.0% 30.0% 40.0% 60.0% Project 4 53.8% 46.2% 46.2% 34.6% 15.4% Project 5 3.4% 0.0% 24.1% 79.3% 3.4% Project 6 36.8% 5.3% 36.8% 73.7% 89.5% Project 7 69.2% 26.9% 50.0% 42.3% 0.0% Total for seven projects 32.4% 17.6% 36.5% 50.0% 27.7%
25
The data suggest that there is a significant potential to improve online records management. For the sample of 7 projects in water sector, comprising 148 contracts, bid evaluation reports were available in less than 20 % of all cases; contract files in less than 40 %, and bidding documents in only a half of all observations. Almost every project saw some effort to upload some files in every stage, but it was an extremely patchy effort –or at least a poorly tagged effort at every stage in every project.