Embed Size (px)
Citation preview
Title
WHITE PAPER
Redefine Your Analytics Journey With Interactive Data Exploration and Predictive AnalyticsFive steps to getting more value from your data and analytical investments
ii
ContentsMoving the Analytical Needle: Why Is It So Difficult? .................................. 1
What do organizations really need? .........................................................................1
How SAS® can help .......................................................................................................2
Give Your Staff the Flexibility and Ease of Use Needed to Quickly Solve Business Problems ..................................................................... 2
In-Memory Platform Is Key to Rapid, Iterative Predictive Modeling ......... 3
Five Steps to Getting More Value From Data................................................. 4
Step 1: Interactively explore and prepare data ......................................................4
Step 2: Use flexible interfaces and sophisticated techniques to build analyti-cal models ......................................................................................................................4
Step 3: Compare and assess models to find the best performer ......................7
Step 4: Collaborate and elaborate ...........................................................................7
Step 5: Put models into production and deliver results .......................................8
Solution Recap ...................................................................................................... 8
SAS® Visual Analytics: What does it do? ..................................................................8
SAS® Visual Statistics: What does it do? ...................................................................8
Extend the Use of Analytics in Your Organization ......................................... 8
Marketing analysts ........................................................................................................8
Risk modelers ................................................................................................................8
Statisticians .....................................................................................................................8
Conclusion ............................................................................................................ 9
Moving the Analytical Needle: Why Is It So Difficult?Let’s face it. Getting answers to business questions that change each day, and using data that changes even more often, is not easy. If it were, every decision would be data driven and no organization would struggle to know the best way to handle constantly evolving market conditions and consumer desires.
Everyone knows you need analytics to get insights from data. But many organizations still have problems getting the value they desire from their data and analytical invest-ments. What’s the best way to broaden the reach of analytics, drive differentiation and beat your competitors?
The answer lies in pushing analytical insights deeper into your organization. That requires a flexible, powerful environment that lets your analytical professionals cycle quickly through hypotheses, data explorations, model building and applying results. And then easily share their findings and collaborate with their line-of-business partners, who can also explore results in an environment they are comfortable with.
If you combine these requirements with the desire to use new sources of data, incorpo-rate ever-changing variables and perform complex computations, all while improving productivity – then it’s clear why finding an analytical solution that delivers real value is a challenge. And why it’s important to choose a data exploration and predictive analytics tool that is suited to the size, maturity and needs of your analytics teams.
What do organizations really need?Ease of use has been the predominant buying criteria for business intelligence (BI) and analytical platforms over the last decade. It’s become a de facto standard – moving to the forefront as the user base for analytics expanded beyond a limited number of statis-ticians and data scientists to a broader set of quantitative business analysts and special-ists (e.g., marketing, risk or financial analysts).
And while extending access to self-service analytics has been helpful, many organizations say that finding and retaining analytical talent and providing them with a productive envi-ronment remains the biggest barrier to realizing value from data.
That’s why it’s imperative to provide powerful, yet flexible, tools that help analytical teams work more easily in each phase of the analytical workflow – from data preparation and exploration to model development and deployment.
There are times when a fast, easy visual drag-and-drop interface will greatly expedite data exploration and model building. And, there are times when your data scientists and statis-ticians need extremely powerful coding capabilities to build and fine-tune analytical models – preferably in the programming language of their choice. That’s what SAS Visual Analytics and SAS Visual Statistics together can provide.
1
2
How SAS® can help• The combination of SAS Visual Analytics and SAS Visual Statistics provides interac-
tive data exploration and predictive analytics through visual or programming inter-faces to help analytical teams be more productive.
• An in-memory analytics platform that supports scalable, distributed processing means faster answers to iterative questions and the ability to scale environments as needed to handle complex computations, more users and more data.
These features empower analytically skilled users to focus on what they do the best (building models and finding answers to business problems), while enabling collabora-tion with business analysts and domain experts to quickly refine models that produce optimized results and real value from data assets.
Give Your Staff the Flexibility and Ease of Use Needed to Quickly Solve Business ProblemsOrganizations continue to rank analytics as their top technology priority because people know that predictive analytics can produce insights that increase revenue, promote growth and drive innovation. Yet, despite technology advances, many struggle to get the value they hoped for from their data and analytical investments. How can we change that?
It only makes sense that ease of use is an important criteria for choosing analytical software. Your solution should be interactive and approachable so users with different skill levels can explore data, find answers and share results on their own.
At the same time, you want to give data scientists and other analytical professionals the power and flexibility they need to dive deep into creating the best models, using their choice of visual or programming interfaces for increased productivity. They need the ability to quickly refine models to target different segments, choose different variables and experiment with different modeling techniques.
Is it possible to have all of this in a single platform? With SAS, the answer is yes.
SAS Visual Analytics provides a highly interactive user experience that combines data visualization, an easy-to-use interface and fast in-memory technology. Even nontech-nical users can explore data, create visualizations and dynamically share results. And, it enables statisticians and data scientists to explore data relationships before they dive deep into model building and refinement. They can quickly and visually examine different variables to gain a better understanding of the data and what factors are influ-encing the desired outcomes.
SAS Visual Statistics adds a flexible predictive modeling environment for analytical professionals. They can quickly query, summarize, filter, aggregate and visualize data, as well as create, compare and deploy the best predictive models. Users can choose between a visual point-and-click interface, the SAS Studio programming interface or even use open source languages, including Python, R, Java and Lua, to access powerful SAS statistical modeling and machine-learning techniques.
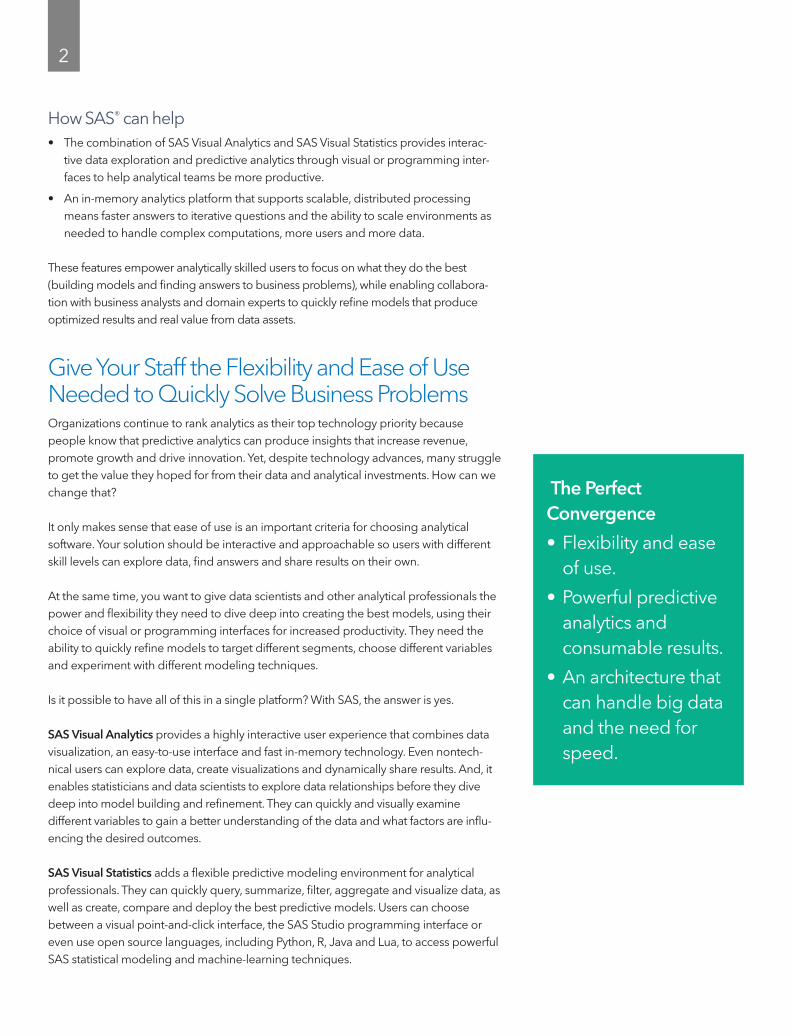
The Perfect Convergence
• Flexibility and ease of use.
• Powerful predictive analytics and consumable results.
• An architecture that can handle big data and the need for speed.
3
Success is often the sum of previous failures but because the margin for error is shrinking, fast model refinement is very important. The ability to build and fine-tune models, over and over again until suitable results are obtained, is crucial to getting more value from your data. Models can be refined by applying new techniques to data that already exists or by using variables that have never been exploited for analytical purposes. Analytical professionals can try new approaches because they are able to test multiple scenarios and evaluate results, which greatly reduces uncertainty and risk.
With integrated model building and visual data exploration, analysts and data scientists can maintain an uninterrupted workflow, cycling quickly between hypotheses and veri-fication. These capabilities boost model development, productivity and the accuracy of results in near-real time.
After trying different modeling techniques and comparing results, they can easily collab-orate with business analysts from the same environment. Once the champion model is identified, it can be put into production by embedding it into operational applications and scoring new data to produce faster insights.
In-Memory Platform Is Key to Rapid, Iterative Predictive Modeling First things first. Let’s start with the underlying architecture because it holds the key to faster results. Traditional batch-oriented systems are simply not designed for fast, complex analytical processing and on-the-fly changes to predictive models. Nor are they intended for the multiple passes through data that is needed for analytical jobs. This creates several issues.
• Statisticians, data scientists and analysts can’t easily experiment and refine their models with new information.
• They cannot quickly and easily build numerous models by segments or groups.
• And they can’t achieve a fast response each time they adjust model properties.
All of these factors inhibit quickly building, refining and selecting the best models.
You need an architecture that will not only scale as your data and processing needs grow, but one that also supports the ability to quickly and interactively adjust and experiment with variables in near-real time. It’s difficult to create great models, espe-cially on the first try. Often the best strategy is to produce a fairly good model quickly, and then adeptly adjust what’s still not ideal.
Fortunately, processing power is more economical than ever. SAS combines in-memory processing with an iterative model development environment so you can build and refine models and test what-if scenarios much faster and easier than ever before.
The SAS In-Memory Analytics platform provides highly available, distributed processing to handle multiple users and complex workloads concurrently. Computing operations are automatically distributed across the cores of a single server or the nodes of a massive compute cluster for exceptionally fast speed. If a node fails, fault-tolerant processing ensures blazingly fast speed is retained. And jobs always finish running.
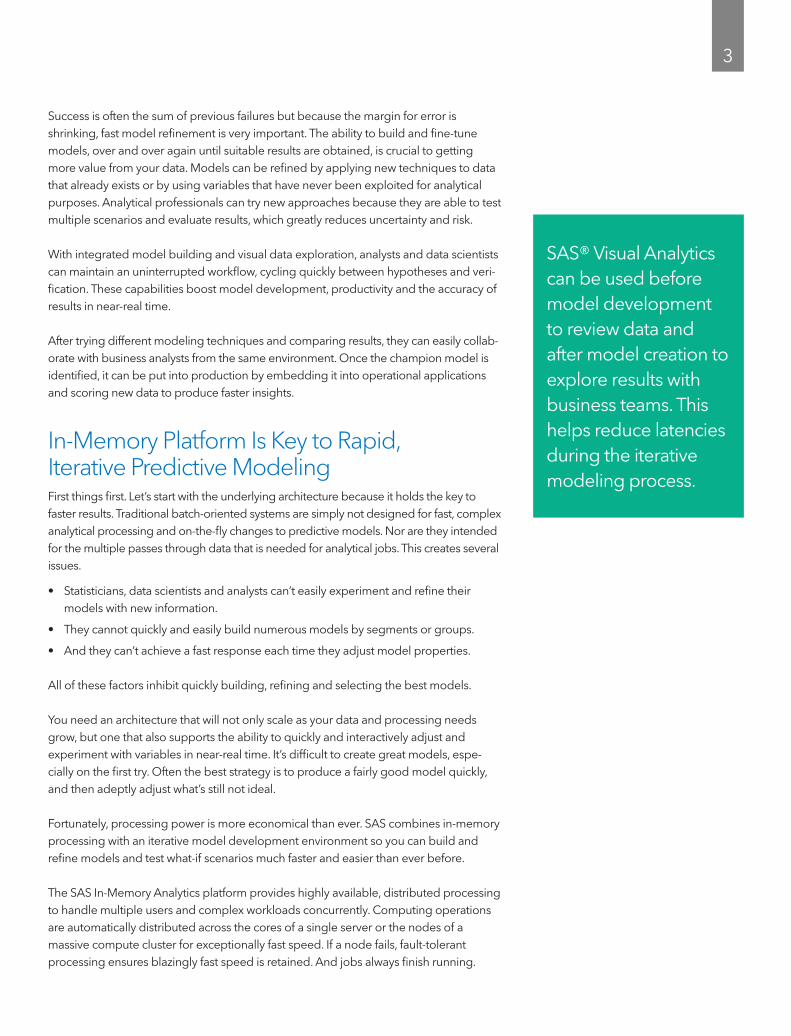
SAS® Visual Analytics can be used before model development to review data and after model creation to explore results with business teams. This helps reduce latencies during the iterative modeling process.
4
All data, tables and objects are held in memory as long as required and for whomever is using them. Independent sessions ensure optimized processing for everyone. There’s no need to write data to disk or shuffle data frequently across nodes. All data is loaded into memory once. It does not have to be reloaded each time a new task is performed or another authorized user is given access to data.
Five Steps to Getting More Value From DataHere’s how SAS Visual Analytics and SAS Visual Statistics work together to improve predictive modeling processes and produce better results.
Step 1: Interactively explore and prepare dataBefore building models, you first need to identify what predictors are needed. You can easily investigate the variables influencing your response variable, understand relationships among variables, remove outliers and handle data manipulations before you start building models. Visualizations such as box plots, correlation matrices, heat maps and scatter plots show relationships and patterns in large volumes of data.
Using SAS Visual Analytics, you can produce quick forecasts with goal seeking that can help identify what it will take to achieve the desired outcome over time.
Then you’re ready to prepare your chosen data for modeling using feature engineering capabilities in SAS Visual Statistics. You can use either the drag-and-drop interface or you can create and edit code to filter data, format variables, add ad hoc calculated columns and create dynamic hierarchies without the need for predefined data struc-tures. This helps you streamline the process of transforming data into useful aggregates and prepare it for predictive modeling.
Step 2: Use flexible interfaces and sophisticated techniques to build analytical modelsSAS Visual Statistics adds sophisticated analytical capabilities for users to iteratively create, evaluate and refine descriptive and predictive models using a visual drag-and-drop interface or the SAS Studio programming interface. If you prefer, you can also access SAS analytical algorithms using other programming languages, including Python, R, Java and Lua.
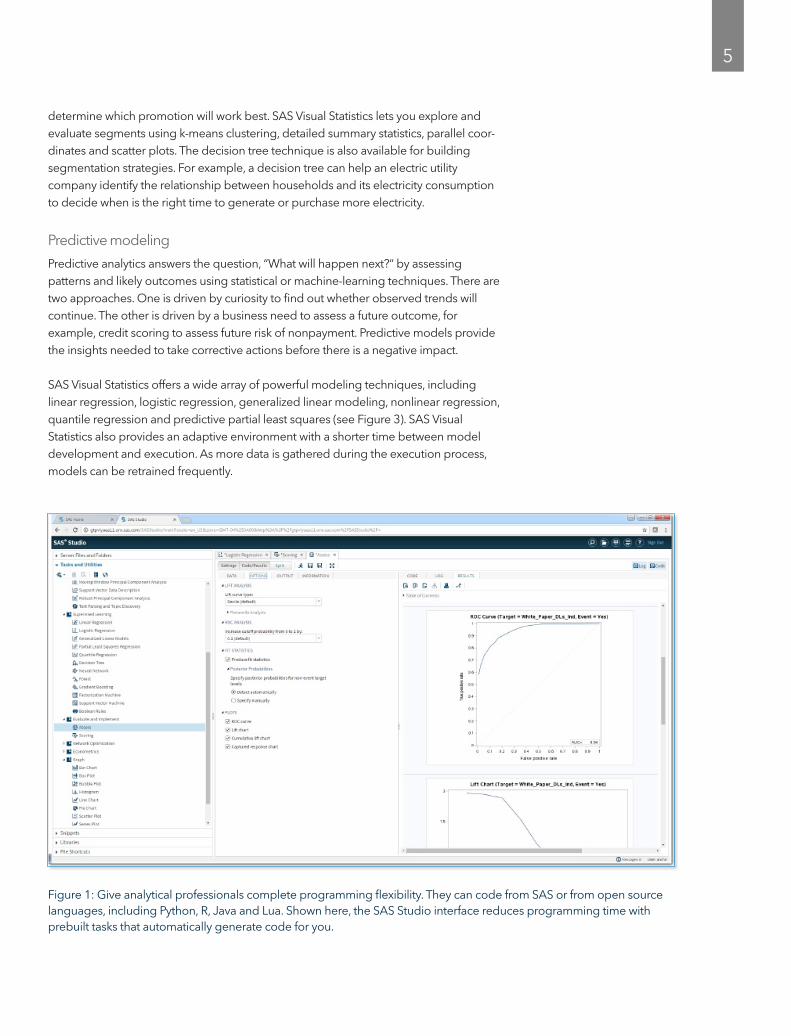
The SAS Studio interface is a popular web-based programming editor suitable for programmers and statisticians who are new to SAS, as well as experienced SAS program-mers. Several features help you work more efficiently, like programming tools that offer interactive feedback and prompts. You’ll also find code snippet libraries for frequently performed jobs, and tasks that automatically generate code when you drag them to the palette. Autocompletion is available for hundreds of SAS statements and procedures and reduces programming errors (see Figure 1).
Descriptive modeling
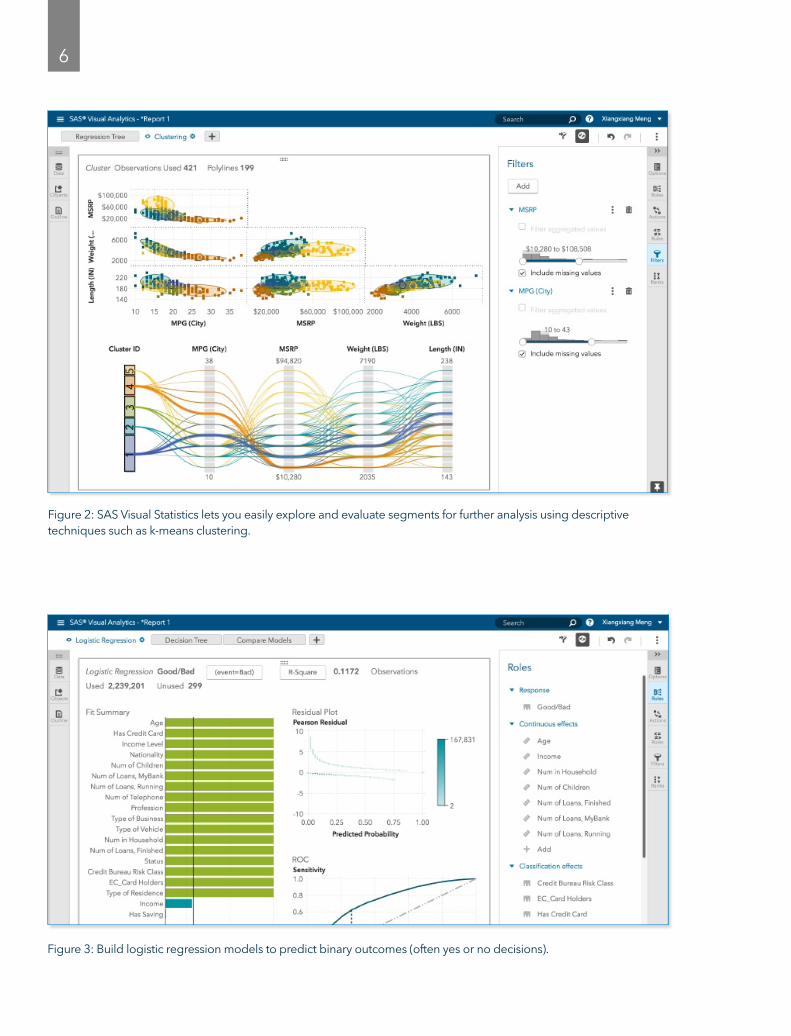
Clustering techniques segment your data into groups that share similar features so you can identify distinct groups based on multiple characteristics (see Figure 2). For example, market segmentation clusters customers with similar buying habits to
5
determine which promotion will work best. SAS Visual Statistics lets you explore and evaluate segments using k-means clustering, detailed summary statistics, parallel coor-dinates and scatter plots. The decision tree technique is also available for building segmentation strategies. For example, a decision tree can help an electric utility company identify the relationship between households and its electricity consumption to decide when is the right time to generate or purchase more electricity.
Predictive modeling
Predictive analytics answers the question, “What will happen next?“ by assessing patterns and likely outcomes using statistical or machine-learning techniques. There are two approaches. One is driven by curiosity to find out whether observed trends will continue. The other is driven by a business need to assess a future outcome, for example, credit scoring to assess future risk of nonpayment. Predictive models provide the insights needed to take corrective actions before there is a negative impact.
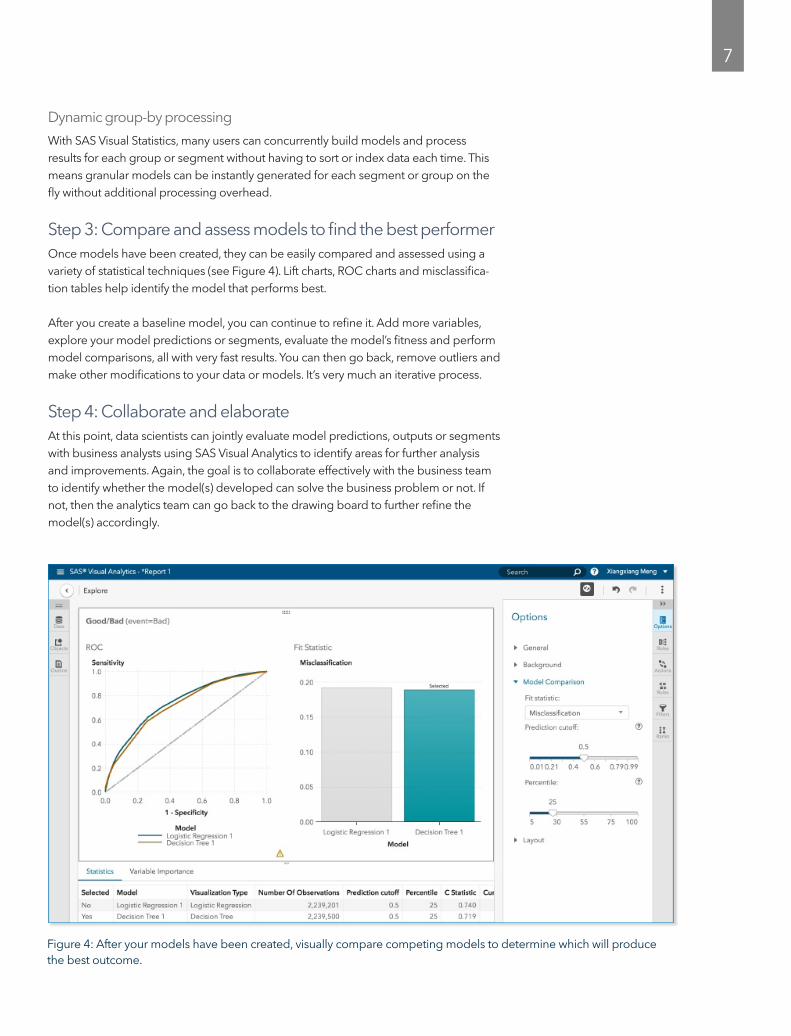
SAS Visual Statistics offers a wide array of powerful modeling techniques, including linear regression, logistic regression, generalized linear modeling, nonlinear regression, quantile regression and predictive partial least squares (see Figure 3). SAS Visual Statistics also provides an adaptive environment with a shorter time between model development and execution. As more data is gathered during the execution process, models can be retrained frequently.
Figure 1: Give analytical professionals complete programming flexibility. They can code from SAS or from open source languages, including Python, R, Java and Lua. Shown here, the SAS Studio interface reduces programming time with prebuilt tasks that automatically generate code for you.
6
Figure 3: Build logistic regression models to predict binary outcomes (often yes or no decisions).
Figure 2: SAS Visual Statistics lets you easily explore and evaluate segments for further analysis using descriptive techniques such as k-means clustering.
7
Dynamic group-by processing
With SAS Visual Statistics, many users can concurrently build models and process results for each group or segment without having to sort or index data each time. This means granular models can be instantly generated for each segment or group on the fly without additional processing overhead.
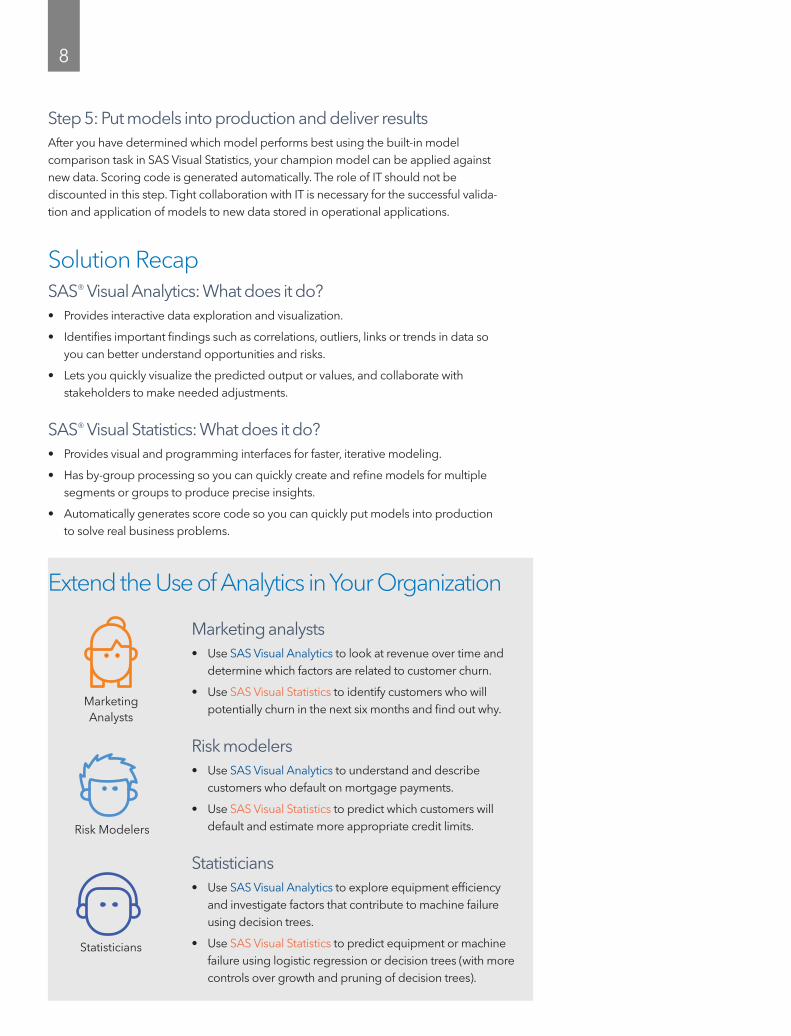
Step 3: Compare and assess models to find the best performerOnce models have been created, they can be easily compared and assessed using a variety of statistical techniques (see Figure 4). Lift charts, ROC charts and misclassifica-tion tables help identify the model that performs best.
After you create a baseline model, you can continue to refine it. Add more variables, explore your model predictions or segments, evaluate the model’s fitness and perform model comparisons, all with very fast results. You can then go back, remove outliers and make other modifications to your data or models. It’s very much an iterative process.
Step 4: Collaborate and elaborateAt this point, data scientists can jointly evaluate model predictions, outputs or segments with business analysts using SAS Visual Analytics to identify areas for further analysis and improvements. Again, the goal is to collaborate effectively with the business team to identify whether the model(s) developed can solve the business problem or not. If not, then the analytics team can go back to the drawing board to further refine the model(s) accordingly.
Figure 4: After your models have been created, visually compare competing models to determine which will produce the best outcome.
8
Step 5: Put models into production and deliver resultsAfter you have determined which model performs best using the built-in model comparison task in SAS Visual Statistics, your champion model can be applied against new data. Scoring code is generated automatically. The role of IT should not be discounted in this step. Tight collaboration with IT is necessary for the successful valida-tion and application of models to new data stored in operational applications.
Solution RecapSAS® Visual Analytics: What does it do?• Provides interactive data exploration and visualization.
• Identifies important findings such as correlations, outliers, links or trends in data so you can better understand opportunities and risks.
• Lets you quickly visualize the predicted output or values, and collaborate with stakeholders to make needed adjustments.
SAS® Visual Statistics: What does it do?• Provides visual and programming interfaces for faster, iterative modeling.
• Has by-group processing so you can quickly create and refine models for multiple segments or groups to produce precise insights.
• Automatically generates score code so you can quickly put models into production to solve real business problems.
Marketing analysts• Use SAS Visual Analytics to look at revenue over time and
determine which factors are related to customer churn.
• Use SAS Visual Statistics to identify customers who will potentially churn in the next six months and find out why.
Risk modelers• Use SAS Visual Analytics to understand and describe
customers who default on mortgage payments.
• Use SAS Visual Statistics to predict which customers will default and estimate more appropriate credit limits.
Statisticians• Use SAS Visual Analytics to explore equipment efficiency
and investigate factors that contribute to machine failure using decision trees.
• Use SAS Visual Statistics to predict equipment or machine failure using logistic regression or decision trees (with more controls over growth and pruning of decision trees).
Risk Modelers
Statisticians
Marketing Analysts
Extend the Use of Analytics in Your Organization
9
Conclusion Merging data exploration with predictive analytics serves an ever-growing group of users – statisticians, data scientists, risk managers, marketing analysts and others. The combination provides a fast, fun way to explore data, build predictive models and assess them to find the best performer. It will make any organization more responsive, agile and assertive. With this solution, you can:
• Uncover opportunities faster than your competition. Data scientists and statisticians can operate on observations at a granular level using the most appropriate analyt-ical modeling technique for the problem they are trying to solve. The result? Unprecedented speed in uncovering insights and finding new ways to increase revenue.
• Boost analytical productivity. SAS Visual Statistics reduces many of the manual, labor-intensive steps analysts have to go through to experiment with data and modeling techniques. Multiple users can collaboratively customize models and instantaneously see how changes affect outcomes. Which model provides the most predictive power? It’s easy to find out. Another productivity booster is the ability for your data scientists and programmers to access SAS Analytics from leading open source programming languages, including Python, R, Java and Lua. They can program where they are most comfortable, while taking advantage of highly tested and trusted SAS modeling techniques.
• Run more models faster. Take action sooner. Running complex analytical computa-tions against large amounts of data requires fast, distributed in-memory processing – if you want answers in minutes, not hours or days. With SAS Visual Statistics, you can build models to target many specific groups or segments and run numerous scenarios simultaneously across multiple nodes and massive computing clusters. Refine models on the fly to produce better results. And put those results into action immediately with automatically generated score code.
The end result is a combined, interactive data discovery and predictive analytics envi-ronment that enables analysts, statisticians, data scientists and programmers to deliver fast insights to decision makers – when and where they’re needed. Your organization can get real value from data because your analytics journey just got a lot easier.

SAS and all other SAS Institute Inc. product or service names are registered trademarks or trademarks of SAS Institute Inc. in the USA and other countries. ® indicates USA registration. Other brand and product names are trademarks of their respective companies. Copyright © 2017, SAS Institute Inc. All rights reserved. 107727_G34379.0617
To contact your local SAS office, please visit: sas.com/offices