Embed Size (px)
Citation preview
Reducing Heavy-Duty Long Haul
Combination Truck GHG
Emissions and Fuel Consumption
Arthur N. Marin
Executive Director,
NESCAUM/NESCCAF
Mobile Source Technical Review Subcommittee
October 6, 2009
2
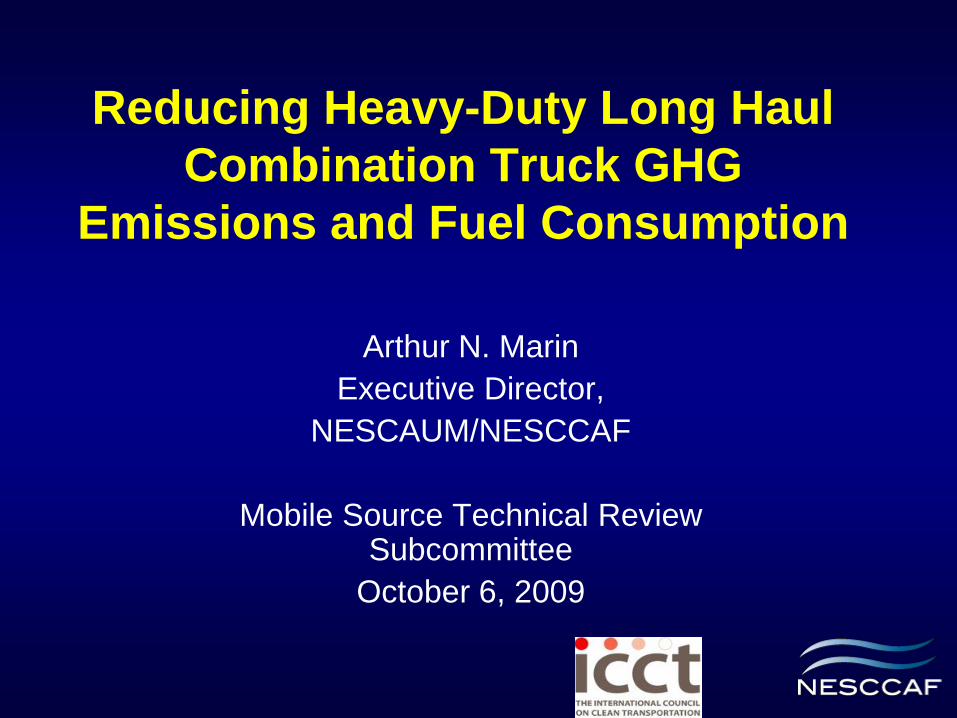
Introduction
• State and federal agencies are evaluating a
host of opportunities to reduce GHGs
• In the US, trucks emit 6% of anthropogenic
GHGs
• Emissions from these sources grew 79% from
1990-2007 – representing the largest %
increase among mobile sources
• To assist policy-makers, NESCCAF and ICCT
collaborated in a study to assess technology-
based opportunities to reduce GHGs and fuel
consumption from Class 8 long-haul trucks
3
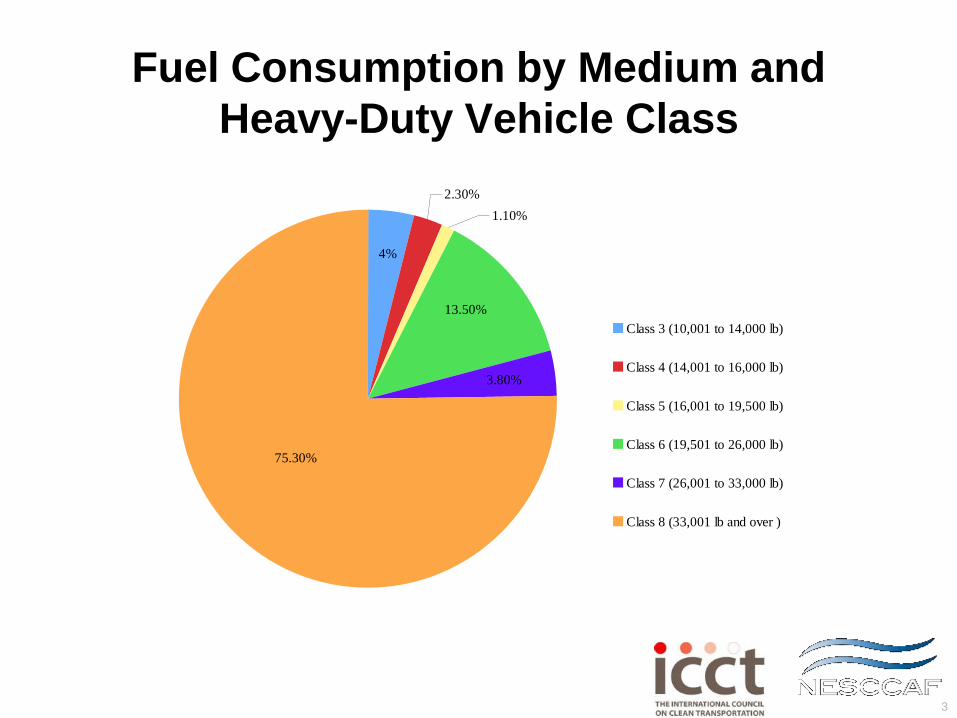
Fuel Consumption by Medium and
Heavy-Duty Vehicle Class
2.30%
1.10%
3.80%
13.50%
4%
75.30%
Class 3 (10,001 to 14,000 lb)
Class 4 (14,001 to 16,000 lb)
Class 5 (16,001 to 19,500 lb)
Class 6 (19,501 to 26,000 lb)
Class 7 (26,001 to 33,000 lb)
Class 8 (33,001 lb and over )
4
Study Goals
• Simulate improvements in fuel economy and
GHG emissions from combined engine,
transmission, and vehicle technologies
• Assess technical feasibility of reducing HD
fuel consumption and GHG emissions
• Estimate GHG / fuel savings that could be
achieved with widespread introduction of
technologies
• Provide cost estimates for different
combinations of technologies
5
Study Objectives
• Build on substantial work being done by government agencies, fleets & national labs
• Assess the GHG / fuel economy benefits of packaging technologies – some of which are commercially available - to achieve cost-effective climate change and fuel economy benefits
• Include some relatively expensive technologies to provide a robust overview of the range of opportunities
6
Research Steering Committee
• Guidance and direction on study design and implementation was provided by Research Steering Committee that included:– Engine manufacturers
– Vehicle manufacturers
– State and federal agencies
– Fleets
– Non profits and environmental groups
– Suppliers
– Developers of new HD technologies
7
Technical Approach
• Engine and vehicle simulation modeling conducted using RAPTOR and GT-Drive
• Cost analysis relied on published information and conversations with suppliers and OEMs
• Cost benefit analysis assumed 7% annual discount rate, prices of $2.50 and $3.53/gallon for diesel, 3 year and 15 year vehicle life
• Fleet-wide GHG and fuel consumption reductions estimated using model developed by TIAX, LLC
• Contractors:– SwRI conducted engine and vehicle simulation modeling
– TIAX conducted cost analysis and cost/benefit calculations
8
Technical Approach (continued)
• Selected baseline vehicle representative of the
current population
– KW T-600 tractor with standard 53’ van trailer
• Selected baseline engine representative of the
current population
– Volvo D13, 485 HP @ 1900 RPM
• Created a comprehensive list of potential fuel saving
technologies and then selected a subset of the most
promising technologies to simulate
9
Duty Cycle
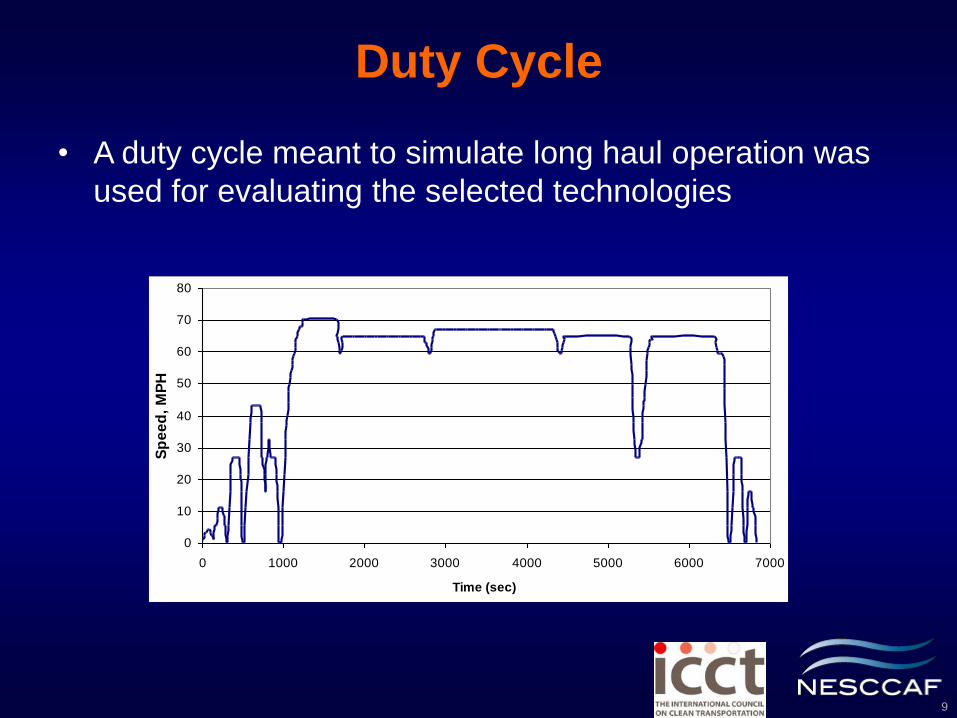
• A duty cycle meant to simulate long haul operation was
used for evaluating the selected technologies
0
10
20
30
40
50
60
70
80
0 1000 2000 3000 4000 5000 6000 7000
Time (sec)
Sp
ee
d,
MP
H
10
Technologies and Policies Modeled
with Standard Trailer
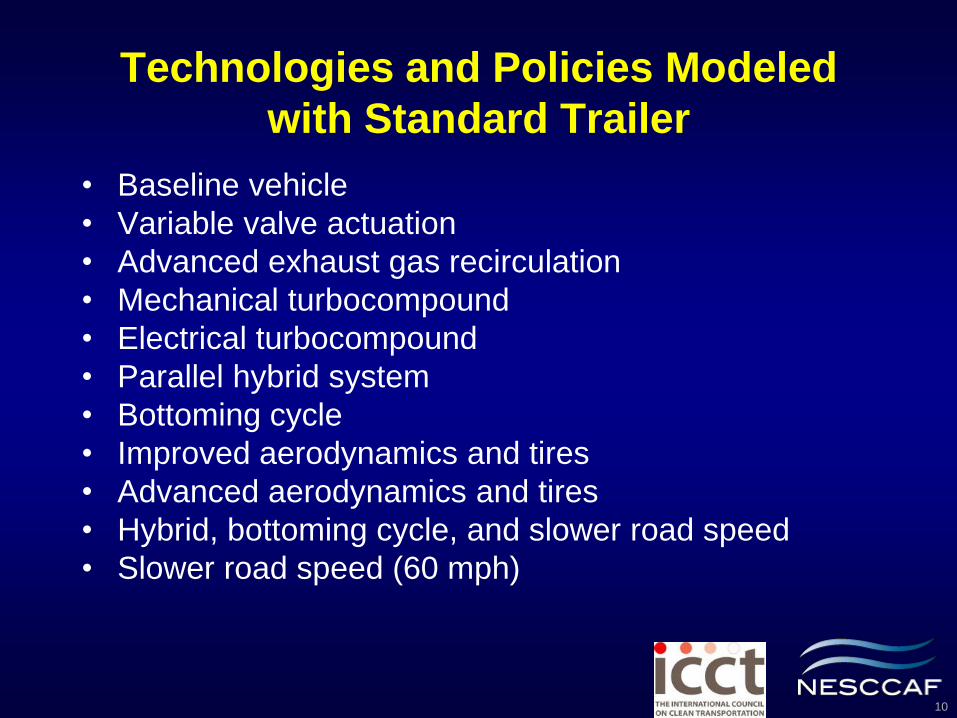
• Baseline vehicle
• Variable valve actuation
• Advanced exhaust gas recirculation
• Mechanical turbocompound
• Electrical turbocompound
• Parallel hybrid system
• Bottoming cycle
• Improved aerodynamics and tires
• Advanced aerodynamics and tires
• Hybrid, bottoming cycle, and slower road speed
• Slower road speed (60 mph)
11
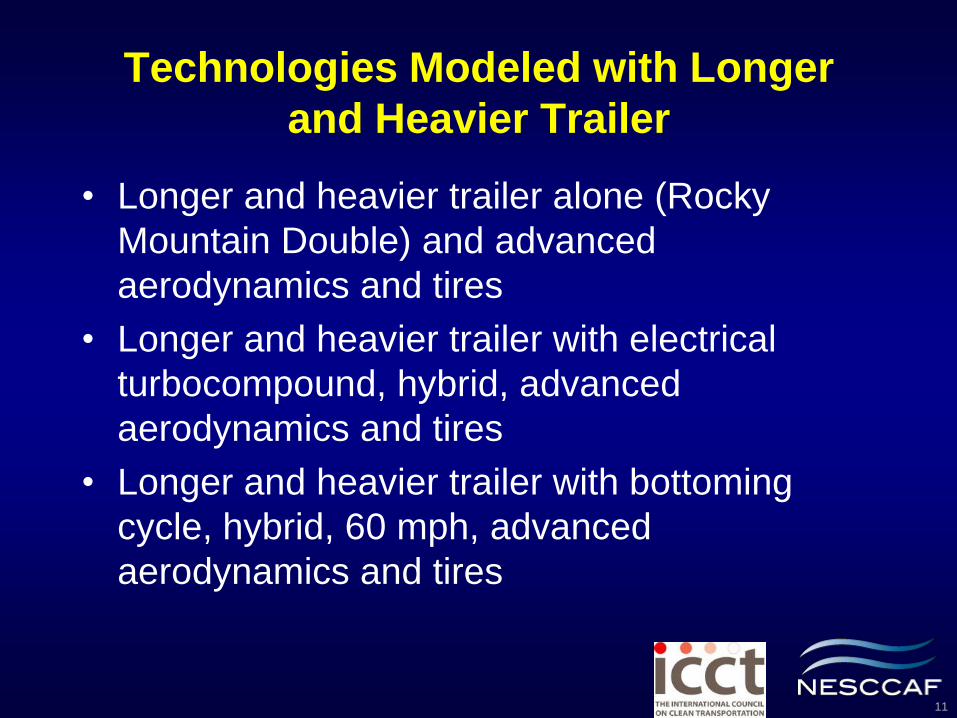
Technologies Modeled with Longer
and Heavier Trailer
• Longer and heavier trailer alone (Rocky
Mountain Double) and advanced
aerodynamics and tires
• Longer and heavier trailer with electrical
turbocompound, hybrid, advanced
aerodynamics and tires
• Longer and heavier trailer with bottoming
cycle, hybrid, 60 mph, advanced
aerodynamics and tires
12
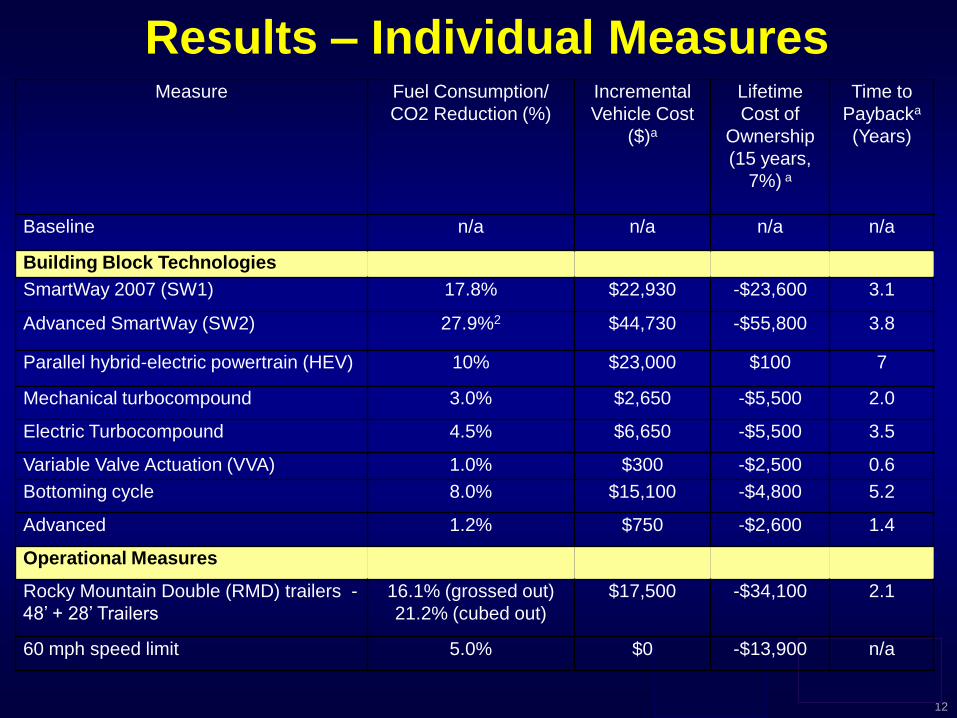
Results – Individual MeasuresMeasure Fuel Consumption/
CO2 Reduction (%)
Incremental
Vehicle Cost
($)a
Lifetime
Cost of
Ownership
(15 years,
7%) a
Time to
Paybacka
(Years)
Baseline n/a n/a n/a n/a
Building Block Technologies
SmartWay 2007 (SW1) 17.8% $22,930 -$23,600 3.1
Advanced SmartWay (SW2) 27.9%2 $44,730 -$55,800 3.8
Parallel hybrid-electric powertrain (HEV) 10% $23,000 $100 7
Mechanical turbocompound 3.0% $2,650 -$5,500 2.0
Electric Turbocompound 4.5% $6,650 -$5,500 3.5
Variable Valve Actuation (VVA) 1.0% $300 -$2,500 0.6
Bottoming cycle 8.0% $15,100 -$4,800 5.2
Advanced 1.2% $750 -$2,600 1.4
Operational Measures
Rocky Mountain Double (RMD) trailers -
48’ + 28’ Trailers
16.1% (grossed out)
21.2% (cubed out)
$17,500 -$34,100 2.1
60 mph speed limit 5.0% $0 -$13,900 n/a
13
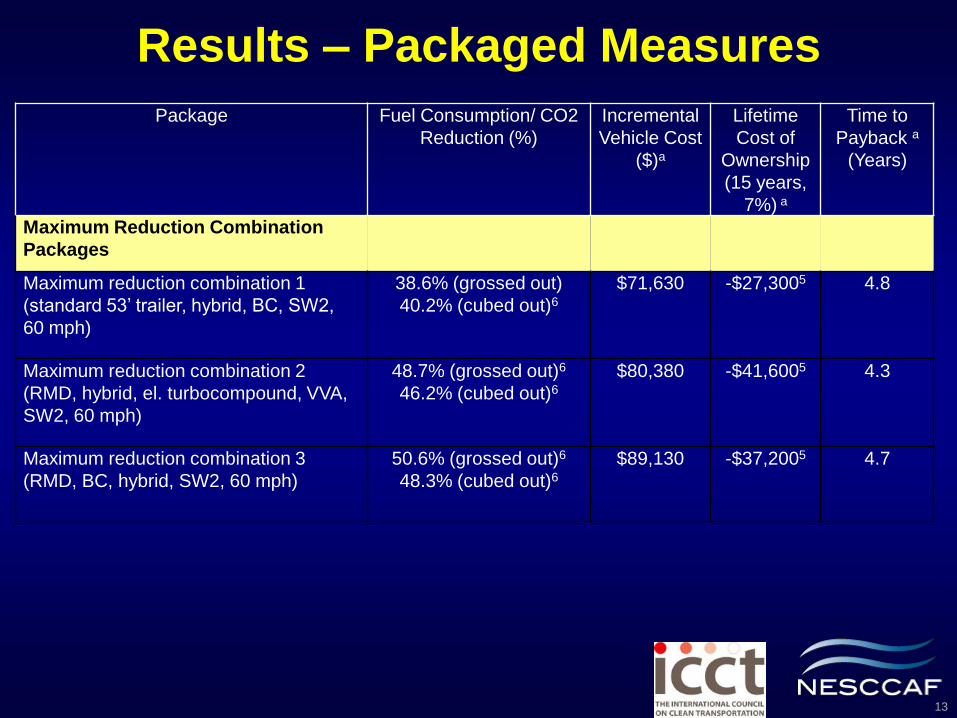
Results – Packaged Measures
Package Fuel Consumption/ CO2
Reduction (%)
Incremental
Vehicle Cost
($)a
Lifetime
Cost of
Ownership
(15 years,
7%) a
Time to
Payback a
(Years)
Maximum Reduction Combination
Packages
Maximum reduction combination 1
(standard 53’ trailer, hybrid, BC, SW2,
60 mph)
38.6% (grossed out)
40.2% (cubed out)6
$71,630 -$27,3005 4.8
Maximum reduction combination 2
(RMD, hybrid, el. turbocompound, VVA,
SW2, 60 mph)
48.7% (grossed out)6
46.2% (cubed out)6
$80,380 -$41,6005 4.3
Maximum reduction combination 3
(RMD, BC, hybrid, SW2, 60 mph)
50.6% (grossed out)6
48.3% (cubed out)6
$89,130 -$37,2005 4.7
14
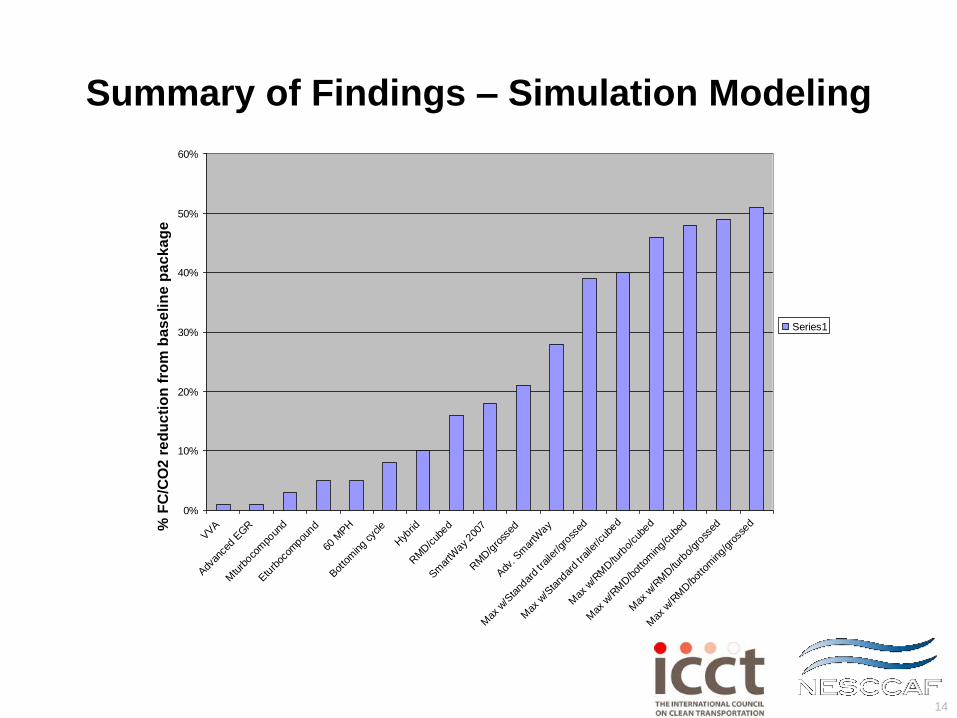
Summary of Findings – Simulation Modeling
0%
10%
20%
30%
40%
50%
60%
VVA
Adv
ance
d EGR
Mtu
rboco
mpo
und
Etu
rboc
ompou
nd
60 M
PH
Bot
tom
ing
cycle
Hyb
rid
RM
D/c
ubed
Sm
artW
ay 200
7
RM
D/g
ross
ed
Adv
. Sm
artW
ay
Max
w/S
tand
ard
traile
r/gro
ssed
Max
w/S
tand
ard
traile
r/cub
ed
Max
w/R
MD/tu
rbo/
cube
d
Max
w/R
MD/b
otto
ming/c
ubed
Max
w/R
MD/tu
rbo/
gross
ed
Max
w/R
MD/b
otto
ming/g
ross
ed% F
C/C
O2
re
du
cti
on
fro
m b
as
eli
ne
pa
ck
ag
e
Series1
15
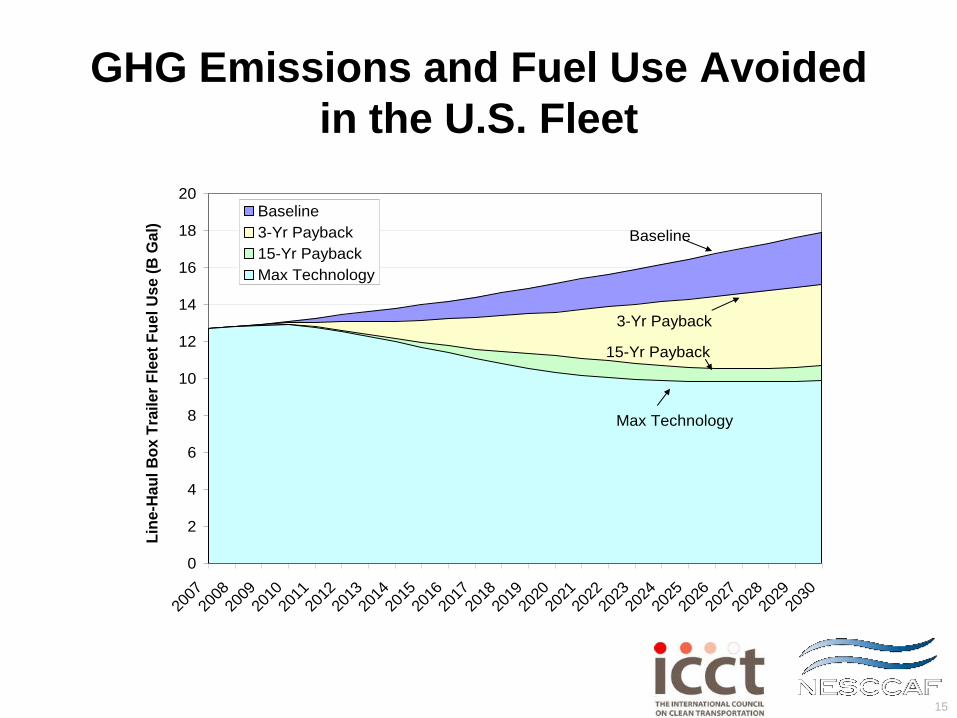
GHG Emissions and Fuel Use Avoided
in the U.S. Fleet
Baseline
3-Yr Payback
15-Yr Payback
Max Technology
0
2
4
6
8
10
12
14
16
18
20
2007
2008
2009
2010
2011
2012
2013
2014
2015
2016
2017
2018
2019
2020
2021
2022
2023
2024
2025
2026
2027
2028
2029
2030
Lin
e-H
au
l B
ox T
rail
er
Fle
et
Fu
el U
se (
B G
al)
Baseline
3-Yr Payback
15-Yr Payback
Max Technology
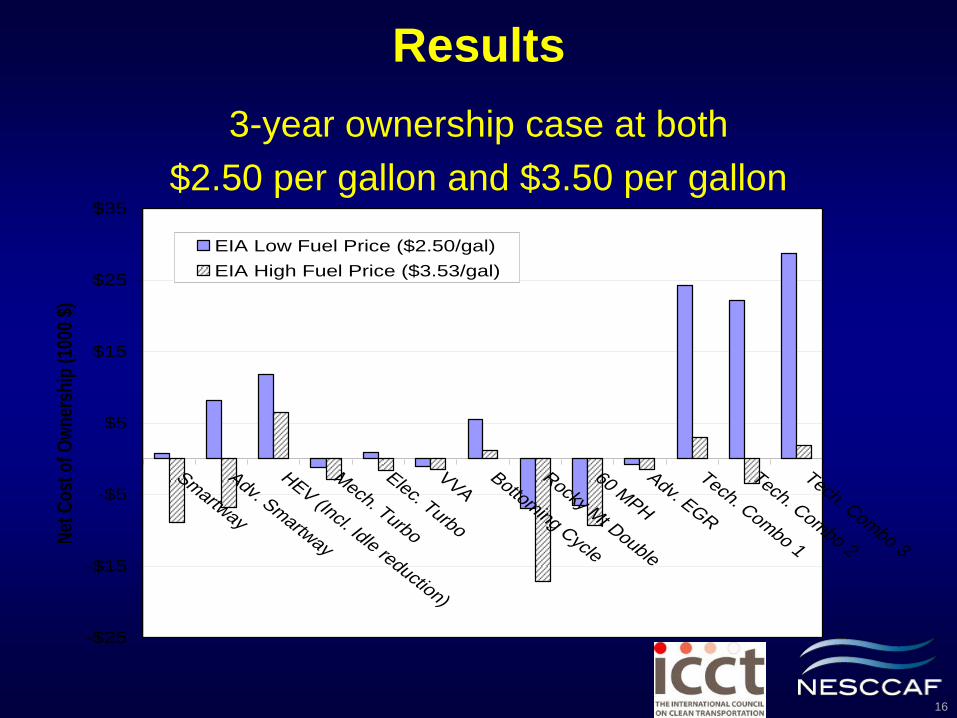
16
Results
3-year ownership case at both
$2.50 per gallon and $3.50 per gallon
-$25
-$15
-$5
$5
$15
$25
$35
Smartway
Adv. Smartway
HEV (Incl. Idle reduction)
Mech. Turbo
Elec. Turbo
VVABottom
ing Cycle
Rocky Mt Double
60 MPH
Adv. EGR
Tech. Combo 1
Tech. Combo 2
Tech. Combo 3N
et C
ost
of
Ow
ner
ship
(10
00 $
)
EIA Low Fuel Price ($2.50/gal)
EIA High Fuel Price ($3.53/gal)
17
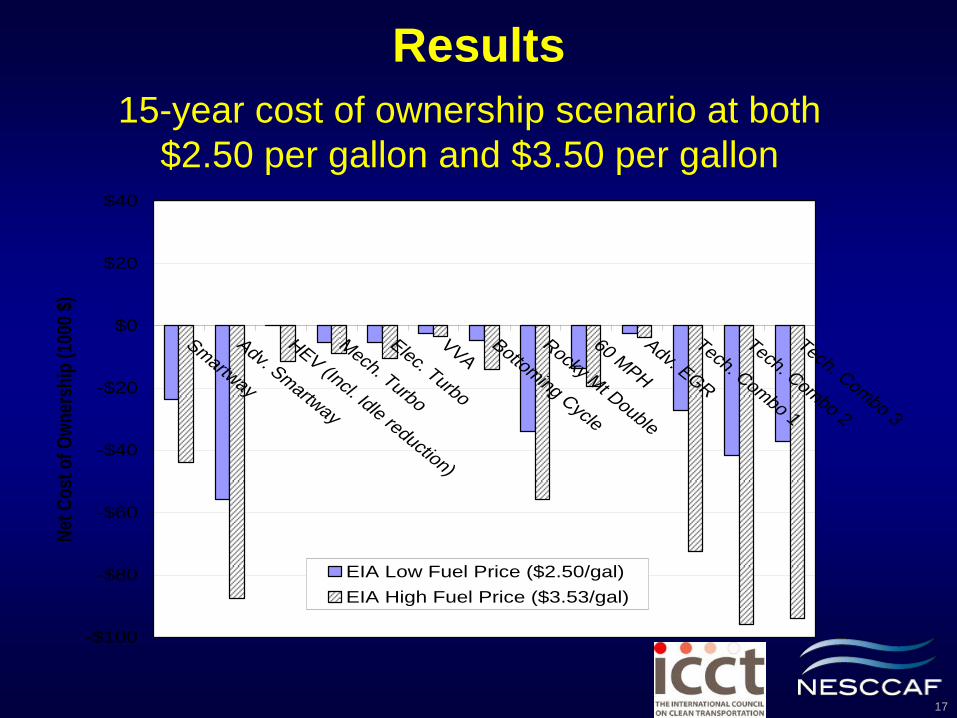
Results
15-year cost of ownership scenario at both
$2.50 per gallon and $3.50 per gallon
-$100
-$80
-$60
-$40
-$20
$0
$20
$40
Smartway
Adv. Smartway
HEV (Incl. Idle reduction)
Mech. Turbo
Elec. Turbo
VVABottom
ing Cycle
Rocky Mt Double
60 MPH
Adv. EGR
Tech. Combo 1
Tech. Combo 2
Tech. Combo 3
Net
Co
st o
f O
wn
ersh
ip (
1000
$)
EIA Low Fuel Price ($2.50/gal)
EIA High Fuel Price ($3.53/gal)
18
Conclusions
• GHG emissions and fuel consumption can be
reduced up to 40% in a standard size heavy-duty
long haul truck in the 2012-2017 timeframe with the
introduction of drivetrain and vehicle technologies
• With changes to tractor length and weight, fuel
consumption and GHG emissions can be reduced by
up to 50%
• These benefits can be achieved at a cost savings
assuming a 15 year payback period and a very
conservative fuel cost assumption of $2.50 per gallon
19
Conclusions• Implementing technologies with ≤ 3-year payback could
reduce GHGs by 12% and save over 2 billion gallons per
year in the 2030 time frame compared to BAU
• Implementing technologies with a ≤ 15-year payback
could reduce GHGs by 39% and save 7 billion gallons of
fuel per year by 2030
• Implementing feasible technologies regardless of cost
could save 8 billion gallons per year and 88 million tons
of CO2 by 2030 (44% reduction)
• Additional fuel savings / GHG reductions can be
achieved by applying many of these technologies /
approaches to other HDV classes & existing fleet
20
Conclusions
• Assuming the industry’s 18 – 36 month payback
expectations and a steady diesel fuel price, the expected
savings will be modest absent regulatory drivers or
incentives
• Given that some of these options are currently available
and others are in development, it is clear that achieving
substantially greater reductions will require incentives or
regulations to promote the deployment of GHG-reducing
/ fuel saving technologies
21
Discussion
Given:
• The current or expected availability of cost-effective
strategies to reduce fuel use / GHG emissions
• The non-integrated nature of HD truck manufacturing
• The short payback period expected in trucking industry
• The fact that multiple federal agencies have regulatory
authority over this sector
• The variety of different state regulations governing
longer-heavier trailers
• The economic climate
• The possibility of a national cap on GHGs
22
Discussion Questions
• What combination of technological developments,
economic incentives (to manufacturers and the trucking
industry), federal regulations, and changes in state
regulations are needed to maximize the deployment of
cost-effective strategies?
• What can the MSTR do to assist in the development of a
comprehensive approach for achieving fuel use and
GHG emission reductions from long-haul trucks?
23
Thanks to:
Tom Reinhart, SwRI
Matt Kromer, TIAX, LLC
Fanta Kamakate, ICCT
Coralie Cooper, NESCCAF