Embed Size (px)
Citation preview
REDUCTION IN WASTE LOAD FROM A MEAT
PROCESSING PLANT-BEEF
SUBMITTED BY
Randolph Packing Co.Asheboro, N.C.
IN COOPERATION WITHFOOD SCIENCE EXTENSION
N.C. STATE UNIVERSITY
north CarolinaAGRICULTURALEXTENSIONSERVICE
This project was supported by a Challenge Grant funded by theN.C. Pollution Prevention Pays Program
REDUCTION IN WASTE LOAD FROM
A MEAT PROCESSING PLANT - BEEF
Submitted by
Randolph Packing Company
Project LeadersRoy E. Carawan, Ph.D.
andDwain H. Pilkington, Ph.D.
of theFood Science Department
and theNorth Carolina Agricultural Extension Service
North Carolina State UniversityRaleigh, NC 27695-7624
Project ManagerMr. Craig Hamlet, Vice-President
Randolph Packing CompanyAsheboro, NC 27203
October 31, 1986
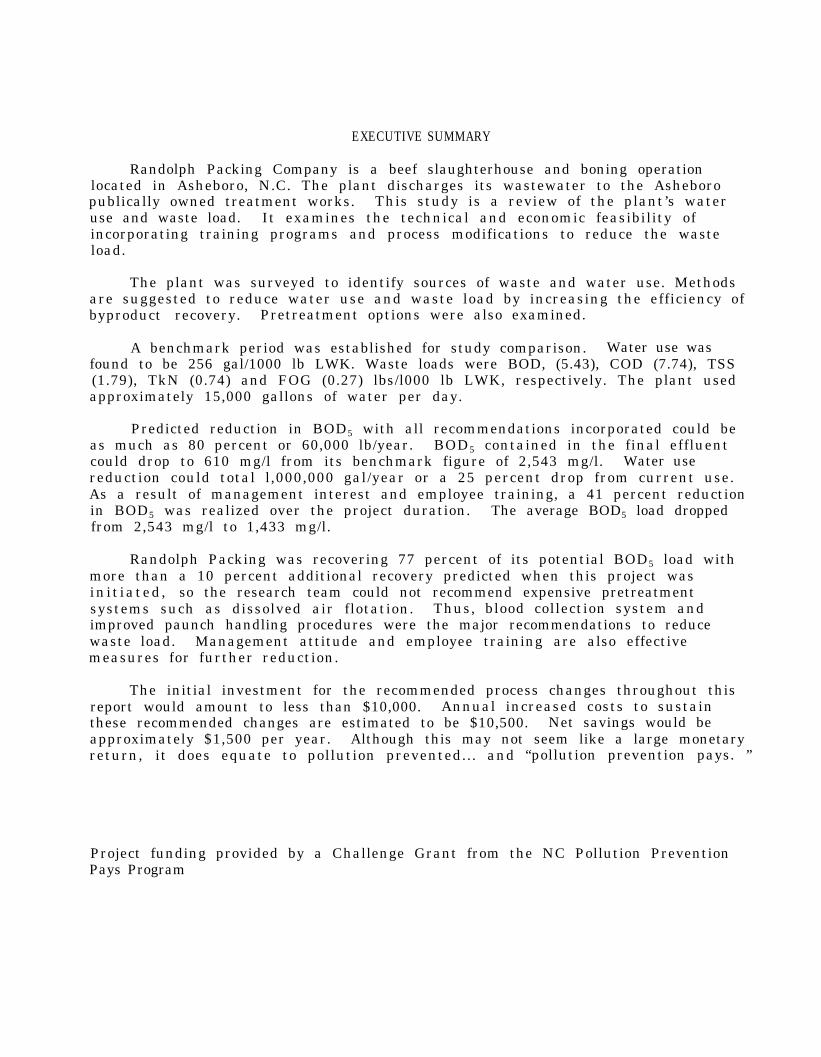
EXECUTIVE SUMMARY
Randolph Packing Company is a beef slaughterhouse and boning operationlocated in Asheboro, N.C. The plant discharges its wastewater to the Asheboropublically owned treatment works. This study is a review of the plant’s wateruse and waste load. It examines the technical and economic feasibility ofincorporating training programs and process modifications to reduce the wasteload.
The plant was surveyed to identify sources of waste and water use. Methodsare suggested to reduce water use and waste load by increasing the efficiency ofbyproduct recovery. Pretreatment options were also examined.
A benchmark period was established for study comparison. Water use wasfound to be 256 gal/1000 lb LWK. Waste loads were BOD, (5.43), COD (7.74), TSS(1.79), TkN (0.74) and FOG (0.27) lbs/l000 lb LWK, respectively. The plant usedapproximately 15,000 gallons of water per day.
Predicted reduction in BOD5 with all recommendations incorporated could beas much as 80 percent or 60,000 lb/year. BOD5 contained in the final effluentcould drop to 610 mg/l from its benchmark figure of 2,543 mg/l. Water usereduction could total l,000,000 gal/year or a 25 percent drop from current use.As a result of management interest and employee training, a 41 percent reductionin BOD5 was realized over the project duration.from 2,543 mg/l to 1,433 mg/l.
The average BOD5 load dropped
Randolph Packing was recovering 77 percent of its potential BOD5 load withmore than a 10 percent additional recovery predicted when this project wasinit iated, so the research team could not recommend expensive pretreatmentsystems such as dissolved air flotation. Thus, blood collection system andimproved paunch handling procedures were the major recommendations to reducewaste load. Management attitude and employee training are also effectivemeasures for further reduction.
The initial investment for the recommended process changes throughout thisreport would amount to less than $10,000. Annual increased costs to sustainthese recommended changes are estimated to be $10,500. Net savings would beapproximately $1,500 per year. Although this may not seem like a large monetaryreturn, it does equate to pollution prevented... and “pollution prevention pays. ”
Project funding provided by a Challenge Grant from the NC Pollution PreventionPays Program
3
ACKNOWLEDGMENTS
The authors wish to express appreciation to the many individuals whoprovided consultation, information and guidance throughout this study. Specialgratitude is expressed to the management and employees of Randolph Packing Co.for their interest , concern and encouragement in this project.
The authors are deeply indebted to the North Carolina Agricultural ExtensionService and the Department of Food Science at N.C. State University for theirsupport toward these activities and for executing the subcontract to helpimplement this project.
The foresight of Mr. Roger Schecter and Mr. Gary Hunt of the N.C. “PollutionPrevention Pays” Program allows for such projects to be instituted. Their help,concern and patience throughout this study is especially appreciated. Theyshould be commended for their unique approach to helping industry find ways toprevent pollution. Funds for this project were provided through Agreement C-1537of the Pollution Prevention Pays Program of the North Carolina Department ofNatural Resources and Community Development.
The authors extensively utilized some of the EPA reports noted in thereference. Many of the tables, ideas, suggestions and observations wereabstracted or taken directly from these publications.
The authors extend their appreciation to Ms. Lisa Nance for her invaluableassistance in typing this report. The editorial assistance of Dr. Duane Larickand Ms. Susan Borowski is gratefully acknowledged.
4
TABLE OF CONTENTS
Page
LIST OF TABLES . . . . . . . . . . . . . . . . . . . . . . . . . . . . . . . 5
LIST OF FIGURES . . . . . . . . . . . . . . . . . . . . . . . . . . . . . . . 6
SCOPE OF WORK . . . . . . . . . . . . . . . . . . . . . . . . . . . . . . . 7
I. INTRODUCTION . . . . . . . . . . . . . . . . . . . . . . . . . . . . 8Randolph Packing CompanyMeat Plant WastewatersSlaughterhousesPacking HousesSources of WastewaterSecondary Manufacturing ProcessesAn Example of Water Conservation and Waste ControlWater Conservation Program
II. PLANT REVIEW AND SURVEY. . . . . . . . . . . . . . .IntroductionSurvey for Product Losses and WastesWater Use and Waste LoadWastewater Discharge Limitations and Costs
I I I . WASTE CENTERS, CHANGES, COSTS AND RESULTS. . . . . .In-Plant Control MeasuresWater Conservation
. . . . . . . 25
. . . . . . . 37
Recovering Products, By-Products and Reducing Waste LoadBlood ConservationPaunch Handling and ProcessingSummary of Process ChangesPretreatmentAdvantages and Disadvantages of PretreatmentPretreatment Systems
IV. CONCLUSIONS AND RECOMMENDATIONS. . . . . . . . . . . . . . . . . . . 57
R E F E R E N C E S . . . . . . . . . . . . . . . . . . . . . . . . . . . . . . . . . 3 9
G L O S S A R Y . . . . . . . . . . . . . . . . . . . . . . . . . . . . . . . . . . 6 0
LIST OF APPENDIXES . . . . . . . . . . . . . . . . . . . . . . . . . . . . 62
LIST OF TABLES
Table Page
1.
2.
Standard Raw Waste Loads. . . . . . . . . . . . . . . . . . . . .
Unit Waste Loads for Selected Meatpacking Plants. . . . . . . . .
3.
4.
5.
6.
7.
8.
9.
10.
11.
12.
13.
14.
Summary of Plant & Raw Waste Characteristics for SimpleSlaughterhouses . . . . . . . . . . . . . . . . . . . . . . . . .
Summary of Plant & Raw Waste Characteristics for Low-ProcessingPacking Houses. . . . . . . . . . . . . . . . . . . . . . . . . .
Waste Load Reduction. . . . . . . . . . . . . . . . . . . . . . .
Water Conservation Program. . . . . . . . . . . . . . . . . . . .
In-Plant Waste Strength Reduction . . . . . . . . . . . . . . . .
Potential Wastes (BOD5) from Randolph Packing . . . . . . . . . .
Water Use for Randolph Packing Company - 1986 . . . . . . . . . .
Average Wastewater Characteristics -1986. . . . . . . . . . . . .
Ratios of Wastewater Parameters and COD . . . . . . . . . . . . .
Water and Waste Coefficients for Randolph Packing Company - 1986.
Benchmark and Project Waste Loads . . . . . . . . . . . . . . . .
Asheboro Pretreatment Ordinance Limitations and Interim DischargeLimits for Randolph Packing . . . . . . . . . . . . . . . . . . .
15.
16.
17.
18.
19.
20.
Measures to Control Water Use, Product Loss and Waste Load. . . .
Initial Costs of Blood Collection System. . . . . . . . . . . . .
Annual Budget for Blood Collection System . . . . . . . . . . . .
Paunch Processing Technology. . . . . . . . . . . . . . . . . . .
Paunch Processing System. . . . . . . . . . . . . . . . . . . . .
Annual Budget for Paunch Processing System. . . . . . . . . . . .
21.
22.
23.
Changes for Waste Load Reduction. . . . . . . . . . . . . . . . .
Pretreatment Methods for Meat Plants. . . . . . . . . . . . . . .
Initial Costs of the Air Flotation System . . . . . . . . . . . .
24. Annual Budget for Air Flotation System. . . . . . . . . . .
. . . 11
. . . 12
. . . 15
. . . 16
. . . 21
. . . 22
. . . 24
. . . 28
. . . 29
. . . 31
. . . 32
. . . 33
. . . 34
. . . 36
. . . 38
. . . 41
. . . 42
. . . 45
. . . 47
. . . 48
. . . 50
. . . 52
. . . 54
. . . 55
LIST OF FIGURES
Figure Page
1. Operating and Wastewater Flow Chart for Low- and High-ProcessingPackinghouses . . . . . . . . . . . . . . . . . . . . . . . . . . . . 13
2. Randolph Packing Company . . . . . . . . . . . . . . . . . . . . . . 26
SCOPE OF WORK
Randolph Packing Co., under the direction of Hr. Craig Hamlet, submitted theproject entitled "Reduction in the Waste Load from a Meat Processing Plant -Beef" to the XC "Pollution Prevention Pays" program on December 15, 1985. Anagreement (No. C-1537) was signed on July 24, 1986 to authorize the project.Memorandum of Agreement was entered into by Randolph Packing Co. and NC StateUniversity, who would assist in the project. Drs. Carawan and Pilkington of theFood Science Department and the North Carolina Agricultural Extension Servicecooperated in this study.
The project included a feasibility study of the potential for reduction andrecovery/reuse of process waste. The project scope is as follows:
1.
2.
3.
4.
5.
Review the use of water by unit processes to identify water-reductionoptions.
Review the waste load by unit processes to identify waste-reduction options.
Use planning sessions to get management and employee suggestions forreduction in water use and waste load.
Examine the technical and economic feasibility of incorporating processchanges to reduce waste generation.
Present findings of this study in a final report to include technical andeconomic evaluations of the waste-reduction options:
- Introduction to the problem
- Technical evaluation of technology(ies)
- Economic assessment of costs, pay back period and annual cost savings
- Summary
INTRODUCTION
Wastewater will always be generated whenever food in any form is handled,processed, packaged and stored. The quantity of this processing wastewater andits general quality (i.e.. pollutant strength, nature of constituents), are botheconomic and environmental factors in the treatability and disposal ofwastewater.
The waste load from a meat processing plant is a result of blood, fleshpart ic les , soluble protein losses and waste materials which are intentionally orinadvertently lost to the sewer system. There are three proven ways to reducewaste load as well as water use and wastewater discharge. First, operate theplant more efficiently. Second, make process modifications to reduce water useand waste. Third, consider pretreatment steps to reduce the waste load.
Water, sewer and surcharge costs are significant to any meat plant. EPAdocuments contend that plants with effective waste management programs can reducesurcharges by 80 per cent. Well-trained employees, the most modern technologyand management support are necessary to achieve the least costly reduction ofwater use and waste.
External restraints on a meat plant’s wastewater may convince managementto consider water and waste reduction programs. These restraints can includeeffluent restrictions on selected wastewater parameters such as BOD, COD, FOG,TKN, P and flow. The city of Asheboro, NC has imposed such limits on industriesthrough a Sewer Use and Pretreatment Ordinance (1986).
Water is an essential tool for the meat industry. In processing and qualitycontrol, it helps to cleanse the product and to convey and remove unwantedmaterials. But in wastewater handling, water flushes organic and inorganicmatter to the sewer. Wastewater treatment is basically a processing system toseparate the organic and inorganic matter from the water that collected it.Thus, keeping organic and inorganic matter out of the water eliminates thenecessity for treatment.
In food processing plants, most wastes are losses from food products andare primarily organic in nature. The goal of every wastewater engineer is toremove these organic solids “dry,” without discharging them to the sewer, and touse an absolute minimum of water for the essentials of sanitation. This goalprovides the pattern for waste and water conservation in the plant:
- Use water wisely--only enough to get the job done.
- Keep waste solids contained for disposal as a solid or concentratedsludge, not for discharge to the sewer.
- Clean with high pressure and minimum water volume (small hoses). Usethe right detergents in the right proportions to clean well with minimumrinsing.
- Recycle water as much as possible within the limits of USDA regulations.
9
- Use minimum pressure and water volume for washing product, adhering toquality control standards.
- Control water volume, temperature, and pressure automatically.Dependence upon manual regulation can lead to waste.
- Use valves that automatically shut off water supply when water is notneeded.
Randolph Packing Company
Randolph Packing Company is a small beef processing plant located inAsheboro, NC. The wastewater from the plant is discharged to the Asheboropublically owned treatment works (POTW). Randolph Packing is a modern plant thatslaughters beef cattle and totally processes the carcasses and hides. By-productsare recovered and trucked to a rendering plant.
Meat Plant Wastewaters
A basic understanding of the nature of meat plant wastewaters and factorsthat influence these wastewaters is essential for the control of wastewatervolume and waste loads. Analyzing waste characteristics of the meatpackingindustry is not a simple matter. It is di f f icult to characterize a “typical”plant and its associated wastes, owing to the many procedures and facets ofmeat-processing operations. However, some similarities have emerged duringextensive study and research.
Typical slaughterhouse and packing house wastes are generally high in 5-daybiochemical oxygen demand (BOD5). total suspended solids (TSS), floatablematerial and grease (FOG). The waste is usually at an elevated temperature andoften contains blood, bits of flesh, fat, manure, dirt and viscera. Bloodrecovery, grease recovery, separate paunch manure handling and efficientrendering operations can reduce waste loads substantially and may also producesalable by-products. Chlorides, phosphorus and nitrogen compounds are alsofound in the wasteload.
Parameters used to define the size of operations were the kill (live weight)and volume of processed meat products, which are expressed in thousands of kg.All values of waste parameters are expressed as kg/1000 kg/LWK, which has thesame numerical value when expressed in lb/1000 lb LWK.
Water is a raw material in the meatpacking industry that is used to cleanseproducts and remove and convey unwanted material. The principal operations andprocesses in meatpacking plants where wastewater originates are:
- Animal holding pens- Slaughtering- Cutting- Meat processing- Secondary manufacturing (by-product operations)- Cleanup operations
10
Wastewaters from slaughterhouses and packing houses contain organic matter(including grease), suspended solids and inorganic material such as phosphates,nitrates, nitrites and salt. These materials enter the waste stream as:
- blood- meat and fatty tissue- meat extracts- paunch contents- bedding- manure- hair- d i r t- contaminated cooling water losses from rendering- curing and pickling solutions- preservatives- caustic or alkaline detergents
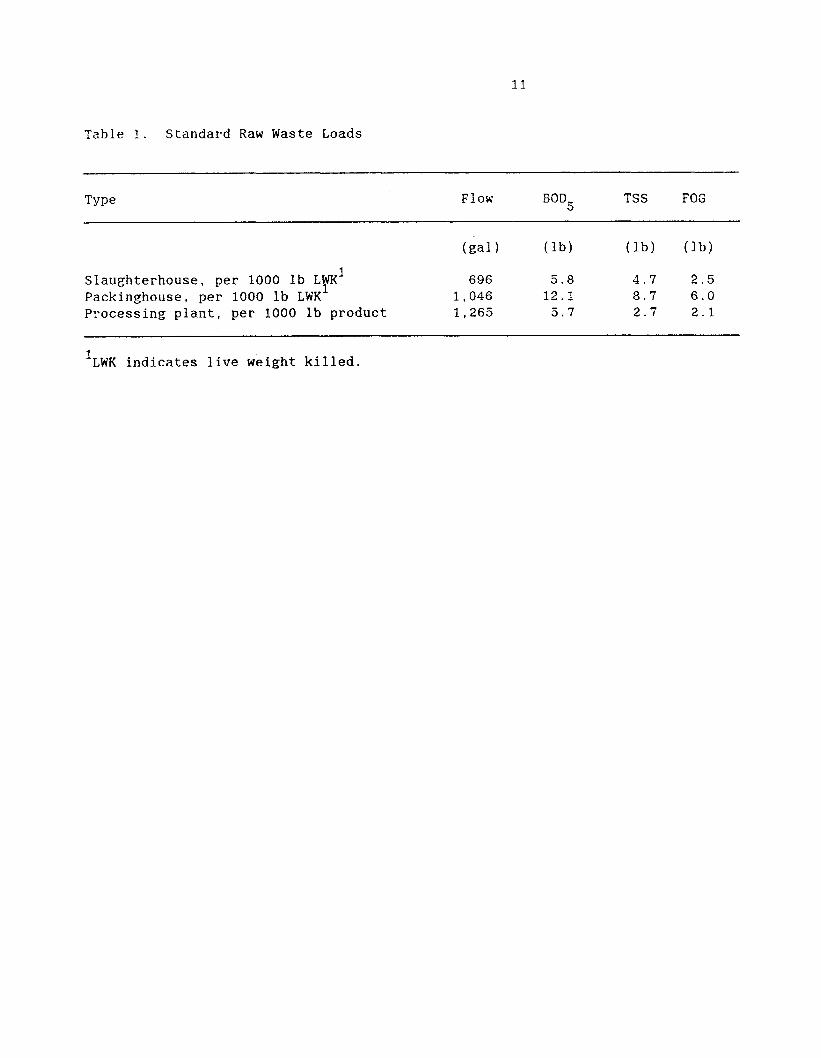
A survey of the meat industry was sponsored by EPA. From this work theauthors of an EPA publication (1973 ) prepared Table 1 which lists waste loadstypical of various types of meat-packing plants. The values listed forslaughterhouses apply only to medium-sized plants that slaughter from 95,000 to750,000 pounds of meat per day. These plants process few, if any, edibleby-products and process blood in such a manner that it will not be released intothe wastewater. They also perform dry, inedible rendering.
The flow and waste load values associated with packing houses apply to mostmedium or large plants that carry out all processes associated with slaughtering,cutting, rendering and processing. Values listed for processing plants representplants that cut and process meat, but do not slaughter or render. Generally, theprocesses performed at a packing plant have a much greater effect on the wasteload than the size of the plant.
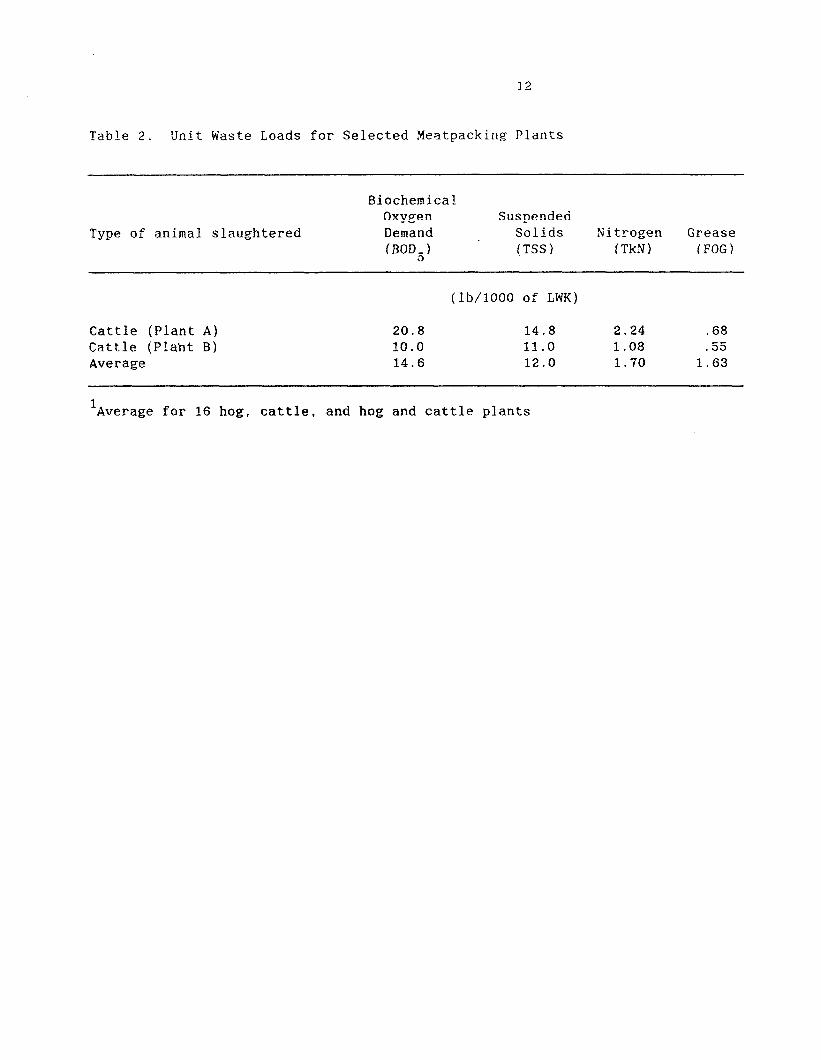
The authors of an EPA publication (1973b) also prepared Table 2 which showsthe characteristics of the waste flow from two cattle packing plants,illustrating a typically wide variation from plant to plant. Average data areshown for 16 hog, cattle or mixed hog and cattle packing plants with a BOD5 SS,TkN and FOG loads of 14.6., 12.0., 1.70 and 1.63 pounds (respectively) per 1000lb of live weight killed.
Slaughterhouses
A typical flow diagram illustrating the sources of wastewaters in bothsimple and complex slaughterhouses is shown in Figure 1. Note that a simpleslaughterhouse normally conducts very few of the by-product operations (secondaryprocesses) listed in Figure 1 as compared to a complex slaughterhouse, whichperforms most or all of them. Occasionally slaughterhouses may not havewastewaters from some of the operations shown, depending upon individual plantcircumstances. For example, some slaughterhouses have dry animal pen cleanup withno discharge of wastewater; some have little or no cutting: and others may have aseparate sewer for sanitary waste.

14
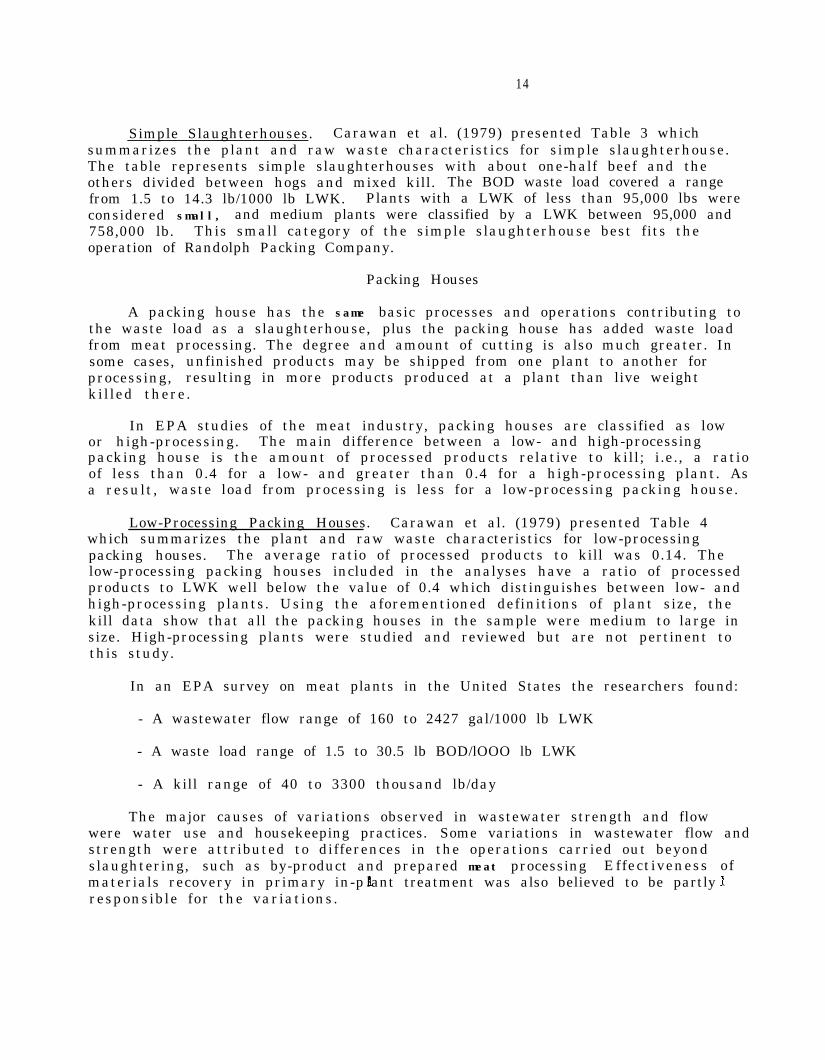
Simple Slaughterhouses. Carawan et al. (1979) presented Table 3 whichsummarizes the plant and raw waste characteristics for simple slaughterhouse.The table represents simple slaughterhouses with about one-half beef and theothers divided between hogs and mixed kill. The BOD waste load covered a rangefrom 1.5 to 14.3 lb/1000 lb LWK. Plants with a LWK of less than 95,000 lbs wereconsidered small, and medium plants were classified by a LWK between 95,000 and758,000 lb. This small category of the simple slaughterhouse best fits theoperation of Randolph Packing Company.
Packing Houses
A packing house has the same basic processes and operations contributing tothe waste load as a slaughterhouse, plus the packing house has added waste loadfrom meat processing. The degree and amount of cutting is also much greater. Insome cases, unfinished products may be shipped from one plant to another forprocessing, resulting in more products produced at a plant than live weightkilled there.
In EPA studies of the meat industry, packing houses are classified as lowor high-processing. The main difference between a low- and high-processingpacking house is the amount of processed products relative to kill; i.e., a ratioof less than 0.4 for a low- and greater than 0.4 for a high-processing plant. Asa result, waste load from processing is less for a low-processing packing house.
Low-Processing Packing Houses. Carawan et al. (1979) presented Table 4which summarizes the plant and raw waste characteristics for low-processingpacking houses. The average ratio of processed products to kill was 0.14. Thelow-processing packing houses included in the analyses have a ratio of processedproducts to LWK well below the value of 0.4 which distinguishes between low- andhigh-processing plants. Using the aforementioned definitions of plant size, thekill data show that all the packing houses in the sample were medium to large insize. High-processing plants were studied and reviewed but are not pertinent tothis study.
In an EPA survey on meat plants in the United States the researchers found:
- A wastewater flow range of 160 to 2427 gal/1000 lb LWK
- A waste load range of 1.5 to 30.5 lb BOD/lOOO lb LWK
- A kill range of 40 to 3300 thousand lb/day
The major causes of variations observed in wastewater strength and flowwere water use and housekeeping practices. Some variations in wastewater flow andstrength were attributed to differences in the operations carried out beyondslaughtering, such as by-product and prepared meat processing Effectiveness of
lant treatment was also believed to be partlymaterials recovery in primary in-presponsible for the variations.
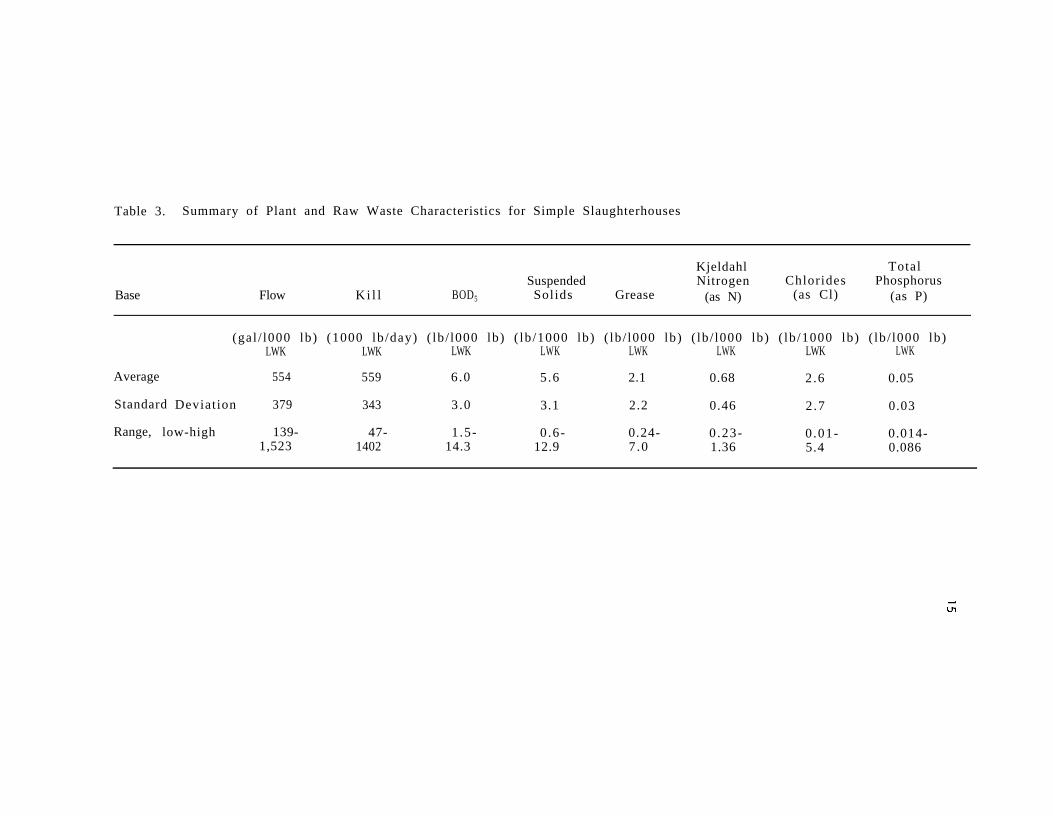
Table 3. Summary of Plant and Raw Waste Characteristics for Simple Slaughterhouses
Base Flow K i l l BOD5
Kjeldahl TotalSuspended Nitrogen Chlorides Phosphorus
Solids Grease (as N) (as Cl) (as P)
(gal / l000 lb) (1000 lb/day) ( lb/ l000 lb) ( lb/1000 lb) ( lb/ l000 lb) ( lb/ l000 lb) ( lb/1000 lb) ( lb/ l000 lb)LWK LWK LWK LWK LWK LWK LWK LWK
Average 554 559 6.0 5.6 2.1 0.68 2.6 0.05
Standard Deviation 379 343 3.0 3.1 2.2 0.46 2.7 0.03
Range, low-high 139- 47- 1.5- 0 .6- 0.24- 0 .23- 0 .01- 0.014-1,523 1402 14.3 12.9 7.0 1.36 5.4 0.086
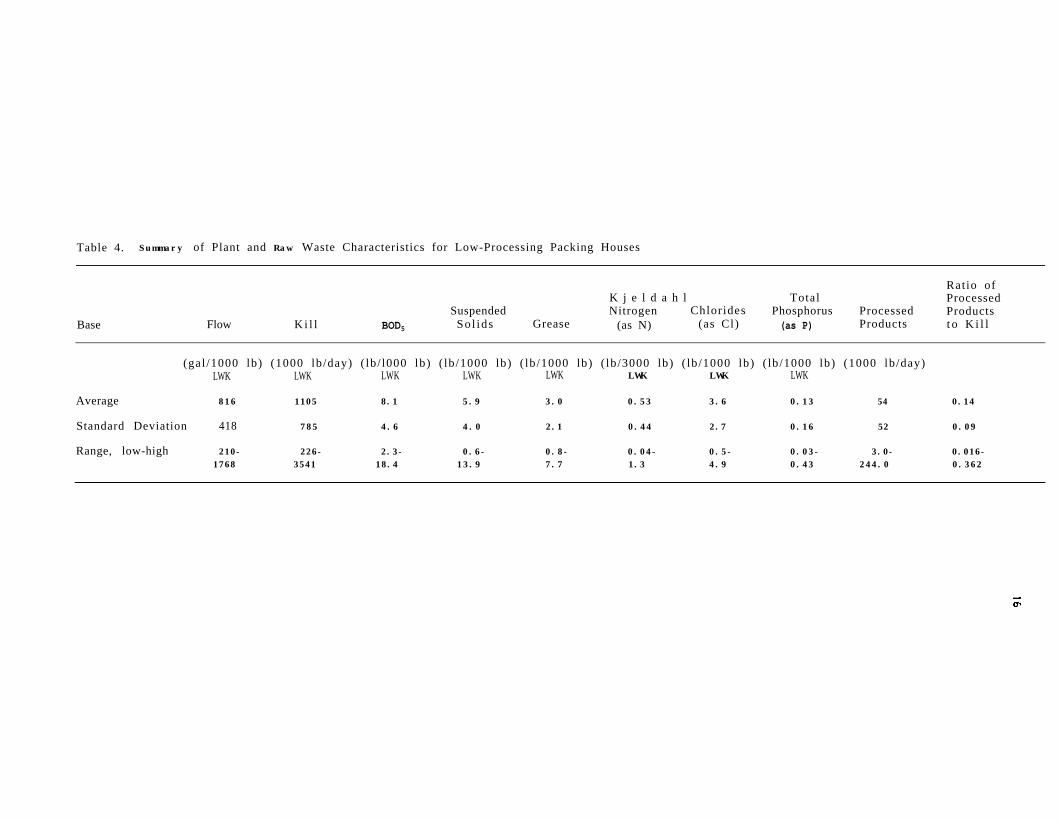
Table 4. Summary of Plant and Raw Waste Characteristics for Low-Processing Packing Houses
Base Flow K i l l BOD5
Ratio ofK j e l d a h l Total Processed
Suspended Nitrogen Chlorides Phosphorus Processed ProductsSo l ids Grease (as N) (as Cl) (as P) Products t o K i l l
(gal /1000 lb) (1000 lb/day) ( lb/ l000 lb) ( lb/1000 lb) ( lb/1000 lb) ( lb/3000 lb) ( lb/1000 lb) ( lb/1000 lb) (1000 lb/day)LWK LWK LWK LWK LWK LWK LWK LWK
Average 816 1105 8.1 5.9 3.0 0.53 3.6 0.13 54 0.14
Standard Deviation 418 785 4.6 4.0 2.1 0.44 2.7 0.16 52 0.09
Range, low-high 210- 226- 2.3- 0.6- 0.8- 0.04- 0.5- 0.03- 3.0- 0.016-1768 3541 18.4 13.9 7.7 1.3 4.9 0.43 244.0 0.362

17
Statistical correlation analysis of the data revealed that the raw wasteload BOD5 values correlated with values measuring the presence of suspendedsolids (TSS), grease (FOG) and kjeldahl nitrogen (TkN) on a LWK basis. This meansthat a change in one parameter will account for a certain predictable change inanother parameter.
Chloride and phosphorus are two parameters that relatively few plantsseemed to measure. The chloride and phosphorus waste load components were foundto be dependent on in-plant operations and housekeeping. For example, largeamounts of chlorides contained in pickling solutions used in processing ham,bacon, and other cured products ultimately end up in the wastewater. The authorsbelieve this explains the unusually high chloride values for high-processingpacking houses which cure many of their products. Very little useful informationon other waste parameters such as Kjeldahl nitrogen, nitrites, nitrates, ammonia,and total dissolved solids were reported by 85 plants surveyed for EPA. Othersources provided the typical ranges listed below for these waste parameters:
- Nitrates and Nitrites, as N, mg/l 0.01 - 0.85- Kjeldahl nitrogen, mg/l 50 - 300- Ammonia as N, mg/l 7 - 50- Total dissolved sol ids , mg/ l 500 - 25,000
Bacteria were also found to be present in raw waste from meat packingplants. The usual measure is in terms of coliforms, for which the most probablenumber is typically in the range of 2 to 4 million per 100 ml.
The process wastewater was noted as normally being warm. It was found toaverage about 32oC (90oF) and reach a high of about 38oC (lOOoF) during the killperiod and a low of about 27oC (80oF) during cleanup.
The pH of the process wastewater was found to vary from 6.5 to 8.5, althoughoccasionally it may be outside this range.
Sources of Wastewater
Animal Pens. Pen wastes are high in nutrients, although they only containabout 0.25 lb of BOD/1000 lb LWK. Solid wastes can be removed by dry cleaning,followed by little or no washdown. If washdown is practiced, a manure trap can beused to recover solids rather than allowing them to enter a treatment system. Anyrainfall or snowmelt runoff is normally contained and routed for treatment withother raw waste flows.
Watering troughs are another source of pen wastewater. Each trough maydischarge 2.1 gal/min or more. With 50 or more pens used at a large plant, thewater source becomes significant although pen waste is but a minor contributor inthe plant’s waste load.
Slaughtering. The slaughtering operation is the largest single source ofwaste load in a meat packing plant, and blood is the major contributor. Blood isrich in BOD, chlorides, and nitrogen. It has an ultimate BOD of 405,000 mg/l anda BOD5 between 150,000 and 200,000 mg/l.
18
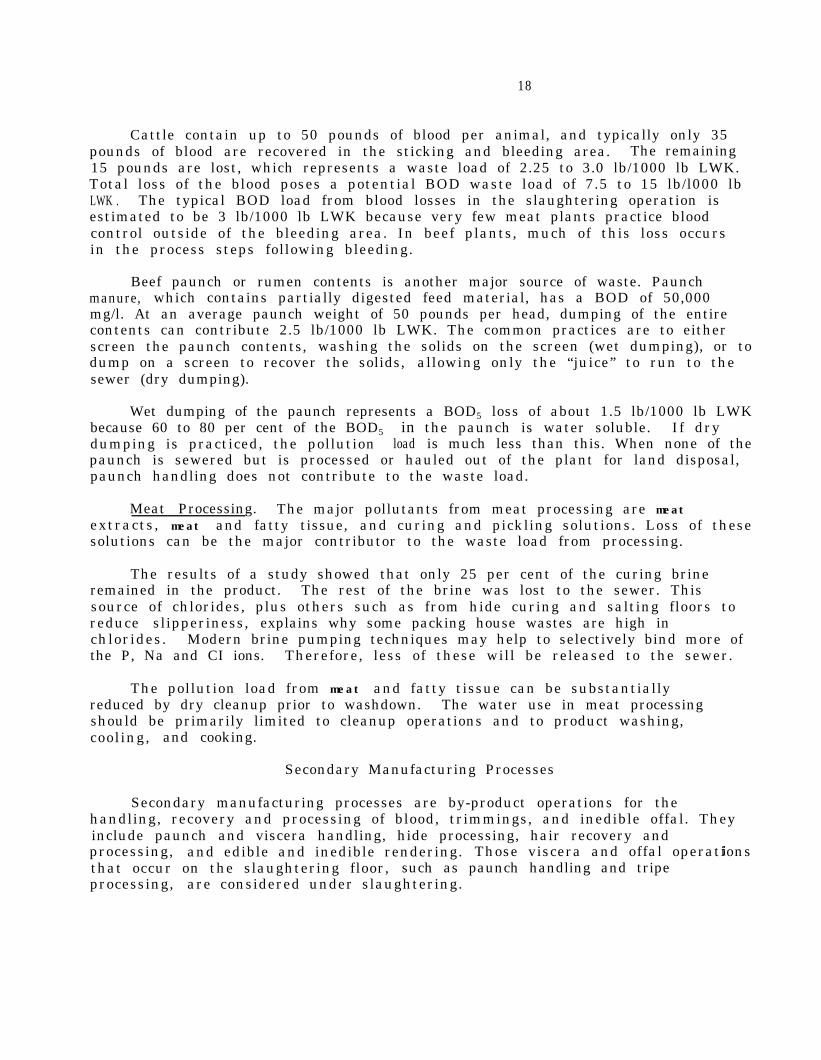
Cattle contain up to 50 pounds of blood per animal, and typically only 35pounds of blood are recovered in the sticking and bleeding area. The remaining15 pounds are lost, which represents a waste load of 2.25 to 3.0 lb/1000 lb LWK.Total loss of the blood poses a potential BOD waste load of 7.5 to 15 lb/l000 lbLWK . The typical BOD load from blood losses in the slaughtering operation isestimated to be 3 lb/1000 lb LWK because very few meat plants practice bloodcontrol outside of the bleeding area. In beef plants, much of this loss occursin the process steps following bleeding.
Beef paunch or rumen contents is another major source of waste. Paunchmanure, which contains partially digested feed material, has a BOD of 50,000mg/l. At an average paunch weight of 50 pounds per head, dumping of the entirecontents can contribute 2.5 lb/1000 lb LWK. The common practices are to eitherscreen the paunch contents, washing the solids on the screen (wet dumping), or todump on a screen to recover the solids, allowing only the “juice” to run to thesewer (dry dumping).
Wet dumping of the paunch represents a BOD5 loss of about 1.5 lb/1000 lb LWKbecause 60 to 80 per cent of the BOD5 in the paunch is water soluble. If drydumping is practiced, the pollution load is much less than this. When none of thepaunch is sewered but is processed or hauled out of the plant for land disposal,paunch handling does not contribute to the waste load.
Meat Processing. The major pollutants from meat processing are meatextracts, meat and fatty tissue, and curing and pickling solutions. Loss of thesesolutions can be the major contributor to the waste load from processing.
The results of a study showed that only 25 per cent of the curing brineremained in the product. The rest of the brine was lost to the sewer. Thissource of chlorides, plus others such as from hide curing and salting floors toreduce slipperiness, explains why some packing house wastes are high inchlorides. Modern brine pumping techniques may help to selectively bind more ofthe P, Na and CI ions. Therefore, less of these will be released to the sewer.
The pollution load from meat and fatty tissue can be substantiallyreduced by dry cleanup prior to washdown. The water use in meat processingshould be primarily limited to cleanup operations and to product washing,cooling, and cooking.
Secondary Manufacturing Processes
Secondary manufacturing processes are by-product operations for thehandling, recovery and processing of blood, trimmings, and inedible offal. Theyinclude paunch and viscera handling, hide processing, hair recovery andprocessing, and edible and inedible rendering. Those viscera and offal operationsthat occur on the slaughtering floor, such as paunch handling and tripeprocessing, are considered under slaughtering.

19
Hide curing operations are becoming increasingly involved at meat packingplants. Today many beef slaughter operations include hide curing in tanks, vatsor raceways. The hides, prior to being soaked in brine, are washed and defleshed.These washings, which are sewered, contain blood, dirt, manure and flesh. In mostdefleshing operations the bulk of the tissue is recovered. In addition to thesewastes, soaking the hide in the brine results in a net overflow of approximately2 gallons of brine solution per hide.
In some plants the brine in the raceway is dumped weekly. In others it isdumped yearly or whenever the solids build up to a point where they interferewith the hide curing operation. The life of the brine can be extended by pumpingthe recycled brine over a vibrating or static screen. The waste load from theoverflow and washings, in a typical hide curing operation where the hide curingwastes are not frequently dumped, is about 1.5 lb/1000 lb LWK for BOD and about 4lb salt/1000 lb LWK.
Cutting. The main pollutants from cutting operations are meat and fatscraps from trimming and bone dust from sawing. Most of these pollutants enterthe waste stream during cleanup operations. These wastes can be reduced byremoving the majority of them by dry cleanup prior to washdown and by some formof grease trap in the cutting area.
The collected material can be used directly in rendering. Bone dust is alarge source of phosphorus and when mixed with water, does not settle outreadi ly : thus i t is di f f icult to recover , and should be captured in a box underthe saw.
Cleanup. Cleanup contributes between 0.3 and 3 lb BOD/l000 lb LWK in smallpacking houses. Data collected by the Iowa Department of Environmental Qualityshowed that anywhere from 27 to 56 per cent of the total BOD waste load iscontained in the cleanup wastewaters. The cleanup operation is a majorcontributor to the waste load. It also leads to a s ignif icant loss ofrecoverable by-products. Detergents used in cleanup can adversely affect theefficiency of grease recovery in the plant catch basin.
The techniques and procedures used during cleanup can greatly influence thewater use in a plant and the total waste load. For example, dry cleaning offloors to remove scraps prior to wash down and dry scraping of the blood from thebleed area into the blood sewer before the normal washdown decreases cleanuppollution load.
An Example of Water Conservation and Waste Control
In an EPA publication Lively (1976) reported how a meat packer decreasedunduly high wastewater costs. He noted that the most logical alternative tohigh costs was to reduce the strength and volume of the slaughterhouse discharge.Water use was 1,060 gallons/l,000 lb LWK with a BOD of 11.8 lb/l,000 lb LWK,compared to the national average of 5.8 lb/l,000 lb LWK when the program began.An in-plant waste control program was devised to reduce the strength and volumeof the wastewater to an acceptable level.
20
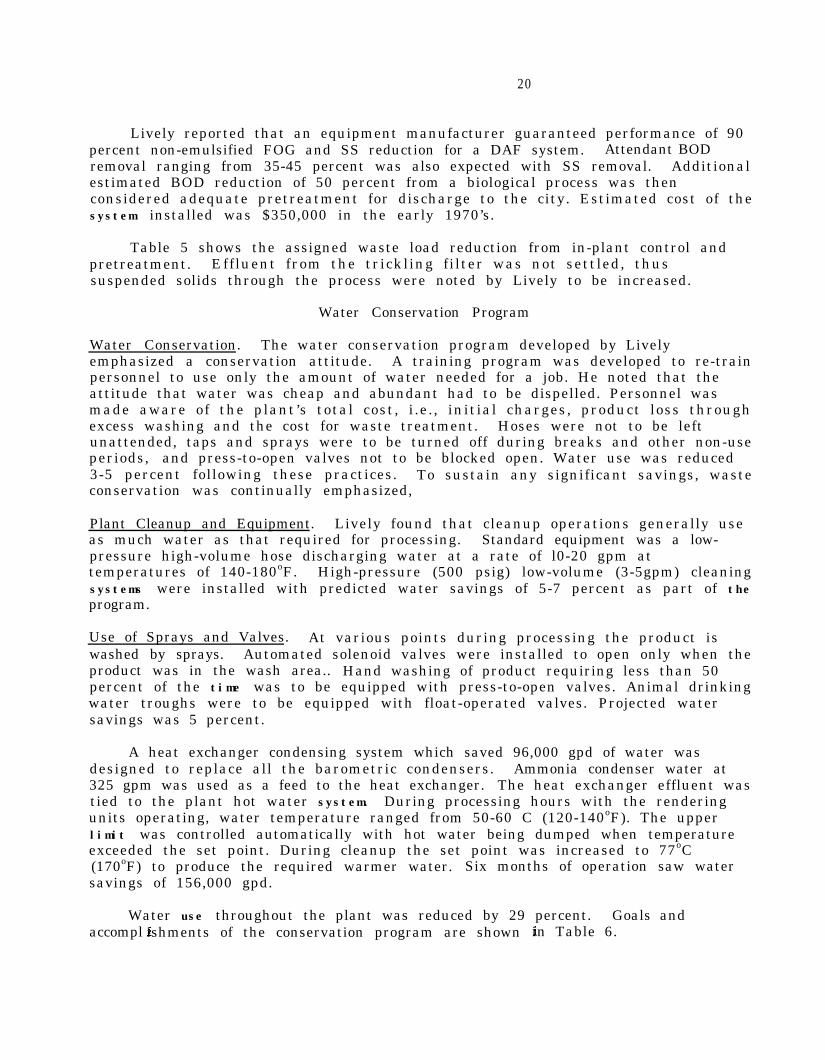
Lively reported that an equipment manufacturer guaranteed performance of 90percent non-emulsified FOG and SS reduction for a DAF system. Attendant BODremoval ranging from 35-45 percent was also expected with SS removal. Additionalestimated BOD reduction of 50 percent from a biological process was thenconsidered adequate pretreatment for discharge to the city. Estimated cost of thesystem installed was $350,000 in the early 1970’s.
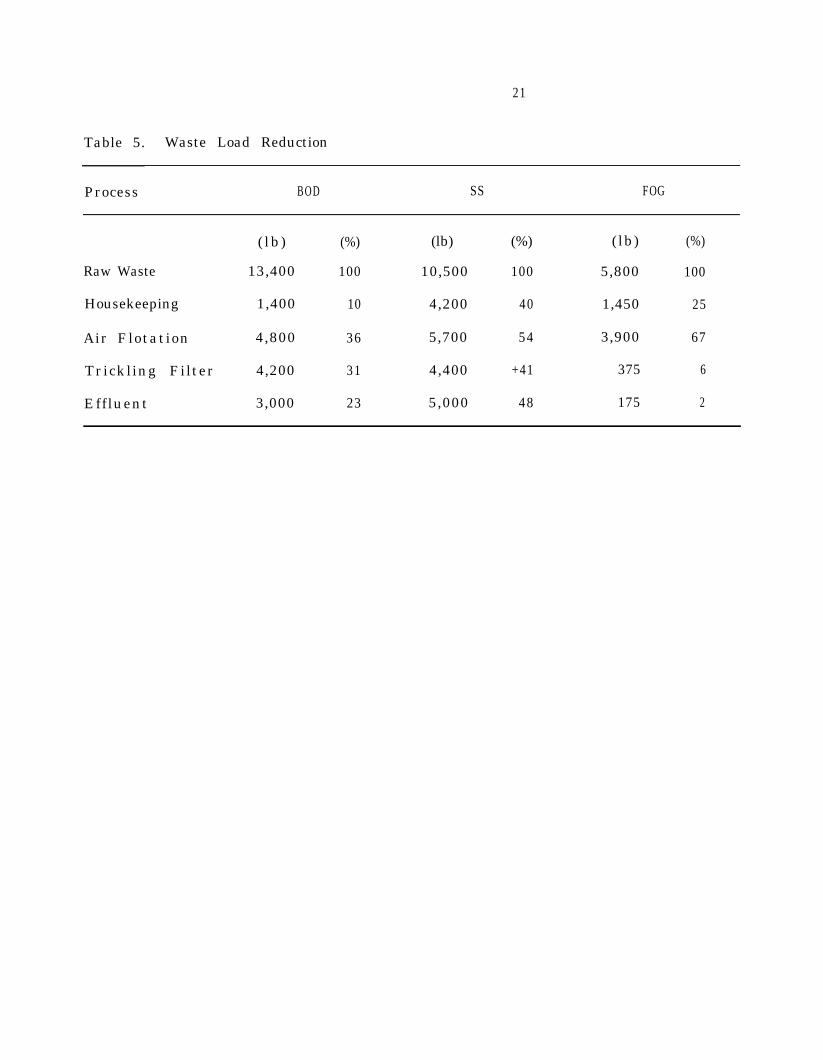
Table 5 shows the assigned waste load reduction from in-plant control andpretreatment. Effluent from the trickling filter was not settled, thussuspended solids through the process were noted by Lively to be increased.
Water Conservation Program
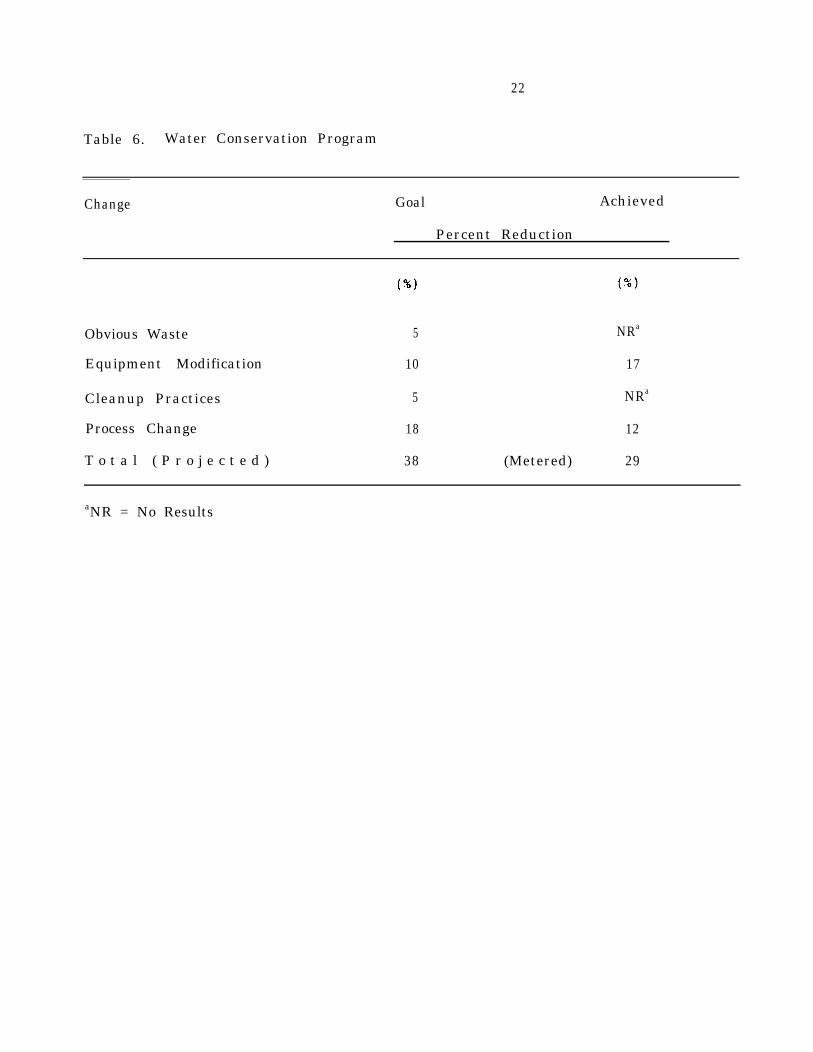
Water Conservation. The water conservation program developed by Livelyemphasized a conservation attitude. A training program was developed to re-trainpersonnel to use only the amount of water needed for a job. He noted that theattitude that water was cheap and abundant had to be dispelled. Personnel wasmade aware of the plant’s total cost, i .e., initial charges, product loss throughexcess washing and the cost for waste treatment. Hoses were not to be leftunattended, taps and sprays were to be turned off during breaks and other non-useperiods, and press-to-open valves not to be blocked open. Water use was reduced3-5 percent following these practices. To sustain any significant savings, wasteconservation was continually emphasized,
Plant Cleanup and Equipment. Lively found that cleanup operations generally useas much water as that required for processing. Standard equipment was a low-pressure high-volume hose discharging water at a rate of l0-20 gpm attemperatures of 140-180oF. High-pressure (500 psig) low-volume (3-5gpm) cleaningsystems were installed with predicted water savings of 5-7 percent as part of theprogram.
Use of Sprays and Valves. At various points during processing the product iswashed by sprays. Automated solenoid valves were installed to open only when theproduct was in the wash area.. Hand washing of product requiring less than 50percent of the time was to be equipped with press-to-open valves. Animal drinkingwater troughs were to be equipped with float-operated valves. Projected watersavings was 5 percent.
A heat exchanger condensing system which saved 96,000 gpd of water wasdesigned to replace all the barometric condensers. Ammonia condenser water at325 gpm was used as a feed to the heat exchanger. The heat exchanger effluent wastied to the plant hot water system. During processing hours with the renderingunits operating, water temperature ranged from 50-60 C (120-140oF). The upperlimit was controlled automatically with hot water being dumped when temperatureexceeded the set point. During cleanup the set point was increased to 77oC(170oF) to produce the required warmer water. Six months of operation saw watersavings of 156,000 gpd.
accomplWater use throughout the plant was reduced by 29 percent. Goals and
in Table 6.ishments of the conservation program are shown
21
Table 5. Waste Load Reduction
Process
Raw Waste
Housekeeping
BOD SS FOG
( lb ) (%) (lb) (%) ( lb) (%)
13,400 100 10,500 100 5,800 100
1,400 10 4,200 40 1,450 25
Air Flotation 4,800 36 5,700 54 3,900 67
Trickling Filter 4,200 31 4,400 +41 375 6
Effluent 3,000 23 5,000 48 175 2
22
Table 6. Water Conservation Program
Change Goal Achieved
Percent Reduction
Obvious Waste 5 NRa
Equipment Modification 10 17
Cleanup Practices 5 NRa
Process Change 18 12
T o t a l ( P r o j e c t e d ) 38 (Metered) 29
aNR = No Results
23
Water savings through correction of obvious waste practices, equipmentmodification and altered cleanup practices could not be measured separately. Agross improvement for the entire plant was reported (Table 6). When all facetsof the program have been completed, Lively predicts that anticipated water usewill be 50 percent of the starting volume.
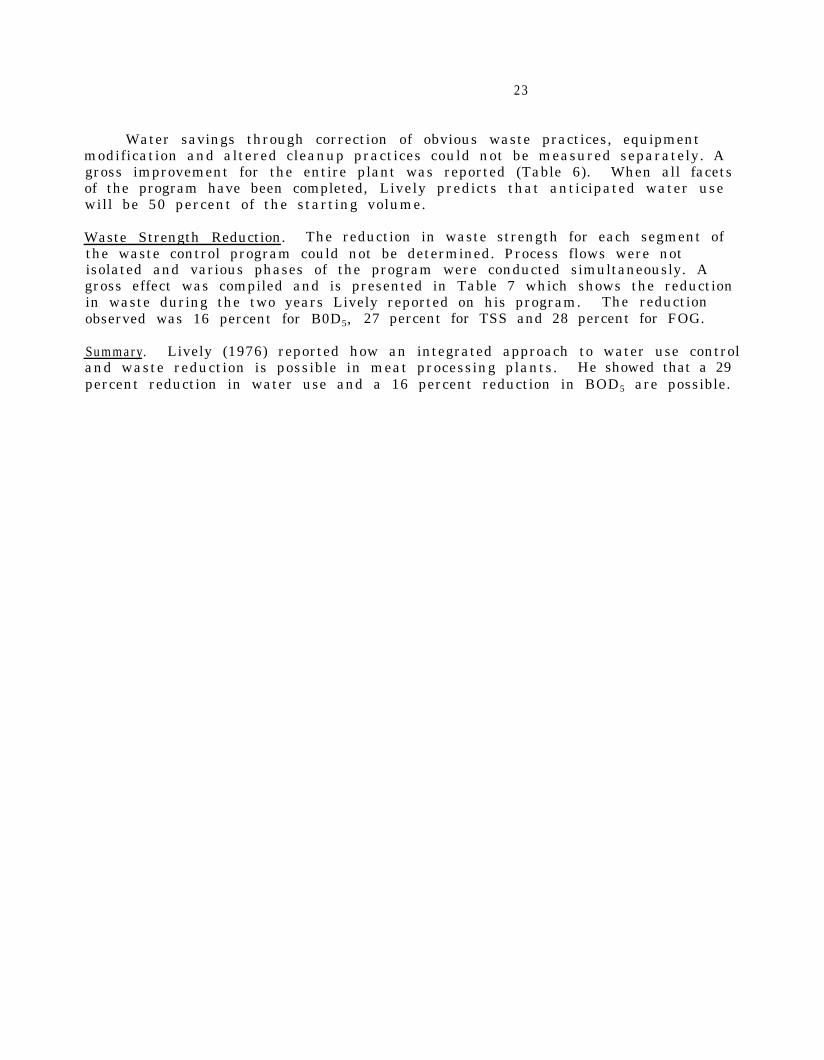
Waste Strength Reduction. The reduction in waste strength for each segment ofthe waste control program could not be determined. Process flows were notisolated and various phases of the program were conducted simultaneously. Agross effect was compiled and is presented in Table 7 which shows the reductionin waste during the two years Lively reported on his program. The reductionobserved was 16 percent for B0D5, 27 percent for TSS and 28 percent for FOG.
Summary. Lively (1976) reported how an integrated approach to water use controland waste reduction is possible in meat processing plants. He showed that a 29percent reduction in water use and a 16 percent reduction in BOD5 are possible.
24
Table 7. In-Plant Waste Strength Reduction
Date
1972
1974
BOD
(lb)
13,400
11,300
16
SS
( lb)
10,500
7,700
% Reduction
27
FOG
( lb )
5,800
4.150
28
25
PLANT REVIEW AND SURVEY
Introduction
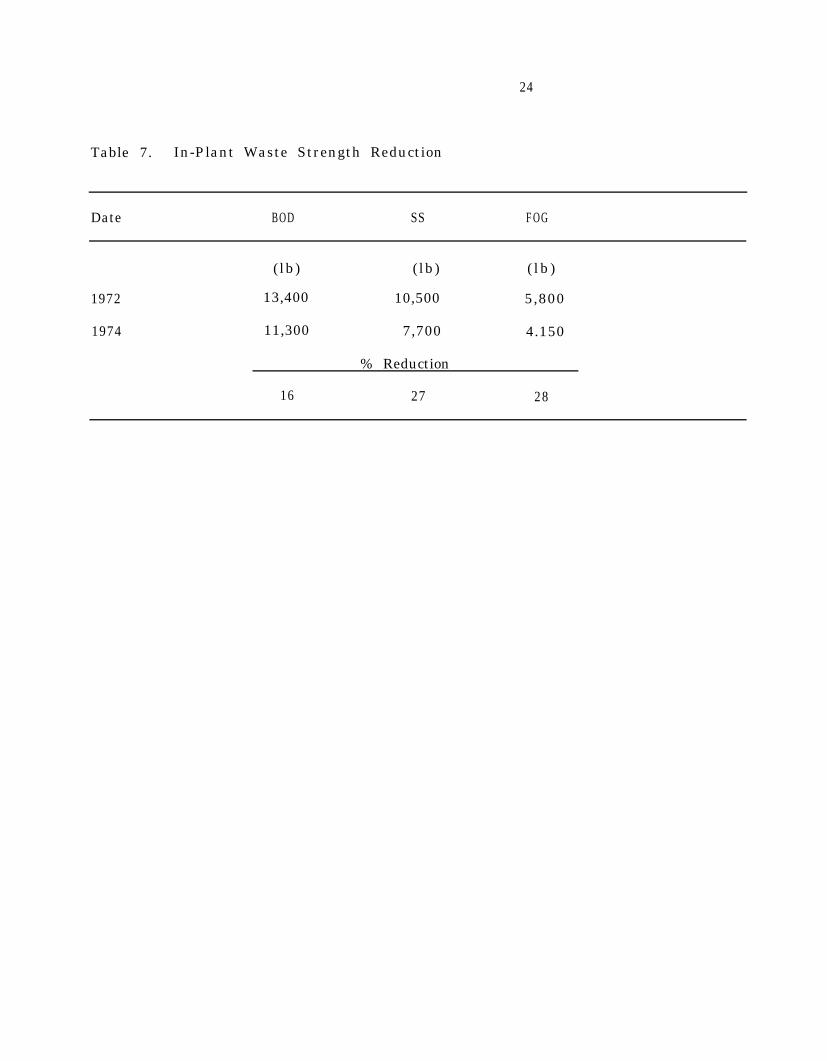
Randolph Packing Company is located in the city of Asheboro, NC. Thecompany is a small beef slaughtering facility that kills in excess of 250,000 lbper week. All carcasses are boned and the majority of the boneless meat sold tofurther processors. Randolph performs a limited amount of further processing,as in steaks, roasts and ground beef. All the wastewater from this modern plantis discharged to the sewers of the Asheboro publically owned treatment works(POTW).
Randolph Packing is a typical beef slaughter plant. A flow diagram ofoperations is shown in Figure 2. A beef slaughter plant is a water-intensivebusiness that can contribute considerable pollution. It consists of adisassembly process that requires water at each step from the time the liveanimal enters the plant until its disassembled parts leave the plant. The waterused becomes wastewater which can contain excess pollutants unless materialdeposition into the wastewater stream is avoided.
The beef cattle are placed in holding pens when they enter the plant. Theyremain in this area until they are ready for slaughter. The animals are givenwater and feed if the holding time is more than one day. The animals will excretethe non-utilized feed and water. To maintain a clean area for the cattle, thearea should be dry cleaned to remove the excrement and the water should beflushed. A thorough dry clean will minimize excess pollutants to the wastewatersystem.
The slaughter process begins with rendering the animals insensitive usinghumane methods. They are then bled by cutting the carotid artery and jugularvein. The blood may weigh as much as 4.5 percent of the body weight. Bloodshould be collected so that it does not enter the wastewater.
The hide is then manually removed, cured with salt, and sold. Excesstrimmings and feet from the hide removal process should be placed in inediblebarrels for disposal to a rendering company. This will avoid particulate matterin the waste-disposal system.
Evisceration removes the internal parts of the animal, and the heart andliver are usually saved. The stomach and intestines are known as the paunch.Although parts of the stomach can be saved, it is not economically beneficial tomany plants. A more economical approach is to tie off the bung (end of the analcanal) before evisceration, which prevents fecal contamination of the carcassand the intestinal contents from entering the wastewater system. The entirecontents will then be picked up by a commercial rendering company and processedinto animal feed.
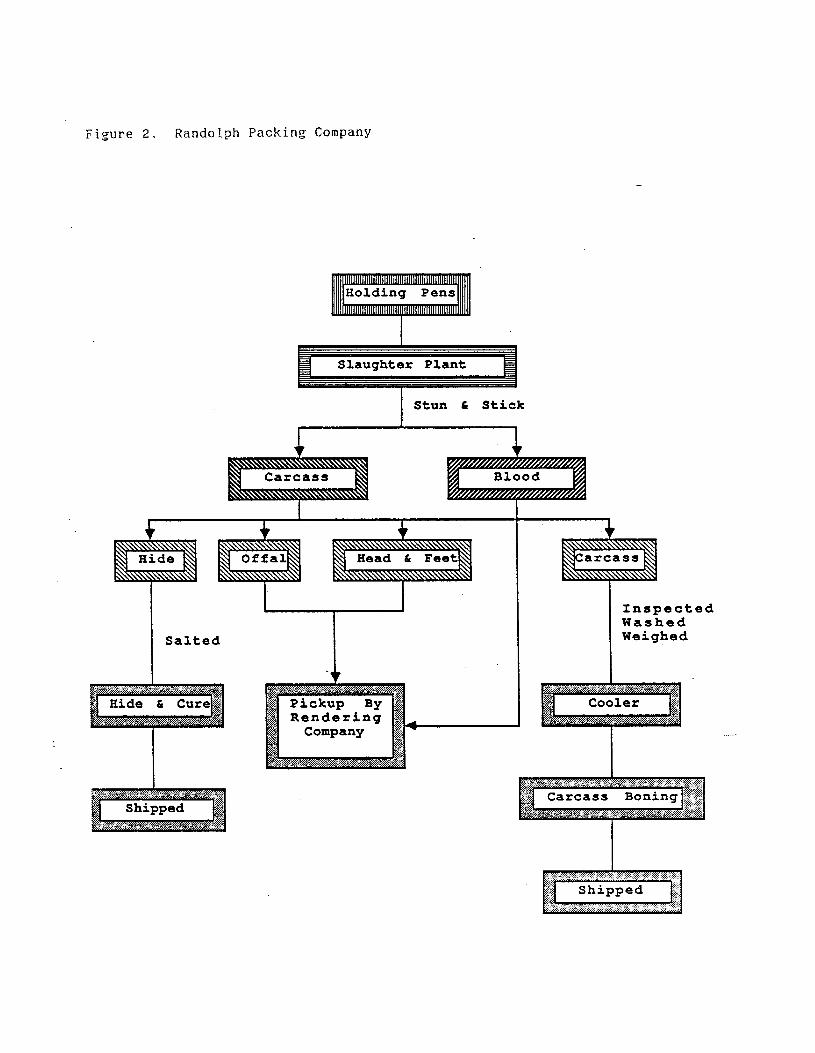
The eviscerated carcasses are inspected by a state or federal employee to.assure they are suitable for human consumption. The carcass is washed and thenplaced in a refrigerated room to remove the body heat.
Since the potable water supply is pressurized, loose particles can beremoved from the carcass during the washing process. All loose material shouldbe removed to avoid disposal in the wastewater system. Trimming the neck areaof blood clots and the entire carcass of loose pieces will help to prevent thismaterial from being washed to the drain.
Survey for Product Losses and Wastes
The research team surveyed Randolph Packing Company utilizing the followingformat:
1) Drawings of product flow and equipment layout were reviewed.
2) Literature was surveyed for known recovery methods.
3) Equipment manufacturers and other meat plant managers were contacted forideas and suggestions.
4) The team visited the plant on several occasions and reviewed its independentand joint findings.
5) Key employees were interviewed at their work stations.
6) The research team prepared a list and mutually reviewed the sources ofwaste, product and by-product losses. Safety, costs and feasibi l i ty ofrecovery were discussed. Notes were made on how management might prevent theloss and/or waste.
7) City of Asheboro officials were contacted for their input.
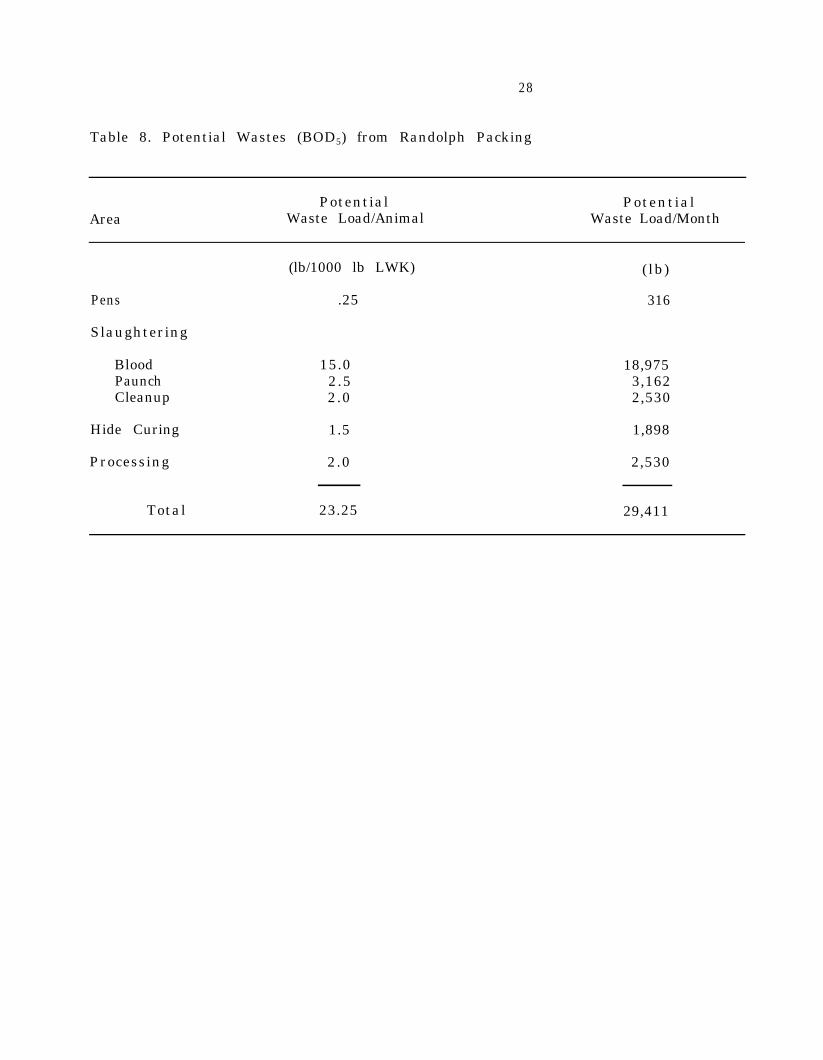
Each area of the plant was surveyed for losses and wastes, including pens,receiving, kill floor and products processing. In each area of the plant, everyprocess and operation were observed for activities that let product escape to thefloor or drain. Losses and wastes are summarized in Table 8. The benchmark wasteload was 6870 lb BOD, per month out of the potential of almost 30,000 lb BOD5 permonth (Table 8). The plant currently recovers as by-products about 77 percent ofthe potential BOD5.
Water Use and Waste Load
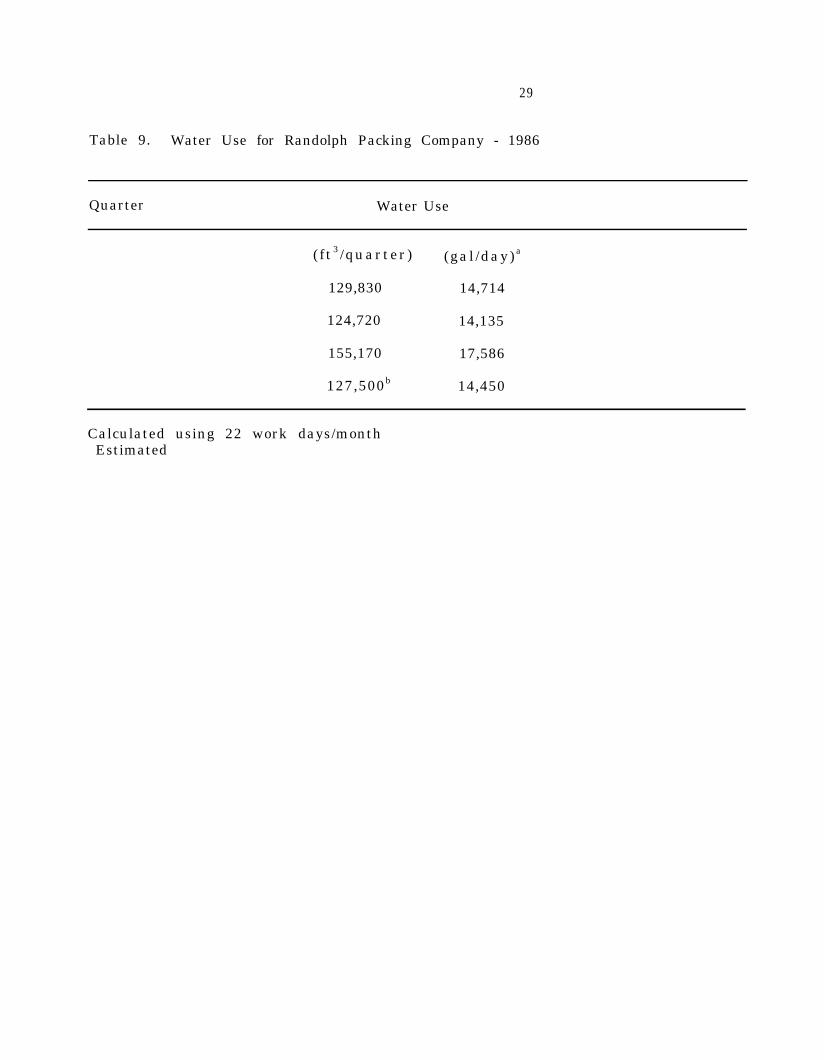
Water Use. Randolph Packing Company receives its water from the City ofAsheboro. City records were reviewed, and water use for 1986 was tabulated inTable 9. The average water use was calculated to be about 15,000 GPD. Water usefor the benchmark period was 14,714 GPD while water use for the project averageperiod was 15,390 GPD.
28
Table 8. Potential Wastes (BOD5) from Randolph Packing
AreaPotential Potential
Waste Load/Animal Waste Load/Month
Pens
(lb/1000 lb LWK)
.25
(lb)
316
Slaughtering
Blood 15.0 18,975Paunch 2.5 3,162Cleanup 2.0 2,530
Hide Curing 1.5 1,898
Processing 2.0 2,530
Total 23.25 29,411
29
Table 9. Water Use for Randolph Packing Company - 1986
Quarter Water Use
( ft 3 /quarter) (gal /day) a
129,830 14,714
124,720 14,135
155,170 17,586
127,500b 14,450
Calculated using 22 work days/monthEstimated
30
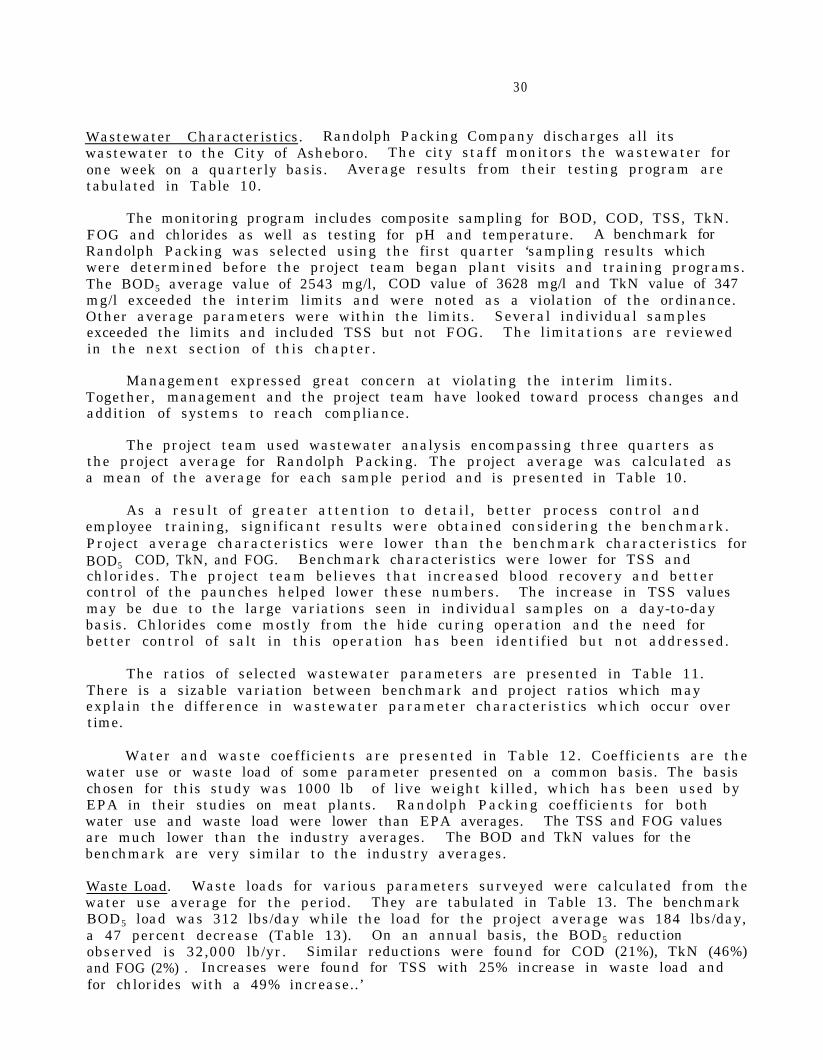
Wastewater Characteristics. Randolph Packing Company discharges all itswastewater to the City of Asheboro. The city staff monitors the wastewater forone week on a quarterly basis. Average results from their testing program aretabulated in Table 10.
The monitoring program includes composite sampling for BOD, COD, TSS, TkN.FOG and chlorides as well as testing for pH and temperature. A benchmark forRandolph Packing was selected using the first quarter ‘sampling results whichwere determined before the project team began plant visits and training programs.The BOD5 average value of 2543 mg/l, COD value of 3628 mg/l and TkN value of 347mg/l exceeded the interim limits and were noted as a violation of the ordinance.Other average parameters were within the limits. Several individual samplesexceeded the limits and included TSS but not FOG. The limitations are reviewedin the next section of this chapter.
Management expressed great concern at violating the interim limits.Together, management and the project team have looked toward process changes andaddition of systems to reach compliance.
The project team used wastewater analysis encompassing three quarters asthe project average for Randolph Packing. The project average was calculated asa mean of the average for each sample period and is presented in Table 10.
As a result of greater attention to detail, better process control andemployee training, significant results were obtained considering the benchmark.Project average characteristics were lower than the benchmark characteristics forBOD5 COD, TkN, and FOG. Benchmark characteristics were lower for TSS andchlorides. The project team believes that increased blood recovery and bettercontrol of the paunches helped lower these numbers. The increase in TSS valuesmay be due to the large variations seen in individual samples on a day-to-daybasis. Chlorides come mostly from the hide curing operation and the need forbetter control of salt in this operation has been identified but not addressed.
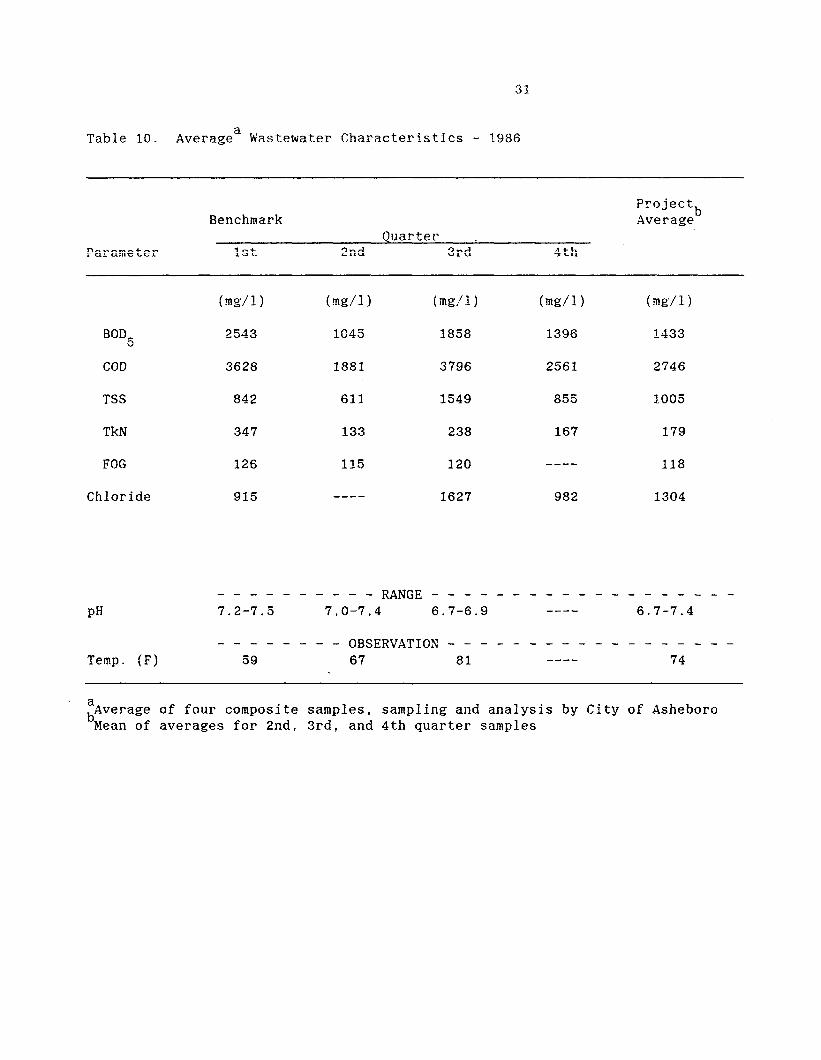
The ratios of selected wastewater parameters are presented in Table 11.There is a sizable variation between benchmark and project ratios which mayexplain the difference in wastewater parameter characteristics which occur overtime.
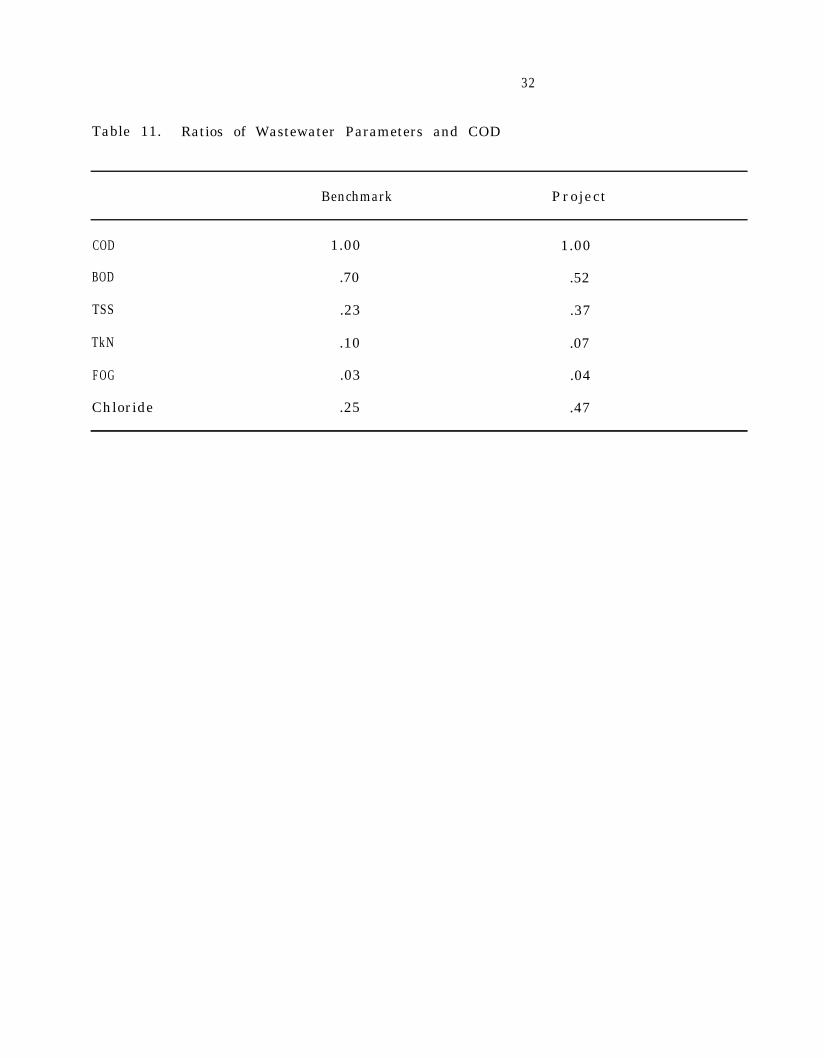
Water and waste coefficients are presented in Table 12. Coefficients are thewater use or waste load of some parameter presented on a common basis. The basischosen for this study was 1000 lb of live weight killed, which has been used byEPA in their studies on meat plants. Randolph Packing coefficients for bothwater use and waste load were lower than EPA averages. The TSS and FOG valuesare much lower than the industry averages. The BOD and TkN values for thebenchmark are very similar to the industry averages.
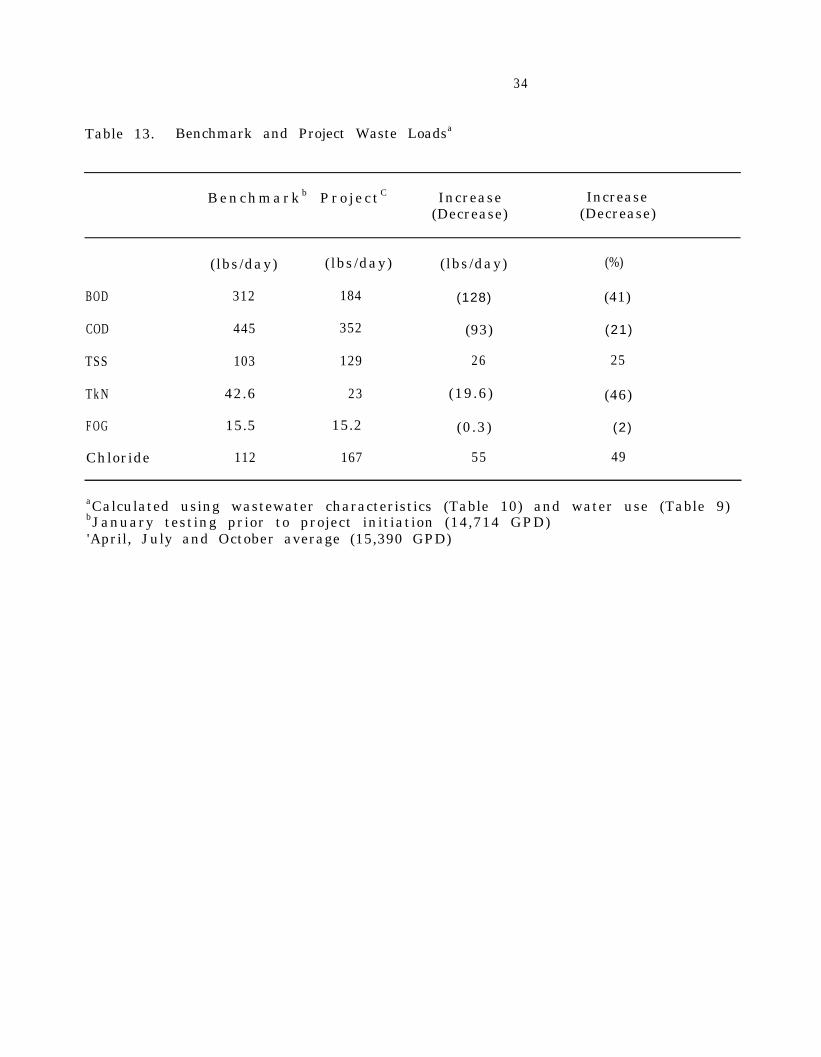
Waste Load. Waste loads for various parameters surveyed were calculated from thewater use average for the period. They are tabulated in Table 13. The benchmarkBOD5 load was 312 lbs/day while the load for the project average was 184 lbs/day,a 47 percent decrease (Table 13). On an annual basis, the BOD5 reductionobserved is 32,000 lb/yr. Similar reductions were found for COD (21%), TkN (46%)and FOG (2%) . Increases were found for TSS with 25% increase in waste load andfor chlorides with a 49% increase..’
32
Table 11. Ratios of Wastewater Parameters and COD
Benchmark Project
COD 1.00 1.00
BOD .70 .52
TSS .23 .37
TkN .10 .07
FOG .03 .04
Chloride .25 .47
33
Table 12. Water and Waste Coefficients for Randolph Packing Company - 1986
Average Water Use
Benchmark P r o j e c t EPAa Survey
(gal/1000 lb LWK) (gal/1000 lb LWK) (gal/1000 Ib LWK)
256 262 554
Average Waste Load
Benchmark Project EPAa Survey
(lb/1000 lb LWK) (lb/1000 lb LWK) (lb/1000 lb LWK)
BOD 5.43 3.14 6.0
COD 7.74 6.00 - - - -
TSS 1.79 2.20 5.6
TkN 0.74 0.39 0.68
FOG 0.27 0.26 2.1
aTable 3
34
Table 13. Benchmark and Project Waste Loadsa
Benchmark b Pro j e c t C Increase Increase(Decrease) (Decrease)
(lbs/day) (lbs/day) (lbs/day) (%)
BOD 312 184 (128) (41)
COD 445 352 (93) (21)
TSS 103 129 26 25
TkN 42.6 23 (19.6) (46)
FOG 15.5 15.2 (0.3) (2)
Chloride 112 167 55 49
aCalculated using wastewater characteristics (Table 10) and water use (Table 9)bJanuary testing prior to project initiation (14,714 GPD)'April, July and October average (15,390 GPD)
35
Wastewater Discharge Limitations and Costs
The discharge from Randolph Packing Company flows directly to the sewers inthe City of Asheboro and to the publically owned treatment works (POTW). Asheboroadopted a Sewer Use and Pretreatment Ordinance on June 23, 1983. The ordinancecontains specific prohibitions and limitations that relate to meat processingplants such as Randolph Packing.
Prohibitions are found in Section 2.4 of the ordinance. Prohibited fromdischarge are substances that might cause fire or explosion, obstruct flow insewers, create hazard to sewer personnel, and interfere with treatment operationand sludge disposal.
“Specifically prohibited are solid or viscous substanceswhich may cause obstruction to the flow in a sewer or otherinterference with the operation of the POTW such as, but notlimited to: floatable oil, animal guts or tissues, paunchmanure, bones, hair, hides or fleshings, whole blood . . .”Section 2.4(3).
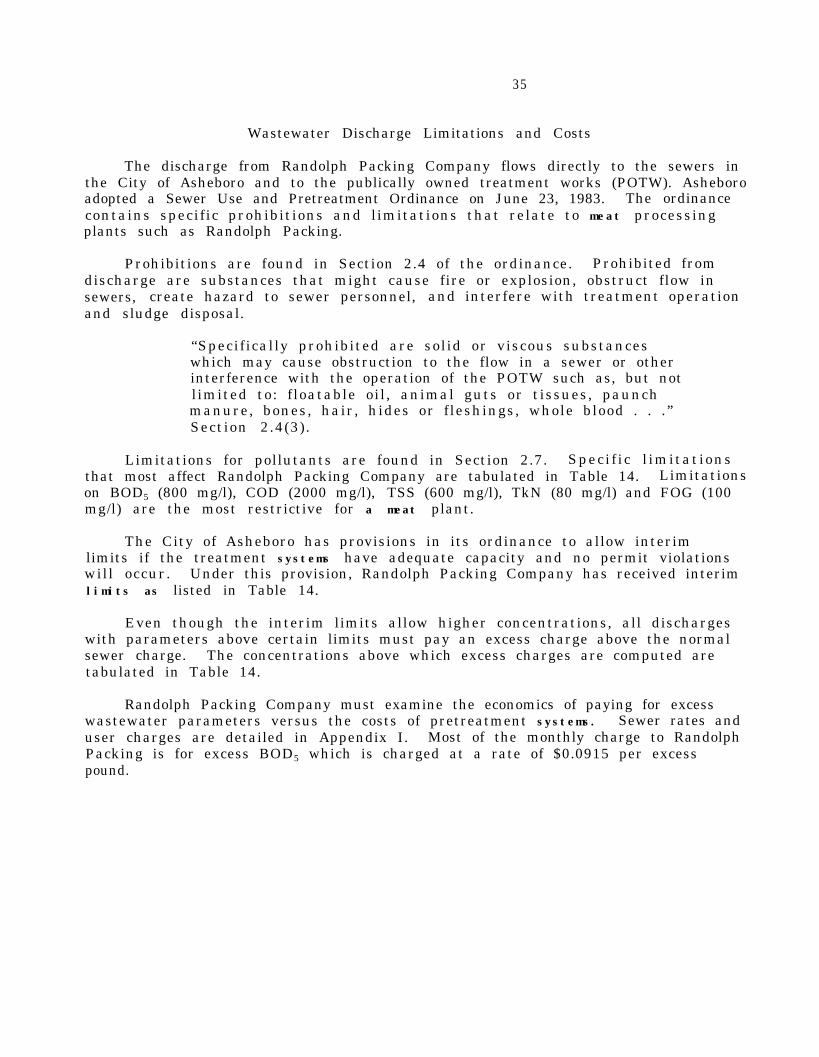
Limitations for pollutants are found in Section 2.7. Speci f ic l imitationsthat most affect Randolph Packing Company are tabulated in Table 14. Limitationson BOD5 (800 mg/l), COD (2000 mg/l), TSS (600 mg/l), TkN (80 mg/l) and FOG (100mg/l) are the most restrictive for a meat plant.
The City of Asheboro has provisions in its ordinance to allow interimlimits if the treatment systems have adequate capacity and no permit violationswill occur. Under this provision, Randolph Packing Company has received interimlimits as listed in Table 14.
Even though the interim limits allow higher concentrations, all dischargeswith parameters above certain limits must pay an excess charge above the normalsewer charge. The concentrations above which excess charges are computed aretabulated in Table 14.
Randolph Packing Company must examine the economics of paying for excesswastewater parameters versus the costs of pretreatment systems. Sewer rates anduser charges are detailed in Appendix I. Most of the monthly charge to RandolphPacking is for excess BOD5 which is charged at a rate of $0.0915 per excesspound.
36
Table 14. Asheboro Pretreatment Ordinance Limitations and Interim DischargeLimitsa for Randolph Packing
Parameter
ExcessLimitation Charge Interim Limitsa
Composite Peak A b o v e Concentration Waste Load
BOD 5 800 1200 300 2000 245
COD 2000 3000 750 4000 491
TSS 600 1000 300 1000 123
TkN 80 200 45 300 37
FOG 100 100 NA 250 31
aAllowed by City of Asheboro (subject to revision and/or revocation)Utilizing benchmark water use of 14,714 GPD and interim concentration limits

37
WASTE CENTERS, CHANGES, COSTS AND RESULTS
In-Plant Control Measures
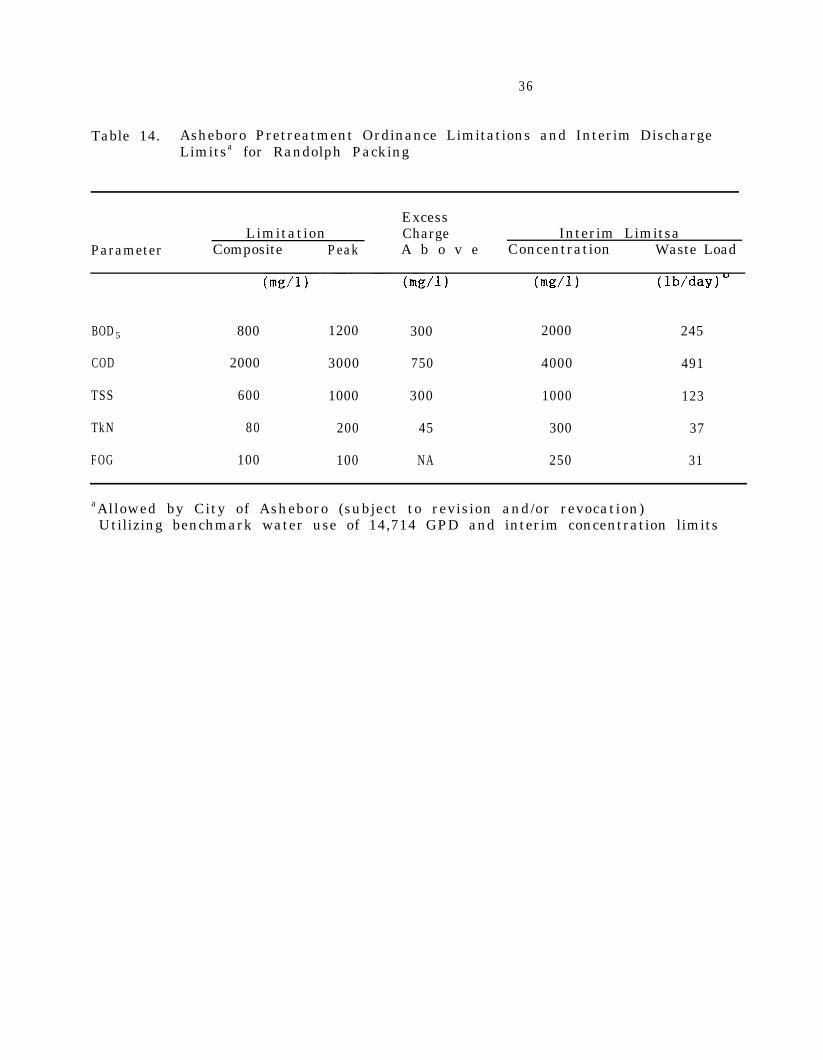
There are many effective measures that a food plant can use to efficientlyand economically reduce water use, product losses and waste loads, as shown inTable 15.
The best and most modern engineering design and equipment alone cannotcontrol water, product losses and waste within a plant. For any plant, thecontrolling factors in reducing water use, product loss and waste will always bemanagement attitude and action.
Management must do its part to have an effective water and waste controlprogram. Management's role must include the following for a successful program:
1) Understanding water and waste control
a) Needs for programb) Economic benefitsc) Awareness of all interrelated factors
2) Developing job descriptions for all personnel
3) Providing an environment that permits supervisors to control water use,product losses and waste load
4) Utilizing an effective and continuing education program for managementand employees
Water Conservation
The goal of every food plant manager should be to use an absolute minimum ofwater for the essentials of sanitation. A water conservation program for theplant can be summarized as follows:
- Employees should be trained to use water wisely-only enough to get the jobdone.
- The acquisition of a high-pressure cleanup system should be explored.
- Employees should be trained and expected to use the minimum pressure andvolume for washing product, consistent with quality control andregulations.
- Valves should be installed and used on all hoses.
38
Table 15. Measures to Control Water Use, Product Loss and Waste Load
Number Measure
1.
2.
3.
4.
Management understanding, interest and support
Installation of modern equipment and piping to reduce loss of product and tofacilitate recovery of by-products
Appointment of water-waste supervisor
Employee training
5.
6.
7.
8.
Accurate records of water use and waste load
Scheduling to reduce water use and waste
Proper cleaning procedures
Wastewater monitoring
9. Planned maintenance program to reduce losses and waste
10. Planned quality control program to reduce losses and waste
11. Planning systems for recovery of wasted product and by-products
12. Development of alternatives for wasted product recovery
39
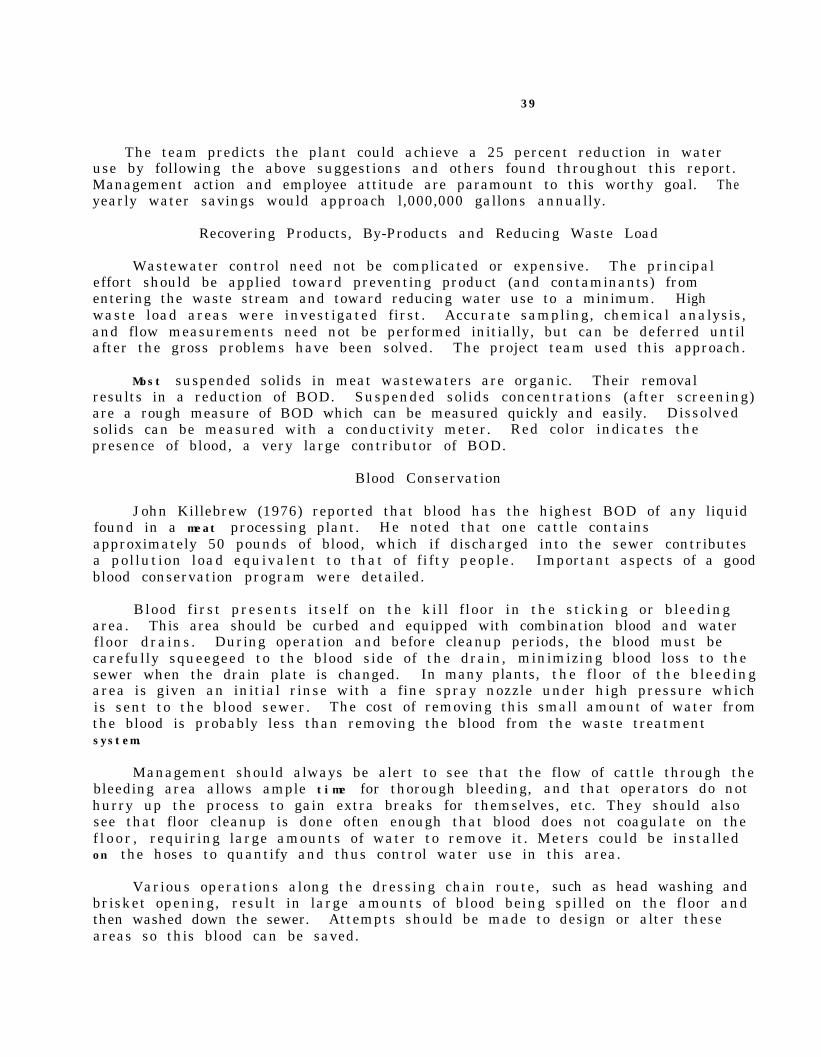
The team predicts the plant could achieve a 25 percent reduction in wateruse by following the above suggestions and others found throughout this report.Management action and employee attitude are paramount to this worthy goal. Theyearly water savings would approach l,000,000 gallons annually.
Recovering Products, By-Products and Reducing Waste Load
Wastewater control need not be complicated or expensive. The principaleffort should be applied toward preventing product (and contaminants) fromentering the waste stream and toward reducing water use to a minimum. Highwaste load areas were investigated first. Accurate sampling, chemical analysis,and flow measurements need not be performed initially, but can be deferred untilafter the gross problems have been solved. The project team used this approach.
Most suspended solids in meat wastewaters are organic. Their removalresults in a reduction of BOD. Suspended solids concentrations (after screening)are a rough measure of BOD which can be measured quickly and easily. Dissolvedsolids can be measured with a conductivity meter. Red color indicates thepresence of blood, a very large contributor of BOD.
Blood Conservation
John Killebrew (1976) reported that blood has the highest BOD of any liquidfound in a meat processing plant. He noted that one cattle containsapproximately 50 pounds of blood, which if discharged into the sewer contributesa pollution load equivalent to that of fifty people. Important aspects of a goodblood conservation program were detailed.
Blood first presents itself on the kill floor in the sticking or bleedingarea. This area should be curbed and equipped with combination blood and waterfloor drains. During operation and before cleanup periods, the blood must becarefully squeegeed to the blood side of the drain, minimizing blood loss to thesewer when the drain plate is changed. In many plants, the floor of the bleedingarea is given an initial rinse with a fine spray nozzle under high pressure whichis sent to the blood sewer. The cost of removing this small amount of water fromthe blood is probably less than removing the blood from the waste treatmentsystem.
Management should always be alert to see that the flow of cattle through thebleeding area allows ample time for thorough bleeding, and that operators do nothurry up the process to gain extra breaks for themselves, etc. They should alsosee that floor cleanup is done often enough that blood does not coagulate on thef l oo r , requiring large amounts of water to remove it. Meters could be installedon the hoses to quantify and thus control water use in this area.
Various operations along the dressing chain route, such as head washing andbrisket opening, result in large amounts of blood being spilled on the floor andthen washed down the sewer. Attempts should be made to design or alter theseareas so this blood can be saved.
40
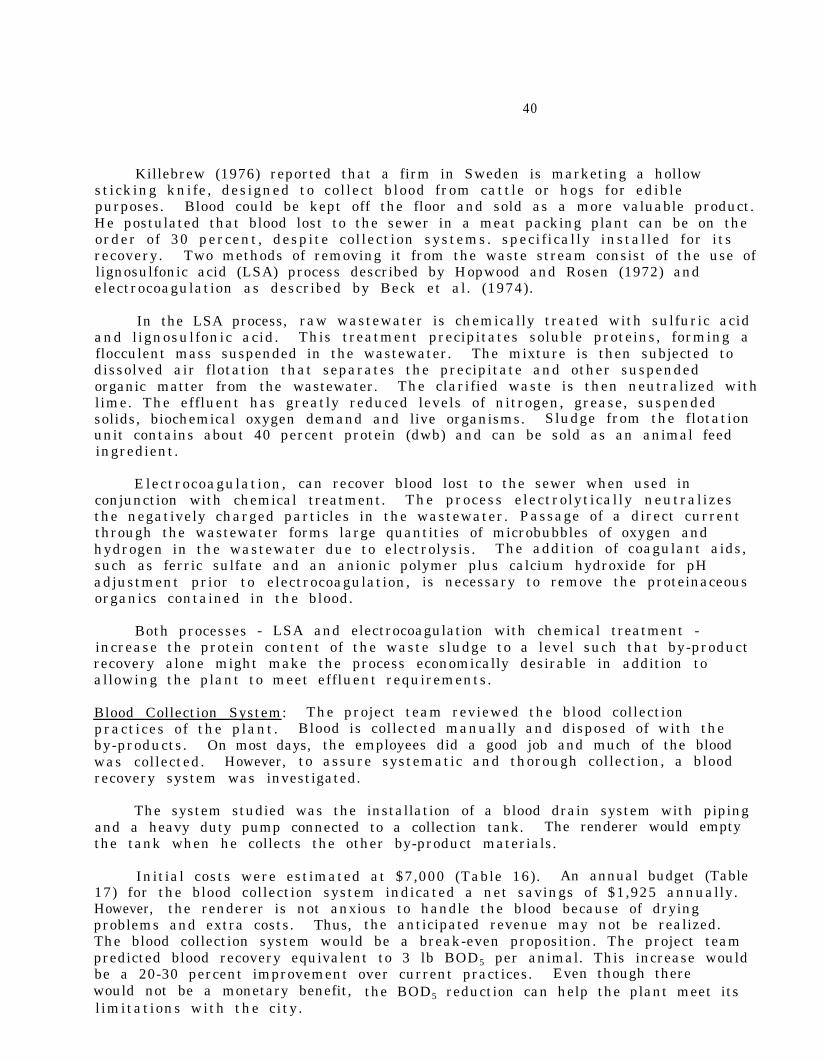
Killebrew (1976) reported that a firm in Sweden is marketing a hollowsticking knife, designed to collect blood from cattle or hogs for ediblepurposes. Blood could be kept off the floor and sold as a more valuable product.He postulated that blood lost to the sewer in a meat packing plant can be on theorder of 30 percent, despite collection systems. specifically installed for itsrecovery. Two methods of removing it from the waste stream consist of the use oflignosulfonic acid (LSA) process described by Hopwood and Rosen (1972) andelectrocoagulation as described by Beck et al. (1974).
In the LSA process, raw wastewater is chemically treated with sulfuric acidand lignosulfonic acid. This treatment precipitates soluble proteins, forming aflocculent mass suspended in the wastewater. The mixture is then subjected todissolved air flotation that separates the precipitate and other suspendedorganic matter from the wastewater. The clarified waste is then neutralized withlime. The effluent has greatly reduced levels of nitrogen, grease, suspendedsolids, biochemical oxygen demand and live organisms. Sludge from the flotationunit contains about 40 percent protein (dwb) and can be sold as an animal feedingredient.
Electrocoagulation, can recover blood lost to the sewer when used inconjunction with chemical treatment. The process electrolytically neutralizesthe negatively charged particles in the wastewater. Passage of a direct currentthrough the wastewater forms large quantities of microbubbles of oxygen andhydrogen in the wastewater due to electrolysis. The addition of coagulant aids,such as ferric sulfate and an anionic polymer plus calcium hydroxide for pHadjustment prior to electrocoagulation, is necessary to remove the proteinaceousorganics contained in the blood.
Both processes - LSA and electrocoagulation with chemical treatment -increase the protein content of the waste sludge to a level such that by-productrecovery alone might make the process economically desirable in addition toallowing the plant to meet effluent requirements.
Blood Collection System: The project team reviewed the blood collectionpractices of the plant. Blood is collected manually and disposed of with theby-products. On most days, the employees did a good job and much of the bloodwas collected. However, to assure systematic and thorough collection, a bloodrecovery system was investigated.
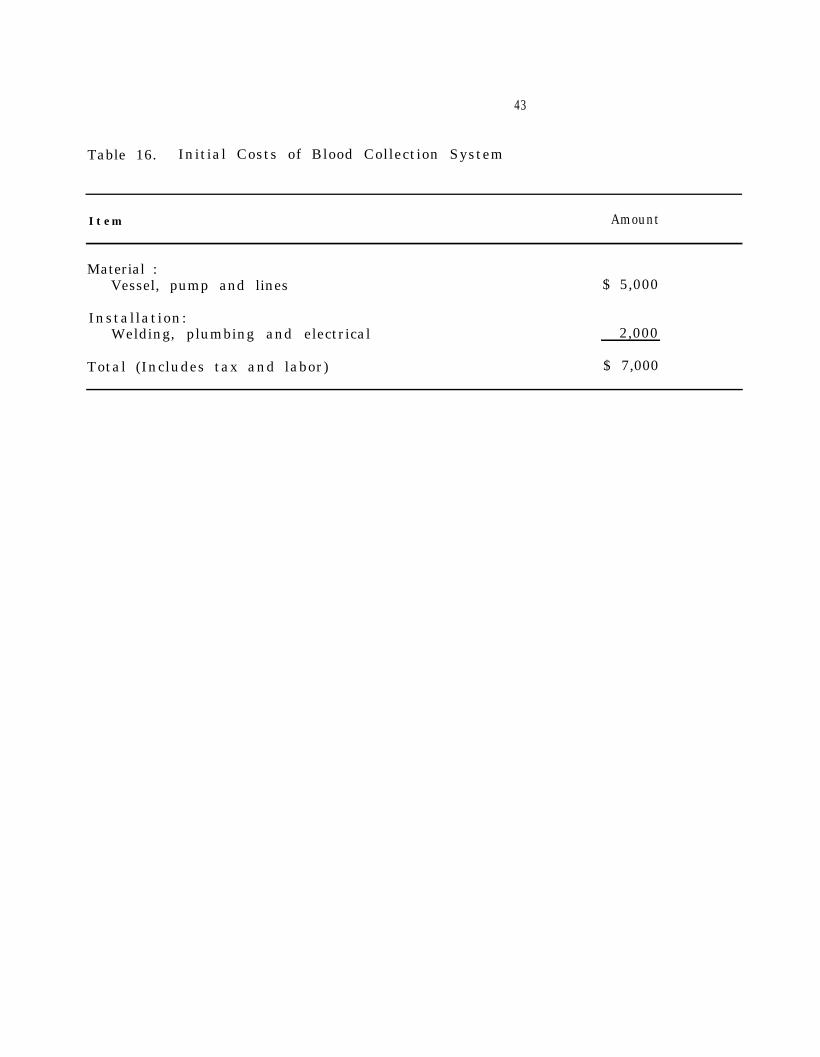
The system studied was the installation of a blood drain system with pipingand a heavy duty pump connected to a collection tank. The renderer would emptythe tank when he collects the other by-product materials.
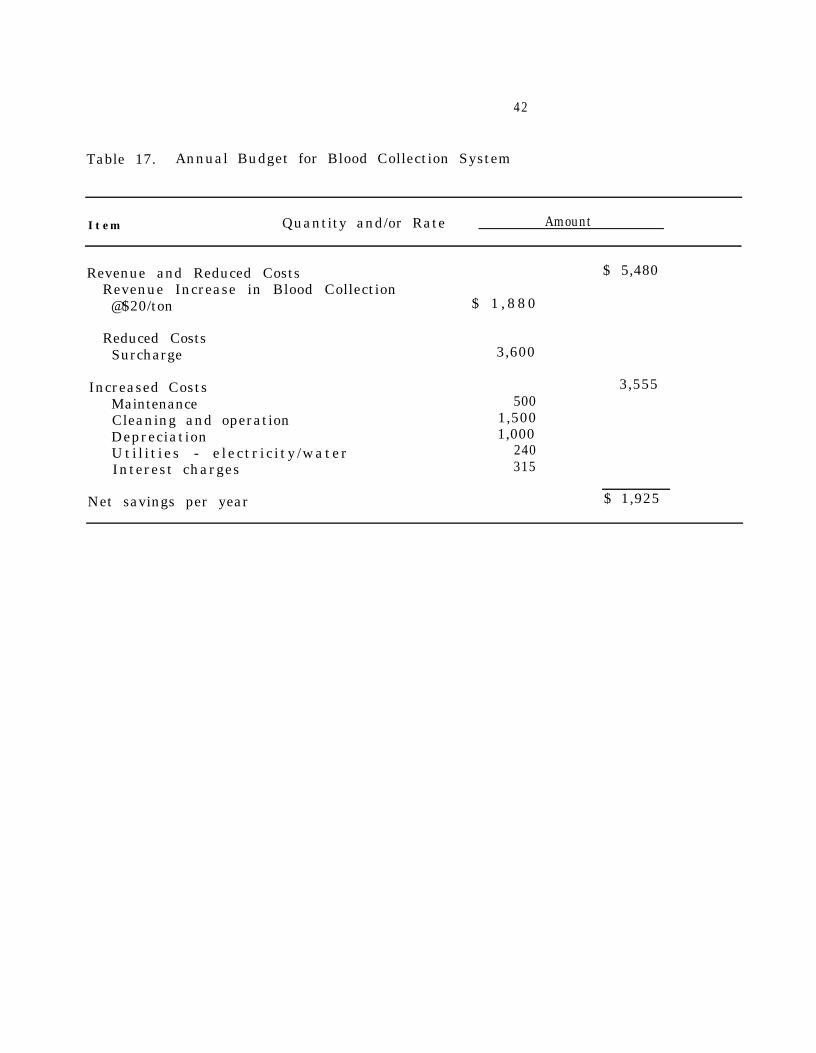
Initial costs were estimated at $7,000 (Table 16). An annual budget (Table17) for the blood collection system indicated a net savings of $1,925 annually.However, the renderer is not anxious to handle the blood because of dryingproblems and extra costs. Thus, the anticipated revenue may not be realized.The blood collection system would be a break-even proposition. The project teampredicted blood recovery equivalent to 3 lb BOD5 per animal. This increase wouldbe a 20-30 percent improvement over current practices. Even though therewould not be a monetary benefit, the BOD5 reduction can help the plant meet itslimitations with the city.
43
Table 16. Initial Costs of Blood Collection System
Item Amount
Material :Vessel, pump and lines $ 5,000
Installation:Welding, plumbing and electrical 2,000
Total (Includes tax and labor) $ 7,000
42
Table 17. Annual Budget for Blood Collection System
Item Quantity and/or Rate Amount
Revenue and Reduced CostsRevenue Increase in Blood Collection
@$20/ton
$ 5,480
$ 1 , 8 8 0
Reduced CostsSurcharge 3,600
3,555Increased CostsMaintenanceCleaning and operationDepreciationUti l i t ies - e lectr ic i ty /waterInterest charges
5001,5001,000
240315
Net savings per year $ 1,925
43
Paunch Handling and Processing
Witherow and Lammers (1976) reviewed paunch handling in beef slaughtering.There are over 35 million head of beef slaughtered annually in the United Stateswhich results in over 1.7 billion pounds of paunch manure to be handled andprocessed per year.
Paunch manure is the partially digested feed contained in the rumen, firststomach. Fresh paunch manure is a yellowish-brown color containing recognizablefiber and grain with an obnoxious odor. The material is acidic with a pH rangingfrom 5.6-7.0. Even with its 85 percent water content, only minor solid-liquidseparation will occur on standing.
The wet weight and dry weight of paunch manure average 54 lb/animal and 8.5lb/animal, respectively. Mean values for paunch manure were Chemical OxygenDemand (COD)-177,300 mg/l and five day Biochemical Oxygen Demand (BOD5)-50.200mg/l. Paunch manure has such an extended oxygen demand that the BOD5 is lessthan 40 percent of the carbonaceous oxygen demand. Paunch manure has a BOD5 of2.5 lb/1000 lb LWK and can constitute 20 percent of the waste load from apackinghouse.
Witherow and Lammers (1976) reviewed the three systems of paunch handling -no-dump, wet-dump, and dry-dump. In the no-dump system the paunch sack is leftunopened and both the sack and the paunch manure are sent to rendering. In thewet-dump system, the paunch sack is sliced open and the contents are waterflushed from the sack into a sewer. In the dry-dump system the paunch sack issliced open and the contents are dumped and transported from the plant in aseparate non-water carriage system. The emptied sack is then rinsed and therinse water goes to the sewer. In the wet-dump or dry-dump systems, the sack issent to rendering or is used to produce tripe.
No-Dump System. When the paunch sack is not dumped, the contents and sack aresent to rendering and become part of the meal by-product. Sending paunch manureto render lowers the protein content of the meal, increases the percent of waterto be vaporized, discolors the greases and increases the odor control cost. Thepotential use of the paunch sack for production of an edible product (tripe) isalso lost . Because of these negative economic factors, the no-dump system hasbeen practiced only on condemned paunches which is a minor percent of the viscerarendered. Current practice at Randolph Packing best could be described as theno-dump system.
Wet-Dump. System. The sluicing of paunch manure with spray washer is undoubtedlythe poorest system from the viewpoint of pollution control. Nevertheless, a 1967survey showed that 84 percent of the industry employed the wet-dumping system.Sending all the material for treatment was practiced by 13 percent of theindustry. Liquid solid separation with off-site disposal of the solids waspracticed by 70 percent. Using a water carriage system will result in 60-85percent of the BOD5 and about 5 percent of the fine solids passing through thetypical screens used for solid-liquid separation. This material loss to thetreatment system will be 2.0 lb BOD5/1000 lb LWK and 0.4 lb TSS/l000 lb LWK.
44
Paunch manure was noted to be untreatable in a conventional sewage treatmentplant for the following reasons: 1) the manure solids settle out and tend toharden to the consistency of low-density rock; 2) the solids clog hopper bottoms,pits and pump suctions; 3) augering may be required to remove the solids frompipelines; 4) the cellulose material does not decompose in digestors and formsstraw blankets which clog and eventually fill digestors; and 5) the entrappedmoisture in the cellulose material cannot be dewatered by vacuum filters.
The use of vibrating, rotating or stationary screens serve a most valuablefunction in separating the solids for transport to ultimate disposal. Withoutscreens the wastewater treatment system must include specially designedliquid-solid separation. sol ids handling and stabi l ization faci l i t ies . Therequired treatment will necessitate not only reduction of the oxygen demand, butalso separation and disposal of the paunch fines and biological solids producedin treatment. The wet-dump system is no longer the most economical one becauseof the increased treatment costs.
Dry-Dump System. The dry-dumped paunch will have a moisture content of 85percent. The elutriated paunch solids in a water carriage system when separatedon screen have an 81-82 percent moisture content. The dry-dump handling systemcan incorporate the same transporting and processing methods used for screenedpaunch solids.
Transporting paunch solids out of the plant has run into problems wherepumps and pipelines are involved. The solids tend to plug the line and pumpintake faci l i t ies . Two satisfactory transporting methods are a screw conveyorand an air-energized system in which the material is intermittently blown througha pipeline. Paunch material has been successfully blown 700 ft. with anelevation increase of 45 ft. If the material is transported away from the plantsite without processing, it is commonly moved in specially designed trailers.The trailer must prevent spillage and is commonly shaped like a tank truck with acovered top to contain odors and a rounded or sloped base to prevent paunchsolids from sticking in the corners.
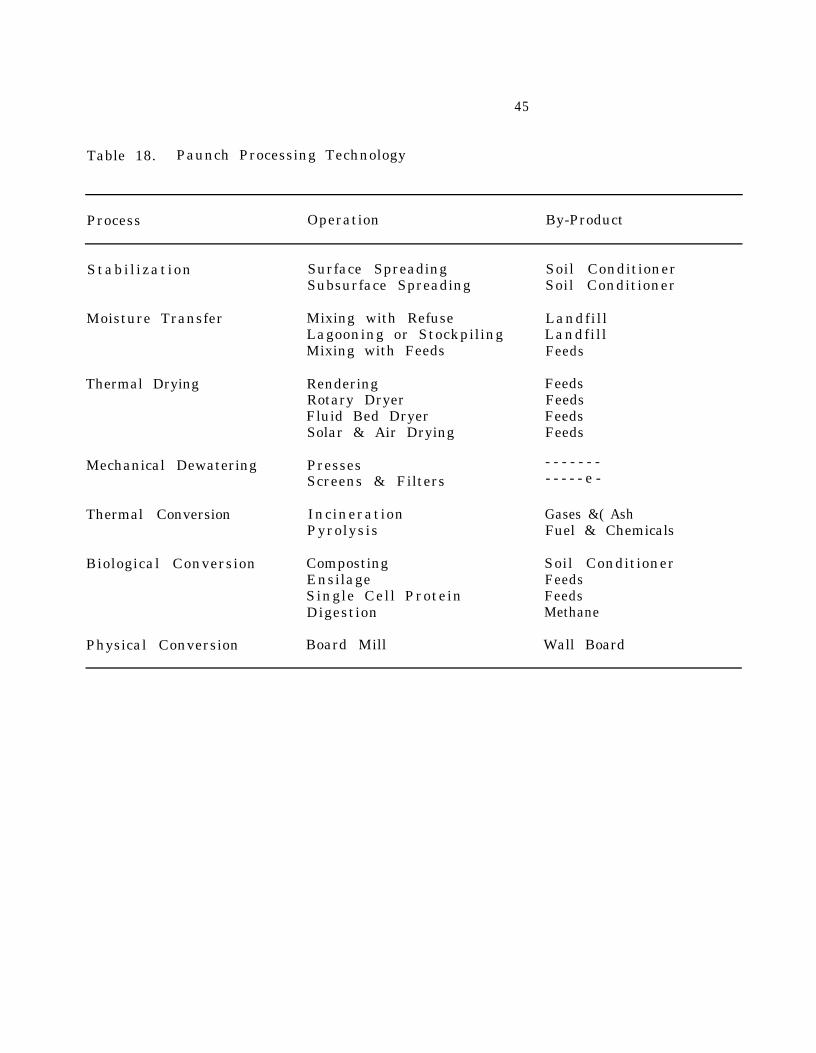
Processing System. Though the future for paunch handling is seen as the dry-dumpsystem with auger or “blow” transport systems, the method of processing anddisposal is far from clear. Technology on a series of processes and operationsfor paunch manure has been developed over the years and the potential isnoteworthy for transferring technology from agricultural investigations on animalmanures. Table 18 is a listing of paunch processing technology with adescription of operations and by-products.
Summary. Paunch manure is a major waste (2.5 lb BOD5/1000 lb LWK) in beefprocessing and is equivalent to 20 percent of the average waste load from apackinghouse. This percentage would be higher based on longer term oxygen demandvalues as the BOD5 of paunch is less than 40 percent of its carbonaceous oxygendemand.
45
Table 18. Paunch Processing Technology
Process Operation By-Product
Stabi l ization Surface Spreading Soil ConditionerSubsurface Spreading Soil Conditioner
Moisture Transfer Mixing with RefuseLagooning or StockpilingMixing with Feeds
Thermal Drying RenderingRotary DryerFluid Bed DryerSolar & Air Drying
Mechanical Dewatering PressesScreens & Filters
Thermal Conversion IncinerationPyrolysis
Biological Conversion CompostingEnsilageSingle Cell ProteinDigestion
Physical Conversion Board Mill
LandfillLandfillFeeds
FeedsFeedsFeedsFeeds
- - - - - - -- - - - - e -
Gases &( AshFuel & Chemicals
Soil ConditionerFeedsFeedsMethane
Wall Board
46
Between 60-85 percent of the BOD in paunch manure is water soluble. Use ofthe wet-dump handling system even with solids-liquid separation adds 2 lbBOD5/1000 lb LWK in the water carriage and significantly increases the wastewatertreatment costs. Because of these increased costs, dry-dump handling is thesystem of economic choice.
The constraints in processing paunch manure are the water pollutionpotential due to the high BOD, the problem of odors and flies, the high moisturecontent, and the low protein content. A number of processes to utilize paunchmanure have been investigated in the laboratory, in pilot plants and atfu l l - s ca le . Of the processes reviewed, the production of soil conditioners bysurface and/or subsurface spreading and the production of feeds by ensilage ordrying appear to be the most feasible.
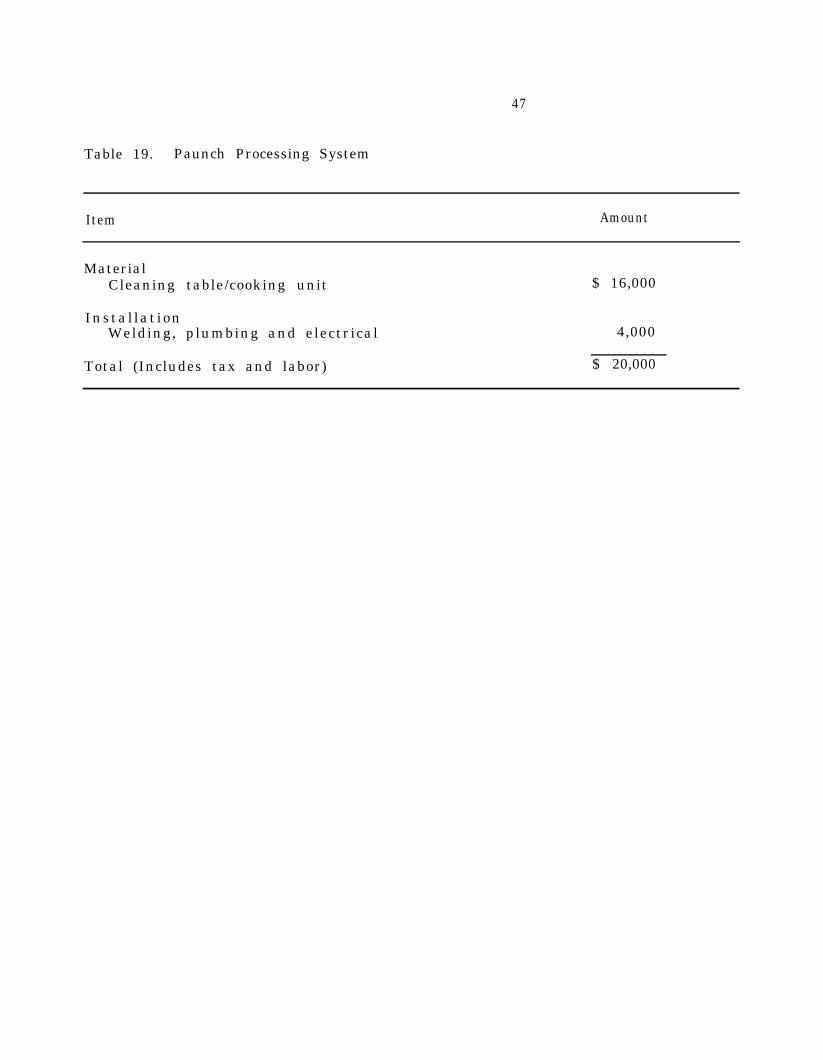
Paunch Processing System. A paunch processing system was explored for RandolphPacking. Parts of the stomach can be saved. cooked for processing as humanfood, packaged and frozen.
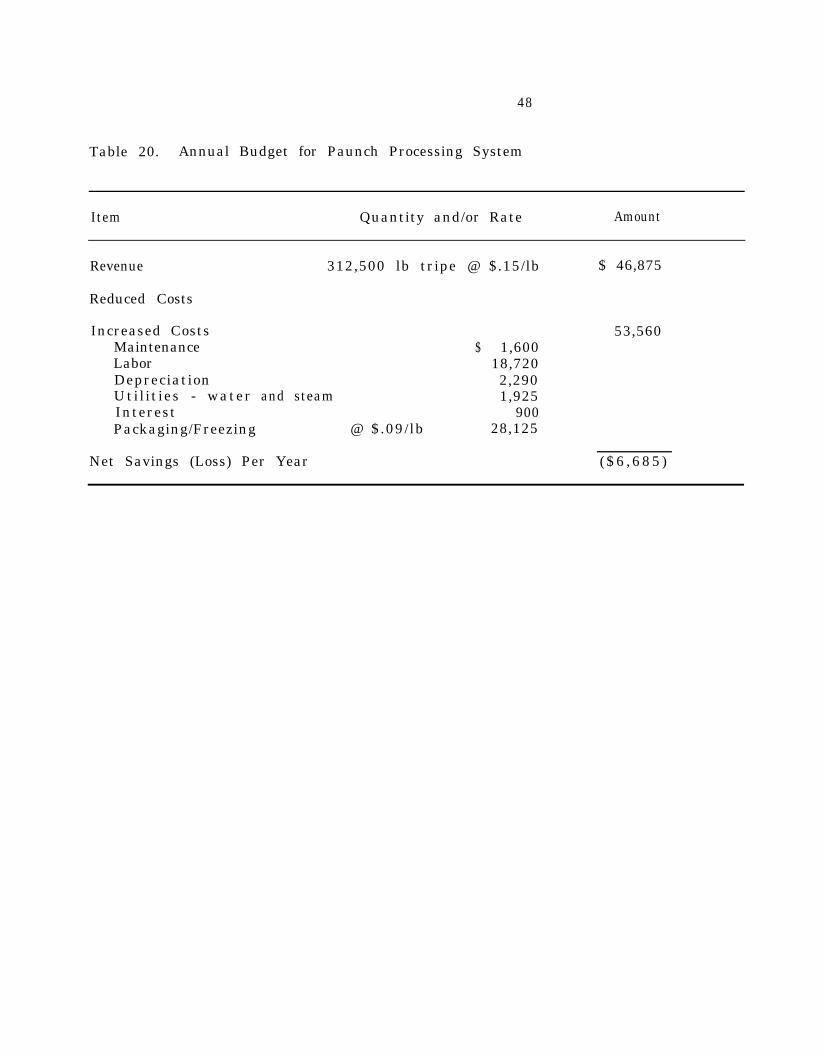
The system would consist of a specialized cleaning table and cooking unit.Costs were estimated at $16,000 plus $4,000 for installation (Table 19). Theproject team estimated the system would require an additional 1.5 people, andchemicals and water for washing to produce about 25 lb of edible product peranimal. The market value of the product is from 0.10-0.25/lb.
A summary of the process is presented in Table 20 with the annual budget.Net losses per year could approach $6,685 annually with a $0.l5/lb value fortripe but a loss of $37,935 would result from a $0.05/lb return for product. Theproject team also believes that this process would result in an increase in wasteload as the extensive cleaning and washing required would release the paunchmaterials to the sewer. An additional 1,250,000 gallons of water per year wouldbe needed for the washing.
In the final analysis, the project team feels that the most economicalapproach to paunch handling is to tie off the bung and send the paunch to arenderer. It is recommended that Randolph Packing pursue the incorporation ofthis practice into their daily operation. The time is estimated at two minutesper animal. Also, the auger carrying the paunches is too small to move thepaunches without losing some contents. A closer look at this operation isnecessary to dispose of paunches with minimal waste load.
Pens. Wells (1976) reviewed the handling of wastes from pens. He noted thatthis is probably one area where wastes are most easily segregated from the otherwaste streams of the plant. Pen design was recognized as an important factor incleaning.
Settling basins have been used successfully for catching wastes from pencleaning. These basins work best with floors sloped at a five percent grade topermit hosed-down pen wastes to settle. Then a front-end loader is used to removethese wastes for disposal to a landfill or agricultural land. These settlingbasins are capable of removing 40 percent of the BOD5.
47
Table 19. Paunch Processing System
Item Amount
MaterialCleaning table/cooking unit $ 16,000
Instal lationWelding, plumbing and electrical 4,000
Total (Includes tax and labor) $ 20,000
48
Table 20. Annual Budget for Paunch Processing System
Item Quantity and/or Rate
Revenue 312,500 lb tripe @ $.15/lb
Amount
$ 46,875
Reduced Costs
Increased Costs 53,560Maintenance $ 1,600Labor 18,720Depreciation 2,290Utilities - water and steam 1,925Interest 900Packaging/Freezing @ $.09/lb 28,125
Net Savings (Loss) Per Year ($6 ,685 )
49
Some pens are cleaned mechanically with the aid of front loaders. Beddingmaterials used are wood chips and/or sawdust. Pens should be dry-cleaned two orthree times daily, with the bedding and waste mixtures hauled to landfill.Randolph Packing had initiated a daily dry cleanup prior to the initiation ofthis project.
Vacuum-type cleaning systems using septic tank pumps with an intake nozzlesimilar to a vacuum cleaner can reduce the BOD5 by 25 percent. Wells (1976)reported that these can be effective without washing except in the warmer monthswhen the pens need to be washed at least twice a week.
Usually runways and pens are hosed down periodically. Consideration shouldbe given to segregation of this strong liquid waste for disposal by trucking orpiping directly onto farmland, within the limits of regulations regarding landdisposal. A settling basin should be investigated to allow recovery of solids.
Scraps and Bone Dust. Plant operations in cutting and trimming should beexamined carefully for opportunities to intercept waste solids before they enterthe sewer. Scraps and liquids from the splitter should be caught in a containerdirectly beneath the washer. Collected contents should be routed directly torendering. Bone dust from sawing operations is a considerable source ofpollution and contains a high concentration of phosphorus. Bone dust is of finetexture and when diluted with water is difficult to recover. Therefore , i tshould be recovered intact by catching directly in containers, or by sweeping upand hauling to the inedible rendering truck.
Hide Curing. Hide-curing operations are becoming increasingly involved assegments of tanning operations are transferred from tanneries tobeef-slaughtering plants. During winter months, a single hide can contain 60lb of attached lumps of manure, mud, and ice. In addition, salt and waste enterthe sewage stream. This water should be recycled or retained. Salt use must becontrolled. The project team recommends management control over water use andsalt use in the hide curing operation.
Summary of Process Changes
A summary of process changes is presented in Table 21. Many of the changescould not be costed out nor could their impact be estimated by the project team.The recommendations are not as extensive as they would be for many meat plantsbecause Randolph Packing Company was already recovering an estimated 77 percentof their potential pollution load through efficient processing and byproductrecovery practices. The project team believes that Randolph Packing may be ableto increase this recovery without pretreatment to 95 percent.
The tabulation of the process changes (Table 21) presented the project teamwith several challenges. First , if all the waste load reductions predicted wereachieved simultaneously, the plant would have a negative waste load. Theindividual waste load reductions are merely estimates. As these estimates cannotbe added without resulting in a negative waste load, further calculations,extensive sampling and testing involving a costly project would be needed.
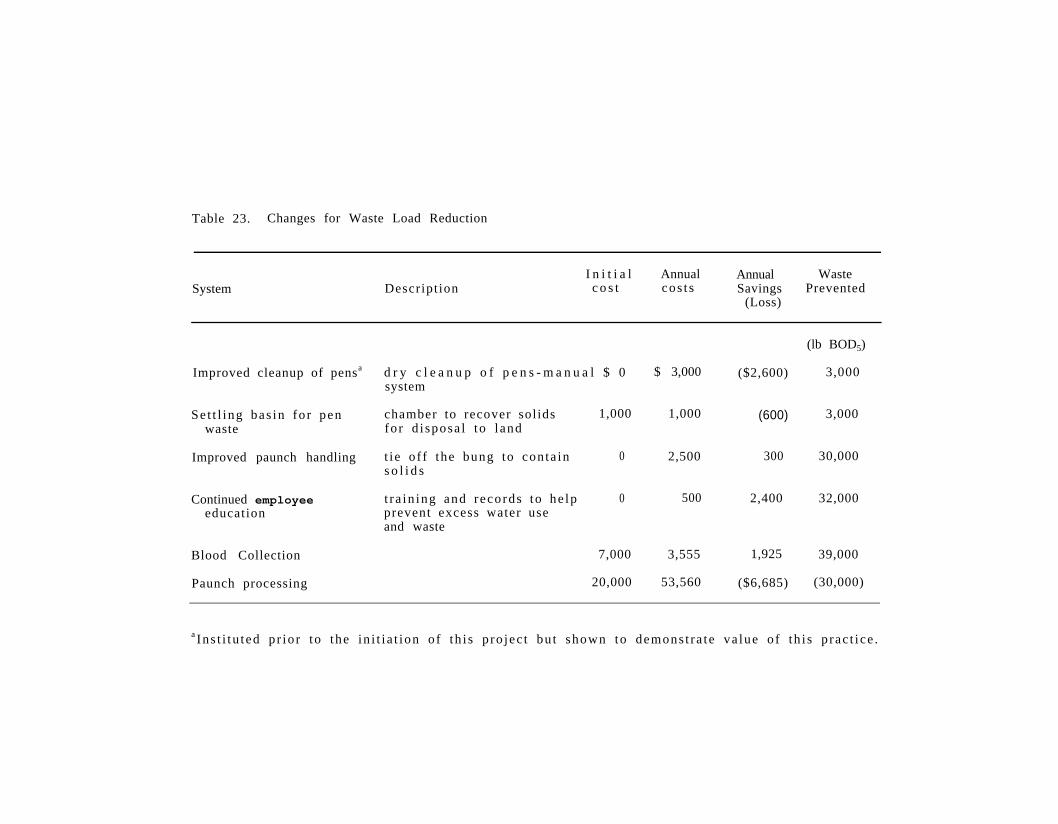
Table 23. Changes for Waste Load Reduction
I n i t i a l Annual Annual WasteSystem Descript ion c o s t cos t s Savings Prevented
(Loss)
Improved cleanup of pensa
Set t l ing bas in fo r pen chamber to recover solidswaste for d i sposa l to l and
Improved paunch handling t ie of f the bung to conta ins o l i d s
Continued employeeeducation
Blood Collection 7,000 3,555 1,925
Paunch processing 20,000 53,560 ($6,685)
d r y c l e a n u p o f p e n s - m a n u a l $ 0 $ 3,000 ($2,600)system
1,000 1,000 (600) 3,000
0 2,500 300 30,000
t ra in ing and records to he lpprevent excess water useand waste
0 500 2,400 32,000
(lb BOD5)
3,000
39,000
(30,000)
a Ins t i tu ted p r io r to the in i t i a t ion o f th i s p ro jec t bu t shown to demons t ra te va lue o f th i s p rac t i ce .
51
Seeming inaccuracies in waste load reduction can be further attributed tothe fact that aggressive employee action to reduce waste load has accomplishedmany of the predicted results. Effective blood collection is an example of this.
Management faces a real challenge in the constant motivation and supportnecessary to maintain peak performance. For instance, maybe 20,000 lb of BOD,reduction attributed to employee education was achieved through better and morethorough blood collection practices. This is approximately 50 percent of thetotal BODmanagemen
load that could be recovered by a blood collection system. Nowmust decide, “Is this 50 percent reduction adequate? And can we
maintain this performance?”
Several thousands of dollars annually could be saved in excess charges withthe successful continuation of these reductions. Further, violations oflimitations established by the city would be minimized.
Pretreatment
Every food processor is faced with choices in disposal of wastewater.First, a decision must be made whether to treat the waste load in-house ordispose of water to a POTW. For plants located in municipalities, most arerequired to discharge to the POTW although many larger food processing plantshave been allowed to treat their own waste by installing appropriate treatmentequipment. Municipalities condition discharge with sewer use and pretreatmentordinances.
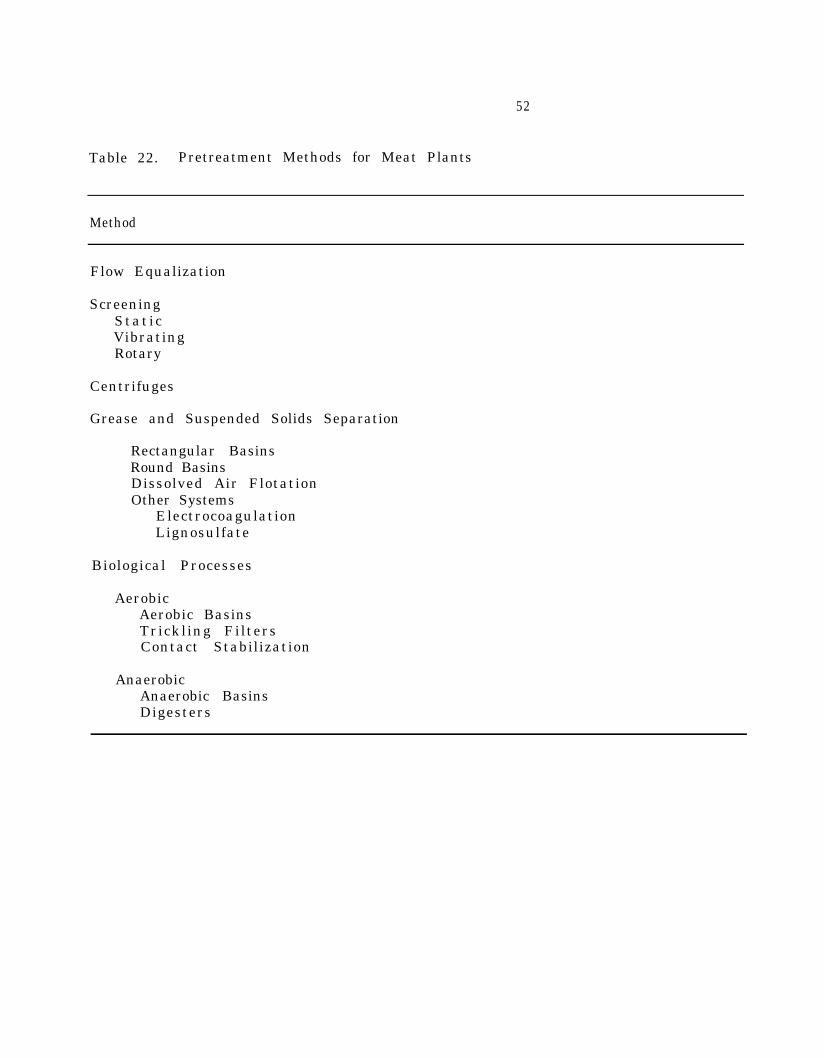
When not prohibited, food processors discharging to POTW’s must decide onwhether or not to pretreat. Economics strongly affect the decision and shouldgovern the level of pretreatment. Systems for pretreatment in meat processingplants were thoroughly reviewed by EPA in a Technology Transfer Publication in1973 and are listed in Table 22.
Advantages and Disadvantages of Pretreatment
Compliance with municipal regulations regarding the quality of wastewaterfor discharge to the city’s sewer will usually determine the degree ofpretreatment. However, there are some factors that may encourage pretreatmentbeyond the levels required by ordinance. Advantages of pretreatment usuallyinclude lower surcharge costs and improved relations with the POTW. They alsoinclude the following:
- A higher quality of pretreatment may be justified economically if the city’scharges and surcharges are at an unusually high level.
- The meat packer may prefer to assume treatment responsibilities to avoidcomplaints from the municipality.
- There may be indications that the future wilrate structure.
bring increases in the c ity ’s
52
Table 22. Pretreatment Methods for Meat Plants
Method
Flow Equalization
ScreeningStaticVibratingRotary
Centrifuges
Grease and Suspended Solids Separation
Rectangular BasinsRound BasinsDissolved Air FlotationOther Systems
ElectrocoagulationLignosulfate
Biological Processes
AerobicAerobic BasinsTrickling FiltersContact Stabilization
AnaerobicAnaerobic BasinsDigesters
53
- Grease and solids may have a good market in the area. Close proximity of asoap plant or similar grease market may produce economic advantages for greaserecovery, or permit some expense in improving quality of the finished inediblegrease or tallow. Such improvements will also improve the wastewater effluent.
Disadvantages of pretreatment are more prevalent for smaller processorsbecause pretreatment systems are often costly to purchase and operate:
- The pretreatment will be placed on the property tax rolls, unless stateregulations permit tax-free waste treatment for industry.
- The maintenance, operation, and record keeping may be too expensive.
- The burden of good operation increases as the treatment becomes more complexand extensive.
- A system will require 25-50 percent of one employee’s time per year foroperation. Sampling and analysis can cost thousands of dollars.
- Pretreatment leaves a residue or sludge that must be stored, deposited andproperly handled. Legal disposal alternatives are limited and trucking isexpensive.
Pretreatment Systems
The project team reviewed the use of two pretreatment systems-a simplesettling basin and a dissolved air flotation (DAF) system.
Settling Basin. In an EPA (1974a) publication on poultry processing, a smallsettling basin was utilized to recover solids from poultry processing wastewater.A similar system was deemed useful to a small meat packer. Septic tank-likestructures have been used for similar settling basins.
A 1500 gallon septic tank with internal baffles would yield up to 30.minutes ’ retention time. The poultry plant reduced BOD5 by more than 16 percentwith only a seven-minute retention time. Longer retention times would increasethe recovery; and more than 30 percent BOD5 removal in poultry processingwastewaters has occurred with more than 15-minute retention times.
Dissolved Air Flotation. The use of dissolved air flotation (DAF) units is oneof the more common pretreatment methods for meat processors. Lively (1976) noteda DAF manufacturer’s guarantee of 80 percent removal of TSS when chemicals wereadded. An EPA study (1974a) of poultry processing effluent found a 45 percentTSS, 28 percent BOD and 56 percent FOG removal without the addition of chemicals.The addition of alum and polymers, although often practiced, makes the recoveredsolids illegal for use in food for animals intended for human consumption such ascatt le , chickens, etc. Approved florculants such as chitosan and lignosulfatecan be used for animal feed recovery.

54
Table 23. Initial Costs of the Air Flotation System
Item Amount
MaterialChamber and Pumps $ 40,000
Installation - including site preparation, welding,plumbing and electrical
20,000
Total (Includes tax and labor) $ 60,000
55
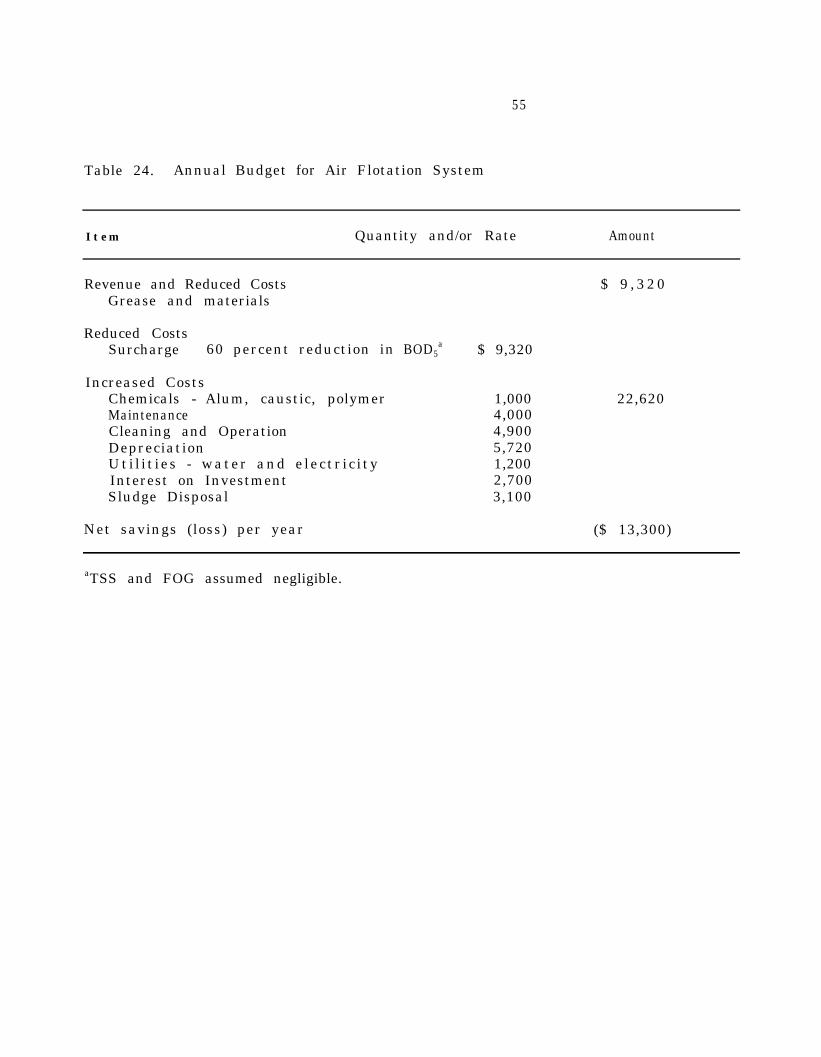
Table 24. Annual Budget for Air Flotation System
Item Quantity and/or Rate Amount
Revenue and Reduced CostsGrease and materials
Reduced CostsSurcharge 60 percent reduction in
Increased CostsChemicals - Alum, caustic, polymerMaintenanceCleaning and OperationDepreciationUti l i t ies - water and electr ic i tyInterest on InvestmentSludge Disposal
Net savings (loss) per year
BOD5a
$ 9 , 3 2 0
$ 9,320
1,0004,0004,9005,7201,2002,7003,100
22,620
($ 13,300)
aTSS and FOG assumed negligible.
56
A DAF unit consists of a chamber into which air is bubbled or into whichwastewater pressurized with air is released. Grease and other solids rise to thesurface and are skimmed by a scraper blade assembly. Chemical addition (alum,polymers) and pH adjustment may increase the efficiency of removal.
The initial costs for a DAF system for Randolph Packing were estimated at$60,000 (Table 23) by one manufacturer. Exact costs were difficult to obtainunless a site was selected and accurate pumping and piping were estimated.
Utilizing the initial costs estimate (Table 23) and assuming a 60 percentreduction in BOD5, an annual budget was developed (Table 24). Reduced costswould include the surcharge reduction of $9,320 annually. Increased costsinclude chemicals, maintenance, cleaning and operation, depreciation, utilities,interest or investment and sludge disposal. Randolph Packing would lose over$13,000 annually by putting in DAF. Also, if other lower cost practicespreviously discussed in this report were adopted, the surcharge reduction wouldnot be as great, further increasing the loss.
Sludge disposal was estimated at only $3,100 per year and this may be toolow considering the nature of the recovered materials. Without the use ofchemicals, the renderer may take the sludge. The reduction in cost of chemicalsand sludge disposal would be offset by the decreased efficiency in BOD5, TSS andFOG removal.
Summary. The research team could not recommend a DAF unit until therecommended process changes have been thoroughly evaluated and operatingparameters established. The annual budget suggests that it is not economicallypractical for Randolph Packing Company to consider costly pretreatment optionssuch as DAF.
57
CONCLUSIONS AND RECOMMENDATIONS
Management's encouragement is an important factor in making any lossprevention/waste control program successful. For the program to function, itmust have top management backing and be thoroughly understood at all employeelevels . Randolph Packing has demonstrated its dedication to pollutionprevention through initiation of recommended programs and training. They areeager to consider the new approaches suggested in this study.
To decrease waste load in the plant, systems were designed to recover solidsand blood for rendering. Implementation of all changes suggested would eliminate60,000 lb BOD5/yr and save about l,000,000 gallons of water. Suggestions include:
1. A collection tank for pen waste2. A procedure for improved paunch handling3. An education program for employees4. A blood collection system5. Pretreatment alternatives should be explored and consideration given to
a settling basin6. Water reduction program should be planned
An initial capital investment for the above changes is estimated at lessthan $10,000. Annual increased costs are estimated at approximately $10,500. Netsavings for the changes are expected to be $1,500 per year. Even though $1,500is not a large return, it proves that pollution prevention does pay.
Aggressive employee action can achieve most or all of the reductionspossible for many of the waste centers. Past experience indicates thatmechanical and automatic controls are also necessary to effectively reduce wasteloads.
If the recommendations formulated in this report are fully implemented, theresearch team predicts an achievable water use reduction of 25 percent and wasteload reduction totaling 80 percent. Approximately l,000,000 gallons of waterwould be saved per year as well as 60,000 pounds of biochemical oxygen demand(BOD5) prevented. Expected final effluent from the plant should comply with thecurrent interim limits established by the City of Asheboro.
Predicted waste loads and wastewater parameters would be as follows:
Parameter Waste Load Concentration(lbs/day) (mg/l)
BOD5 56 610COD 80 870TSS 33.6 366TkN 3.4 37FOG 15 160Chlorides 100 1100
58
The research team views these as optimistic goals. They are perhaps achievable,with the exception of TkN and FOG, but may not be economically feasible untiluser charges reach much higher levels than the current ones. Note that almost noreduction is shown for chlorides as current processing technology suggests nofeasible alternative to salt (NaCl) curing and its attendant losses.
The numbers and dollar amounts used to detail product loss, productrecovery, byproduct recovery, waste load and pollution prevented are merelyestimates. This project’s time and resources did not allow for the in-depthanalysis needed to measure and document these statistics.
Recommendations from the project team for Randolph Packing include:
1. Training in proper water use and waste handling needs to be expanded andcontinued.
2. An improved blood handling system is needed to comply with the cityordinance and to reduce waste load.
3. An improved paunch handling system needs to be instituted to complywith the city ordinance and to reduce waste load.
4. A continuing record needs to be established detailing water use andwastewater characteristics.
5. These initial efforts need to be expanded to verify the assumptions andestimates generated by the research team.
6. Contact should be made with the city to suggest waste load limitationsbe established rather than the current concentration limits.
The benefits of this project may extend to all the North Carolina meatindustry. There are approximately 400 meat plants in North Carolina processing338,000 head of cattle and 3,622,000 head of swine with a combined processedvalue exceeding $500,000,000 per year.
Randolph Packing Company is presently recovering 77 percent of itspotential pollution load and ‘is expecting a 10 percent additional recovery - alaudable accomplishment for any beef processing plant. Thus, the project teamstrongly emphasizes continuous employee training and motivation by management toperpetuate the concept that “pollution prevention pays”...both now and in thefuture.
59
REFERENCES
Beck, E.C.; Giannini, A.P.; and Ramirez, E.R. "Electrocoagulation ClarifiesWastewater," Food Technology, (February 1974).
Carawan, Roy E.; Chambers, James V.; Wilkowske, Roger H.; and Zall, Robert RMeat Processing Water and Wastewater Management, N.C. Agricultural ExtensService Special Report no. AM-18c (1979).
Chittenden, Jimmie A. "Aspects of Pollution from the Brine Curing OperationWorkshop on In-Plant Waste Reduction in the Meat Industry. EPA (1976).
Food
ion
Hopwood, A.P. and Rosen,.G.D.. "Protein and Fat Recovery from Effluent." ProcessBiochemistry Vol. 7, no. 3. (1972).
Lively, Lawrence D. "Water Conservation and Waste Control in a Meat PackingPlant." Workshop on In-Plant Waste Reduction in the Meat Industry. EPA(1976).
Texas Agricultural Extension Service. The Texas A&M University System. WaterPollution Control in Slaughterhouses and Meat Processing Plants, by John M.Sweeten. Pubn. No. MP-1372.
U.S. Environmental Protection Agency. In-Process Modifications and Pretreatment- Upgrading Meat Packing Facilities to Reduce Pollution. Technology TransferProgram (1973a).
U.S. Environmental Protection Agency. Water and Waste Management in PoultryProcessing, by Roy E. Carawan, William M. Crosswhite, John A. Macon and ByronK. Hawkins. Environmental Protection Technology Series Pubn. no.EPA-660/2-74-031 (1974a).
U.S. Environmental Protection Agency. Workshop on In-Plant Waste Reduction inthe Meat Industry, compiled by Jack L. Witherow and James F. Scraef.Environmental Protection Technology Series Pubn. no. EPA-600/2-76-214 (1976).
U.S. Environmental Protection Agency. Development Document for ProposedEffluent Limitations Guidelines and New Source Performance Standards for theProcessor Segment of the Meat Products Point Source Category Pubn. no.EPA-440/l-74/031 (1974b).
U.S. Environmental Protection Agency. Economic Analysis of Proposed EffluentGuidelines Meat Packing Industry, by Raymond E. Seltzer and James K. AllwoodPubn. no. EPA-230/l-73-017 (1973b).
U.S. Environmental Protection Agency. Waste Treatment: Upgrading Meat PackingFacilities to Reduce Pollution, Technology Transfer Seminar Pubn. no.EPA-625/3-74-003 (1973c).
Wells, W. James, Jr. "Pens." Workshop on In-Plant Waste Reduction in the MeatIndustry. EPA (1976).
Witherow, Jack L. and Lammers, Stanley. "Paunch and Viscera Handling." Workshopon In-Plant Waste Reduction in the Meat Industry. EPA (1976).
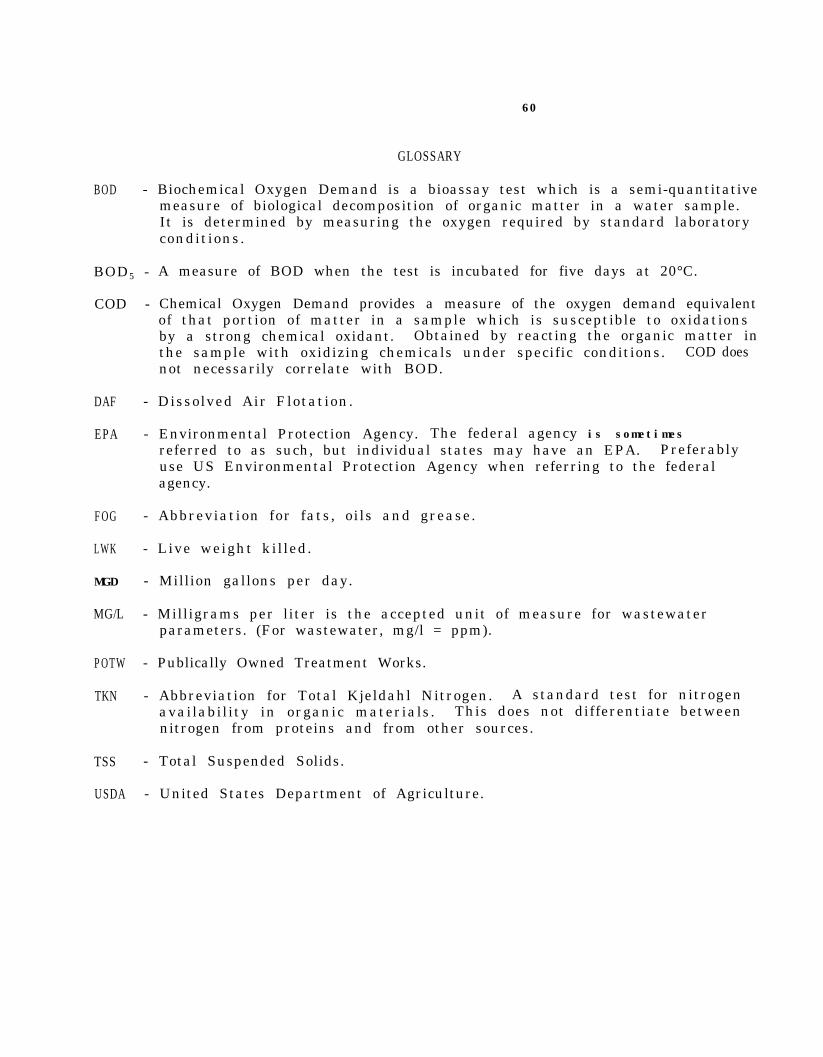
60
GLOSSARY
BOD - Biochemical Oxygen Demand is a bioassay test which is a semi-quantitativemeasure of biological decomposition of organic matter in a water sample.It is determined by measuring the oxygen required by standard laboratoryconditions.
BOD5 - A measure of BOD when the test is incubated for five days at 20°C.
COD - Chemical Oxygen Demand provides a measure of the oxygen demand equivalentof that portion of matter in a sample which is susceptible to oxidationsby a strong chemical oxidant. Obtained by reacting the organic matter inthe sample with oxidizing chemicals under specific conditions. COD doesnot necessarily correlate with BOD.
DAF - Dissolved Air Flotation.
EPA - Environmental Protection Agency. The federal agency is sometimesreferred to as such, but individual states may have an EPA. Preferablyuse US Environmental Protection Agency when referring to the federalagency.
FOG - Abbreviation for fats, oils and grease.
LWK - Live weight killed.
MGD - Million gallons per day.
MG/L - Milligrams per liter is the accepted unit of measure for wastewaterparameters. (For wastewater, mg/l = ppm).
POTW - Publically Owned Treatment Works.
TKN - Abbreviation for Total Kjeldahl Nitrogen. A standard test for nitrogenavailability in organic materials. This does not differentiate betweennitrogen from proteins and from other sources.
TSS - Total Suspended Solids.
USDA - United States Department of Agriculture.

61
APPENDIXES
62
LIST OF APPENDIXES
Appendix Page_
I. Water, Sewer and User Charges for City of Asheboro, NC . . . . . . 62
II . Notes on Costs and Budgets . . . . . . : . . . . . . . . . . . . . 63

63
Appendix I. Water, Sewer and User Charges for City of Asheboro, NC - 1986
Water Rates
For users using more than400 cu. ft. per month
Sewer Rates
For users using more than400 cu. ft. per month
0.85
User Charges
Charges for monitoring (sampl ing and analysis):
Rate($ / l 00 cu . f t . )
0.85
Rate($ / l 00 cu . f t . )
BODCODpH and TemperatureTotal Suspended SolidsChlorideKjeldahl NitrogenOil and Grease
Sampling
Excessive Pollutant Concentrations:
Parameter
Excess BOD5
or '(whichever is higher)Excess COD
Excess TkN 0.07442
Excess TSS 0.0998
Cost/Analysis($)
8.007.004.003.004.007.007.00
Cost/Day($)
35.00
Charge($)
0.0915
0.0366
Source: Sewer Use and Pretreatment Ordinance for City of Asheboro, XC. EffectiveJanuary 1, 1986.

64
Appendix II. Notes on Costs and Budgets
1. Maintenance - 10% of material cost
2. Interest - 9%
3. Installation labor - $20/hr
4. Plant labor - $6/hr
5. Electricity - $0.06/kwh
6. Trucking - $0.60/mile
7. Depreciation - Hoses, Nozzles, Tanks, Equipment, etc.Expense 7 yrs. (14.3%); Buildings 20 yrs. (5%)
8. Surcharge - $0.0915/lb BOD, $ 0,07442/1b TkN and $ 0.0998/1b TSS
![[XLS]Load Reduction Estimating Workbook - Ohio …water.ohiodnr.gov/portals/soilwater/data/xls/Load... · Web viewOil/Grit Separator storm sewers. Feedlots Feedlot Pollution Reduction](https://img.pdfslide.net/doc/110x75/5b5e17937f8b9a310a8bbb8c/xlsload-reduction-estimating-workbook-ohio-water-web-viewoilgrit-separator.jpg)