Embed Size (px)
Citation preview
October 1999
Industry Structure and Competitiveness
REFINED CANE SUGAR INDUSTRY
Introduction
Refined sugar is sugar in granular/crystalline form, primarily composed of sucrose, and
obtained mainly from sugar cane and sugar beets.
There are three (3) major grades of refined cane sugar: (1) standard refined, which is
used primarily as table sugar; (2) premium sugar, which is used by food manufacturers;
and (3) bottlers grade sugar, which is used by the beverage industry.
The manufacturing process for refined cane sugar may be broken down into the
following phases:
➲ Raw sugar process
➲ Affination (washing-off of molasses film from crystals)
➲ Melting
➲ Clarification (removal of insoluble/suspended impurities, gums, pectins,
colloids)
➲ Vacuum filtration (removal of remaining fine particles)
➲ Decolorization (removal of colorants)
2
➲ Boiling/Crystallization
➲ Drying
Refined cane sugar serves as a major input to processed food manufacturing,
particularly in the production of sugar confectioneries, sugar preparations, pastry,
cakes, biscuits and other baker’s wares, preserved fruits and nuts, and beverages.
The objective of the study is to analyze the state of competition within the refined cane
sugar industry and how competition can help develop the refined cane sugar industry
into a viable industry as a potential major input to processed food manufacturing. An
analytical framework specially developed for this purpose will be utilized and
recommendations made, if necessary, on how to make the sector competitive or
improve its competitiveness. It is hypothesized that to improve the input sectors of the
Philippine export industry (such as refined cane sugar) will translate into
competitiveness or better competitiveness of Philippine exports.
Competition and Competitiveness Analysis
I Defining the Relevant Market A relevant market is defined as, “… a product or group of products and a geographical
area in which it is produced or sold such that a hypothetical profit-maximizing firm, not
subject to price regulation, that was the only present and future producer or seller of
those products in that area likely would impose at least a ‘small but significant and
nontransitory’ increase in price, assuming the terms of sale of all other products are
3
held constant. A relevant market is a group of products and a geographic area that is
no bigger than necessary to satisfy this test1”.
Simply put, a relevant market is defined by the product or service involved, the
geographical area in which said product or service is sold, and the sellers and buyers of
such product or service.
! Product Market
The relevant product market is defined as domestic refined cane
sugar.
In defining the relevant product market, the approach followed is: assuming a
hypothetical monopolist for a product, would said monopolist profit by imposing at
least a small but significant and non-transitory increase in price?
Restrictions currently exist on the importation of refined sugar. Given these
restrictions, food processors and beverage makers do not have the option to
switch to imported refined sugar assuming the existence of a hypothetical sugar
monopolist who imposes a price increase. The relevant product market is then
clearly defined – domestic refined cane sugar.
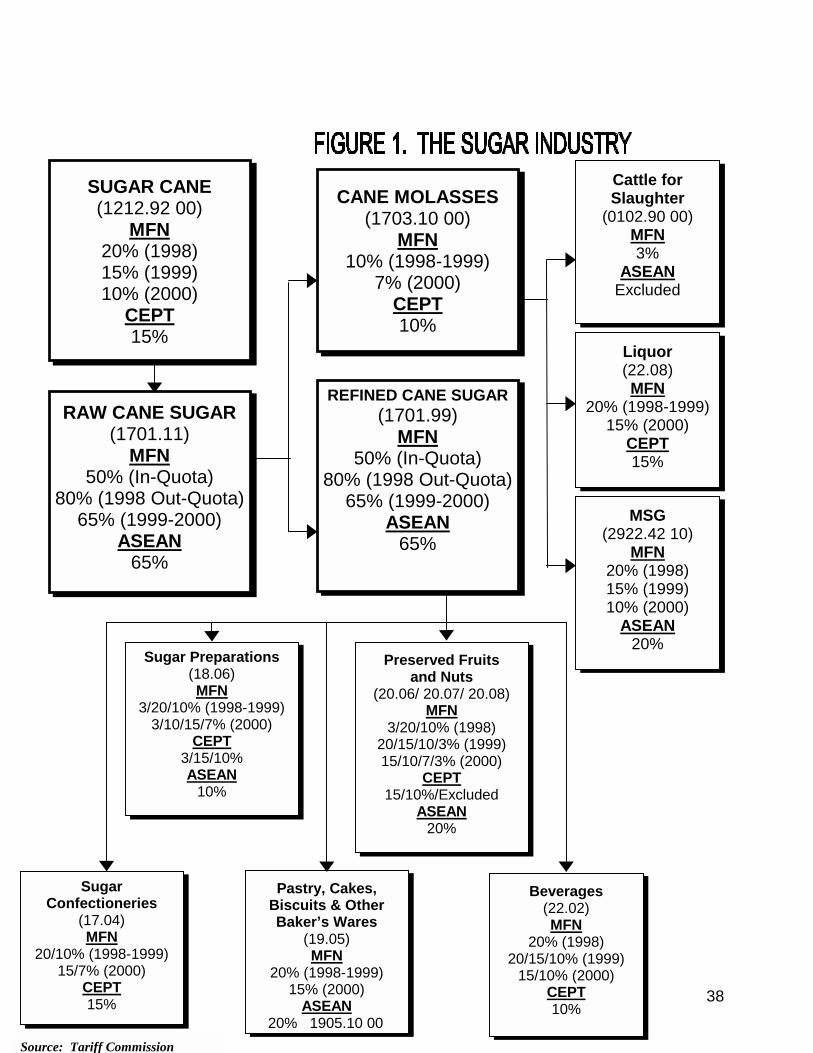
Figure 1 depicts the flow of commodities from the sugar industry to user
industries. Sugar cane goes into the production of raw cane sugar which, in
turn, is transformed into either cane molasses or refined cane sugar. As
previously mentioned, refined cane sugar is an input to the production of sugar
confectioneries, sugar preparations, pastry, cakes, biscuits and other baker’s
wares, preserved fruits and nuts, and beverages.
1 As defined by Section 1 of the U.S. Department of Justice and Federal Trade Commission Horizontal
Merger Guidelines dated 2 April 1992.
4
! Geographical Market
The geographical market for domestic refined cane sugar is defined
as the Philippine national territory.
The relevant geographical market is defined similarly as the product market. It is
the region where a hypothetical monopolist, being the only present or future
producer of the product, could make a profit from imposing at least a small but
significant and non-transitory price increase holding the terms of sale constant at
all other locations. The difficulty in determining the geographical market is made
more complicated with the increasing globalization of markets and the use of
electronic trade (e.g. through the Internet).
Considering, however, that local food processors and beverage makers are
effectively restricted to purchasing their sugar requirements from domestic
producers, the relevant geographical market for domestic refined cane sugar is
defined as the Philippine national territory, for purposes of this study.
! Participants in the Market
The relevant participants in the market are the sixteen (16) cane sugar
mills and refineries with the highest revenues.
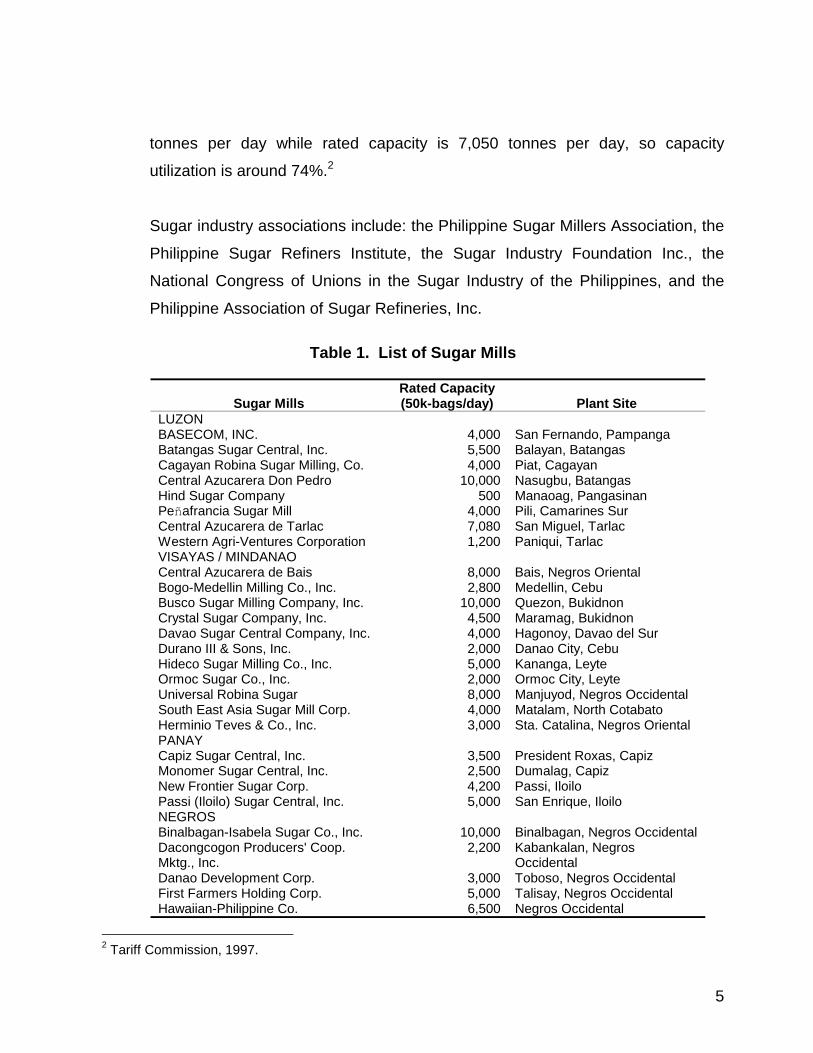
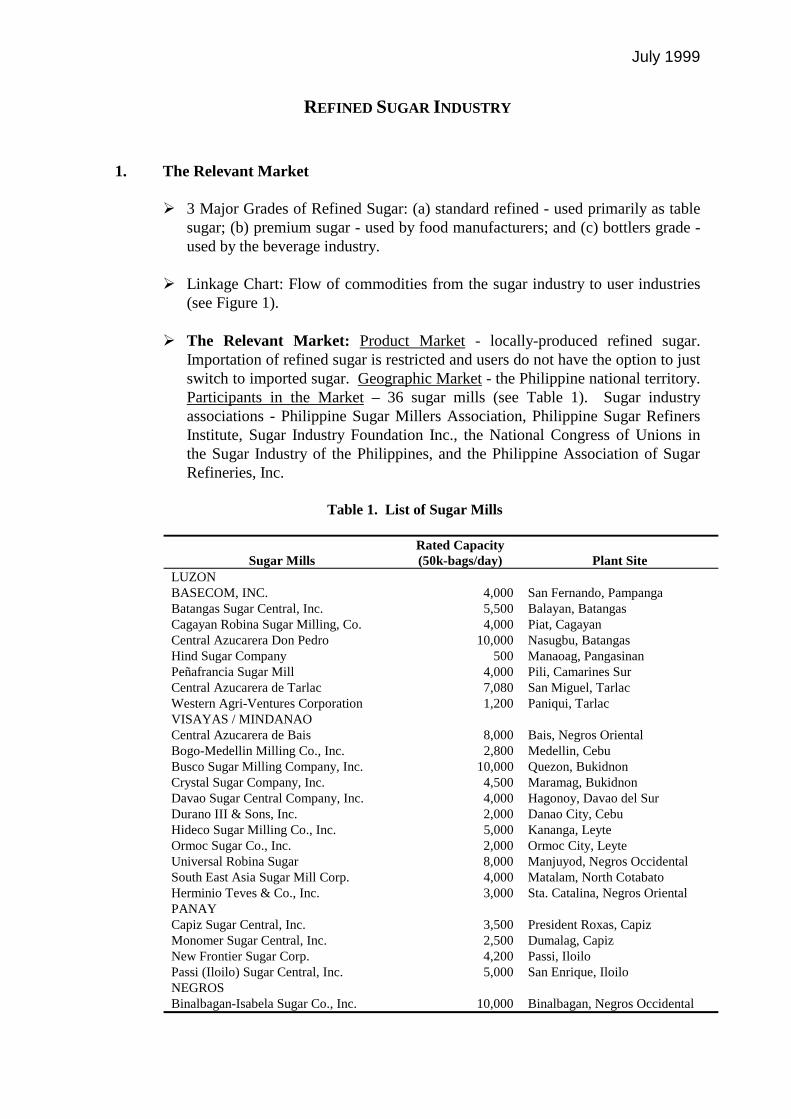
As of crop year 1998 - 1999, the total number of Philippine sugar mills was thirty
six (36) (see Table 1).
The sugar milling industry has a rated plant capacity of 185,000 tonnes of cane
per day or a daily utilization rate of 53%. The refiners’ actual capacity is 5,200
5
tonnes per day while rated capacity is 7,050 tonnes per day, so capacity
utilization is around 74%.2
Sugar industry associations include: the Philippine Sugar Millers Association, the
Philippine Sugar Refiners Institute, the Sugar Industry Foundation Inc., the
National Congress of Unions in the Sugar Industry of the Philippines, and the
Philippine Association of Sugar Refineries, Inc.
Table 1. List of Sugar Mills
Sugar Mills
Rated Capacity (50k-bags/day)
Plant Site
LUZON BASECOM, INC. 4,000 San Fernando, Pampanga Batangas Sugar Central, Inc. 5,500 Balayan, Batangas Cagayan Robina Sugar Milling, Co. 4,000 Piat, Cagayan Central Azucarera Don Pedro 10,000 Nasugbu, Batangas Hind Sugar Company 500 Manaoag, Pangasinan Peñafrancia Sugar Mill 4,000 Pili, Camarines Sur Central Azucarera de Tarlac 7,080 San Miguel, Tarlac Western Agri-Ventures Corporation 1,200 Paniqui, Tarlac VISAYAS / MINDANAO Central Azucarera de Bais 8,000 Bais, Negros Oriental Bogo-Medellin Milling Co., Inc. 2,800 Medellin, Cebu Busco Sugar Milling Company, Inc. 10,000 Quezon, Bukidnon Crystal Sugar Company, Inc. 4,500 Maramag, Bukidnon Davao Sugar Central Company, Inc. 4,000 Hagonoy, Davao del Sur Durano III & Sons, Inc. 2,000 Danao City, Cebu Hideco Sugar Milling Co., Inc. 5,000 Kananga, Leyte Ormoc Sugar Co., Inc. 2,000 Ormoc City, Leyte Universal Robina Sugar 8,000 Manjuyod, Negros Occidental South East Asia Sugar Mill Corp. 4,000 Matalam, North Cotabato Herminio Teves & Co., Inc. 3,000 Sta. Catalina, Negros Oriental PANAY Capiz Sugar Central, Inc. 3,500 President Roxas, Capiz Monomer Sugar Central, Inc. 2,500 Dumalag, Capiz New Frontier Sugar Corp. 4,200 Passi, Iloilo Passi (Iloilo) Sugar Central, Inc. 5,000 San Enrique, Iloilo NEGROS Binalbagan-Isabela Sugar Co., Inc. 10,000 Binalbagan, Negros Occidental Dacongcogon Producers' Coop. Mktg., Inc.
2,200 Kabankalan, Negros Occidental
Danao Development Corp. 3,000 Toboso, Negros Occidental First Farmers Holding Corp. 5,000 Talisay, Negros Occidental Hawaiian-Philippine Co. 6,500 Negros Occidental
2 Tariff Commission, 1997.
6
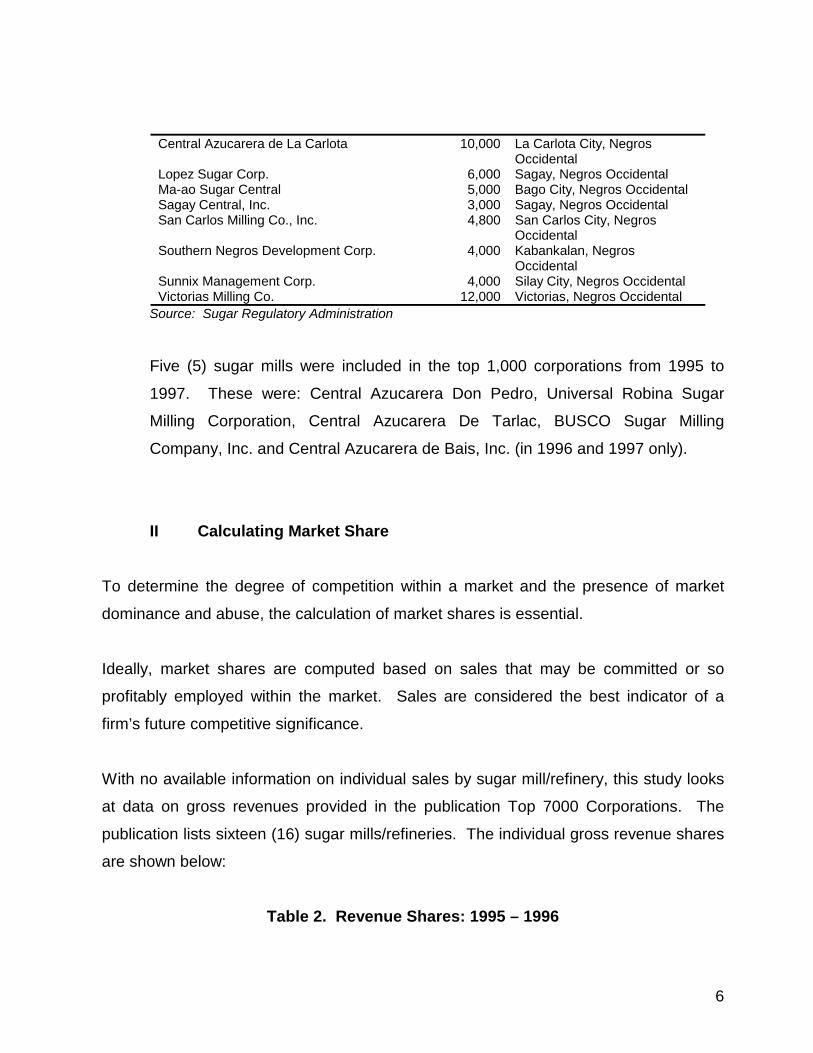
Central Azucarera de La Carlota 10,000 La Carlota City, Negros Occidental
Lopez Sugar Corp. 6,000 Sagay, Negros Occidental Ma-ao Sugar Central 5,000 Bago City, Negros Occidental Sagay Central, Inc. 3,000 Sagay, Negros Occidental San Carlos Milling Co., Inc. 4,800 San Carlos City, Negros
Occidental Southern Negros Development Corp. 4,000 Kabankalan, Negros
Occidental Sunnix Management Corp. 4,000 Silay City, Negros Occidental Victorias Milling Co. 12,000 Victorias, Negros Occidental
Source: Sugar Regulatory Administration
Five (5) sugar mills were included in the top 1,000 corporations from 1995 to
1997. These were: Central Azucarera Don Pedro, Universal Robina Sugar
Milling Corporation, Central Azucarera De Tarlac, BUSCO Sugar Milling
Company, Inc. and Central Azucarera de Bais, Inc. (in 1996 and 1997 only).
II Calculating Market Share
To determine the degree of competition within a market and the presence of market
dominance and abuse, the calculation of market shares is essential.
Ideally, market shares are computed based on sales that may be committed or so
profitably employed within the market. Sales are considered the best indicator of a
firm’s future competitive significance.
With no available information on individual sales by sugar mill/refinery, this study looks
at data on gross revenues provided in the publication Top 7000 Corporations. The
publication lists sixteen (16) sugar mills/refineries. The individual gross revenue shares
are shown below:
Table 2. Revenue Shares: 1995 – 1996

7
Players 1995 1996 Central Azucarera Don Pedro 32.9 29.3 Central Azucarera de Tarlac 12.3 16.4 Busco Sugar Milling Co., Inc. 9.7 10.3 New Leyte Edible Oil Mfg. Corp. 12.2 8.3 Central Azucarera de Bais, Inc. 4.3 7.4 Universal Robina Sugar Milling Corp. 9.1 6.7 HIDECO Sugar Milling Co., Inc. 5.2 6.1 Sagay Central, Inc. 2.9 3.2 Pampanga Sugar Development Co., Inc. 2.8 2.5 Bogo-Medellin Milling Co., Inc. 2.9 2.3 Ma-ao Sugar Central Co., Inc. 1.2 1.1 Southern Negros Development Corp. 3.1 1.0 Tarlac Development Corp. Nil 0.4 Southwind Sugar Corporation 0.5 4.1 Manuel L. Teves, Inc. 0.5 0.6 Associated Sugar, Inc. 0.2 0.5
Source of Basic Data: Top 7000 Corporations
The percentage figures representing individual revenue shares are taken to
indicate individual market shares.
III Evaluating Level of Concentration
The level of concentration, i.e. firm ownership and industry structure, in the industry was
computed using the Herfindahl-Hirschman Index (HHI). The HHI is an indicator used in
the United States. It is the sum of the squares of the individual market shares of all
market participants. An HHI of 10,000 means a pure monopoly while an HHI
approaching zero indicates an atomistic market. To aid in the interpretation of the HHI,
the United States uses the following approach: an HHI below 1000 means non-
concentration in the market, an HHI between 1000 and 1800 means moderate market
concentration, and an HHI above 1800 means high market concentration. An HHI of
above 1800 is considered “highly concentrated” even though it seems a long way from
10,000, i.e. absolute monopoly power. This is because, in the merger context at least,
8
U.S. antitrust laws are concerned not only with mergers that result in a monopoly, but
also with mergers that result in a highly concentrated market.
Under American law, the HHI is not strictly mandated in any situation, even in mergers.
Rather, it is used in guidelines of the U.S. Department of Justice when reviewing
mergers. Courts have adopted the guidelines, including the HHI, as useful in analyzing
mergers, and they look to the HHI for guidance in other areas of antitrust law as well.
While the HHI has no “legal” authority, courts, regulators and economists recognize it as
a useful tool in analyzing market concentration in mergers and other areas of antitrust
law.
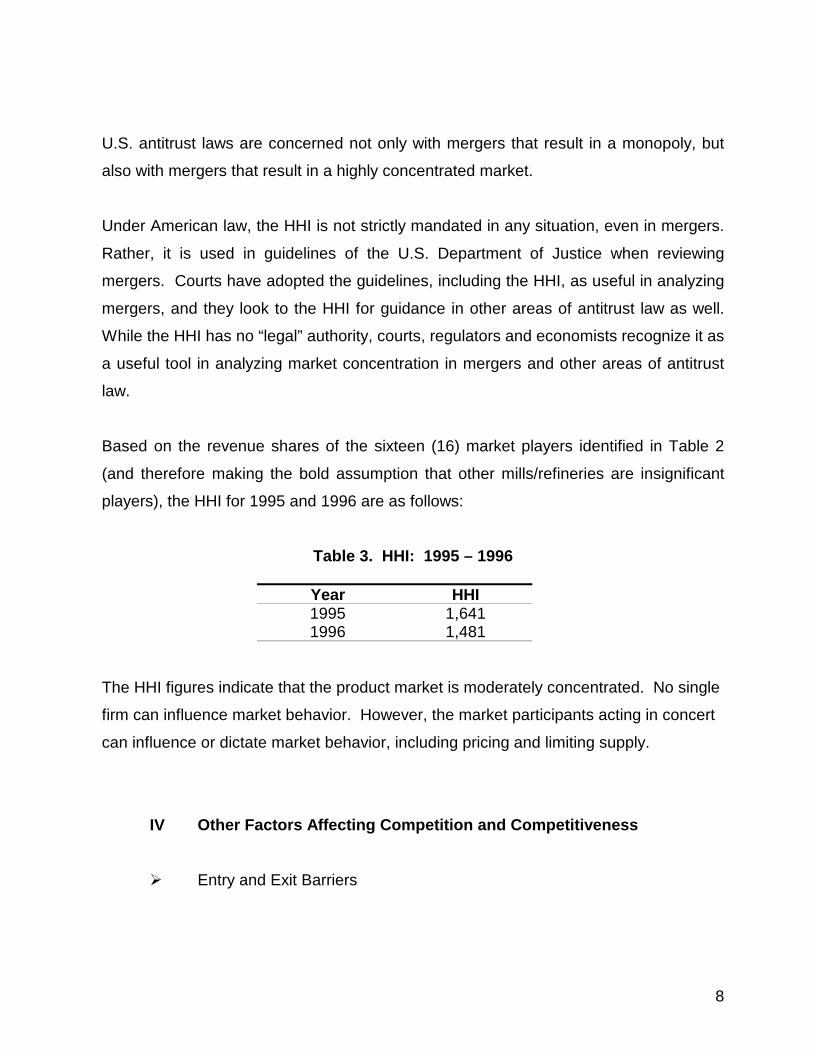
Based on the revenue shares of the sixteen (16) market players identified in Table 2
(and therefore making the bold assumption that other mills/refineries are insignificant
players), the HHI for 1995 and 1996 are as follows:
Table 3. HHI: 1995 – 1996
Year HHI 1995 1,641 1996 1,481
The HHI figures indicate that the product market is moderately concentrated. No single
firm can influence market behavior. However, the market participants acting in concert
can influence or dictate market behavior, including pricing and limiting supply.
IV Other Factors Affecting Competition and Competitiveness
! Entry and Exit Barriers
9
The attainment of greater competition in markets may be constrained by the
conditions of entry of new firms in said markets. Where entry is easy (i.e. the
market is contestable), the threat of potential entrants increases the competitive
pressure on incumbent firms. Incumbents are thus forced to become more
efficient and competitive, since failure to do so could mean the loss of market
share and power to new players. With easy entry, abuse of market power is
therefore unlikely and the efficiency benefits of competition are more easily
realized.
Where exit barriers exist, the release of unused or excess resources by failed
firms is made difficult. Attaining allocative efficiency is hindered.
Where entry or and/or exit barriers exist, however, the attainment of equilibrium
as close as possible to a case of perfect competition, becomes that much more
difficult.
In the domestic refined cane sugar industry, the conditions of entry and exit are
as follows:
(a) Investment Cost
According to the Sugar Regulatory Authority (SRA), there are no legal
barriers to entry, and exit, from the sugar industry.
However, both entry and exit would be difficult, entry in view of the heavy
investments required, and exit in view of the heavy investments, estimated
at P160 billion, already made. Around P80 billion has been spent on
sugar farms, P50 billion on mills, and P30 billion on refineries.
(b) Laws and Regulations
10
Traditionally, the government has regulated the sugar industry, from the
planting of sugarcane up to the eventual disposition of the sugar product.
The intended objectives of these policies are to distribute the benefits of
the high-priced U.S. quota market, to support the industry, and ultimately
to reduce poverty in the rural areas.
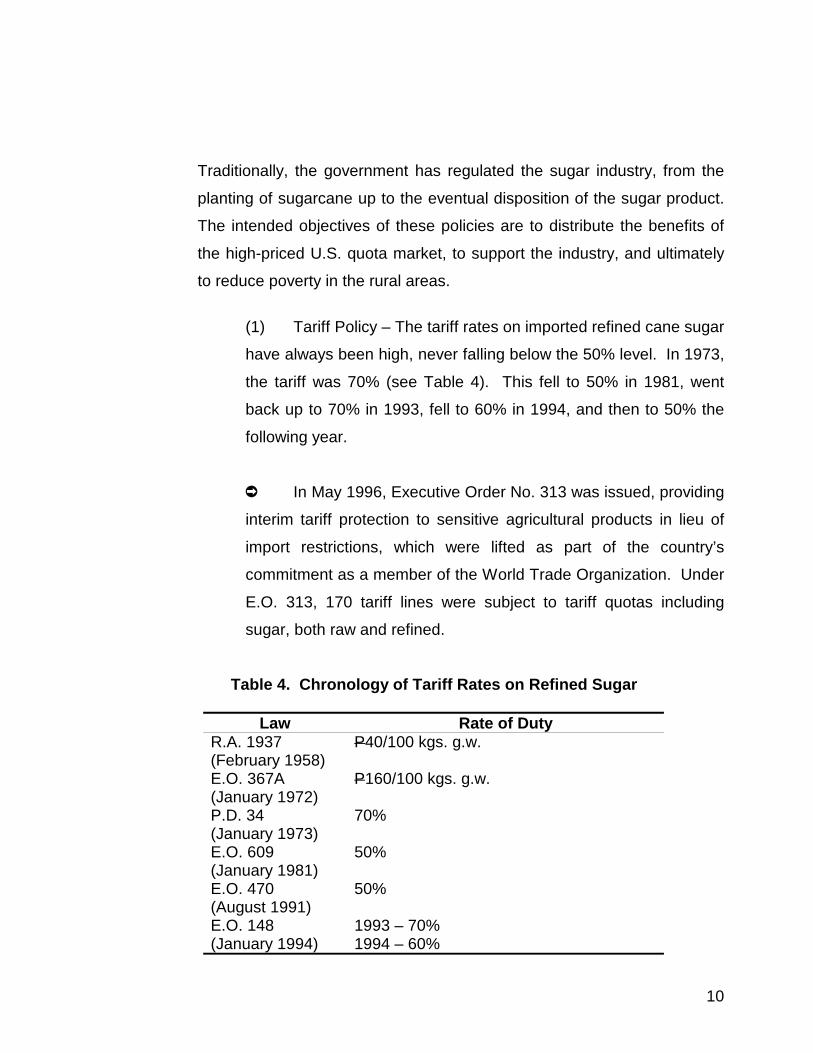
(1) Tariff Policy – The tariff rates on imported refined cane sugar
have always been high, never falling below the 50% level. In 1973,
the tariff was 70% (see Table 4). This fell to 50% in 1981, went
back up to 70% in 1993, fell to 60% in 1994, and then to 50% the
following year.
➲ In May 1996, Executive Order No. 313 was issued, providing
interim tariff protection to sensitive agricultural products in lieu of
import restrictions, which were lifted as part of the country’s
commitment as a member of the World Trade Organization. Under
E.O. 313, 170 tariff lines were subject to tariff quotas including
sugar, both raw and refined.
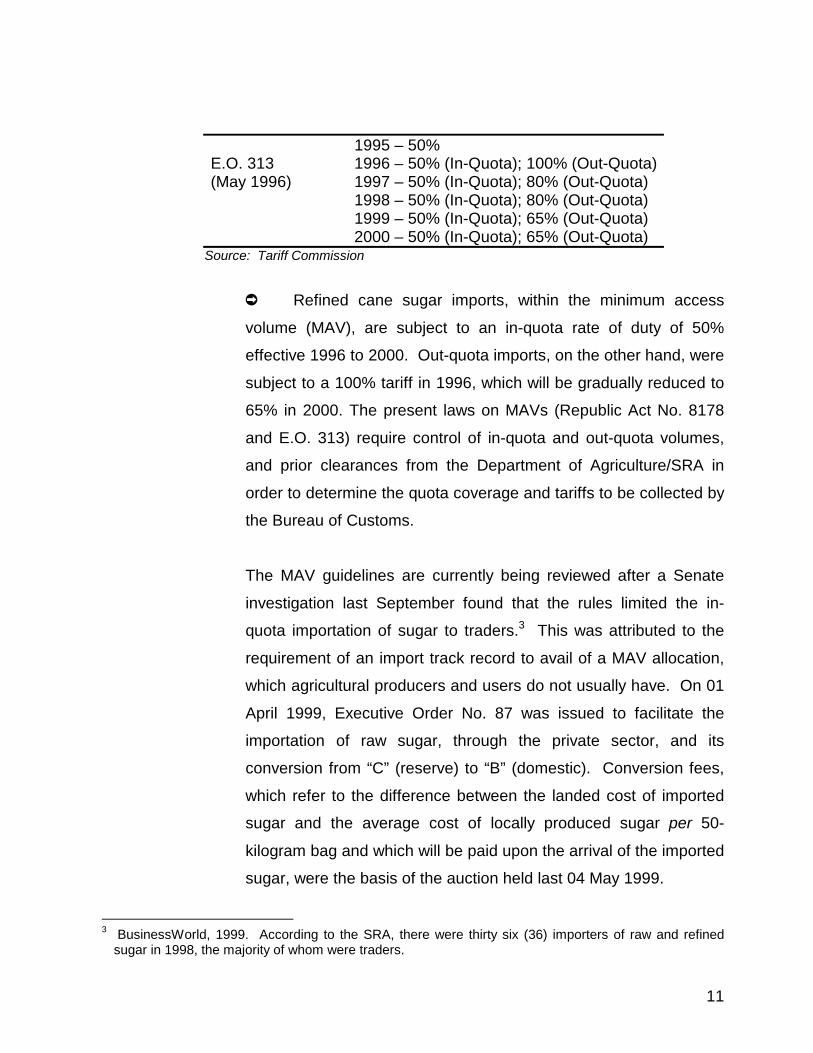
Table 4. Chronology of Tariff Rates on Refined Sugar
Law Rate of Duty R.A. 1937 (February 1958)
P40/100 kgs. g.w.
E.O. 367A (January 1972)
P160/100 kgs. g.w.
P.D. 34 (January 1973)
70%
E.O. 609 (January 1981)
50%
E.O. 470 (August 1991)
50%
E.O. 148 (January 1994)
1993 – 70% 1994 – 60%
11
1995 – 50% E.O. 313 (May 1996)
1996 – 50% (In-Quota); 100% (Out-Quota) 1997 – 50% (In-Quota); 80% (Out-Quota) 1998 – 50% (In-Quota); 80% (Out-Quota) 1999 – 50% (In-Quota); 65% (Out-Quota) 2000 – 50% (In-Quota); 65% (Out-Quota)
Source: Tariff Commission
➲ Refined cane sugar imports, within the minimum access
volume (MAV), are subject to an in-quota rate of duty of 50%
effective 1996 to 2000. Out-quota imports, on the other hand, were
subject to a 100% tariff in 1996, which will be gradually reduced to
65% in 2000. The present laws on MAVs (Republic Act No. 8178
and E.O. 313) require control of in-quota and out-quota volumes,
and prior clearances from the Department of Agriculture/SRA in
order to determine the quota coverage and tariffs to be collected by
the Bureau of Customs.
The MAV guidelines are currently being reviewed after a Senate
investigation last September found that the rules limited the in-
quota importation of sugar to traders.3 This was attributed to the
requirement of an import track record to avail of a MAV allocation,
which agricultural producers and users do not usually have. On 01
April 1999, Executive Order No. 87 was issued to facilitate the
importation of raw sugar, through the private sector, and its
conversion from “C” (reserve) to “B” (domestic). Conversion fees,
which refer to the difference between the landed cost of imported
sugar and the average cost of locally produced sugar per 50-
kilogram bag and which will be paid upon the arrival of the imported
sugar, were the basis of the auction held last 04 May 1999.
3 BusinessWorld, 1999. According to the SRA, there were thirty six (36) importers of raw and refined
sugar in 1998, the majority of whom were traders.
12
➲ Under the Agriculture and Fisheries Modernization Act
(AFMA), certain agriculture and fishery inputs, machinery and
equipment (including fertilizers, insecticides, tractors, hybrid seeds,
farm implements and machinery) may be imported duty-free for a
period of five years commencing 1999. Products falling under List
A may be imported duty-free with no restrictions, while importers of
products falling under List B need to get prior certification from the
Department of Agriculture as enterprises duly engaged in
agriculture and fishery. Combined with high output tariffs, the duty-
free importation of inputs in effect increases the protection enjoyed
by the sugar industry from the tariff system.
It is noted that the tariffs on sugar are higher than the tariffs on the
finished products (e.g. sugar confectioneries, sugar preparations,
pastry, cakes, biscuits and other baker’s wares, preserved fruits
and nuts, and beverages), which are at a maximum of 20% (see
Figure 1).
➲ With respect to the ASEAN Free Trade Area (AFTA)-
Common Effective Preferential Tariff (CEPT) Scheme, which
envisions duties falling within the 0-5% range for commodities
traded within the region, sugar is currently in the Temporary
Exclusion List of the Philippines. Thus, the MFN rate of 65%
currently prevails for sugar imports from within ASEAN.
Other ASEAN members such as Brunei, Indonesia, Malaysia,
Singapore and Vietnam also presently exclude sugar. The only
exception is Thailand, which excludes raw sugar but grants a CEPT
13
duty of 2.63 baht/kilogram (equivalent to about 20% ad valorem) on
refined sugar.
During the 6th ASEAN Summit held in Hanoi in December 1998, the
ASEAN Leaders decided to accelerate the implementation of AFTA
by one year from 2003 to 2002. The Philippines will likely exercise
the flexibility option and sugar will be phased into the Scheme by
2003 at a CEPT rate of 5%.
➲ On the country’s commitments to the World Trade
Organization (WTO), the final binding tariff rate on both raw and
refined sugar is 50% to be implemented in 2004. To reach the 50%
target by 2004, reductions must be implemented in 1997 and 2000.
Thus, from 100% in 1996, the out-quota rate of duty on refined
sugar was reduced to 80% in 1997 and further to 65% in 1999 and
2000.
➲ With respect to the Asia Pacific Economic Cooperation
(APEC), the goal is zero tariffs in 2010 and 2020 for developed and
developing countries, respectively.
(2) Factors Restricting Entry of Sugar Imports – Prior to 1982,
the importation of refined sugar was restricted. However, by virtue
of Central Bank Circular No. 850, the importation of refined sugar
was liberalized effective 15 February 1982. Together with the
oversupply and depressed prices of sugar in the world market, the
incentive to import should be high.
14
➲ In reality, however, the SRA continues to exercise regulatory
powers over sugar importation, affecting its entry and practically
isolating the domestic market from imports.
The SRA is the government agency responsible for overseeing the
development of the sugar industry. It is governed by the Sugar
Board, which is chaired by the Secretary of Agriculture, with one (1)
representative each from the sugar millers and sugar planters as
members. It is vested with the power to regulate production of,
establish market allocations for, and institute a quedaning system
for sugar.
Although sugar millers and sugar planters are represented in the
Sugar Board, food processors and other users and consumers are
not, making for a lop-sided policy in favor of the planters and
millers.
The SRA’s regulatory powers include monitoring of sugar imports,
imposing of monitoring fees, and prescribing administrative
procedures if the imported sugar is not used in food processing.
Among these monitoring fees are: “monitoring fee” of P10.00/50 kg
and a “clearance fee” imposed on exporters of sugar-based
products; P50.00/50 kg added to the world price for “B1” sugar
used by food processors and exporters; “clearance fee” of P0.45/50
kg imposed on sugar exporters to the U.S.; “import fee” of
P13.60/50 kg; PhilSURIN lien of P2.00/50 kg; SIFI of P4.75/50 kg;
SMDF of P0.70/50 kg.; PASUDECO of P1.00/50 kg; and P0.40/50
kg.4
4 Tolentino, 1999.
15
➲ The market quota system works in the following manner:
➘ Locally produced sugar is classified into five (5) categories
based on market destination. These are: “A” for the U.S. import
quota market, “B” for the domestic market, C” for reserve, “D” for
exports to countries other than the U.S., and “E” which may be
bought at the world price by exporting firms using sugar as input.
In 1992, the SRA created another quota category, B1, which is also
for the domestic market but may be withdrawn from storage only
after 120 days.
➘ According to sugar industry sources, the market allocation
system ensures the domestic supply of sugar, which is a vital
commodity, in instances where the world price is greater than the
domestic price, when U.S. prices are high (so domestic sugar
producers would rather export), or when the foreign exchange rate
is “uncooperative” (the peso depreciates against the dollar so
imports cost more). It is also claimed by industry sources that the
market allocation system is practised worldwide.
The quota system was devised to allow all planters and millers
proportionately equal access to the higher-priced U.S. quota
market. The SRA estimates production at the start of a crop year
and then prepares a “sugar order” containing the percentage
allocations of the sugar produced into the various destinations.
These allocations are adjusted as production estimates are
modified or the country’s share of the U.S. quota market changes.
16
➘ The market quota system is implemented through a quedan
system and controls on the withdrawal of sugar from warehouses.
All milled sugar is deposited in registered warehouses and the
owners provided quedans (as proof of ownership) which state the
classification, or market destination, of the sugar. The quedan is a
negotiable instrument and sugar is traded using these. Sugar may
be withdrawn from warehouses only with a sugar release order
from the SRA and upon surrender of the quedan.
➘ In 1992, the SRA began quedaning refined sugar.
Refineries issue the refined sugar quedan upon acceptance of raw
sugar for tolling. However, refineries are allowed to accept sugar
for tolling only when accompanied by a sugar release order issued
by the SRA. For integrated refineries (refineries attached to a
sugar mill), refining occurs only after surrender of the raw sugar
quedans and replacement with refined sugar quedans. Refined
sugar can be withdrawn only with the surrender of the refined sugar
quedans.
(3) Providing Access to Imported Sugar – According to the SRA,
exporters may import sugar duty-free. An exporter has to apply for
his sugar requirement with the SRA and submit two (2) pre-
requisites: sales invoice of previous performance and proof that the
exporter has an export commitment. From the point of view of the
SRA therefore, there is no problem for exporters with respect to
access to duty-free sugar.
According to an SRA representative, these requisites are
necessary in order to prevent cheaper imported sugar from finding
its way into the domestic market. Clearly, the
17
! Factors Affecting Competitiveness
(a) Backward Linkage
The Comprehensive Agrarian Reform Law (CARL) has contributed largely
to the declining hectarage planted to sugar, as well as declining yields per
hectare. Under the CARL, farm sizes have been reduced such that
mechanization has become too expensive. The small farmer cannot
afford the tractor that is needed for deep plowing. Sugar cane roots must
reach one meter (1m) deep for higher yields and more efficient harvesting.
Hence, sugar cane farming under the CARL is not cost effective. Industry
sources state that in Australia, sugar cane yield per hectare is two
hundred times more than sugar cane yield per hectare in the Philippines.
Sugar cane farms in Australia are fully mechanized, from soil preparation,
to planting to harvesting. Sugar is a plantation crop where economies of
scale are important. In Thailand and Indonesia, the average sugar
plantation is composed of seventy hectares (70 ha).
Moreover, some farmers who were granted land under the CARL, have
either sold it to developers who in turn develop these into subdivisions or
golf courses, lease it to small business entrepreneurs or leave the land
idle. Interest accruing to farmers, if they sell the land and deposit the
proceeds, as well as income from leasing are greater than profits they
may realize from planting sugar cane. On the other hand, some farmers
prefer to leave the land idle, as income generated from working the land is
not proportionate to taxes paid. Another reason for leaving lands idle is
the lack of capital to fund planting activities. Thus, the reduced hectarage
has led to a deficient supply of canes and the consequent underutilization
of milling capacity and lower sugar production.
18
(b) Technology
Some sugar mills have invested in modern technology and this has
resulted in higher mill output as well as more efficient operations.
However, a majority of the mills have outdated technology and are in need
of modernization to improve efficiencies.
The volume of sugar production depends on the amount of sugar cane
processed and the sugar content of the cane. The failure to mechanize
harvesting results in further decline in sugar cane yield per hectare.
Moreover, harvesting techniques employed affects the sugar content in
cane. Ideally, cane should be milled within twenty-four (24) hours from
cutting to maintain high sugar content. The practice of burning cane
before harvesting, as well as the amount of impurities attached to the
cane, e.g., soil, affects sugar recovery.
(c) Cane Sharing Scheme
The domestic sugar industry employs a cane-sharing scheme to pay
farmers for the sugar cane it brings to mills for processing. The sharing is
as follows: 65% to 70% of the mill output goes to the planters while the
remaining 30% to 35% is retained by the mill. There is little incentive to
improve mill efficiency under the cane-sharing scheme, as the sugar mill
spends for such undertaking but the benefits will accrue mostly to
planters.
(d) Additional Cost to Millers
19
Mills normally shoulder the transport cost of cane from farm to mill. This
aggregates to about 40% of the budget allocated to transportation cost.
Moreover, mills have to invest in water/pollution control system in line with
the legislated Clean Air Act.
(e) Access to Financing
According to industry sources, banks do not accept the plantation (or the
land itself) as loan collateral, which seriously inhibits the ability of planters
to source credit. Credit is especially crucial for investments in new
technology necessary for attaining greater efficiency and productivity. The
investment required to rehabilitate and modernize is huge. According to
an industry informant, P20 billion in modernization expenses have been
made since 1992. Another P40 billion is required but a loan interest rate
above 12% will not prove profitable for millers.
V Industry Performance Assessment
(a) Domestic Industry
The sugar industry as a whole is one of the country’s oldest and most important
industries. Until the mid-1970s, the industry contributed approximately 9% to
agricultural gross value added (GVA).5 In the 1980s, the share of GVA from
sugar cane production to total agricultural GVA averaged 4%.
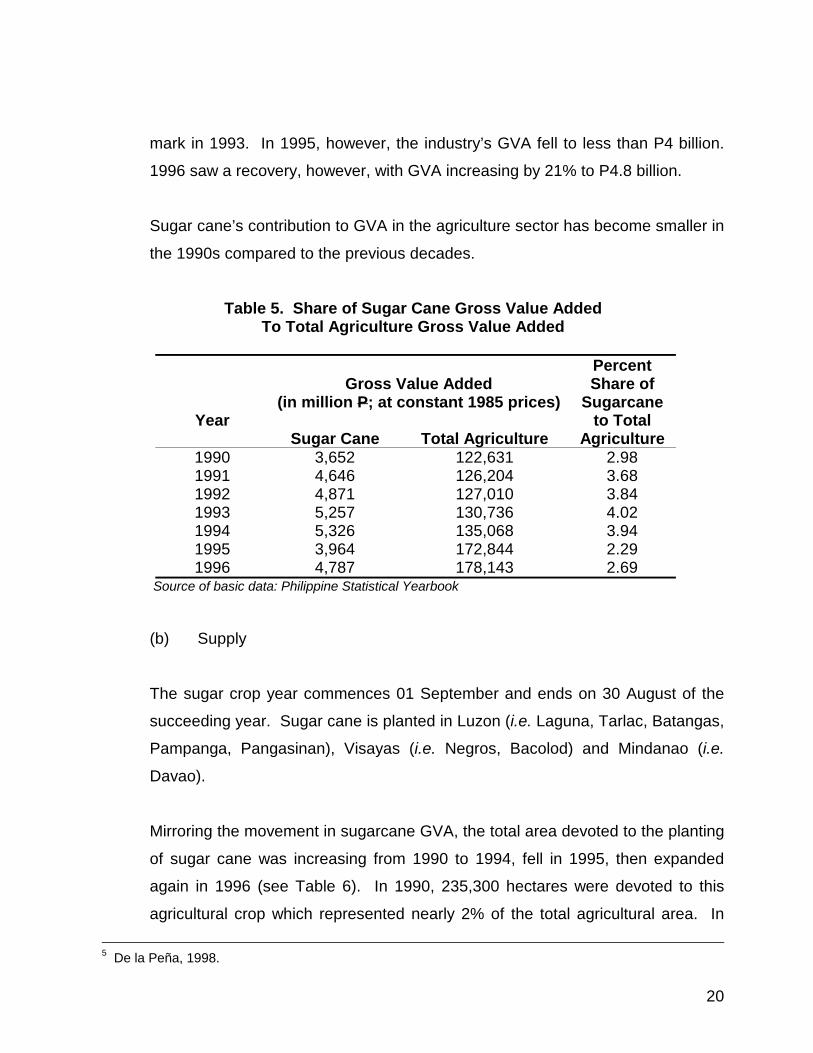
Over the period 1990 to 1994, the sugar industry’s GVA has been increasing
(see Table 5). From P3.65 billion in 1990, GVA from the sugar cane sector
topped the P4 billion mark the following year, then went on to pass the P5 billion
20
mark in 1993. In 1995, however, the industry’s GVA fell to less than P4 billion.
1996 saw a recovery, however, with GVA increasing by 21% to P4.8 billion.
Sugar cane’s contribution to GVA in the agriculture sector has become smaller in
the 1990s compared to the previous decades.
Table 5. Share of Sugar Cane Gross Value Added To Total Agriculture Gross Value Added
Gross Value Added (in million P; at constant 1985 prices)
Percent Share of
Sugarcane Year
Sugar Cane
Total Agriculture to Total
Agriculture 1990 3,652 122,631 2.98 1991 4,646 126,204 3.68 1992 4,871 127,010 3.84 1993 5,257 130,736 4.02 1994 5,326 135,068 3.94 1995 3,964 172,844 2.29 1996 4,787 178,143 2.69
Source of basic data: Philippine Statistical Yearbook
(b) Supply
The sugar crop year commences 01 September and ends on 30 August of the
succeeding year. Sugar cane is planted in Luzon (i.e. Laguna, Tarlac, Batangas,
Pampanga, Pangasinan), Visayas (i.e. Negros, Bacolod) and Mindanao (i.e.
Davao).
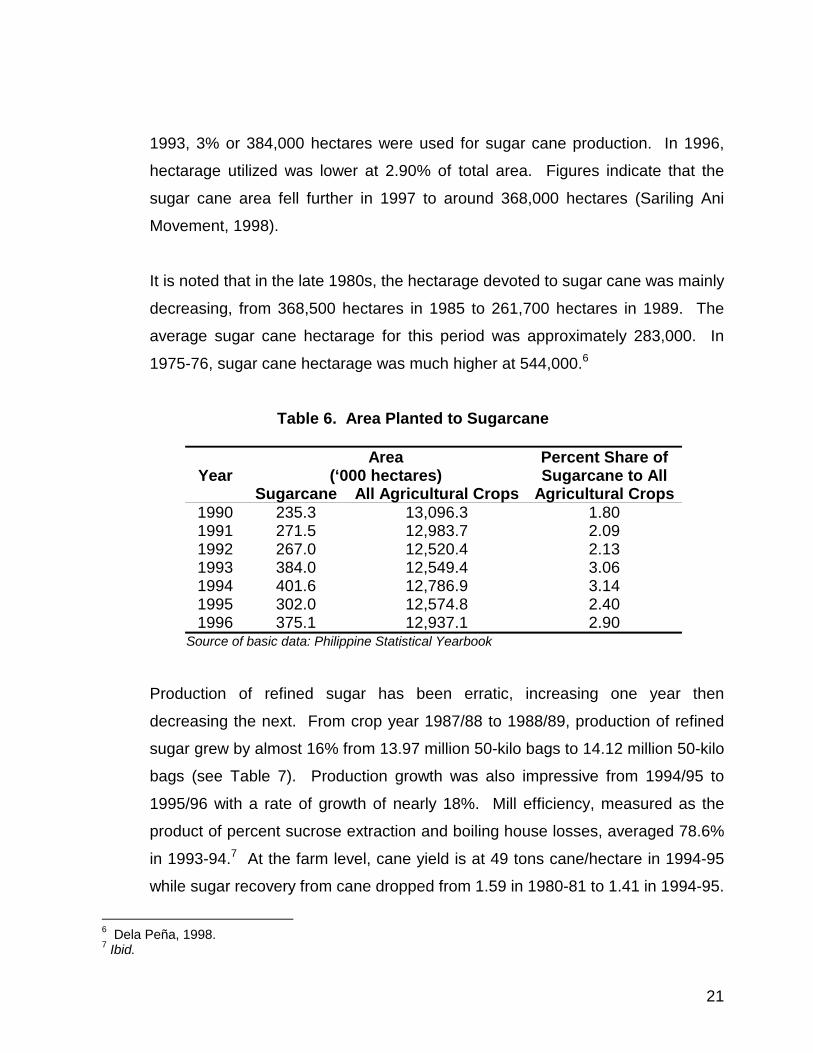
Mirroring the movement in sugarcane GVA, the total area devoted to the planting
of sugar cane was increasing from 1990 to 1994, fell in 1995, then expanded
again in 1996 (see Table 6). In 1990, 235,300 hectares were devoted to this
agricultural crop which represented nearly 2% of the total agricultural area. In
5 De la Peña, 1998.
21
1993, 3% or 384,000 hectares were used for sugar cane production. In 1996,
hectarage utilized was lower at 2.90% of total area. Figures indicate that the
sugar cane area fell further in 1997 to around 368,000 hectares (Sariling Ani
Movement, 1998).
It is noted that in the late 1980s, the hectarage devoted to sugar cane was mainly
decreasing, from 368,500 hectares in 1985 to 261,700 hectares in 1989. The
average sugar cane hectarage for this period was approximately 283,000. In
1975-76, sugar cane hectarage was much higher at 544,000.6
Table 6. Area Planted to Sugarcane
Year
Area (‘000 hectares)
Percent Share of Sugarcane to All
Sugarcane All Agricultural Crops Agricultural Crops 1990 235.3 13,096.3 1.80 1991 271.5 12,983.7 2.09 1992 267.0 12,520.4 2.13 1993 384.0 12,549.4 3.06 1994 401.6 12,786.9 3.14 1995 302.0 12,574.8 2.40 1996 375.1 12,937.1 2.90
Source of basic data: Philippine Statistical Yearbook
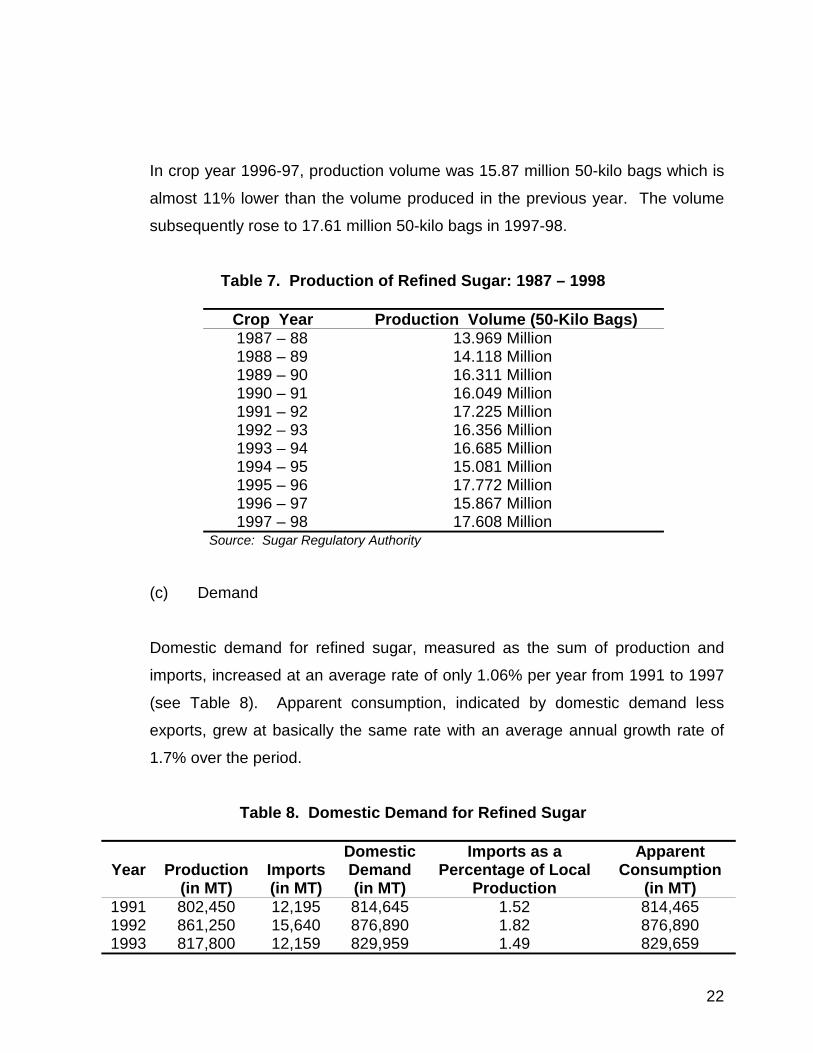
Production of refined sugar has been erratic, increasing one year then
decreasing the next. From crop year 1987/88 to 1988/89, production of refined
sugar grew by almost 16% from 13.97 million 50-kilo bags to 14.12 million 50-kilo
bags (see Table 7). Production growth was also impressive from 1994/95 to
1995/96 with a rate of growth of nearly 18%. Mill efficiency, measured as the
product of percent sucrose extraction and boiling house losses, averaged 78.6%
in 1993-94.7 At the farm level, cane yield is at 49 tons cane/hectare in 1994-95
while sugar recovery from cane dropped from 1.59 in 1980-81 to 1.41 in 1994-95.
6 Dela Peña, 1998. 7 Ibid.
22
In crop year 1996-97, production volume was 15.87 million 50-kilo bags which is
almost 11% lower than the volume produced in the previous year. The volume
subsequently rose to 17.61 million 50-kilo bags in 1997-98.
Table 7. Production of Refined Sugar: 1987 – 1998
Crop Year Production Volume (50-Kilo Bags) 1987 – 88 13.969 Million 1988 – 89 14.118 Million 1989 – 90 16.311 Million 1990 – 91 16.049 Million 1991 – 92 17.225 Million 1992 – 93 16.356 Million 1993 – 94 16.685 Million 1994 – 95 15.081 Million 1995 – 96 17.772 Million 1996 – 97 15.867 Million 1997 – 98 17.608 Million
Source: Sugar Regulatory Authority
(c) Demand
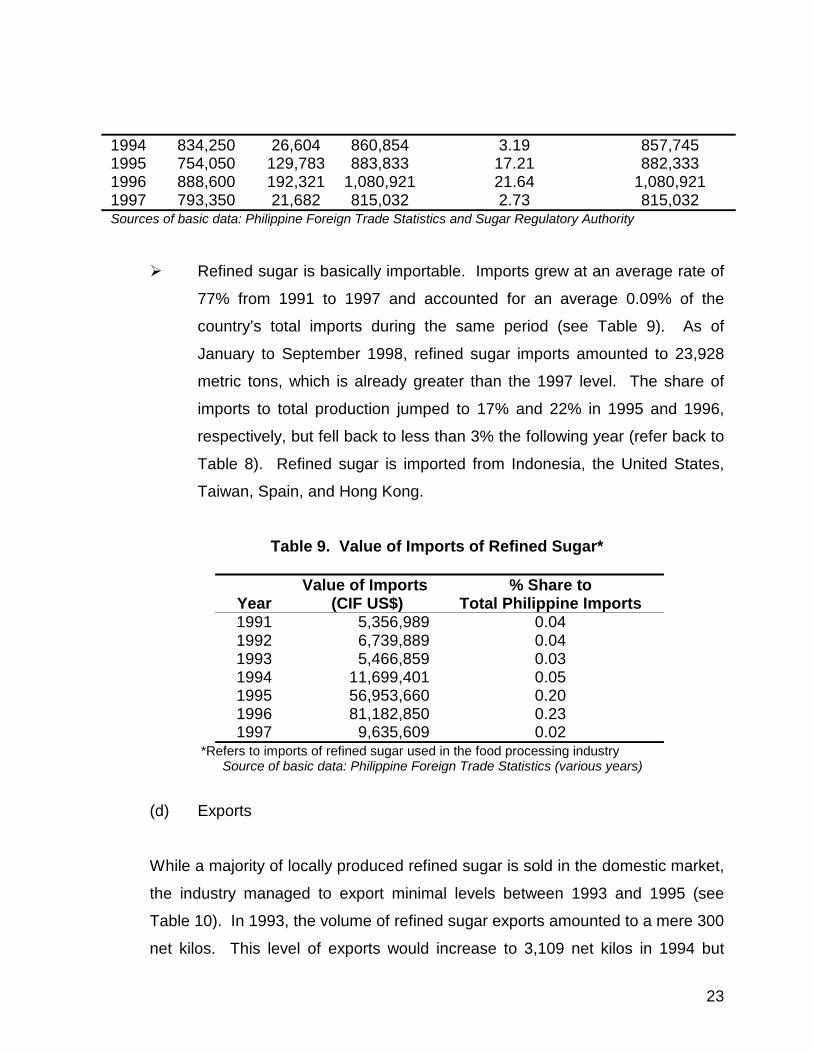
Domestic demand for refined sugar, measured as the sum of production and
imports, increased at an average rate of only 1.06% per year from 1991 to 1997
(see Table 8). Apparent consumption, indicated by domestic demand less
exports, grew at basically the same rate with an average annual growth rate of
1.7% over the period.
Table 8. Domestic Demand for Refined Sugar Year
Production
(in MT)
Imports (in MT)
Domestic Demand (in MT)
Imports as a Percentage of Local
Production
Apparent Consumption
(in MT) 1991 802,450 12,195 814,645 1.52 814,465 1992 861,250 15,640 876,890 1.82 876,890 1993 817,800 12,159 829,959 1.49 829,659
23
1994 834,250 26,604 860,854 3.19 857,745 1995 754,050 129,783 883,833 17.21 882,333 1996 888,600 192,321 1,080,921 21.64 1,080,921 1997 793,350 21,682 815,032 2.73 815,032
Sources of basic data: Philippine Foreign Trade Statistics and Sugar Regulatory Authority
! Refined sugar is basically importable. Imports grew at an average rate of
77% from 1991 to 1997 and accounted for an average 0.09% of the
country’s total imports during the same period (see Table 9). As of
January to September 1998, refined sugar imports amounted to 23,928
metric tons, which is already greater than the 1997 level. The share of
imports to total production jumped to 17% and 22% in 1995 and 1996,
respectively, but fell back to less than 3% the following year (refer back to
Table 8). Refined sugar is imported from Indonesia, the United States,
Taiwan, Spain, and Hong Kong.
Table 9. Value of Imports of Refined Sugar*
Year
Value of Imports (CIF US$)
% Share to Total Philippine Imports
1991 5,356,989 0.04 1992 6,739,889 0.04 1993 5,466,859 0.03 1994 11,699,401 0.05 1995 56,953,660 0.20 1996 81,182,850 0.23 1997 9,635,609 0.02
*Refers to imports of refined sugar used in the food processing industry Source of basic data: Philippine Foreign Trade Statistics (various years)
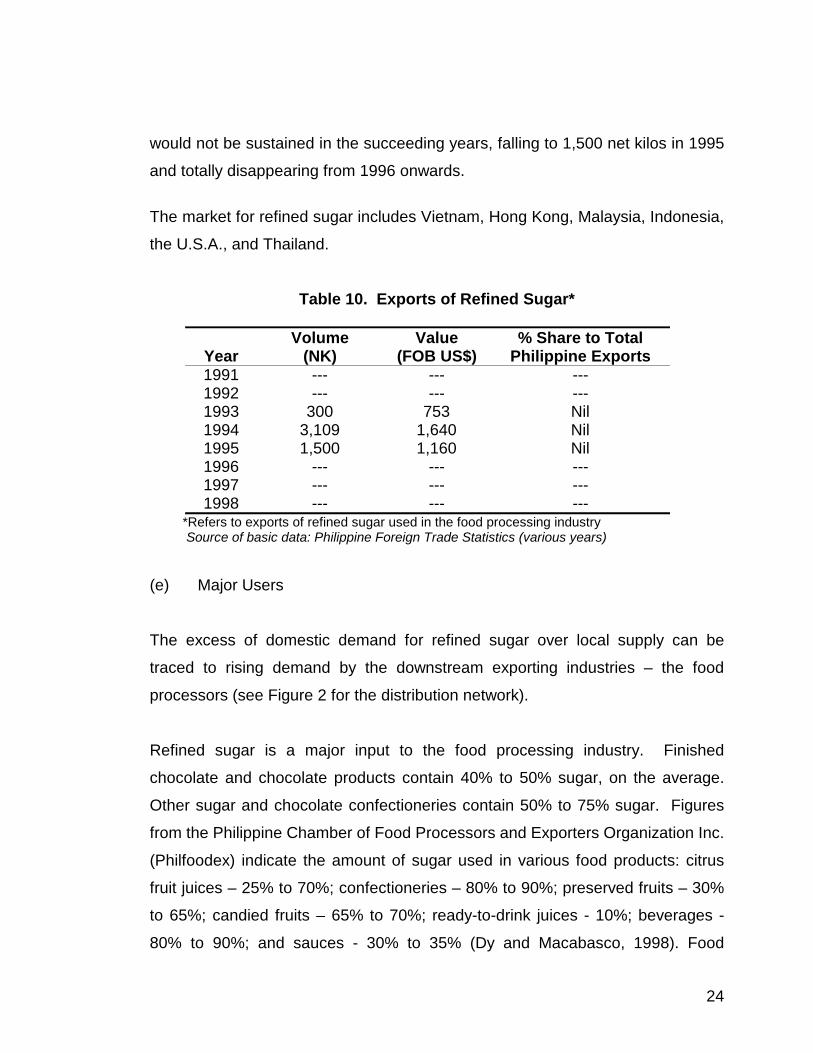
(d) Exports
While a majority of locally produced refined sugar is sold in the domestic market,
the industry managed to export minimal levels between 1993 and 1995 (see
Table 10). In 1993, the volume of refined sugar exports amounted to a mere 300
net kilos. This level of exports would increase to 3,109 net kilos in 1994 but
24
would not be sustained in the succeeding years, falling to 1,500 net kilos in 1995
and totally disappearing from 1996 onwards.
The market for refined sugar includes Vietnam, Hong Kong, Malaysia, Indonesia,
the U.S.A., and Thailand.
Table 10. Exports of Refined Sugar*
Year
Volume (NK)
Value (FOB US$)
% Share to Total Philippine Exports
1991 --- --- --- 1992 --- --- --- 1993 300 753 Nil 1994 3,109 1,640 Nil 1995 1,500 1,160 Nil 1996 --- --- --- 1997 --- --- --- 1998 --- --- ---
*Refers to exports of refined sugar used in the food processing industry Source of basic data: Philippine Foreign Trade Statistics (various years)
(e) Major Users
The excess of domestic demand for refined sugar over local supply can be
traced to rising demand by the downstream exporting industries – the food
processors (see Figure 2 for the distribution network).
Refined sugar is a major input to the food processing industry. Finished
chocolate and chocolate products contain 40% to 50% sugar, on the average.
Other sugar and chocolate confectioneries contain 50% to 75% sugar. Figures
from the Philippine Chamber of Food Processors and Exporters Organization Inc.
(Philfoodex) indicate the amount of sugar used in various food products: citrus
fruit juices – 25% to 70%; confectioneries – 80% to 90%; preserved fruits – 30%
to 65%; candied fruits – 65% to 70%; ready-to-drink juices - 10%; beverages -
80% to 90%; and sauces - 30% to 35% (Dy and Macabasco, 1998). Food
25
processors include: Philfoodex, the Philippine Chamber of Food Manufacturers
Inc., Nestle Philippines Inc., and Coca-Cola Bottlers Philippines Inc.
According to the Philippine Chamber of Food Manufacturers, Inc., about 200,000
metric tons of sugar are used yearly for various food products. According to the
Beverage Industry Association of the Philippines (BIAP), it consumes 37% of the
country’s production of refined sugar.
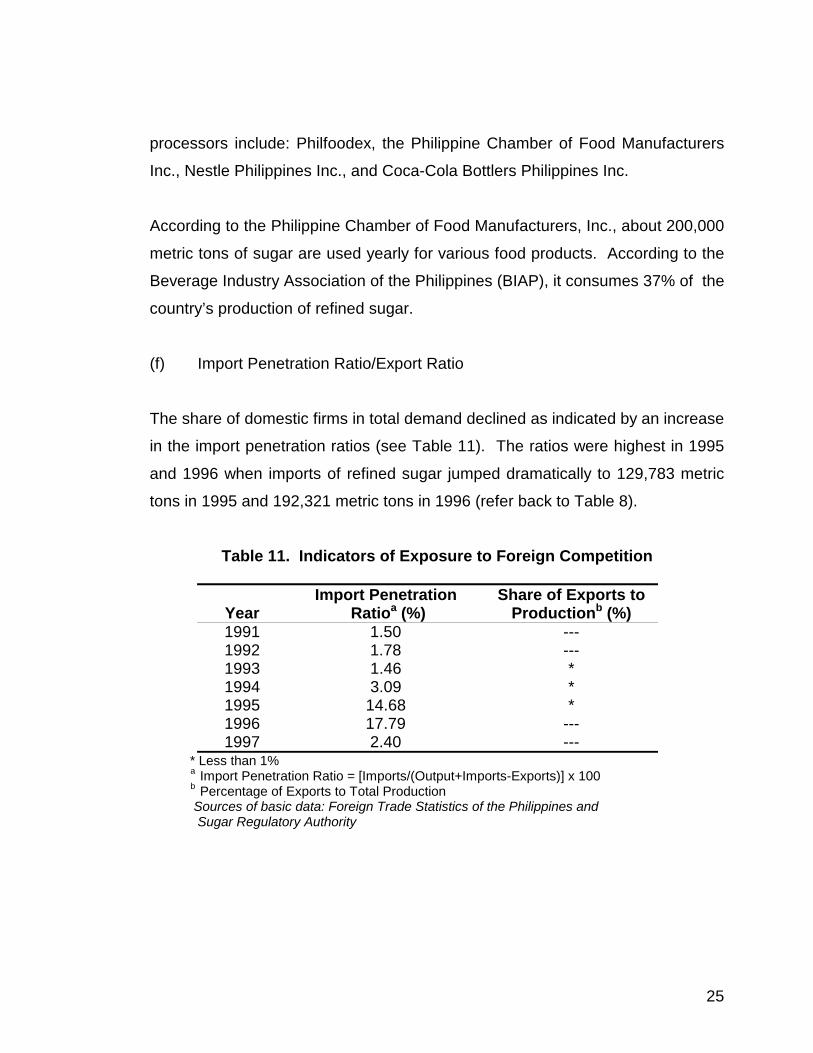
(f) Import Penetration Ratio/Export Ratio
The share of domestic firms in total demand declined as indicated by an increase
in the import penetration ratios (see Table 11). The ratios were highest in 1995
and 1996 when imports of refined sugar jumped dramatically to 129,783 metric
tons in 1995 and 192,321 metric tons in 1996 (refer back to Table 8).
Table 11. Indicators of Exposure to Foreign Competition
Year
Import Penetration Ratioa (%)
Share of Exports to Productionb (%)
1991 1.50 --- 1992 1.78 --- 1993 1.46 * 1994 3.09 * 1995 14.68 * 1996 17.79 --- 1997 2.40 ---
* Less than 1% a Import Penetration Ratio = [Imports/(Output+Imports-Exports)] x 100 b Percentage of Exports to Total Production Sources of basic data: Foreign Trade Statistics of the Philippines and
Sugar Regulatory Authority
26
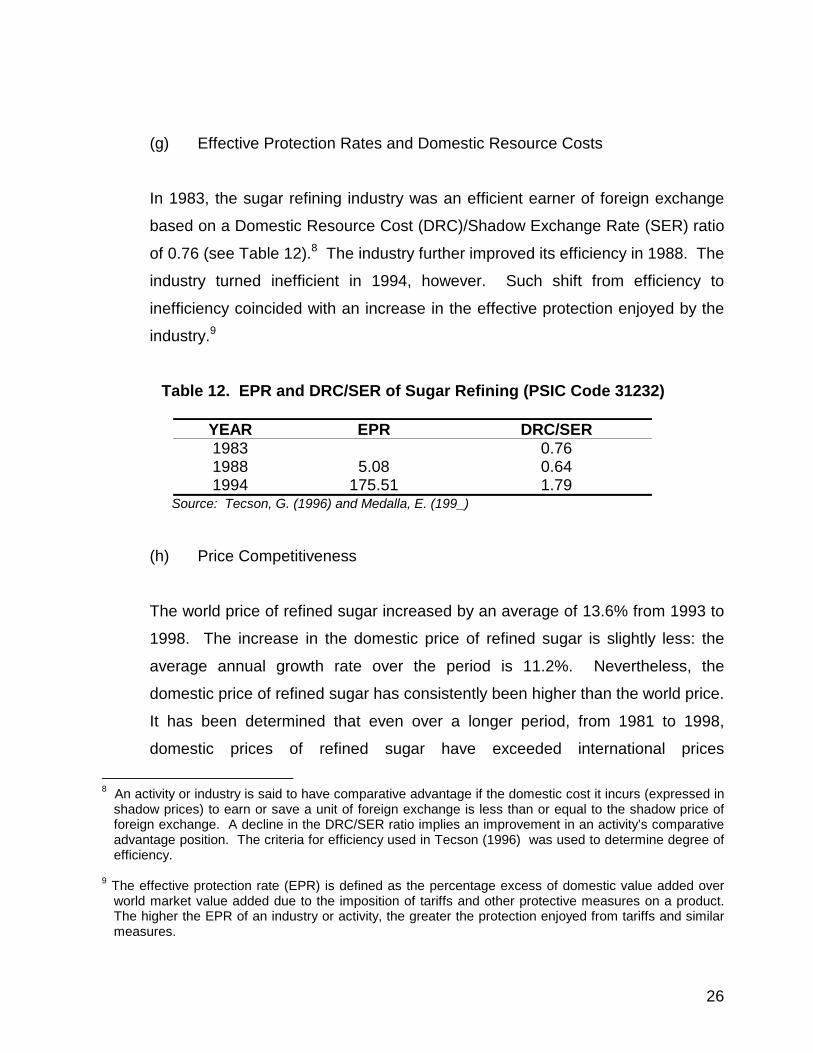
(g) Effective Protection Rates and Domestic Resource Costs
In 1983, the sugar refining industry was an efficient earner of foreign exchange
based on a Domestic Resource Cost (DRC)/Shadow Exchange Rate (SER) ratio
of 0.76 (see Table 12).8 The industry further improved its efficiency in 1988. The
industry turned inefficient in 1994, however. Such shift from efficiency to
inefficiency coincided with an increase in the effective protection enjoyed by the
industry.9
Table 12. EPR and DRC/SER of Sugar Refining (PSIC Code 31232)
YEAR EPR DRC/SER 1983 0.76 1988 5.08 0.64 1994 175.51 1.79
Source: Tecson, G. (1996) and Medalla, E. (199_)
(h) Price Competitiveness
The world price of refined sugar increased by an average of 13.6% from 1993 to
1998. The increase in the domestic price of refined sugar is slightly less: the
average annual growth rate over the period is 11.2%. Nevertheless, the
domestic price of refined sugar has consistently been higher than the world price.
It has been determined that even over a longer period, from 1981 to 1998,
domestic prices of refined sugar have exceeded international prices
8 An activity or industry is said to have comparative advantage if the domestic cost it incurs (expressed in
shadow prices) to earn or save a unit of foreign exchange is less than or equal to the shadow price of foreign exchange. A decline in the DRC/SER ratio implies an improvement in an activity’s comparative advantage position. The criteria for efficiency used in Tecson (1996) was used to determine degree of efficiency.
9 The effective protection rate (EPR) is defined as the percentage excess of domestic value added over
world market value added due to the imposition of tariffs and other protective measures on a product. The higher the EPR of an industry or activity, the greater the protection enjoyed from tariffs and similar measures.
27
continuously. Further, over this longer period, domestic prices have increased at
a faster rate of 10% annually on average, as compared to an average annual
growth rate of 1% for world prices. Domestic prices have also been more
volatile.10
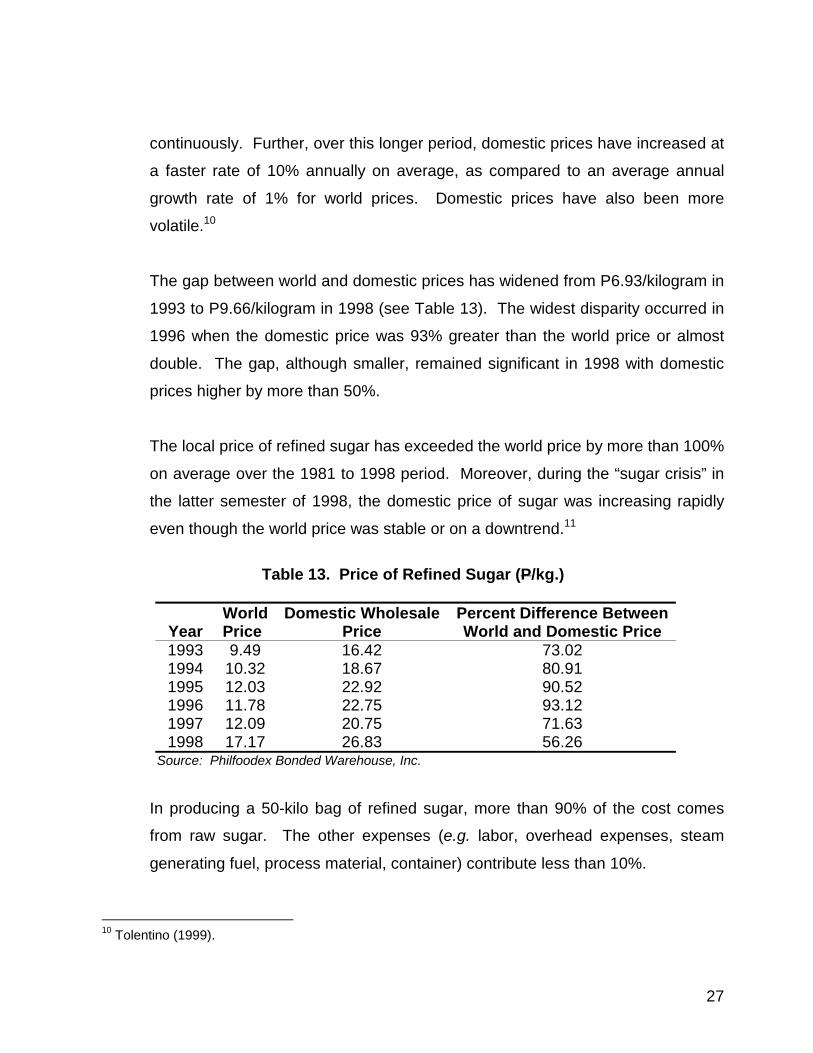
The gap between world and domestic prices has widened from P6.93/kilogram in
1993 to P9.66/kilogram in 1998 (see Table 13). The widest disparity occurred in
1996 when the domestic price was 93% greater than the world price or almost
double. The gap, although smaller, remained significant in 1998 with domestic
prices higher by more than 50%.
The local price of refined sugar has exceeded the world price by more than 100%
on average over the 1981 to 1998 period. Moreover, during the “sugar crisis” in
the latter semester of 1998, the domestic price of sugar was increasing rapidly
even though the world price was stable or on a downtrend.11
Table 13. Price of Refined Sugar (P/kg.)
World Domestic Wholesale Percent Difference Between
Year Price Price World and Domestic Price 1993 9.49 16.42 73.02 1994 10.32 18.67 80.91 1995 12.03 22.92 90.52 1996 11.78 22.75 93.12 1997 12.09 20.75 71.63 1998 17.17 26.83 56.26
Source: Philfoodex Bonded Warehouse, Inc.
In producing a 50-kilo bag of refined sugar, more than 90% of the cost comes
from raw sugar. The other expenses (e.g. labor, overhead expenses, steam
generating fuel, process material, container) contribute less than 10%.
10 Tolentino (1999).
28
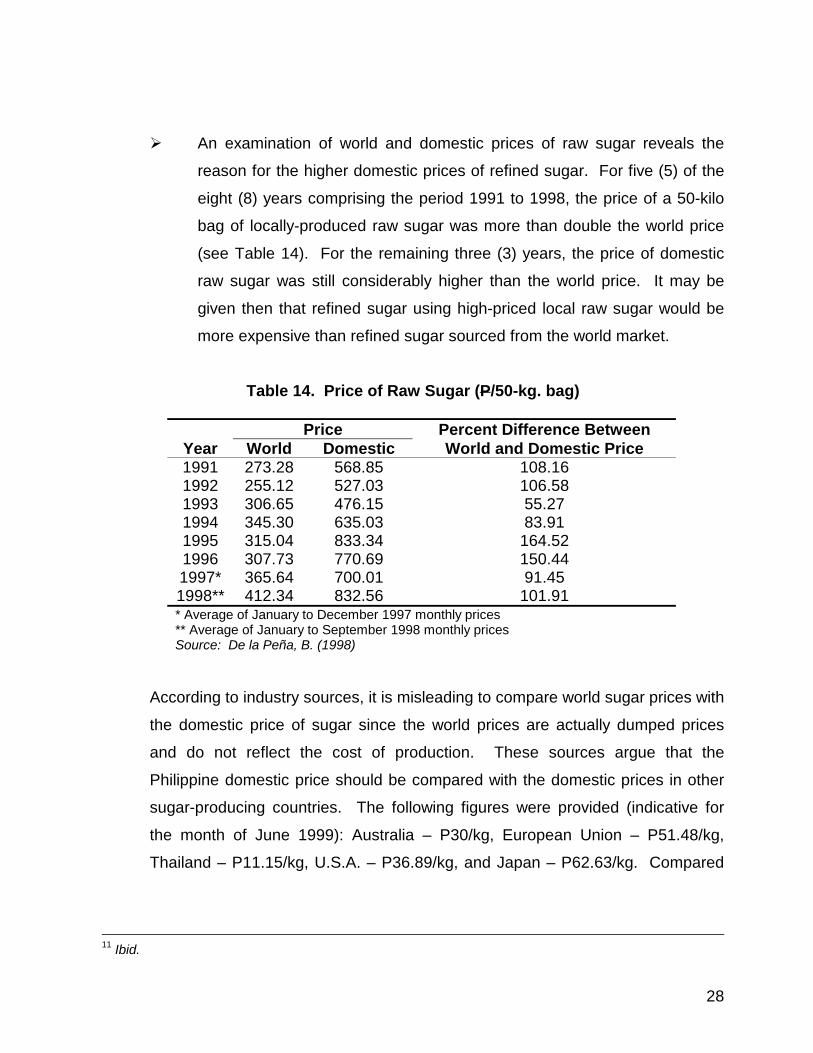
! An examination of world and domestic prices of raw sugar reveals the
reason for the higher domestic prices of refined sugar. For five (5) of the
eight (8) years comprising the period 1991 to 1998, the price of a 50-kilo
bag of locally-produced raw sugar was more than double the world price
(see Table 14). For the remaining three (3) years, the price of domestic
raw sugar was still considerably higher than the world price. It may be
given then that refined sugar using high-priced local raw sugar would be
more expensive than refined sugar sourced from the world market.
Table 14. Price of Raw Sugar (P/50-kg. bag)
Price Percent Difference Between Year World Domestic World and Domestic Price 1991 273.28 568.85 108.16 1992 255.12 527.03 106.58 1993 306.65 476.15 55.27 1994 345.30 635.03 83.91 1995 315.04 833.34 164.52 1996 307.73 770.69 150.44 1997* 365.64 700.01 91.45 1998** 412.34 832.56 101.91
* Average of January to December 1997 monthly prices ** Average of January to September 1998 monthly prices Source: De la Peña, B. (1998)
According to industry sources, it is misleading to compare world sugar prices with
the domestic price of sugar since the world prices are actually dumped prices
and do not reflect the cost of production. These sources argue that the
Philippine domestic price should be compared with the domestic prices in other
sugar-producing countries. The following figures were provided (indicative for
the month of June 1999): Australia – P30/kg, European Union – P51.48/kg,
Thailand – P11.15/kg, U.S.A. – P36.89/kg, and Japan – P62.63/kg. Compared
11 Ibid.
29
with a Philippine domestic price of P25.23/kg, then the Philippines would actually
have the cheapest sugar.
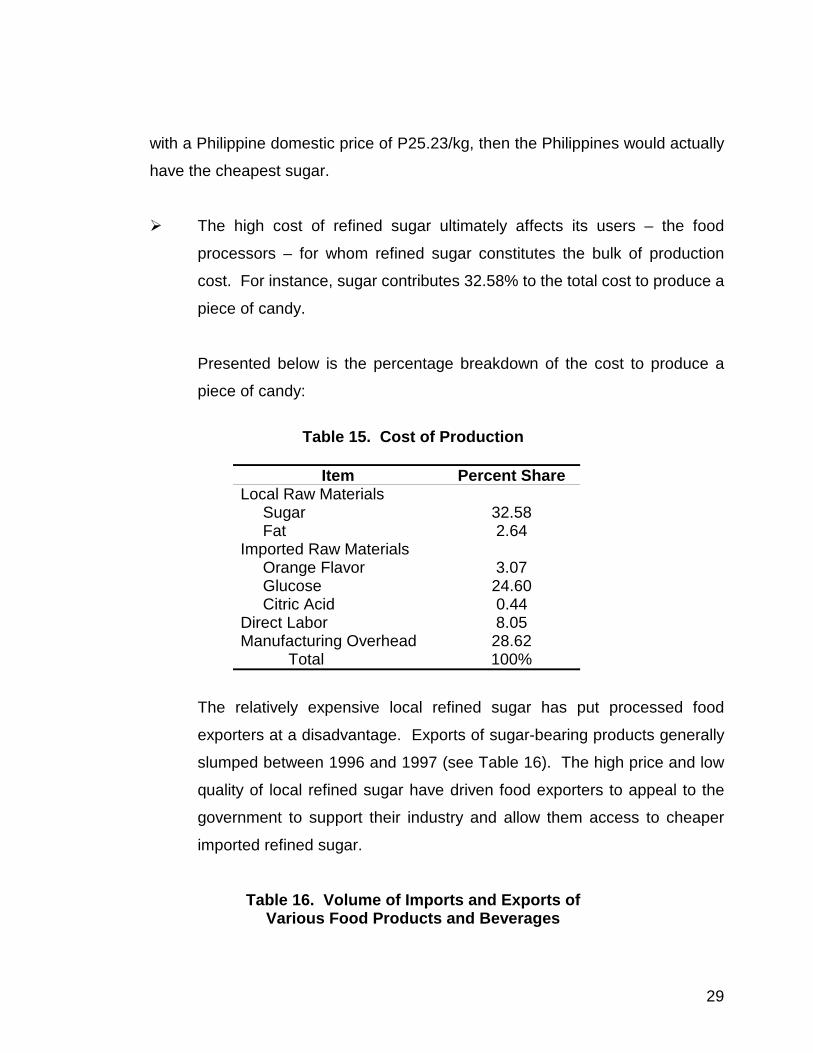
! The high cost of refined sugar ultimately affects its users – the food
processors – for whom refined sugar constitutes the bulk of production
cost. For instance, sugar contributes 32.58% to the total cost to produce a
piece of candy.
Presented below is the percentage breakdown of the cost to produce a
piece of candy:
Table 15. Cost of Production
Item Percent Share
Local Raw Materials Sugar 32.58 Fat 2.64 Imported Raw Materials Orange Flavor 3.07 Glucose 24.60 Citric Acid 0.44 Direct Labor 8.05 Manufacturing Overhead 28.62
Total 100%
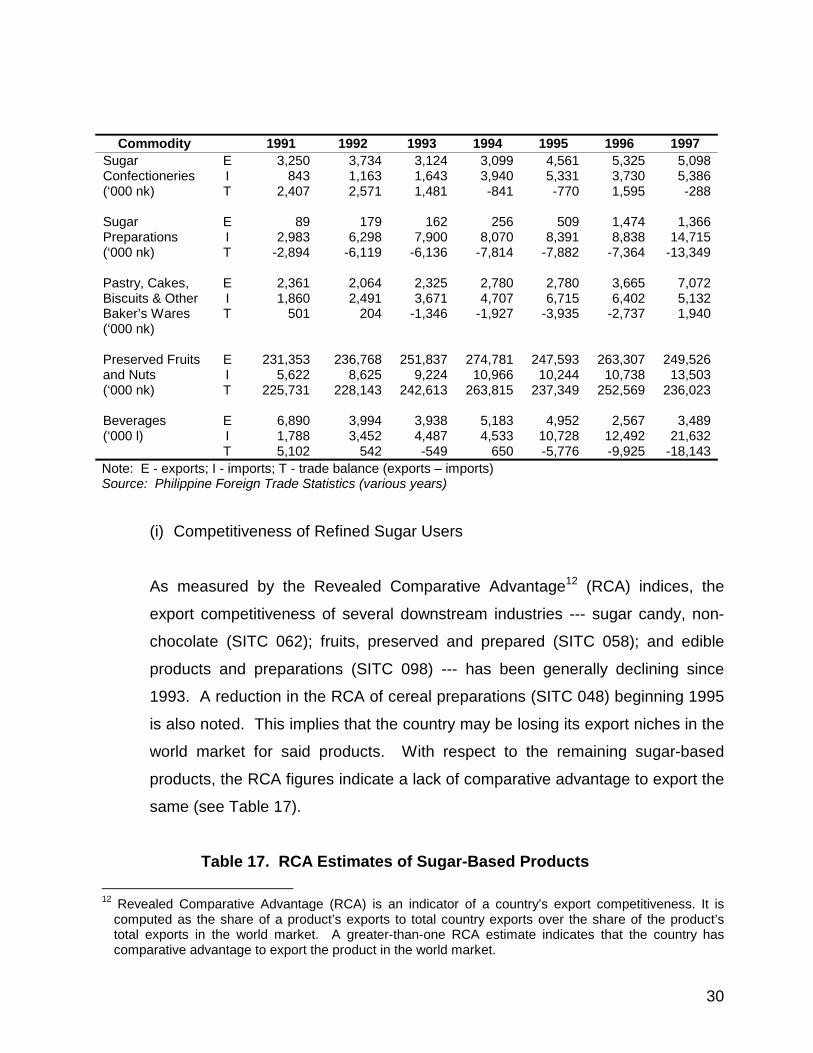
The relatively expensive local refined sugar has put processed food
exporters at a disadvantage. Exports of sugar-bearing products generally
slumped between 1996 and 1997 (see Table 16). The high price and low
quality of local refined sugar have driven food exporters to appeal to the
government to support their industry and allow them access to cheaper
imported refined sugar.
Table 16. Volume of Imports and Exports of Various Food Products and Beverages
30
Commodity 1991 1992 1993 1994 1995 1996 1997 Sugar E 3,250 3,734 3,124 3,099 4,561 5,325 5,098 Confectioneries I 843 1,163 1,643 3,940 5,331 3,730 5,386 (‘000 nk) T 2,407 2,571 1,481 -841 -770 1,595 -288 Sugar E 89 179 162 256 509 1,474 1,366 Preparations I 2,983 6,298 7,900 8,070 8,391 8,838 14,715 (‘000 nk) T -2,894 -6,119 -6,136 -7,814 -7,882 -7,364 -13,349 Pastry, Cakes, E 2,361 2,064 2,325 2,780 2,780 3,665 7,072 Biscuits & Other I 1,860 2,491 3,671 4,707 6,715 6,402 5,132 Baker’s Wares T 501 204 -1,346 -1,927 -3,935 -2,737 1,940 (‘000 nk) Preserved Fruits E 231,353 236,768 251,837 274,781 247,593 263,307 249,526 and Nuts I 5,622 8,625 9,224 10,966 10,244 10,738 13,503 (‘000 nk) T 225,731 228,143 242,613 263,815 237,349 252,569 236,023 Beverages E 6,890 3,994 3,938 5,183 4,952 2,567 3,489 (‘000 l) I 1,788 3,452 4,487 4,533 10,728 12,492 21,632 T 5,102 542 -549 650 -5,776 -9,925 -18,143 Note: E - exports; I - imports; T - trade balance (exports – imports) Source: Philippine Foreign Trade Statistics (various years)
(i) Competitiveness of Refined Sugar Users
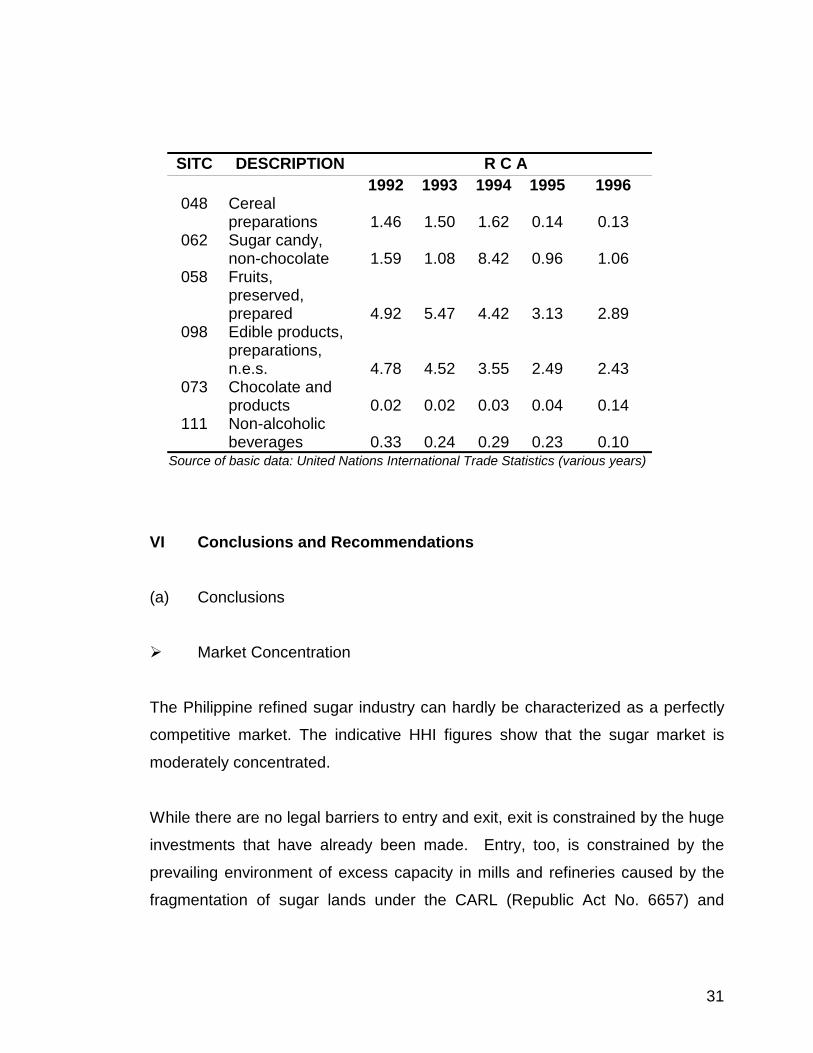
As measured by the Revealed Comparative Advantage12 (RCA) indices, the
export competitiveness of several downstream industries --- sugar candy, non-
chocolate (SITC 062); fruits, preserved and prepared (SITC 058); and edible
products and preparations (SITC 098) --- has been generally declining since
1993. A reduction in the RCA of cereal preparations (SITC 048) beginning 1995
is also noted. This implies that the country may be losing its export niches in the
world market for said products. With respect to the remaining sugar-based
products, the RCA figures indicate a lack of comparative advantage to export the
same (see Table 17).
Table 17. RCA Estimates of Sugar-Based Products 12 Revealed Comparative Advantage (RCA) is an indicator of a country’s export competitiveness. It is
computed as the share of a product’s exports to total country exports over the share of the product’s total exports in the world market. A greater-than-one RCA estimate indicates that the country has comparative advantage to export the product in the world market.
31
SITC DESCRIPTION R C A
1992 1993 1994 1995 1996 048 Cereal
preparations
1.46
1.50
1.62
0.14
0.13 062 Sugar candy,
non-chocolate
1.59
1.08
8.42
0.96
1.06 058 Fruits,
preserved, prepared
4.92
5.47
4.42
3.13
2.89 098 Edible products,
preparations, n.e.s.
4.78
4.52
3.55
2.49
2.43 073 Chocolate and
products
0.02
0.02
0.03
0.04
0.14 111 Non-alcoholic
beverages
0.33
0.24
0.29
0.23
0.10 Source of basic data: United Nations International Trade Statistics (various years)
VI Conclusions and Recommendations
(a) Conclusions
! Market Concentration
The Philippine refined sugar industry can hardly be characterized as a perfectly
competitive market. The indicative HHI figures show that the sugar market is
moderately concentrated.
While there are no legal barriers to entry and exit, exit is constrained by the huge
investments that have already been made. Entry, too, is constrained by the
prevailing environment of excess capacity in mills and refineries caused by the
fragmentation of sugar lands under the CARL (Republic Act No. 6657) and
32
declining sugar productivity in terms of hectarage and piculs per tons cane or
sugar yields.
! Anti-Competitive Behavior
Despite moderate market concentration, the anti-competitive behavior of market
participants, evident in the industry’s pricing behavior, is reinforced by
government regulations. The industry has long been subject of extensive
government regulation, which serves as a barrier to the free working of the
market. Government policy would seem to be well-intentioned: to reduce poverty
by supporting the industry and distributing the benefits of the U.S. quota market.
However, policymakers have failed to address the “unexpected” burden policy
has imposed on the rest of the economy.
➲ Restrictions imposed on sugar imports – Since sugar has
traditionally been considered a sensitive agricultural commodity, it has
always been highly protected. Tariffs have been at the high-end13 and
while imports are supposed to have been liberalized, import controls are
maintained by the SRA. While E.O. 87 facilitates the importation of sugar
and its conversion from “C” to “B,” a new tax on imports has effectively
been imposed. According to some sources, the conversion fee paid by
the bidders during the 04 May auction would add P8/kilo to the price of
sugar currently pegged at P21/kilo14.
➲ Incentives to entry reinforce anti-competitive behavior – While
tariffs and import restrictions serve as incentives to entry since potential
13 The mechanism of using bonded warehouses to take advantage of reduced tariffs on imported inputs is
generally limited to those with the capability and resources to utilize such and process all the required paperwork in Manila (Tolentino, 1999).
14 Philippine Daily Inquirer, 1999.
33
players are assured of a protected domestic environment, it also
discourages entry if they allow incumbents to “entrench” themselves as
seems to be the case in the sugar industry. Sugar
producers/millers/refiners form a well-organized group willing to pay the
costs of ensuring that their interests remain protected and the government
incentives they have long enjoyed stay. In contrast, consumers are
scattered, the awareness level with respect to the burden from high local
sugar prices is low, so an effective counterforce to the sugar-producing
group that can influence policy does not exist.
➲ The goal of government’s trade liberalization initiatives is to induce
Philippine industries to attain global competitiveness. Essentially, the
strategy is to introduce greater competition into the economy through the
lowering/elimination of trade barriers --- the competitive pressure from
imports would push domestic firms to innovate and work towards greater
efficiency and ultimately, world competitiveness. This liberalization
strategy has been sparingly applied to the sugar industry. Thus, the
degree of competition within the industry is less than desirable.
➲ Quota allocation and quedaning system – Aside from trade barriers,
another obstacle to a more competitive sugar market is the quota
allocation and quedaning system. Since market destination is pre-
determined, producers/mills need not compete with each other for a share
of the market.
The quota allocation and quedaning system has clearly dulled any
competitive edge that the refined sugar industry may have developed had
it been allowed to face competition. When asked what steps the sugar
producers are taking or have taken with respect to the probable reduction
of the U.S. sugar quota allocation to Mexico (under the North American
34
Free Trade Accord), an industry source merely said that they (sugar
planters and millers) are “watching with concern” and that the reduction is
“farfetched yet anyway.”
(b) Recommendations
It is apparent that government policy that has led to the suppression of market
forces and the low level of competition within the refined sugar industry.
! Issues That Can Be Addressed by Competition Policy
The combination of trade restrictions and the regulatory system of sugar
marketing have adversely affected the sugar industry’s development. The
industry has not been encouraged to “shape up” and work towards greater
efficiency and competitiveness. Indeed, where is the incentive for restructuring
when the industry is protected from competition from lower-priced imports,
access to the high-priced U.S. market is assured, and market destination is pre-
determined. As proof, the industry remains characterized by low farm cane
productivity and low sugar mill efficiency relative to world standards as well as
high sugar prices.15 Domestic production efficiency and supply have fallen
behind domestic demand. The DRC/SER ratios indicate a shift from efficiency to
inefficiency as effective protection to the industry increased. Moreover, it has
been claimed that the plight of the sacadas16 has not really improved. The
industry’s contribution to GVA has been falling along with the hectarage devoted
to sugar cane, which means that scarce resources continue to be diverted to a
shrinking sector.
15 Tolentino, 1999. 16 Sacada is the local term for sugar tenant farmer.
35
The inefficiencies of the sugar industry, graphically illustrated by high domestic
prices for sugar, penalize downstream and export industries (like the food
processors) and the Filipino consumer. The high cost of food impacts on the
cost of labor which, in turn, impacts on the country’s competitiveness. With
respect to the export industries, these have proven potential in the world market.
However, the high cost of refined sugar is certainly a factor in the decline in
export competitiveness of sugar confectioneries and preserved fruits and nuts
during the past three (3) years. This suggests that the country may lose potential
export niches. How many other export industries were prevented from emerging
due to the high cost of sugar?
➲ Providing competition in the market – Since government policy on
sugar has produced unintended outcomes to the detriment of a large
sector of the economy, then a modification of policy would seem to be in
order. Competition policy would help greatly with respect to providing
direction in freeing the market and allowing the interplay of market forces.
Permitting competition among the industry players and allowing further
competitive pressure from imports would provide the incentive for striving
towards higher efficiency levels and world competitiveness.17
➲ Reviewing the mandate of the Sugar Regulatory Administration -
Consistent with this, the SRA’s mandate should be reviewed. With a
national competition policy in place, the role of the SRA would have to be
assessed within the framework of encouraging greater competition within
the market. What is required in these times is a responsive bureaucracy.
The government should apply competition policy to its own activities and
17 Competition policy would have to be supported by an integrated package of reforms. Industry sources
cite the following problems, among others: poor infrastructure leading to high transport costs, inadequate irrigation, insufficient funds for research and development, outdated production sharing system, lack of countryside credit, the adverse effects of CARL.
36
devolve certain services that it currently performs to the more efficient
private sector.
➲ “Save-Us-Save-Yourselves” – This should be the lobbying cry of
domestic industrial users of refined sugar. Both the refined sugar and
domestic food processing industries can utilize competition policy to
improve their respective sectors. An efficient sugar industry can support a
highly developed food processing industry. Instead of working against
each other, both industries should work together in lobbying the
government for reforms to make the sugar industry competitive. The
competitiveness of the sugar industry will translate into competitiveness
for the food processing industry. The objective is to develop
competitiveness not extend protectionism.
An advocacy group, whether composed of members of the industries or
independently contracted professional lobbyists, is vital in order to ensure
the passage of executive and/or legislative measures designed to assist
both sectors in developing and/or improving their competitiveness, to rally
members of the industries into active participation, and to raise public
awareness and support for the industries.
! Temporary and/or Additional Measures
The effects of competition policy will not necessarily be immediate. Pending the
same, temporary and/or additional measures may be taken:
➲ Consolidation of B1 Requirements – The B1 quota category, which
is also for the domestic market but may be withdrawn from storage only
after 120 days, are available for the use of food processors and other
industrial domestic consumers. According to an industry source, the
37
problem on the supply side is that the millers/traders do not have the
resources to deliver the individual orders of each industrial consumer.
Industrial consumers should therefore organize their own centralized
distribution network where their sugar orders may be placed and
consolidated with other orders. All orders will be delivered to the
distribution network office, which will then make the deliveries to the
individual industrial consumer or groups of industrial consumers.
➲ Milling Waste Products as Income Source – Bagasse, which is
sugar cane residue, can be made into paper and boards of various
grades, including fine writing and printing papers. The paper industry is
looking for other sources of fiber for making paper. Selling bagasse to the
paper industry can be a major source of funds for financing the
modernization of the sugar industry as well as an economical and
environmentally sound way to dispose of milling waste products.
In fine, the urgency for the sugar industry to gain even domestic competitiveness is
highlighted by the reduction and probable disappearance of the U.S. sugar quota with
the implementation of the NAFTA. Without a sure source of income, the sugar industry
must look closer to home to sustain and develop itself. The most logical and profitable
way is to supply the domestic market at competitive prices. To charge uncompetitive
prices would undoubtedly be self-destructive, for to bleed to death the domestic food
processing industry is to ultimately kill the sugar industry as well.
Competition policy could play a key role in ensuring that not only this objective is
realized but also the national goal of attaining sustainable economic development
through the strengthening of exports.
38
SUGAR CANE (1212.92 00)
MFN 20% (1998) 15% (1999) 10% (2000)
CEPT 15%
RAW CANE SUGAR (1701.11)
MFN 50% (In-Quota)
80% (1998 Out-Quota) 65% (1999-2000)
ASEAN 65%
CANE MOLASSES
(1703.10 00) MFN
10% (1998-1999) 7% (2000)
CEPT 10%
REFINED CANE SUGAR (1701.99)
MFN 50% (In-Quota)
80% (1998 Out-Quota) 65% (1999-2000)
ASEAN 65%
MSG (2922.42 10)
MFN 20% (1998) 15% (1999) 10% (2000)
ASEAN 20%
Liquor (22.08) MFN
20% (1998-1999) 15% (2000)
CEPT 15%
Cattle for Slaughter
(0102.90 00) MFN 3%
ASEAN Excluded
Sugar Confectioneries
(17.04) MFN
20/10% (1998-1999) 15/7% (2000)
CEPT 15%
Sugar Preparations (18.06) MFN
3/20/10% (1998-1999) 3/10/15/7% (2000)
CEPT 3/15/10% ASEAN
10%
Pastry, Cakes, Biscuits & Other Baker’s Wares
(19.05) MFN
20% (1998-1999) 15% (2000)
ASEAN 20% 1905.10 00
Beverages (22.02) MFN
20% (1998) 20/15/10% (1999)
15/10% (2000) CEPT 10%
Preserved Fruits and Nuts
(20.06/ 20.07/ 20.08) MFN
3/20/10% (1998) 20/15/10/3% (1999) 15/10/7/3% (2000)
CEPT 15/10%/Excluded
ASEAN 20%
Source: Tariff Commission
July 1999
REFINED SUGAR INDUSTRY
1. The Relevant Market
! 3 Major Grades of Refined Sugar: (a) standard refined - used primarily as table sugar; (b) premium sugar - used by food manufacturers; and (c) bottlers grade - used by the beverage industry.
! Linkage Chart: Flow of commodities from the sugar industry to user industries
(see Figure 1). ! The Relevant Market: Product Market - locally-produced refined sugar.
Importation of refined sugar is restricted and users do not have the option to just switch to imported sugar. Geographic Market - the Philippine national territory. Participants in the Market – 36 sugar mills (see Table 1). Sugar industry associations - Philippine Sugar Millers Association, Philippine Sugar Refiners Institute, Sugar Industry Foundation Inc., the National Congress of Unions in the Sugar Industry of the Philippines, and the Philippine Association of Sugar Refineries, Inc.
Table 1. List of Sugar Mills
Sugar Mills Rated Capacity (50k-bags/day)
Plant Site
LUZON BASECOM, INC. 4,000 San Fernando, Pampanga Batangas Sugar Central, Inc. 5,500 Balayan, Batangas Cagayan Robina Sugar Milling, Co. 4,000 Piat, Cagayan Central Azucarera Don Pedro 10,000 Nasugbu, Batangas Hind Sugar Company 500 Manaoag, Pangasinan Peñafrancia Sugar Mill 4,000 Pili, Camarines Sur Central Azucarera de Tarlac 7,080 San Miguel, Tarlac Western Agri-Ventures Corporation 1,200 Paniqui, Tarlac VISAYAS / MINDANAO Central Azucarera de Bais 8,000 Bais, Negros Oriental Bogo-Medellin Milling Co., Inc. 2,800 Medellin, Cebu Busco Sugar Milling Company, Inc. 10,000 Quezon, Bukidnon Crystal Sugar Company, Inc. 4,500 Maramag, Bukidnon Davao Sugar Central Company, Inc. 4,000 Hagonoy, Davao del Sur Durano III & Sons, Inc. 2,000 Danao City, Cebu Hideco Sugar Milling Co., Inc. 5,000 Kananga, Leyte Ormoc Sugar Co., Inc. 2,000 Ormoc City, Leyte Universal Robina Sugar 8,000 Manjuyod, Negros Occidental South East Asia Sugar Mill Corp. 4,000 Matalam, North Cotabato Herminio Teves & Co., Inc. 3,000 Sta. Catalina, Negros Oriental PANAY Capiz Sugar Central, Inc. 3,500 President Roxas, Capiz Monomer Sugar Central, Inc. 2,500 Dumalag, Capiz New Frontier Sugar Corp. 4,200 Passi, Iloilo Passi (Iloilo) Sugar Central, Inc. 5,000 San Enrique, Iloilo NEGROS Binalbagan-Isabela Sugar Co., Inc. 10,000 Binalbagan, Negros Occidental
Date: July1999
2
Dacongcogon Producers' Coop. Mktg., Inc.
2,200 Kabankalan, Negros Occidental
Danao Development Corp. 3,000 Toboso, Negros Occidental First Farmers Holding Corp. 5,000 Talisay, Negros Occidental Hawaiian-Philippine Co. 6,500 Negros Occidental Central Azucarera de La Carlota 10,000 La Carlota City, Negros
Occidental Lopez Sugar Corp. 6,000 Sagay, Negros Occidental Ma-ao Sugar Central 5,000 Bago City, Negros Occidental Sagay Central, Inc. 3,000 Sagay, Negros Occidental San Carlos Milling Co., Inc. 4,800 San Carlos City, Negros
Occidental Southern Negros Development Corp. 4,000 Kabankalan, Negros Occidental Sunnix Management Corp. 4,000 Silay City, Negros Occidental Victorias Milling Co. 12,000 Victorias, Negros Occidental
Source: Sugar Regulatory Administration
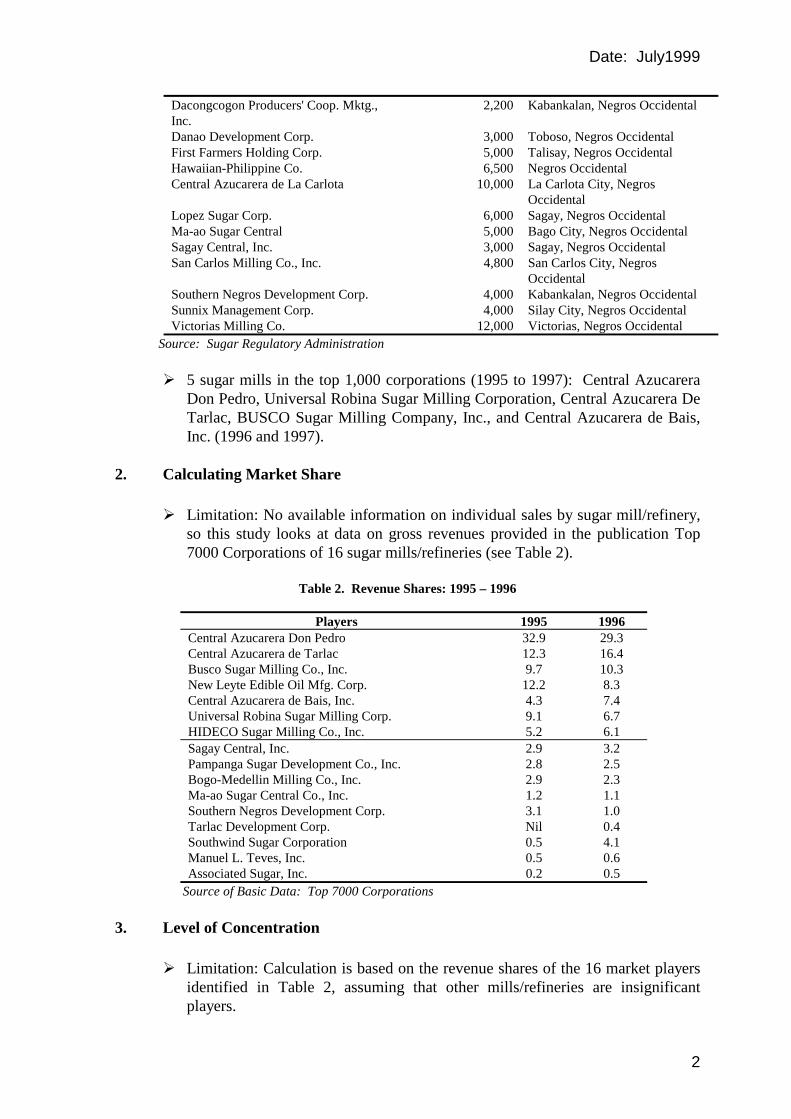
! 5 sugar mills in the top 1,000 corporations (1995 to 1997): Central Azucarera Don Pedro, Universal Robina Sugar Milling Corporation, Central Azucarera De Tarlac, BUSCO Sugar Milling Company, Inc., and Central Azucarera de Bais, Inc. (1996 and 1997).
2. Calculating Market Share
! Limitation: No available information on individual sales by sugar mill/refinery, so this study looks at data on gross revenues provided in the publication Top 7000 Corporations of 16 sugar mills/refineries (see Table 2).
Table 2. Revenue Shares: 1995 – 1996
Players 1995 1996
Central Azucarera Don Pedro 32.9 29.3 Central Azucarera de Tarlac 12.3 16.4 Busco Sugar Milling Co., Inc. 9.7 10.3 New Leyte Edible Oil Mfg. Corp. 12.2 8.3 Central Azucarera de Bais, Inc. 4.3 7.4 Universal Robina Sugar Milling Corp. 9.1 6.7 HIDECO Sugar Milling Co., Inc. 5.2 6.1 Sagay Central, Inc. 2.9 3.2 Pampanga Sugar Development Co., Inc. 2.8 2.5 Bogo-Medellin Milling Co., Inc. 2.9 2.3 Ma-ao Sugar Central Co., Inc. 1.2 1.1 Southern Negros Development Corp. 3.1 1.0 Tarlac Development Corp. Nil 0.4 Southwind Sugar Corporation 0.5 4.1 Manuel L. Teves, Inc. 0.5 0.6 Associated Sugar, Inc. 0.2 0.5
Source of Basic Data: Top 7000 Corporations 3. Level of Concentration
! Limitation: Calculation is based on the revenue shares of the 16 market players identified in Table 2, assuming that other mills/refineries are insignificant players.
Date: July1999
3
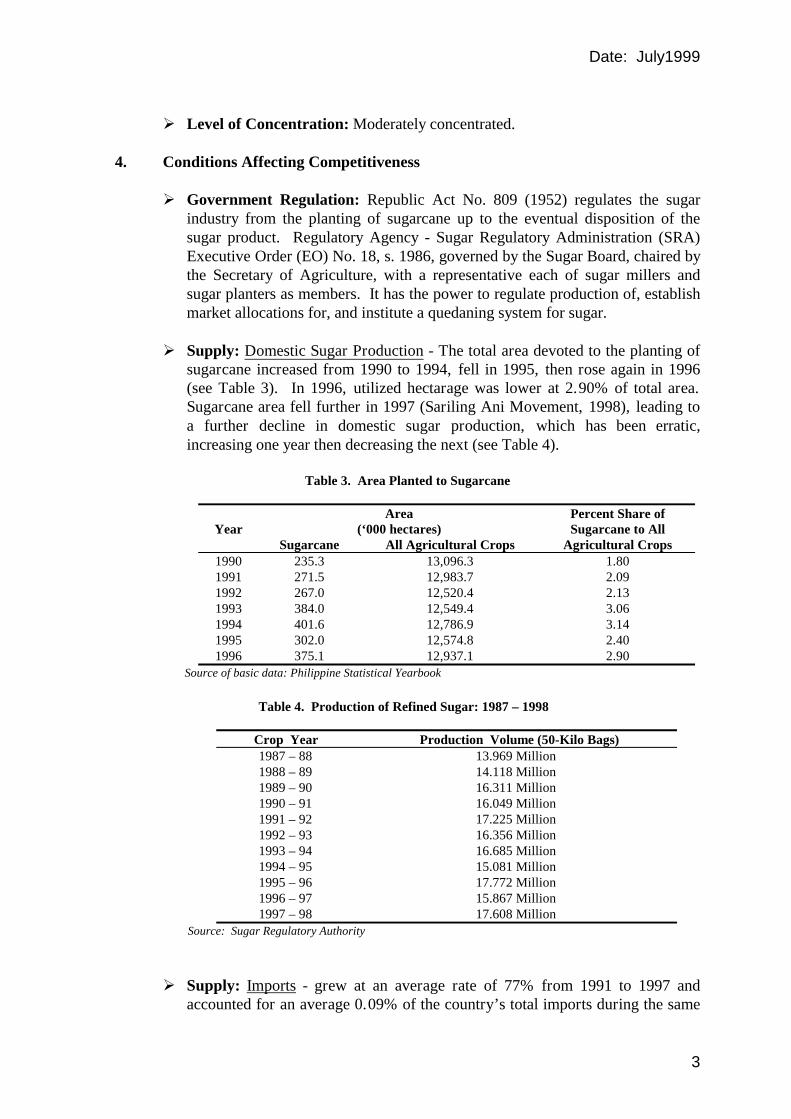
! Level of Concentration: Moderately concentrated.
4. Conditions Affecting Competitiveness
! Government Regulation: Republic Act No. 809 (1952) regulates the sugar industry from the planting of sugarcane up to the eventual disposition of the sugar product. Regulatory Agency - Sugar Regulatory Administration (SRA) Executive Order (EO) No. 18, s. 1986, governed by the Sugar Board, chaired by the Secretary of Agriculture, with a representative each of sugar millers and sugar planters as members. It has the power to regulate production of, establish market allocations for, and institute a quedaning system for sugar.
! Supply: Domestic Sugar Production - The total area devoted to the planting of
sugarcane increased from 1990 to 1994, fell in 1995, then rose again in 1996 (see Table 3). In 1996, utilized hectarage was lower at 2.90% of total area. Sugarcane area fell further in 1997 (Sariling Ani Movement, 1998), leading to a further decline in domestic sugar production, which has been erratic, increasing one year then decreasing the next (see Table 4).
Table 3. Area Planted to Sugarcane
Year Area
(‘000 hectares) Percent Share of Sugarcane to All
Sugarcane All Agricultural Crops Agricultural Crops 1990 235.3 13,096.3 1.80 1991 271.5 12,983.7 2.09 1992 267.0 12,520.4 2.13 1993 384.0 12,549.4 3.06 1994 401.6 12,786.9 3.14 1995 302.0 12,574.8 2.40 1996 375.1 12,937.1 2.90
Source of basic data: Philippine Statistical Yearbook
Table 4. Production of Refined Sugar: 1987 – 1998
Crop Year Production Volume (50-Kilo Bags) 1987 – 88 13.969 Million 1988 – 89 14.118 Million 1989 – 90 16.311 Million 1990 – 91 16.049 Million 1991 – 92 17.225 Million 1992 – 93 16.356 Million 1993 – 94 16.685 Million 1994 – 95 15.081 Million 1995 – 96 17.772 Million 1996 – 97 15.867 Million 1997 – 98 17.608 Million
Source: Sugar Regulatory Authority
! Supply: Imports - grew at an average rate of 77% from 1991 to 1997 and
accounted for an average 0.09% of the country’s total imports during the same
Date: July1999
4
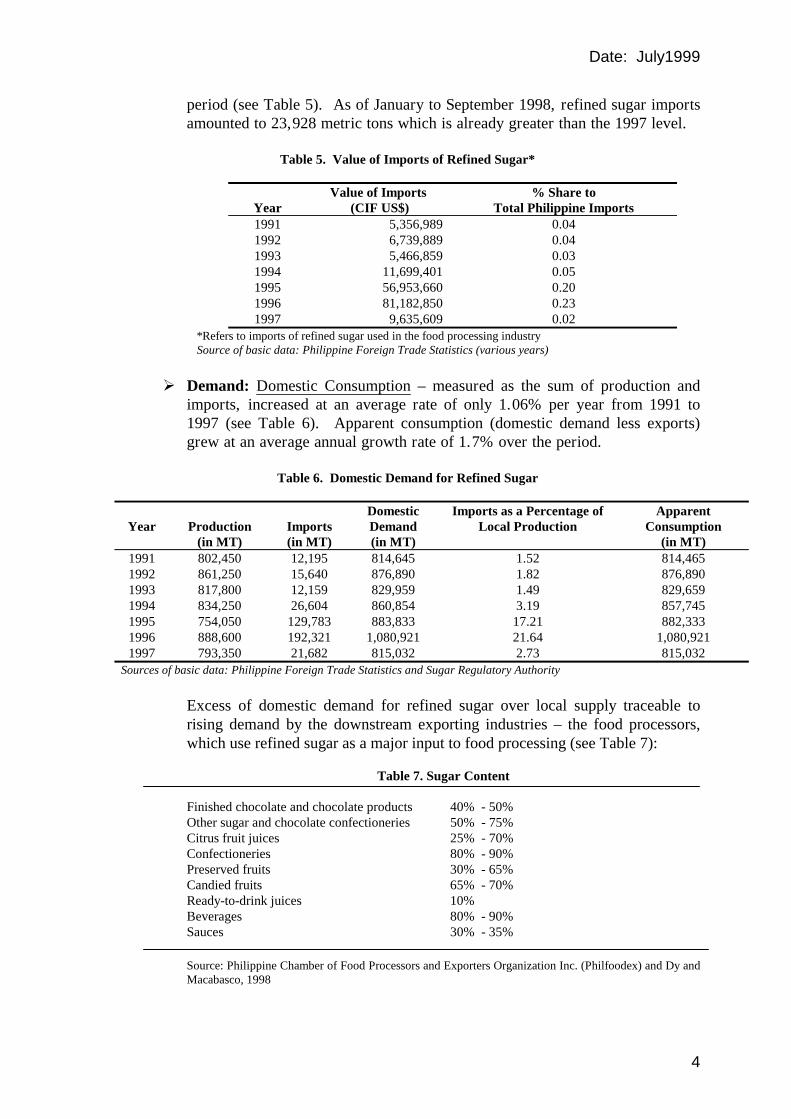
period (see Table 5). As of January to September 1998, refined sugar imports amounted to 23,928 metric tons which is already greater than the 1997 level.
Table 5. Value of Imports of Refined Sugar*
Year Value of Imports
(CIF US$) % Share to
Total Philippine Imports 1991 5,356,989 0.04 1992 6,739,889 0.04 1993 5,466,859 0.03 1994 11,699,401 0.05 1995 56,953,660 0.20 1996 81,182,850 0.23 1997 9,635,609 0.02
*Refers to imports of refined sugar used in the food processing industry Source of basic data: Philippine Foreign Trade Statistics (various years)
! Demand: Domestic Consumption – measured as the sum of production and imports, increased at an average rate of only 1.06% per year from 1991 to 1997 (see Table 6). Apparent consumption (domestic demand less exports) grew at an average annual growth rate of 1.7% over the period.
Table 6. Domestic Demand for Refined Sugar
Year
Production
(in MT)
Imports (in MT)
Domestic Demand (in MT)
Imports as a Percentage of Local Production
Apparent Consumption
(in MT) 1991 802,450 12,195 814,645 1.52 814,465 1992 861,250 15,640 876,890 1.82 876,890 1993 817,800 12,159 829,959 1.49 829,659 1994 834,250 26,604 860,854 3.19 857,745 1995 754,050 129,783 883,833 17.21 882,333 1996 888,600 192,321 1,080,921 21.64 1,080,921 1997 793,350 21,682 815,032 2.73 815,032
Sources of basic data: Philippine Foreign Trade Statistics and Sugar Regulatory Authority
Excess of domestic demand for refined sugar over local supply traceable to rising demand by the downstream exporting industries – the food processors, which use refined sugar as a major input to food processing (see Table 7):
Table 7. Sugar Content
Finished chocolate and chocolate products 40% - 50% Other sugar and chocolate confectioneries 50% - 75% Citrus fruit juices 25% - 70% Confectioneries 80% - 90% Preserved fruits 30% - 65% Candied fruits 65% - 70% Ready-to-drink juices 10% Beverages 80% - 90% Sauces 30% - 35%
Source: Philippine Chamber of Food Processors and Exporters Organization Inc. (Philfoodex) and Dy and Macabasco, 1998
Date: July1999
5
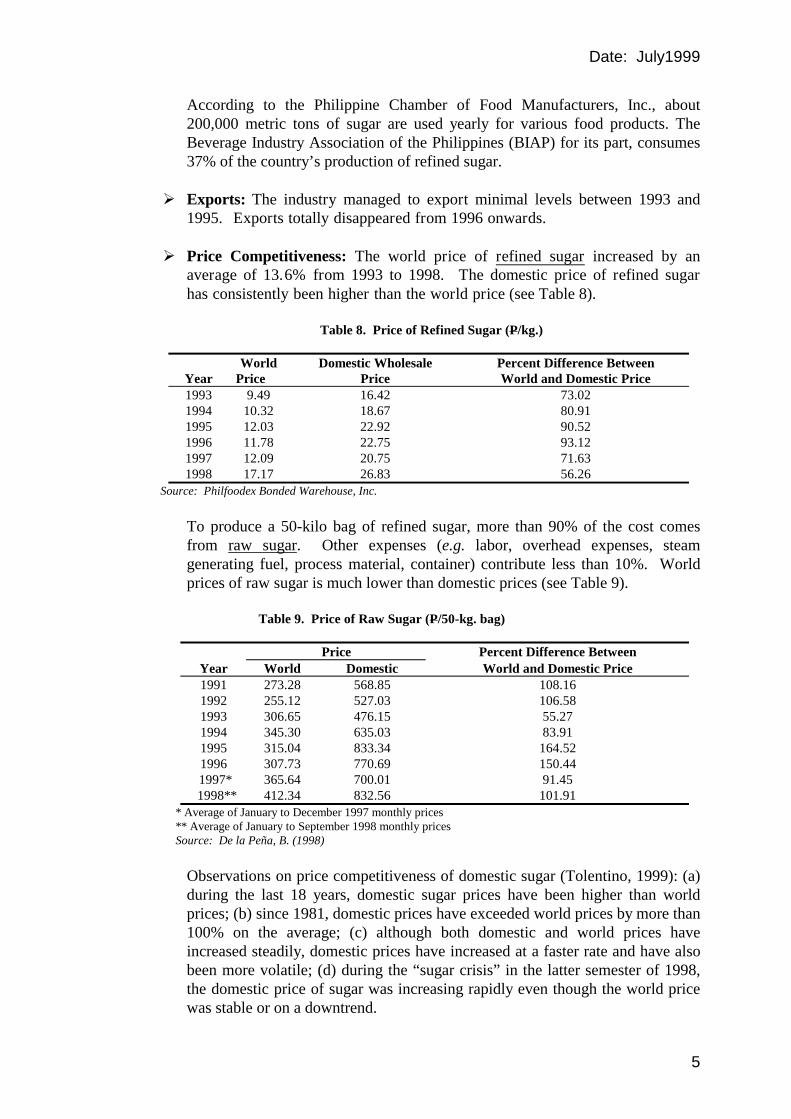
According to the Philippine Chamber of Food Manufacturers, Inc., about 200,000 metric tons of sugar are used yearly for various food products. The Beverage Industry Association of the Philippines (BIAP) for its part, consumes 37% of the country’s production of refined sugar.
! Exports: The industry managed to export minimal levels between 1993 and
1995. Exports totally disappeared from 1996 onwards.
! Price Competitiveness: The world price of refined sugar increased by an average of 13.6% from 1993 to 1998. The domestic price of refined sugar has consistently been higher than the world price (see Table 8).
Table 8. Price of Refined Sugar (P/kg.)
World Domestic Wholesale Percent Difference Between
Year Price Price World and Domestic Price 1993 9.49 16.42 73.02 1994 10.32 18.67 80.91 1995 12.03 22.92 90.52 1996 11.78 22.75 93.12 1997 12.09 20.75 71.63 1998 17.17 26.83 56.26
Source: Philfoodex Bonded Warehouse, Inc.
To produce a 50-kilo bag of refined sugar, more than 90% of the cost comes from raw sugar. Other expenses (e.g. labor, overhead expenses, steam generating fuel, process material, container) contribute less than 10%. World prices of raw sugar is much lower than domestic prices (see Table 9).
Table 9. Price of Raw Sugar (P/50-kg. bag)
Price Percent Difference Between Year World Domestic World and Domestic Price 1991 273.28 568.85 108.16 1992 255.12 527.03 106.58 1993 306.65 476.15 55.27 1994 345.30 635.03 83.91 1995 315.04 833.34 164.52 1996 307.73 770.69 150.44
1997* 365.64 700.01 91.45 1998** 412.34 832.56 101.91
* Average of January to December 1997 monthly prices ** Average of January to September 1998 monthly prices Source: De la Peña, B. (1998)
Observations on price competitiveness of domestic sugar (Tolentino, 1999): (a) during the last 18 years, domestic sugar prices have been higher than world prices; (b) since 1981, domestic prices have exceeded world prices by more than 100% on the average; (c) although both domestic and world prices have increased steadily, domestic prices have increased at a faster rate and have also been more volatile; (d) during the “sugar crisis” in the latter semester of 1998, the domestic price of sugar was increasing rapidly even though the world price was stable or on a downtrend.
Date: July1999
6
5. Entry Analysis
! Financial Considerations: Huge capital outlay required to enter the industry. Based on SRA estimates, current market players have invested approximately P160 billion: P80 billion on sugar farms, P50 billion on mills, and P30 billion on refineries.
! Excess Milling and Refining Capacity: Caused by the fragmentation of
sugarlands under the Comprehensive Agrarian Reform Law (R.A. 6657) and declining sugar productivity in terms of hectarage and piculs per tons cane or sugar yields.
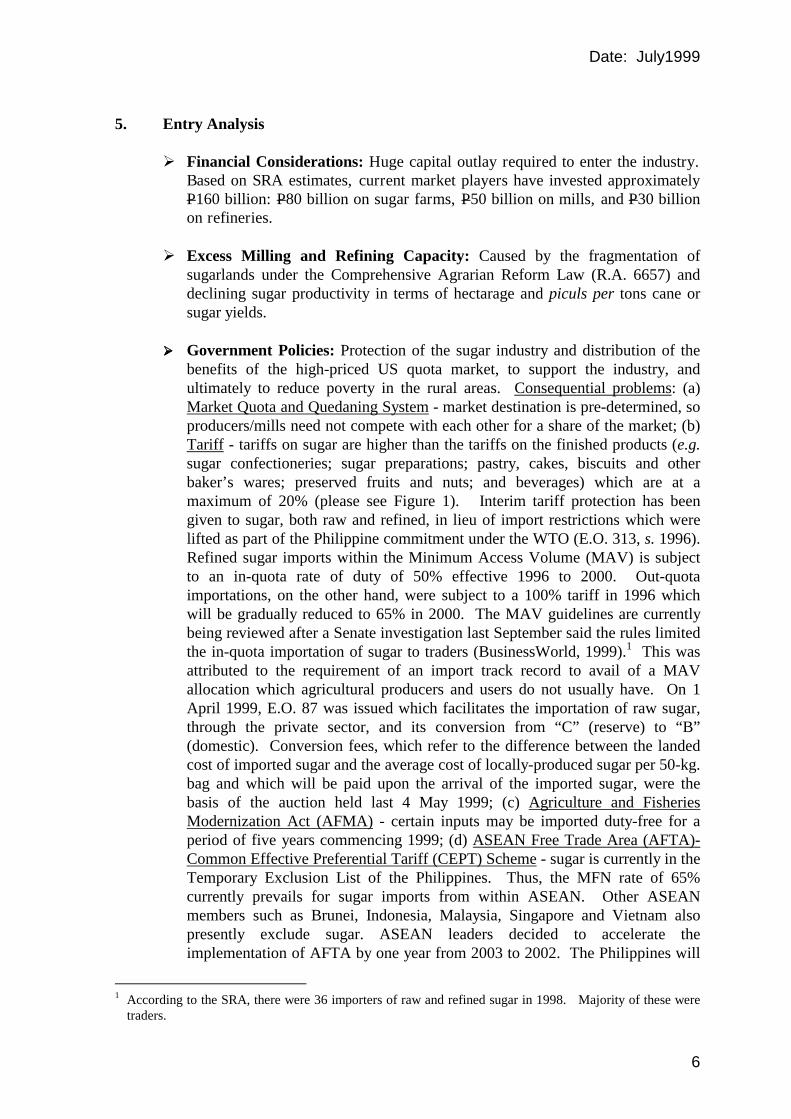
!!!! Government Policies: Protection of the sugar industry and distribution of the
benefits of the high-priced US quota market, to support the industry, and ultimately to reduce poverty in the rural areas. Consequential problems: (a) Market Quota and Quedaning System - market destination is pre-determined, so producers/mills need not compete with each other for a share of the market; (b) Tariff - tariffs on sugar are higher than the tariffs on the finished products (e.g. sugar confectioneries; sugar preparations; pastry, cakes, biscuits and other baker’s wares; preserved fruits and nuts; and beverages) which are at a maximum of 20% (please see Figure 1). Interim tariff protection has been given to sugar, both raw and refined, in lieu of import restrictions which were lifted as part of the Philippine commitment under the WTO (E.O. 313, s. 1996). Refined sugar imports within the Minimum Access Volume (MAV) is subject to an in-quota rate of duty of 50% effective 1996 to 2000. Out-quota importations, on the other hand, were subject to a 100% tariff in 1996 which will be gradually reduced to 65% in 2000. The MAV guidelines are currently being reviewed after a Senate investigation last September said the rules limited the in-quota importation of sugar to traders (BusinessWorld, 1999).1 This was attributed to the requirement of an import track record to avail of a MAV allocation which agricultural producers and users do not usually have. On 1 April 1999, E.O. 87 was issued which facilitates the importation of raw sugar, through the private sector, and its conversion from “C” (reserve) to “B” (domestic). Conversion fees, which refer to the difference between the landed cost of imported sugar and the average cost of locally-produced sugar per 50-kg. bag and which will be paid upon the arrival of the imported sugar, were the basis of the auction held last 4 May 1999; (c) Agriculture and Fisheries Modernization Act (AFMA) - certain inputs may be imported duty-free for a period of five years commencing 1999; (d) ASEAN Free Trade Area (AFTA)-Common Effective Preferential Tariff (CEPT) Scheme - sugar is currently in the Temporary Exclusion List of the Philippines. Thus, the MFN rate of 65% currently prevails for sugar imports from within ASEAN. Other ASEAN members such as Brunei, Indonesia, Malaysia, Singapore and Vietnam also presently exclude sugar. ASEAN leaders decided to accelerate the implementation of AFTA by one year from 2003 to 2002. The Philippines will
1 According to the SRA, there were 36 importers of raw and refined sugar in 1998. Majority of these were
traders.
Date: July1999
7
likely exercise the flexibility option and sugar will be phased into the Scheme by 2003 at a CEPT rate of 5%; (e) WTO - To reach the 50% target by 2004, reductions must be implemented in 1997 and 2000. Thus, from 100% in 1996, the out-quota rate of duty on refined sugar was reduced to 80% in 1997 and further to 65% in 1999 and 2000; and (f) Asia Pacific Economic Cooperation (APEC), the goal is zero tariffs in 2010 and 2020 for developed and developing countries, respectively.
!!!! Import Restrictions: Under Central Bank Circular 850, the importation of
refined sugar was liberalized effective 15 February 1982. In reality, the SRA continues to exercise regulatory powers by way of monitoring sugar imports2, imposing monitoring fees3, and prescribing administrative procedures if the imported sugar is not used in food processing.
6. Assessment of Industry Performance
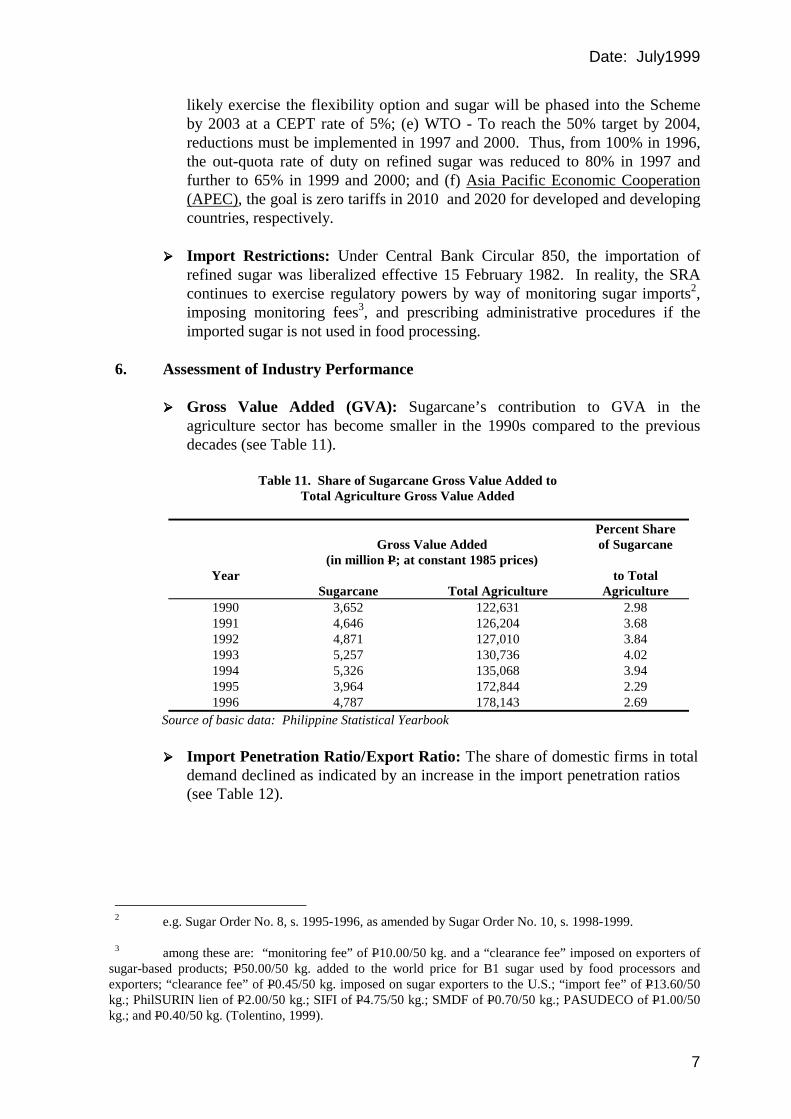
!!!! Gross Value Added (GVA): Sugarcane’s contribution to GVA in the agriculture sector has become smaller in the 1990s compared to the previous decades (see Table 11).
Table 11. Share of Sugarcane Gross Value Added to
Total Agriculture Gross Value Added
Gross Value Added
(in million P; at constant 1985 prices)
Percent Share of Sugarcane
Year Sugarcane
Total Agriculture
to Total Agriculture
1990 3,652 122,631 2.98 1991 4,646 126,204 3.68 1992 4,871 127,010 3.84 1993 5,257 130,736 4.02 1994 5,326 135,068 3.94 1995 3,964 172,844 2.29 1996 4,787 178,143 2.69
Source of basic data: Philippine Statistical Yearbook
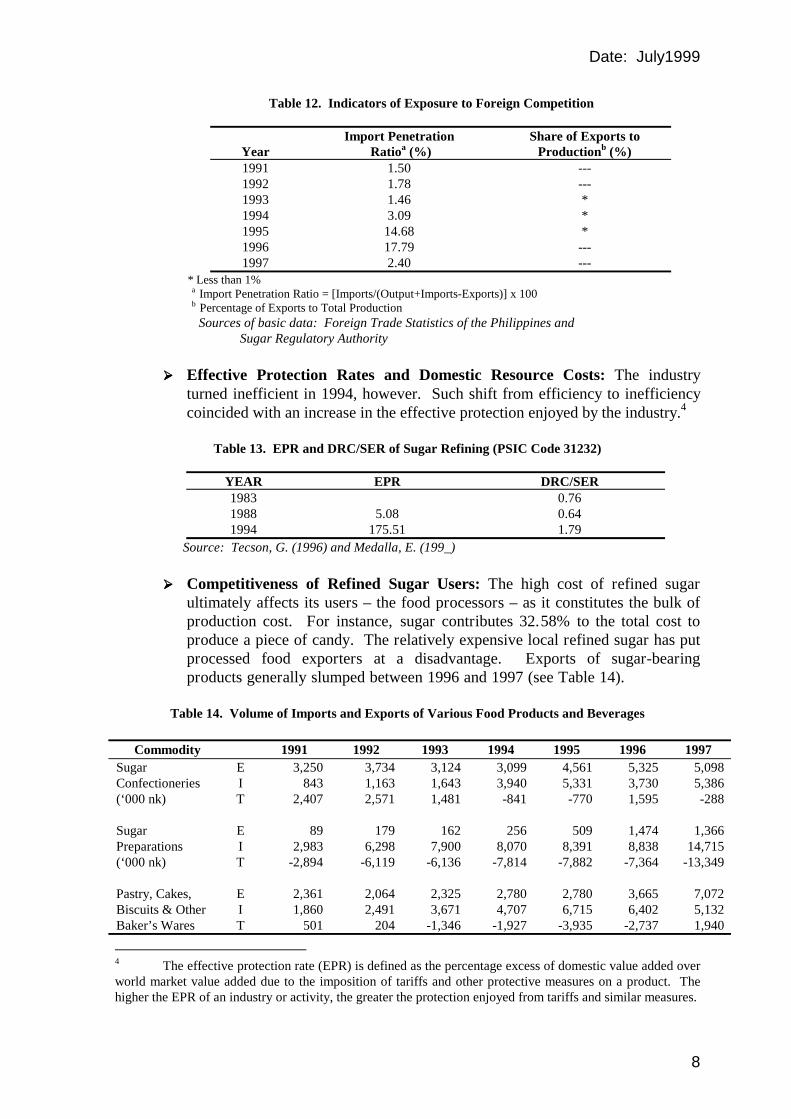
!!!! Import Penetration Ratio/Export Ratio: The share of domestic firms in total demand declined as indicated by an increase in the import penetration ratios (see Table 12).
2 e.g. Sugar Order No. 8, s. 1995-1996, as amended by Sugar Order No. 10, s. 1998-1999. 3 among these are: “monitoring fee” of P10.00/50 kg. and a “clearance fee” imposed on exporters of
sugar-based products; P50.00/50 kg. added to the world price for B1 sugar used by food processors and exporters; “clearance fee” of P0.45/50 kg. imposed on sugar exporters to the U.S.; “import fee” of P13.60/50 kg.; PhilSURIN lien of P2.00/50 kg.; SIFI of P4.75/50 kg.; SMDF of P0.70/50 kg.; PASUDECO of P1.00/50 kg.; and P0.40/50 kg. (Tolentino, 1999).
Date: July1999
8
Table 12. Indicators of Exposure to Foreign Competition
Year
Import Penetration Ratioa (%)
Share of Exports to Productionb (%)
1991 1.50 --- 1992 1.78 --- 1993 1.46 * 1994 3.09 * 1995 14.68 * 1996 17.79 --- 1997 2.40 ---
* Less than 1% a Import Penetration Ratio = [Imports/(Output+Imports-Exports)] x 100 b Percentage of Exports to Total Production Sources of basic data: Foreign Trade Statistics of the Philippines and
Sugar Regulatory Authority
!!!! Effective Protection Rates and Domestic Resource Costs: The industry turned inefficient in 1994, however. Such shift from efficiency to inefficiency coincided with an increase in the effective protection enjoyed by the industry.4
Table 13. EPR and DRC/SER of Sugar Refining (PSIC Code 31232)
YEAR EPR DRC/SER 1983 0.76 1988 5.08 0.64 1994 175.51 1.79
Source: Tecson, G. (1996) and Medalla, E. (199_)
!!!! Competitiveness of Refined Sugar Users: The high cost of refined sugar ultimately affects its users – the food processors – as it constitutes the bulk of production cost. For instance, sugar contributes 32.58% to the total cost to produce a piece of candy. The relatively expensive local refined sugar has put processed food exporters at a disadvantage. Exports of sugar-bearing products generally slumped between 1996 and 1997 (see Table 14).
Table 14. Volume of Imports and Exports of Various Food Products and Beverages
Commodity 1991 1992 1993 1994 1995 1996 1997
Sugar E 3,250 3,734 3,124 3,099 4,561 5,325 5,098 Confectioneries I 843 1,163 1,643 3,940 5,331 3,730 5,386 (‘000 nk) T 2,407 2,571 1,481 -841 -770 1,595 -288 Sugar E 89 179 162 256 509 1,474 1,366 Preparations I 2,983 6,298 7,900 8,070 8,391 8,838 14,715 (‘000 nk) T -2,894 -6,119 -6,136 -7,814 -7,882 -7,364 -13,349 Pastry, Cakes, E 2,361 2,064 2,325 2,780 2,780 3,665 7,072 Biscuits & Other I 1,860 2,491 3,671 4,707 6,715 6,402 5,132 Baker’s Wares T 501 204 -1,346 -1,927 -3,935 -2,737 1,940
4 The effective protection rate (EPR) is defined as the percentage excess of domestic value added over world market value added due to the imposition of tariffs and other protective measures on a product. The higher the EPR of an industry or activity, the greater the protection enjoyed from tariffs and similar measures.
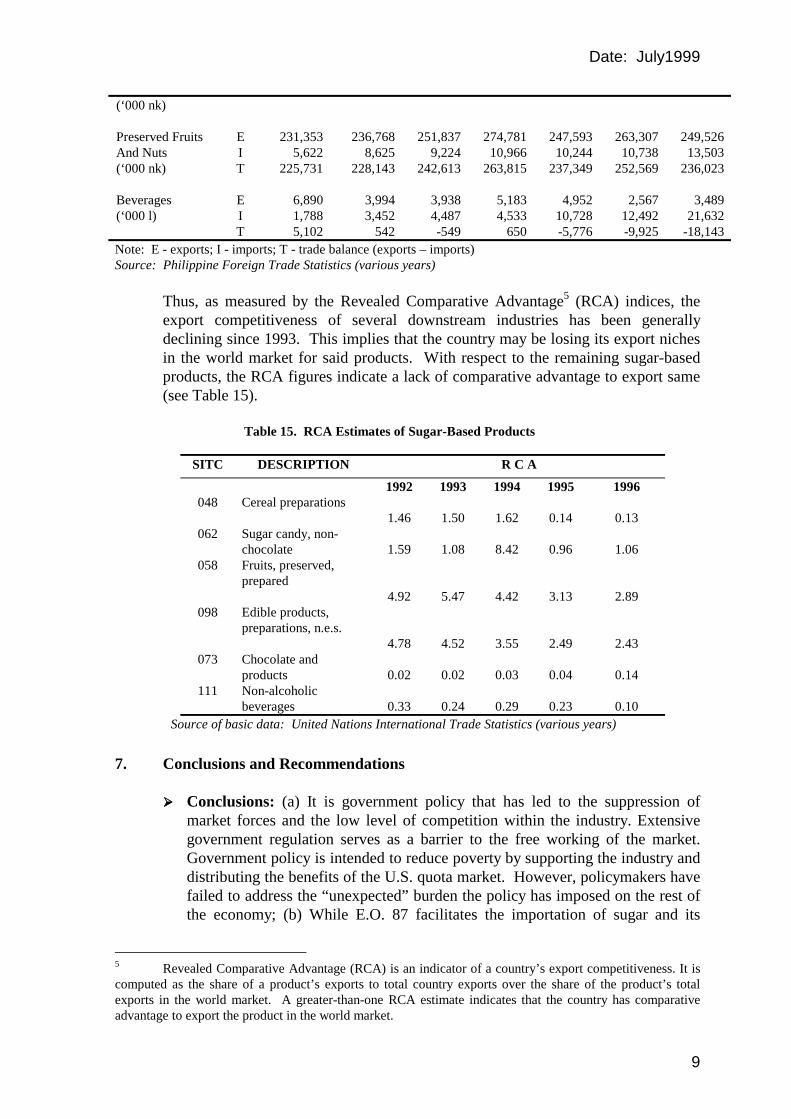
Date: July1999
9
(‘000 nk) Preserved Fruits E 231,353 236,768 251,837 274,781 247,593 263,307 249,526 And Nuts I 5,622 8,625 9,224 10,966 10,244 10,738 13,503 (‘000 nk) T 225,731 228,143 242,613 263,815 237,349 252,569 236,023 Beverages E 6,890 3,994 3,938 5,183 4,952 2,567 3,489 (‘000 l) I 1,788 3,452 4,487 4,533 10,728 12,492 21,632 T 5,102 542 -549 650 -5,776 -9,925 -18,143 Note: E - exports; I - imports; T - trade balance (exports – imports) Source: Philippine Foreign Trade Statistics (various years)
Thus, as measured by the Revealed Comparative Advantage5 (RCA) indices, the export competitiveness of several downstream industries has been generally declining since 1993. This implies that the country may be losing its export niches in the world market for said products. With respect to the remaining sugar-based products, the RCA figures indicate a lack of comparative advantage to export same (see Table 15).
Table 15. RCA Estimates of Sugar-Based Products
SITC DESCRIPTION R C A
1992 1993 1994 1995 1996 048 Cereal preparations
1.46
1.50
1.62
0.14
0.13 062 Sugar candy, non-
chocolate
1.59
1.08
8.42
0.96
1.06 058 Fruits, preserved,
prepared
4.92
5.47
4.42
3.13
2.89 098 Edible products,
preparations, n.e.s.
4.78
4.52
3.55
2.49
2.43 073 Chocolate and
products
0.02
0.02
0.03
0.04
0.14 111 Non-alcoholic
beverages
0.33
0.24
0.29
0.23
0.10 Source of basic data: United Nations International Trade Statistics (various years)
7. Conclusions and Recommendations
!!!! Conclusions: (a) It is government policy that has led to the suppression of market forces and the low level of competition within the industry. Extensive government regulation serves as a barrier to the free working of the market. Government policy is intended to reduce poverty by supporting the industry and distributing the benefits of the U.S. quota market. However, policymakers have failed to address the “unexpected” burden the policy has imposed on the rest of the economy; (b) While E.O. 87 facilitates the importation of sugar and its
5 Revealed Comparative Advantage (RCA) is an indicator of a country’s export competitiveness. It is computed as the share of a product’s exports to total country exports over the share of the product’s total exports in the world market. A greater-than-one RCA estimate indicates that the country has comparative advantage to export the product in the world market.
Date: July1999
10
conversion from “C” to “B,” a new tax on imports has effectively been imposed. According to some sources, the conversion fee paid by the bidders during the 4 May auction would add P8/kilo to the price of sugar currently pegged at P21/kilo (Philippine Daily Inquirer, 1999); (c) Tariffs and import restrictions allow incumbents to “entrench” themselves; (d) hey can also discourage entry if they Sugar producers/millers/refiners form a well-organized group willing to pay the costs of ensuring that their interests remain protected and the government incentives they have long enjoyed stay. In contrast, consumers are scattered, the awareness level with respect to the burden from high local sugar prices is low, so an effective counterforce to the sugar-producing group that can influence policy does not exist; (e) With market quota allocation and quedaning system., market destination is pre-determined, so producers/mills need not compete with each other for a share of the market; (f) The inefficiencies of the sugar industry, graphically illustrated by high domestic prices for sugar, penalize downstream and export industries (like the food processors) and the Filipino consumer. The high cost of food impacts on the cost of labor which, in turn, impacts on the country’s competitiveness.
!!!! Recommendations: (a) A modification of government policy is in order.
Competition policy would help greatly with respect to providing direction in freeing the market and allowing the interplay of market forces. Permitting competition among the industry players and allowing further competitive pressure from imports would provide the incentive for striving towards higher efficiency levels and world competitiveness;6 (b) The SRA’s mandate should be reviewed. With a national competition policy in place, the role of the SRA would have to be assessed within the framework of encouraging greater competition within the market; and (c) The uncompetitive sugar industry is bound to self-destruct considering the decline and probable disappearance of the U.S. sugar quota with the implementation of the North American Free Trade Agreement (NAFTA). Thus, it becomes imperative that government take steps now to develop the competitiveness of the industry through a sound competition policy.
sugar-sum/phlxprt-taps5
6 Competition policy would have to be supported by an integrated package of reforms. Industry sources cite the following problems, among others: poor infrastructure leading to high transport costs, inadequate irrigation, insufficient funds for research and development, outdated production sharing system, lack of countryside credit, the adverse effects of CARL.
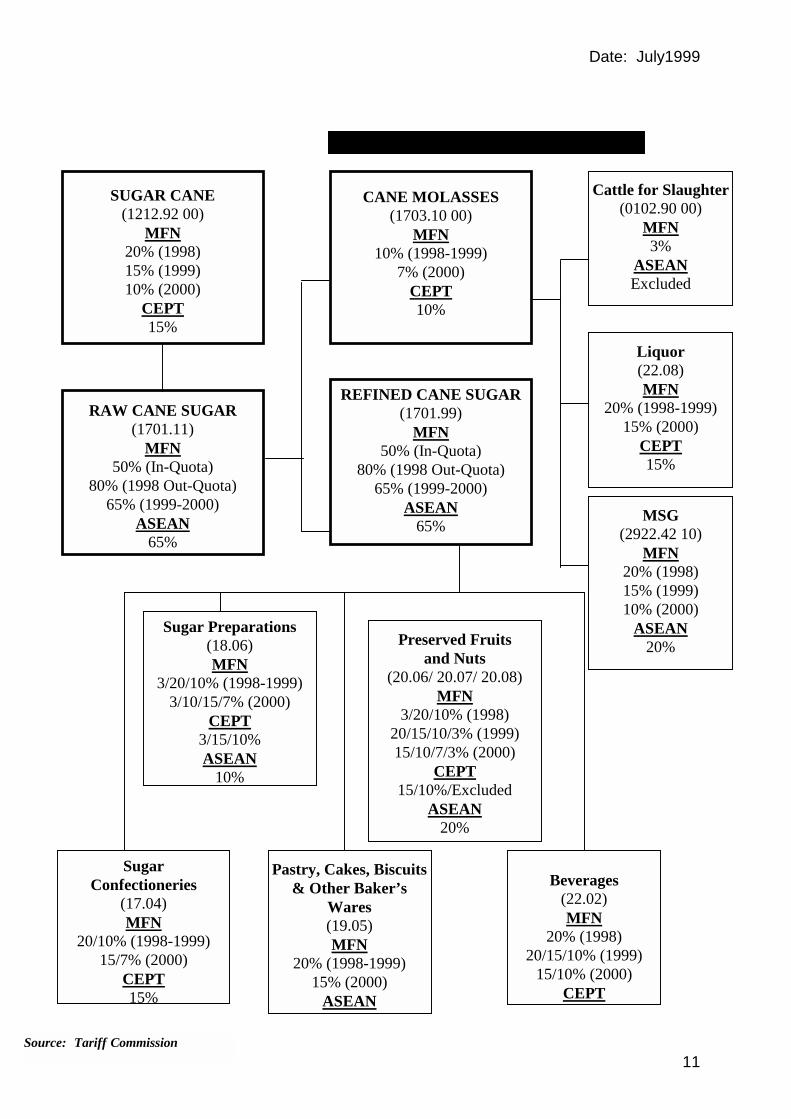
Date: July1999
11
SUGAR CANE (1212.92 00)
MFN 20% (1998) 15% (1999) 10% (2000)
CEPT 15%
RAW CANE SUGAR (1701.11)
MFN 50% (In-Quota)
80% (1998 Out-Quota) 65% (1999-2000)
ASEAN 65%
CANE MOLASSES (1703.10 00)
MFN 10% (1998-1999)
7% (2000) CEPT 10%
REFINED CANE SUGAR (1701.99)
MFN 50% (In-Quota)
80% (1998 Out-Quota) 65% (1999-2000)
ASEAN 65%
MSG (2922.42 10)
MFN 20% (1998) 15% (1999) 10% (2000)
ASEAN 20%
Liquor (22.08) MFN
20% (1998-1999) 15% (2000)
CEPT 15%
Cattle for Slaughter (0102.90 00)
MFN 3%
ASEAN Excluded
Sugar Confectioneries
(17.04) MFN
20/10% (1998-1999) 15/7% (2000)
CEPT 15%
Sugar Preparations (18.06) MFN
3/20/10% (1998-1999) 3/10/15/7% (2000)
CEPT 3/15/10% ASEAN
10%
Pastry, Cakes, Biscuits & Other Baker’s
Wares (19.05) MFN
20% (1998-1999) 15% (2000)
ASEAN
Beverages
(22.02) MFN
20% (1998) 20/15/10% (1999)
15/10% (2000) CEPT
Preserved Fruits and Nuts
(20.06/ 20.07/ 20.08) MFN
3/20/10% (1998) 20/15/10/3% (1999) 15/10/7/3% (2000)
CEPT 15/10%/Excluded
ASEAN 20%
Source: Tariff Commission