Embed Size (px)
Citation preview
Continental Shelf Research, Vol. I I, No. 7, pp. 641~'554. 1991. 02784343/91 $3.1~1 ~ I1.~t Printed in Great Britain. © 1991 Pergamon Press p~c
Regional and seasonal differences in growth of larval North Sea herring (Clupea harengus L.) estimated by otolith
microstructure analysis
PETER MUNK,* MIKE HEATHt and Bo SKAARUP*
(Received 10 September 1990; accepted 17 January 1991 )
Abstract--The ecology processes of the larval life of autumn-spawned North Sea herring have been studied in a multidisciplinary and internationally coordinated research programme (ACE). The programme focused on larval advection and the importance of the autumn/winter circulation in determining larval distribution. In order to evaluate the effect of potential changes in spatial distribution of larvae through time, the growth pattern of spatially separated groups of larvae has been analysed. Growth of larvae was estimated by comparing mean length of groups in four surveys and by examining the relationship between larval length and otolith ring structure within defined geographical regions and restricted periods of time. The analysis indicates a 45% decrease in growth rates through the autumn/winter period along with a substantial difference between southern and northern areas, the growth rates in the south being about 50% higher. The significance of differences is evaluated in relation to method of analysis and assumptions oll ring deposition rates. The findings point to the importance of spatial distribution pattern in determining overall growth and survival of herring larvae.
INTRODUCTION
HERRING spawn in the N o r t h Sea b e t w e e n A u g u s t and J a nua ry off the Bri t ish coast and in the Engl i sh C h a n n e l , bu t the ma jo r i t y of the spawning occurs b e t w e e n late A u g u s t and the end of O c t o b e r and is r e f e r r ed to as a u t u m n spawning. Loca t ions of the ma jo r spawning g rounds are well de sc r ibed by the annua l INTERNATIONAL HERRING LARVAE SURVEYS ( I H L S ; 1987a) tha t have b e e n p e r f o r m e d since 1972. These surveys es t ima te the abun- dance and d i s t r ibu t ion of newly ha t ched la rvae in the wes te rn N o r t h Sea (west of 2°E). A n o t h e r i n t e rna t i ona l survey p r o g r a m m e , THE INTERNATIONAL YOUNG FISH SURVEY ( IYFS; 1989) e s t ima te s the d i s t r ibu t ion and a b u n d a n c e of a u t u m n - s p a w n e d la rvae in F e b r u a r y when they are m o r e d i spe r sed and the m a j o r concen t r a t i ons are genera l ly in the s o u t h e a s t e r n N o r t h Sea and in the K a t t e g a t (MUNK and CHRISTENSEN, 1990). The d ispersa l of l a rvae dur ing the win te r is r e l a t ed to the cyclonic c i rcu la t ion in the N o r t h Sea (BARTSCH
et al., 1989). The ear ly dr i f t o f he r r ing l a rvae (wi thin the first 2 m o n t h s af ter ha tch ing) has been
de sc r ibed in a n u m b e r of s tudies (KIORBOE et al., 1988; HEATH and RANKINE, 1988) and in
*Danish Institute for Fisheries and Marine Research, Charlottenlund Castle, DK-2920 Charlottenlund, Denmark.
t DAFS, Marine Laboratory, Victoria Road, Aberdeen AB9 8DB, U.K.
641
642 P. MUNK et al.
1987, several laboratories cooperated to investigate the advection, growth and survival of a single year-class in the North Sea in more detail. This study was part of the AtJxuMN CIRCULATION EXPERIMENT (ACE; 1987b). The primary objectives were to examine the connection between the mainly wind-driven circulation in the North Sea during the winter and distribution of herring during the larval phase and to investigate whether variations in distribution might result in changes in overall growth and survival of larvae as a consequence of regional differences in larval growth rates.
In this paper, the results of investigations of regional and seasonal differences in larval growth are presented. Two methods of growth estimation are considered. One is based on the tracing of major groups of larvae between surveys and comparing length distributions. The other is based on age estimation of larvae by analysis of otolith microstructure. The latter method relies on an assumed relationship between age and visible ring number in the otoliths.
The concentric rings visible in larval otoliths result from variations in the concentration of calcium carbonate within the protein matrix (WATANABE et al . , 1982) and are presum- ably related to changes in metabolic activity (MoSEGAARD and TITUS, 1987). The changes are seen in light microscopy as concentric light and dark bands or increments. In a number of studies, increment formation has been shown to occur on a daily basis (for example, CAMPANA and NEILSON, 1982; JONES and BROTHERS, 1987; RADTKE, 1989). However, at low growth rates the verification of daily periodicity often fails and ring deposition rate is apparently less than I day - t (GEFFEN, 1982; MCGURK, 1984; JONES and BROTHERS, 1987). CAMPANA et al. (1987) have argued that inter-ring distances during periods of slow growth are likely to be smaller than the theoretical resolution of light microscopy ( - 1/~m) and that this could account for the apparent deviation from daily ring deposition.
The growth rates of autumn-spawned North Sea herring larvae are in general, relatively low (KIORBOE et al . , 1988; MUNK et al . , 1986) and the range of reported ring widths of other autumn-spawned herring (LoucH et al. , 1982; 0.6-2.4/~m) indicates that examination of rings might be limited by the resolution of light microscopy. In the study we will evaluate our conclusions in relation to the so called "invisible ring problem".
M A T E R I A L S A N D M E T H O D S
Sampling was carried out during surveys between October 1987 and February 1988, each of approximately 3 weeks duration. Basic information about surveys and sampling are given in Table 1.
Table 1. Sampling performed during the four survey periods
Number of Number of samples samples/larvae
Survey Sampling Sampling for larval for otolith month Research vessel period gear distribution examination
October FRV Scotia 8-23/10 GULFIII 80 7/13 l November H/S Dana 21/11-5/12 MIK 40 11/231 January R/V Challenger and 7-26/1 MIK 83 7/72
R/V Clione February "IYFS" vessels and 28/1-25/2 IKMT/MIK 309 5/82
H/S Dana
Regional and seasonal growth diffcrenccs of Clupea harengus L. 643
Sampling was carried out at a series of predefined stations. Routine sampling of hydrographic parameters, zooplankton and herring larvae (abundance, length di:tri- bution) were carried out at every station. Handling procedures for the gears employed (Table 1) followed standards described in the INTERNATIONAL HERRING LARVAE SURVEY (1985) (GULF Ill) and MUNK (1988) (MIK and IKMT). Samples were preserved in buffered 4% formalin and within 2 months standard length of herring larvae was measured in 0.5 mm length intervals.
At a limited number of "key" stations, additional sampling was carried out for plankton productivity and abundance measurements and subsamples of larvae were collected for stomach and otolith analysis. The procedures used in otolith examination were the following:
On the first three surveys, the standard lengths of a random subsample of about 20 fresh larvae from the catch were measured immediately after recovery of the gear and preserved individually in 70% ethanol. During the last survey (February), specimens preserved in 4% formaldehyde solution were used. Shortly after the last survey the sagittal otoliths were removed using dissecting needles and micropipettes. Otoliths were mounted on microscope slides in thermoplastic resin, concave side up, and analysed using a transmitted light microscope equipped with a video viewing system (63 × objective, ca 2700 × effec- tive magnification to screen). The otolith radius was measured as half of the maximal diameter, and the number of dark rings were counted. Counting was repeated three times on each otolith. There were no systematic differences between replicate counts on each otolith and, consequently, the counts for each otolith were averaged. Data on larval length, otolith radius and otolith ring numbers were analysed by linear regression using the procedure GLM in Statistical Analysis System (SAS Institute, Cary NC, U.S.A.).
A relationship between pre-preservation standard length and dry weight was found for larvae subsampled from surveys in November and February. Lengths of individual larvae were measured immediately after capture. The larvae were rinsed in distilled water, dried on microscope slides for 24 h at 55°C and weighed after storage in a desiccator. A conversion from pre-preservation to formalin-preserved standard lengths was found by measuring a sample of larvae before and after individual storage.
RESULTS
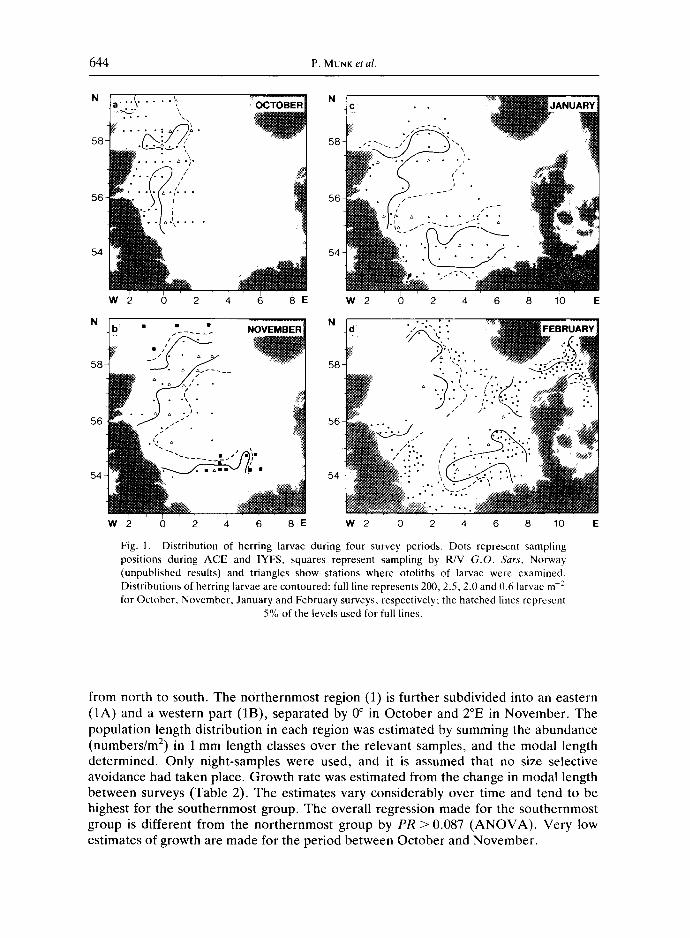
The distribution of larvae during each survey is illustrated in Fig. 1. In the first part of the investigation period (September-October), herring larvae were found close to the spawning grounds off the Scottish and English coasts. Over the following months larvae were progressively dispersed eastwards. In the later surveys when an extensive area of the North Sea was sampled, some potential areas of distribution were not covered, leaving some uncertainty as to the exact limits of larval dispersion.
Growth estimates based on larval length increase in spatially separated groups
Progressive changes in length distribution were investigated by tracing major concen- trations of larvae from survey to survey. The data in Fig. 1, indicate three major patches of larvae, in Fig. la one north of 57°N and a second between 55 and 57°N can be seen, and in Fig. lb a third south of 55°N is evident. The patches are assumed to stay within three defined regions geographically separated by latitudes 55 and 57°N and numbered !, 2 and 3
644 P. MUNK et al.
58
56
54
58
56
54
W 2 0 2 4 6 8 E W 2 0 2 4 6 8 10
N
58
56
54
W 2 0 2 4 6 8 E W 2 0 2 4 6 8 10 Fig. 1. Distribution of herring larvae during four survey periods. Dots represent sampling positions during ACE and IYFS, squares represent sampling by R/V G.O. Sars, Norway (unpublished results) and triangles show stations wherc otoliths of larvae were examined. Distributions of herring larvae are contoured: full line represents 200, 2.5, 2.0 and 0.6 larvae m -~ for October, November, January and February surveys, respectively; the hatched lines represent
5% of the levels used for full lines.
from north to south. The northernmost region (1) is further subdivided into an eastern (1A) and a western part (1B), separated by 0 ° in October and 2°E in November. The population length distribution in each region was estimated by summing the abundance (numbers/m 2) in 1 mm length classes over the relevant samples, and the modal length determined. Only night-samples were used, and it is assumed that no size selective avoidance had taken place. Growth rate was estimated from the change in modal length between surveys (Table 2). The estimates vary considerably over time and tend to be highest for the southernmost group. The overall regression made for the southernmost group is different from the northernmost group by P R > 0.087 (ANOVA) . Very low estimates of growth are made for the period between October and November.
Regional and seasonal growth differences of Clupea harengus L. 645
Growth estimates based on otolith analysis
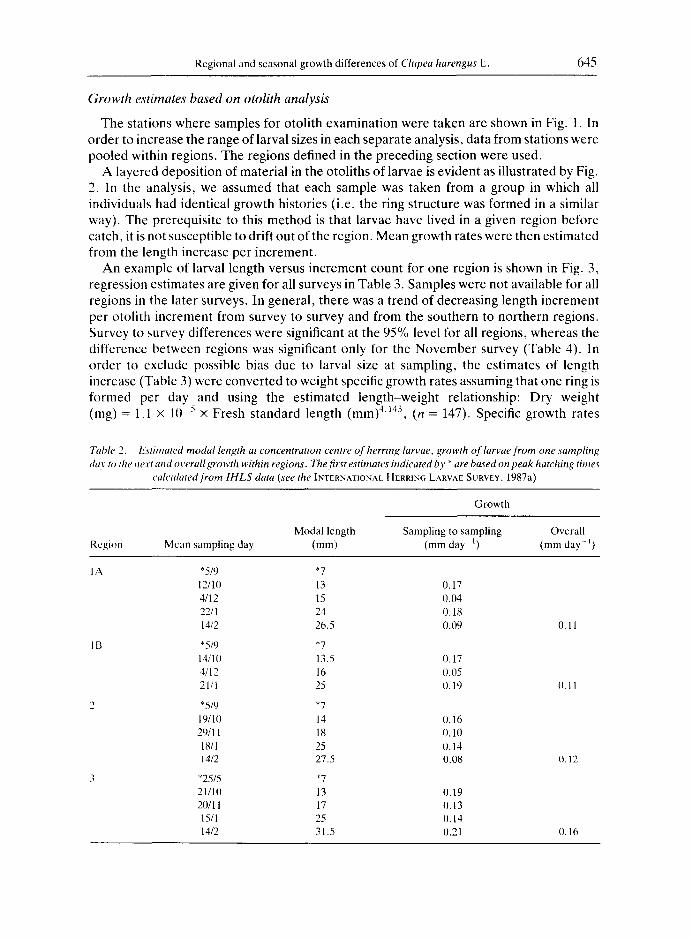
The stations where samples for otolith examination were taken are shown in Fig. 1. In order to increase the range of larval sizes in each separate analysis, data from stations were pooled within regions. The regions defined in the preceding section were used.
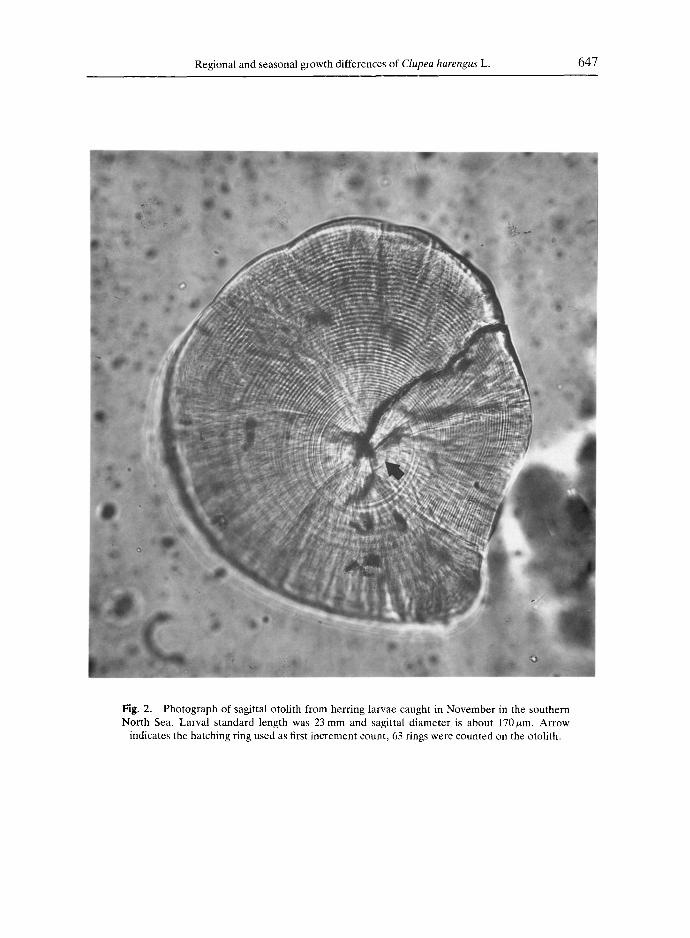
A layered deposition of material in the otoliths of larvae is evident as illustrated by Fig. 2. In the analysis, we assumed that each sample was taken from a group in which all individuals had identical growth histories (i.e. the ring structure was formed in a similar way). The prerequisite to this method is that larvae have lived in a given region before catch, it is not susceptible to drift out of the region. Mean growth rates were then estimated from the length increase per increment.
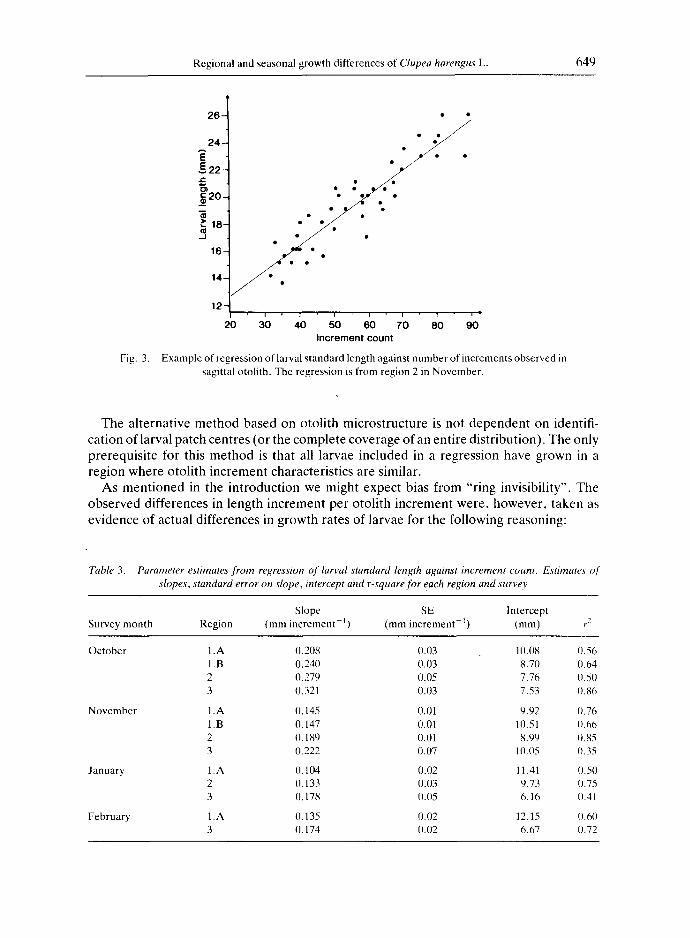
An example of larval length versus increment count for one region is shown in Fig. 3, regression estimates are given for all surveys in Table 3. Samples were not available for all regions in the later surveys. In general, there was a trend of decreasing length increment per otolith increment from survey to survey and from the southern to northern regions. Survey to survey differences were significant at the 95% level for all regions, whereas the difference between regions was significant only for the November survey (Table 4). In order to exclude possible bias due to larval size at sampling, the estimates of length increase (Table 3) were converted to weight specific growth rates assuming that one ring is formed per day and using the estimated length-weight relationship: Dry weight (mg) = 1.1 × 10 5 × Fresh standard length (mm) 4"143, (n = 147). Specific growth rates
Tabh, 2. Estimated modal length at concentration centre of herring larvae, growth of larvae from one sampling day to the next and overall growth within regions. The first estimates indicated by * are based on peak hatching times
calculated from IHLS data (see the INTERNATIONAL HERRING LARVAE SURVEY, 1987a)
Growth
Modal length Sampling to sampling Overall Region Mean sampling day (mm) (mm day l) (mm day i)
IA *5/9 *7 12/10 13 0.17 4/12 15 0.04 22/1 24 0.18 14/2 26.5 0.09 (I. 11
1B *5/9 *7 14/10 13.5 (/.17 4/12 16 0.05 21/1 25 0.19 0. i 1
2 *5/9 *7 19/10 14 0.16 29/11 18 0.10 18/1 25 (I.14 14/2 27.5 0.08 0.12
3 *25/5 *7 21/10 13 0.19 20/11 17 0.13 15/1 25 0.14 14/2 31.5 0.21 0.16
646 P. MUNK et al.
range between 2.0 and 7.2% day -~ (Fig. 4), and the relationship between seasons and regions is the same as for the estimated absolute increase in length.
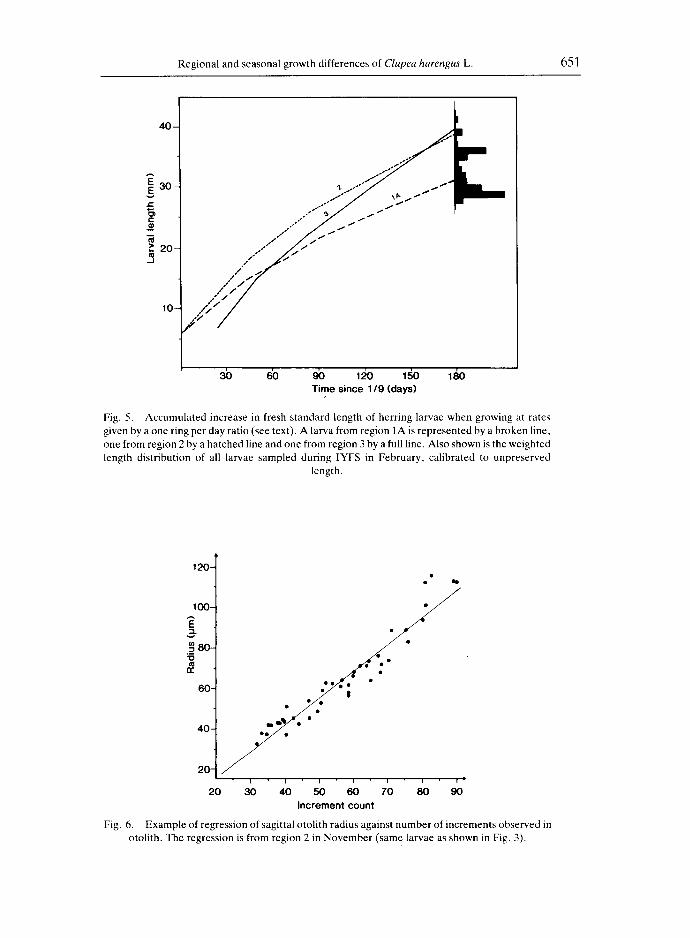
In order to determine whether the mean length increases per ring increment in each area was a reasonable estimate of daily growth rate, the growth histories of larvae in each region were reconstructed assuming daily ring deposition. Calculations were initiated at a larval length of 7 mm on the 5th of September for regions 1 and 2 and on the 25th for region 3 (based on peak hatching estimates from IHLS data, see the INTERNATIONAL HERRINC SURVEY, 1987a). The resulting expected range of larval lengths in the North Sea at the end of February, assuming daily otolith ring deposition, was then compared with the actual length distribution of larvae in the February survey (Fig. 5).
The analysis showed that the regional growth differences should have resulted in different size distributions of larvae growing up in regions 1 and 2, respectively, even though they were hatched at the same date, whereas larvae from region 3, in spite of their later hatch, grew faster and were larger at the end of February. The expected range of lengths corresponded reasonably well with that observed in the samples.
Otol i th d i m e n s i o n s
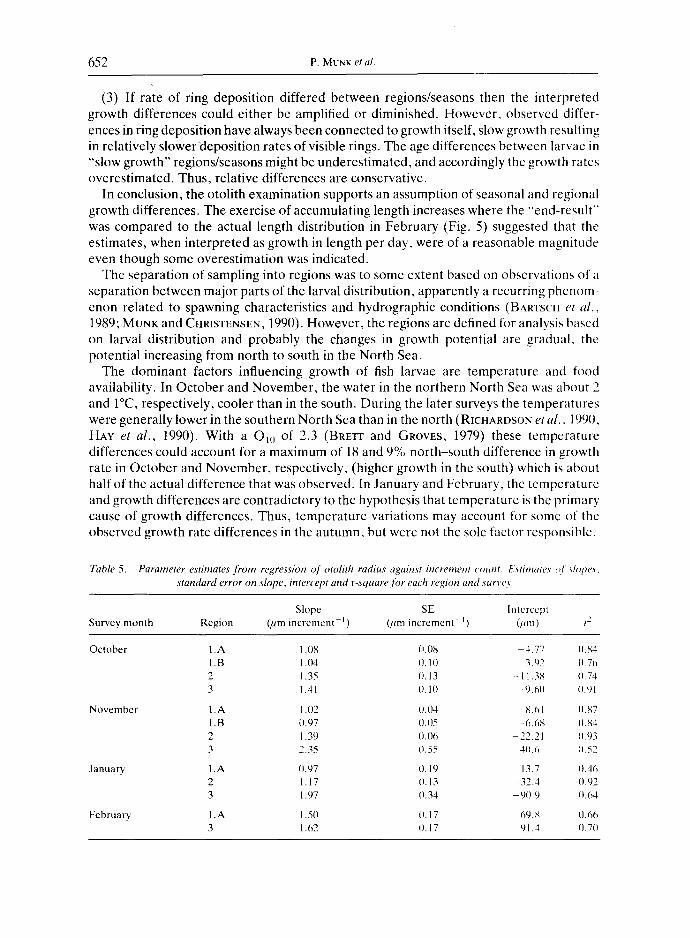
Mean increment width was determined by regressing otolith radius against number of increments (example shown in Fig. 6). In Table 5, the parameter estimates are shown. R- squares of regressions were in almost all cases higher than those for the larval length against increment number relationship. Mean width was significantly different between regions in three of the four surveys, whereas a change with time was significant in region 3 only (Table 4).
Width of increments is also related to larval size. The relationship between natural logarithm of otolith radius and logarithm of larval standard length was analysed by linear regression. The model fitted data well (n = 489, r-square = 0.91) and, from the estimated relationship [Otolith radius ~m) = 0.18 x Fresh standard length (mm) 196] it follows that otolith ring width will increase with increasing larval size even at the same absolute somatic growth rate.
When the ring width-larval length dependence was considered by regressing larval length against otolith radius to the power of 0.51 (1.96 ~), the relationship between regression estimates was altered (Table 4). The time effect within regions was, in this case, highly significant, whereas the differences between regions were significant for the November and the January surveys only.
DISCUSSION
In the present study results of both the otolith and cohort-tracking methods for estimating growth rates indicated regional and seasonal growth differences of North Sea herring larvae. However, the cohort tracking method was of restricted value. Recogniz- able cohorts could not be identified with sufficient precision on account of the wide area distribution of larvae, and in several cases growth rate estimates were extremely (probably erroneously) low. Significant numbers of the larger larvae must have been outside the sampling areas in November and January. In studies of less diffuse distributions of herring larvae (KIORBOE et al. , 1988; HEATH and MACLACHLAN, 1987; MCGURK, 1987) reasonable use of distribution analysis has been possible.
Regional and seasonal growth differences of Clupea harengus L. 647
Fig. 2. Photograph of sagittal otolith from herring larvae caught in November in the southern North Sea. Larval standard length was 23 mm and sagittal diameter is about 170/~m. Arrow
indicates the hatching ring used as first increment count, 63 rings were counted on the otolith.
Regional and seasonal growth differences of Clupea harengus L. 649
Fig. 3,
26 -
24-
E 2 2 - t -
18- _J
16-
14-
12-
20 30
• ° ° •
i u i u u o
50 60 70 80 90 Increment count
Example of regression of larval s tandard length against number of increments observed in sagittal otolith. The regression is from region 2 in November .
The alternative method based on otolith microstructure is not dependent on identifi- cation of larval patch centres (or the complete coverage of an entire distribution). The only prerequisite for this method is that all larvae included in a regression have grown in a region where otolith increment characteristics are similar.
As mentioned in the introduction we might expect bias from "ring invisibility". The observed differences in length increment per otolith increment were, however, taken as evidence of actual differences in growth rates of larvae for the following reasoning:
Table 3. Parameter estimates from regression of larval standard length against increment count. Estimates of" slopes, standard error on slope, intercept and r-square for each region and survey
Slope SE Intercept Survey month Region (mm increment J) (mm increment I) (mm) r e
October 1. A 0.208 0.03 10.08 0.56 1. B 0.240 0.03 8.70 0.64 2 0.279 0.05 7.76 0.50 3 0.321 0.03 7.53 0.86
November 1.A 0.145 0.01 9.92 0.76 1.B 0.147 0.01 10.51 0.66 2 O. 189 0.01 8.99 0.85 3 0.222 0.07 10.05 0.35
January 1.A 0. 104 0.02 11.41 (I.50 2 0. 133 0.03 9.73 0.75 3 0. 178 0.05 6.16 0.41
February 1.A 0.135 0.02 12.15 0.60 3 0.174 0.02 6.67 0.72
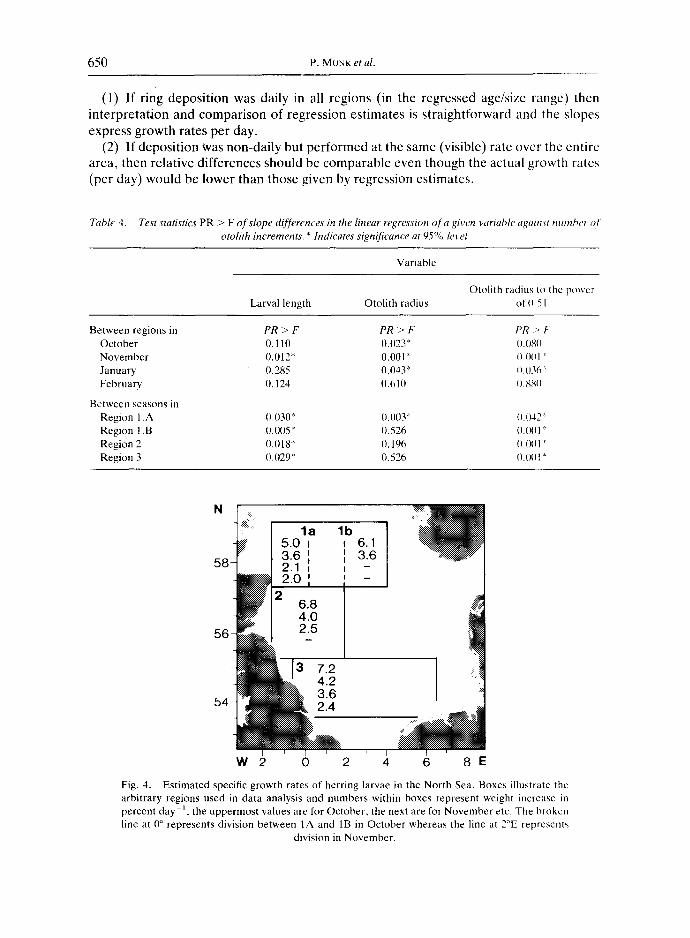
(1) If ring deposition was daily in all regions (in the regressed age/size range) then interpretation and comparison of regression estimates is straightforward and the slopes express growth rates per day.
(2) If deposition was non-daily but performed at the same (visible) rate over the entire area, then relative differences should be comparable even though the actual growth rates (per day) would be lower than those given by regression estimates.
Table 4. Test statistics PR > F o f slope differences in the linear regression o f a giw'.n variable against number o f otolith increments'. * Indicates significance at 95% level
Variable
N
Otolith radius to thc power Larval length Otolith radius of 11.51
Between regions in PR > F PR > F PR > F October 0.110 0.023" 0.080 November 0.012" (I.(ll/1 * 0.001 ' January 0.285 0.043" 0.(136' February (t. 124 0.610 0.88(I
Between seasons in Region 1 .A 0.030* 0.003* 0.042: Region 1.B 0.(l(15* 0.526 0.001" Region 2 0.018" 0.196 0.0111 * Region 3 0.029' 0.526 0.0{11 :"
58
56
|
650 P. MUNK et al.
W 2 0 2 4 6 8 I=
Fig. 4. Estimated specific growth rates of herring larvae in the North Sea. Boxes illustrate the arbitrary regions used in data analysis and numbers within boxes represent weight increase in percent day - j , the uppermost values are for October, the next are for November etc. The broken line at 0 ° represents division between IA and 1B in October whereas the line at 2°E represents
division in November.
Regional and seasonal growth differences of Clupea harengus L. 651
40-
30 E J~
C _¢
> 20
10-
°.o-
e " ° t / t / ~
/ o . ~.
v ,• 1" 0." j / / •
o./ / " /
I |
3b 6b 90 120 150 180 Time since 1/9 (days)
Fig. 5. Accumulated increase in fresh standard length of herring larvae when growing at rates given by a one ring per day ratio (see text). A larva from region 1A is represented by a broken line, one from region 2 by a hatched line and one from region 3 by a full line. Also shown is the weighted length distribution of all larvae sampled during IYFS in February, calibrated to unpreserved
length.
120-
100-
~80 - " 0
n" •
60-
40-
• ° ;
20 30 40 50
$
60 70 8O 90 Increment count
Fig. 6. Example of regression of sagittal otolith radius against number of increments observed in otolith. The regression is from region 2 in November (same larvae as shown in Fig. 3).
652 P. MUNK et al.
(3) If rate of ring deposition differed between regions/seasons then the interpreted growth differences could either be amplified or diminished. However, observed differ- ences in ring deposition have always been connected to growth itself, slow growth resulting in relatively slowerdeposition rates of visible rings. The age differences between larvae in "slow growth" regions/seasons might be underestimated, and accordingly the growth rates overestimated. Thus, relative differences are conservative.
In conclusion, the otolith examination supports an assumption of seasonal and regional growth differences. The exercise of accumulating length increases where the "'end-result" was compared to the actual length distribution in February (Fig. 5) suggested that the estimates, when interpreted as growth in length per day, were of a reasonable magnitude even though some overestimation was indicated.
The separation of sampling into regions was to some extent based on observations of a separation between major parts of the larval distribution, apparently a recurring phenom- enon related to spawning characteristics and hydrographic conditions (BARTSCH et al . ,
1989; MUNK and CHRISTENSEN, 1990). However, the regions are defined for analysis based on larval distribution and probably the changes in growth potential are gradual, the potential increasing from north to south in the North Sea.
The dominant factors influencing growth of fish larvae are temperature and food availability. In October and November, the water in the northern North Sea was about 2 and I°C, respectively, cooler than in the south. During the later surveys the temperatures were generally lower in the southern North Sea than in the north (RICHARDSON et a l . , 199(L HAY et a l . , 1990). With a Q10 of 2.3 (BRErr and GROVES, 1979) these temperature differences could account for a maximum of 18 and 9% north-south difference in growth rate in October and November, respectively, (higher growth in the south) which is about half of the actual difference that was observed. In January and February, the temperature and growth differences are contradictory to the hypothesis that temperature is the primary cause of growth differences. Thus, temperature variations may account for some of the observed growth rate differences in the autumn, but were not the sole factor responsible.
Table 5. Parameter estimates from regression of otolith radius against increment count. Estimates of ~'lope.s. standard error on slope, intercept and r-square for each region and survey
Slope SE Intercept Survey month Region ~um increment i) (um increment i) 0tin) r:
October 1. A 1.08 0.08 4.77 (I. 84 1 .B 1.(14 I ) . 10 3.92 0.76 2 1.35 0.13 - 11.38 ().74 3 1.41 0.10 -9.60 ().91
November 1.A 1.02 0.04 - 8.61 0.87 1 .B (I.97 (I.05 -6.6b; I).b~4 2 1.39 0.06 22.21 0.93 3 2.35 0.55 4(I.6 (I.52
January 1 .A 0.97 (I. 19 13.7 0,46 2 1.17 0.13 -32.4 0.92 3 1.97 I).34 -9(I.9 0.64
February 1.A 1.50 (1.17 - 69.8 11.66 3 1.62 (1.17 -91.4 (I.70
Regional and seasonal growth differences of Clupea harengus L. 653
Stomach content analyses of larvae caught during the investigation showed that copepods were the most frequently ingested prey item (unpublished results). The productivity and abundance of copepods was analysed during the ACE-programme by HAy et al. (1990). In general, the overall trend in productivity of selected copepod species (measured by egg production) was higher in the southern North Sea than in the north. In November and January, the productivity of all species was negligible north of 57°N, whereas some production still took place in the southern parts. Between January and February the productivity in northern areas increased but at a lower rate (about the half) than in the south. The production of copepods did not reflect their abundance at a given site. Only in January was there any tendency of higher abundance of copepods in the south. In general, no consistent geographical trends in biomass of copepods per unit area could be established. Over the study period, the productivity of copepods showed a minimum in November whereas copepod abundance reached the lowest level in January.
The decrease in specific growth rate of herring larvae with time (Fig. 4) probably stems from the overall decline in copepod productivity and abundance. As the growth rate estimates reflect prey consumption during some period prior to sampling, a potential effect of the increase in prey concentration in February on growth rates could not be measured. On a regional basis, larval growth rate and copepod productivity were directly related, whereas the variations in the larval growth estimates could not be explained by the copepod abundance estimates as given by HAY et al. (1990). In order to ascertain the availability of prey, information about the relationship between copepod productivity and abundance as well as vertical distribution of prey and larvae has to be included. An analysis of these factors and larval consumption of prey during the ACE-period is under prep- aration (HEAVH and MUNK, in preparation).
Three main determinants of North Sea herring distribution during the larval phase have been proposed; the inflow of Atlantic water (CORTEN, 1986), the relative contribution from spatially separated spawning grounds (MUNK and CHRISTENSEN, 1990), and the wind- susceptibility of the anticlockwise circulation pattern (BARTSCH et al., 1989). Whereas the two first factors mainly introduce variation on a scale of several years, the influence from wind acts on a year to year basis. The study of circulation patterns and larval distributions in the Autumn Circulation Experiment (BARTSCH et al., 1989) point to a close connection between the mainly wind-determined circulation patterns, larval advection, and sub- sequent distribution pattern within the North Sea. The observations made during the ACE-programme emphasize the diversity of the North Sea in hydrographic and plank- tonic parameters (RICHARDSON et al., 1990; HAY et al., 1990). The present investigation traces the diversity to the growth potential of larval herring, hence, the determinants of larval distribution also exert influence on the overall growth and possibly the survival of herring larvae.
R E F E R E N C E S
AUIUMN C[RCUI,ATION EXPERIMEN/ (1987b) Report of the working group on larval fish ecology to the Biological Oceanography Committee of ICES. International Council for the Exploration of the Sea, CM 1987/L:28 (mimeo).
BARrSCll J. K., K. BRANDER, M. HEATH, P. MUNK, K. RICHARDSON and E. SVENDSEN (1989) Modelling the advection of herring larvae in the North Sea. Nature, 340 (6235), 632~i36.
BREH J. R. and T. D. D. GROVES (1979) Physiological energetics. In: Fish physiology, Vol. VIII, W. J. HOAR. R. J. RANDALl, and J. R. BREVr, editors, Academic Press, New York, pp. 279-352.
654 P. MUNK et al.
CAMPANA S. E., J. A. GAGNE and J. MUNRO (1987) Otolith microstructure of larval herring (Clupea harengus): Image or reality'? Canadian Journal of Fisheries and Aquatic Science, 44, 1922-1929.
CAMPANA S. E. and J. D. NEILSON (1982) Daily growth increments in otoliths of starry flounder (Platichthys stellatus) and the influence of some environmental variables in their production. Canadian Journal of Fisheries and Aquatic Science, 39,937-942.
CORJ FN A. (1986) On the causes of the recruitment failure of herring in the central and northern North Sea in the years 1972-1978. Journal du Conseil International pour l'Exploration de la Mer, 42, 281-294.
GEVFEN A. J. (19821 Otolith ring deposition in relation to growth rate in herring (Clupea harengus) and turbot (Scophthalmus maximus) larvae. Marine Biology, 71,317-326.
1lAY S. J., T. KIORBOE and A. MATrHEWS (1990) Zooplankton biomass and production in the North Sea during the Autumn Circulation Experiment, October 1987-March 1988. Continental Shelf Research, submitted.
HEA1H M. R. and P. W. RANKINE (1988) Growth and advection of larval herring (Clupea harengus L.) in the vicinity of the Orkney Isles. Estuarine and Coastal Shelf Science, 27,547-565.
H~AIH M. R. and P. M. MACLACI-ILAN (1987). Dispersion and mortality of yolk-sac herring (Clupea harengus L.) larvae from a spawning ground to the west of the Outer Hebrides. Journal of Plankton Research, 9,613~30.
]NIl RNA ['IONAI HERRING LARVAE SURVEY (1985) Survey Manual for the International Herring Larvae surveys, south o] 62°N, July 1985 version. International Council for the Exploration of the Sea, Copenhagen, Denmark.
IN rERNArIONAL HERRING LARVAE SURVEY (1987a) Report of the working group on herring larvae surveys south of 62°N. International Council for the Exploration of the Sea, CM 1987/H:7 (mimeo).
INrI-RNATIONAL YOUNG FISH SURVEY (1989) Report of the working group on international young fish surveys. International Council for the Exploration of the Sea, CM 1989/H :2 (mimeo).
JONES C. and E. BROTHERS ( 19871 Validation of the otolith increment aging technique for striped bass, Morone saxatilis, larvae reared under suboptimal feeding conditions. Fisheries Bulletin, 85 (2), 171-178.
KIORBOE T., P. MUNK, K. RICHARDSON, V. CHRISTENSEN and H. PAULSEN (1988) Plankton dynamics and larval herring growth, drift and survival in a frontal area. Marine Ecology Progress Series, 44, 2(15-219.
l,otr(;u R. G., M. PENNINGTON, G. R. BOLZ and A. A. ROSENBERG (1982) Age and growth of larval Atlantic hcrring Clupea harengus L. in the Gulf of Maine-Georges Bank region based on otolith growth increments. Fisheries Bulletin, 80 (2), 187-199.
M¢'(]URK M. D. (1987) Age and growth of Pacific herring larvae based on length frequency analysis and otolith ring number. Environmental Biology of Fishes, 20, 33~7.
M('(; u R K M. D. (1984) Effects of delayed feeding and temperature on the age of irreversiblc starvation and on the r~ltes of growth and mortality of Pacific herring. Marine Biology, 84, 13-26.
Mos EGAARD H. and R. Trrus (1987) Daily growth rates of otoliths in yolk sac fry, of two salmonids at five different temperatures. In: Proceedings of the Fifth Conference on European Ichthyology, Stockholm 1985, O. KUI_ANDER and B. FERNI-tOLM, editors, Swedish Museum of Natural History, Stockholm, pp. 221-227.
MUNK P. (19881 Catching large herring larvae: Gear applicability and larval distribution. Journal du Conseil International pour I'Exploration de la Mer, 45, 97-104.
MUNK P. and V. CHRISrENSEN (1990) Larval growth and drift pattern and the separation of herring spawning groups in the North Sea. Journal ofFish Biology, 37, 135-148.
MUNK P., V. CHINS1ENSEN and H. PAUt.SEN (1986). Studies of a larval herring (Clupea harengus L.) patch in the Buchan arca. 11. Growth, mortality and drift of larvae. Dana, 6, 11-24.
RAt)rKE. R. 1,. (1989) Larval fish age, growth, and body shrinkage: Information available from otoliths. Canadian Journal of Fisheries and Aquatic Science, 46, 1884-1894.
RI('IIARDSON K., M. R. HEAIH, D. BAIRD, A. CHRISTOFFERSEN and D. SEATON (1990) The distribution of phytoplankton and primary production in the North Sea during the Autumn Circulation Experiment. ('ontinental Shelf Research, submitted.
W,XlA~AB~. N., K. TANAKA, Y. YAMADA and J. M. DEAN (1982). Scanning electron microscope observations of thc organic matrix in the otoliths of the teleost fish Fundulus heterocitus L. and Tilapia niloica L. Journal of Experimental Marine Biolog 3 and Ecology, 58, 127-134.