Embed Size (px)
Citation preview
This article was downloaded by: [University of Strathclyde]On: 10 October 2014, At: 08:32Publisher: RoutledgeInforma Ltd Registered in England and Wales Registered Number: 1072954 Registered office:Mortimer House, 37-41 Mortimer Street, London W1T 3JH, UK
Regional StudiesPublication details, including instructions for authors and subscriptioninformation:http://www.tandfonline.com/loi/cres20
Regional Development Strategies in ChangingEnvironments: An Ecological ApproachFrancesca Gambarotto a & Mario A. Maggioni b ca Dipartimento di Scienze Economiche 'Marco Fanno' , Universitàdegli Studidi Padova , via del Santo 28, Padova, 35123, Italyb ISEIS , UniversitàCattolica , Largo Gemelli 1, Milano, 20123c IDSE-C NR , Istituto di ricerca sulla Dinamica dei Sistemi Economici , viaAmpèere 56, Milano, 20131, ItalyPublished online: 18 Aug 2010.
To cite this article: Francesca Gambarotto & Mario A. Maggioni (1998) Regional DevelopmentStrategies in Changing Environments: An Ecological Approach, Regional Studies, 32:1, 49-61, DOI:10.1080/00343409850123611
To link to this article: http://dx.doi.org/10.1080/00343409850123611
PLEASE SCROLL DOWN FOR ARTICLE
Taylor & Francis makes every effort to ensure the accuracy of all the information (the “Content”)contained in the publications on our platform. However, Taylor & Francis, our agents, and ourlicensors make no representations or warranties whatsoever as to the accuracy, completeness, orsuitability for any purpose of the Content. Any opinions and views expressed in this publicationare the opinions and views of the authors, and are not the views of or endorsed by Taylor &Francis. The accuracy of the Content should not be relied upon and should be independentlyverified with primary sources of information. Taylor and Francis shall not be liable for anylosses, actions, claims, proceedings, demands, costs, expenses, damages, and other liabilitieswhatsoever or howsoever caused arising directly or indirectly in connection with, in relation to orarising out of the use of the Content.
This article may be used for research, teaching, and private study purposes. Any substantialor systematic reproduction, redistribution, reselling, loan, sub-licensing, systematic supply, ordistribution in any form to anyone is expressly forbidden. Terms & Conditions of access and usecan be found at http://www.tandfonline.com/page/terms-and-conditions
Regional Studies, Vol. 32.1, pp. 49± 61
Regional Development Strategies in ChangingEnvironments: An Ecological Approach
FRANCESCA GAMBAROTTO* and MARIO A. MAGGIONI ²*UniversitaÁ degli Studi di Padova, Dipartimento di Scienze Economiche `Marco Fanno’, via del Santo 28, 35123, Padova, Italy
² ISEIS, UniversitaÁ Cattolica, Largo Gemelli 1, 20123, Milano and IDSE-CNR, Istituto di ricerca sulla Dinamica dei
Sistemi Economici, via AmpeÁ re 56, 20131, Milano, Italy
(Received February 1995; in revised form April 1996)
GAMBARO TTO F. and M AGGIONI M. A. (1998) Regional development strategies in changing environments: an ecological
approach, Reg. Studies 32, 49± 61. The aim of this paper is the analysis of regional industrial development policies. This objectiveis achieved through a class of dynamic models mutated from the population ecology literature. The paper begins by studying
the development of a local population of homogeneous ® rms when only one region is considered. In this way it is possible to
endogenously determine the regional c̀arrying capacity’ (i.e. the maximum dimension of its industrial mass) in terms of theavailability of resources (local inputs and infrastructures) and the ® rms’ ability to exploit these resources. The analysis is then
extended through the introduction of the regional public authority which is able to foster regional industrial development by
focusing its interventions on two alternative targets: either the regional `maximum rate of growth’ (r-strategy) or the regionalc̀arrying capacity’ (K-strategy). The paper concludes by studying the eVects of both national and international macro-economic
shocks on the regional economy. We ® nd that not only the size but also the frequency of these shocks is relevant when assessing
the optimality of diVerent policies.
Regional industrial development Variable macroenvironments Agglomeration economies Population-ecology models
GAMBARO TTO F. et MAGGIONI M. A. (1998) La politique GAMBAROTTO F. und MAGGIONI M. A. (1998) Regionale
d’ame nagement du territoire dans des environnements en Entwicklungsstrategien in sich wandelnden Umwelten: ein
pleine e volution: une facË on e cologique, Reg. Studies 32, oÈ kologischer Ansatz, Reg. Studies 32, 49± 61. Das Ziel dieses49± 61. Cet article analyse des politiques d’ame nagement du Aufsatzes ist die Analyse von Bestrebungen regionaler indu-
territoire aÁ partir d’un ensemble de modeÁ les dynamiques strieller Entwicklung. Die wird mittels einer Art dynamischer
de veloppe par la biologie des populations. En premier, l’ arti- Modelle erreicht, die eine Abwendung von dercle e tudie le de veloppement d’un regroupement local d’en- BevoÈ lkerungsoÈ kologieliteratur darstellt. Der Aufsatz unter-
treprises homogeÁ nes au sein d’une seule re gion. Cela permet sucht zunaÈ chst die Entwicklung einer ortsansaÈ ssigen BevoÈ lk-
la de termination endogeÁ ne du p̀otentiel’ (aÁ savoir, les limites erung gleichartiger Firmen, die sich auf nur eine Regionde sa masse industrielle) en termes de la disponibilite de beschraÈ nkt. Auf diese Weise ist es moÈ glich, die regionale
ressources (c’est aÁ dire, les inputs et les e quipements locaux), `TragfaÈ higkeit’ , (d.h. die maximale Dimension ihrer industri-
et la capacite des entreprises de valoriser ces ressources. ellen Masse) endogen unter dem Aspekt des VorhandenseinsL’analyse se poursuit en pre sentant la direction re gionale qui von Resourssen (oÈ rtlicher Aufwand und Infrastruktur) und
encourage l’ame nagement du territoire en concentrant ses der FaÈ higkeit der Firmen, diese auszunutzen, zu bestimmen.
aides directes sur deux objectifs alternatifs: ou l̀e taux de Die Analyse wird sodann durch die EinfuÈ hrung der region-
croissance maximale’ re gional (la strate gie-r), ou l̀e potentiel’ alen AmtsbehoÈ rde erweitert, welche regionale Indus-re gional (la strate gie-K ). Pour conclure, l’ article e tudie les trieentwicklung foÈ rdern kann, indem sie ihr Eingreifen auf
eVets des chocs macroe conomiques, et nationaux, et intern- zweierlei Ziele, entweder die regionale `maximale Wach-
ationaux, sur l’e conomie re gionale. Il s’aveÁ re que non seule- stumsrate’ (Strategie r) oder die regionale `TragfaÈ higkeit’ment l’ampleur mais aussi la fre quence de ces chocs est (Strategie K ) konzentriert. Der Aufsatz schlieû t mit einer
pertinente lors d’une e valuation du pour et du contre des Untersuchung der Auswirkungen nationaler und inter-
politiques diVe rentes. nationaler makrooÈ konomischer Schocks, die eine Regional-wirtschaft treVen. Es wird festgestellt, daû nicht nur die
Ame nagement du territoire GroÈ û e, sondern auch die HaÈ u® gkeit dieser Schocks bei der
Environnements macro-e conomiques variables Beurteilung der besten Eignung verschiedener BestrebungenEconomies d’agglome ration sachdienlich ist.
ModeÁ les de l’e cologie de mographique
Regionale Industrielle EntwicklungVeraÈ nderliche Makroumwelten Ballungswirtschaften
BevoÈ lkerungsoÈ kologische Modelle
0034-3404/98/010049-13 ©1998 Regional Studies Association
Dow
nloa
ded
by [
Uni
vers
ity o
f St
rath
clyd
e] a
t 08:
32 1
0 O
ctob
er 2
014
50 Francesca Gambarotto and Mario A. Maggioni
INT ROD UCT I ON: D O RE G IONA L
D E V E L OP ME NT P OL I CIE S RE A L LY
MAT T E R?
Since the late 1980s the importance of local develop-
ment policies has been stressed both from a theoretical
and an empirical perspective. Academics and public
decision makers have acknowledged the central roleplayed by local systems of production in determining
growth potential and the economic success of a country.
Even the European Union has shifted the focus of its
policy towards both the regional and local level (NUTS
(a)
010
Num
ber
of s
ilk m
ills
Years1800
100
2030405060708090
1820 1840 1860 1880
1 and 2) and is currently targeting lagging regions and
declining industrial and rural areas in order to c̀reate amore cohesive Community’, achieve a stable long
term development path and foster the international
competitiveness of the European economies.
If regional policies play a relevant role in fostering
local economic development, it is necessary to identify
a number of criteria for evaluating diVerent interven-tions and measuring their eYciency and eVectiveness.
In a context of increasing global interdependence, these
policies cannot however be evaluated without reference
to external macro-economic conditions.
This paper presents a model of the development ofa local population of homogeneous ® rms when only
one region is considered in isolation. The ® rms’
Num
ber
of fi
rms
(siz
e of
a r
egio
n)
Discovery
Equilibrium level (K)
(b)
Golden age Maturity Timelocation decision is described in the model as non-
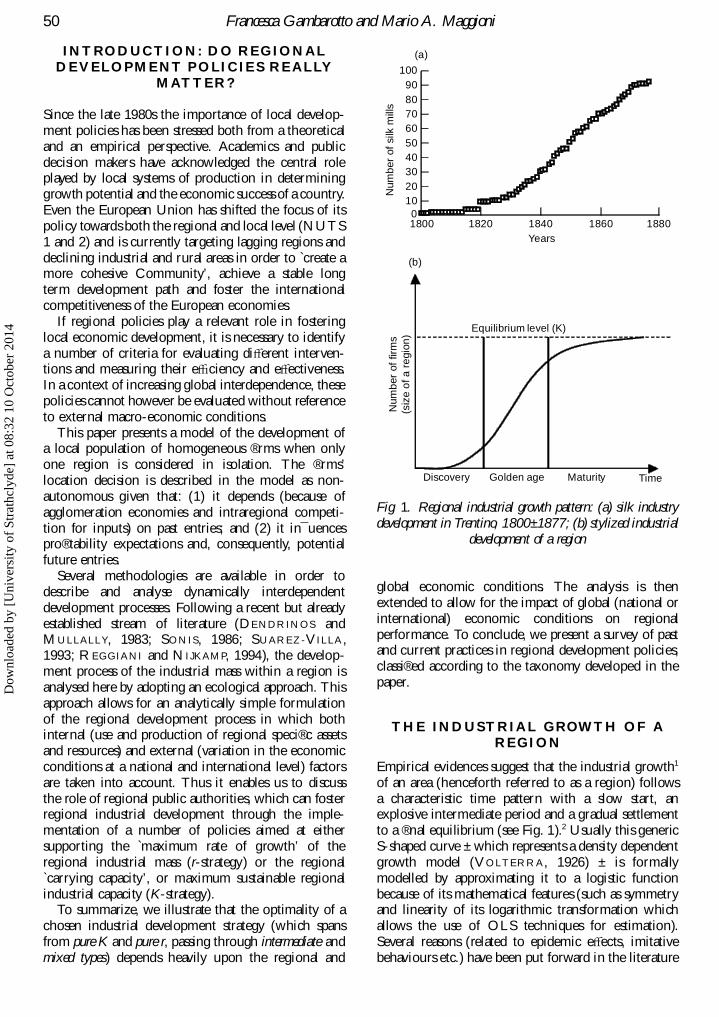
autonomous given that: (1) it depends (because ofFig. 1. Regional industrial growth pattern: (a) silk industryagglomeration economies and intraregional competi-development in Trentino, 1800± 1877; (b) stylized industrialtion for inputs) on past entries; and (2) it in¯ uences
development of a regionpro® tability expectations and, consequently, potential
future entries.
Several methodologies are available in order toglobal economic conditions. The analysis is thendescribe and analyse dynamically interdependentextended to allow for the impact of global (national ordevelopment processes. Following a recent but alreadyinternational) economic conditions on regionalestablished stream of literature (DENDRINOS andperformance. To conclude, we present a survey of pastM ULLALLY, 1983; SONIS, 1986; SUAREZ-V ILLA ,and current practices in regional development policies,1993; R EGGIANI and N I JKAMP, 1994), the develop-classi® ed according to the taxonomy developed in thement process of the industrial mass within a region ispaper.analysed here by adopting an ecological approach. This
approach allows for an analytically simple formulation
of the regional development process in which bothT H E IND US T RIA L G ROWT H OF A
internal (use and production of regional speci® c assetsRE G I ON
and resources) and external (variation in the economic
conditions at a national and international level) factors Empirical evidences suggest that the industrial growth1
of an area (henceforth referred to as a region) followsare taken into account. Thus it enables us to discuss
the role of regional public authorities, which can foster a characteristic time pattern with a slow start, anexplosive intermediate period and a gradual settlementregional industrial development through the imple-
mentation of a number of policies aimed at either to a ® nal equilibrium (see Fig. 1).2 Usually this generic
S-shaped curve ± which represents a density dependentsupporting the `maximum rate of growth’ of the
regional industrial mass (r-strategy) or the regional growth model (V OLTERRA, 1926) ± is formally
modelled by approximating it to a logistic function`carrying capacity’, or maximum sustainable regional
industrial capacity (K-strategy). because of its mathematical features (such as symmetryand linearity of its logarithmic transformation whichTo summarize, we illustrate that the optimality of a
chosen industrial development strategy (which spans allows the use of OLS techniques for estimation).
Several reasons (related to epidemic eVects, imitativefrom pure K and pure r, passing through intermediate and
mixed types) depends heavily upon the regional and behaviours etc.) have been put forward in the literature
Dow
nloa
ded
by [
Uni
vers
ity o
f St
rath
clyd
e] a
t 08:
32 1
0 O
ctob
er 2
014
Regional Development Strategies in Changing Environments 51
to explain S-shaped economic processes. The following entrant lowers the net bene® ts available to the resident
® rms. This process can be better explained by referringsection is mainly devoted to the elaboration of an
endogenously derived formulation of a logistic pattern to the dynamics of locational gross bene® ts and costs.Gross bene® ts initially increase because of agglom-of growth of the industrial mass of the region.
eration economies (i.e. due to productive specialization,
technical and commercial spillovers, reduction in bothA single region model transport and transaction costs, creation of a local
pool of skilled labour force), and then decrease whenFirms decide to settle in a region on the basis of thecongestion oVsets agglomeration economies. Loca-pro® tability of being located there. This pro® tabilitytional costs, on the other hand, decrease until thedepends on net locational bene® ts (N ) ± obtained aseYcient number of users for a given set of urban,the diVerence between gross locational bene® ts (G) andindustrial and environmental infrastructures andcosts (C) ± which, in turn, are based on both observableresources is reached. Then, due to congestion phenom-and unobservable elements. In an uncertain world, withena, they increase rapidly. More importantly, such costslimited information available to the outsiders regardingare raised by the competition between a larger numberboth the level of local costs and pro® ts, pro® tabilityof ® rms for a ® xed pool of local inputs (such as capital,expectations of a particular location are conceived solelylabour and land ± see M AGGIONI, 1994). Thus, neton the basis of observable elements. In this analysis welocational bene® ts increase during the initial stages ofassume that the only observable element for outsiders,regional development, then decrease and are ® nallyon which they can base their expectations, is the num-driven to zero. Regional industrial growth is thereforeber of ® rms already located in the area.initially stimulated, then slowed down and ® nally comesLocational gross bene® ts G for ® rm i locating into a halt.region j are a monotonic increasing function of the
For a given region and a given population of Nproductivity of local factors of production (capital kpotential entrants,4 there is therefore an equilibriumand labour l), the qualities of the social capabilities inlevel (or carrying capacity) K such as K < N, which actsthe area c, and the eYciency of urban and industrialas an upper limit to the region’s growth. In each periodinfrastructure u. All these components are, in turn,t, the number of entries will depend both on the actualdependent on the number of ® rms n already establishednumber of potential entrants K 2 n(t) and on thein the region. In particular, we assume that the relationnumber of ® rms already located there n(t). But how isbetween these components and the number of incum-K determined? Is it an endogenous or exogenousbent ® rms follows a concave path. More formally, thisparameter of the model?5 Let us consider the costs andscenario can be described as follows:3
bene® ts derived from entering a region. For the sakeG j
i 5 fi [kj(n j ), l j(n j ), c j(n j ), u j(n j )] (1) of argument let ® rms outside the region experience
zero locational bene® ts.6 Firms are assumed to beLocational costs are, symmetrically, a monotoniclocationally identical (in that the locational bene® ts andincreasing function of the locally prevailing wage wcosts are equal for any ® rm entering the region). Weand interest rate r, the taxation regime t, and thecan therefore study the behaviour of a representativeenvironmental legislation e, which are, in turn, convex® rm i and analyse its average net bene® ts functionfunctions of the number of incumbent ® rms:illustrated in equation (3).
C ji 5 gi [r
j(n j ), w j(n j ), t j(n j ), e j(n j )] (2) Fig. 2 shows the (average and marginal) costs, gross
bene® ts and net bene® ts from entering a region. MoreSubtracting equation (1) from equation (2) we obtainformally:an equation for the locational net bene® ts:
G ji 5 fi(n
j ), f 9 i (nj ) > 0, f ºi (n j ) < 0 when 0 < n j < B9 ;N j
i 5 G ji 2 C j
i
f 9 i (nj ) < 0, f ºi (n j ) < 0 when n j > B9 (4)
5 hi [kj(n j ), l j(n j ), c j(n j ), u j(n j ), (3)
C ji 5 gi(n
j ), g9 i (nj ) < 0, gºi (n j ) > 0 when 0 < n j < B ;r j(n j ), w j(n j ), t j(n j ), e j(n j )]
g9 i (nj ) > 0, gºi (n j ) > 0 when n j > B (5)
In the subsequent analyses, what is relevant for describ- These assumptions ± regarding the concavity and con-
vexity of the costs and bene® ts functions ± provideing ® rms’ location decisions is the behaviour of the net
bene® t function in the ® rms’ space. some guidance for modelling the growth of a region.
Both positive and negative externalities are involved inIt is commonly assumed in the literature (see, for
example, ISARD, 1956; PAPAGEORGIOU, 1979; the process; there are economies arising from agglom-
eration, but also diseconomies derived from congestionM IYAO and KANEMOTO, 1987) that the function ofnet locational bene® ts is concave. In other words, the and increased competition both on the demand side
(consumers) and on the supply side (natural resources,establishment of an individual ® rm increases the per-
ceived, and real, pro® tability of locating in the region workforce, capital, industrial and urban infrastruc-
tures, etc.).only up to a certain threshold; after that, each new
Dow
nloa
ded
by [
Uni
vers
ity o
f St
rath
clyd
e] a
t 08:
32 1
0 O
ctob
er 2
014
52 Francesca Gambarotto and Mario A. Maggioni
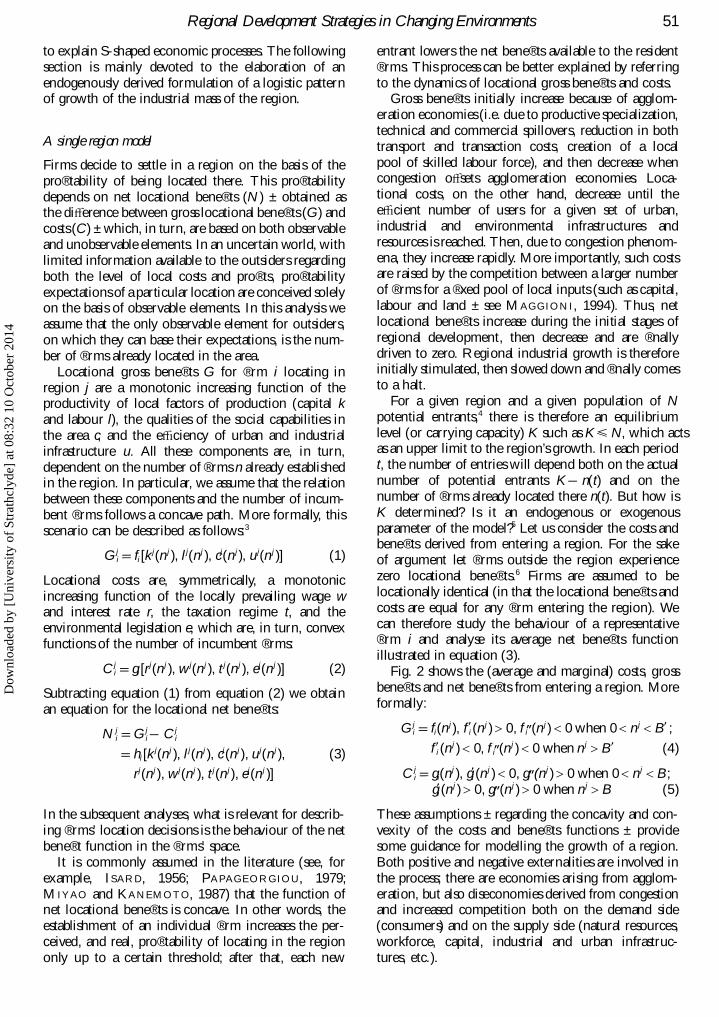
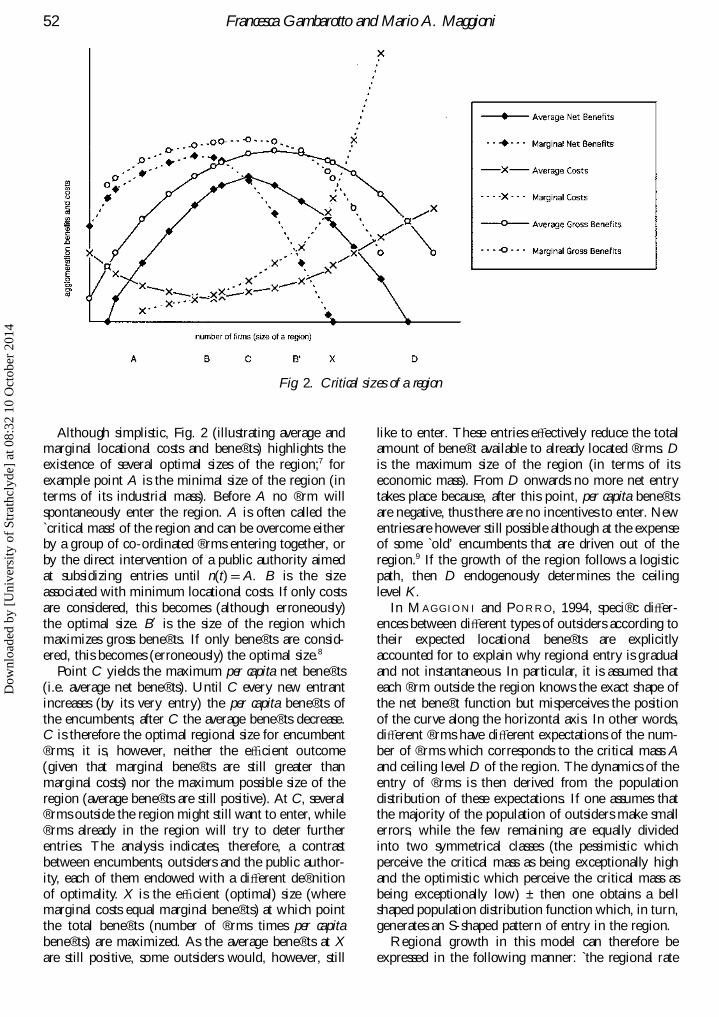
Fig. 2. Critical sizes of a region
Although simplistic, Fig. 2 (illustrating average and like to enter. These entries eVectively reduce the totalamount of bene® t available to already located ® rms. Dmarginal locational costs and bene® ts) highlights the
existence of several optimal sizes of the region;7 for is the maximum size of the region (in terms of its
economic mass). From D onwards no more net entryexample point A is the minimal size of the region (in
terms of its industrial mass). Before A no ® rm will takes place because, after this point, per capita bene® ts
are negative, thus there are no incentives to enter. Newspontaneously enter the region. A is often called the
`critical mass’ of the region and can be overcome either entries are however still possible although at the expenseof some `old’ encumbents that are driven out of theby a group of co-ordinated ® rms entering together, or
by the direct intervention of a public authority aimed region.9 If the growth of the region follows a logistic
path, then D endogenously determines the ceilingat subsidizing entries until n(t) 5 A. B is the size
associated with minimum locational costs. If only costs level K.
In M AGGIONI and PORRO, 1994, speci® c diVer-are considered, this becomes (although erroneously)
the optimal size. B9 is the size of the region which ences between diVerent types of outsiders according totheir expected locational bene® ts are explicitlymaximizes gross bene® ts. If only bene® ts are consid-
ered, this becomes (erroneously) the optimal size.8 accounted for to explain why regional entry is gradual
and not instantaneous. In particular, it is assumed thatPoint C yields the maximum per capita net bene® ts
(i.e. average net bene® ts). Until C every new entrant each ® rm outside the region knows the exact shape of
the net bene® t function but misperceives the positionincreases (by its very entry) the per capita bene® ts of
the encumbents; after C the average bene® ts decrease. of the curve along the horizontal axis. In other words,diVerent ® rms have diVerent expectations of the num-C is therefore the optimal regional size for encumbent
® rms; it is, however, neither the eYcient outcome ber of ® rms which corresponds to the critical mass A
and ceiling level D of the region. The dynamics of the(given that marginal bene® ts are still greater than
marginal costs) nor the maximum possible size of the entry of ® rms is then derived from the population
distribution of these expectations. If one assumes thatregion (average bene® ts are still positive). At C, several® rms outside the region might still want to enter, while the majority of the population of outsiders make small
errors, while the few remaining are equally divided® rms already in the region will try to deter further
entries. The analysis indicates, therefore, a contrast into two symmetrical classes (the pessimistic which
perceive the critical mass as being exceptionally highbetween encumbents, outsiders and the public author-
ity, each of them endowed with a diVerent de® nition and the optimistic which perceive the critical mass as
being exceptionally low) ± then one obtains a bellof optimality. X is the eYcient (optimal) size (wheremarginal costs equal marginal bene® ts) at which point shaped population distribution function which, in turn,
generates an S-shaped pattern of entry in the region.the total bene® ts (number of ® rms times per capita
bene® ts) are maximized. As the average bene® ts at X Regional growth in this model can therefore be
expressed in the following manner: t̀he regional rateare still positive, some outsiders would, however, still
Dow
nloa
ded
by [
Uni
vers
ity o
f St
rath
clyd
e] a
t 08:
32 1
0 O
ctob
er 2
014
Regional Development Strategies in Changing Environments 53
of growth equals the product of the individual ® rm’s Regional development agencies and policy options
contribution to the regional population’s growth andK and r therefore play a major role in shaping a logistic
the number of ® rms already in the region’ (MAG-growth path: the greater is r, the steeper the S-curve;
GIONI, 1993). If only agglomeration economies andthe larger K, the higher the ceiling level of the function.
positive spillover eVects are taken into account, then theIt would therefore appear worthwhile, given their
individual ® rm’s contribution to regional populationimportance, to examine each of these parameters in
growth would be equal to a constant r and regionalgreater detail.
industrial growth would follow an explosive exponen-The intrinsic or maximum rate of growth is r. In the
tial path. More formally:ecological literature it expresses the diVerence between
the birth and mortality rates (r 5 b 2 d ) of a population.nÇ j 5 rn j(t) (6a)This observation can be transferred to a regional
n j(t) 5 ertn j(0) (6b) economic framework where the net entry (and con-
sequently the maximum industrial rate of growth) of aIf, on the other hand, congestion and competitionregion is obtained as the diVerence between totaleVects are considered, then we need to modify theentries or start-ups and the bankruptcies or exits in themodel in order to allow for density dependent factorsperiod considered. The same value of r can, therefore,to progressively slow down regional growth. As alreadycorrespond to two very diVerent regional situations: amentioned, the simplest formulation which takes intomodest birth rate without `mortality’; or a high birthaccount these features is the logistic function.10 Byrate, compensated by an equivalently high death rate.adopting this functional form, equation (7a), it is easyTherefore, r is a compound index which describesto see that the individual ® rm’s contribution to regionalboth the region’s entrepreneurship potential and thegrowth decreases as a linear function of regional popu-individual ® rm’s probability of surviving, once born,lation size n(t):in the regional environment.12 From a public authority
perspective, r is the best target for policy interventionsnÇ j 5 rn j(t)(1 2
n j(t)
K ) (7a) aimed at fostering fast industrial growth. From equa-
tions (1) and (2) an r-strategy of development therefore
exogenously decreases localization costs or raises theand:location bene® ts so as to lower the regional barriers to
entry for all ® rms, irrespective of their technologicaln j(t) 5 ertn j(0)K
K 2 n j(0) 1 n j(0)ert(7b)
and organizational level. It is questionable, however,
whether r-type policies are the most appropriate whenwhere r is the intrinsic rate of increase and K is the
planning and implementing a long run developmentequilibrium level or the maximum dimension possible
intervention, for the larger the value of r, the soonerfor the region in isolation due to: (1) the limited
the region reaches its equilibrium level, where itavailability of resources (inputs and consumers); (2)remains. Other policies may then be required in orderthe strategic interaction between ® rms (competition,to promote a structural change.congestion and lobbying of encumbents). The resulting
K is the equilibrium value or, the carrying capacity,graph of regional growth against time is due to thei.e. the maximum dimension of the region which iscounteracting roles played by r and K: an S-shapeddetermined by the relationship between the amount ofcurve. When the region is small (n(t) near to zero) theavailable resources (inputs and infrastructures) in theterm in brackets in equation (7a) is close to one (henceregion and the use of these resources made by ® rmsthe logistic equation appproximately describes an expo-(GAMBAROTTO, 1993).13 In brief, K is a function of:nential growth path); but as n(t) approaches K, the(1) the resources endowment of the region (the richerterms in brackets tend to zero, driving to zero thethe region, the larger is K ); and (2) the average techno-whole growth rate and terminating the entry process.logical level of the region (the more advanced theBy choosing speci® c functional forms for locationaltechnology, the larger is K ).14 K increases, therefore, asbene® ts and costs, one can endogenously determineresult of either the discovery of new resources or ofthe maximum dimension of the region, K, which innew ways of exploiting already existing ones. AnyFig. 2 corresponds to s̀ize’ D, where locational netpublic policy aimed at increasing the technologicalbene® ts are equal to zero. If we assume a quadraticcapabilities of resident ® rms (i.e. innovation policies)formulation for the average net bene® ts function (i.e.or at increasing the value or productivity of localG 5 2 an2 1 bn 1 c) the regional equilibrium level D is:resources, both natural and human (through more
eYcient infrastructures and specialized training forD 5
b 1 b2 1 4ac
2a. workers), is a structural policy which raises K.
An r-strategy raises the vertex of the net bene® t
function illustrated in Fig. 2; whilst a K-strategy widensUsing a similar argument we can derive every other
critical size of the region.11 the same function moving point D further to the
Dow
nloa
ded
by [
Uni
vers
ity o
f St
rath
clyd
e] a
t 08:
32 1
0 O
ctob
er 2
014
54 Francesca Gambarotto and Mario A. Maggioni
right. If we approximate the function using the above 1. Interregional competition, where the other region
is an alternative location for the same ® rmsmentioned quadratic formulation, then an r-strategy
would tend to increase the value of the expression 2. Interregional mutualism, where the other region isan ideal location for a complementary activity
3. Interregional commensalism or centre± peripheryv 5 2b2 2 4c
4a;
models, where the other region (periphery) is
dependent on the development of the central one.16
while a K-strategy will increase the distance between
the two intercepts In M AGGIONI, 1993, a wide spectrum of bi-regional
interactions is considered and the above mentionedcases are analysed in order to demonstrate that thed 5 2
b2 2 4ac
a.
ecological approach is able to allow for very diVerent
situations within the same conceptual and analyticalIt should be stressed that a regional authority with a framework. In this paper we therefore choose to focus
® xed budget available for its policy interventions faces, on the eVects of the wider macro-economic environ-at least in the short run, a trade-oV between r-type and
ments and variability in their conditions upon theK-type policies: a large value of r is `purchased’ at the development of a region and upon the choice of theexpenses of a low K and vice-versa. This is easily appropriate policy.understood by considering the fact that any region
willing to increase its r has to support an indiscriminate
entry of ® rms irrespective of their technological cap-The extra-regional environmentabilities, entries which consequently decrease the value
of K. If the objective, however, is to increase the value In previous sections of the paper the macro-economicof K, then this objective is achieved by a strict selection environment external to the region is assumed to beof the entrants (based on eYciency and technology- unique.17 This is not, however, a very realistic hypo-related criteria). Such a strategy does however result thesis;18 thus this section oVers an analysis of theinitially in a reduction of the regional growth rate, r.15
complex relationships existing between regional strat-The optimality of these two strategies is however egies of growth and diVerent macro-economic
in¯ uenced by the macro-economic conditions (both at environments.a national and at an international level) which can As already mentioned above, r and K strategies focusaVect the region. In an undisturbed environment ± i.e. on either the regional maximum growth rate or thewhere the ® rms’ death rate d is density dependent, regional carrying capacity. Let the state of the externalmeaning that it is dependent only on congestion and environment (i.e. the density independent ® rms’ deathcompetition ± the best policy consists of raising K. rate) be described by Ei ± a binomial variable where E1
Stricter entry selection and innovation-supporting stands for a slump and E2 for a boom period ± and letpolicies produce slower development but a higher Uh be a de® nition of the region speci® c policy (i.e. theequilibrium level. In a disturbed environment ± i.e. position of the region’s development strategy on awhere d is in¯ uenced by density independent factors continuum stretching from a pure K to a pure r-strategy).which impinge heavily upon the population of ® rms The ® tness v j of the region j (i.e. the rate of growth ofeven before it approaches the ceiling level, then the its industrial mass) will depend on the combination ofonly viable policy in the short run is to sustain r both Uh and Ei or, more formally:(through generic grants to support entrepreneurship,
v j 5 v j(Ei,Uh ) i 5 1,2 and h e S where S 5 {r,K}non selective ® nancial aids, etc.). This somewhat simp-(8)listic scenario thus suggests that the regional policy
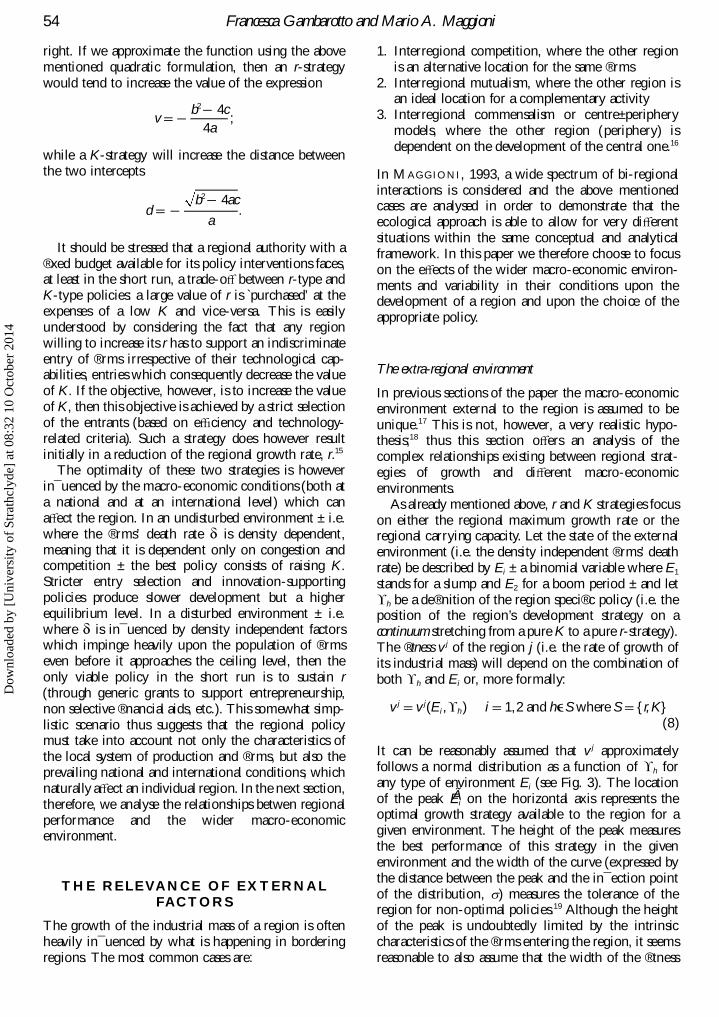
must take into account not only the characteristics ofIt can be reasonably assumed that v j approximatelythe local system of production and ® rms, but also thefollows a normal distribution as a function of Uh forprevailing national and international conditions, whichany type of environment Ei (see Fig. 3). The locationnaturally aVect an individual region. In the next section,of the peak EÃ i on the horizontal axis represents thetherefore, we analyse the relationships betwen regionaloptimal growth strategy available to the region for aperformance and the wider macro-economicgiven environment. The height of the peak measuresenvironment.the best performance of this strategy in the given
environment and the width of the curve (expressed by
the distance between the peak and the in¯ ection pointT H E RE L E VA NCE OF E X T E RNA L
of the distribution, s) measures the tolerance of theFACTORS
region for non-optimal policies.19 Although the height
of the peak is undoubtedly limited by the intrinsicThe growth of the industrial mass of a region is often
heavily in¯ uenced by what is happening in bordering characteristics of the ® rms entering the region, it seems
reasonable to also assume that the width of the ® tnessregions. The most common cases are:
Dow
nloa
ded
by [
Uni
vers
ity o
f St
rath
clyd
e] a
t 08:
32 1
0 O
ctob
er 2
014
Regional Development Strategies in Changing Environments 55
v
v (E1,YK )
E1 E2
v (E2,Yr )s
Yk Yr
Fig. 3. Regional ® tness, v j, in two different macro-
environments, E1, E2
function cannot be increased without lowering its
height.For simplicity, let us consider two very diVerent
macro-economic environments E1 and E2 (see Fig. 3).20
Two speci® c ® tness functions (which de® ne the growth
E1
(a)
GDP
E’1
E2
Time
E1
(b)
GDP
E’1
E2
Timerate of the regional industrial mass as a function of the
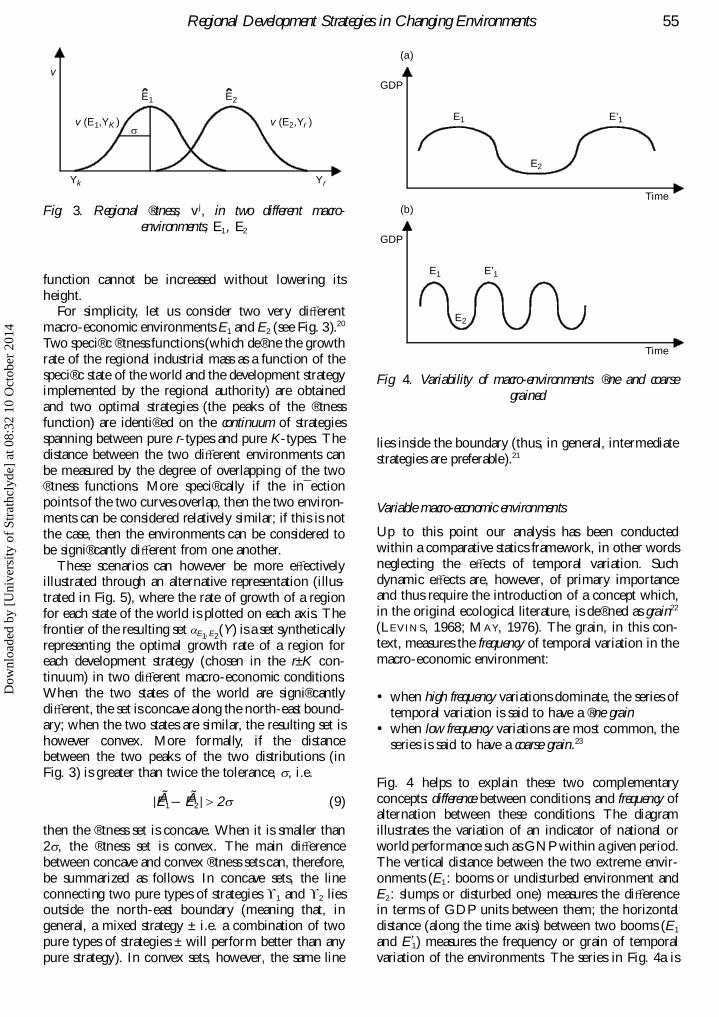
speci® c state of the world and the development strategy Fig. 4. Variability of macro-environments: ® ne and coarseimplemented by the regional authority) are obtained grainedand two optimal strategies (the peaks of the ® tness
function) are identi® ed on the continuum of strategies
spanning between pure r-types and pure K-types. The lies inside the boundary (thus, in general, intermediatedistance between the two diVerent environments can strategies are preferable).21
be measured by the degree of overlapping of the two® tness functions. More speci® cally if the in¯ ection
points of the two curves overlap, then the two environ- Variable macro-economic environmentsments can be considered relatively similar; if this is not
Up to this point our analysis has been conductedthe case, then the environments can be considered towithin a comparative statics framework, in other wordsbe signi® cantly diVerent from one another.neglecting the eVects of temporal variation. SuchThese scenarios can however be more eVectivelydynamic eVects are, however, of primary importanceillustrated through an alternative representation (illus-and thus require the introduction of a concept which,trated in Fig. 5), where the rate of growth of a regionin the original ecological literature, is de® ned as grain22
for each state of the world is plotted on each axis. The(LEVINS, 1968; M AY, 1976). The grain, in this con-frontier of the resulting set aE1,E2
(Y) is a set syntheticallytext, measures the frequency of temporal variation in therepresenting the optimal growth rate of a region formacro-economic environment:each development strategy (chosen in the r± K con-
tinuum) in two diVerent macro-economic conditions.
When the two states of the world are signi® cantly ? when high frequency variations dominate, the series ofdiVerent, the set is concave along the north-east bound- temporal variation is said to have a ® ne grainary; when the two states are similar, the resulting set is ? when low frequency variations are most common, thehowever convex. More formally, if the distance series is said to have a coarse grain.23
between the two peaks of the two distributions (in
Fig. 3) is greater than twice the tolerance, s, i.e.Fig. 4 helps to explain these two complementary
concepts: difference between conditions; and frequency of| EÃ 1 2 EÃ 2 | > 2s (9)alternation between these conditions. The diagram
then the ® tness set is concave. When it is smaller than illustrates the variation of an indicator of national or
world performance such as GNP within a given period.2s, the ® tness set is convex. The main diVerence
between concave and convex ® tness sets can, therefore, The vertical distance between the two extreme envir-
onments (E1 : booms or undisturbed environment andbe summarized as follows. In concave sets, the line
connecting two pure types of strategies U1 and U2 lies E2 : slumps or disturbed one) measures the diVerencein terms of GDP units between them; the horizontaloutside the north-east boundary (meaning that, in
general, a mixed strategy ± i.e. a combination of two distance (along the time axis) between two booms (E1
and E9 1) measures the frequency or grain of temporalpure types of strategies ± will perform better than any
pure strategy). In convex sets, however, the same line variation of the environments. The series in Fig. 4a is
Dow
nloa
ded
by [
Uni
vers
ity o
f St
rath
clyd
e] a
t 08:
32 1
0 O
ctob
er 2
014
56 Francesca Gambarotto and Mario A. Maggioni
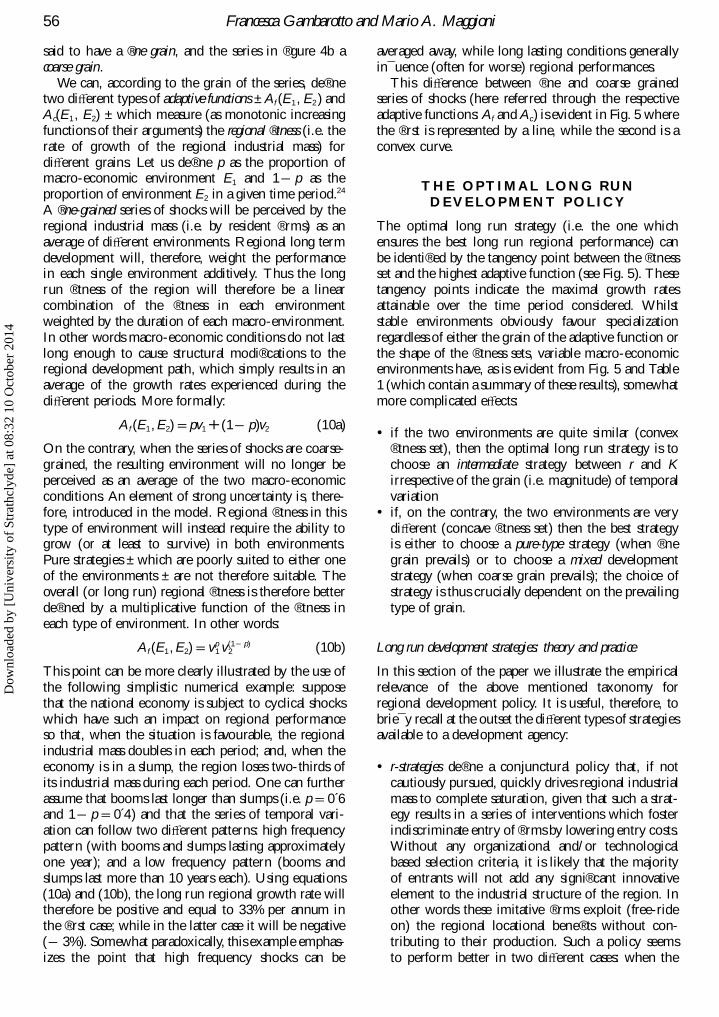
said to have a ® ne grain, and the series in ® gure 4b a averaged away, while long lasting conditions generally
in¯ uence (often for worse) regional performances.coarse grain.
We can, according to the grain of the series, de® ne This diVerence between ® ne and coarse grainedseries of shocks (here referred through the respectivetwo diVerent types of adaptive functions ± Af (E1 , E2 ) and
Ac(E1 , E2) ± which measure (as monotonic increasing adaptive functions: Af and Ac ) is evident in Fig. 5 where
the ® rst is represented by a line, while the second is afunctions of their arguments) the regional ® tness (i.e. the
rate of growth of the regional industrial mass) for convex curve.
diVerent grains. Let us de® ne p as the proportion ofmacro-economic environment E1 and 1 2 p as the
T HE OP T I MA L L ONG RUNproportion of environment E2 in a given time period.24
D E V E L OP ME NT P OL ICYA ® ne-grained series of shocks will be perceived by the
regional industrial mass (i.e. by resident ® rms) as an The optimal long run strategy (i.e. the one which
ensures the best long run regional performance) canaverage of diVerent environments. Regional long term
development will, therefore, weight the performance be identi® ed by the tangency point between the ® tnessset and the highest adaptive function (see Fig. 5). Thesein each single environment additively. Thus the long
run ® tness of the region will therefore be a linear tangency points indicate the maximal growth rates
attainable over the time period considered. Whilstcombination of the ® tness in each environment
weighted by the duration of each macro-environment. stable environments obviously favour specialization
regardless of either the grain of the adaptive function orIn other words macro-economic conditions do not last
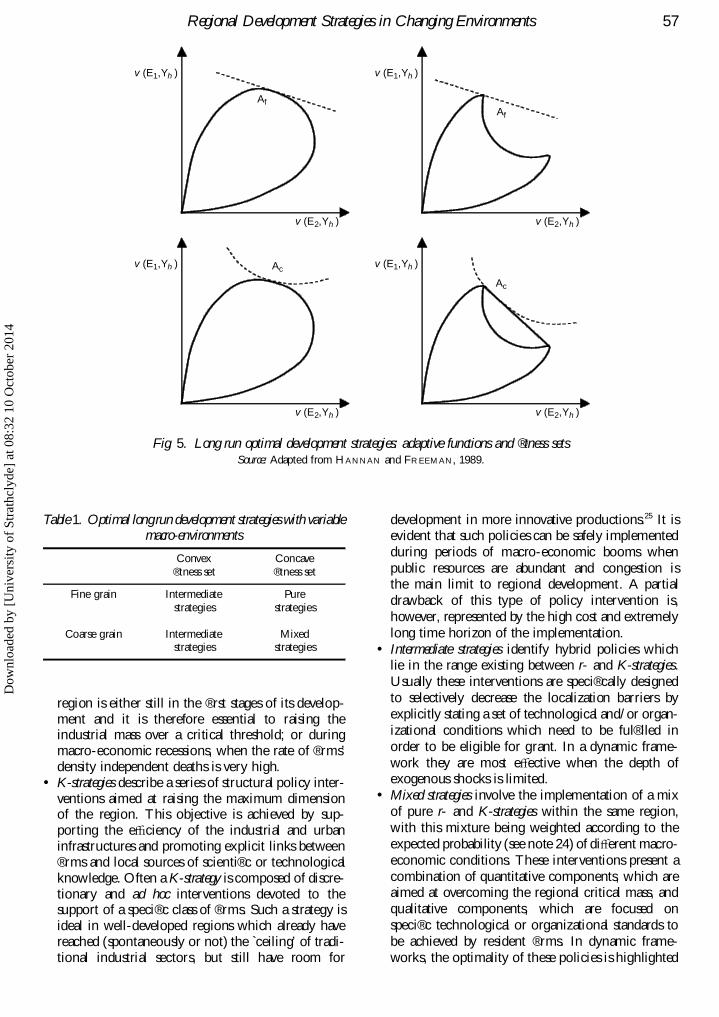
long enough to cause structural modi® cations to the the shape of the ® tness sets, variable macro-economicenvironments have, as is evident from Fig. 5 and Tableregional development path, which simply results in an
average of the growth rates experienced during the 1 (which contain a summary of these results), somewhat
more complicated eVects:diVerent periods. More formally:
Af (E1 , E2) 5 pv1 1 (1 2 p)v2 (10a) ? if the two environments are quite similar (convexOn the contrary, when the series of shocks are coarse- ® tness set), then the optimal long run strategy is to
choose an intermediate strategy between r and Kgrained, the resulting environment will no longer be
perceived as an average of the two macro-economic irrespective of the grain (i.e. magnitude) of temporal
variationconditions. An element of strong uncertainty is, there-
fore, introduced in the model. Regional ® tness in this ? if, on the contrary, the two environments are very
diVerent (concave ® tness set) then the best strategytype of environment will instead require the ability togrow (or at least to survive) in both environments. is either to choose a pure-type strategy (when ® ne
grain prevails) or to choose a mixed developmentPure strategies ± which are poorly suited to either one
of the environments ± are not therefore suitable. The strategy (when coarse grain prevails); the choice of
strategy is thus crucially dependent on the prevailingoverall (or long run) regional ® tness is therefore better
de® ned by a multiplicative function of the ® tness in type of grain.
each type of environment. In other words:
Af (E1 , E2) 5 v p1 v (1 2 p)
2 (10b) Long run development strategies: theory and practice
This point can be more clearly illustrated by the use of In this section of the paper we illustrate the empirical
relevance of the above mentioned taxonomy forthe following simplistic numerical example: suppose
that the national economy is subject to cyclical shocks regional development policy. It is useful, therefore, to
brie¯ y recall at the outset the diVerent types of strategieswhich have such an impact on regional performanceso that, when the situation is favourable, the regional available to a development agency:
industrial mass doubles in each period; and, when the
economy is in a slump, the region loses two-thirds of ? r-strategies de® ne a conjunctural policy that, if not
cautiously pursued, quickly drives regional industrialits industrial mass during each period. One can further
assume that booms last longer than slumps (i.e. p 5 0 6́ mass to complete saturation, given that such a strat-egy results in a series of interventions which fosterand 1 2 p 5 0 4́) and that the series of temporal vari-
ation can follow two diVerent patterns: high frequency indiscriminate entry of ® rms by lowering entry costs.
Without any organizational and/or technologicalpattern (with booms and slumps lasting approximately
one year); and a low frequency pattern (booms and based selection criteria, it is likely that the majority
of entrants will not add any signi® cant innovativeslumps last more than 10 years each). Using equations
(10a) and (10b), the long run regional growth rate will element to the industrial structure of the region. Inother words these imitative ® rms exploit (free-ridetherefore be positive and equal to 33% per annum in
the ® rst case; while in the latter case it will be negative on) the regional locational bene® ts without con-
tributing to their production. Such a policy seems( 2 3%). Somewhat paradoxically, this example emphas-
izes the point that high frequency shocks can be to perform better in two diVerent cases: when the
Dow
nloa
ded
by [
Uni
vers
ity o
f St
rath
clyd
e] a
t 08:
32 1
0 O
ctob
er 2
014
Regional Development Strategies in Changing Environments 57
v (E1,Yh )
Af
v (E2,Yh )
v (E1,Yh )
Af
v (E2,Yh )
v (E1,Yh ) Ac
v (E2,Yh )
v (E1,Yh )
v (E2,Yh )
Ac
Fig. 5. Long run optimal development strategies: adaptive functions and ® tness setsSource: Adapted from HANNAN and FREEMAN, 1989.
Table 1. Optimal long run development strategies with variable development in more innovative productions.25 It ismacro-environments evident that such policies can be safely implemented
during periods of macro-economic booms whenConvex Concave
public resources are abundant and congestion is® tness set ® tness set
the main limit to regional development. A partialFine grain Intermediate Pure
drawback of this type of policy intervention is,strategies strategies
however, represented by the high cost and extremely
long time horizon of the implementation.Coarse grain Intermediate Mixed
strategies strategies ? Intermediate strategies identify hybrid policies which
lie in the range existing between r- and K-strategies.
Usually these interventions are speci® cally designed
to selectively decrease the localization barriers byregion is either still in the ® rst stages of its develop-explicitly stating a set of technological and/or organ-ment and it is therefore essential to raising theizational conditions which need to be ful® lled inindustrial mass over a critical threshold; or duringorder to be eligible for grant. In a dynamic frame-macro-economic recessions, when the rate of ® rms’work they are most eVective when the depth ofdensity independent deaths is very high.exogenous shocks is limited.? K-strategies describe a series of structural policy inter-
? Mixed strategies involve the implementation of a mixventions aimed at raising the maximum dimensionof pure r- and K-strategies within the same region,of the region. This objective is achieved by sup-with this mixture being weighted according to theporting the eYciency of the industrial and urbanexpected probability (see note 24) of diVerent macro-infrastructures and promoting explicit links betweeneconomic conditions. These interventions present a® rms and local sources of scienti® c or technologicalcombination of quantitative components, which areknowledge. Often a K-strategy is composed of discre-aimed at overcoming the regional critical mass, andtionary and ad hoc interventions devoted to thequalitative components, which are focused onsupport of a speci® c class of ® rms. Such a strategy isspeci® c technological or organizational standards toideal in well-developed regions which already havebe achieved by resident ® rms. In dynamic frame-reached (spontaneously or not) the c̀eiling’ of tradi-
tional industrial sectors, but still have room for works, the optimality of these policies is highlighted
Dow
nloa
ded
by [
Uni
vers
ity o
f St
rath
clyd
e] a
t 08:
32 1
0 O
ctob
er 2
014
58 Francesca Gambarotto and Mario A. Maggioni
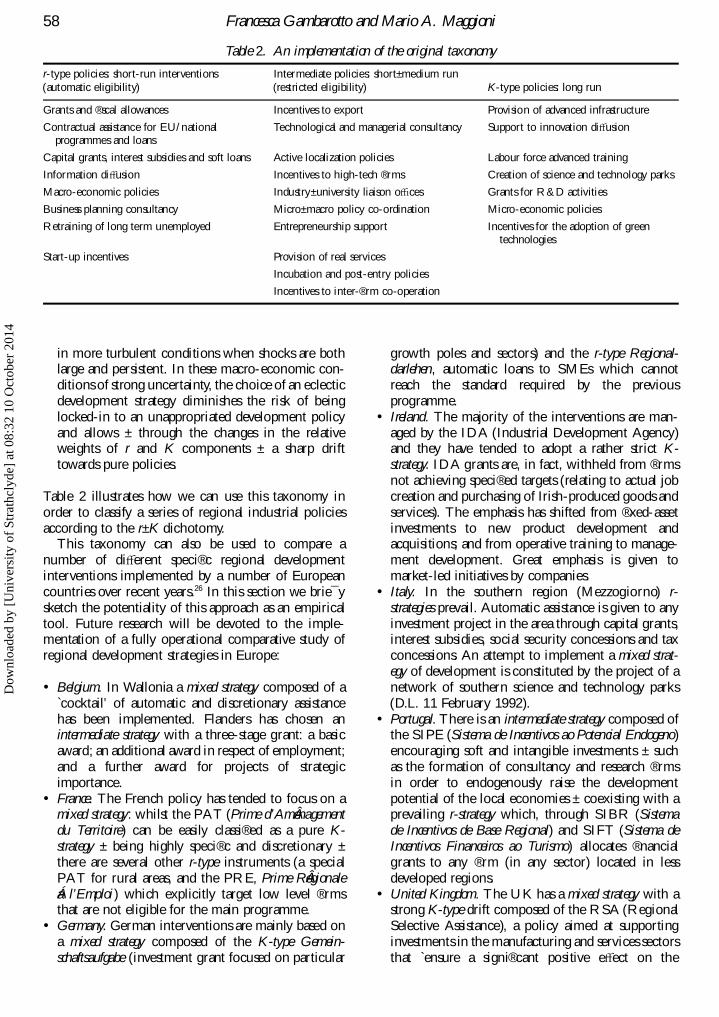
Table 2. An implementation of the original taxonomy
r-type policies: short-run interventions Intermediate policies: short± medium run
(automatic eligibility) (restricted eligibility) K-type policies: long run
Grants and ® scal allowances Incentives to export Provision of advanced infrastructure
Contractual assistance for EU/national Technological and managerial consultancy Support to innovation diVusion
programmes and loans
Capital grants, interest subsidies and soft loans Active localization policies Labour force advanced training
Information diVusion Incentives to high-tech ® rms Creation of science and technology parks
Macro-economic policies Industry± university liaison oYces Grants for R&D activities
Business planning consultancy Micro± macro policy co-ordination Micro-economic policies
Retraining of long term unemployed Entrepreneurship support Incentives for the adoption of green
technologies
Start-up incentives Provision of real services
Incubation and post-entry policies
Incentives to inter-® rm co-operation
in more turbulent conditions when shocks are both growth poles and sectors) and the r-type Regional-darlehen, automatic loans to SMEs which cannotlarge and persistent. In these macro-economic con-
ditions of strong uncertainty, the choice of an eclectic reach the standard required by the previous
programme.development strategy diminishes the risk of being
locked-in to an unappropriated development policy ? Ireland. The majority of the interventions are man-
aged by the IDA (Industrial Development Agency)and allows ± through the changes in the relativeweights of r and K components ± a sharp drift and they have tended to adopt a rather strict K-
strategy. IDA grants are, in fact, withheld from ® rmstowards pure policies.
not achieving speci® ed targets (relating to actual job
creation and purchasing of Irish-produced goods andTable 2 illustrates how we can use this taxonomy in
order to classify a series of regional industrial policies services). The emphasis has shifted from ® xed-asset
investments to new product development andaccording to the r± K dichotomy.This taxonomy can also be used to compare a acquisitions; and from operative training to manage-
ment development. Great emphasis is given tonumber of diVerent speci® c regional development
interventions implemented by a number of European market-led initiatives by companies.
? Italy. In the southern region (Mezzogiorno) r-countries over recent years.26 In this section we brie¯ y
sketch the potentiality of this approach as an empirical strategies prevail. Automatic assistance is given to any
investment project in the area through capital grants,tool. Future research will be devoted to the imple-mentation of a fully operational comparative study of interest subsidies, social security concessions and tax
concessions. An attempt to implement a mixed strat-regional development strategies in Europe:
egy of development is constituted by the project of a
network of southern science and technology parks? Belgium. In Wallonia a mixed strategy composed of a
c̀ocktail’ of automatic and discretionary assistance (D.L. 11 February 1992).
? Portugal. There is an intermediate strategy composed ofhas been implemented. Flanders has chosen anintermediate strategy with a three-stage grant: a basic the SIPE (Sistema de Incentivos ao Potencial Endogeno)
encouraging soft and intangible investments ± suchaward; an additional award in respect of employment;
and a further award for projects of strategic as the formation of consultancy and research ® rms
in order to endogenously raise the developmentimportance.
? France. The French policy has tended to focus on a potential of the local economies ± coexisting with aprevailing r-strategy which, through SIBR (Sistemamixed strategy: whilst the PAT (Prime d’Ame nagement
du Territoire) can be easily classi® ed as a pure K- de Incentivos de Base Regional) and SIFT (Sistema de
Incentivos Financeiros ao Turismo) allocates ® nancialstrategy ± being highly speci® c and discretionary ±
there are several other r-type instruments (a special grants to any ® rm (in any sector) located in less
developed regions.PAT for rural areas, and the PRE, Prime Re gionale
aÁ l’Emploi ) which explicitly target low level ® rms ? United Kingdom. The UK has a mixed strategy with astrong K-type drift composed of the RSA (Regionalthat are not eligible for the main programme.
? Germany. German interventions are mainly based on Selective Assistance), a policy aimed at supporting
investments in the manufacturing and services sectorsa mixed strategy composed of the K-type Gemein-
schaftsaufgabe (investment grant focused on particular that `ensure a signi® cant positive eVect on the
Dow
nloa
ded
by [
Uni
vers
ity o
f St
rath
clyd
e] a
t 08:
32 1
0 O
ctob
er 2
014
Regional Development Strategies in Changing Environments 59
versions of this paper and the participants in the 25thregional economy and raise or keep constant the levelRSAI Conference, English and Irish Section, held at Trinityof regional employment’, and the REG (RegionalCollege, University of Dublin, in September 1994 and inEnterprise Grant), a policy fostering ® xed investmentthe workshop on Regional Development Models held atand innovative behaviour for SMEs of any sectorBocconi University on 17 March 1995. The paper is the
located in less developed areas.fruit of a joint eVort by both authors. However, the sections
entitled: Introduction; the extra-regional environment; andThe Optimal Long Run Development Policy have beenCONCL US IONS A NDwritten by F. Gambarotto; the remaining ones by M. A.ME T HOD O L OG ICA L RE MA RKSMaggioni. The usual caveats apply.
This paper has presented an application of ecologically-
derived models to the ® eld of regional economics, NOT E Shighlighting the ability of this methodology to suit the
1. In the paper, the number of located ® rms is used asdynamic analysis of both regional development andindex of industrial growth. For a detailed discussion seeregional development policies, at the same timenote 7.emphasizing the in¯ uence of macro-economic condi-
2. In this section the possibility of sudden shocks, structuraltions on regional performance. The relative simplicity
changes and density independent mortality rates haveof the framework has not, however, prevented the
been ruled out. Some of these restrictions will, however,attainment of a number of signi® cant results. In particu- be relaxed later in the paper.lar, we have shown that the success of a development 3. Equation (1) summarizes in analytical form the follow-policy (and consequently the regional performance in ing: that ® rms’ location decisions depend on pro® tabilityterms of the growth rate of its industrial mass) depends expectation; expectations depend on locational bene® ts;
to some extent on the matching of speci® c interven- locational bene® ts are composed of observable and
unobservable elements.tions with the following conditions:4. Composed of two main categories: ® rms already estab-
1. The relative stage of regional internal development lished outside the region; and potential entrepreneurs± is the regional industrial mass still struggling to inside the region looking for the right moment to startachieve a critical dimension or is it constrained by their own business.
5. In the original ecological literature K is often simplyan already stretched carrying capacity in terms ofassumed to be an exogenous parameter dependent onregional resources and infrastructures?the physiological features of the population.2. The degree of sensitivity, or dependence, of the
6. This assumption can, however, easily be relaxed byregion with respect to public policies ± is regionalassigning the locational bene® ts of the region a valuedevelopment heavily dependent on public interven-equal to the diVerence in locational bene® ts between
tion or is it almost an autonomous process drivenoutside and inside the region.
by private investment? 7. Throughout the paper the size or economic mass of a3. The state of the external global macro-economic region is approximated by the number of located ® rms.
conditions ± is the nation/world economy in a This index can easily be substituted by a more realisticboom or recessionary phase? proxy of the ® rms’ dimensions (such as employment or
4. The scale, multiregional, national or international, sales). However the number of ® rms has an obvious
advantage in its simplicity and is the best indicator whenof the relevant environment ± what is the mostthe inter-® rm relationships at study (i.e. knowledgein¯ uential geo-economic context for the regionalspillovers) are independent of ® rm size.economy; what is the degree of national/inter-
8. B and B9 underline the importance of analysing bothnational openness of the region?costs and bene® ts to avoid damaging misrepresentation5. The depth and frequency of external shocks, withof the economic reality.
respect to the structure of the regional industrial9. These entries support a process of turnover without
mass. causing changes to the equilibrium level.
10. It is, in fact, a simple density-dependent growth model,The taxonomy we have presented has also been shownand it is the ® rst two terms in a power series expansionto be an eVective tool for the classi® cation of theof a general growth model where the individual ® rm’s
plethora of policies designed and implemented incontribution to regional growth is a function of the
Europe. Further research is, however, required in orderactual size of the region population (cf. ROUGH-
to identify a compact set of indicators and gather aGARDEN, 1979; DENDRINOS and MULLALLY, 1985).
signi® cant sample of speci® c interventions. The next 11. Referring to Fig. 2, the other main critical regionalstep will, therefore, be to include the empirical test dimensions, in terms of the underlining parameters ofof a g̀eneral rule’ of successful regional industrial the net bene® t function are as follows:
development policies.
A 5b 2 b2 1 4ac
2a, C 5
b
2a, X 5
b 1 b2 1 3ac
3a
12. Therefore r measures the growth rate of a region whenAcknowledgements ± The authors wish to thank U. Bell
and P. Stoneman for comments and observations on previous there are no limits on available resources.
Dow
nloa
ded
by [
Uni
vers
ity o
f St
rath
clyd
e] a
t 08:
32 1
0 O
ctob
er 2
014
60 Francesca Gambarotto and Mario A. Maggioni
of the prevailing production of the region. It is therefore13. A `measure of the amount of renewable resources in thepossible to rank regions according to the relevance ofenvironment in units of the number of organisms thesethe external environment on their performance, fromresources can support’ (ROUGHGARDEN, 1979, p. 305).the isolated region which has local input and outputWithin a regional economics framework, K refers to themarkets, to the intermediate, whose economy operatesamount of production factors and consumers endowedmainly within national borders, to the internationallyto a region, measured through the maximum number ofconnected case.® rms this region can sustain.
18. For an exhaustive survey of the literature on business14. Throughout the paper t̀echnology’ denotes, rathercycles, long waves, etc. see ROSTOW, 1990.loosely, any method of transforming inputs into outputs
19. The ® tness function measures the degree of impact ofand t̀echnological level’ refers mainly to the eYciencyregional policies. In other words, the dependence ofof this transformation process. The more eYcient is theregional performances on public interventions. A t̀alltransformation of inputs into outputs, the higher is theand thin’ bell identi® es a region which is very reactivetechnological level.and deeply dependent on public policies; a `̄ at and15. HANNAN and FREEMAN, 1989, use the distinctionthick’ bell identi® es a region which is unresponsive/between r- and K-strategies in relation to the diVerentindiVerent to public interventions and whose growthtypes of ® rms that enter a new market. Their taxonomydepends only on internal characteristics and dynamics.has been slightly modi® ed and adapted (see MAGGIONI ,
20. Two diVerent environments are, for example, the booms1993) in order to describe the process of regional loca-and the slumps of a capitalist economy’s growth.
tion. In the ® rst phase, the region is entered by small21. More details on speci® c types of policies can be found
creative ® rms whose optimal strategy is to quickly exploitin the next section.
new and ephemeral opportunities; in the second phase,22. `Grain refers to the pattern of mixing of diVerent
when the region is already approaching the equilibriumenvironments in a spatial or temporal distribution’
level and the competition becomes ® ercer, most of(HANNAN and FREEMAN, 1989, p. 106).
the new entrants are highly eYcient, standardized mass23. The frequency is considered high when a given macro-
producers that have developed a cost or technical advant-environment lasts less than the average life of a typical
age over their direct competitors. In high-tech clusters ® rm within the region.± such as Silicon Valley and Boston Route 128 ± the 24. p and 1 2 p can be considered either as proportions of a® rst phase of development registered a majority of g̀ar- diVerent environment in an ex post perspective; or asage’ and university spin-oV ® rms (whose main emphasis probabilities, in an ex ante perspective. In this last caseis on R&D and not on manufacturing); while the we are assuming that the regional authority bases itssecond (often referred to as the rationalization phase) forecasts of macro-economic variations (i.e. by calculat-witnesses the entry of major ® rms with larger production ing the probabilities p and p 2 1 according to an adaptivefacilities, aimed at reaching eYciency and low costs expectation model based on a weighted average of thethrough standardization procedures. past n periods).
16. Another possible bi-regional interaction concerning a 25. One must, however, bear in mind the fact that ancentre± periphery model refers to the predatory behav- indirect eVect of such a policy is the increase of theiour of the central regions whose development is localization barriers by raising the technological level ofobtained at the expense of the peripheral one. the average ® rm in the region.
17. The scale of this external environment can be either 26. For an exhaustive survey of the matter, see YUILL
et al., 1992.national or international, being dependent on the nature
RE F E RE NCE S
DENDRINOS D. S. and MULLALLY H. (1983) Empirical evidence of Volterra± Lotka dynamics in US metropolitan areas:
1947± 1977, in GRIFFITH D. and LEA T. (Eds) Evolving Geographical Structures. Martinus NijhoV, Amsterdam.DENDRINOS D. S. and MULLALLY H. (1985) Urban Evolution: Studies in the Mathematical Ecology of Cities. Oxford University
Press, Oxford.
GAMBARO TTO F. (1993) The fertility of biological analogy in economics: the case of spatial competition, Quaderni del Dip.di Scienze Economiche `Marco Fanno’ n. 23, University of Padua.
H ANNAN M. T. and FREEMAN J. (1989) Organizational Ecology. Harvard University Press, Cambridge, MA.
ISARD W. (1956) Location and Space-economy. MIT Press, Cambridge, MA.
LEVINS R. (1968) Evolution in Changing Environments: Some Theoretical Explorations. Princeton University Press, Princeton, NJ.MAGGIONI M. A. (1993) Ecological dynamics and critical mass processes in the location of high-tech ® rms, paper presented
at the 40th RSAI Conference, November, Houston, TX.
MAGGIONI M. A. (1994) Modelli ecologici per l’analisi della dinamica industriale regionale, in PASQUINI F., POMPILI T. andSECONDINI P. (Eds) Modelli d’Analisi e d’Intervento per un Nuovo Regionalismo. Franco Angeli, Milan.
MAGGIONI M. A. and P ORRO G. (1994) Il ruolo delle aspettative in modelli di tipo ecologico, paper presented at the XV
Conference AISRe, October, Matera.MAY R. M. (1976) (Ed) Theoretical Ecology. Blackwell Scienti® c, Oxford.
M IYAO T. and KANEMOTO Y. (1987) Urban Dynamics and Urban Externalities. Harwood Academic, London.
Dow
nloa
ded
by [
Uni
vers
ity o
f St
rath
clyd
e] a
t 08:
32 1
0 O
ctob
er 2
014
Regional Development Strategies in Changing Environments 61
REGGIANI A. and N IJKAMP P. (1994) Evolutionary dynamics in technological systems: a multi-layer niche approach, inLEYDESDORFF L. and VAN DEN BESSELAAR P. (Eds) Evolutionary Economics and Chaos Theory. Frances Pinter, London.
ROSTOW W. W. (1990) Theorists of Economic Growth from David Hume to the Present. Oxford University Press, Oxford.
P APAGEORGIOU Y. Y. (1979) Agglomerations, Reg. Sci. Urban Econ. 9, 41± 9.ROUGHGARDEN J. (1979) Theory of Population Genetics and Evolutionary Ecology: An Introduction. Macmillan, New York.
S ONIS M. (1986) A uni® ed theory of innovation diVusion, dynamic choice of alternatives, ecological dynamics and urban
regional growth and decline, Ricerche Economiche 14, 696± 723.S UAREZ-V ILLA L. (1993) The dynamics of regional invention and innovation: innovative capacity and regional change in the
20th century, Geogr. Analysis 25, 147± 64.
VOLTERRA V. (1926) Variazione e ¯ uttuazioni del numero d’ individui in specie animali conviventi, Memorie AccademiaNazionale dei Lincei 2, 31± 113.
YUILL D., ALLEN K., BACHTLER J. and W ISHLADE F. (1992) European Regional Incentives. Bowker-Saur, London.
Dow
nloa
ded
by [
Uni
vers
ity o
f St
rath
clyd
e] a
t 08:
32 1
0 O
ctob
er 2
014