Embed Size (px)
Citation preview
This article was downloaded by: [Ohio University Libraries]On: 06 October 2013, At: 06:43Publisher: Taylor & FrancisInforma Ltd Registered in England and Wales Registered Number: 1072954 Registered office: Mortimer House,37-41 Mortimer Street, London W1T 3JH, UK
North American Journal of Fisheries ManagementPublication details, including instructions for authors and subscription information:http://www.tandfonline.com/loi/ujfm20
Regional Economic Impact Assessments of RecreationalFisheries: An Application of the IMPLAN ModelingSystem to Marine Party and Charter Boat Fishing inMaineScott R. Steinback aa Social Sciences Branch, National Marine Fisheries Service, Northeast Fisheries ScienceCenter, Woods Hole, Massachusetts, 02543-1097, USAPublished online: 09 Jan 2011.
To cite this article: Scott R. Steinback (1999) Regional Economic Impact Assessments of Recreational Fisheries: An Applicationof the IMPLAN Modeling System to Marine Party and Charter Boat Fishing in Maine, North American Journal of FisheriesManagement, 19:3, 724-736, DOI: 10.1577/1548-8675(1999)019<0724:REIAOR>2.0.CO;2
To link to this article: http://dx.doi.org/10.1577/1548-8675(1999)019<0724:REIAOR>2.0.CO;2
PLEASE SCROLL DOWN FOR ARTICLE
Taylor & Francis makes every effort to ensure the accuracy of all the information (the “Content”) containedin the publications on our platform. However, Taylor & Francis, our agents, and our licensors make norepresentations or warranties whatsoever as to the accuracy, completeness, or suitability for any purpose of theContent. Any opinions and views expressed in this publication are the opinions and views of the authors, andare not the views of or endorsed by Taylor & Francis. The accuracy of the Content should not be relied upon andshould be independently verified with primary sources of information. Taylor and Francis shall not be liable forany losses, actions, claims, proceedings, demands, costs, expenses, damages, and other liabilities whatsoeveror howsoever caused arising directly or indirectly in connection with, in relation to or arising out of the use ofthe Content.
This article may be used for research, teaching, and private study purposes. Any substantial or systematicreproduction, redistribution, reselling, loan, sub-licensing, systematic supply, or distribution in anyform to anyone is expressly forbidden. Terms & Conditions of access and use can be found at http://www.tandfonline.com/page/terms-and-conditions
724
North American Journal of Fisheries Management 19:724–736, 1999American Fisheries Society 1999
Regional Economic Impact Assessments ofRecreational Fisheries: An Application of the
IMPLAN Modeling System to Marine Party andCharter Boat Fishing in Maine
SCOTT R. STEINBACK*Social Sciences Branch, National Marine Fisheries Service,
Northeast Fisheries Science Center, Woods Hole, Massachusetts 02543-1097, USA
Abstract.—Regional economic impact assessments (EIAs) of recreational fisheries reveal howanglers’ expenditures affect economic activity such as sales, income, and employment in a par-ticular region. Unfortunately, most EIA studies report only the final impacts of the EIA, withoutdescribing the economic interdependencies that produced the impacts or how the results shouldand should not be used to guide management decisions. This is particularly troublesome becausemost resource managers only vaguely understand how EIA models work and how to interpret theresults in a fisheries management framework. The purpose of this article is to provide a startingpoint toward establishing consistent and defensible techniques for conducting regional EIAs ofrecreational fisheries and to explore the appropriate uses of EIA outputs as they relate to thegrowing needs of natural resource managers. Using marine recreational party and charter boatfishing in Maine in 1996 as an example, an EIA was conducted with the IMPLAN (Impact analysisfor Planning) input–output system. Economic impacts were analyzed separately for Maine residentsand nonresidents, and a linear production function that represented average for-hire operatingexpenditures was developed and integrated into the input–output model. Direct, indirect, andinduced economic impacts were estimated for sales, income, and employment. In total, the US$1.12million spent in Maine by nonresident party and charter anglers in 1996 resulted in $1.04 millionin sales that remained within the state, $393 thousand in additional income, and supported ap-proximately 37 jobs. Resident expenditures in 1996 totaled $276 thousand and generated $225thousand in instate sales, $82 thousand in income, and approximately 10 jobs. The impacts ofnonresident expenditures were generally five times greater than that of their resident counterparts.However, the actual economic impact of resident expenditures depends on assumptions regardingthe absence of the marine for-hire fishery in Maine. Although the model’s multipliers may be usedto predict the total impacts of changes in expenditures by party and charter boat anglers, it isimportant to understand their limitations. The procedures and data sets applied here, if used inconjunction with future versions of IMPLAN, can serve as a foundation for updating the Maineinput–output model provided in this study and for developing economic impact assessments ofrecreational fisheries in other states.
In 1996 over 8 million saltwater anglers fished64 million days in the United States.1 Fishing of-fers an important leisure outlet for many individ-uals and also generates economic activity in theform of sales, income, and employment throughoutthe country. Marine recreational fishing expendi-tures in the U.S. in 1996 generated approximatelyU.S.$25 million in sales, $6 million in income,and supported more than 287 thousand jobs (Ma-haraj and Carpenter, no date). At the subnationallevel, however, only a handful of published studies
* E-mail: [email protected] Estimates obtained from the U.S. Department of
Commerce, National Marine Fisheries Service, MarineRecreational Fisheries Statistics Survey, Internet site athttp://www.st.nmfs.gov/st1/recreational/index.html.
Received July 13, 1998; accepted March 30, 1999
have estimated the economic activity associatedwith recreational fisheries. These studies focusedon regions of various sizes: a multistate region(e.g., Great Lakes fishery, Talhelm 1988); entirestates (e.g., Florida, Bell et al. 1982; Massachu-setts, Storey and Allen 1993; and Virginia, Kirkleyand Kerstetter 1997); multiple counties acrossstates (e.g., Oklahoma–Texas, Schorr et al. 1995);and multiple counties within a state (e.g., Hous-ton–Galveston area of Texas, Ditton et al. 1980;Devils Lake area of North Dakota, Anderson et al.1986; and southern California, Wegge et al. 1986).All of these studies conducted various economicimpact assessments (EIAs) to evaluate how rec-reational fishing expenditures affected economicactivity such as sales, income, and employment ina particular region.
Unfortunately, most of the studies reported only
Dow
nloa
ded
by [
Ohi
o U
nive
rsity
Lib
rari
es]
at 0
6:43
06
Oct
ober
201
3
725ECONOMICS OF CHARTER BOAT FISHING
the final impacts of the EIA, without describingthe economic interdependencies that produced theimpacts or how the results should and should notbe used to guide decisions. This practice is likelyto spread with the growing popularity of ready-made regional economic impact models, which en-able regional scientists to generate economic im-pact estimates with limited knowledge or appre-ciation of the inner workings required for suchanalyses. This is particularly troublesome, becausemost resource managers only vaguely understandhow EIA models work and how to interpret theresults in a fisheries management framework.Thus, resource managers and EIA practitionersalike are becoming increasingly concerned aboutthe operational techniques used in EIAs and inimproving the information transfer between thesetwo groups. In addition, recent legislative require-ments have generated a renewed interest in re-gional EIAs. National Standard 8 of the recentlyamended Magnuson–Stevens Fishery and Conser-vation Management Act requires review of regu-latory impacts on fishing communities, and theRegulatory Flexibility Act and the SustainableFisheries Act require U.S. federal regulators to rec-ognize and assess the impacts of management ac-tions on communities and fishery-dependent andindependent businesses. At a policy level, the reg-ulatory requirements of these Acts can be partiallyfulfilled with a regional EIA.
The purpose of this article is to provide a start-ing point toward establishing consistent and de-fensible techniques for conducting regional EIAsof recreational fisheries and to explore the appro-priate uses of EIA outputs as they relate to thegrowing needs of natural resource managers. Us-ing marine recreational party and charter boat fish-ing in Maine in 1996 as an example, an EIA wasconducted with the most widely employed ready-made regional economic impact model: the IM-PLAN (Impact analysis for Planning) input–outputsystem. Although most of the discussion centersaround the use of IMPLAN to address a specificcomponent of recreational fisheries in the state ofMaine, the methodological and conceptual issuesapply equally well to other states and recreationalfishing modes in the U.S. The linkage between EIAand benefit-cost analysis is also elucidated in thispaper, although the distinction deserves greater de-tail and readers are encouraged to draw upon thevast literature for further clarification (e.g., Hu-shak 1987; Propst and Gavrilis 1987; Edwards1991; Lipton et al. 1995).
To provide information necessary for conduct-
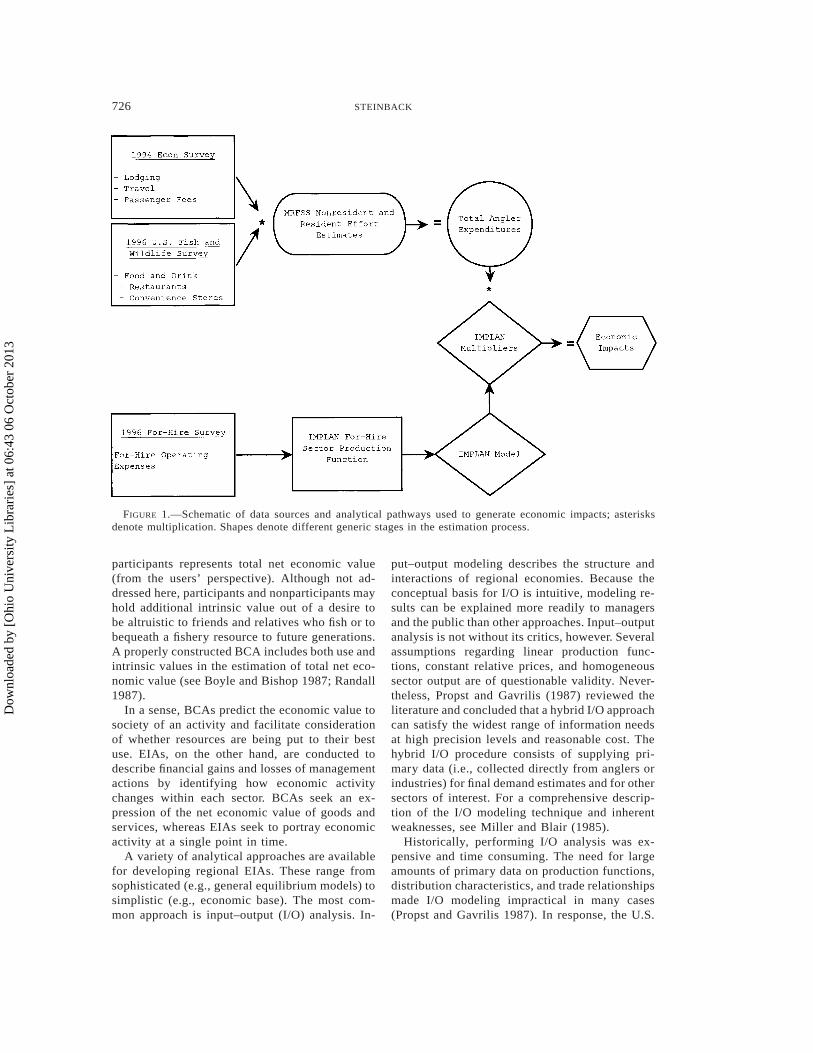
ing an EIA of Maine’s party and charter boat fish-ing industry, the National Marine Fisheries Ser-vice, Rutgers University, and the Maine Depart-ment of Marine Resources collected data on anglerexpenditures and associated operating expenses ofthe marine for-hire fishing businesses in Maineduring 1994 and 1996. In combination with anglerexpenditure information collected by the U.S. Fishand Wildlife Service, these data were incorporatedinto the IMPLAN input–output system to computeeconomic impacts of the for-hire marine recrea-tional fishing industry in Maine (Figure 1).
Economic Impact and Benefit-Cost Analysis
During the course of a for-hire fishing trip, an-glers purchase a variety of goods and services,spending money on boat fees, lodging, travel costs,and food and beverages. Businesses providingthese goods and services also must purchase goodsand services and hire employees, which in turn,generate more sales, income, and employment.
Three levels of economic impacts result frompurchases by party and charter fishermen: (1) di-rect, (2) indirect, and (3) induced. Direct impactsare the sales, income, and employment generatedfrom initial purchases by anglers (e.g., party andcharter access fees paid to owners of for-hire ves-sels). Indirect impacts are the sales, income, andemployment of industries that supply the directlyaffected industries (e.g., for-hire owners must pur-chase bait from supply shops, gasoline and oilfrom marine service stations, and procure loansfrom banks). Induced impacts represent the sales,income and employment resulting from expendi-tures by employees of the direct and indirect sec-tors (e.g., mates on party boats purchase groceriesand incur auto loans). The summation of direct,indirect, and induced impacts are total impacts.
Total impacts of recreational fishing are notequivalent to total net economic value. Benefit-cost analysis (BCA) measures the total net eco-nomic value of an activity, i.e., the difference be-tween total economic value and total costs. In thecontext of recreational fishing, total net economicvalue is generally defined as the additional valueabove opportunity costs (usually taken to be ex-penditures of time and money) that anglers wouldbe willing to pay in order to fish. Alternatively,willingness to pay in excess of actual expenditurescan be thought of as additional money an anglerwould spend to fish but is not required to spendand, instead, can be spent on other goods and ser-vices that provide additional value (Edwards1990). The summation of this extra money across
Dow
nloa
ded
by [
Ohi
o U
nive
rsity
Lib
rari
es]
at 0
6:43
06
Oct
ober
201
3
726 STEINBACK
FIGURE 1.—Schematic of data sources and analytical pathways used to generate economic impacts; asterisksdenote multiplication. Shapes denote different generic stages in the estimation process.
participants represents total net economic value(from the users’ perspective). Although not ad-dressed here, participants and nonparticipants mayhold additional intrinsic value out of a desire tobe altruistic to friends and relatives who fish or tobequeath a fishery resource to future generations.A properly constructed BCA includes both use andintrinsic values in the estimation of total net eco-nomic value (see Boyle and Bishop 1987; Randall1987).
In a sense, BCAs predict the economic value tosociety of an activity and facilitate considerationof whether resources are being put to their bestuse. EIAs, on the other hand, are conducted todescribe financial gains and losses of managementactions by identifying how economic activitychanges within each sector. BCAs seek an ex-pression of the net economic value of goods andservices, whereas EIAs seek to portray economicactivity at a single point in time.
A variety of analytical approaches are availablefor developing regional EIAs. These range fromsophisticated (e.g., general equilibrium models) tosimplistic (e.g., economic base). The most com-mon approach is input–output (I/O) analysis. In-
put–output modeling describes the structure andinteractions of regional economies. Because theconceptual basis for I/O is intuitive, modeling re-sults can be explained more readily to managersand the public than other approaches. Input–outputanalysis is not without its critics, however. Severalassumptions regarding linear production func-tions, constant relative prices, and homogeneoussector output are of questionable validity. Never-theless, Propst and Gavrilis (1987) reviewed theliterature and concluded that a hybrid I/O approachcan satisfy the widest range of information needsat high precision levels and reasonable cost. Thehybrid I/O procedure consists of supplying pri-mary data (i.e., collected directly from anglers orindustries) for final demand estimates and for othersectors of interest. For a comprehensive descrip-tion of the I/O modeling technique and inherentweaknesses, see Miller and Blair (1985).
Historically, performing I/O analysis was ex-pensive and time consuming. The need for largeamounts of primary data on production functions,distribution characteristics, and trade relationshipsmade I/O modeling impractical in many cases(Propst and Gavrilis 1987). In response, the U.S.
Dow
nloa
ded
by [
Ohi
o U
nive
rsity
Lib
rari
es]
at 0
6:43
06
Oct
ober
201
3
727ECONOMICS OF CHARTER BOAT FISHING
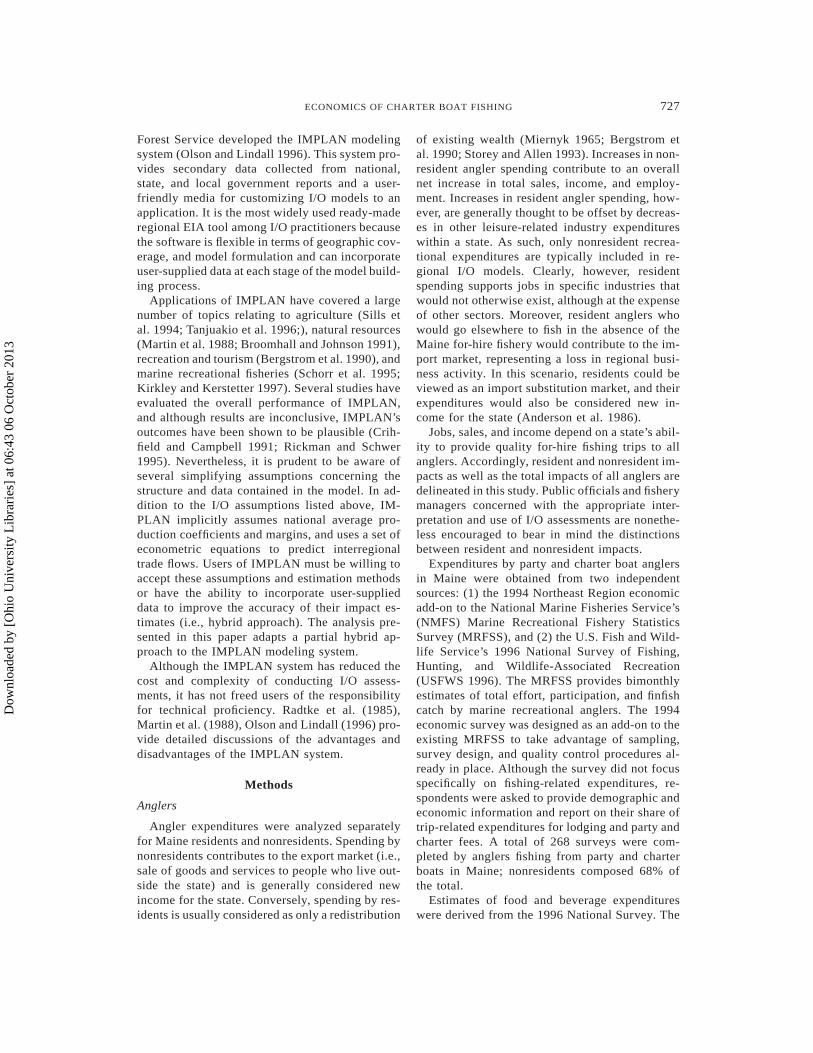
Forest Service developed the IMPLAN modelingsystem (Olson and Lindall 1996). This system pro-vides secondary data collected from national,state, and local government reports and a user-friendly media for customizing I/O models to anapplication. It is the most widely used ready-maderegional EIA tool among I/O practitioners becausethe software is flexible in terms of geographic cov-erage, and model formulation and can incorporateuser-supplied data at each stage of the model build-ing process.
Applications of IMPLAN have covered a largenumber of topics relating to agriculture (Sills etal. 1994; Tanjuakio et al. 1996;), natural resources(Martin et al. 1988; Broomhall and Johnson 1991),recreation and tourism (Bergstrom et al. 1990), andmarine recreational fisheries (Schorr et al. 1995;Kirkley and Kerstetter 1997). Several studies haveevaluated the overall performance of IMPLAN,and although results are inconclusive, IMPLAN’soutcomes have been shown to be plausible (Crih-field and Campbell 1991; Rickman and Schwer1995). Nevertheless, it is prudent to be aware ofseveral simplifying assumptions concerning thestructure and data contained in the model. In ad-dition to the I/O assumptions listed above, IM-PLAN implicitly assumes national average pro-duction coefficients and margins, and uses a set ofeconometric equations to predict interregionaltrade flows. Users of IMPLAN must be willing toaccept these assumptions and estimation methodsor have the ability to incorporate user-supplieddata to improve the accuracy of their impact es-timates (i.e., hybrid approach). The analysis pre-sented in this paper adapts a partial hybrid ap-proach to the IMPLAN modeling system.
Although the IMPLAN system has reduced thecost and complexity of conducting I/O assess-ments, it has not freed users of the responsibilityfor technical proficiency. Radtke et al. (1985),Martin et al. (1988), Olson and Lindall (1996) pro-vide detailed discussions of the advantages anddisadvantages of the IMPLAN system.
Methods
Anglers
Angler expenditures were analyzed separatelyfor Maine residents and nonresidents. Spending bynonresidents contributes to the export market (i.e.,sale of goods and services to people who live out-side the state) and is generally considered newincome for the state. Conversely, spending by res-idents is usually considered as only a redistribution
of existing wealth (Miernyk 1965; Bergstrom etal. 1990; Storey and Allen 1993). Increases in non-resident angler spending contribute to an overallnet increase in total sales, income, and employ-ment. Increases in resident angler spending, how-ever, are generally thought to be offset by decreas-es in other leisure-related industry expenditureswithin a state. As such, only nonresident recrea-tional expenditures are typically included in re-gional I/O models. Clearly, however, residentspending supports jobs in specific industries thatwould not otherwise exist, although at the expenseof other sectors. Moreover, resident anglers whowould go elsewhere to fish in the absence of theMaine for-hire fishery would contribute to the im-port market, representing a loss in regional busi-ness activity. In this scenario, residents could beviewed as an import substitution market, and theirexpenditures would also be considered new in-come for the state (Anderson et al. 1986).
Jobs, sales, and income depend on a state’s abil-ity to provide quality for-hire fishing trips to allanglers. Accordingly, resident and nonresident im-pacts as well as the total impacts of all anglers aredelineated in this study. Public officials and fisherymanagers concerned with the appropriate inter-pretation and use of I/O assessments are nonethe-less encouraged to bear in mind the distinctionsbetween resident and nonresident impacts.
Expenditures by party and charter boat anglersin Maine were obtained from two independentsources: (1) the 1994 Northeast Region economicadd-on to the National Marine Fisheries Service’s(NMFS) Marine Recreational Fishery StatisticsSurvey (MRFSS), and (2) the U.S. Fish and Wild-life Service’s 1996 National Survey of Fishing,Hunting, and Wildlife-Associated Recreation(USFWS 1996). The MRFSS provides bimonthlyestimates of total effort, participation, and finfishcatch by marine recreational anglers. The 1994economic survey was designed as an add-on to theexisting MRFSS to take advantage of sampling,survey design, and quality control procedures al-ready in place. Although the survey did not focusspecifically on fishing-related expenditures, re-spondents were asked to provide demographic andeconomic information and report on their share oftrip-related expenditures for lodging and party andcharter fees. A total of 268 surveys were com-pleted by anglers fishing from party and charterboats in Maine; nonresidents composed 68% ofthe total.
Estimates of food and beverage expenditureswere derived from the 1996 National Survey. The
Dow
nloa
ded
by [
Ohi
o U
nive
rsity
Lib
rari
es]
at 0
6:43
06
Oct
ober
201
3
728 STEINBACK
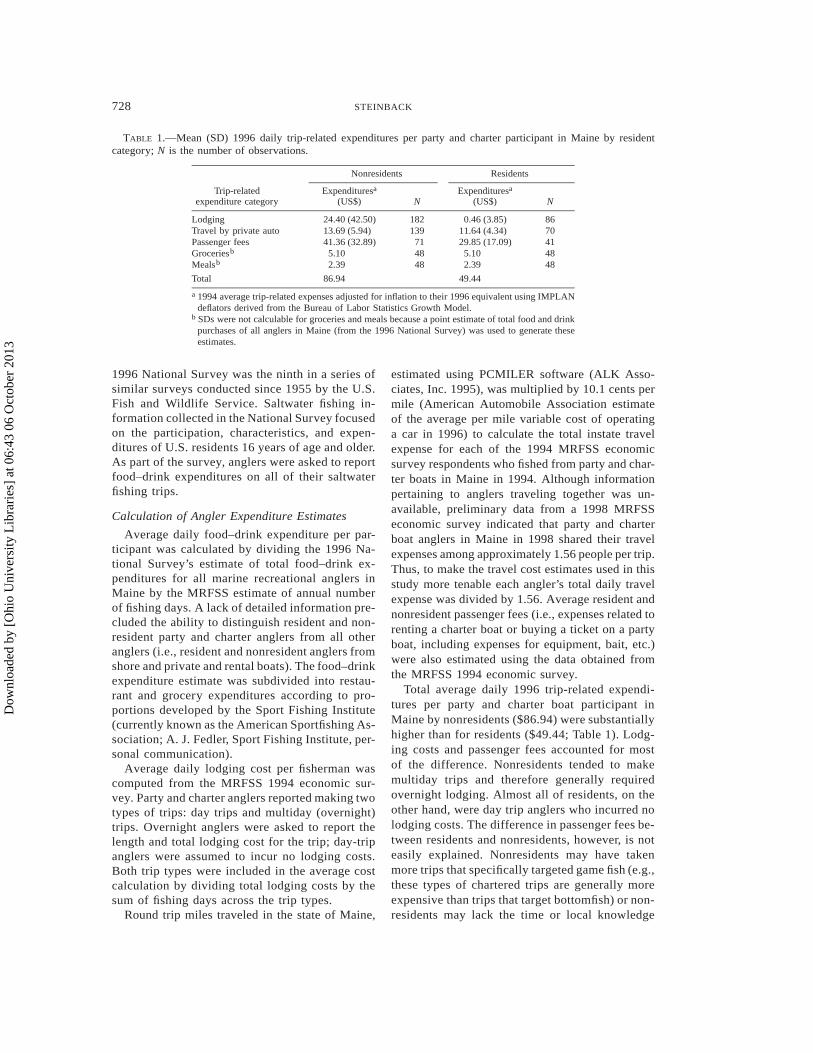
TABLE 1.—Mean (SD) 1996 daily trip-related expenditures per party and charter participant in Maine by residentcategory; N is the number of observations.
Trip-relatedexpenditure category
Nonresidents
Expendituresa
(US$) N
Residents
Expendituresa
(US$) N
LodgingTravel by private autoPassenger feesGroceriesb
Mealsb
Total
24.40 (42.50)13.69 (5.94)41.36 (32.89)5.102.39
86.94
182139714848
0.46 (3.85)11.64 (4.34)29.85 (17.09)5.102.39
49.44
8670414848
a 1994 average trip-related expenses adjusted for inflation to their 1996 equivalent using IMPLANdeflators derived from the Bureau of Labor Statistics Growth Model.
b SDs were not calculable for groceries and meals because a point estimate of total food and drinkpurchases of all anglers in Maine (from the 1996 National Survey) was used to generate theseestimates.
1996 National Survey was the ninth in a series ofsimilar surveys conducted since 1955 by the U.S.Fish and Wildlife Service. Saltwater fishing in-formation collected in the National Survey focusedon the participation, characteristics, and expen-ditures of U.S. residents 16 years of age and older.As part of the survey, anglers were asked to reportfood–drink expenditures on all of their saltwaterfishing trips.
Calculation of Angler Expenditure Estimates
Average daily food–drink expenditure per par-ticipant was calculated by dividing the 1996 Na-tional Survey’s estimate of total food–drink ex-penditures for all marine recreational anglers inMaine by the MRFSS estimate of annual numberof fishing days. A lack of detailed information pre-cluded the ability to distinguish resident and non-resident party and charter anglers from all otheranglers (i.e., resident and nonresident anglers fromshore and private and rental boats). The food–drinkexpenditure estimate was subdivided into restau-rant and grocery expenditures according to pro-portions developed by the Sport Fishing Institute(currently known as the American Sportfishing As-sociation; A. J. Fedler, Sport Fishing Institute, per-sonal communication).
Average daily lodging cost per fisherman wascomputed from the MRFSS 1994 economic sur-vey. Party and charter anglers reported making twotypes of trips: day trips and multiday (overnight)trips. Overnight anglers were asked to report thelength and total lodging cost for the trip; day-tripanglers were assumed to incur no lodging costs.Both trip types were included in the average costcalculation by dividing total lodging costs by thesum of fishing days across the trip types.
Round trip miles traveled in the state of Maine,
estimated using PCMILER software (ALK Asso-ciates, Inc. 1995), was multiplied by 10.1 cents permile (American Automobile Association estimateof the average per mile variable cost of operatinga car in 1996) to calculate the total instate travelexpense for each of the 1994 MRFSS economicsurvey respondents who fished from party and char-ter boats in Maine in 1994. Although informationpertaining to anglers traveling together was un-available, preliminary data from a 1998 MRFSSeconomic survey indicated that party and charterboat anglers in Maine in 1998 shared their travelexpenses among approximately 1.56 people per trip.Thus, to make the travel cost estimates used in thisstudy more tenable each angler’s total daily travelexpense was divided by 1.56. Average resident andnonresident passenger fees (i.e., expenses related torenting a charter boat or buying a ticket on a partyboat, including expenses for equipment, bait, etc.)were also estimated using the data obtained fromthe MRFSS 1994 economic survey.
Total average daily 1996 trip-related expendi-tures per party and charter boat participant inMaine by nonresidents ($86.94) were substantiallyhigher than for residents ($49.44; Table 1). Lodg-ing costs and passenger fees accounted for mostof the difference. Nonresidents tended to makemultiday trips and therefore generally requiredovernight lodging. Almost all of residents, on theother hand, were day trip anglers who incurred nolodging costs. The difference in passenger fees be-tween residents and nonresidents, however, is noteasily explained. Nonresidents may have takenmore trips that specifically targeted game fish (e.g.,these types of chartered trips are generally moreexpensive than trips that target bottomfish) or non-residents may lack the time or local knowledge
Dow
nloa
ded
by [
Ohi
o U
nive
rsity
Lib
rari
es]
at 0
6:43
06
Oct
ober
201
3
729ECONOMICS OF CHARTER BOAT FISHING
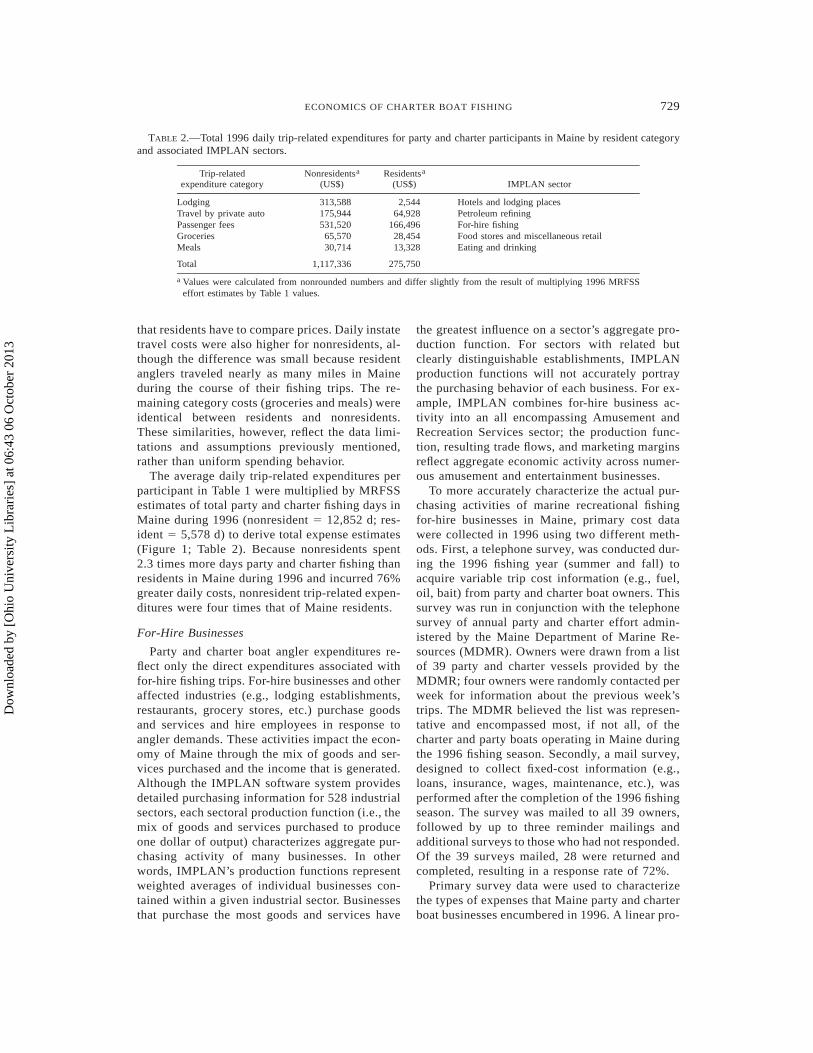
TABLE 2.—Total 1996 daily trip-related expenditures for party and charter participants in Maine by resident categoryand associated IMPLAN sectors.
Trip-relatedexpenditure category
Nonresidentsa
(US$)Residentsa
(US$) IMPLAN sector
LodgingTravel by private autoPassenger feesGroceriesMeals
Total
313,588175,944531,52065,57030,714
1,117,336
2,54464,928
166,49628,45413,328
275,750
Hotels and lodging placesPetroleum refiningFor-hire fishingFood stores and miscellaneous retailEating and drinking
a Values were calculated from nonrounded numbers and differ slightly from the result of multiplying 1996 MRFSSeffort estimates by Table 1 values.
that residents have to compare prices. Daily instatetravel costs were also higher for nonresidents, al-though the difference was small because residentanglers traveled nearly as many miles in Maineduring the course of their fishing trips. The re-maining category costs (groceries and meals) wereidentical between residents and nonresidents.These similarities, however, reflect the data limi-tations and assumptions previously mentioned,rather than uniform spending behavior.
The average daily trip-related expenditures perparticipant in Table 1 were multiplied by MRFSSestimates of total party and charter fishing days inMaine during 1996 (nonresident 5 12,852 d; res-ident 5 5,578 d) to derive total expense estimates(Figure 1; Table 2). Because nonresidents spent2.3 times more days party and charter fishing thanresidents in Maine during 1996 and incurred 76%greater daily costs, nonresident trip-related expen-ditures were four times that of Maine residents.
For-Hire Businesses
Party and charter boat angler expenditures re-flect only the direct expenditures associated withfor-hire fishing trips. For-hire businesses and otheraffected industries (e.g., lodging establishments,restaurants, grocery stores, etc.) purchase goodsand services and hire employees in response toangler demands. These activities impact the econ-omy of Maine through the mix of goods and ser-vices purchased and the income that is generated.Although the IMPLAN software system providesdetailed purchasing information for 528 industrialsectors, each sectoral production function (i.e., themix of goods and services purchased to produceone dollar of output) characterizes aggregate pur-chasing activity of many businesses. In otherwords, IMPLAN’s production functions representweighted averages of individual businesses con-tained within a given industrial sector. Businessesthat purchase the most goods and services have
the greatest influence on a sector’s aggregate pro-duction function. For sectors with related butclearly distinguishable establishments, IMPLANproduction functions will not accurately portraythe purchasing behavior of each business. For ex-ample, IMPLAN combines for-hire business ac-tivity into an all encompassing Amusement andRecreation Services sector; the production func-tion, resulting trade flows, and marketing marginsreflect aggregate economic activity across numer-ous amusement and entertainment businesses.
To more accurately characterize the actual pur-chasing activities of marine recreational fishingfor-hire businesses in Maine, primary cost datawere collected in 1996 using two different meth-ods. First, a telephone survey, was conducted dur-ing the 1996 fishing year (summer and fall) toacquire variable trip cost information (e.g., fuel,oil, bait) from party and charter boat owners. Thissurvey was run in conjunction with the telephonesurvey of annual party and charter effort admin-istered by the Maine Department of Marine Re-sources (MDMR). Owners were drawn from a listof 39 party and charter vessels provided by theMDMR; four owners were randomly contacted perweek for information about the previous week’strips. The MDMR believed the list was represen-tative and encompassed most, if not all, of thecharter and party boats operating in Maine duringthe 1996 fishing season. Secondly, a mail survey,designed to collect fixed-cost information (e.g.,loans, insurance, wages, maintenance, etc.), wasperformed after the completion of the 1996 fishingseason. The survey was mailed to all 39 owners,followed by up to three reminder mailings andadditional surveys to those who had not responded.Of the 39 surveys mailed, 28 were returned andcompleted, resulting in a response rate of 72%.
Primary survey data were used to characterizethe types of expenses that Maine party and charterboat businesses encumbered in 1996. A linear pro-
Dow
nloa
ded
by [
Ohi
o U
nive
rsity
Lib
rari
es]
at 0
6:43
06
Oct
ober
201
3
730 STEINBACK
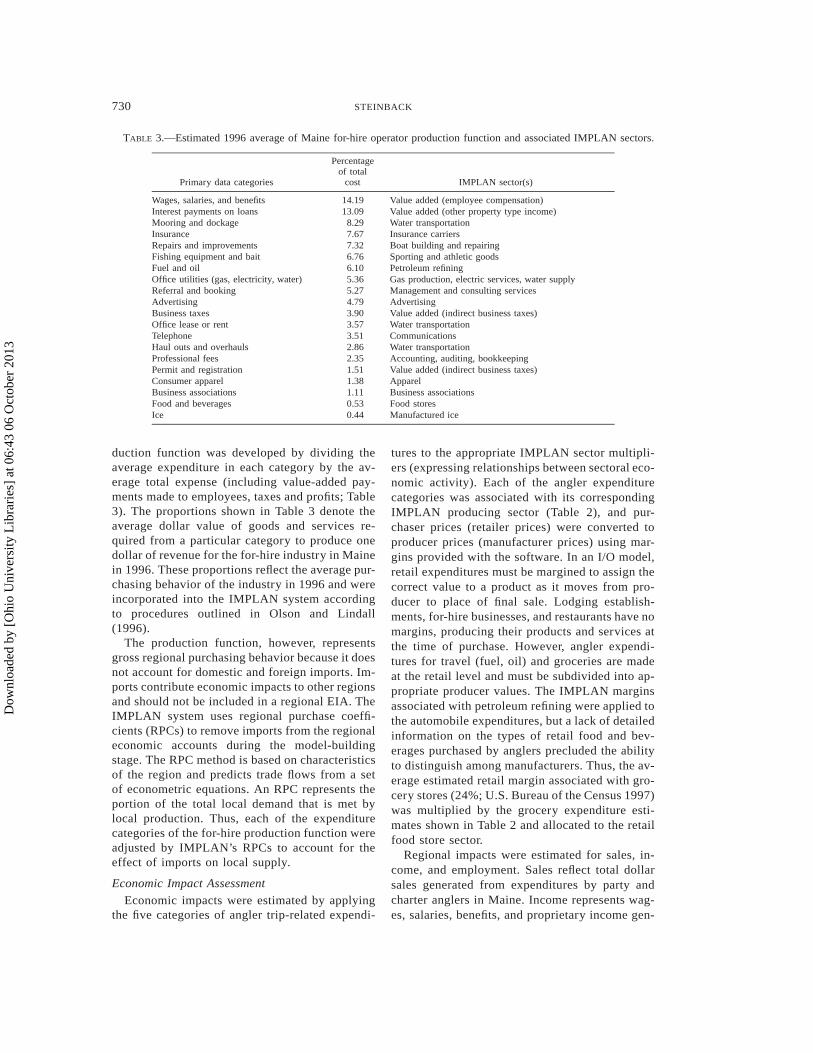
TABLE 3.—Estimated 1996 average of Maine for-hire operator production function and associated IMPLAN sectors.
Primary data categories
Percentageof total
cost IMPLAN sector(s)
Wages, salaries, and benefitsInterest payments on loansMooring and dockageInsuranceRepairs and improvementsFishing equipment and baitFuel and oilOffice utilities (gas, electricity, water)Referral and bookingAdvertisingBusiness taxesOffice lease or rentTelephoneHaul outs and overhaulsProfessional feesPermit and registrationConsumer apparel
14.1913.098.297.677.326.766.105.365.274.793.903.573.512.862.351.511.38
Value added (employee compensation)Value added (other property type income)Water transportationInsurance carriersBoat building and repairingSporting and athletic goodsPetroleum refiningGas production, electric services, water supplyManagement and consulting servicesAdvertisingValue added (indirect business taxes)Water transportationCommunicationsWater transportationAccounting, auditing, bookkeepingValue added (indirect business taxes)Apparel
Business associationsFood and beveragesIce
1.110.530.44
Business associationsFood storesManufactured ice
duction function was developed by dividing theaverage expenditure in each category by the av-erage total expense (including value-added pay-ments made to employees, taxes and profits; Table3). The proportions shown in Table 3 denote theaverage dollar value of goods and services re-quired from a particular category to produce onedollar of revenue for the for-hire industry in Mainein 1996. These proportions reflect the average pur-chasing behavior of the industry in 1996 and wereincorporated into the IMPLAN system accordingto procedures outlined in Olson and Lindall(1996).
The production function, however, representsgross regional purchasing behavior because it doesnot account for domestic and foreign imports. Im-ports contribute economic impacts to other regionsand should not be included in a regional EIA. TheIMPLAN system uses regional purchase coeffi-cients (RPCs) to remove imports from the regionaleconomic accounts during the model-buildingstage. The RPC method is based on characteristicsof the region and predicts trade flows from a setof econometric equations. An RPC represents theportion of the total local demand that is met bylocal production. Thus, each of the expenditurecategories of the for-hire production function wereadjusted by IMPLAN’s RPCs to account for theeffect of imports on local supply.
Economic Impact Assessment
Economic impacts were estimated by applyingthe five categories of angler trip-related expendi-
tures to the appropriate IMPLAN sector multipli-ers (expressing relationships between sectoral eco-nomic activity). Each of the angler expenditurecategories was associated with its correspondingIMPLAN producing sector (Table 2), and pur-chaser prices (retailer prices) were converted toproducer prices (manufacturer prices) using mar-gins provided with the software. In an I/O model,retail expenditures must be margined to assign thecorrect value to a product as it moves from pro-ducer to place of final sale. Lodging establish-ments, for-hire businesses, and restaurants have nomargins, producing their products and services atthe time of purchase. However, angler expendi-tures for travel (fuel, oil) and groceries are madeat the retail level and must be subdivided into ap-propriate producer values. The IMPLAN marginsassociated with petroleum refining were applied tothe automobile expenditures, but a lack of detailedinformation on the types of retail food and bev-erages purchased by anglers precluded the abilityto distinguish among manufacturers. Thus, the av-erage estimated retail margin associated with gro-cery stores (24%; U.S. Bureau of the Census 1997)was multiplied by the grocery expenditure esti-mates shown in Table 2 and allocated to the retailfood store sector.
Regional impacts were estimated for sales, in-come, and employment. Sales reflect total dollarsales generated from expenditures by party andcharter anglers in Maine. Income represents wag-es, salaries, benefits, and proprietary income gen-
Dow
nloa
ded
by [
Ohi
o U
nive
rsity
Lib
rari
es]
at 0
6:43
06
Oct
ober
201
3
731ECONOMICS OF CHARTER BOAT FISHING
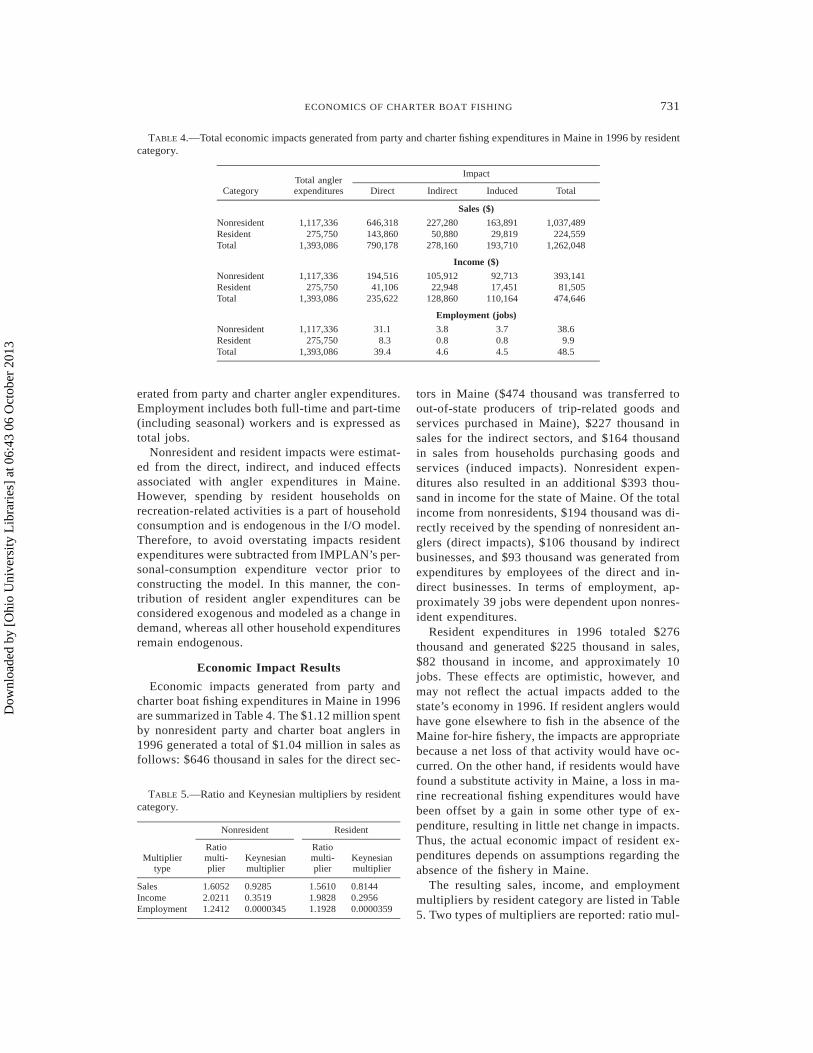
TABLE 4.—Total economic impacts generated from party and charter fishing expenditures in Maine in 1996 by residentcategory.
CategoryTotal anglerexpenditures
Impact
Direct Indirect Induced Total
Sales ($)
NonresidentResidentTotal
1,117,336275,750
1,393,086
646,318143,860790,178
227,28050,880
278,160
163,89129,819
193,710
1,037,489224,559
1,262,048
Income ($)
NonresidentResidentTotal
1,117,336275,750
1,393,086
194,51641,106
235,622
105,91222,948
128,860
92,71317,451
110,164
393,14181,505
474,646
Employment (jobs)
NonresidentResidentTotal
1,117,336275,750
1,393,086
31.18.3
39.4
3.80.84.6
3.70.84.5
38.69.9
48.5
TABLE 5.—Ratio and Keynesian multipliers by residentcategory.
Multipliertype
Nonresident
Ratiomulti-plier
Keynesianmultiplier
Resident
Ratiomulti-plier
Keynesianmultiplier
SalesIncomeEmployment
1.60522.02111.2412
0.92850.35190.0000345
1.56101.98281.1928
0.81440.29560.0000359
erated from party and charter angler expenditures.Employment includes both full-time and part-time(including seasonal) workers and is expressed astotal jobs.
Nonresident and resident impacts were estimat-ed from the direct, indirect, and induced effectsassociated with angler expenditures in Maine.However, spending by resident households onrecreation-related activities is a part of householdconsumption and is endogenous in the I/O model.Therefore, to avoid overstating impacts residentexpenditures were subtracted from IMPLAN’s per-sonal-consumption expenditure vector prior toconstructing the model. In this manner, the con-tribution of resident angler expenditures can beconsidered exogenous and modeled as a change indemand, whereas all other household expendituresremain endogenous.
Economic Impact Results
Economic impacts generated from party andcharter boat fishing expenditures in Maine in 1996are summarized in Table 4. The $1.12 million spentby nonresident party and charter boat anglers in1996 generated a total of $1.04 million in sales asfollows: $646 thousand in sales for the direct sec-
tors in Maine ($474 thousand was transferred toout-of-state producers of trip-related goods andservices purchased in Maine), $227 thousand insales for the indirect sectors, and $164 thousandin sales from households purchasing goods andservices (induced impacts). Nonresident expen-ditures also resulted in an additional $393 thou-sand in income for the state of Maine. Of the totalincome from nonresidents, $194 thousand was di-rectly received by the spending of nonresident an-glers (direct impacts), $106 thousand by indirectbusinesses, and $93 thousand was generated fromexpenditures by employees of the direct and in-direct businesses. In terms of employment, ap-proximately 39 jobs were dependent upon nonres-ident expenditures.
Resident expenditures in 1996 totaled $276thousand and generated $225 thousand in sales,$82 thousand in income, and approximately 10jobs. These effects are optimistic, however, andmay not reflect the actual impacts added to thestate’s economy in 1996. If resident anglers wouldhave gone elsewhere to fish in the absence of theMaine for-hire fishery, the impacts are appropriatebecause a net loss of that activity would have oc-curred. On the other hand, if residents would havefound a substitute activity in Maine, a loss in ma-rine recreational fishing expenditures would havebeen offset by a gain in some other type of ex-penditure, resulting in little net change in impacts.Thus, the actual economic impact of resident ex-penditures depends on assumptions regarding theabsence of the fishery in Maine.
The resulting sales, income, and employmentmultipliers by resident category are listed in Table5. Two types of multipliers are reported: ratio mul-
Dow
nloa
ded
by [
Ohi
o U
nive
rsity
Lib
rari
es]
at 0
6:43
06
Oct
ober
201
3
732 STEINBACK
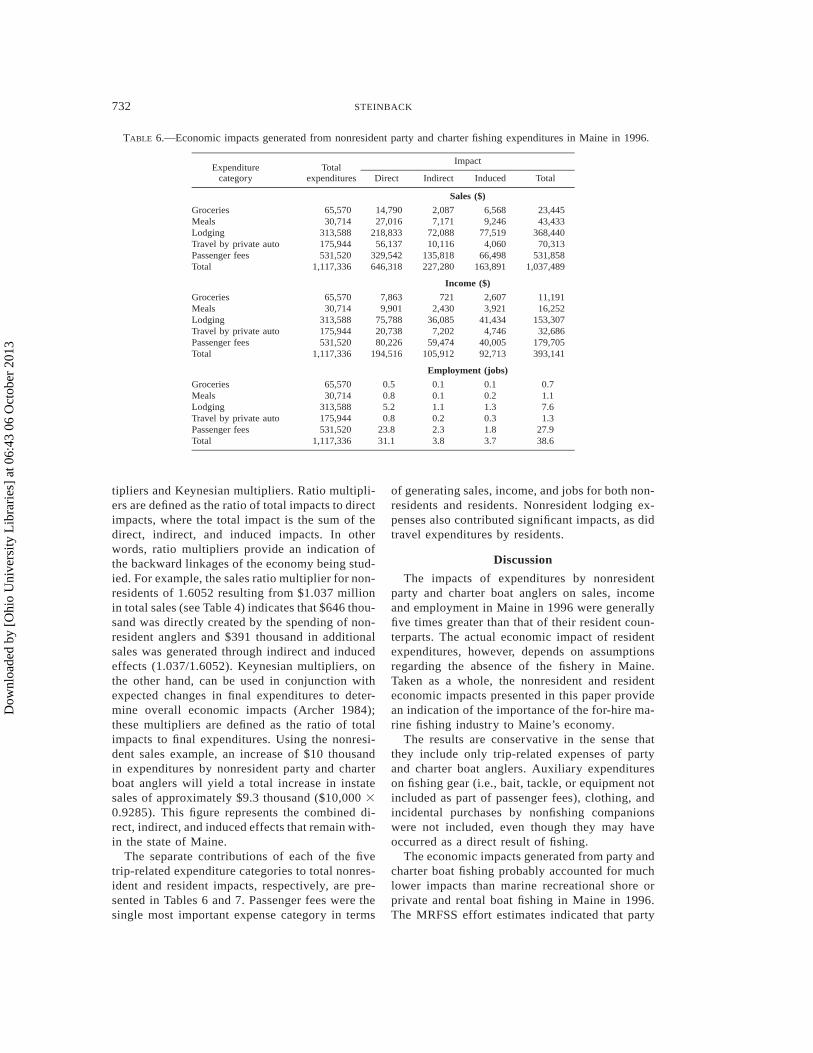
TABLE 6.—Economic impacts generated from nonresident party and charter fishing expenditures in Maine in 1996.
Expenditurecategory
Totalexpenditures
Impact
Direct Indirect Induced Total
Sales ($)
GroceriesMealsLodgingTravel by private autoPassenger feesTotal
65,57030,714
313,588175,944531,520
1,117,336
14,79027,016
218,83356,137
329,542646,318
2,0877,171
72,08810,116
135,818227,280
6,5689,246
77,5194,060
66,498163,891
23,44543,433
368,44070,313
531,8581,037,489
Income ($)
GroceriesMealsLodgingTravel by private autoPassenger feesTotal
65,57030,714
313,588175,944531,520
1,117,336
7,8639,901
75,78820,73880,226
194,516
7212,430
36,0857,202
59,474105,912
2,6073,921
41,4344,746
40,00592,713
11,19116,252
153,30732,686
179,705393,141
Employment (jobs)
GroceriesMealsLodging
65,57030,714
313,588
0.50.85.2
0.10.11.1
0.10.21.3
0.71.17.6
Travel by private autoPassenger feesTotal
175,944531,520
1,117,336
0.823.831.1
0.22.33.8
0.31.83.7
1.327.938.6
tipliers and Keynesian multipliers. Ratio multipli-ers are defined as the ratio of total impacts to directimpacts, where the total impact is the sum of thedirect, indirect, and induced impacts. In otherwords, ratio multipliers provide an indication ofthe backward linkages of the economy being stud-ied. For example, the sales ratio multiplier for non-residents of 1.6052 resulting from $1.037 millionin total sales (see Table 4) indicates that $646 thou-sand was directly created by the spending of non-resident anglers and $391 thousand in additionalsales was generated through indirect and inducedeffects (1.037/1.6052). Keynesian multipliers, onthe other hand, can be used in conjunction withexpected changes in final expenditures to deter-mine overall economic impacts (Archer 1984);these multipliers are defined as the ratio of totalimpacts to final expenditures. Using the nonresi-dent sales example, an increase of $10 thousandin expenditures by nonresident party and charterboat anglers will yield a total increase in instatesales of approximately $9.3 thousand ($10,000 30.9285). This figure represents the combined di-rect, indirect, and induced effects that remain with-in the state of Maine.
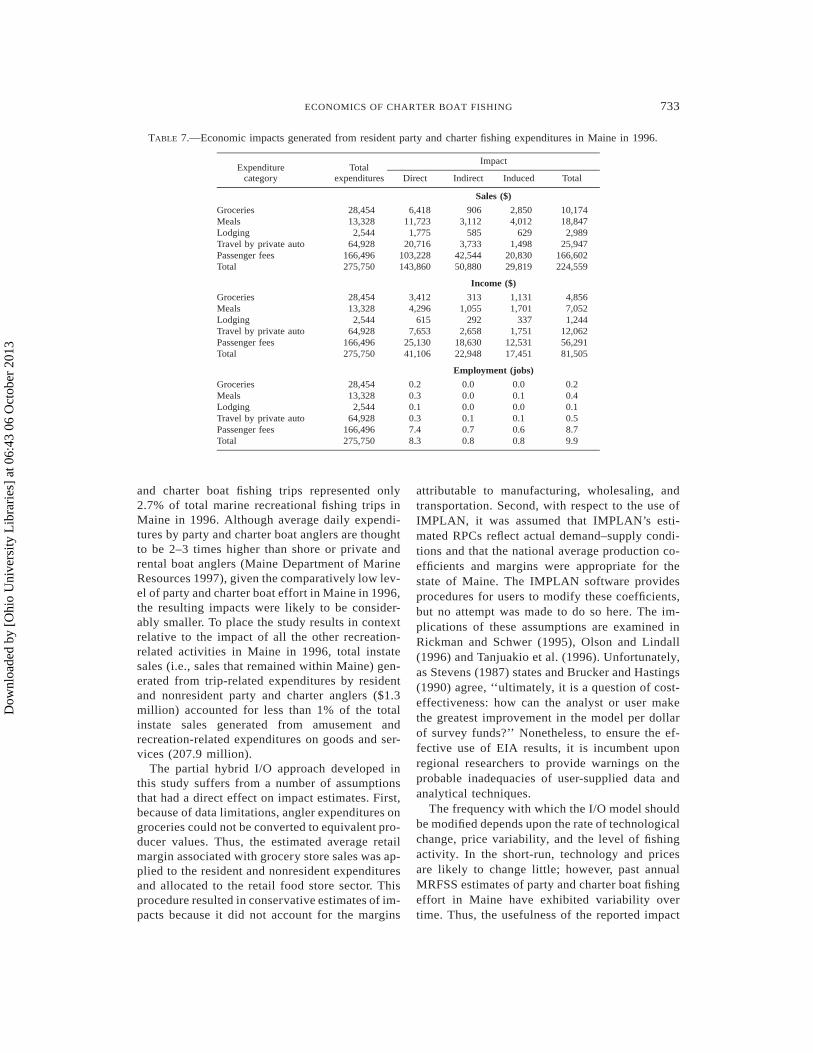
The separate contributions of each of the fivetrip-related expenditure categories to total nonres-ident and resident impacts, respectively, are pre-sented in Tables 6 and 7. Passenger fees were thesingle most important expense category in terms
of generating sales, income, and jobs for both non-residents and residents. Nonresident lodging ex-penses also contributed significant impacts, as didtravel expenditures by residents.
Discussion
The impacts of expenditures by nonresidentparty and charter boat anglers on sales, incomeand employment in Maine in 1996 were generallyfive times greater than that of their resident coun-terparts. The actual economic impact of residentexpenditures, however, depends on assumptionsregarding the absence of the fishery in Maine.Taken as a whole, the nonresident and residenteconomic impacts presented in this paper providean indication of the importance of the for-hire ma-rine fishing industry to Maine’s economy.
The results are conservative in the sense thatthey include only trip-related expenses of partyand charter boat anglers. Auxiliary expenditureson fishing gear (i.e., bait, tackle, or equipment notincluded as part of passenger fees), clothing, andincidental purchases by nonfishing companionswere not included, even though they may haveoccurred as a direct result of fishing.
The economic impacts generated from party andcharter boat fishing probably accounted for muchlower impacts than marine recreational shore orprivate and rental boat fishing in Maine in 1996.The MRFSS effort estimates indicated that party
Dow
nloa
ded
by [
Ohi
o U
nive
rsity
Lib
rari
es]
at 0
6:43
06
Oct
ober
201
3
733ECONOMICS OF CHARTER BOAT FISHING
TABLE 7.—Economic impacts generated from resident party and charter fishing expenditures in Maine in 1996.
Expenditurecategory
Totalexpenditures
Impact
Direct Indirect Induced Total
Sales ($)
GroceriesMealsLodgingTravel by private autoPassenger feesTotal
28,45413,3282,544
64,928166,496275,750
6,41811,7231,775
20,716103,228143,860
9063,112
5853,733
42,54450,880
2,8504,012
6291,498
20,83029,819
10,17418,8472,989
25,947166,602224,559
Income ($)
GroceriesMealsLodgingTravel by private autoPassenger feesTotal
28,45413,3282,544
64,928166,496275,750
3,4124,296
6157,653
25,13041,106
3131,055
2922,658
18,63022,948
1,1311,701
3371,751
12,53117,451
4,8567,0521,244
12,06256,29181,505
Employment (jobs)
GroceriesMealsLodging
28,45413,3282,544
0.20.30.1
0.00.00.0
0.00.10.0
0.20.40.1
Travel by private autoPassenger feesTotal
64,928166,496275,750
0.37.48.3
0.10.70.8
0.10.60.8
0.58.79.9
and charter boat fishing trips represented only2.7% of total marine recreational fishing trips inMaine in 1996. Although average daily expendi-tures by party and charter boat anglers are thoughtto be 2–3 times higher than shore or private andrental boat anglers (Maine Department of MarineResources 1997), given the comparatively low lev-el of party and charter boat effort in Maine in 1996,the resulting impacts were likely to be consider-ably smaller. To place the study results in contextrelative to the impact of all the other recreation-related activities in Maine in 1996, total instatesales (i.e., sales that remained within Maine) gen-erated from trip-related expenditures by residentand nonresident party and charter anglers ($1.3million) accounted for less than 1% of the totalinstate sales generated from amusement andrecreation-related expenditures on goods and ser-vices (207.9 million).
The partial hybrid I/O approach developed inthis study suffers from a number of assumptionsthat had a direct effect on impact estimates. First,because of data limitations, angler expenditures ongroceries could not be converted to equivalent pro-ducer values. Thus, the estimated average retailmargin associated with grocery store sales was ap-plied to the resident and nonresident expendituresand allocated to the retail food store sector. Thisprocedure resulted in conservative estimates of im-pacts because it did not account for the margins
attributable to manufacturing, wholesaling, andtransportation. Second, with respect to the use ofIMPLAN, it was assumed that IMPLAN’s esti-mated RPCs reflect actual demand–supply condi-tions and that the national average production co-efficients and margins were appropriate for thestate of Maine. The IMPLAN software providesprocedures for users to modify these coefficients,but no attempt was made to do so here. The im-plications of these assumptions are examined inRickman and Schwer (1995), Olson and Lindall(1996) and Tanjuakio et al. (1996). Unfortunately,as Stevens (1987) states and Brucker and Hastings(1990) agree, ‘‘ultimately, it is a question of cost-effectiveness: how can the analyst or user makethe greatest improvement in the model per dollarof survey funds?’’ Nonetheless, to ensure the ef-fective use of EIA results, it is incumbent uponregional researchers to provide warnings on theprobable inadequacies of user-supplied data andanalytical techniques.
The frequency with which the I/O model shouldbe modified depends upon the rate of technologicalchange, price variability, and the level of fishingactivity. In the short-run, technology and pricesare likely to change little; however, past annualMRFSS estimates of party and charter boat fishingeffort in Maine have exhibited variability overtime. Thus, the usefulness of the reported impact
Dow
nloa
ded
by [
Ohi
o U
nive
rsity
Lib
rari
es]
at 0
6:43
06
Oct
ober
201
3
734 STEINBACK
estimates in near future years is conditional onsimilar effort estimates.
More importantly, perhaps, the model itselfcould be used in conjunction with updated data topredict changes in economic activity associatedwith future fishery policies. For example, if a pro-posed policy decision was expected to reduce out-of-state participation by 10% in the year 2000,updated effort estimates could easily be incorpo-rated into the model (adjusted for inflation) to pre-dict the impacts on sales, income, and employmentin Maine.
The IMPLAN system is also updated annually,including its regional databases. Thus, price andtechnology changes for the entire economy will beincorporated into future versions. In addition, theNMFS has recently committed to collecting de-tailed expenditure data from marine anglers alongthe Atlantic coast every 3 years. These data willexpress changes in tastes and preferences andcould be used to update the mix of angler expen-ditures provided in this study. Efforts are also un-derway to collect fishery-dependent cost data tocharacterize the actual purchasing behavior of for-hire businesses, by state. In combination, theseactivities provide the ability to continually updatethe I/O model presented here.
While the model’s multipliers may be used toassess the impacts of changes on Maine’s econo-my, it is important for resource managers to un-derstand the multipliers’ limitations. Multipliersare prone to misuse and misinterpretation becausethey conveniently represent many complex inter-actions in an economy. Because of data limitations,fishery decision makers often extrapolate multi-plier estimates across regions. However, few pol-icymakers realize that multipliers are dependentupon trade flows, production functions, and mar-keting margins that may vary greatly from regionto region. Also, it is not uncommon for resourcemanagers to confuse the more familiar, albeit in-creasingly abused, ratio multiplier with theKeynesian multiplier. Ratio multipliers provideuseful information to relate the direct, indirect, andinduced impacts to total impacts, but as Edwards(1990) points out, these multipliers are usuallymeaningless for predicting total impacts fromchanges in final expenditures because they are notmathematically linked to final expenditures. How-ever, ratio multipliers are indirectly linked to finalexpenditures through the RPC for a given com-modity. Resource decision makers with compre-hensive knowledge of regional trade flows coulduse RPC-adjusted final expenditures (i.e., direct
effects) in combination with ratio multipliers topredict impacts of final demand changes. In effect,this procedure results in what is known as theKeynesian multiplier. Keynesian multipliers aremathematically linked to final expenditures and donot require decision makers to have absoluteknowledge of RPCs. Keynesian multipliers ex-press the amount of sales, income and employmentgenerated in a region by an additional dollar ofspending and are used in conjunction with finalexpenditures to determine total economic impacts.For example, the Keynesian multipliers providedin this study could be used by fishery managersto predict the total impacts of changes in expen-ditures by party and charter boat anglers in Maine.To accomplish this, the appropriate Keynesianmultiplier would be multiplied by the change. Cau-tion is advised, however, because Keynesian mul-tiplier projections are based on a region’s currentindustrial structure and assume that there is suf-ficient productive capacity (i.e., labor and capital)within the region to satisfy an increase in finalexpenditures. In addition, users of the IMPLANsystem must calculate Keynesian multipliers man-ually because the software is only capable of re-porting ratio multipliers.
The effective use of the IMPLAN system forconducting regional EIAs of recreational fisheriesmay well depend on users’ abilities to incorporateadditional survey data, adjust region-specific tech-nological coefficients, and provide results that canbe readily explained to fishery managers and thepublic. From this perspective, it is crucial to de-velop consistent and defensible techniques forgenerating economic impacts with IMPLAN. Fu-ture regional EIA studies of recreational fisheriesshould attempt to include auxiliary expenditureson fishing gear and incidental purchases by non-fishing companions. In addition, there is a need toevaluate whether resident anglers would contributeto the import market or remain within the regionin the absence of the fishery. The procedures anddata sets applied here, if used in conjunction withfuture versions of IMPLAN, can serve as a foun-dation for updating the Maine input–output modelprovided in this study and for developing econom-ic assessments of recreational fisheries in otherstates.
Acknowledgments
I thank Dr. Steven Edwards, Dr. Fredric Serchuk,Dr. Eric Thunberg and three anonymous refereesfor many valuable suggestions toward improvingearlier drafts of the paper. Sincere appreciation is
Dow
nloa
ded
by [
Ohi
o U
nive
rsity
Lib
rari
es]
at 0
6:43
06
Oct
ober
201
3

735ECONOMICS OF CHARTER BOAT FISHING
extended to Jon O’Neil for his data collection ef-forts and to the Maine Department of Marine Re-sources for their support.
References
ALK Associates. 1995. PCMILER version 9. Trans-portation and information technologies. ALK As-sociates, Princeton, New Jersey.
Anderson, R. S., C. J. Schwinden, and J. A. Leitch. 1986.Regional economic impact of the Devil’s Lake fish-ery. Fisheries 11(5):14–17.
Archer, H. B. 1984. Economic impact: misleading mul-tiplier. Annals of Tourism Research 11:517–518.
Bell, F. W., P. E. Sorensn, and V. R. Leeworthy. 1982.The economic impact and valuation of saltwater rec-reational fisheries in Florida. University of Florida,Florida Sea Grant College Program, Report 47,Gainesville.
Bergstrom, J. C., M. K. Cordell, A. E. Watson, and G.A. Schley. 1990. Economic impacts of state parkson state economies in the south. Southern Journalof Agricultural Economics 22(2):69–77.
Boyle, K. J., and R. C. Bishop. 1987. Valuing wildlifein benefit-cost analyses: a case study involving en-dangered species. Water Resources Research 23:943–950.
Broomhall, D., and T. G. Johnson. 1991. Regional im-pacts of the conservation reserve program in thesoutheast with conversion to trees: an applicationof input–output analysis. Review of Regional Stud-ies 20:76–85.
Brucker, S. M., and S. E. Hastings. 1990. The variationof estimated impacts from five regional input–out-put models. International Regional Science Review13:119–139.
Crihfield, J. B., and H. S. Campbell. 1991. Evaluatingalternative regional planning models. Growth andChange 22(2):1–16.
Ditton, R. B., A. R. Graefe, and G. Lapotka. 1980. Eco-nomic impacts of recreational boat fishing in theHouston-Galveston area of the Texas coast. TexasA&M University, Sea Grant College Program,TAMU-SG-80-206, College Station.
Edwards, S. F. 1990. An economics guide to allocationof fish stocks between commercial and recreationalfisheries. NOAA Technical Report NMFS 94.
Edwards, S. F. 1991. A critique of three ‘‘economics’’arguments commonly used to influence fishery al-locations. North American Journal of FisheriesManagement 11:121–130.
Hushak, L. J. 1987. Use of input–output analysis infisheries assessment. Transactions of the AmericanFisheries Society 116:441–449.
Kirkley, J., and D. Kerstetter. 1997. Saltwater anglingand its economic importance to Virginia. Universityof Virginia, Virginia Sea Grant Publication VSG-97-04, Charlottesville.
Lipton, D. W., K. F. Wellman, I. C. Sheifer, and R. F.Weiher. 1995. Economic valuation of natural re-sources—a handbook of coastal resource policy-makers. NOAA Coastal Ocean Office, Coastal
Ocean Program Decision Analysis Series 5, SilverSpring, Maryland.
Maharaj, V., and J. E. Carpenter. No date. The 1996economic impact of sport fishing in the UnitedStates. American Sportfishing Association, Alex-andria, Virginia.
Maine Department of Marine Resources. 1997. The ma-rine recreational fisheries statistics survey. MaineDepartment of Marine Resources Newsletter 2(1):3. (West Boothbay Harbor, Maine.)
Martin, M., H. Radtke, B. Eleveld, and S. Nofzinger.1988. The impacts of the conservation reserve pro-gram on rural communities: the case of three Oregoncounties. Western Journal of Agricultural Econom-ics 13:225–232.
Miernyk, W. H. 1965. The elements of input–outputanalysis. Random House, New York.
Miller, R. E., and P. D. Blair. 1985. Input–output anal-ysis: foundations and extensions. Prentice-Hall, En-glewood Cliffs, New Jersey.
Olson, D., and S. Lindall. 1996. IMPLAN professionalsoftware, analysis, and data guide. Minnesota IM-PLAN Group, Stillwater, Minnesota.
Propst, D. B., and D. G. Gavrilis. 1987. Role of eco-nomic impact assessment procedures in recreationalfisheries management. Transactions of the AmericanFisheries Society 116:450–460.
Radtke, H., S. Detering, and R. Brokken. 1985. A com-parison of economic impact estimates for changesin the federal grazing fee: secondary vs primary dataI/O models. Western Journal of Agricultural Eco-nomics 10:82–390.
Randall, A. 1987. Total economic value as a basis forpolicy. Transactions of the American Fisheries So-ciety 116:325–335.
Rickman, D. S., and R. K. Schwer. 1995. A comparisonof the multipliers of IMPLAN, REMI, and RIMSII: benchmarking ready-made models for compari-son. Annals of Regional Science 29:363–374.
Schorr, M. S., J. Sah, D. F. Schreiner, M. R. Meador,and L. G. Hill. 1995. Regional economic impact ofthe Lake Texoma (Oklahoma–Texas) striped bassfishery. Fisheries 20(5):14–18.
Sills, E. O., J. Alwang, and P. Driscoll. 1994. Migrantfarm workers on Virginia’s eastern shore: an anal-ysis of economic impacts. Journal of Agriculturaland Applied Economics 26:209–223.
Stevens, B. 1987. Comments on ready-made regionalinput–output model systems: model accuracy andthe value of limited surveys. Review of RegionalStudies 17(2):19.
Storey, D. A., and G. P. Allen. 1993. Economic impactof marine recreational fishing in Massachusetts.North American Journal of Fisheries Management13:698–708.
Talhelm, D. 1988. Economics of great lakes fisheries:a 1985 assessment. Great Lakes Fishery Commis-sion, Technical Report 54, Ann Arbor, Michigan.
Tanjuakio, R. V., S. E. Hastings, and P. J. Tytus. 1996.The economic contribution of agriculture in Dela-ware. Agricultural and Resource Economics Review25:46–53.
Dow
nloa
ded
by [
Ohi
o U
nive
rsity
Lib
rari
es]
at 0
6:43
06
Oct
ober
201
3

736 STEINBACK
U.S. Bureau of the Census. 1997. Annual benchmarkreport for retail trade: January 1987 through De-cember 1996. Current Business Reports, Series BR/96-RV, Washington, D.C.
USFWS (U.S. Fish and Wildlife Service). 1996. Na-tional survey of fishing, hunting, and wildlife-as-
sociated recreation. USFWS, U.S. GovernmentPrinting Office, Washington, D.C.
Wegge, T. C., H. M. Hanemann, and I. E. Strand. 1986.An economic assessment of marine recreationalfishing in southern California. NOAA TechnicalMemorandum NMFS SWR-015.
Dow
nloa
ded
by [
Ohi
o U
nive
rsity
Lib
rari
es]
at 0
6:43
06
Oct
ober
201
3